1. Introduction
Tree species information is a basic parameter in vegetation monitoring, change detection, forest inventory, tree growth condition analyzing, and carbon stock predicting, to mention only a few [
1,
2,
3,
4,
5]. In sustainable forest management, spatial and structure information of individual trees offer crucial information for management decisions.
Tree species classification originally relied on expensive and time-consuming field investigations to measure structure attributes such as tree height, leaf area index, branch angle etc. of individual trees, then identified the tree species by comparing these parameters to a standard one, where visual inspection by a botanist is usually necessary [
6]. With the development of the remote sensing technique, large-scale classification of tree species became possible. Most studies conducted in the past two decades tried to enhance the performance of extraction of structure parameters of individual trees from both optical and Synthetic Aperture Radar (SAR) images, then input them into a classifier to identify each individual tree species [
7,
8]. Some earlier research also tried to establish the statistical, physical, and geometric relationships between electromagnetic scattering characteristics of various tree species and parameters of interest [
9], leading to the intensive study of forest parameters retrieval, such as biomass, leaf and basal area, net and gross primary production (NPP/GPP), etc. [
8,
10,
11,
12,
13,
14] from remote sensing data. The existing studies show that conventional optical remote sensing data are applicable for large-scale forest monitoring and classification, because tree components such as water and chlorophyll show strong absorption in the visible and infrared spectral bands [
15,
16]. Many machine learning methods have been developed for pixel-level classification based on spectral differences among tree species, which are generally caused by their differences in foliar properties [
17,
18,
19]. SAR data, especially in L-band or P-band, have showed superiority in small scale forest monitoring and species identification due to its penetrability of the tree canopy [
20,
21,
22,
23], But the inherent speckle noises in SAR data pose huge challenges for extracting fine structural information from them, and it is difficult to use SAR data alone for accurate classification of tree species [
24]. As a result, for large-scale tree species identification, it is difficult, if not impossible, to extract structural information on individual trees from SAR data.
Airborne LiDAR is another kind of active remote sensing technique developed in the early 1960s using pulsed lasers to detect and measure terrain and object surfaces, providing range data in the form of three-dimensional point clouds [
25,
26]. The application of LiDAR data in forest inventory began in the early 1980s [
27], though it had already been employed to generate the Digital Elevation Model (DEM) [
28], because it acquires high precision 3D coordinate values of the Earth’s surface. Most research on tree species classification using airborne LiDAR data pays the most attention to the extraction of structural parameters from the data, for example, Holmgren and Persson [
29] classified Norway spruce and Scotch Pine with an overall accuracy of 95%, which applied tree height and average forest plot height, such as Lorey’s mean height, and predominant tree height extracted from laser scanning point clouds put to supervised classifiers. In this aspect, differences in the definitions of tree structure parameters can change the classification accuracy [
30]. For instance, mean tree height may be taken as the average height of dominant and co-dominant trees [
31], whereas others may consider the contribution from suppressed trees [
32,
33,
34].
Full waveform LiDAR data, which can be acquired by installing a full waveform digitizer to the traditional discrete LiDAR system, provide a higher point density and additional information about the vertical characteristics of a tree which has been proved to apply to tree species classification [
35,
36,
37]. Some attempts were made to fully use the structure information of the tree canopy for species classification, which needs to decompose the waveform data to obtain the high-density point cloud data and to retrieve the more vertical structure information of individual tree crowns, e. g., Riaño, Reitberger et al. [
34,
38]. However, full waveform decomposition is complex and time-consuming, and different decomposition algorithms may achieve different parameters, which hinder their application to large scale tree species classification.
Accuracy can be improved by using the LiDAR intensity values through a multiple band LiDAR system [
39], both for individual tree segmentation and tree species classification [
40,
41,
42,
43,
44,
45,
46,
47,
48,
49,
50,
51], two main aspects in terms of applying LiDAR data for automatic forest inventory. For example, Sooyoung Kim et al. in 2009 [
47] and 2011 [
52] employed the mean intensity values of individual tree crowns to identify the leaf-on and leaf-off tree species; also, Reitberger et al. [
38] applied supervised and unsupervised classification to classify fir and spruce by combining intensity values with other attributes from full waveform LiDAR data. Other strategies to improve both segmentation and classification accuracy include point clouds and spectral image fusion, and the application of recently developed machine learning algorithms such as deep neural networks [
42,
43]. Though promising experimental results were achieved, the former largely depended on the registration accuracy of point clouds and image data, while the latter required a large quantity of training samples.
Based on the above, the classification and recognition of tree species based on remote sensing technology has been highly developed, which enables determination of the key driving factors affecting forest biomass from complex predictors to obtain the quantitative estimation of above ground biomass [
53,
54]. Also, some tree species results from LiDAR points have been successfully applied to cultivated or invasive tree species above ground biomass estimation [
55,
56,
57,
58].
However, in summary, tree species classification based on remotely sensed data still shows the following challenges:
(1) It is difficult to obtain tree structure information by solely using optical images or SAR data, hence it is not easy to achieve high accuracy tree species classification at the crown level.
(2) More precise tree structure information can be retrieved from full waveform data than from the point cloud, but the identification results rely heavily on the precision of waveform decomposition. Moreover, to acquire full waveform data, more budget and more storage resources are required.
(3) The LiDAR point cloud shows promising results in terms of tree species identification by the parameters describing the structural information of tree crowns. However, the parameters depend on the quality of the point cloud in general, and the point cloud density in particular. A better strategy for accurate tree species identification or classification requires the integration of structural and spectral information from the optical images and point cloud, respectively.
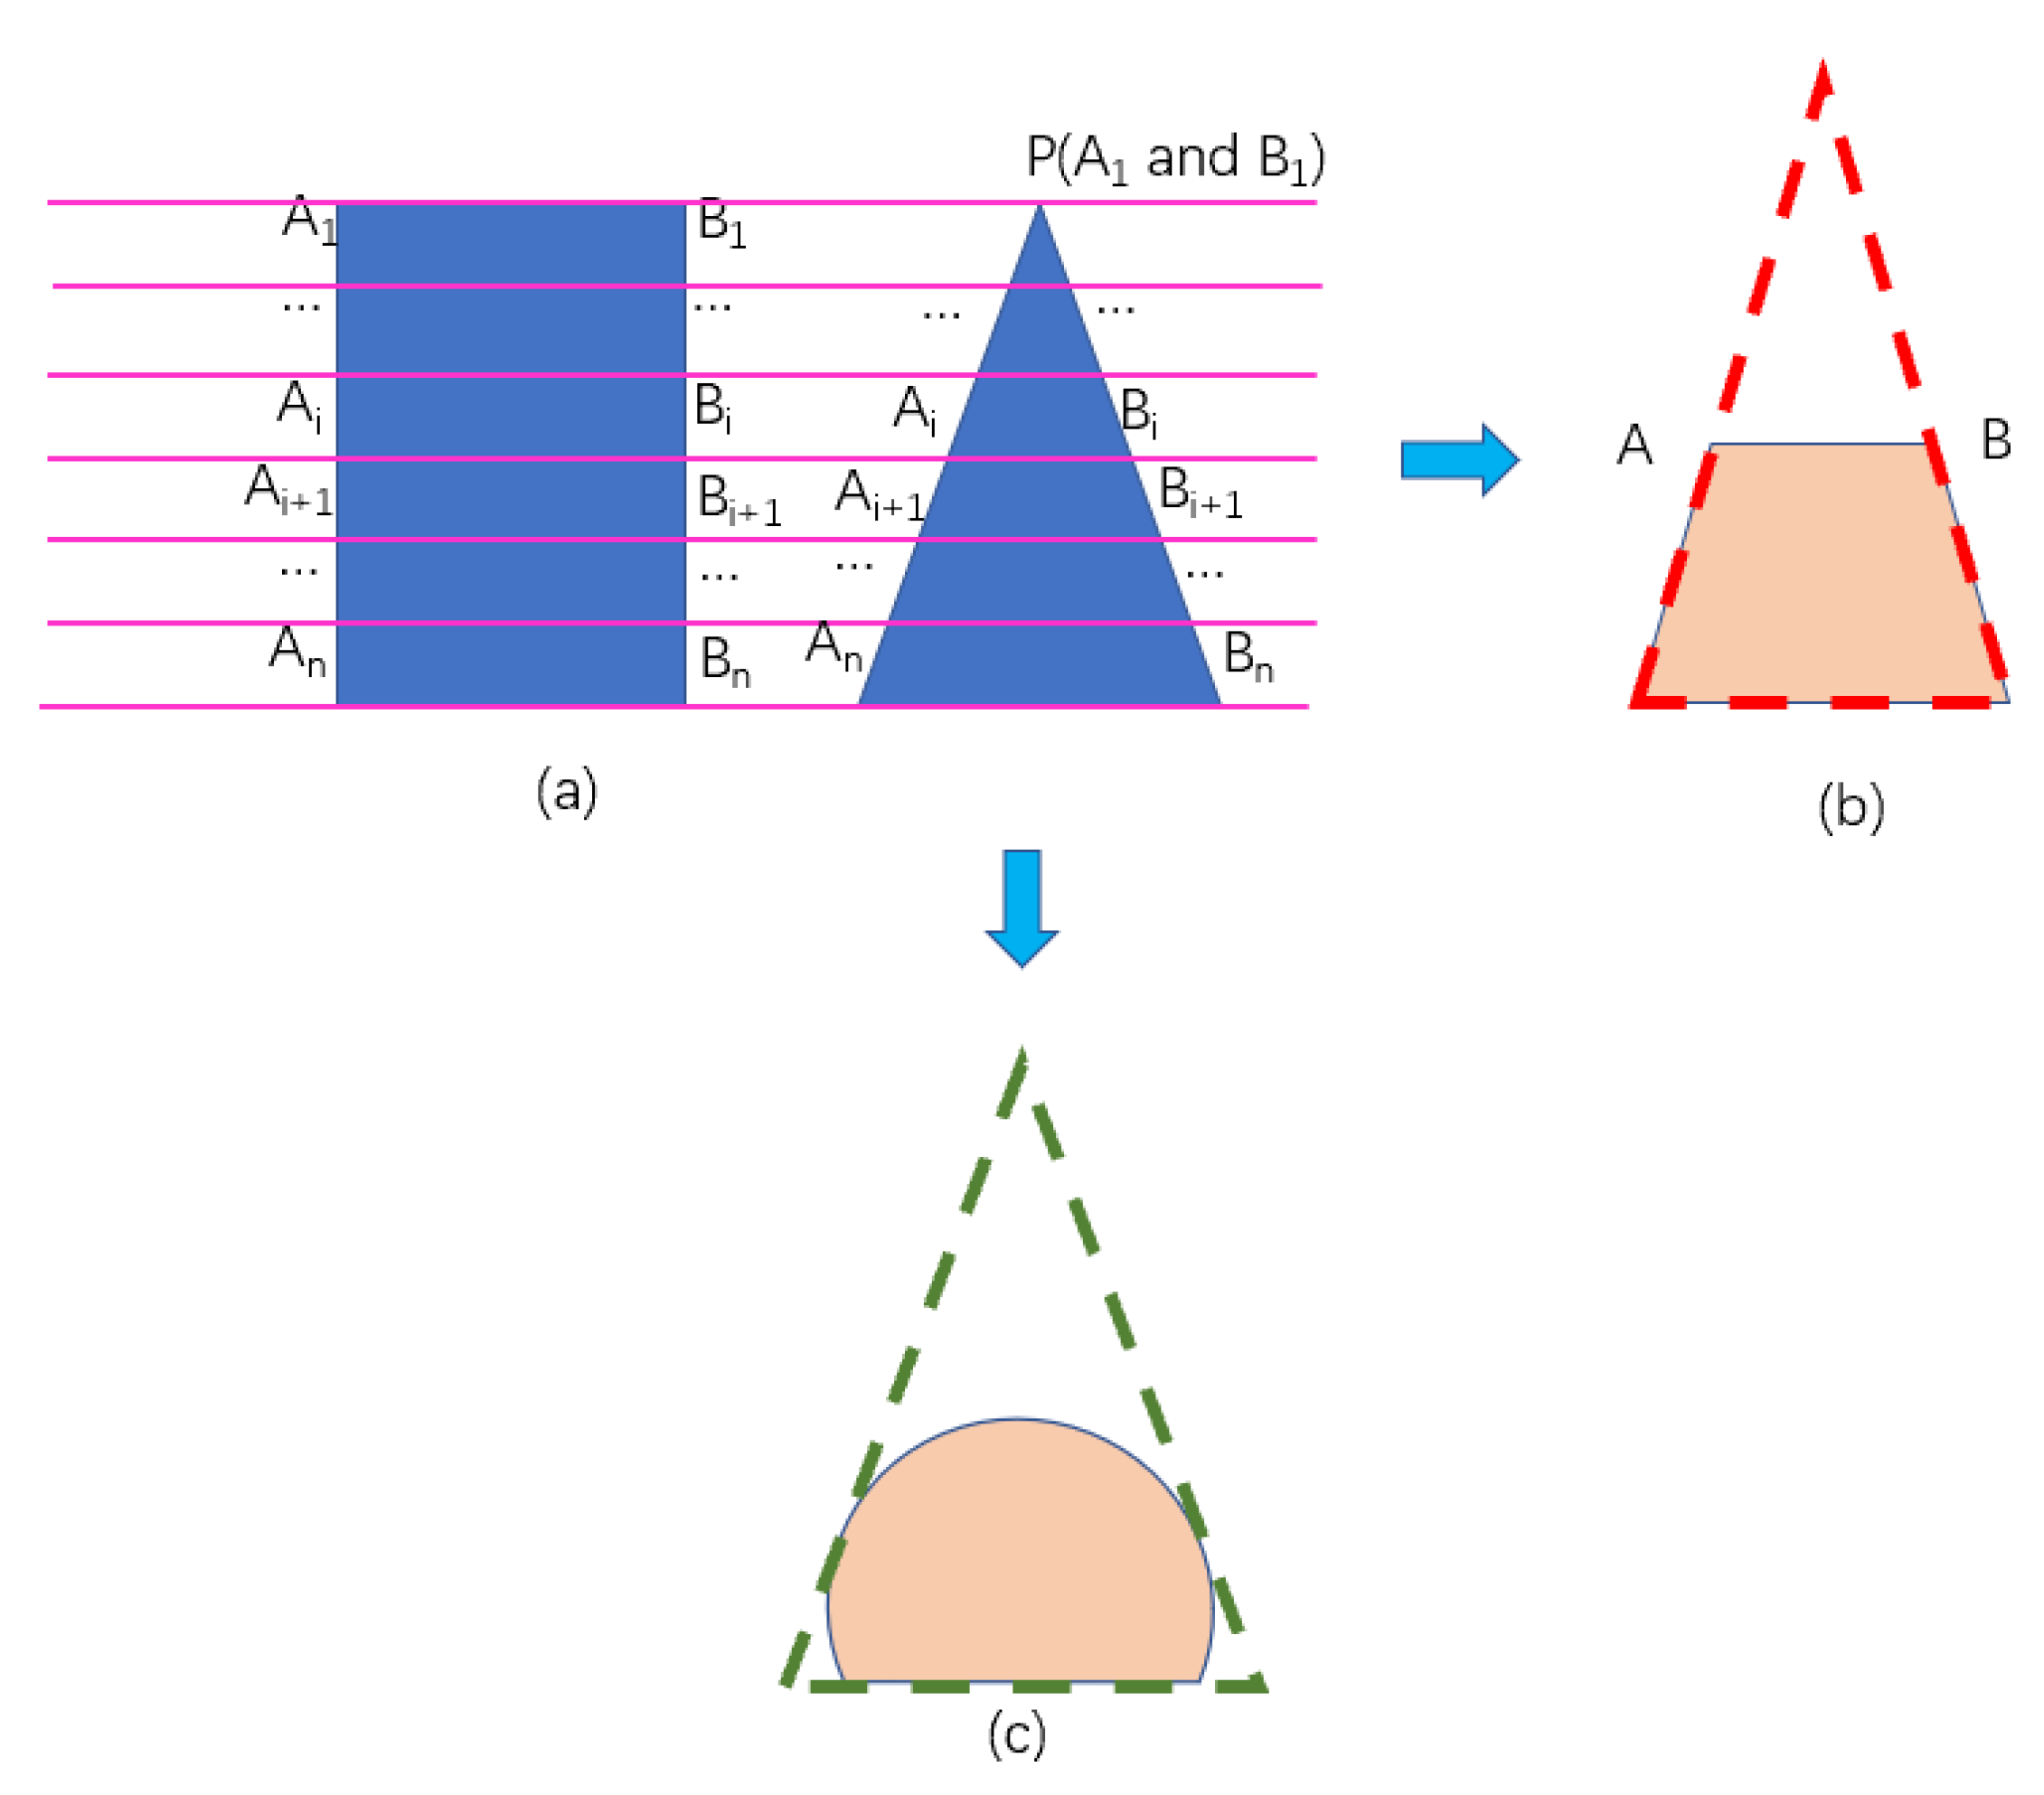
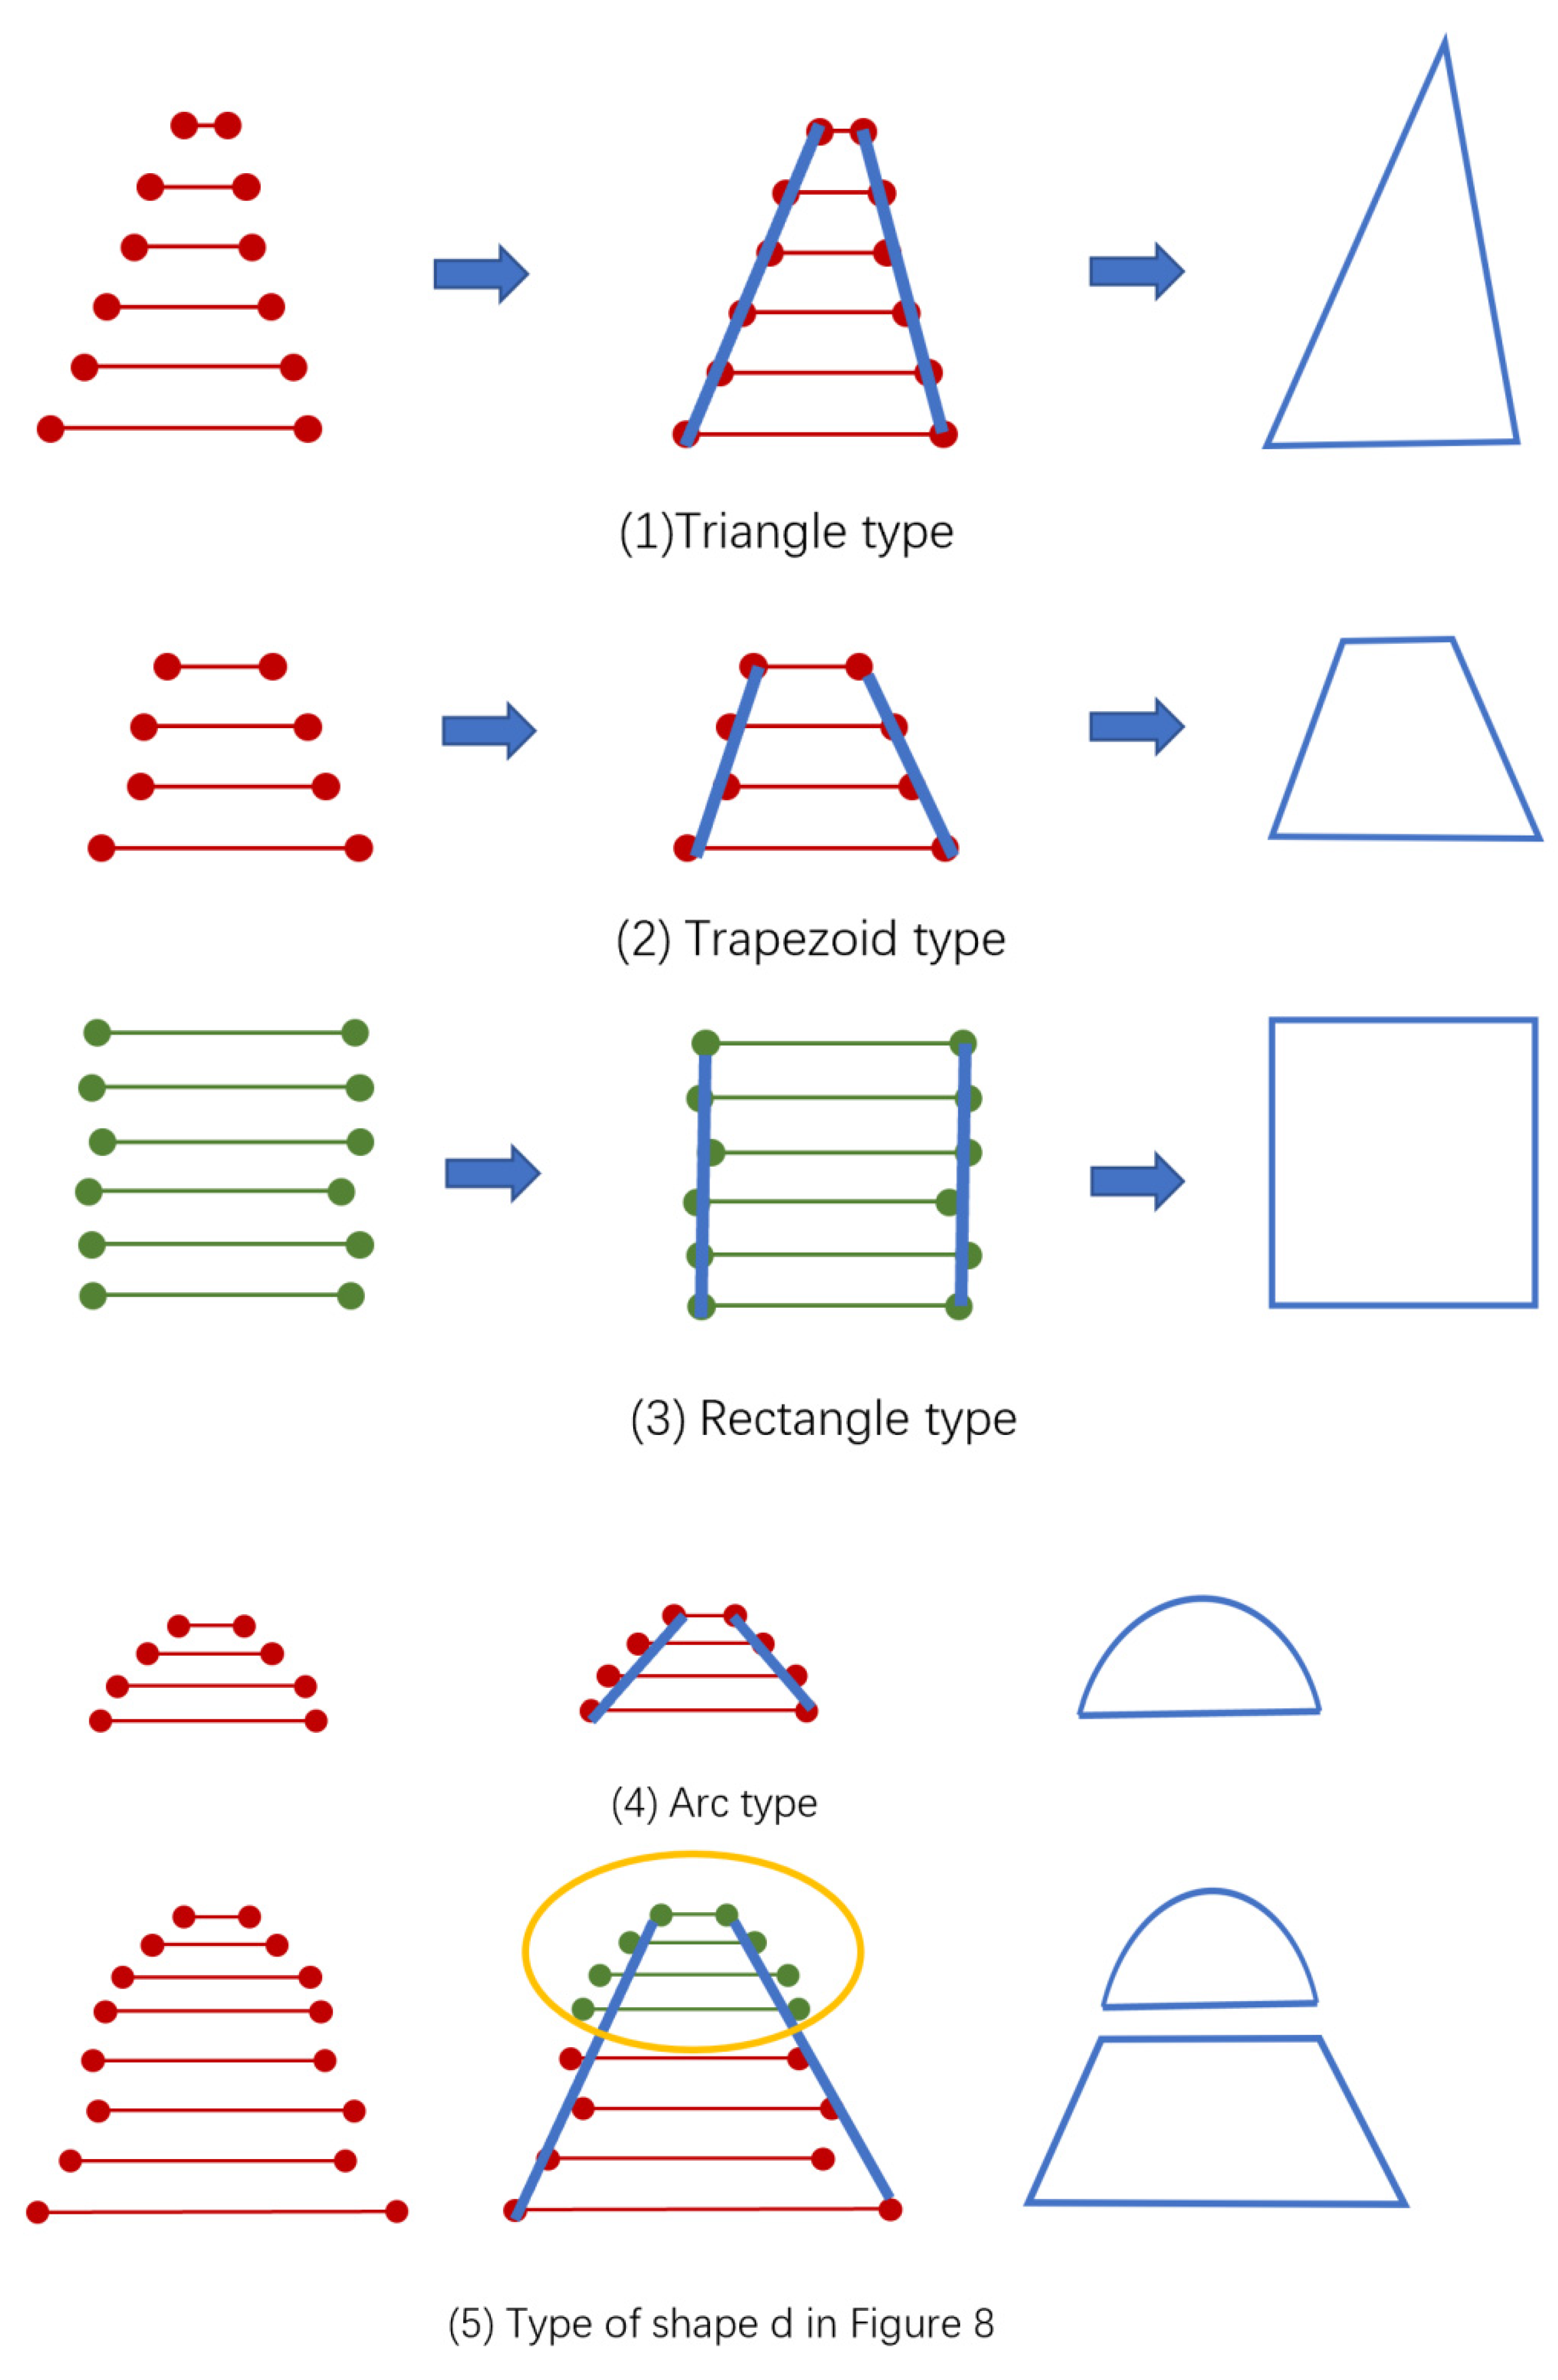
Bearing the above-mentioned challenges in mind, the paper attempts to match the segmented tree crown with specific geometric shapes, that is, based on the extraction of the outer contour of a tree crown, a specific shape or the combination of several shapes are used to represent it to avoid the impact of point cloud density on the tree species classification. After the crown segmentation, it is possible to select a limited number of basic shapes, namely triangles, rectangles, or arcs as the basic geometric elements to fit the tree crown shape. If the crown shape is relatively complex, a combination of basic shapes will be adopted to fit it. Then, if the crown belongs to the same type of shape, parameter classification, which completely transforms the crown into relative structure parameters to eliminate the influence of the tree size and the density of the point cloud, is used. The developed method showed a high accuracy of 90.9% in individual tree species classification by using the two test datasets acquired from two sites in Northeastern China.
3. Experiment and Result
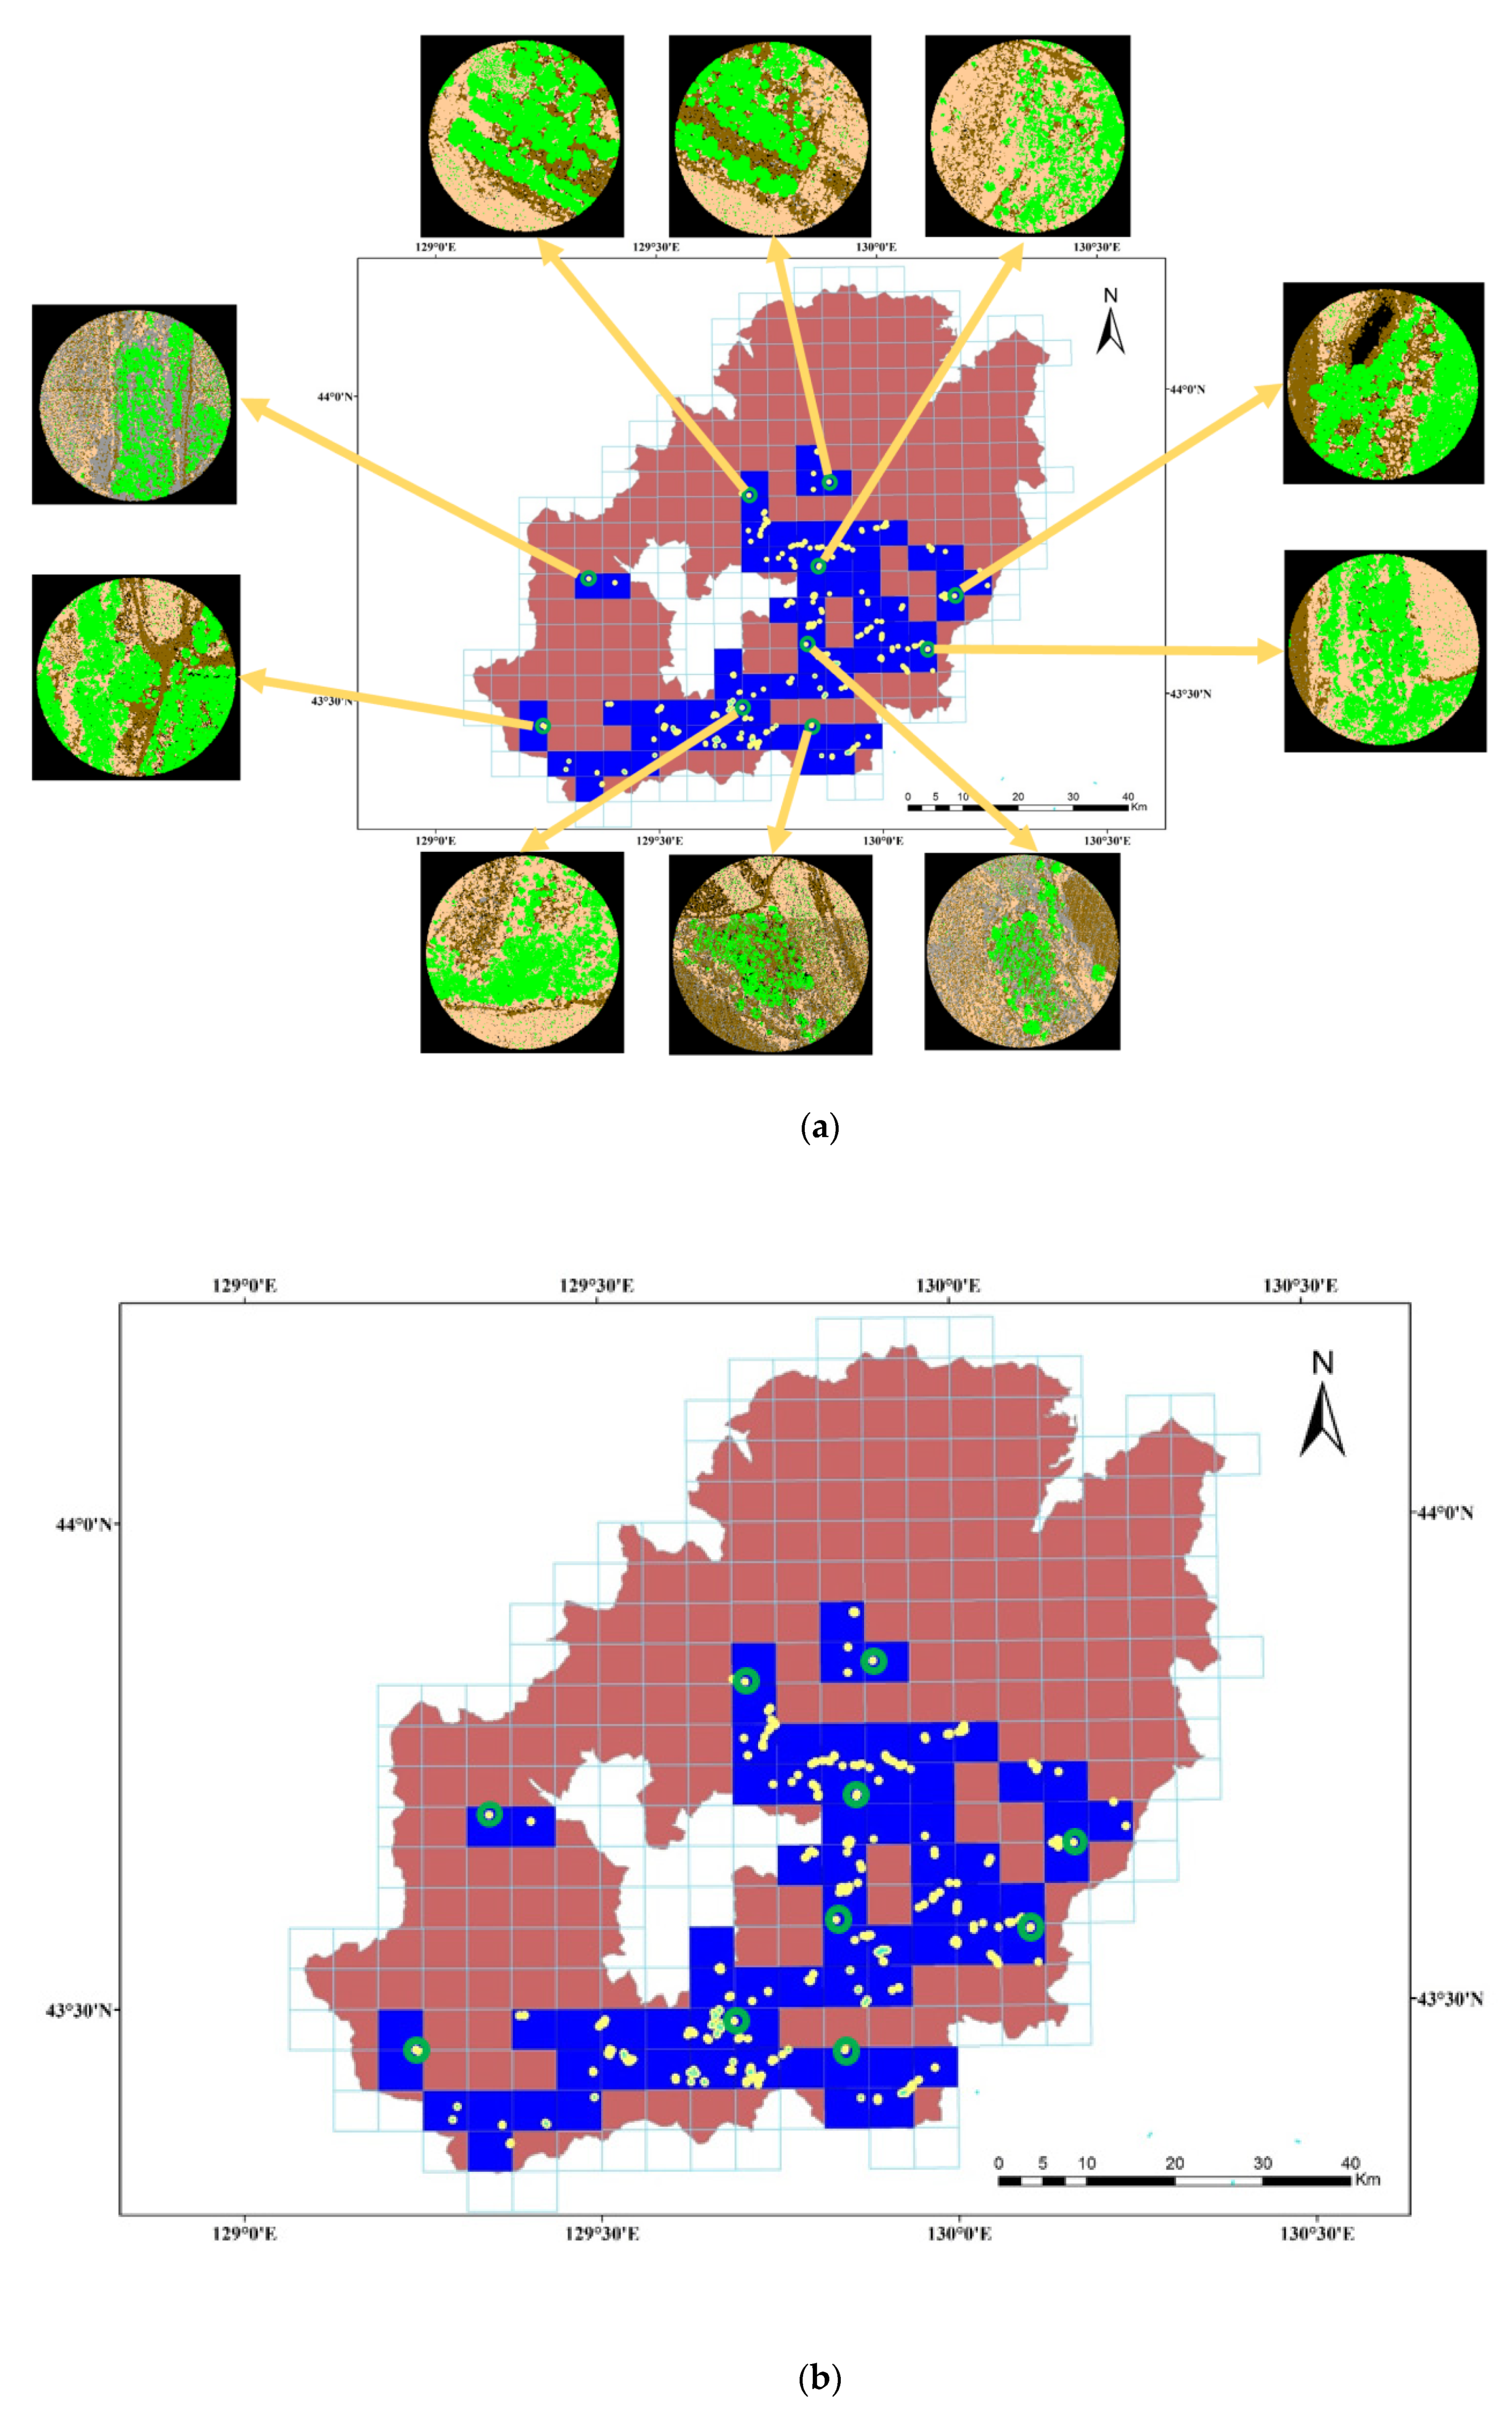
To verify the tree species classification method proposed in this paper, ten typical plots are selected from the Hopao National Park, as
Figure 1 shows, to test the method. The tree species samples required by the algorithm are selected from the other remaining187 plots.
Each sample plot has nearly 30 parameters, including the number of sample trees, location coordinate values and tree species information, and the tree species information can be used to verify the method proposed in this paper.
3.1. Location and Segmentation of Trees
Using template operations, the initial extraction of tree vertices can be achieved. The extraction accuracy is affected by the grid size d and the elevation threshold HT. To extract all trees in the survey area, both d and HT should not be more than 3 m. In the experiment, we increase the value of d from 1 m to 3 m in steps of 0.5 m and set the value of the height threshold HT according to the tree species composition in the survey area.
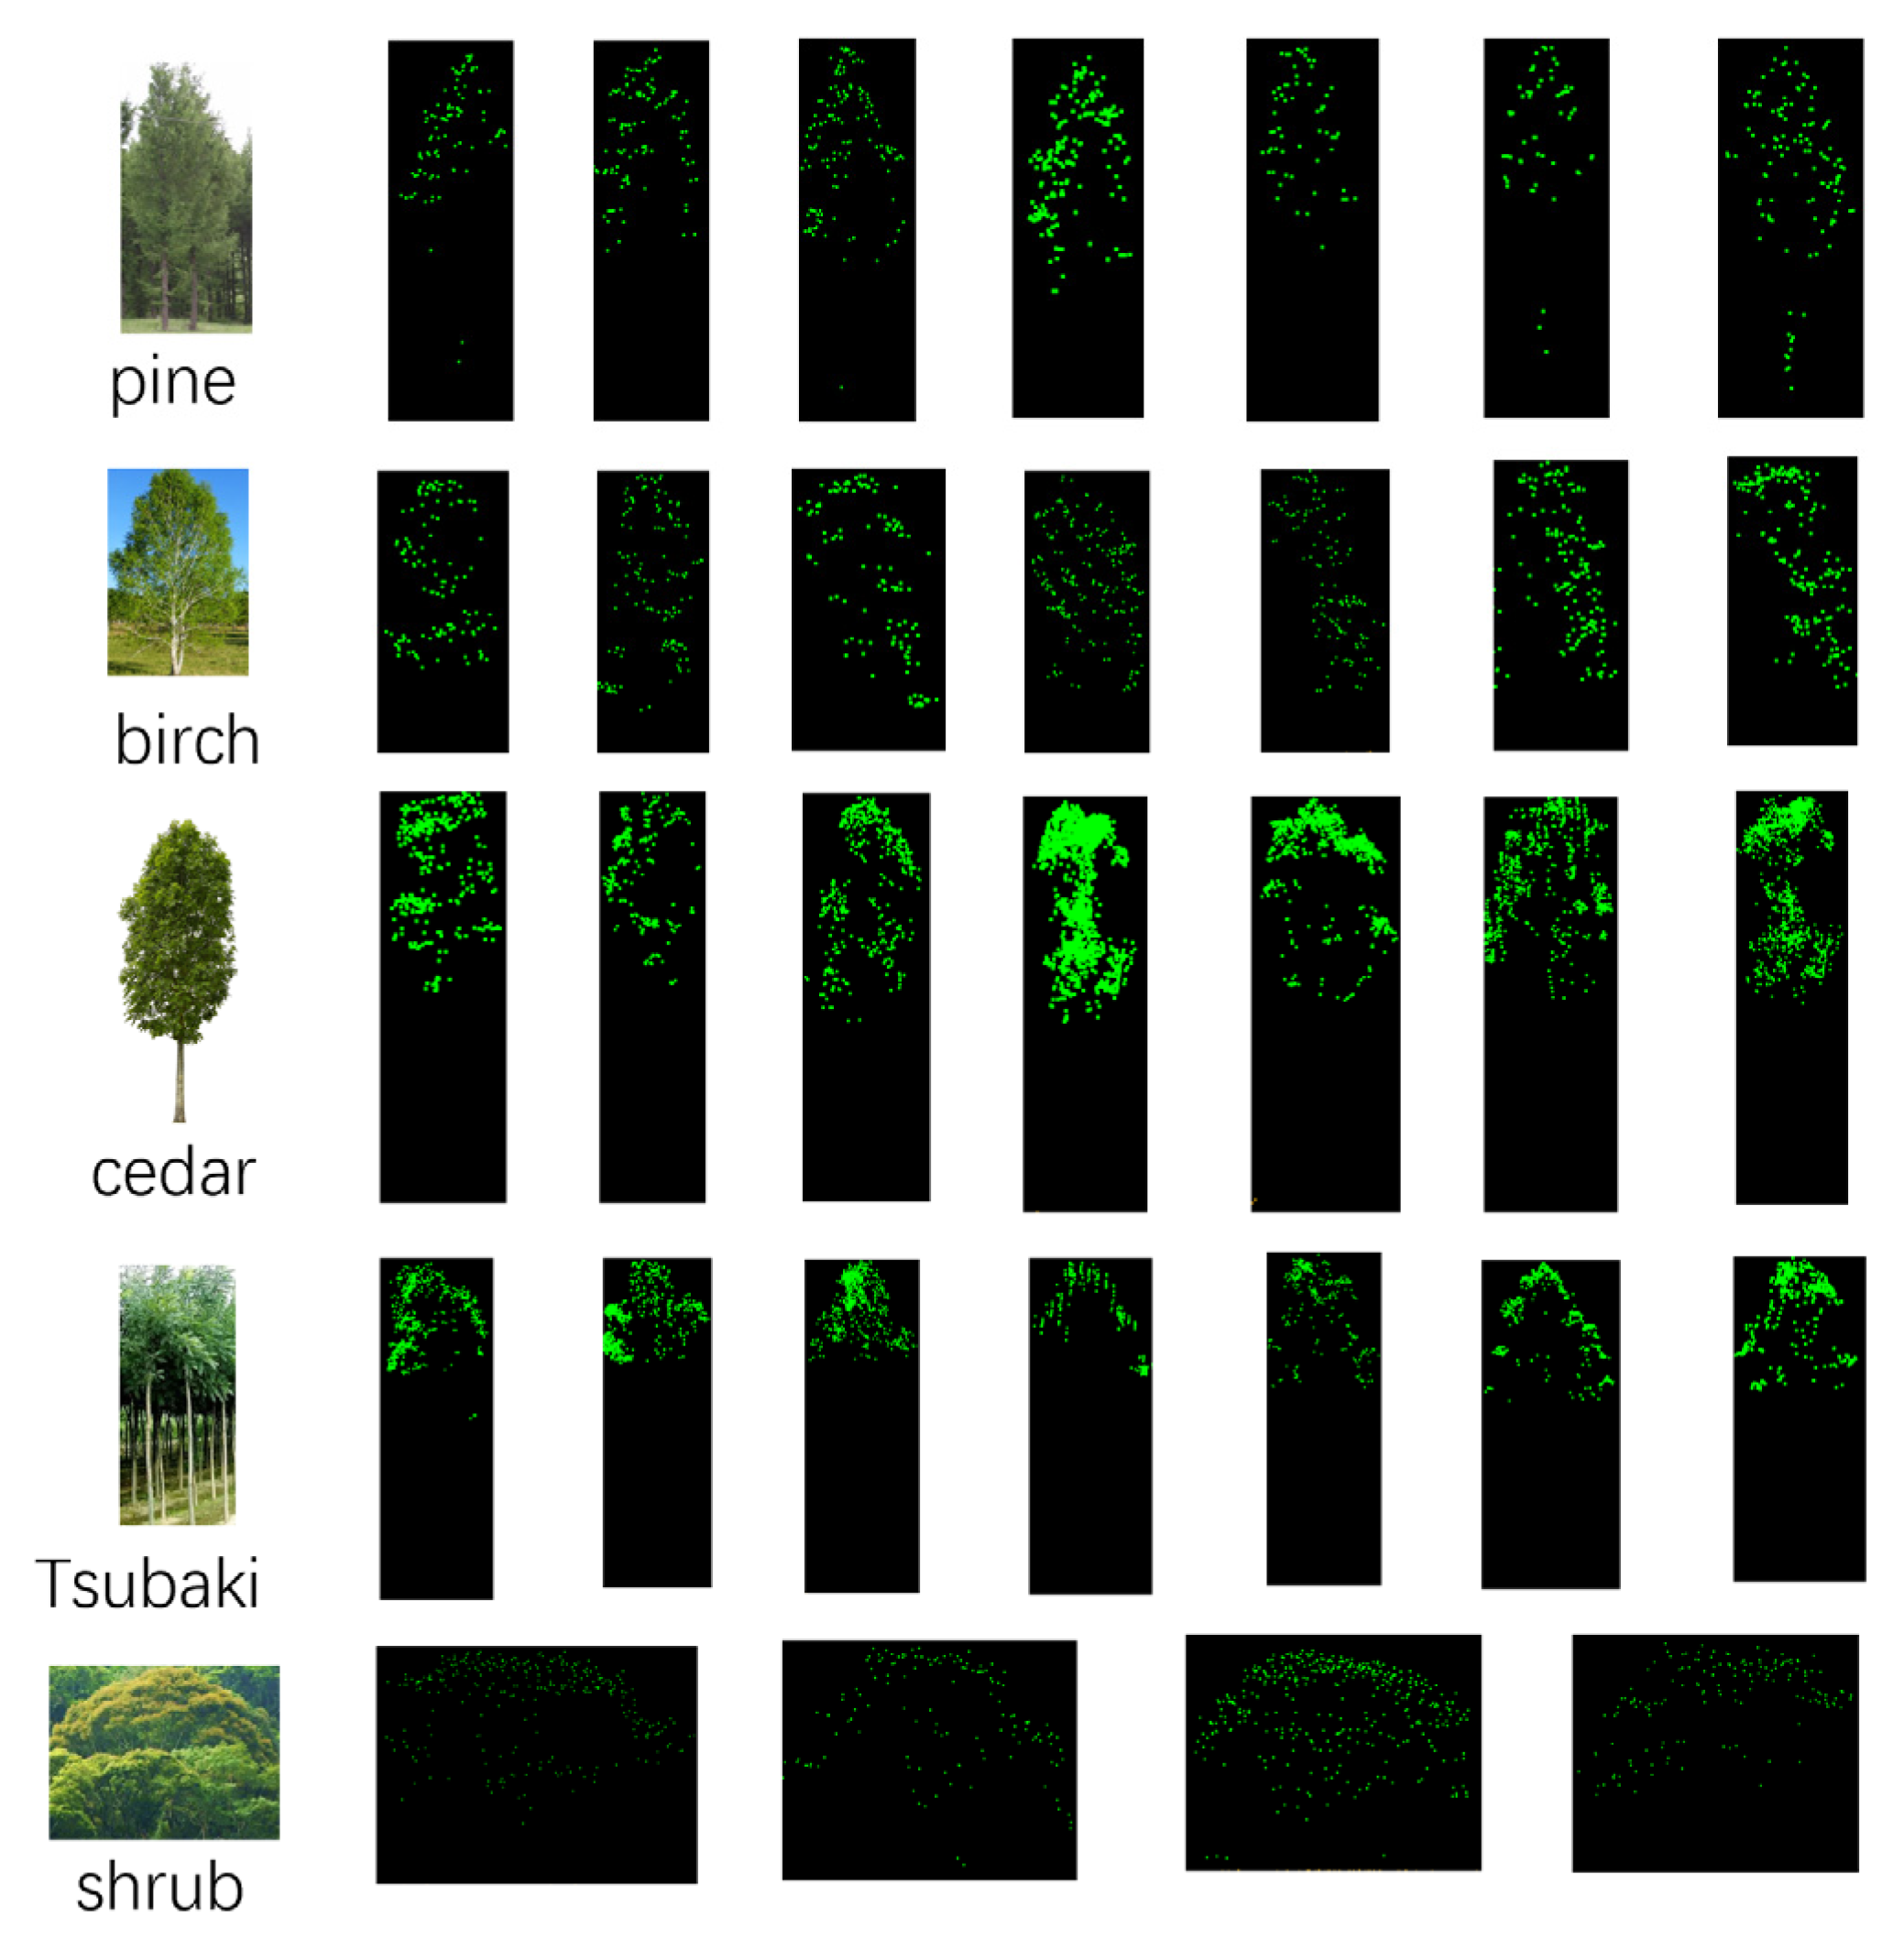
To obtain the optimal algorithm parameters for the tree location extraction, ten forest plots are used for the threshold value training and testing. The trees are mainly six species, including Pine, Birch, Cedar, Tsubaki, Shrub and others. The details of the training plots are listed in
Table 2.
Through the grid size
d and the elevation threshold
HT, the rough tree position can be obtained. Using the rotated profile with an angle step of
θ, the tree crown segmentation can be generated while the tree position is optimized. The sample plot is 30 m in diameter, there are a total of 781 sample trees in ten plots, and all the details are shown in
Table 3. The acquisition of the initial tree locations is the basis for the subsequent tree vertex position acquisition and the final tree segmentation. Therefore, to obtain a more accurate initial tree point position, one first needs to set more appropriate parameters
d and
HT as
Figure 16 shows. Different settings of
d and
HT lead to different results of the rough tree locations. If the
d and
HT are small, the detected rough tree number will be large and will require a lot of iterations to get the segmented tree crowns and finally the tree locations. Conversely, if the values of
d and
HT are set large, many small trees will be missed.
It can be seen in
Figure 16 that the blue curve represents rough tree numbers for each plot, the green dashed line represents the final calculated tree number obtained from the RPAA, and the orange curve represents the true tree numbers measured in the sample plots. The higher the coincidence degree of the green dashed line and the orange curve, the more reasonable the parameter
d and
HT settings are considered.
Figure 16b has ideal results when
d = 1.5 m and
HT = 1 m. The result is more sensitive to the parameter
HT and the parameter setting
d = 1.5 m;
HT = 1 m is more reasonable.
When
d = 1.5 and
HT = 1, the green row is the ideal extraction result. All calculated tree numbers are larger than the true tree numbers in each plot, meaning some trees with huge crowns are divided into two trees and there are no missing trees; the average extraction error rate
is 4.3% according to (8).
where
N: The number of the sample plots.
CTNi: The calculated tree number of the ith plot.
TTNi: The true tree number of the ith plot.
The setting of
d and
HT is according to the tree crown size in the sample plots, in which the diameter of the smallest tree crown is around 3 m. Consequently, the value of
d should be set equivalent to the radius of the smallest canopy. From
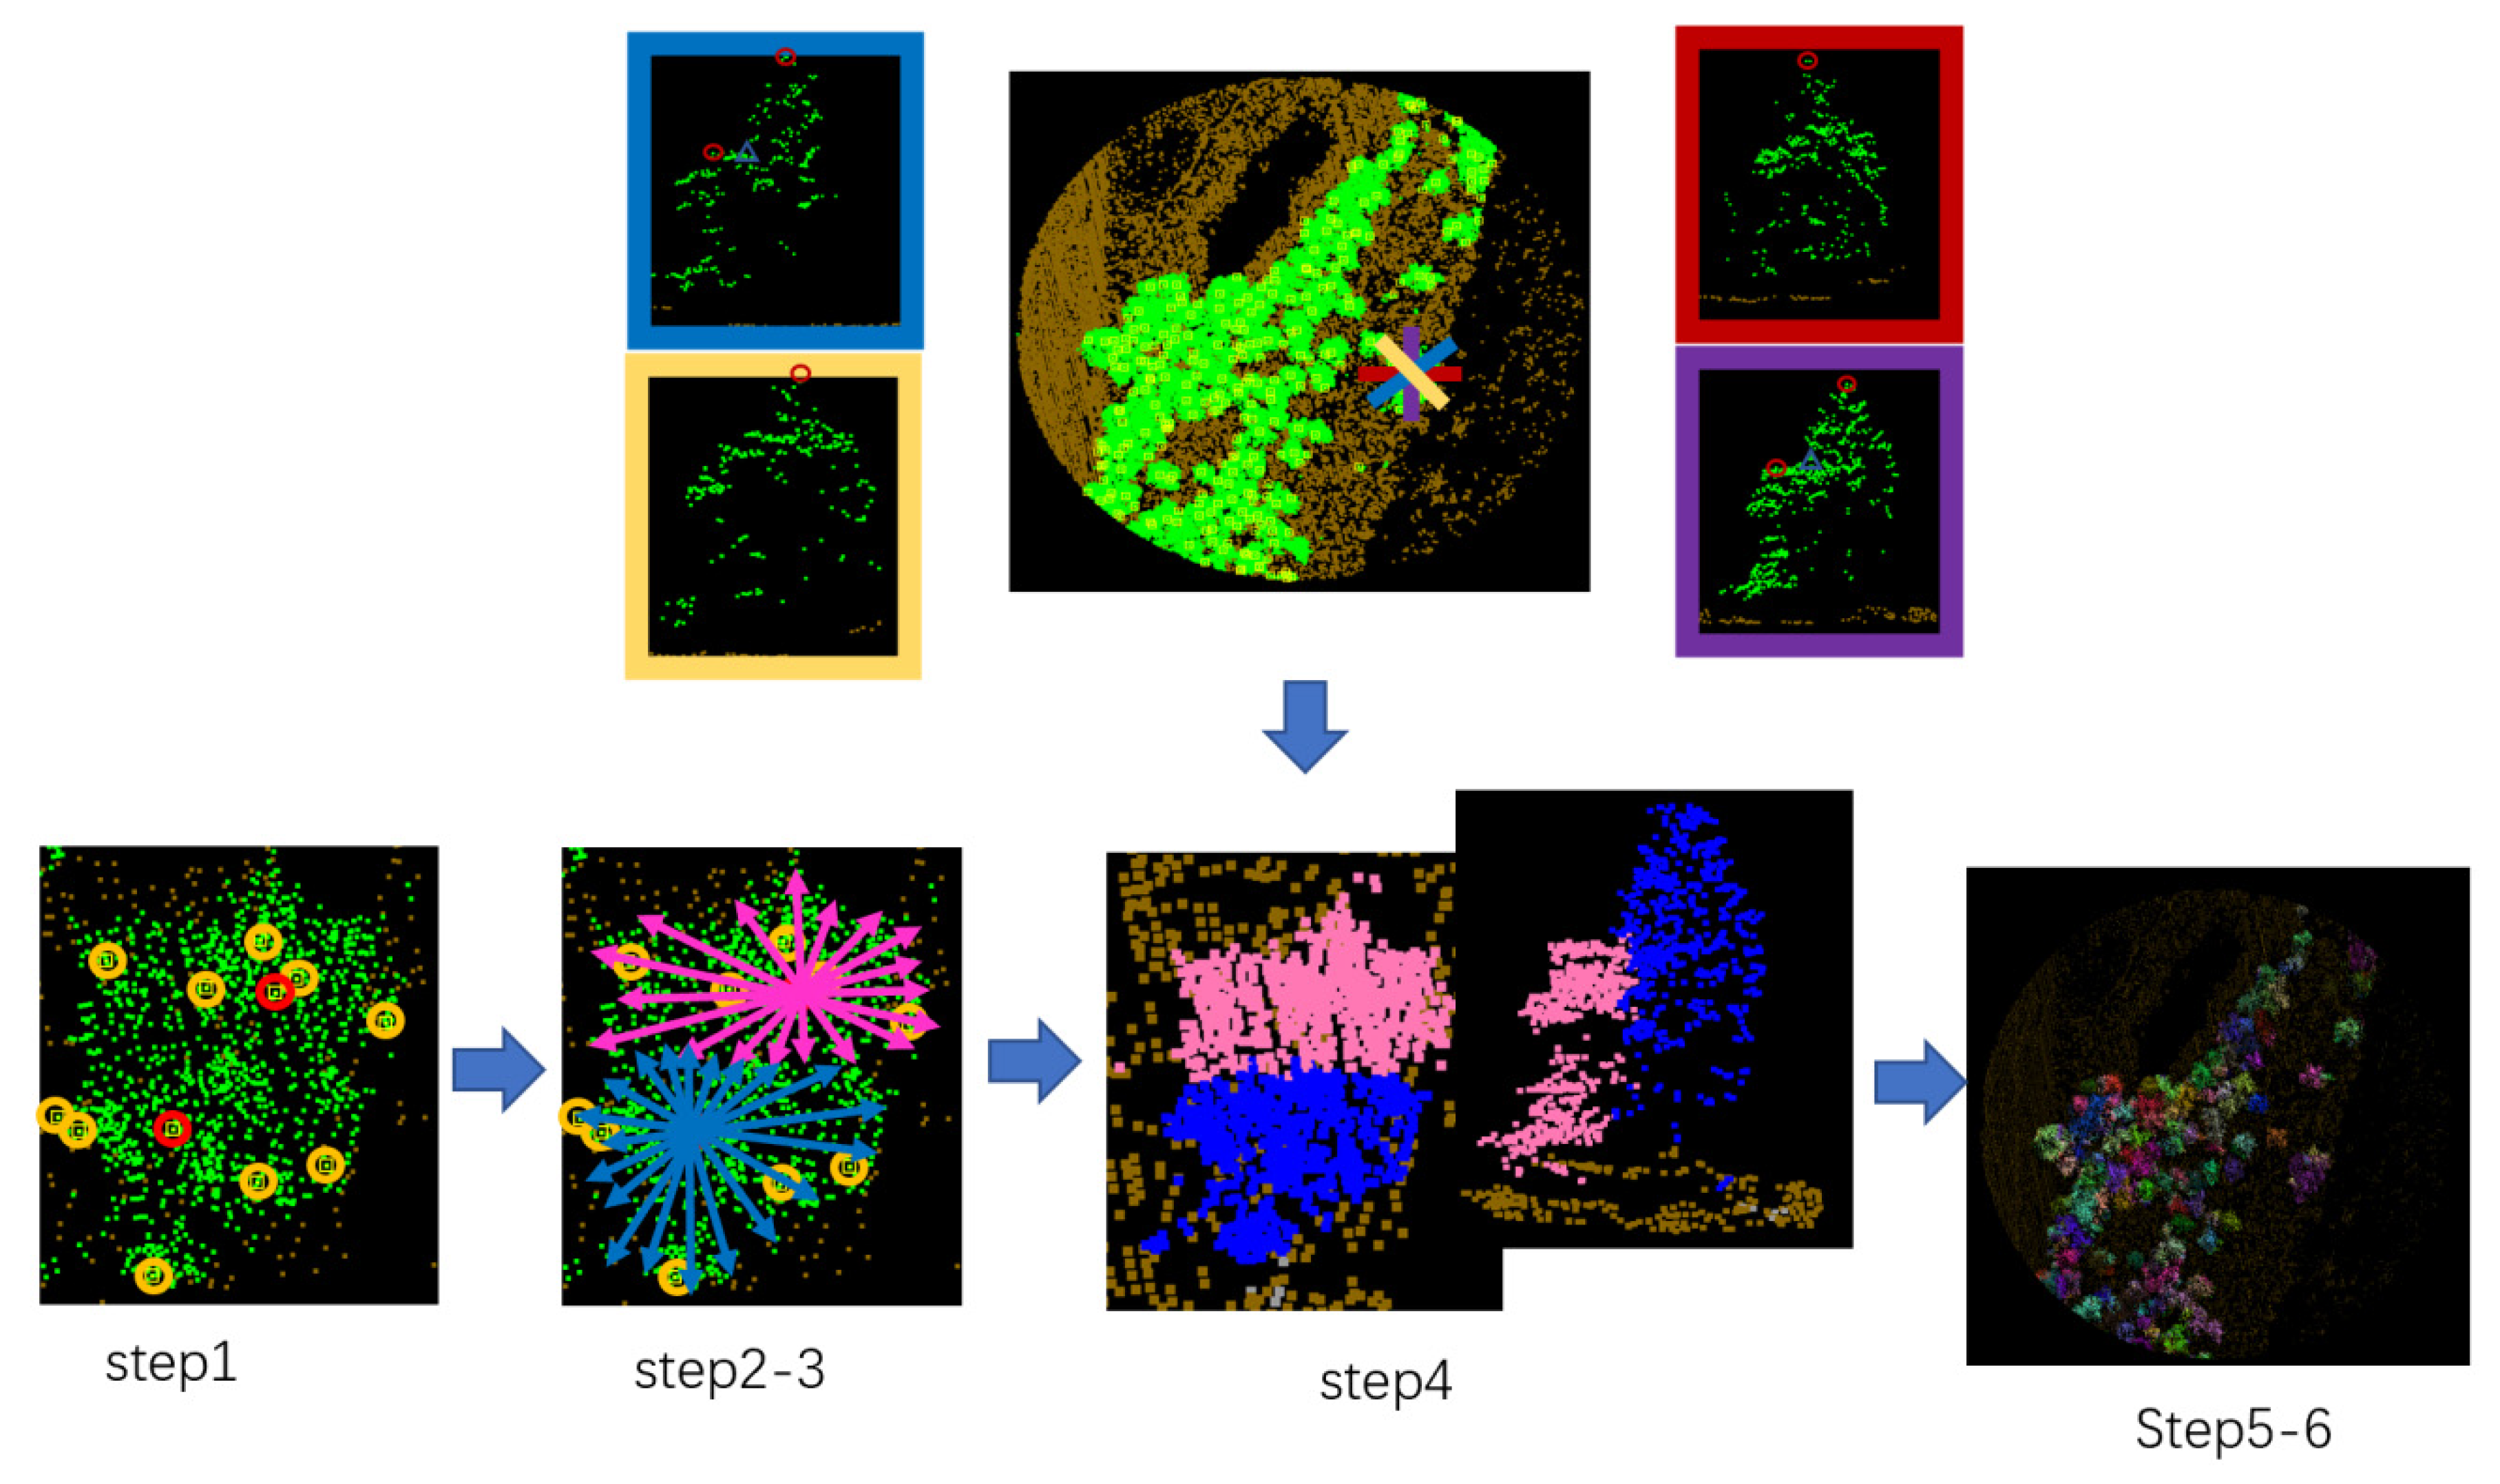
Section 2.2.5: While optimizing the location of the trees, the point cloud segmentation of individual trees is also completed, as
Figure 17 shows, which provides a data basis for subsequent tree classification. From
Table 3, the calculated number of trees must be greater than the actual number of trees to avoid missing detection. Therefore, in the canopy segmentation results some trees with larger canopies are divided into two, which are shown in the red circles in
Figure 17.
3.2. Tree Species Classification
This article uses structural and geometric information of each individual tree to determine the tree species classification. In the test site, there are mainly six kinds of trees, including pine, birch, cedar, Tsubaki, shrub, and others, and the details of the training plots are listed in
Table 2. In this paper, several typical trees of each type are selected to get firsthand geometry information, as
Table 4 shows.
From
Section 2.2.6, in the first stage, the Birch, Cedar, Shrub can be classified using the basic shapes. And in the second stage, the Pine and Tsubaki can be ruled out using the
as
Figure 18 shows.
.
From the samples, pine usually has a big , because the tree crown is usually exceedingly high. In the test site, the value ranges from 2.1 to 4.7, but we set the range from 2 to 5. For the Tsubaki, the range is not so big, but from 0.8 to 1.4. Here, we set it as 0.5 to 1.5. Then, we classify the triangle type trees which depends on the value of the . Accuracy evaluation indicators include the following:
Classification accuracy: the ratio of the correctly classified tree number of a certain species to the total number of trees of that species.
Type I error: Proportion of trees not belonging to class A tree species classified to class A tree species.
Type II error: Proportion of trees belonging to class A tree species not classified to class A tree species.
In the test data of ten plots, the tree number of each tree species is shown in
Table 2. Using the method in this paper, the tree classification results are listed in
Table 5.
From
Table 5, the tree species classification accuracy of shape fitting is better than that of LiDAR metrics method, and the average classification accuracy of shape fitting is 90.9%, while the average accuracy of the LiDAR metrics method is 87.2%. In the classification result of shape fitting, the optimal classification accuracy can reach 95.9%, and for the LiDAR metrics, the optimal classification accuracy can reach 93.8%.
The details of tree misclassification are listed in
Table 6, which can clearly indicate the number of tree species misclassified into other categories.
Table 6 shows that the pines, birches and cedars are often mixed, 12 cedars are classified as pines, and 5 pines are classified as cedars. Meanwhile, 6 birches are classified as pines and 6 pines are classified as birches. However, the Tsubakis and shrubs have good classification results; their overall classification accuracy is 94.03% and 95.95%, respectively, because of their particularity in appearance. Moreover, the Tsubakis and shrubs are obviously different from other tree species in geometry shapes. The kappa coefficient of the test is 0.8935 and the overall classification accuracy is good, reaching the expected results. And The tree species classification results of ten sample plots are shown in the
Figure 19. It can be seen from the
Figure 19 that the main tree species in the survey area are Pine and Birch.
4. Discussion
4.1. The Segmentation of the Trees
The high vegetation points, which are not segmented, are assigned to the corresponding tree point group with the shortest distance to the central axis of the tree, and the final tree crown segmentation is complete. The segmentation results are closely related to the grid size and the elevation threshold of the template calculation. If the values are too low, the calculation amount will increase. Otherwise, if the values are set too high, the trees will be missed. The optimal value is related to the point cloud density, tree crown size, and shapes.
In this paper, the laser point cloud data is first segmented into point groups, and each point group is taken as a whole; the structural features embodied in the whole point set are extracted to achieve the overall classification. To obtain the tree groups of all the samples in the test area, the threshold plays a significant role during the processing of tree locations, including the grid size d and the elevation threshold HT. Generally, the size d is related to the crown size, and setting of the elevation threshold HT refers to the shape of the treetop. In the test site, the minimum diameter of the tree crown is about 3 m, so the grid size is set to d = 1.5 m to ensure that all trees can be detected. The elevation threshold depends on the shape of the treetop. If the shape of the treetop is sharp, such as pine trees, the elevation threshold is larger. If the shape of the treetop is relatively flat, such as shrubs, the elevation threshold is smaller. However, in natural forest land, a variety of tree species are mixed. In order to ensure that all the samples are sorted out, the threshold is often chosen to be small, and the value here is HT = 1 m.
For this paper, the quality of the crown segmentation results mainly depends on the point cloud density and the growth mode of forest vegetation, whether it is loose distribution or interlaced branches and vines. The survey area in this paper belongs to the northeast forest region, and the vegetation distribution is relatively sparse. Therefore, the result of tree crown segmentation essentially depends on the point cloud density of forest land data and whether it is covered by trees. Some small trees or trees close to each other will inevitably be ignored, resulting in multiple trees combined into one tree. On the contrary, when a tree is too big or broad, it will be easily divided into two trees. The uniformity of tree growth in the forest area is also particularly important. Compared with the traditional watershed method, this method can avoid missing or excessive segmentation of the tree crown by moving the profile in multiple directions. In this paper, when d = 1.5 and HT = 1, the crown segmentation accuracy can reach 95.7%.
4.2. Tree Species Classification
The test areas in this paper are in the northeast of China where there are mainly coniferous forests. Unlike the tree species in the southern part of China, the canopy is relatively separable and rarely grows staggered. Compared with the trees in the south of China, the growth of trees in the northeast region is relatively discrete, and the results of tree crown segmentation can truly reflect the profile geometry of trees. It is inevitable that many trees grow together and snuggle up to each other, causing some difficulties in the classification of trees.
Section 3.2 indicated that, using the geometric information of the tree crown, the shape fitting method is slightly better than the LiDAR Metrics method proposed by Riaño and Reitberger [
34,
38]. The shape fitting method can more effectively eliminate the random error caused by the semi random dispersion characteristics of point clouds, making the tree species fit more specifically, which leads to better classification results. For a single tree growing naturally, each tree species has unique geometric characteristics, which have the following advantages for tree species classification:
(1) Leaves have little impact on the tree species classification result, which is an important advantage of using geometric morphology over using spectral information;
(2) Despite being affected by natural disasters, most trees can maintain their geometric shape well, and the general characteristics of the geometric shape of each tree species are relatively prominent and easy to distinguish.
(3) In
Figure 10, only a few typical tree geometries are listed. There are more than these tree geometries in the world. With the development of LiDAR technology, the density of point clouds is getting higher, and more details on trees can be obtained. More in-depth methods to use geometric forms need to be further studied and applied.
(4) Each basic geometric feature can be expressed parametrically, taking triangular shape, for example, which has side length and included angle. Therefore, in addition to using the geometric composition for classification, for trees with similar shapes, the value range of different parameters can be used for further classification.
However, the performance of the parallel-line shape fitting method mainly depends on the segmentation results, and
Table 5 and
Table 6 indicate that the pines, birches, and cedars are easily confused or indistinguishable. There is also a sizable proportion of misclassification in the “other “class. The reasons are summarized as follows:
(1) From the perspective of classified objects, trees with similar geometric shapes are easier to be misclassified, such as pines, birches and cedars in the test site.
(2) The result of classification depends on the result of tree crown segmentation. The result of tree crown segmentation is affected by many factors, e.g., lightning or rocks can cause changes in the geometric shape of trees, and that is the main reason many tree species are wrongly classified into the “other “ class.
(3) If many trees are growing close together, the segmentation results as well as the classification of tree species will be affected. In this survey area, if pines or birches grow together, they are easily identified as cedars, because the segmentation algorithm easily classifies the trees’ points next to each other equally, which makes the triangular shape become a rectangular section structure.
(4) For tree species with single basic geometric structure, such as triangular, rectangular or arc-shaped tree species, the classification accuracy can reach 90%, such as pines, shrubs, etc.
From above, it is clear that in Northeast China, the growth of trees is relatively sparse, the types of tree species are relatively simple, which are mainly coniferous forests and some deciduous forests. Therefore, the method proposed in this paper can obtain better classification results and save manual participation greatly in the forestry survey.
For the complex forest area with complex tree species in the south area, it is difficult to achieve good classification accuracy. Strictly speaking, the geometric shape of trees has the unique characteristics of each tree, and the geometric shape of trees is affected by accidental factors, which often affects the classification accuracy when using the shape fitting method. As a result, in the further work, more shapes or more remote sensing techniques, such as multispectral or radar technology, should be combined with laser radar technology to improve the classification in complex forest areas.
5. Conclusions
In this paper, a rotating profile at a certain angle (RPAA) is used, and the initial segmentation of the crowns is complete; then the accuracy of tree crown segmentation has reached 95%, which provides excellent preparation for tree species classification.
Assuming that the tree crown can be seen as the triangle, rectangle, arc, and other basic shapes, or as combinations of basic geometry, the parallel-line shape fitting method is performed to classify tree species; this type of species classification has an average classification accuracy of 90.9%, and the optimal classification accuracy was 95.9%. It is superior to the parametric crown classification method, which also uses the geometric information of the tree crown, in average accuracy of 87.2% and the highest accuracy of 93.8%; however, the latter often requires full waveform data.
Table 7 shows the accuracy of different tree species classification. Method 1 is an SVM/RF classifier based on fusion data [
61]. It works well in general macro-classes, but it is not very suitable for single tree species classification. Method 2 is CNN based on UVA images [
49]. It is only applicable to palm classification and does not have universality. Method 3 is the linear discriminant function with a cross validation based on LiDAR intensity data [
47]. Its classification rate is higher using leaf-off data (84.3%) than using leaf-on data (73.1%) and is at its highest (90.6%) when combining these two. Method 4 is unsupervised classification based on full waveform LiDAR data [
38]. Its results are also different in the data set of leaf-off and leaf-on. Method 5 is DNN based on UAV LiDAR data [
62]. It has satisfactory results in the classification of two tree species. Method 6 is the algorithm used in this paper and the method in this paper largely depends on the segmentation results of the tree crown. For trees whose crown geometry is similar to each other or grow too close, the tree species classification usually has poor results, because the original crown shapes are damaged by interwoven crowns. As a result, the method proposed in this paper can obtain better classification results in sparse forest areas. From
Table 7, it is clear that the shape fitting method is suitable for tree species classification in sparse areas.
In further work, more shapes should be tested, and the spectral information of the image can be combined, or the phenological information of multi-temporal data can be used to improve the accuracy of tree species classification. But, in the tropical rain forest where tree species grow staggered, tree species extraction and classification are still difficult.


