Article

Drought Propagation in Brazilian Biomes Revealed by Remote Sensing

by
Júlia Brusso Rossi
1,*,
Anderson Ruhoff
1,
Ayan Santos Fleischmann
2 and
Leonardo Laipelt
1
1
Institute of Hydraulic Research, Federal University of Rio Grande do Sul, Porto Alegre 91501-970, Brazil
2
Mamirauá Institute for Sustainable Development, Tefé 69553-225, Brazil
*
Author to whom correspondence should be addressed.
Remote Sens. 2023, 15(2), 454; https://doi.org/10.3390/rs15020454
Submission received: 16 December 2022 / Revised: 6 January 2023 / Accepted: 10 January 2023 / Published: 12 January 2023
(This article belongs to the Special Issue Remote Sensing of the Amazon Region)

Abstract

:
Drought events have been reported in all Brazilian regions every year, evolving slowly over time and large areas, and largely impacting agriculture, hydropower production, and water supplies. In the last two decades, major drought events have occurred over the country, such as the 2010 and 2015 events in the Amazon, the 2012 event in the Pampa, and the 2014 event in the Cerrado biome. This research aimed to understand drought propagation and patterns over these biomes through joint analysis of hydrological, climatic, and vegetation indices based on remote sensing data. To understand the drought cascade propagation patterns, we assessed precipitation, evapotranspiration, soil moisture (at surface and sub-surface), terrestrial water storage, land surface temperature, enhanced vegetation index, and gross primary productivity. Similar drought patterns were observed in the 2015 Amazon and 2012 Pampa droughts, with meteorological and agricultural droughts followed by a hydrological drought, while the 2014 event in the Cerrado was more associated with a hydrological drought. Moreover, the 2015 Amazon drought showed a different pattern than that of 2010, with higher anomalies in precipitation and lower anomalies in evapotranspiration. Thus, drought propagation behaves differently in distinct Brazilian biomes. Our results highlight that terrestrial water storage anomalies were able to represent the hydrological drought patterns over the country. Our findings reveal important aspects of drought propagation using remote sensing in a heterogenous country largely affected by such events.

Graphical Abstract

1. Introduction

The Earth’s surface has warmed over the past decades [1,2], and the last few years have been described as the warmest on record [3]. A changing climate can lead to unprecedented climate extremes due to changes in frequency, intensity, spatial extent, duration, and timing of droughts and floods [4,5]. Drought can lead to major impacts on agriculture, hydropower production, and water supplies [6,7,8]. In 2020, Brazil experienced one of the worst water crises in almost a century [9], and in 2021–2022, it continued to experience drought events in its south and southeast regions [10], as shown by the Brazilian’s Drought Monitoring System (https://monitordesecas.ana.gov.br/ (accessed on 12 December 2022)). Furthermore, climate change is projected to lead to more intense and recurrent drought events in some regions of Brazil [11].
Brazil is particularly vulnerable to droughts events, especially agricultural and electrical production in eastern Brazil, since irrigated agriculture uses 32% of the country’s water, and hydropower provides more than 70% of Brazil’s energy generation [6]. Considering the importance of agriculture (irrigated and rainfed) to the Brazilian economy (e.g., soybean crops), drought events cause an increase in water use for irrigation to avoid crop failure due to climatic conditions. Anderson et al. [7] identified agricultural regions within Brazil, primarily in the southern and northeastern states, where crop yields have been climatically sensitive to moisture deficits during the past decade. In southern Brazil, one of the worst droughts ever was registered in the austral summer of 2020, which affected several sectors, such as agriculture, hydropower generation, and water supply to the population [12]. In the Amazon, reduced water vapor in the atmosphere, evapotranspiration (ET), and precipitation (P) [13] can impact agriculture, river transport, and hydroelectric generation, triggering forest fires, tree mortality, and changes in carbon emissions [14].
Droughts have been grouped into four types [15,16,17]: (i) meteorological drought, related to anomalous P deficiency; (ii) agricultural drought, associated with deficit in soil moisture; (iii) hydrological drought, related to negative anomalies in surface and subsurface water; and (iv) socioeconomic drought, when the phenomenon leads to socioeconomic impacts. However, these definitions can be updated as the knowledge of drought risk expands. In addition, these drought types are all progressive stages of the same drought propagating through the hydrological cycle [18]. These events can be assessed by changes in hydrological fluxes, such as P, and land surface water fluxes, including ET and runoff, and storage, including soil moisture and groundwater [19]. The depletion of soil moisture storage is related to complex hydrological processes connecting the atmosphere, surface, and soil or geological formations, including ET, infiltration and percolation to groundwater, and runoff to streams [20]. These variables can be used to assess different drought types; for instance, P for meteorological drought, soil moisture for agricultural drought, and streamflow, reservoir, or groundwater levels for hydrological drought [16,21].
The expression “drought propagation” has been used to denote changes in the drought signal as it moves through the terrestrial part of the hydrological cycle (from anomalous meteorological conditions to hydrological drought) [20]. A variety of characteristics of drought propagation (e.g., the response time scale, lag time, and propagation rate) can be defined to depict the propagation process [22]. Additionally, determining the mechanisms of drought propagation is necessary in a multi-indicator approach [23]. Moreover, meteorological droughts with similar features (e.g., magnitude and duration) can propagate differently and cause distinct social and economic impacts, evidencing the need to improve the understanding of drought propagation mechanisms [24]. Shi et al. [25] analyzed drought propagation on a global scale and showed that regions with humid climates and large ET rates had a strong response relationship between meteorological and hydrological drought. Considering the effects of a warmed climate, Jehanzaib et al. [26] calculated the propagation probability of a meteorological drought turning into a hydrological drought and found that the probability increased significantly under climate change scenarios. To better characterize extreme events, especially considering that regional intense droughts have caused major depletion of water resources in southeastern Brazil, Melo et al. [27] pointed out that further analysis of drought propagation is necessary.
In order to address the complex characteristics of droughts (timing, duration, intensity, and spatial extent), as well as their development and cascade propagation through the water cycle, a multi-indicator approach is required [23]. Advances in remote sensing of the terrestrial water cycle have helped in this, enabling the Earth’s surface and atmosphere to be monitored at different spatial and temporal resolutions all over the globe and providing a core alternative for regions with a low density of ground measurements [28,29,30,31,32]. For example, Farahmand et al. [33] characterized drought cascades in the USA using satellite observations of vapor pressure deficit (VPD), P, terrestrial water storage (TWS), and reanalysis-based estimates of root zone soil moisture. Moreover, remote sensing data can empower policy and decision makers towards social, economic and environmental policies that promote better adaptation to extreme droughts [6].
Because of Brazil’s dimensions, each region and biome has specific climatological and ecological characteristics, in addition to different population densities and occupation patterns, which influence the frequency and intensity of drought impacts in each location. Scientific studies have been published on droughts using remote sensing for different Brazilian regions and biomes [11,34,35,36,37,38,39,40,41], although very few studies have been dedicated to biomes such as the Pampa [11,41]. Furthermore, most research has focused primarily on P and ET [42].
Droughts affected most parts of Brazil in last decades [43,44], with an increasing trend in droughts and heatwaves in some parts of the country [45]. Therefore, the main goal of this study was to understand drought patterns and propagation, and to compare events that occurred in different Brazilian biomes based on remote sensing data. This was accomplished by assessing eight hydrometeorological and land-surface indicators, such as P, ET, soil moisture at surface and sub-surface, TWS, land surface temperature (LST), enhanced vegetation index (EVI), and gross primary productivity (GPP), based on remote sensing data that are publicly available through a cloud computing environment (Google Earth Engine—GEE). We evaluated four extreme drought episodes that occurred in Brazil: the 2010 and 2015 events in the Amazon, the 2012 event in the Pampa, and the 2014 event in the Cerrado biome. The spatial and temporal drought patterns were determined by assessing the response and recovery time of each variable in relation to its anomalies for the extreme drought events. This allowed us to evaluate the drought propagation patterns through the hydrological cycle, in addition to the onset, duration, and maximum intensity of drought events.

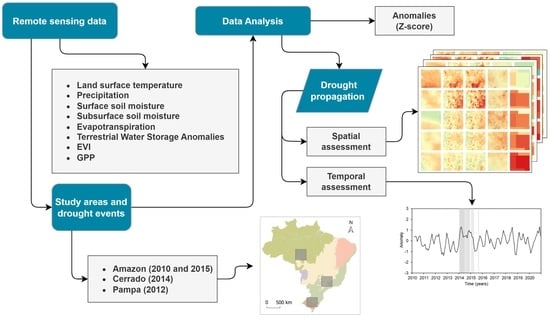
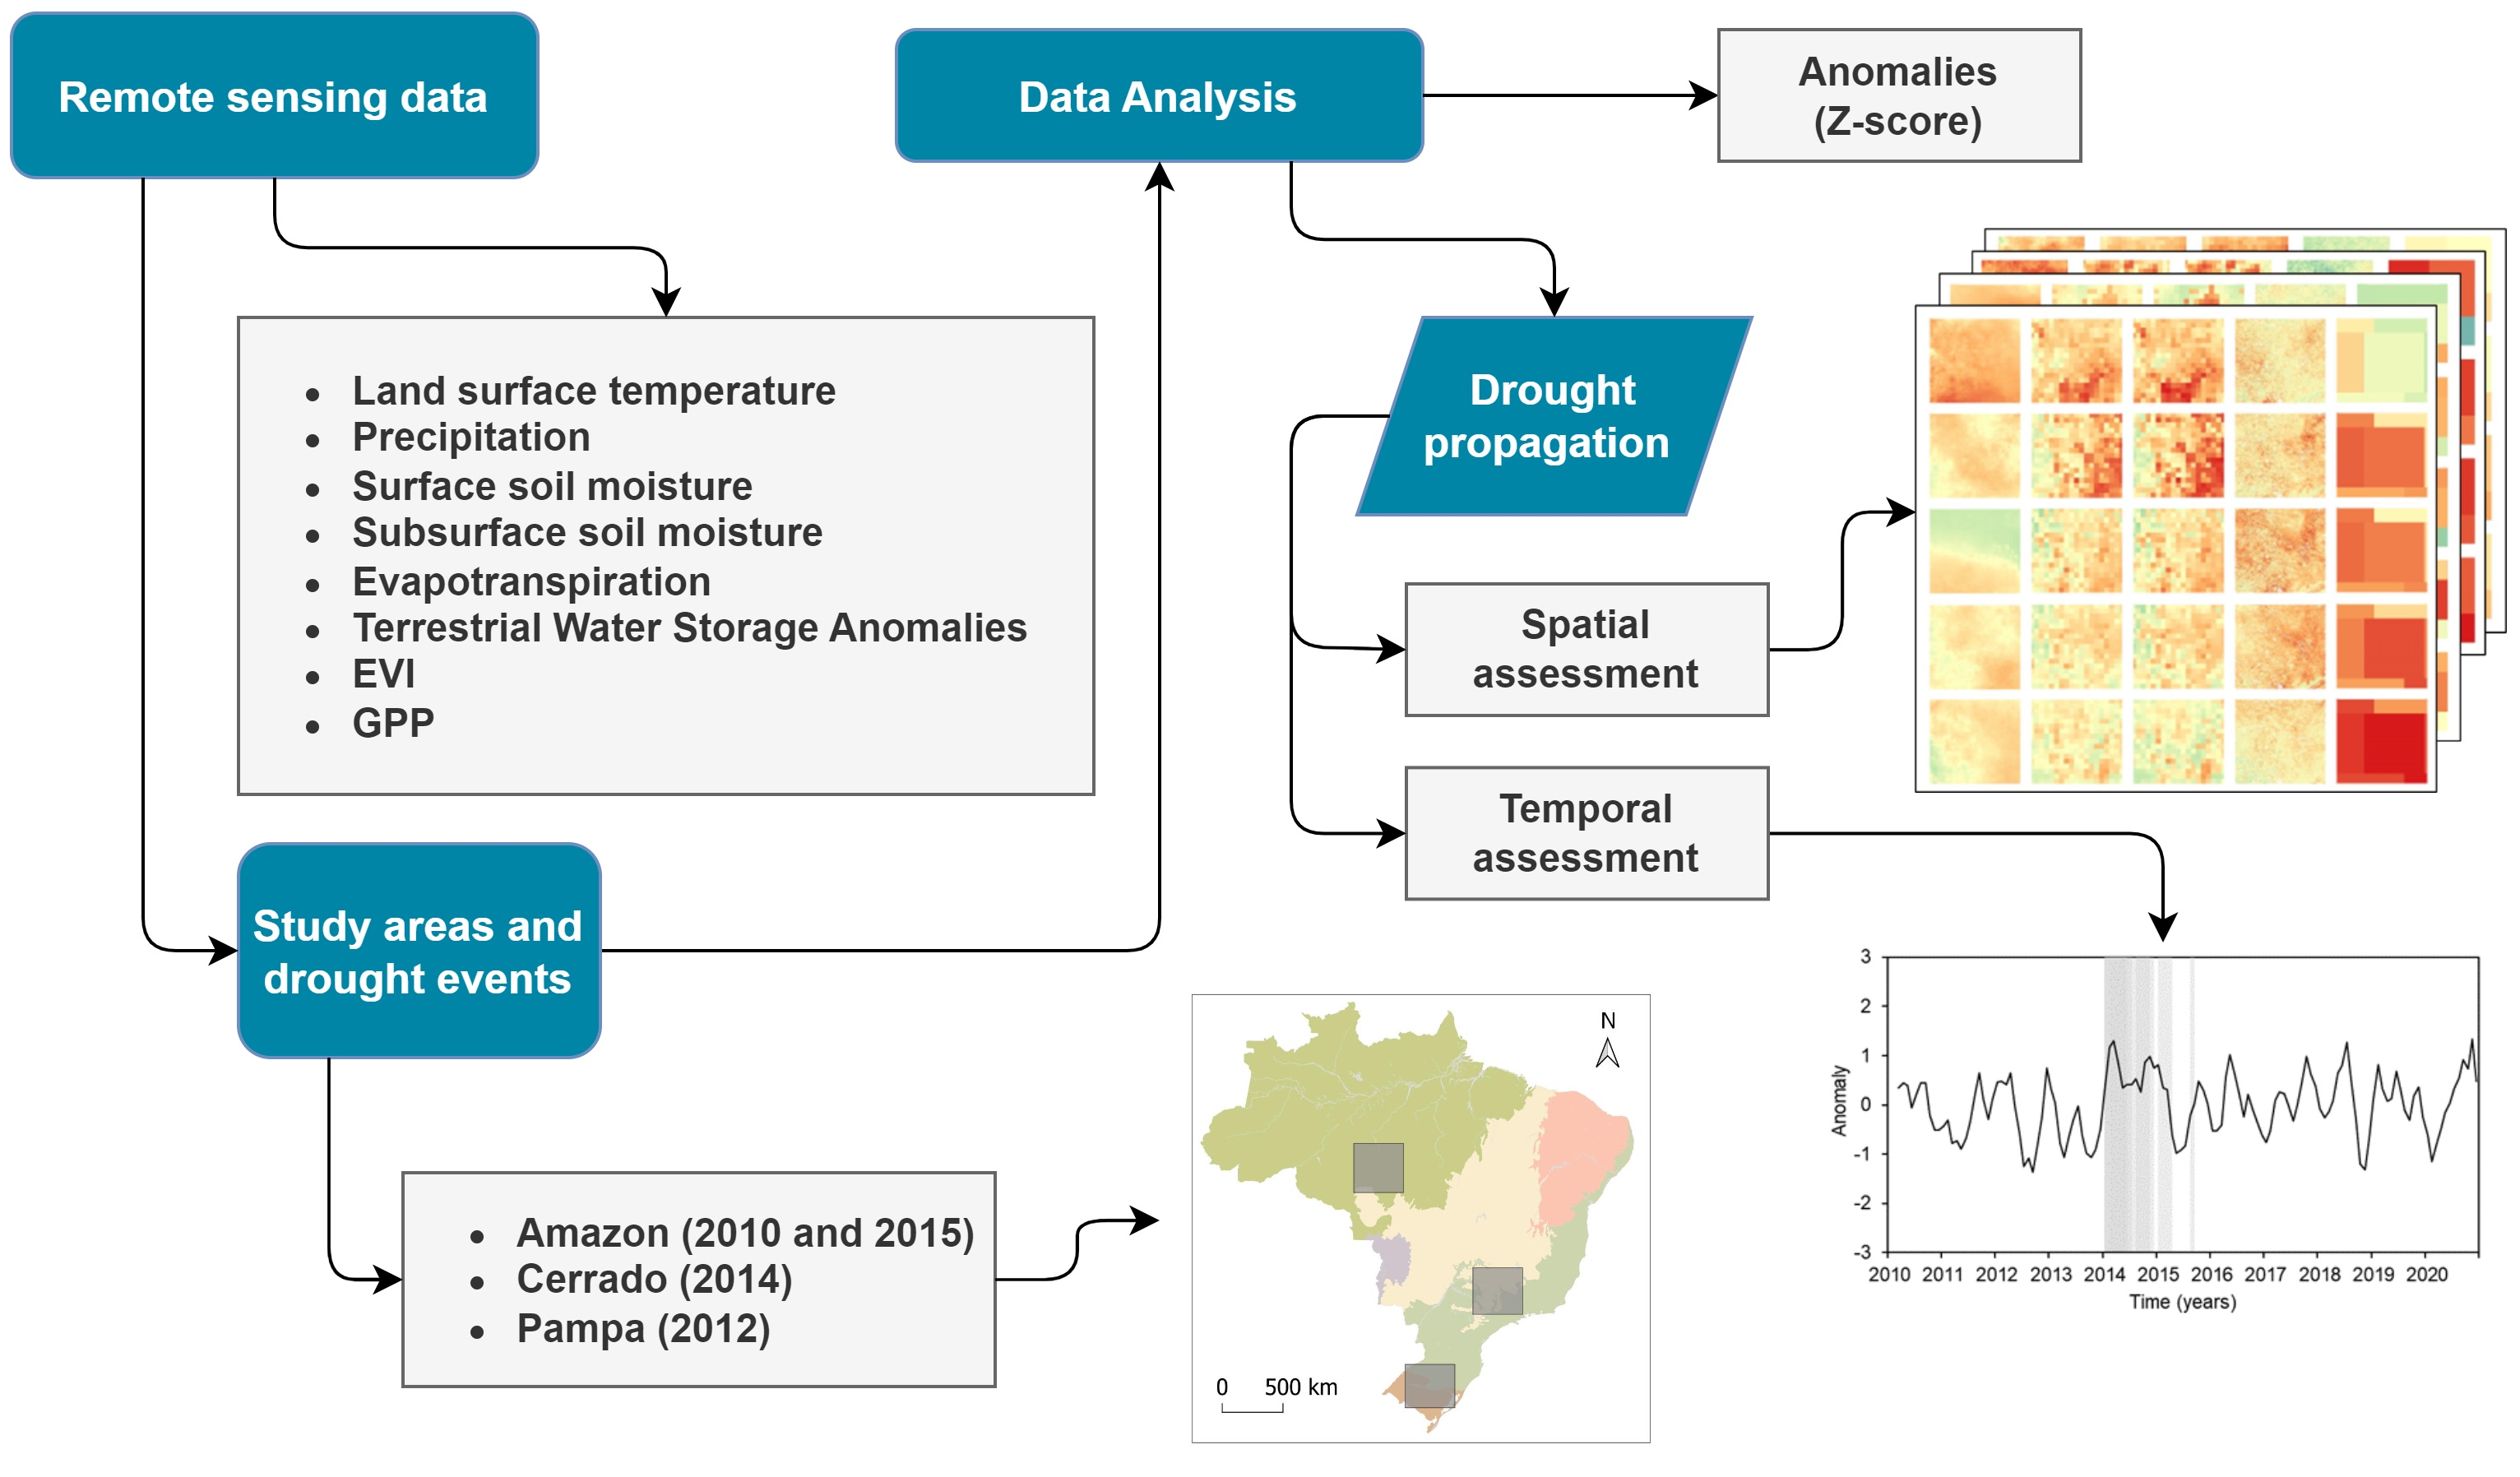
2. Materials and Methods

2.1. Study Areas and Drought Events

Three Brazilian biomes with great importance for the country’s water, energy, and food security were chosen as study areas (Figure 1): the Amazon, Cerrado, and Pampa. Major drought events occurred over these areas in the last two decades, such as the 2010 and 2015 events in Amazon, the 2014 drought over southeastern Brazil (where the Cerrado biome predominates in combination with the Atlantic Forest biome), and the 2012 event in the southern region (mostly covered by the Pampa biome). It is worth mentioning that other severe drought events occurred in Brazil in the last years, although they were not addressed in this study, such as the 2019–2020 drought in the Pantanal biome [46] and the 2020 drought in the southern region [12].
The analysis of droughts in Brazil covered three study areas delimitated by regions of 500 × 500 km2 in each of the three biomes. The location of these regions was defined to coincide with large areas affected by major drought events in the last decades.

2.1.1. Amazon: The 2010 and 2015 Droughts

According to Marengo et al. [47], most of the Brazilian Amazon has an annual P cycle with the highest rainfall in austral summer and an average annual rainfall of approximately 2200 mm/year [48,49]. The wet/dry seasons are defined as December-March/July-October for southern Amazonia and February–May/July–October for northern Amazonia, according to the rainfall seasonal cycle [50].
The southern Amazon, especially the southeastern region, includes the area with a large expansion of deforestation, also known as of the arc of deforestation, which is the driest portion of the Amazon Basin [51], with months with rainfall rates lower than 100 mm during the austral winter [52]. The region was affected by severe droughts in 2010 and 2015, which were associated with a record-breaking warming [50,53,54]. The analyzed region was located over the southern Amazon biome, a region predominantly covered by forest (76%), associated with indigenous lands and conservation units, and especially characterized by large deforestation associated with agriculture and pasture development (22% covered by farming) [51].

2.1.2. Cerrado: The 2014 Drought

The Cerrado (usually called the “Brazilian savanna”) biome covers a large part of southeastern Brazil and its vegetation encompasses savanna formations as well other types, ranging from grasslands to forests [55]. The Cerrado is a seasonal ecosystem characterized by distinct dry and wet seasons [56], with a rainy season during the austral summer (December-February) [57]. The region was affected by an intense South Atlantic Convergence Zone (SACZ) episode during mid-to-late December 2013 [57]. There was a rainfall deficit until the end of the rainy season, in March 2014, and this scenario was repeated in 2015, which resulted in a scarcity of soil moisture [58]. Water supplies, agriculture, and energy generation were severely affected by this event, since the region is highly populated and contains the main hydropower plants in the country, numerous industrial centers, and irrigation fields [6]. The selected study area was located in a region roughly corresponding to the Upper Paraná River basin. This area is predominantly covered by farming (77%), with some parts covered by forest vegetation (13%).

2.1.3. Pampa: The 2012 Drought

The Brazilian Pampa is predominantly a natural grassland region located in the extreme south of the country, within the South Temperate Zone, and has both subtropical and temperate climates with four well-characterized seasons [59]. The region has regular P during the whole year, even though it is often subject to prolonged and severe droughts, which can greatly affect the growth and harvest of crops [60]. The biome faced significant drought impacts between 2009 and 2015, with municipalities declaring an emergency and constantly reporting economic losses in the agricultural sector [11]. In this context, most of Brazilian southern region presented drought conditions through an extensive area in 2011–2012, which affected water supplies in rural properties, agriculture, and livestock production [43]. The studied area was mostly located in the Pampa biome (southern portion), while the northern portion had a mixture of agricultural lands and remaining vegetation from the Atlantic Forest biome. This area is predominantly covered by farming (45%), grassland (26%), and forest (20%).
Figure 1. Brazilian biomes and land cover in the study areas. Land cover from MapBiomas [61].
Remotesensing 15 00454 g001

2.2. Datasets

Remote sensing datasets (Table 1) were obtained from GEE, a cloud computing-based platform that allows extensive computational processing in a planetary scale [62]. The GEE public data catalog encompasses widely used geospatial datasets, with most of the catalog consisting of remote sensing data, but also including diverse environmental, geophysical, and socio-economic datasets.

2.2.1. Land Surface Temperature

LST is the radiative skin temperature of the land surface, and hydrologic and ecological processes are sensitive to variations in LST [70]. LST estimates are available from the MODIS MOD11A2 product and were derived here with a spatial resolution of 1 km and an average 8-day compositing period, consisting of an average from two to eight days of the MOD11A1 daily LST product [63].

2.2.2. Precipitation

Precipitation (P) was obtained from the GPM mission, launched in 2014 in a cooperation between NASA and JAXA. GPM expands on the previous Tropical Rainfall Measuring Mission (TRMM), which operated from 1997 to 2015, providing improved P measurements globally. The algorithm used is the Integrated Multi-satellitE Retrievals for GPM (IMERG), which provides P estimates from analysis of several satellites of the GPM constellation, with microwave-calibrated infrared (IR) satellite estimates, P gauge analyses, and potentially other P estimators [64]. The IMERG algorithm provides global P estimates with half-hourly and monthly temporal resolutions of approximately 11 km (0.1°).

2.2.3. Surface and Subsurface Soil Moisture

The adopted soil moisture dataset was developed by the Hydrological Science Laboratory (HSL) at NASA’s Goddard Space Flight Center in collaboration with USDA Foreign Agricultural Services and USDA Hydrology and Remote Sensing Lab. This dataset was generated by integrating estimates from the Soil Moisture Ocean Salinity (SMOS) and Soil Moisture Active Passive (SMAP) missions into a modified two-layer Palmer model using a one-dimensional (1D) ensemble Kalman filter (EnKF) data assimilation approach [65]. The model accounts for the daily amount of water withdrawn by ET and replenished by P. Surface soil moisture (SM) and subsurface soil moisture (SSM) data are composed of 3-day composites with a spatial resolution of approximately 28 km (0.25°).

2.2.4. Evapotranspiration

ET was obtained from the global MOD16 dataset, which estimates ET from the Penman-Monteith equation parameterized with land surface and vegetation properties [66]. Daily meteorological reanalysis data and remotely sensed vegetation property dynamics from MODIS are used as inputs. The algorithm calculates ET considering the sum of daytime and nighttime components and separating the dry canopy surface from the wet [71]. The MOD16 ET dataset is available on an 8-day (MOD16A2) basis at a spatial resolution of 500 m.

2.2.5. Terrestrial Water Storage

TWS anomalies (TWSA) were analyzed with the Gravity Recovery and Climate Experiment—GRACE dataset, developed by NASA and the German Aerospace Center, which measures changes in the Earth’s gravitational field to detect regional changes in Earth’s water bodies [67]. Water storage is assessed in the form of TWSA. GRACE data are processed by different processing centers: CSR (University of Texas at the Center for Space Research), GFZ (GeoForschungsZentrum Potsdam), and JPL (NASA Jet Propulsion Laboratory). Here, the GRACE datasets from JPL were used, as also adopted in previous studies [72,73]. Monthly TWSA has a spatial resolution of approximately 111 km.

2.2.6. Vegetation Index

EVI and GPP estimates were used in this study to analyze the vegetation behavior during drought events. The global MOD13 product from MODIS [68] was used to obtain EVI data. These 16-day composites are acquired with a spatial resolution of 1 km (MOD13A2). The GPP dataset was available as an 8-day composite time-series derived from MODIS [69], at a spatial resolution of 500 m (MOD17A2H version 6).

2.2.7. Data Analysis

All datasets were assessed for the period of 2010–2020. The data were evaluated using the native spatial resolution on a monthly scale; thus, average values in each month were calculated for variables that had a temporal resolution of less than a month. Anomalies based on the z-score were also assessed. The z-score indicated how much a variable deviated from its mean (positive or negative anomaly), according to its standard deviation. It provided the monthly anomaly values for all years of the analyzed period, which enabled visualization of periods of more extreme drought events. This type of analysis has already been performed in other studies for the detection of droughts by remote sensing products [33,39,74,75]. The Z-score was calculated for each variable through Equation (1):
Z   = X ¯ m X m ¯ σ X ¯ m
where Z is the z-score; X is the analyzed variable; X ¯ m is the spatial mean value for each month m ; X m ¯ is the average of X ¯ m for the same month of the year over the 10-year period (2010 to 2020); and σ X ¯ m is the standard deviation of the total time series over the same month of the year. The fraction of the polygon area affected by monthly negative anomalous values (z-score below or equal to −1) was obtained in each region for a 3-month composite. This result showed the amplitude and spatial extent of the drought event, as demonstrated by Panisset et al. [76]. This metric from monthly negative anomalous values (z-score ≤ −1) was also used to indicate the most affected areas during the extreme drought event. This assessment considered the hydrological variables P, SM, SSM, ET, and TWSA.
We evaluated drought propagation by analyzing the time of drought recovery for each hydrological, climatic, and vegetation variable after onset of the drought (when TWSA became extremely negative). Finally, we identified the onset, duration, and maximum intensity for all case studies. For the onset of droughts, we used the threshold of z-score equal to “−1” as an indicator of moderate drought [33], considering consecutive anomalous values for monthly intervals. We assumed the onset of P (for a z-score ≤ −1) equal to zero, and the onsets of other variables were characterized relative to onset of P. TWSA were evaluated without gap-filling the data. Figure 2 summarizes the data analysis process.

3. Results

3.1. Spatio-Temporal Drought Patterns

The drought temporal patterns are presented in Table 2, indicating the percentage of the polygon area in each biome that was affected by monthly anomalous values of P, SM, SSM, ET, and TWSA. The results showed how the hydrological variables represented drought in each region, the time lag of the anomalies, in which period the anomalous situation started, and the length of time taken to return to a normal state. On the other hand, Figure 3 represents the drought spatial patterns focusing on the temporal effects of the phenomenon.
For the Amazon in 2015, the first negative anomalies (z-score ≤ −1) occurred in SON for P, SM, and SSM, considering that TWSA already showed a z-score ≤ −1 in a smaller percentage of the area (35%) in JJA 2015. P covered a major percentage of the area with anomalous values (≤−1) in SON 2015 (79%), while anomalous values of SM and SSM affected the greatest percentage of the area in DJF 2015 (44% and 60%, respectively). TWS continued with a z-score ≤ −1 until JJA 2016, reaching up to 88% of the area affected, and being the last variable to return to normal conditions. For this drought, no ET anomalies were observed in the MOD16 dataset. Thus, drought patterns in 2015–2016 were associated with a meteorological drought, later turning into agricultural and hydrological droughts. The 2010 event in the Amazon showed a different behavior in relation to that of 2015, with a larger area affected by anomalies in SM and SSM than by P anomalies in MAM 2010. SSM continued with negative anomalies in part of the area (32%) in JJA 2010. On the other hand, negative ET anomaly values were found in SON 2010, which were not observed in 2015. In this same period, however, there were negative TWSA anomaly values affecting a much smaller area than in 2015 (22%).
The Cerrado showed a more expressive effect of drought propagation (Figure 3), while the negative anomalies followed a pattern that started in DJF 2013–2014 by affecting P (26%), followed by effects in SM, SSM, and ET in the following months, and finally reaching the TWSA variable. The MAM 2014 data already showed a larger part of the area (88%) affected by TWSA anomalies, while the entire area was affected by negative TWSA anomaly values (z-score ≤ −1) in December 2014 to February 2015. Further, the Cerrado had a longer period (especially from 2014 to 2015) with part of the area affected by negative anomalies compared to the other regions of this study. The 2014–2015 drought in the Cerrado clearly represented a long-lasting hydrological drought episode, with a slow recovery time, and large impact in TWSA.
In the Pampa, the first sign of major P anomalies (z-score ≤ −1) were observed in SON 2011 (20% of the area), followed by anomalies in all other variables, especially from December 2011 to May 2012. It was noticed that TWSA continued to show anomalies in a large part of the area from June to November 2012 (73% in JJA and 78% in SON). The Pampa’s 2012 drought appeared as both a meteorological and agricultural drought, followed by a hydrological drought. The duration of this drought was shorter than the one in the Cerrado, approaching the duration of the Amazon droughts.

3.2. Drought Propagation Analysis

The negative anomalous values (z-score ≤ −1) in the drought events, plotted with 3-month moving averages (Figure 4), showed that the anomalies in TWSA lasted longer and had more accentuated values during the 2015 Amazon drought than during the 2010 event. For the vegetation and LST variables, taking out the GPP peak in 2016, the droughts show reduced anomaly values for EVI (reaching a z-score of −2.0 in August 2010 and −1.9 in December 2015) and GPP (approximately −1.9 in October 2010), and positive anomalies for LST in 2010 and 2015–2016. Considering anomalies in the hydrological variables, the 2010 drought reached more negative z-score values in April 2010 for P (−1.3), May 2010 for SM and SSM (about −2.1 for both variables), and October 2010 for TWSA (−1.8). Until October 2010, there remained very negative anomalous values for SM, SSM, and ET. For the 2015 drought, the most negative values were found for December 2015 for P, SM, and SSM (−2.0, −2.2, and −2.3, respectively) and in July 2016 for TWSA (−1.7).
Drought propagation in the Cerrado was clear for the 2014 event, as demonstrated by anomalous decreases in various hydrological variables. In January 2014, the z-score for P was −1.4, and the values for SM, SSM, ET, EVI, and LST in February 2014 were −1.8, −1.9, −2.0, −1.9, and +1,9, respectfully. The negative anomalies stood out for TWSA, with z-score values <−1 between May 2014 and August 2015. The long drought duration in the Cerrado (with recovery in 2016) also affected ET, EVI, and GPP. In the Pampa biome, the hydrological variables reached negative anomalous values in January 2012, with values of −1.6, −1.9 −1.8, −2.1, and −1.4 for P, SM, SSM, ET, and TWSA, respectively, reaching −1.9 for TWSA in August 2012. The hydrological variables point to a short-duration drought that lasted less than a year and occurred during the austral summer season. A great increase in positive LST anomaly values was observed in May 2012 (approximately 1.7). At the same time, the results indicated the fast evolution of EVI and GPP to negative anomaly values (in February 2012, the EVI anomaly reached a value of −2.2).
Table 3 summarizes the characteristics of the drought events according to onset, duration, and maximum intensity. This enabled the visualization of drought propagation characteristics on climatic and hydrological variables and vegetation indices, especially considering the duration and severity (maximum intensity). The difference between the 2010 and 2015 droughts in the Amazon became clearer, highlighting P, ET, and TWSA. The SM and SSM in 2015 showed more months with negative anomalies, although their severity was variable and did not always reach the threshold of −1. In addition, the duration of the Cerrado 2014 drought is noteworthy, especially for ET, TWSA, and GPP. In the Pampa biome, droughts usually occur in the summer (such as the 2012 drought), when there are naturally higher temperatures. The event started with a reduction in P and all other variables already registered negative anomalies in the following month, with the effect of propagation being more present when the duration of these anomalies was evaluated (see SM, SSM, and TWSA).

4. Discussion

Regarding the Amazon biome, different drought events present distinct effects on intensity and duration. Our results indicated that the 2015 event affected a larger area and had higher intensity than the 2010 drought, as also indicated by Anderson et al. [77]. Hu et al. [78] showed that the 2010 drought was well characterized by TWSA in northern Brazil; however, P did not present significant changes, which could possibly imply that the drought affected mainly surface water and soil moisture. The Cerrado biome presented a long period with areas affected by negative anomalies. Van Loon [20] described that extreme drought scenarios with a lack of available SM and wilting point can limit ET, which further limits soil moisture depletion but can also limit locally generated P, thereby exacerbating drought conditions. This may have occurred in the Cerrado, considering the event duration.
For the Pampa, our results agreed with those of Lopes Ribeiro et al. [11], who found that soil moisture declined until its lowest point in the beginning of 2012. Moreover, Cunha et al. [43] indicated the highest intensity of drought in August 2012, and our study showed SON-2012 with the highest percentage of area affected by TWSA (78%). In 2013, the biome succeeded in overcoming the drought effects, showing a great capacity to recover soil moisture after periods of drought [11]. ET and EVI variables reached anomalous values of z-score <−2 between January and February 2012. Drought is usually associated with the summer season in this biome, with great influence from ET due to the greater energy availability for this process as net radiation also increases in this period, which is typically used for growth of crops and harvesting. Hence, agriculture in this region suffers from drought events, as it is a climate-sensitive sector [6].
Regarding drought propagation, a pattern of the drought advancing from anomalies in P to those in SM, SSM, ET, EVI, and GPP was observed, reaching TWSA last. Evaluating the studied variables, our results indicated high negative anomalous values for SM and SSM in all analyzed droughts, while LST presented positive anomalies for all events as well. Furthermore, TWSA were able to represent the hydrological drought duration patterns from the point where TWSA had very negative values until average values were reached again. Farahmand et al. [33] also showed the relevance of TWSA deficit analysis on the evaluation of drought impacts for four major US drought events. According to Van Loon [20], a groundwater drought does not always occur, but when it does, it often shows long periods of low groundwater levels.
The onset and duration of the droughts showed different behaviors for the analyzed variables, especially considering the duration of TWSA negative anomalies during the Cerrado 2014 drought (over 15 months). The Amazon and Pampa experienced short-duration drought events (less than a year) compared to the 2-year drought event that occurred in the Cerrado from 2014–2016. Geirinhas et al. [45] found that during this drought episode in the Cerrado, there was an association between drought and heatwave (dry and hot extreme condition), as a result of hot periods coupled with long-term P deficits that induced dry surface conditions. This agreed with our results considering a drought propagation perspective. In this sense, the Cerrado’s drought exhibited a longer duration compared with the other study areas, which may have occurred due to a combination of conditions (dry and hot) that amplify the impact of extreme events.
The Amazon and Pampa biomes presented a propagation cascade (as defined by Van Loon et al. [79]) from meteorological to agricultural (soil moisture deficit) to hydrological droughts (TWSA), while the Cerrado was more affected by a hydrological drought. Zhou et al. [80] also identified a strong response relationship between meteorological and hydrological droughts for a study river basin in China. The intensity of the meteorological drought was significantly amplified in the hydrological drought, which agreed with the results found by Yang et al. [81] in which drought effects were assessed in 130 catchments in southeastern Australia. In addition, hydrological drought recovery is slower than meteorological drought recovery [82].
Regarding the effects of drought on vegetation, the three biomes presented different vegetation types, which directly influenced the recovery time. This was evaluated mainly by the duration of the drought on EVI and GPP due to a large influence of P and ET. According to Anderson et al. [7], the concomitant development of negative P, ET, and vegetation index anomalies over timescales of several weeks provides valuable evidence of possible yield impacts. The Cerrado 2014 drought produced a large effect on ET and GPP with a long duration of negative anomalies (11 and 10 months, respectively), which was not observed for EVI. For the Pampa 2012 drought, anomalies in ET, EVI, and GPP had a considerable duration considering that the event lasted less than a year. On the other hand, we found that the two drought events in the Amazon presented different behaviors regarding the effects on vegetation. The 2010 drought showed considerable duration in ET and EVI anomalies, but GPP (9 months) was the main variable with the longest recovery time for this event, while the 2015 drought had less effect on vegetation overall. Analyses of drought effects on vegetation are relevant considering that droughts are ecologically disruptive due to water scarcity, soil degradation, and occurrence of fires, which additionally cause economic losses in agriculture [41].
As a limitation, the study used only 10 years of data for the anomaly analysis, which was limited by SM and SSM product availability. Regarding the classification of ‘hydrological drought’, this study focused on TWSA, which refers to all water storage and does not focus on groundwater. This was due to the occurrence of substantial uncertainty in soil moisture data from remote sensing [83], leading to higher uncertainties in estimates of groundwater from TWSA. In addition, some limitations are associated with the analysis of variables with different spatial resolutions. For example, the GRACE data only had a spatial resolution of approximately 111 km (1° × 1° grid), although the data demonstrated a satisfactory correlation with drought propagation and duration. Therefore, future studies should focus on addressing additional case studies, and as satellite data availability improves for global domains, it may be possible to achieve data with better spatial and temporal resolution.

5. Conclusions

The response and recovery time of several hydrological variables were assessed for multiple drought events and biomes across Brazil. The duration and propagation of extreme droughts are important aspects for the comprehension of such disasters. In the Amazon and Pampa biomes, drought persisted for only a few months and clearly showed a drought propagation pattern from meteorological to agricultural to hydrological droughts. In contrast, as result of atmospheric blockage affecting the region in 2014, the drought in the Cerrado biome was quite intense and the episode was repeated in 2015 (with less intensity). This event lasted approximately two years and presented characteristics of a hydrological drought. Considering the analyzed variables, SM and SSM stood out for exhibiting high negative anomalies and LST showed high positive anomalies for all of the drought events. Further, TWSA obtained from the GRACE mission satisfactorily represented the drought duration.
This study was able to improve and promote the comprehension of the characteristic patterns of extreme drought events for different biomes in Brazil using a comparative hydrological approach. By understanding the potential duration and intensity of extreme droughts, we expect this study be useful in helping to identify the impacts of drought events on the environment and people in different regions of Brazil and worldwide. The use of remote sensing data for drought analysis is relatively recent, and satellite datasets are fundamental tools for analyzing extreme events due to the large amount of hydrological, climatic, and vegetation variables that are available and the possibility of large-scale analyses.

Author Contributions

Conceptualization, J.B.R., A.R. and A.S.F.; methodology, J.B.R., A.R. and A.S.F.; software, L.L. and J.B.R.; discussions, J.B.R., A.R., A.S.F. and L.L.; writing—original draft preparation, J.B.R.; writing—review and editing, A.R., A.S.F. and L.L.; supervision, A.R. and A.S.F.; project administration, A.R.; funding acquisition, A.R. All authors have read and agreed to the published version of the manuscript.

Funding

This research was financially supported by the Brazilian Water Agency (ANA) and by the Brazilian Ministry of Education through the Coordination for the Improvement of Higher Education Personnel (CAPES), under grant number 88887.144979/2017-00. We are also grateful to the Brazilian Ministry of Science and Technology through the National Council for Scientific and Technological Development (CNPq) for financial support.

Data Availability Statement

Not applicable.

Acknowledgments

The authors would like to thank the Federal University of Rio Grande do Sul (UFRGS) and the Brazilian Water and Sanitation Agency (ANA) for institutional support.

Conflicts of Interest

The authors declare no conflict of interest.

References

  1. Hartmann, D.L.; Tank, A.M.G.K.; Rusticucci, M.; Alexander, L.; Brönnimann, S.; Charabi, Y.; Dentener, F.; Dlugokencky, E.; Easterling, D.; Kaplan, A.; et al. Observations: Atmosphere and Surface Supplementary Material. In Climate Change 2013 – The Physical Science Basis: Working Group I Contribution to the Fifth Assessment Report of the Intergovernmental Panel on Climate Change; Intergovernmental Panel on Climate Change: Geneva, Switzerland, 2013; pp. 159–254. [Google Scholar]
  2. Johnson, G.C.; Lyman, J.M. Warming Trends Increasingly Dominate Global Ocean. Nat. Clim. Chang. 2020, 10, 757–761. [Google Scholar] [CrossRef]
  3. Paul, V. Global Temperatures in 2020 Tied Record Highs. Science 2021, 371, 334–335. [Google Scholar] [CrossRef]
  4. Seneviratne, S.I.; Nicholls, N.; Easterling, D.; Goodess, C.M.; Kanae, S.; Kossin, J.; Luo, Y.; Marengo, J.; Mc Innes, K.; Rahimi, M.; et al. Changes in Climate Extremes and Their Impacts on the Natural Physical Environment. In Managing the Risks of Extreme Events and Disasters to Advance Climate Change Adaptation. A Special Report of Working Groups I and II of the Intergovernmental Panel on Climate Change (IPCC); Cambridge University Press: Cambridge, UK, 2012; pp. 109–230. [Google Scholar] [CrossRef] [Green Version]
  5. Perkins-Kirkpatrick, S.E.; Lewis, S.C. Increasing Trends in Regional Heatwaves. Nat. Commun. 2020, 11, 3357. [Google Scholar] [CrossRef] [PubMed]
  6. Getirana, A. Extreme Water Deficit in Brazil Detected from Space. J. Hydrometeorol. 2016, 17, 591–599. [Google Scholar] [CrossRef]
  7. Anderson, M.C.; Zolin, C.A.; Sentelhas, P.C.; Hain, C.R.; Semmens, K.; Tugrul Yilmaz, M.; Gao, F.; Otkin, J.A.; Tetrault, R. The Evaporative Stress Index as an Indicator of Agricultural Drought in Brazil: An Assessment Based on Crop Yield Impacts. Remote Sens. Environ. 2016, 174, 82–99. [Google Scholar] [CrossRef]
  8. Field, C.B.; Barros, V.; Stocker, T.F.; Dahe, Q.; Jon Dokken, D.; Ebi, K.L.; Mastrandrea, M.D.; Mach, K.J.; Plattner, G.K.; Allen, S.K.; et al. Managing the Risks of Extreme Events and Disasters to Advance Climate Change Adaptation: Special Report of the Intergovernmental Panel on Climate Change; Cambridge University Press: Cambridge, UK, 2012; pp. 1–582. [Google Scholar] [CrossRef]
  9. Langenbrunner, B. Water, Water Not Everywhere. Nat. Clim. Chang. 2021, 11, 650. [Google Scholar] [CrossRef]
  10. Rao, V.B.; Franchito, S.H.; Rosa, M.B.; Govardhan, D.; Figueroa, S.N.; Bhargavi, V.S.L. In a Changing Climate Hadley Cell Induces a Record Flood in Amazon and Another Recorded Drought across South Brazil in 2021. Nat. Hazards 2022, 114, 1549–1561. [Google Scholar] [CrossRef]
  11. Lopes Ribeiro, F.; Guevara, M.; Vázquez-Lule, A.; Cunha, A.P.; Zeri, M.; Vargas, R. The Impact of Drought on Soil Moisture Trends across Brazilian Biomes. Nat. Hazards Earth Syst. Sci. 2021, 21, 879–892. [Google Scholar] [CrossRef]
  12. Grimm, A.M.; Almeida, A.S.; Beneti, C.A.A.; Leite, E.A. The Combined Effect of Climate Oscillations in Producing Extremes: The 2020 Drought in Southern Brazil. RBRH 2020, 25, e.48. [Google Scholar] [CrossRef]
  13. Langenbrunner, B.; Pritchard, M.S.; Kooperman, G.J.; Randerson, J.T. Why Does Amazon Precipitation Decrease When Tropical Forests Respond to Increasing CO2? Earth’s Future 2019, 7, 450–468. [Google Scholar] [CrossRef] [Green Version]
  14. Marengo, J.A.; Espinoza, J.C. Extreme Seasonal Droughts and Floods in Amazonia: Causes, Trends and Impacts. Int. J. Climatol. 2016, 36, 1033–1050. [Google Scholar] [CrossRef]
  15. Wilhite, D.A.; Glantz, M.H. Understanding: The Drought Phenomenon: The Role of Definitions. Water Int. 1985, 10, 111–120. [Google Scholar] [CrossRef] [Green Version]
  16. Wilhite, D.A. Drought as a Natural Hazard: Concepts and Definitions. Drought A Glob. Assess. 2000, I, 3–18. [Google Scholar]
  17. Wilhite, D.A.; Sivakumar, M.V.K.; Pulwarty, R. Managing Drought Risk in a Changing Climate: The Role of National Drought Policy. Weather Clim. Extrem. 2014, 3, 4–13. [Google Scholar] [CrossRef] [Green Version]
  18. United Nations Office for Disaster Risk Reduction. GAR Special Report on Drought 2021; United Nations Office for Disaster Risk Reduction: Geneva, Switzerland, 2021. [Google Scholar]
  19. McColl, K.A.; Roderick, M.L.; Berg, A.; Scheff, J. The Terrestrial Water Cycle in a Warming World. Nat. Clim. Chang. 2022, 12, 604–606. [Google Scholar] [CrossRef]
  20. Van Loon, A.F. Hydrological Drought Explained. WIREs Water 2015, 2, 359–392. [Google Scholar] [CrossRef]
  21. Brunner, M.I.; Slater, L.; Tallaksen, L.M.; Clark, M. Challenges in Modeling and Predicting Floods and Droughts: A Review. WIREs Water 2021, 8, e1520. [Google Scholar] [CrossRef]
  22. Zhang, X.; Hao, Z.; Singh, V.P.; Zhang, Y.; Feng, S.; Xu, Y.; Hao, F. Drought Propagation under Global Warming: Characteristics, Approaches, Processes, and Controlling Factors. Sci. Total Environ. 2022, 838, 156021. [Google Scholar] [CrossRef]
  23. Bevacqua, A.G.; Chaffe, P.L.B.; Chagas, V.B.P.; AghaKouchak, A. Spatial and Temporal Patterns of Propagation from Meteorological to Hydrological Droughts in Brazil. J. Hydrol. 2021, 603, 126902. [Google Scholar] [CrossRef]
  24. Apurv, T.; Sivapalan, M.; Cai, X. Understanding the Role of Climate Characteristics in Drought Propagation. Water Resour. Res. 2017, 53, 9304–9329. [Google Scholar] [CrossRef] [Green Version]
  25. Shi, H.; Zhou, Z.; Liu, L.; Liu, S. A Global Perspective on Propagation from Meteorological Drought to Hydrological Drought during 1902–2014. Atmos. Res. 2022, 280, 106441. [Google Scholar] [CrossRef]
  26. Jehanzaib, M.; Sattar, M.N.; Lee, J.-H.; Kim, T.-W. Investigating Effect of Climate Change on Drought Propagation from Meteorological to Hydrological Drought Using Multi-Model Ensemble Projections. Stoch. Environ. Res. Risk Assess. 2020, 34, 7–21. [Google Scholar] [CrossRef]
  27. Melo, D.D.C.D.; Scanlon, B.R.; Zhang, Z.; Wendland, E.; Yin, L. Reservoir Storage and Hydrologic Responses to Droughts in the Paraná River Basin, South-Eastern Brazil. Hydrol. Earth Syst. Sci. 2016, 20, 4673–4688. [Google Scholar] [CrossRef] [Green Version]
  28. Gao, H.; Tang, Q.; Ferguson, C.R.; Wood, E.F.; Lettenmaier, D.P. Estimating the Water Budget of Major US River Basins via Remote Sensing. Int. J. Remote Sens. 2010, 31, 3955–3978. [Google Scholar] [CrossRef]
  29. Moreira, A.A.; Ruhoff, A.L.; Roberti, D.R.; Souza, V.d.A.; da Rocha, H.R.; de Paiva, R.C.D. Assessment of Terrestrial Water Balance Using Remote Sensing Data in South America. J. Hydrol. 2019, 575, 131–147. [Google Scholar] [CrossRef]
  30. Menne, M.J.; Durre, I.; Vose, R.S.; Gleason, B.E.; Houston, T.G. An Overview of the Global Historical Climatology Network-Daily Database. J. Atmos. Ocean. Technol. 2012, 29, 897–910. [Google Scholar] [CrossRef]
  31. Fick, S.E.; Hijmans, R.J. WorldClim 2: New 1-Km Spatial Resolution Climate Surfaces for Global Land Areas. Int. J. Climatol. 2017, 37, 4302–4315. [Google Scholar] [CrossRef]
  32. West, H.; Quinn, N.; Horswell, M. Remote Sensing for Drought Monitoring & Impact Assessment: Progress, Past Challenges and Future Opportunities. Remote Sens. Environ. 2019, 232, 111291. [Google Scholar] [CrossRef]
  33. Farahmand, A.; Reager, J.T.; Madani, N. Drought Cascade in the Terrestrial Water Cycle: Evidence From Remote Sensing. Geophys. Res. Lett. 2021, 48, e2021GL093482. [Google Scholar] [CrossRef]
  34. Janssen, T.; van der Velde, Y.; Hofhansl, F.; Luyssaert, S.; Naudts, K.; Driessen, B.; Fleischer, K.; Dolman, H. Drought Effects on Leaf Fall, Leaf Flushing and Stem Growth in the Amazon Forest: Reconciling Remote Sensing Data and Field Observations. Biogeosciences 2021, 18, 4445–4472. [Google Scholar] [CrossRef]
  35. Aragão, L.E.O.C.; Anderson, L.O.; Fonseca, M.G.; Rosan, T.M.; Vedovato, L.B.; Wagner, F.H.; Silva, C.V.J.; Silva Junior, C.H.L.; Arai, E.; Aguiar, A.P.; et al. 21st Century Drought-Related Fires Counteract the Decline of Amazon Deforestation Carbon Emissions. Nat. Commun. 2018, 9, 536. [Google Scholar] [CrossRef] [Green Version]
  36. Mariano, D.A.; dos Santos, C.A.C.; Wardlow, B.D.; Anderson, M.C.; Schiltmeyer, A.V.; Tadesse, T.; Svoboda, M.D. Use of Remote Sensing Indicators to Assess Effects of Drought and Human-Induced Land Degradation on Ecosystem Health in Northeastern Brazil. Remote Sens. Environ. 2018, 213, 129–143. [Google Scholar] [CrossRef]
  37. Nogueira, J.M.P.; Rambal, S.; Barbosa, J.P.R.A.D.; Mouillot, F. Spatial Pattern of the Seasonal Drought/Burned Area Relationship across Brazilian Biomes: Sensitivity to Drought Metrics and Global Remote-Sensing Fire Products. Climate 2017, 5, 42. [Google Scholar] [CrossRef] [Green Version]
  38. Oliveira, P.T.S.; Nearing, M.A.; Moran, M.S.; Goodrich, D.C.; Wendland, E.; Gupta, H. V Trends in Water Balance Components across the Brazilian Cerrado. Water Resour. Res. 2014, 50, 7100–7114. [Google Scholar] [CrossRef] [Green Version]
  39. Anderson, L.O.; Malhi, Y.; Aragão, L.E.O.C.; Ladle, R.; Arai, E.; Barbier, N.; Phillips, O. Remote Sensing Detection of Droughts in Amazonian Forest Canopies. New Phytol. 2010, 187, 733–750. [Google Scholar] [CrossRef]
  40. de Oliveira, M.L.; dos Santos, C.A.C.; de Oliveira, G.; Silva, M.T.; da Silva, B.B.; Cunha, J.E.d.B.L.; Ruhoff, A.; Santos, C.A.G. Remote Sensing-Based Assessment of Land Degradation and Drought Impacts over Terrestrial Ecosystems in Northeastern Brazil. Sci. Total Environ. 2022, 835, 155490. [Google Scholar] [CrossRef]
  41. Tomasella, J.; Cunha, A.P.M.A.; Simões, P.A.; Zeri, M. Assessment of Trends, Variability and Impacts of Droughts across Brazil over the Period 1980–2019. Nat. Hazards 2022, 1–18. [Google Scholar] [CrossRef]
  42. Caballero, C.B.; Ruhoff, A.; Biggs, T. Land Use and Land Cover Changes and Their Impacts on Surface-Atmosphere Interactions in Brazil: A Systematic Review. Sci. Total Environ. 2022, 808, 152134. [Google Scholar] [CrossRef]
  43. Cunha, A.P.M.A.; Zeri, M.; Deusdará Leal, K.; Costa, L.; Cuartas, L.A.; Marengo, J.A.; Tomasella, J.; Vieira, R.M.; Barbosa, A.A.; Cunningham, C.; et al. Extreme Drought Events over Brazil from 2011 to 2019. Atmosphere 2019, 10, 642. [Google Scholar] [CrossRef]
  44. Awange, J.L.; Mpelasoka, F.; Goncalves, R.M. When Every Drop Counts: Analysis of Droughts in Brazil for the 1901-2013 Period. Sci. Total Environ. 2016, 566–567, 1472–1488. [Google Scholar] [CrossRef] [Green Version]
  45. Geirinhas, J.L.; Russo, A.; Libonati, R.; Sousa, P.M.; Miralles, D.G.; Trigo, R.M. Recent Increasing Frequency of Compound Summer Drought and Heatwaves in Southeast Brazil. Environ. Res. Lett. 2021, 16, 34036. [Google Scholar] [CrossRef]
  46. Libonati, R.; Geirinhas, J.L.; Silva, P.S.; Russo, A.; Rodrigues, J.A.; Belém, L.B.C.; Nogueira, J.; Roque, F.O.; DaCamara, C.C.; Nunes, A.M.B.; et al. Assessing the Role of Compound Drought and Heatwave Events on Unprecedented 2020 Wildfires in the Pantanal. Environ. Res. Lett. 2022, 17, 015005. [Google Scholar] [CrossRef]
  47. Marengo, J.A.; Liebmann, B.; Kousky, V.E.; Filizola, N.P.; Wainer, I.C. Onset and End of the Rainy Season in the Brazilian Amazon Basin. J. Clim. 2001, 14, 833–852. [Google Scholar] [CrossRef]
  48. Nobre, C.A.; Sellers, P.J.; Shukla, J. Amazonian Deforestation and Regional Climate Change. J. Clim. 1991, 4, 957–988. [Google Scholar] [CrossRef]
  49. Nobre, C.A.; Gilvan, S.; Borma, L.S.; Carlos, C.-R.J.; Silva, J.S.; Manoel, C. Land-Use and Climate Change Risks in the Amazon and the Need of a Novel Sustainable Development Paradigm. Proc. Natl. Acad. Sci. USA 2016, 113, 10759–10768. [Google Scholar] [CrossRef] [PubMed] [Green Version]
  50. Marengo, J.A.; Tomasella, J.; Alves, L.M.; Soares, W.R.; Rodriguez, D.A. The Drought of 2010 in the Context of Historical Droughts in the Amazon Region. Geophys. Res. Lett. 2011, 38, L12703. [Google Scholar] [CrossRef] [Green Version]
  51. Jimenez, J.C.; Libonati, R.; Peres, L.F. Droughts Over Amazonia in 2005, 2010, and 2015: A Cloud Cover Perspective. Front. Earth Sci. 2018, 6, 227. [Google Scholar] [CrossRef] [Green Version]
  52. Marengo, J.A.; Souza, C.M.; Thonicke, K.; Burton, C.; Halladay, K.; Betts, R.A.; Alves, L.M.; Soares, W.R. Changes in Climate and Land Use Over the Amazon Region: Current and Future Variability and Trends. Front. Earth Sci. 2018, 6, 228. [Google Scholar] [CrossRef]
  53. Jiménez-Muñoz, J.C.; Mattar, C.; Barichivich, J.; Santamaría-Artigas, A.; Takahashi, K.; Malhi, Y.; Sobrino, J.A.; van der Schrier, G. Record-Breaking Warming and Extreme Drought in the Amazon Rainforest during the Course of El Niño 2015–2016. Sci. Rep. 2016, 6, 33130. [Google Scholar] [CrossRef]
  54. Lewis, S.L.; Brando, P.M.; Phillips, O.L.; van der Heijden, G.M.F.; Nepstad, D. The 2010 Amazon Drought. Science 2011, 331, 554. [Google Scholar] [CrossRef]
  55. Alves, D.B.; Pérez-Cabello, F. Multiple Remote Sensing Data Sources to Assess Spatio-Temporal Patterns of Fire Incidence over Campos Amazônicos Savanna Vegetation Enclave (Brazilian Amazon). Sci. Total Environ. 2017, 601–602, 142–158. [Google Scholar] [CrossRef] [PubMed]
  56. Beuchle, R.; Grecchi, R.C.; Shimabukuro, Y.E.; Seliger, R.; Eva, H.D.; Sano, E.; Achard, F. Land Cover Changes in the Brazilian Cerrado and Caatinga Biomes from 1990 to 2010 Based on a Systematic Remote Sensing Sampling Approach. Appl. Geogr. 2015, 58, 116–127. [Google Scholar] [CrossRef]
  57. Nobre, C.A.; Marengo, J.A.; Seluchi, M.E.; Cuartas, L.A.; Alves, L.M. Some Characteristics and Impacts of the Drought and Water Crisis in Southeastern Brazil during 2014 and 2015. J. Water Resour. Prot. 2016, 8, 252–262. [Google Scholar] [CrossRef] [Green Version]
  58. Marengo, J.A.; Nobre, C.A.; Seluchi, M.E.; Cuartas, A.; Alves, L.M.; Mendiondo, E.M.; Obregón, G.; Sampaio, G. A Seca e a Crise Hídrica de 2014-2015 Em São Paulo. Rev. USP 2015, 106, 31–44. [Google Scholar] [CrossRef] [Green Version]
  59. Roesch, L.F.W.; Vieira, F.C.; Pereira, V.A.; Schünemann, A.L.; Teixeira, I.F.; Senna, A.J.T.; Stefenon, V.M. The Brazilian Pampa: A Fragile Biome. Diversity 2009, 1, 182–198. [Google Scholar] [CrossRef] [Green Version]
  60. Da Mota, F.S.; Agendes, M.O.D.O.; Rosskoff, J.L.D.C.; Da Silva, J.B.; Signorini, E.; Alves, E.G.P.; Araujo, S.M.B. Risco de Secas Para a Cultura Da Soja No Rio Grande Do Sul. Pesq. agropec. bras. 1992, 27, 709–720. [Google Scholar]
  61. MapBiomas Collection 6 of Brazilian Land Cover & Use Map Series. Available online: https://mapbiomas.org/ (accessed on 25 June 2022).
  62. Gorelick, N.; Hancher, M.; Dixon, M.; Ilyushchenko, S.; Thau, D.; Moore, R. Google Earth Engine: Planetary-Scale Geospatial Analysis for Everyone. Remote Sens. Environ. 2017, 202, 18–27. [Google Scholar] [CrossRef]
  63. Wan, Z.; Hook, S.; Hulley, G. MOD11A2 MODIS/Terra Land Surface Temperature/Emissivity 8-Day L3 Global 1km SIN Grid; NASA: Washington, DC, USA, 2015. [CrossRef]
  64. Huffman, G.J.; Stocker, E.F.; Bolvin, D.T.; Nelkin, E.J.; Tan, J. GPM IMERG Final Precipitation L3 1 Month 0.1 Degree x 0.1 Degree V06; Goddard Earth Sciences Data and Information Services Center: Greenbelt, MD, USA, 2019. [Google Scholar]
  65. Sazib, N.; Mladenova, I.; Bolten, J. Leveraging the Google Earth Engine for Drought Assessment Using Global Soil Moisture Data. Remote. Sens. 2018, 10, 1265. [Google Scholar] [CrossRef] [Green Version]
  66. Running, S.; Mu, Q.; Zhao, M. MOD16A2 MODIS/Terra Net Evapotranspiration 8-Day L4 Global 500m SIN Grid; V006; NASA: Washington, DC, USA, 2017.
  67. Swenson, S.C. GRACE MONTHLY LAND WATER MASS GRIDS NETCDF RELEASE 5.0; DAAC: Pasadena, CA, USA, 2012. [Google Scholar]
  68. Didan, K. MOD13A2 MODIS/Terra Vegetation Indices 16-Day L3 Global 1km SIN Grid V006; NASA: Washington, DC, USA, 2015. [CrossRef]
  69. Running, S.; Mu, Q.; Zhao, M. MOD17A2H MODIS/Terra Gross Primary Productivity 8-Day L4 Global 500m SIN Grid; V006; NASA: Washington, DC, USA, 2015.
  70. Running, S.W.; Justice, C.O.; Salomonson, V.; Hall, D.; Barker, J.; Kaufmann, Y.J.; Strahler, A.H.; Huete, A.R.; Muller, J.-P.; Vanderbilt, V.; et al. Terrestrial Remote Sensing Science and Algorithms Planned for EOS/MODIS. Int. J. Remote Sens. 1994, 15, 3587–3620. [Google Scholar] [CrossRef]
  71. Mu, Q.; Zhao, M.; Running, S.W. Improvements to a MODIS Global Terrestrial Evapotranspiration Algorithm. Remote Sens. Environ. 2011, 115, 1781–1800. [Google Scholar] [CrossRef]
  72. Behrangi, A.; Gardner, A.S.; Reager, J.T.; Fisher, J.B. Using GRACE to Constrain Precipitation Amount over Cold Mountainous Basins. Geophys. Res. Lett. 2017, 44, 219–227. [Google Scholar] [CrossRef]
  73. Melati, M.D.; Fleischmann, A.S.; Fan, F.M.; Paiva, R.C.D.; Athayde, G.B. Estimates of Groundwater Depletion under Extreme Drought in the Brazilian Semi-Arid Region Using GRACE Satellite Data: Application for a Small-Scale Aquifer. Hydrogeol. J. 2019, 27, 2789–2802. [Google Scholar] [CrossRef]
  74. Jain, V.K.; Pandey, R.P.; Jain, M.K.; Byun, H.-R. Comparison of Drought Indices for Appraisal of Drought Characteristics in the Ken River Basin. Weather Clim. Extrem. 2015, 8, 1–11. [Google Scholar] [CrossRef] [Green Version]
  75. Zhao, M.; A, G.; Velicogna, I.; Kimball, J.S. A Global Gridded Dataset of GRACE Drought Severity Index for 2002–14: Comparison with PDSI and SPEI and a Case Study of the Australia Millennium Drought. J. Hydrometeorol. 2017, 18, 2117–2129. [Google Scholar] [CrossRef] [Green Version]
  76. Panisset, J.S.; Libonati, R.; Gouveia, C.M.P.; Machado-Silva, F.; França, D.A.; França, J.R.A.; Peres, L.F. Contrasting Patterns of the Extreme Drought Episodes of 2005, 2010 and 2015 in the Amazon Basin. Int. J. Climatol. 2017, 38, 1096–1104. [Google Scholar] [CrossRef]
  77. Anderson, L.O.; Ribeiro Neto, G.; Cunha, A.P.; Fonseca, M.G.; Mendes de Moura, Y.; Dalagnol, R.; Wagner, F.H.; de Aragão, L.E.O.e.C. Vulnerability of Amazonian Forests to Repeated Droughts. Philos. Trans. R. Soc. B Biol. Sci. 2018, 373, 20170411. [Google Scholar] [CrossRef] [PubMed]
  78. Hu, K.; Awange, J.L.; Khandu; Forootan, E.; Goncalves, R.M.; Fleming, K. Hydrogeological Characterisation of Groundwater over Brazil Using Remotely Sensed and Model Products. Sci. Total Environ. 2017, 599–600, 372–386. [Google Scholar] [CrossRef] [Green Version]
  79. Van Loon, A.F.; Gleeson, T.; Clark, J.; Van Dijk, A.I.J.M.; Stahl, K.; Hannaford, J.; Di Baldassarre, G.; Teuling, A.J.; Tallaksen, L.M.; Uijlenhoet, R.; et al. Drought in the Anthropocene. Nat. Geosci. 2016, 9, 89–91. [Google Scholar] [CrossRef]
  80. Zhou, Z.; Shi, H.; Fu, Q.; Ding, Y.; Li, T.; Wang, Y.; Liu, S. Characteristics of Propagation From Meteorological Drought to Hydrological Drought in the Pearl River Basin. J. Geophys. Res. Atmos. 2021, 126, e2020JD033959. [Google Scholar] [CrossRef]
  81. Yang, Y.; McVicar, T.R.; Donohue, R.J.; Zhang, Y.; Roderick, M.L.; Chiew, F.H.S.; Zhang, L.; Zhang, J. Lags in Hydrologic Recovery Following an Extreme Drought: Assessing the Roles of Climate and Catchment Characteristics. Water Resour. Res. 2017, 53, 4821–4837. [Google Scholar] [CrossRef]
  82. Wu, J.; Yao, H.; Chen, X.; Wang, G.; Bai, X.; Zhang, D. A Framework for Assessing Compound Drought Events from a Drought Propagation Perspective. J. Hydrol. 2022, 604, 127228. [Google Scholar] [CrossRef]
  83. Barbedo, R.; Fleischmann, A.S.; Siqueira, V.; Brêda, J.P.; Matte, G.; Laipelt, L.; Amorim, A.; Araújo, A.A.; Fuckner, M.; Meller, A.; et al. Water Storage Variability across Brazil. RBRH 2022, 27, e.32. [Google Scholar] [CrossRef]
Figure 2. Methodological flowchart applied in this study.
Remotesensing 15 00454 g002
Figure 3. Area affected by monthly anomalous values from −2 to 2 for precipitation (P), surface soil moisture (SM), subsurface soil moisture (SSM), evapotranspiration (ET), and terrestrial water storage anomalies (TWSA), for the Amazon, Cerrado and Pampa.
Remotesensing 15 00454 g003
Figure 4. Temporal drought patterns (2010 to 2020) for analyzed variables in the three Brazilian study areas: (a) the Amazon, (b) Cerrado and (c) Pampa; being (a1), (b1), and (c1) for P, SM, SSM, ET, and TWSA; (a2), (b2), (c2) for EVI and GPP; and (a3), (b3), and (c3) for LST. The hatched area represents z-score ≤ −0.5 verified in dry periods with long effect in the analyzed variables (approximately 2010 and 2015 for the Amazon, 2014 for the Cerrado, and 2012 for the Pampa).
Remotesensing 15 00454 g004
Table 1. Synthesis of remote sensing datasets.
VariableDataSpatial
Resolution
Temporal
Resolution
Data
Availability
Main
Reference
Land surface temperature (LST)MOD111 km8 days2003–2016[63]
Precipitation (P)IMERG~11 kmMonthly2003–2016[64]
Surface soil moisture (SM)SMOS-SMAP~28 km3 days2010–2020[65]
Subsurface soil moisture (SSM)
Evapotranspiration (ET)MOD160.5 km8 days2003–2016[66]
Terrestrial Water Storage Anomalies (TWSA)GRACE~111 kmMonthly2003–2016[67]
EVIMOD131 km16 days2003–2016[68]
GPPMOD170.5 km8 days2003–2016[69]
Table 2. Percentage (%) of the polygon area affected by monthly negative anomalous values (z-score ≤ −1) for precipitation (P), surface soil moisture (SM), subsurface soil moisture (SSM), evapotranspiration (ET), and terrestrial water storage anomalies (TWSA), for the Amazon, Cerrado, and Pampa.
LocationDataPSMSMMETTWSA
Amazon2010MAM24%39%65%0%0%
JJA0%5%32%2%0%
SON1%2%11%29%22%
2010–2011DJF0%0%0%13%0%
2015JJA0%0%0%0%35%
SON79%22%22%0%66%
2015–2016DJF52%44%60%1%88%
2016MAM22%1%4%0%69%
JJA0%0%0%1%88%
SON0%0%0%0%0%
Cerrado2013SON0%0%1%0%0%
2013–2014DJF26%21%27%6%0%
2014MAM0%28%40%10%88%
JJA0%3%7%29%88%
SON0%0%1%22%90%
2014–2015DJF0%1%2%2%100%
2015MAM0%0%1%1%62%
JJA0%2%2%0%62%
SON0%0%0%0%53%
2015–2016DJF0%0%0%0%2%
Pampa2011JJA0%0%0%1%0%
SON20%1%7%1%3%
2011–2012DJF11%62%76%51%56%
2012MAM78%62%47%4%25%
JJA3%20%28%0%73%
SON2%0%0%11%78%
2012–2013DJF0%0%0%0%0%
Table 3. Characteristics of drought events according to onset, duration, and maximum intensity for the 2010 and 2015 droughts in the Amazon, 2014 drought in the Cerrado, and 2012 drought in the Pampa biome. The onset was characterized relative to the precipitation onset.
LSTPSMSSMETTWSAEVIGPP
Amazon 2010 drought
Onset (month)−10114534
Duration (month)34774549
Maximum
intensity (z-score)
+1.5−1.3−2.1−2.1−1.8−1.8−2.0−1.9
Amazon 2015 drought
Onset (month)001154912
Duration (month)105441732
Maximum
intensity (z-score)
+1.8−2.0−2.2−2.3−0.9−1.7−1.8−1.9
Cerrado 2014 drought
Onset (month)00001213
Duration (month)33671115210
Maximum
intensity (z-score)
+1.9−1.4−1.8−1.9−2.0−1.6−1.9−1.8
Pampa 2012 drought
Onset (month)10111111
Duration (month)437105945
Maximum
intensity (z-score)
+2.1−1.6−1.9−1.8−2.1−1.9−2.2−1.4
Disclaimer/Publisher’s Note: The statements, opinions and data contained in all publications are solely those of the individual author(s) and contributor(s) and not of MDPI and/or the editor(s). MDPI and/or the editor(s) disclaim responsibility for any injury to people or property resulting from any ideas, methods, instructions or products referred to in the content.

