Mapping Population Distribution with High Spatiotemporal Resolution in Beijing Using Baidu Heat Map Data
Abstract
:1. Introduction
2. Materials
2.1. Study Area
2.2. Data and Preprocessing
2.2.1. Baidu Heat Map Data
2.2.2. Mobile Signaling Data
2.2.3. Remote Sensing Data
2.2.4. Point of Interest Data
2.2.5. Building Volume Data
2.2.6. Ambient Population Data
2.2.7. Basic Geographic and Census Data
3. Methodology
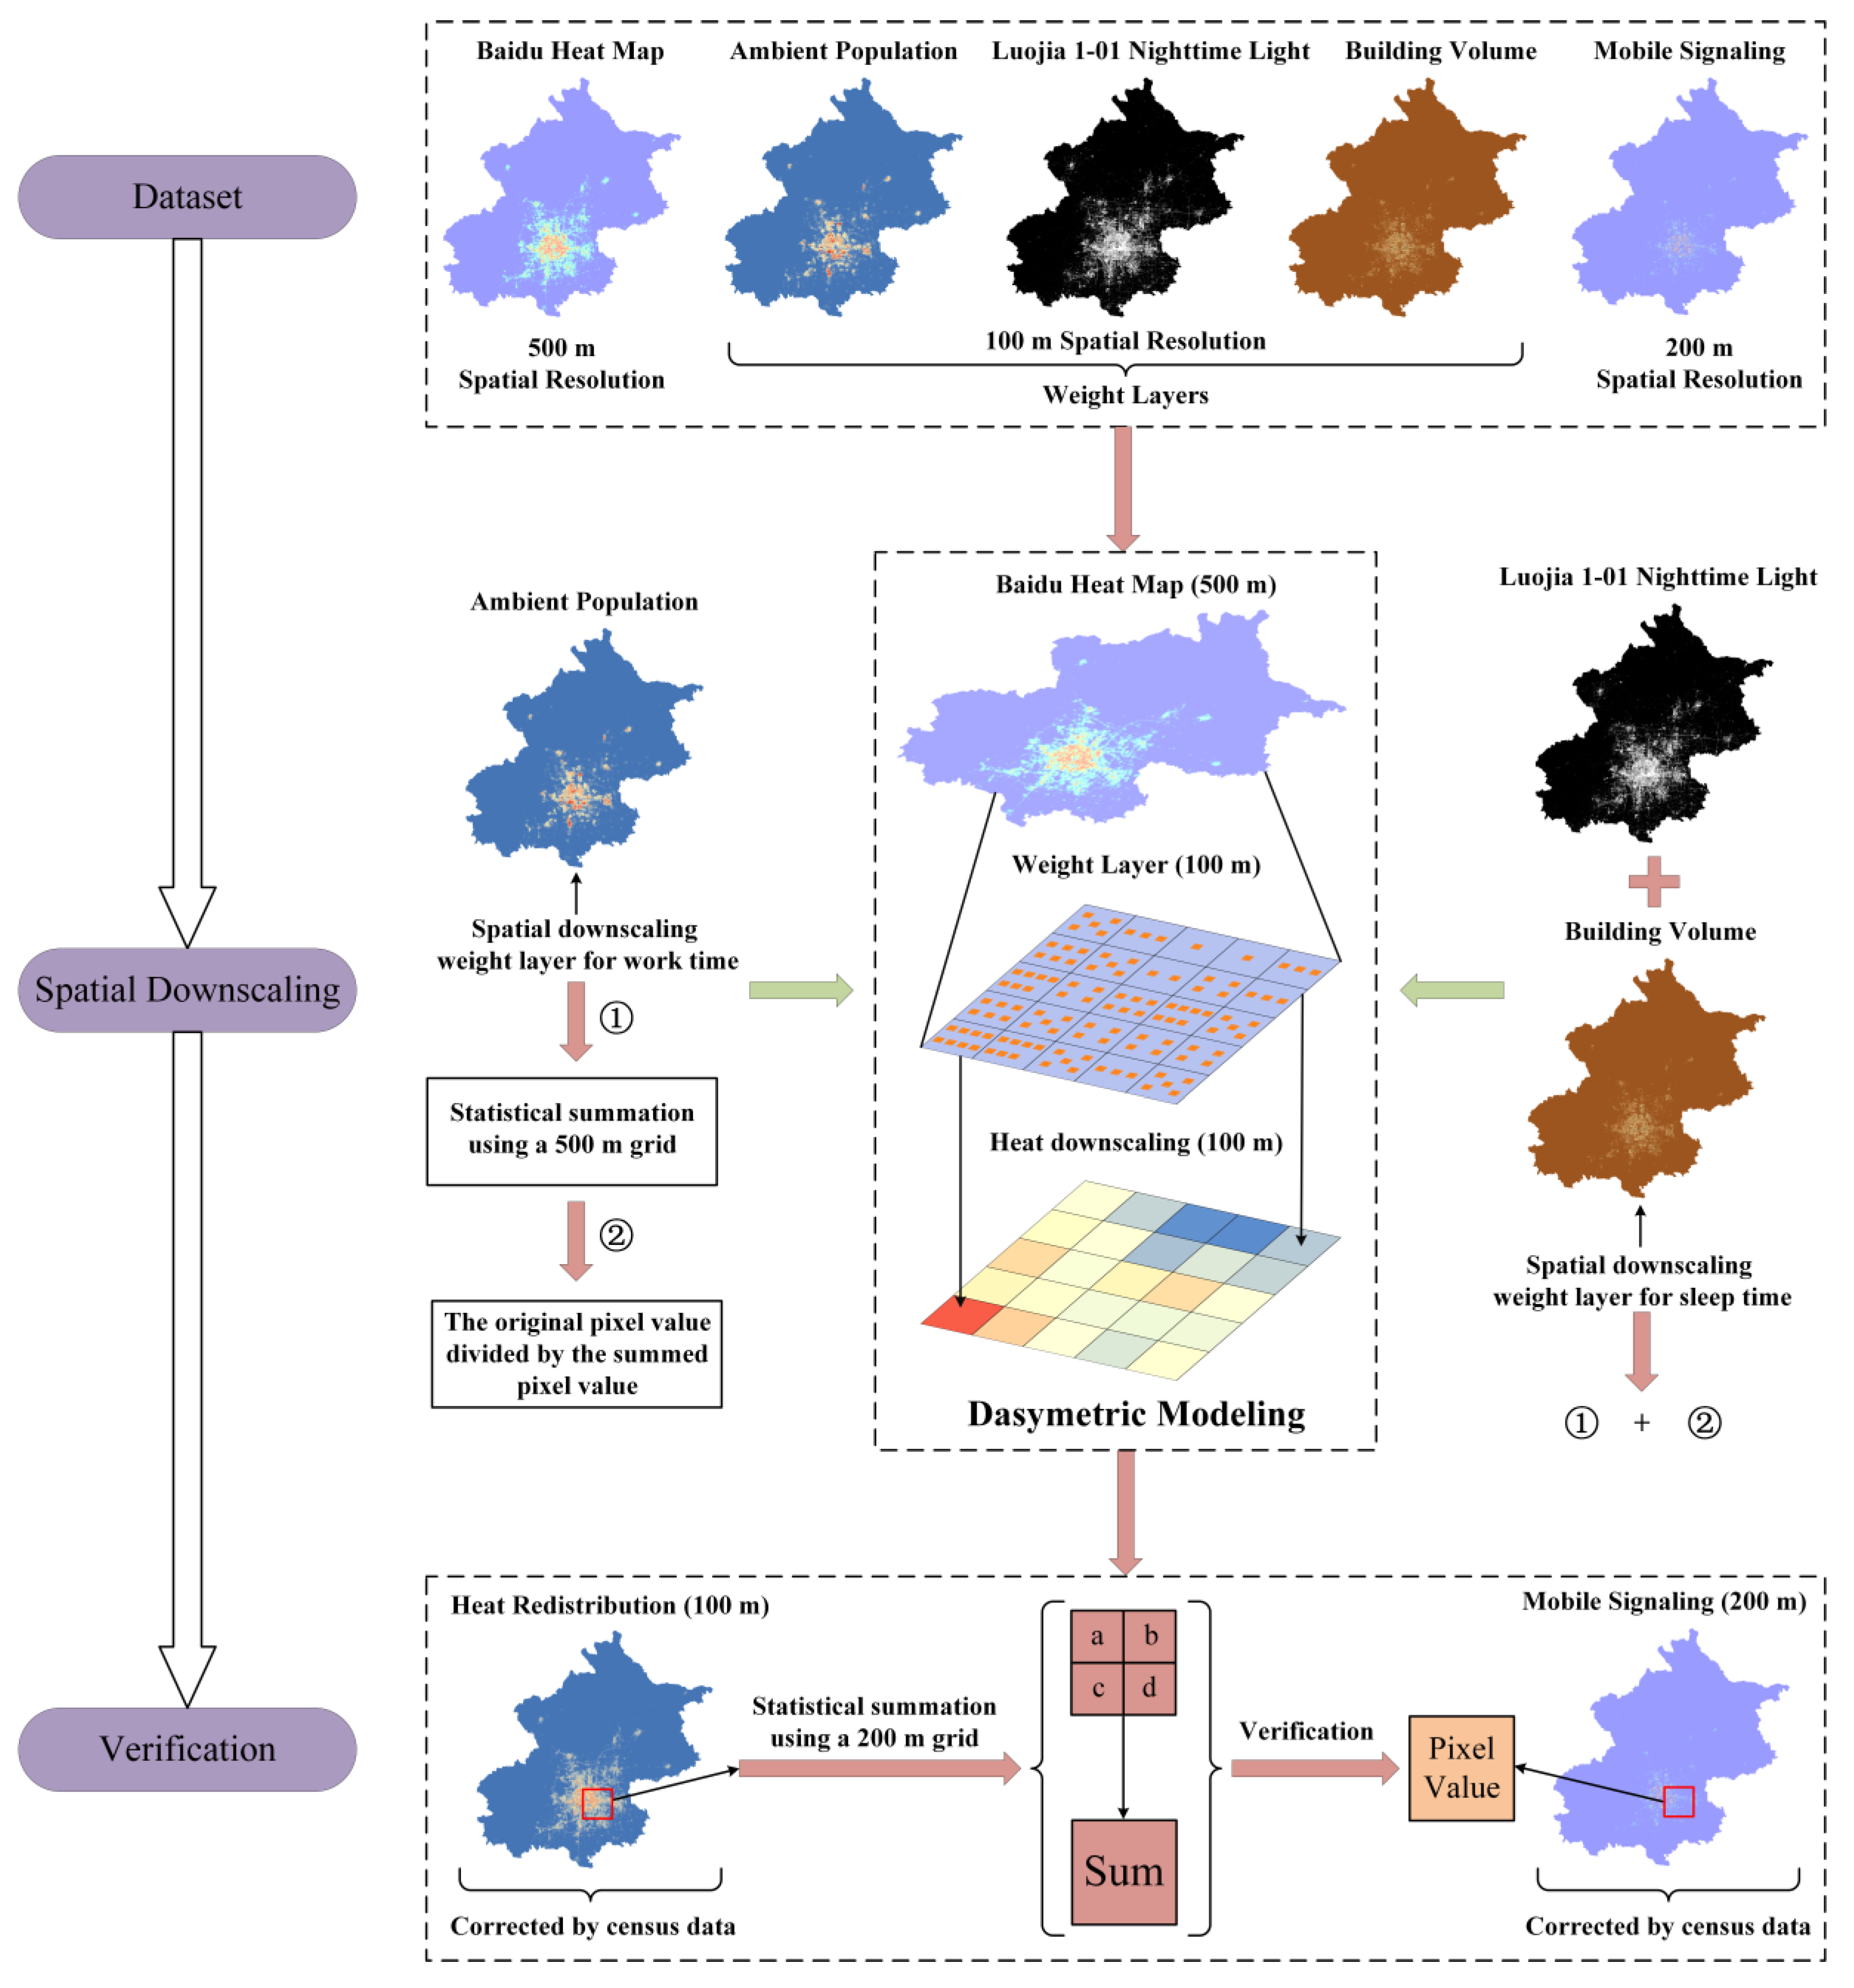
3.1. Spatial Downscaling Framework for Work Time
3.2. Spatial Downscaling Framework for Sleep Time
3.3. Kernel Density Estimation and Random Forest
3.4. Statistical Analysis and Accuracy Assessment
4. Results
4.1. Mapping Dynamic Population Distribution
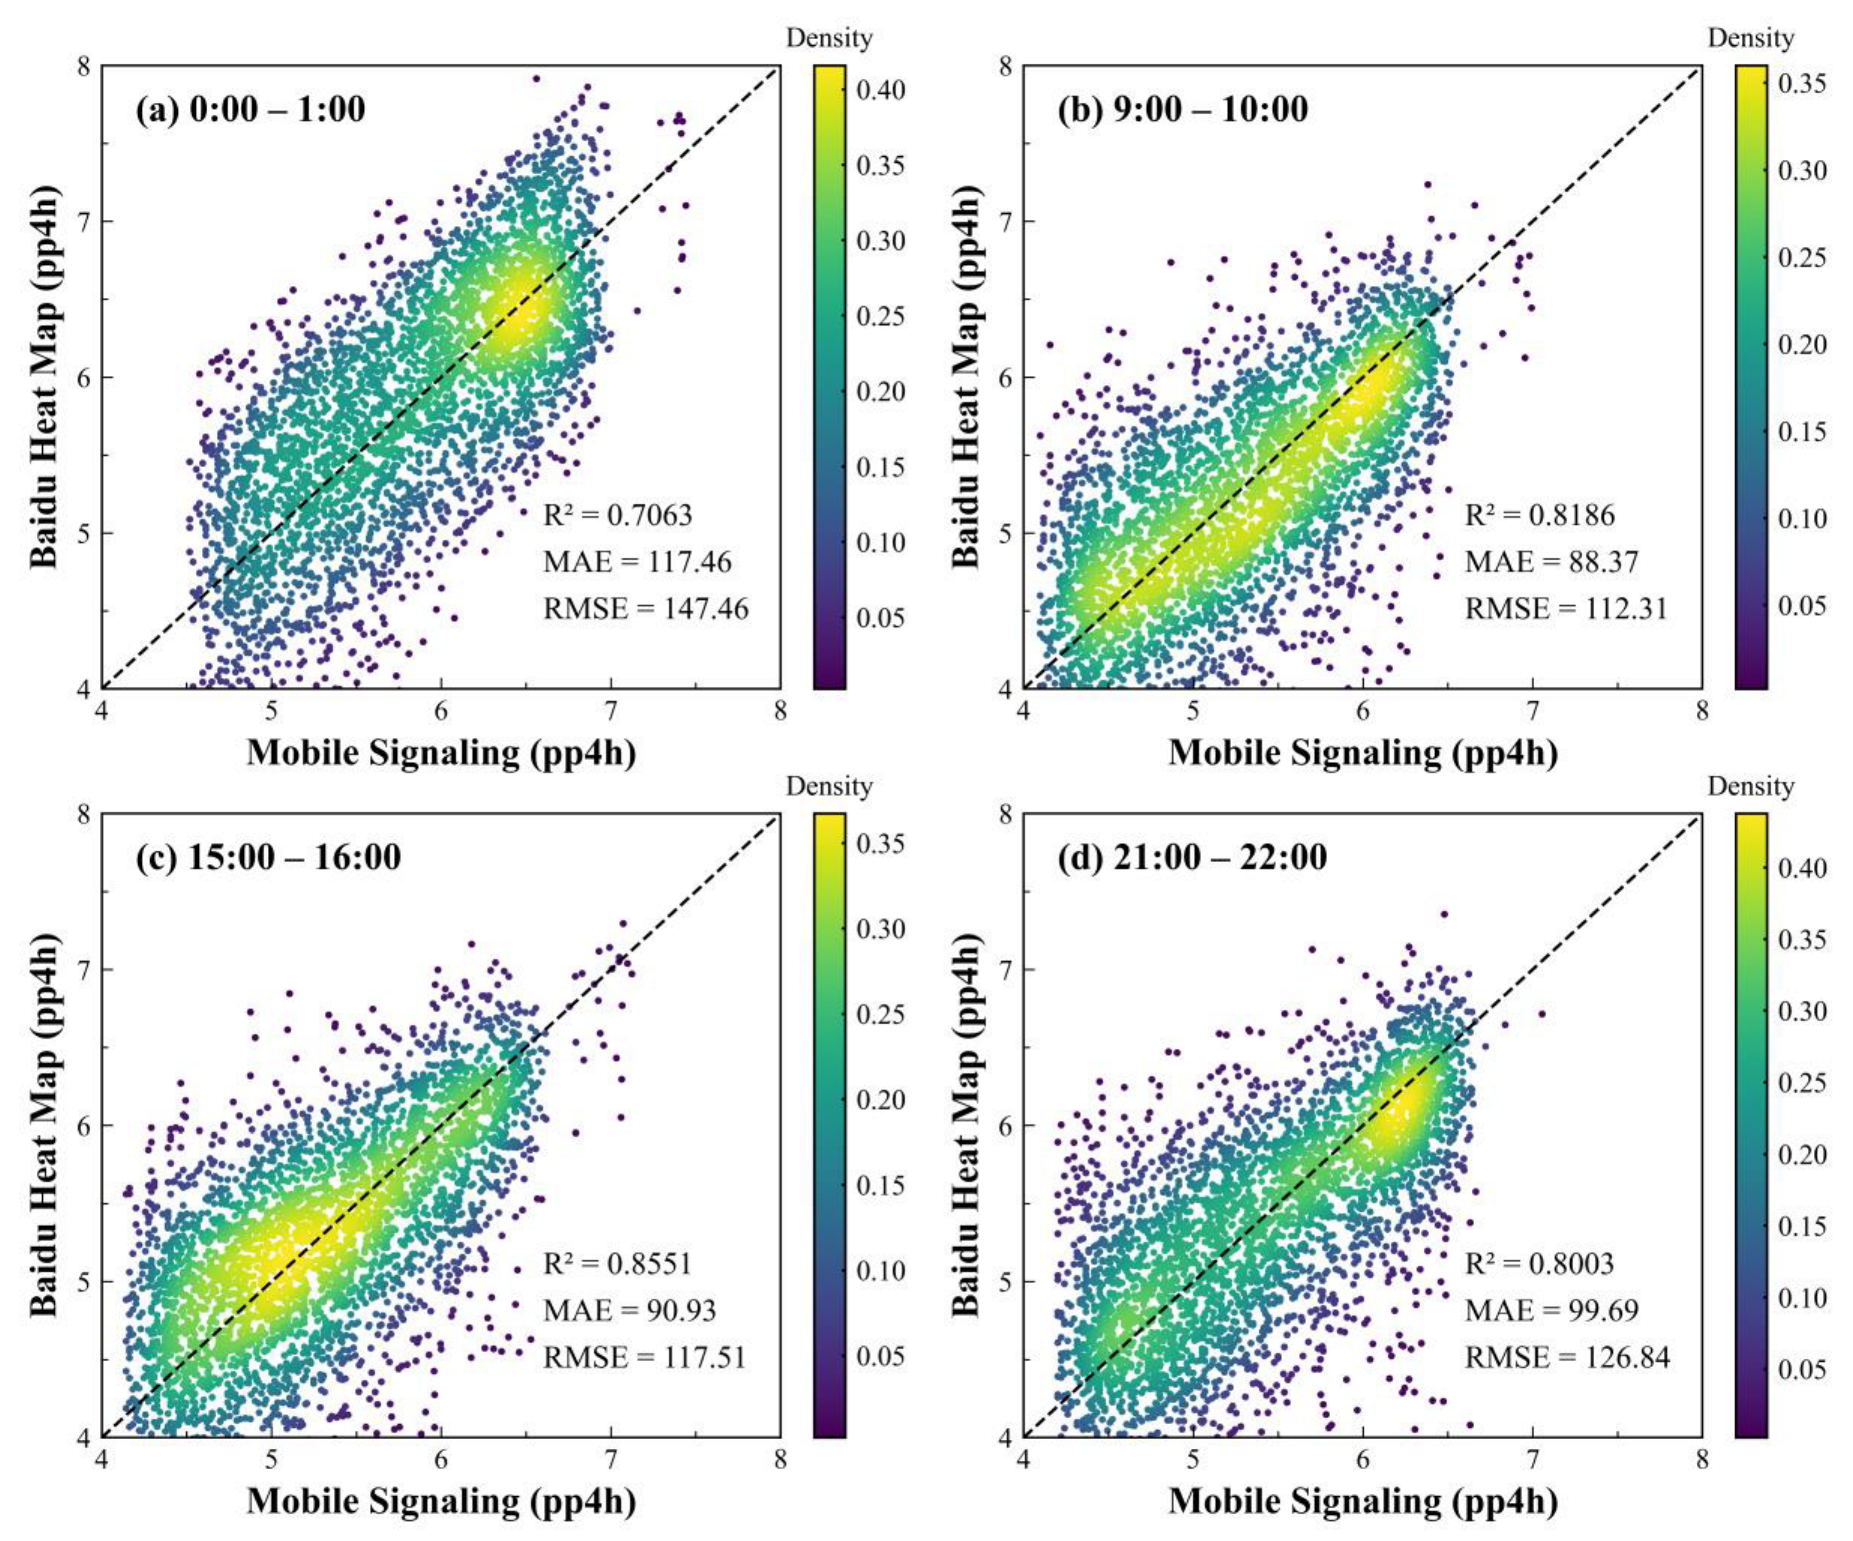
4.2. Evaluation of Spatial Downscaling Framework
5. Discussion
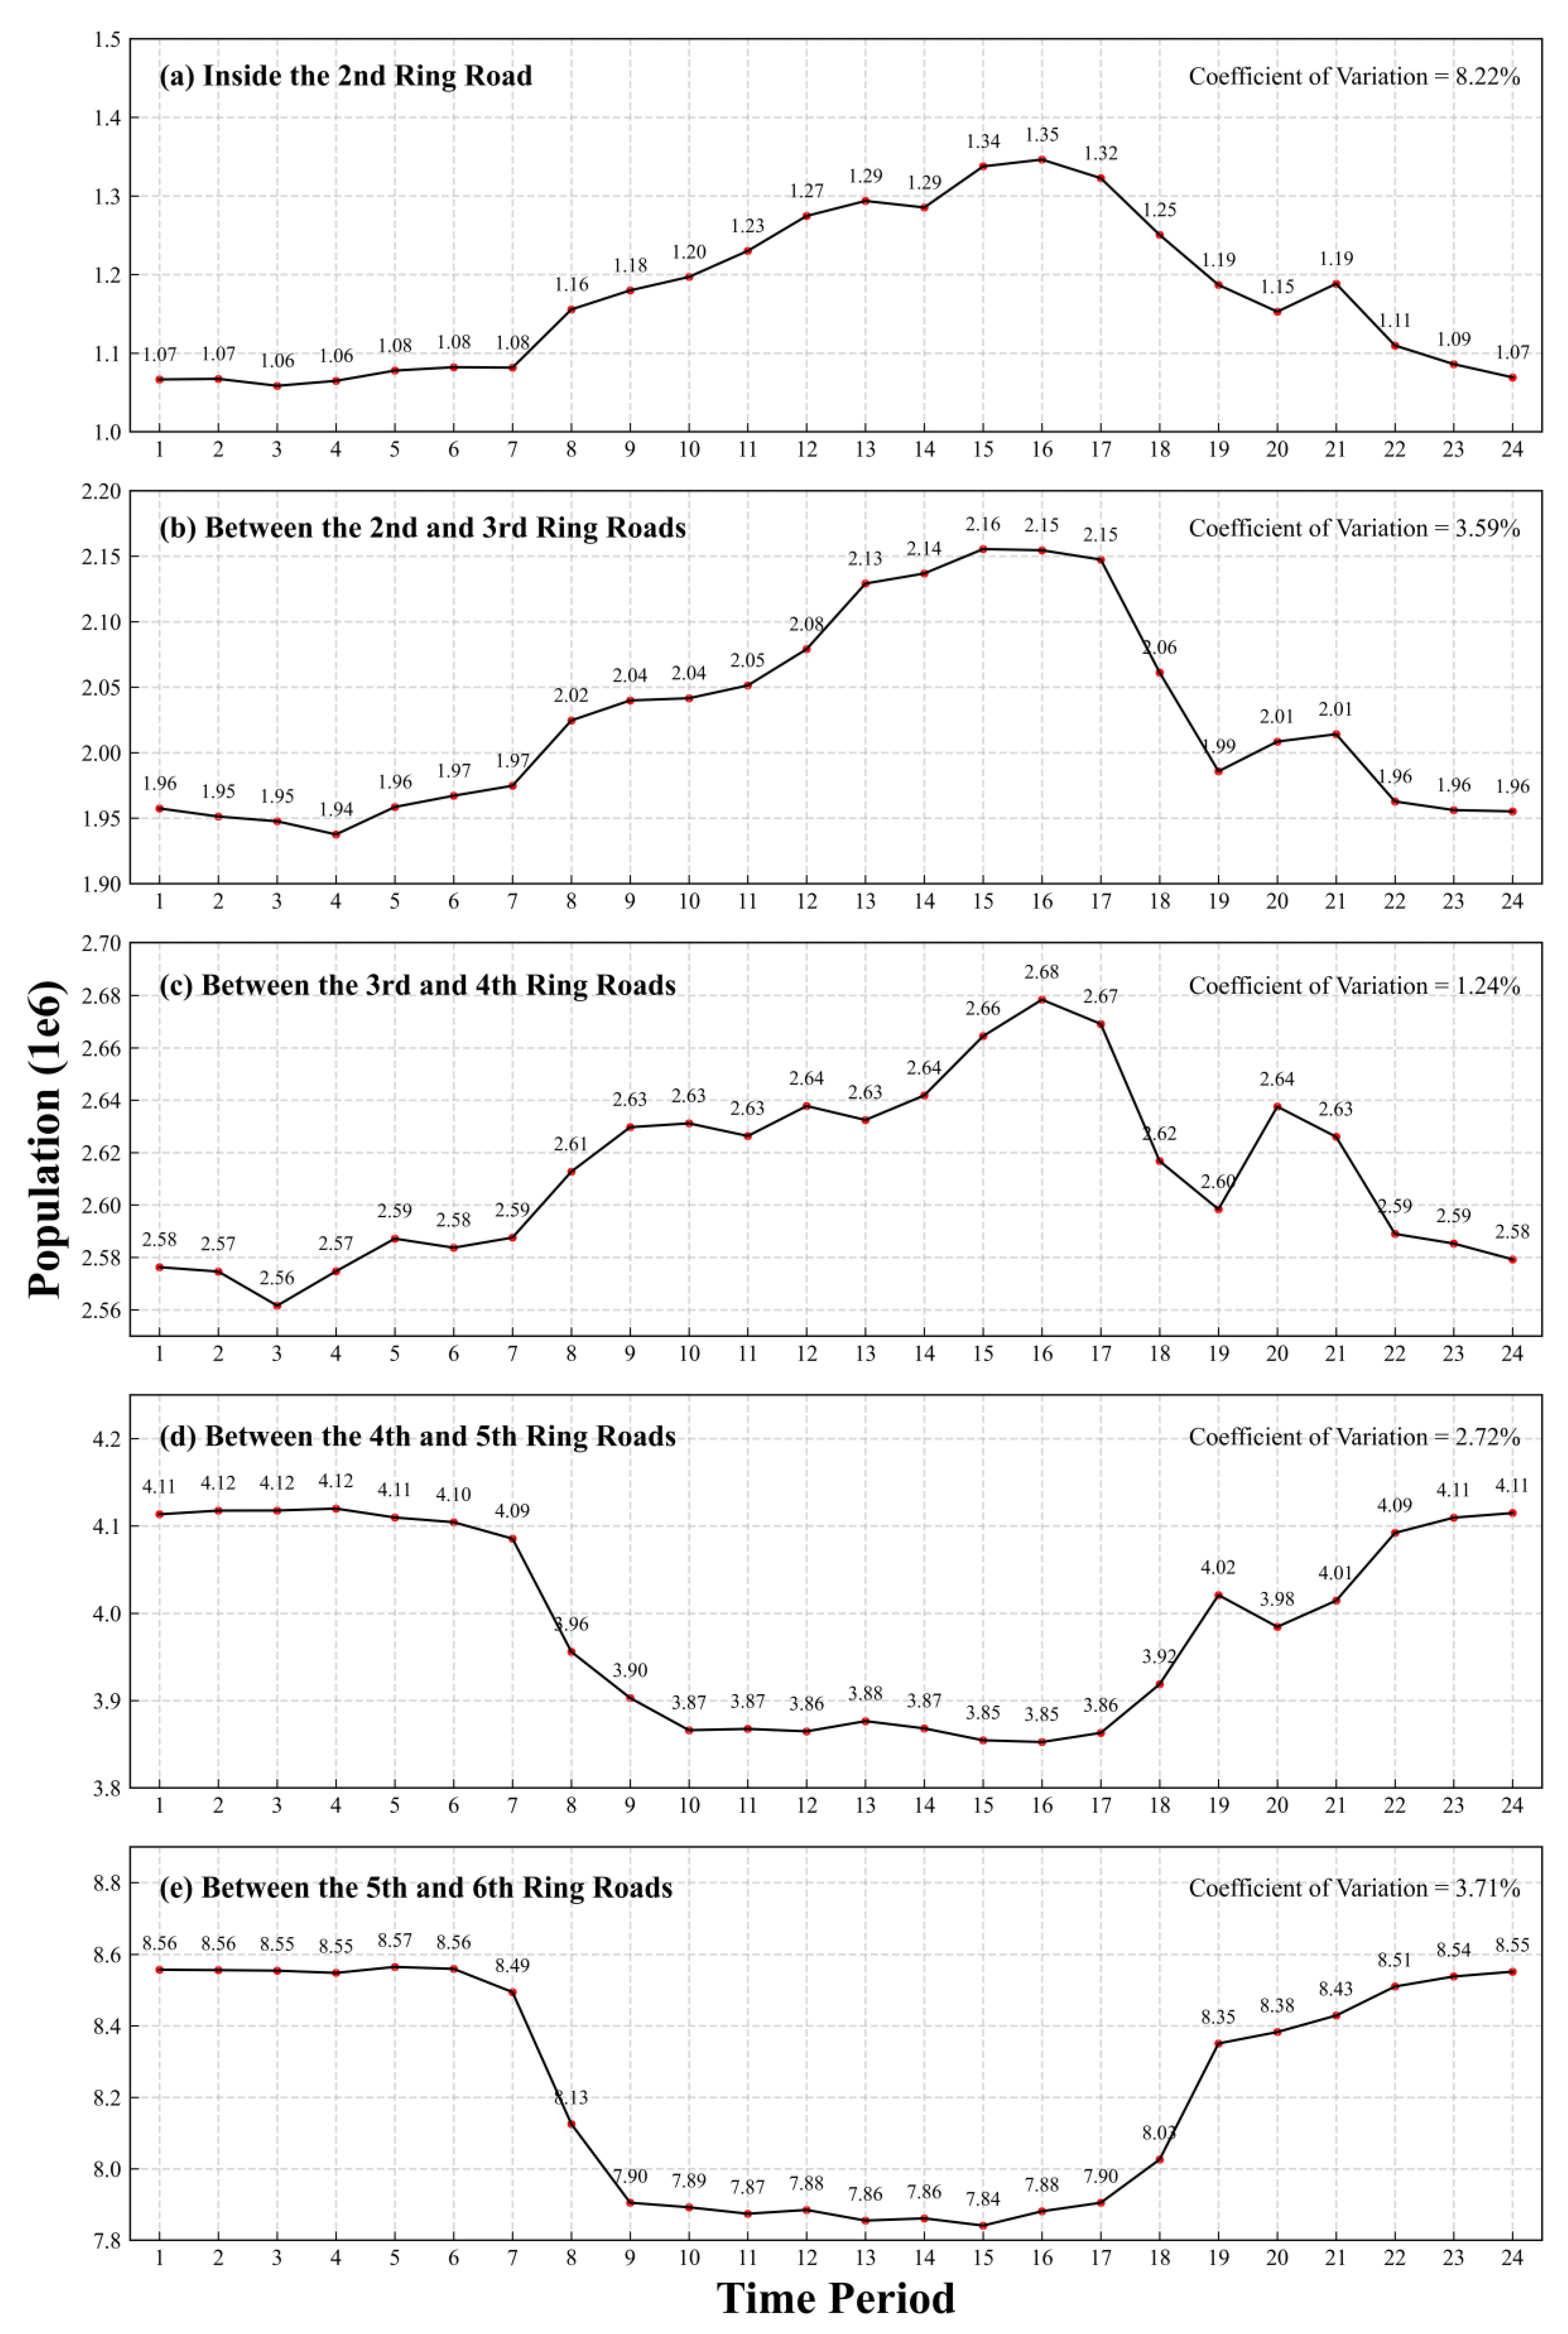
5.1. Spatiotemporal Distribution Characteristics of Population
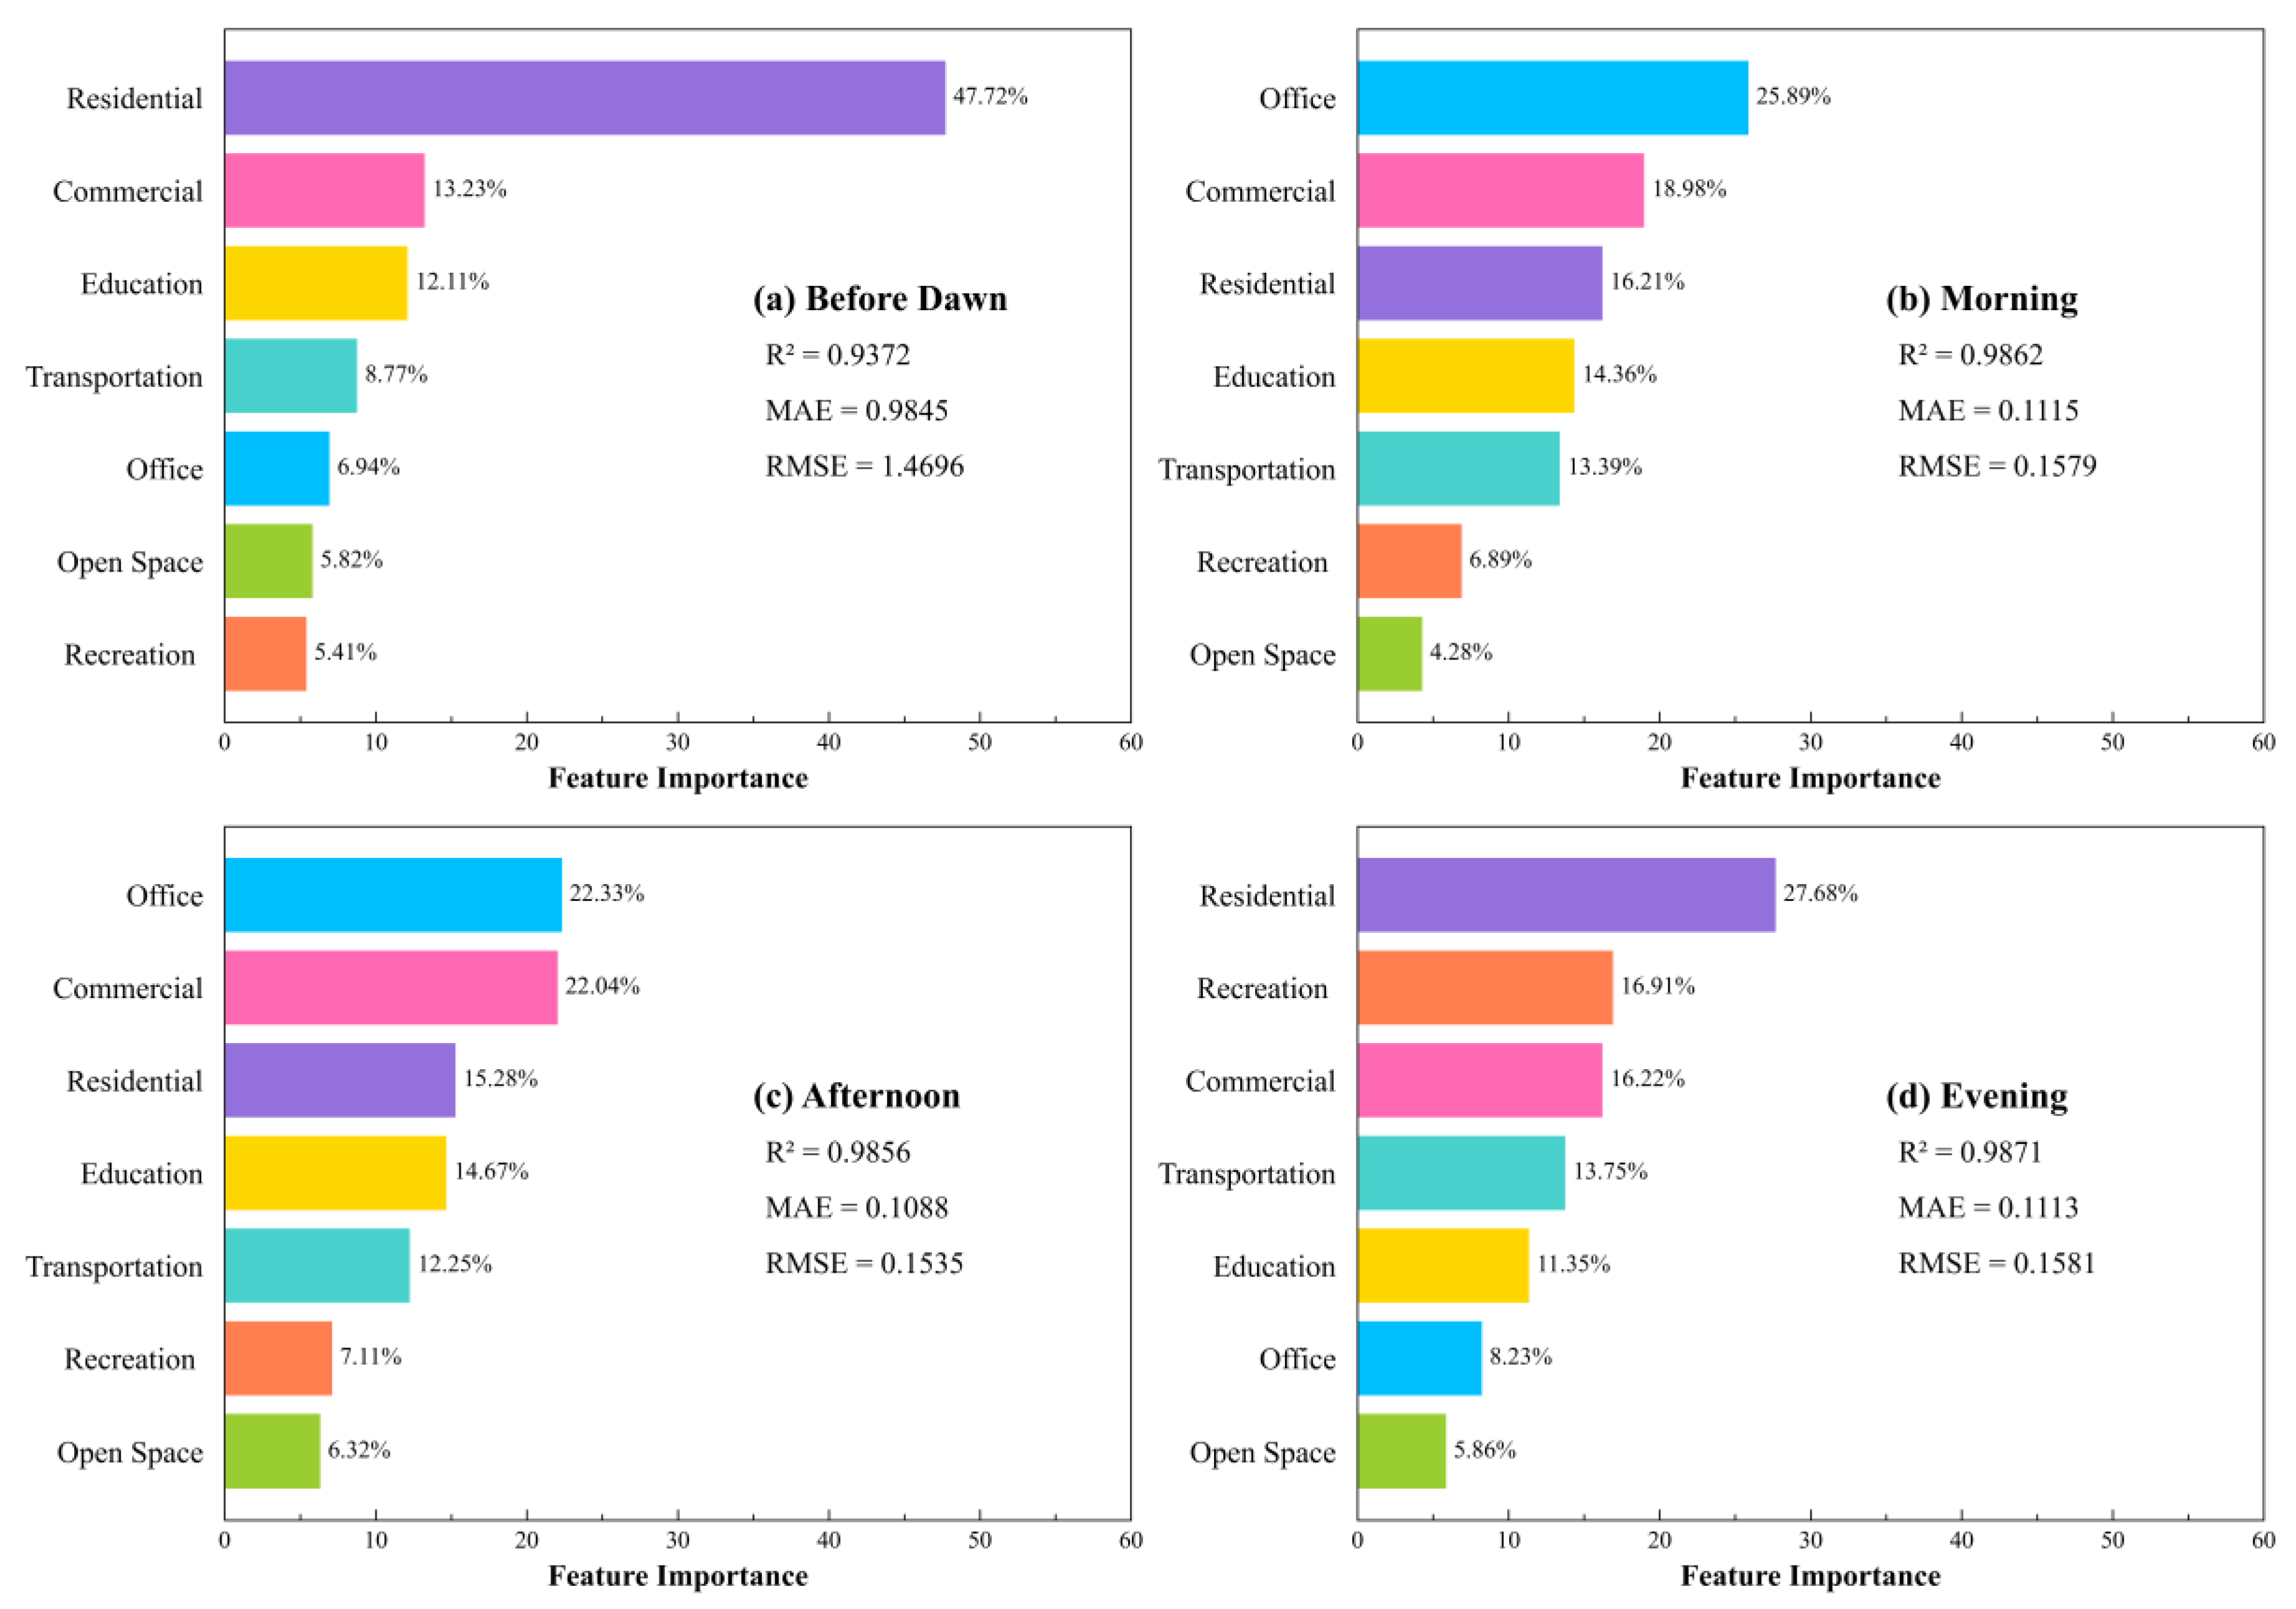
5.2. Relationship between Population and Land Use Type over Time
5.3. Impact of Policy on Population Mobility during the COVID-19 Pandemic
5.4. Advantages and Limitations
6. Conclusions
- (1)
- Verification results show that our proposed spatial downscaling framework for both work time and sleep time has high accuracy.
- (2)
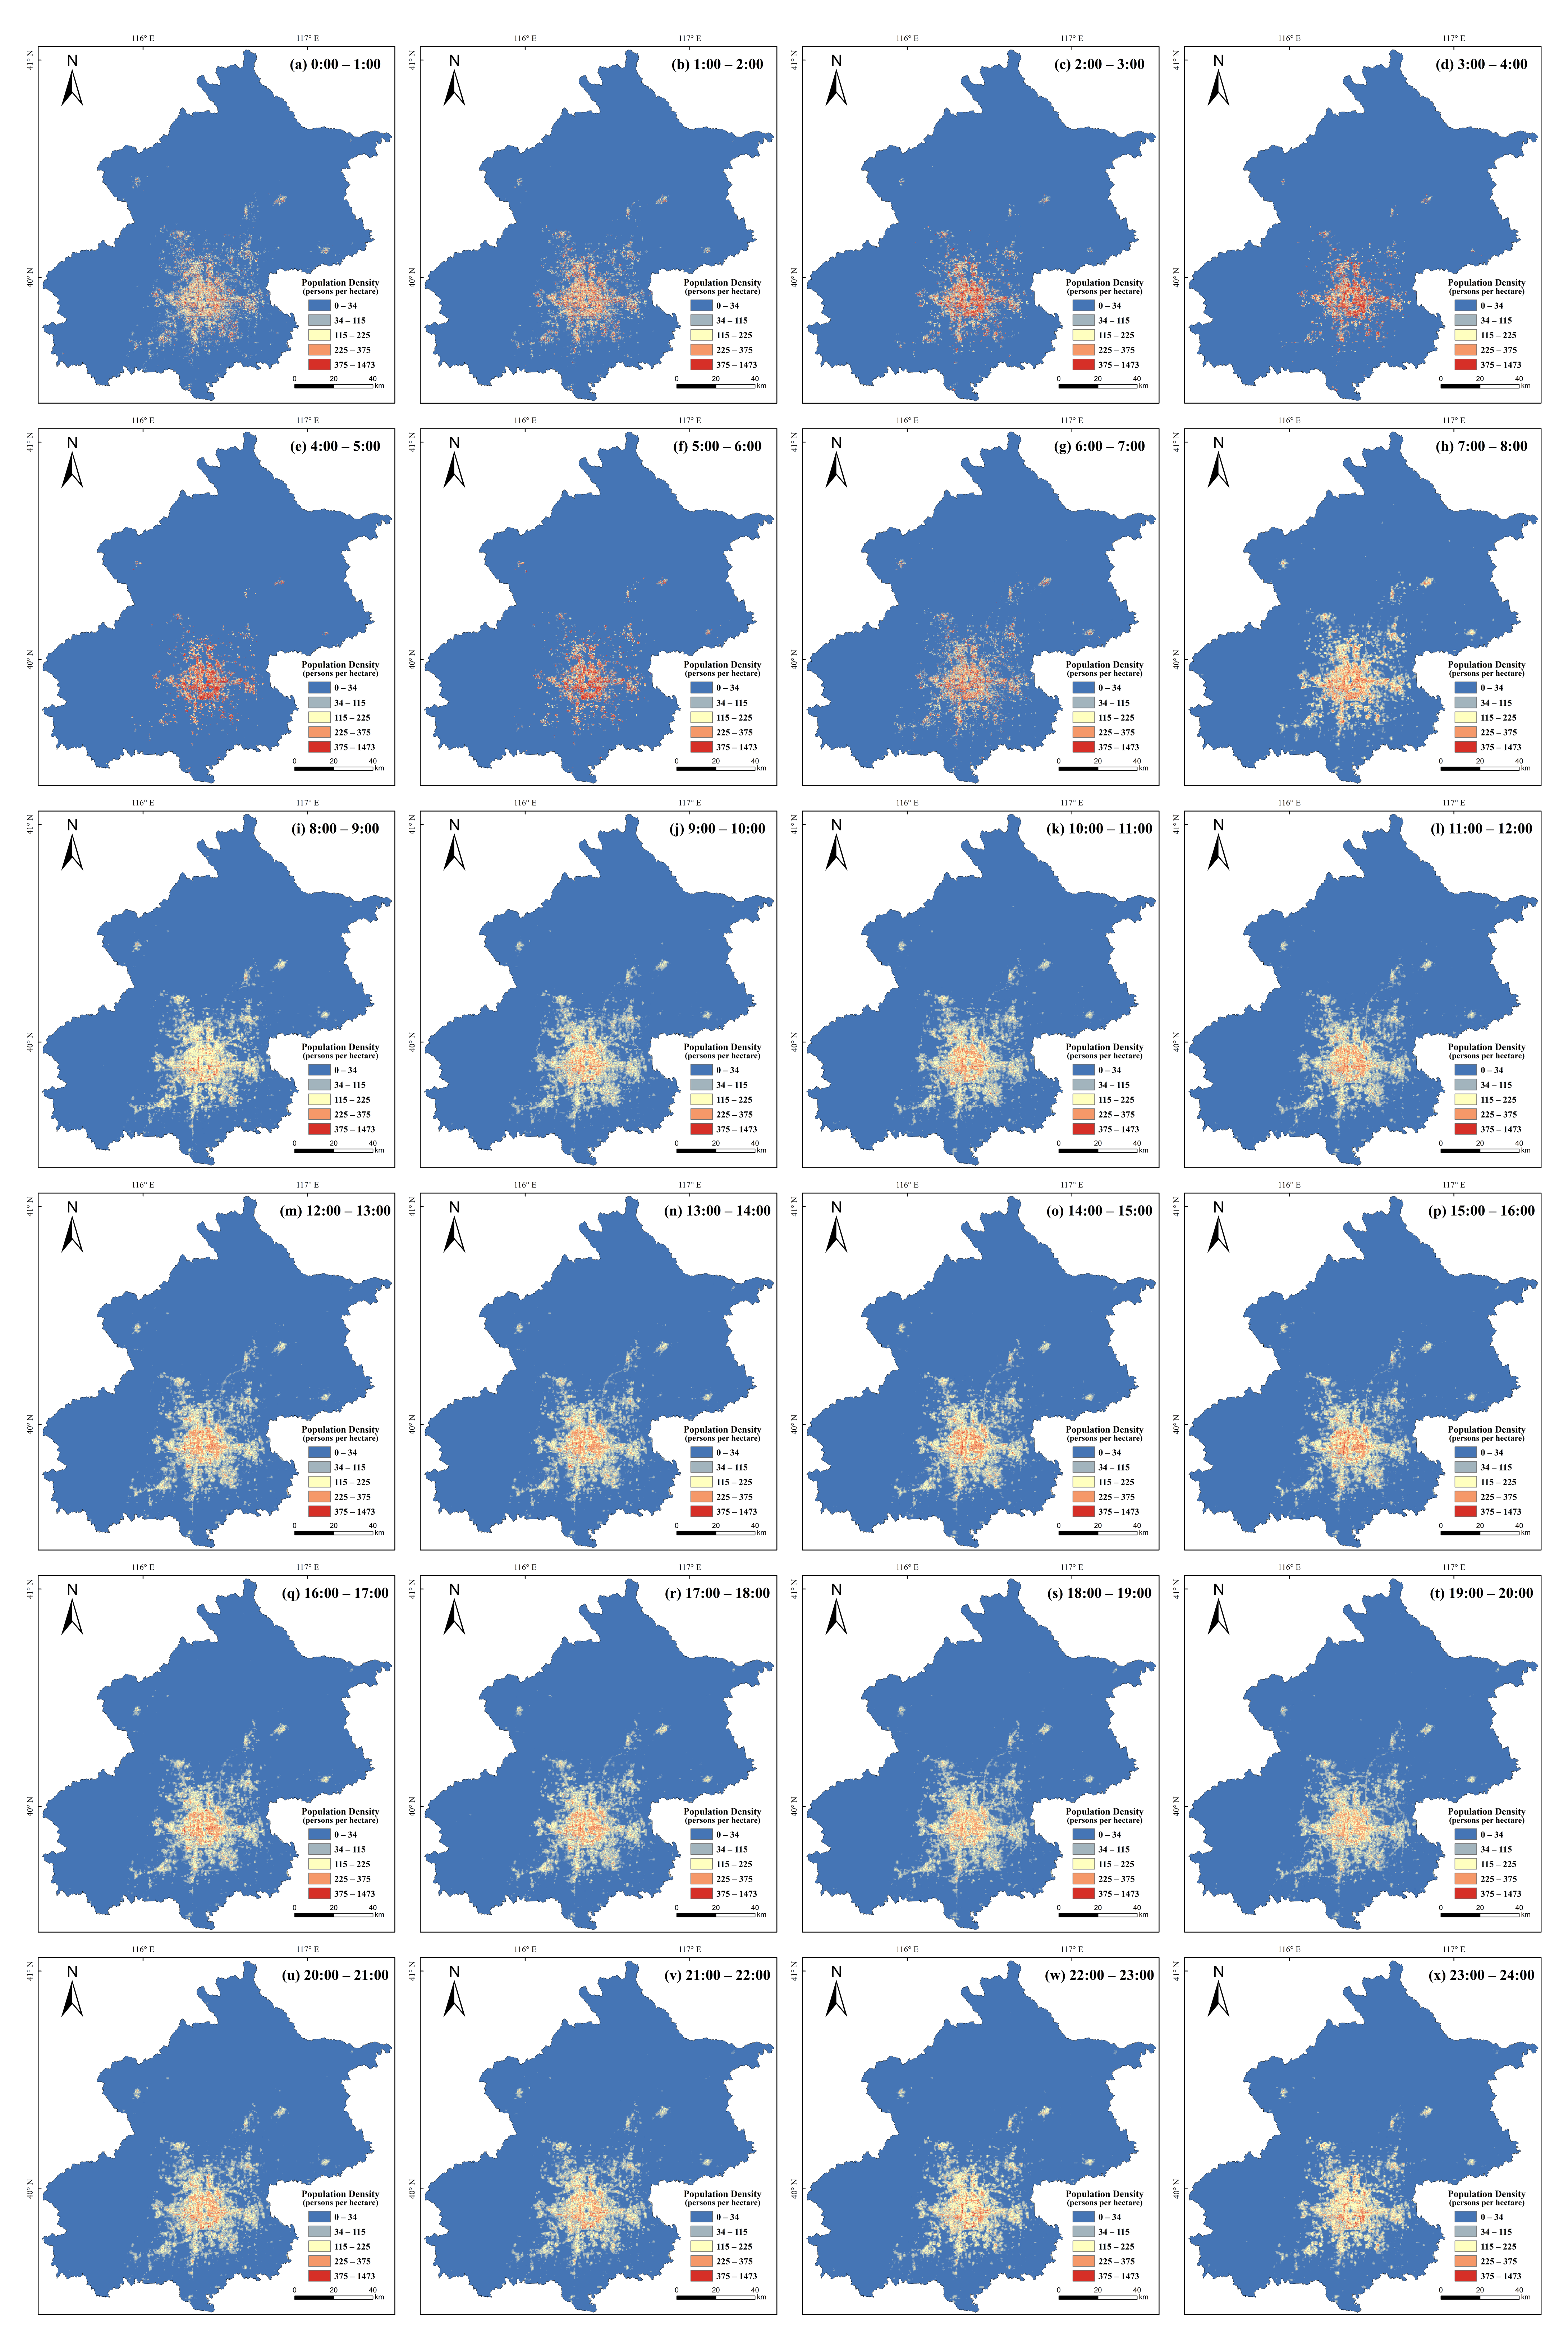
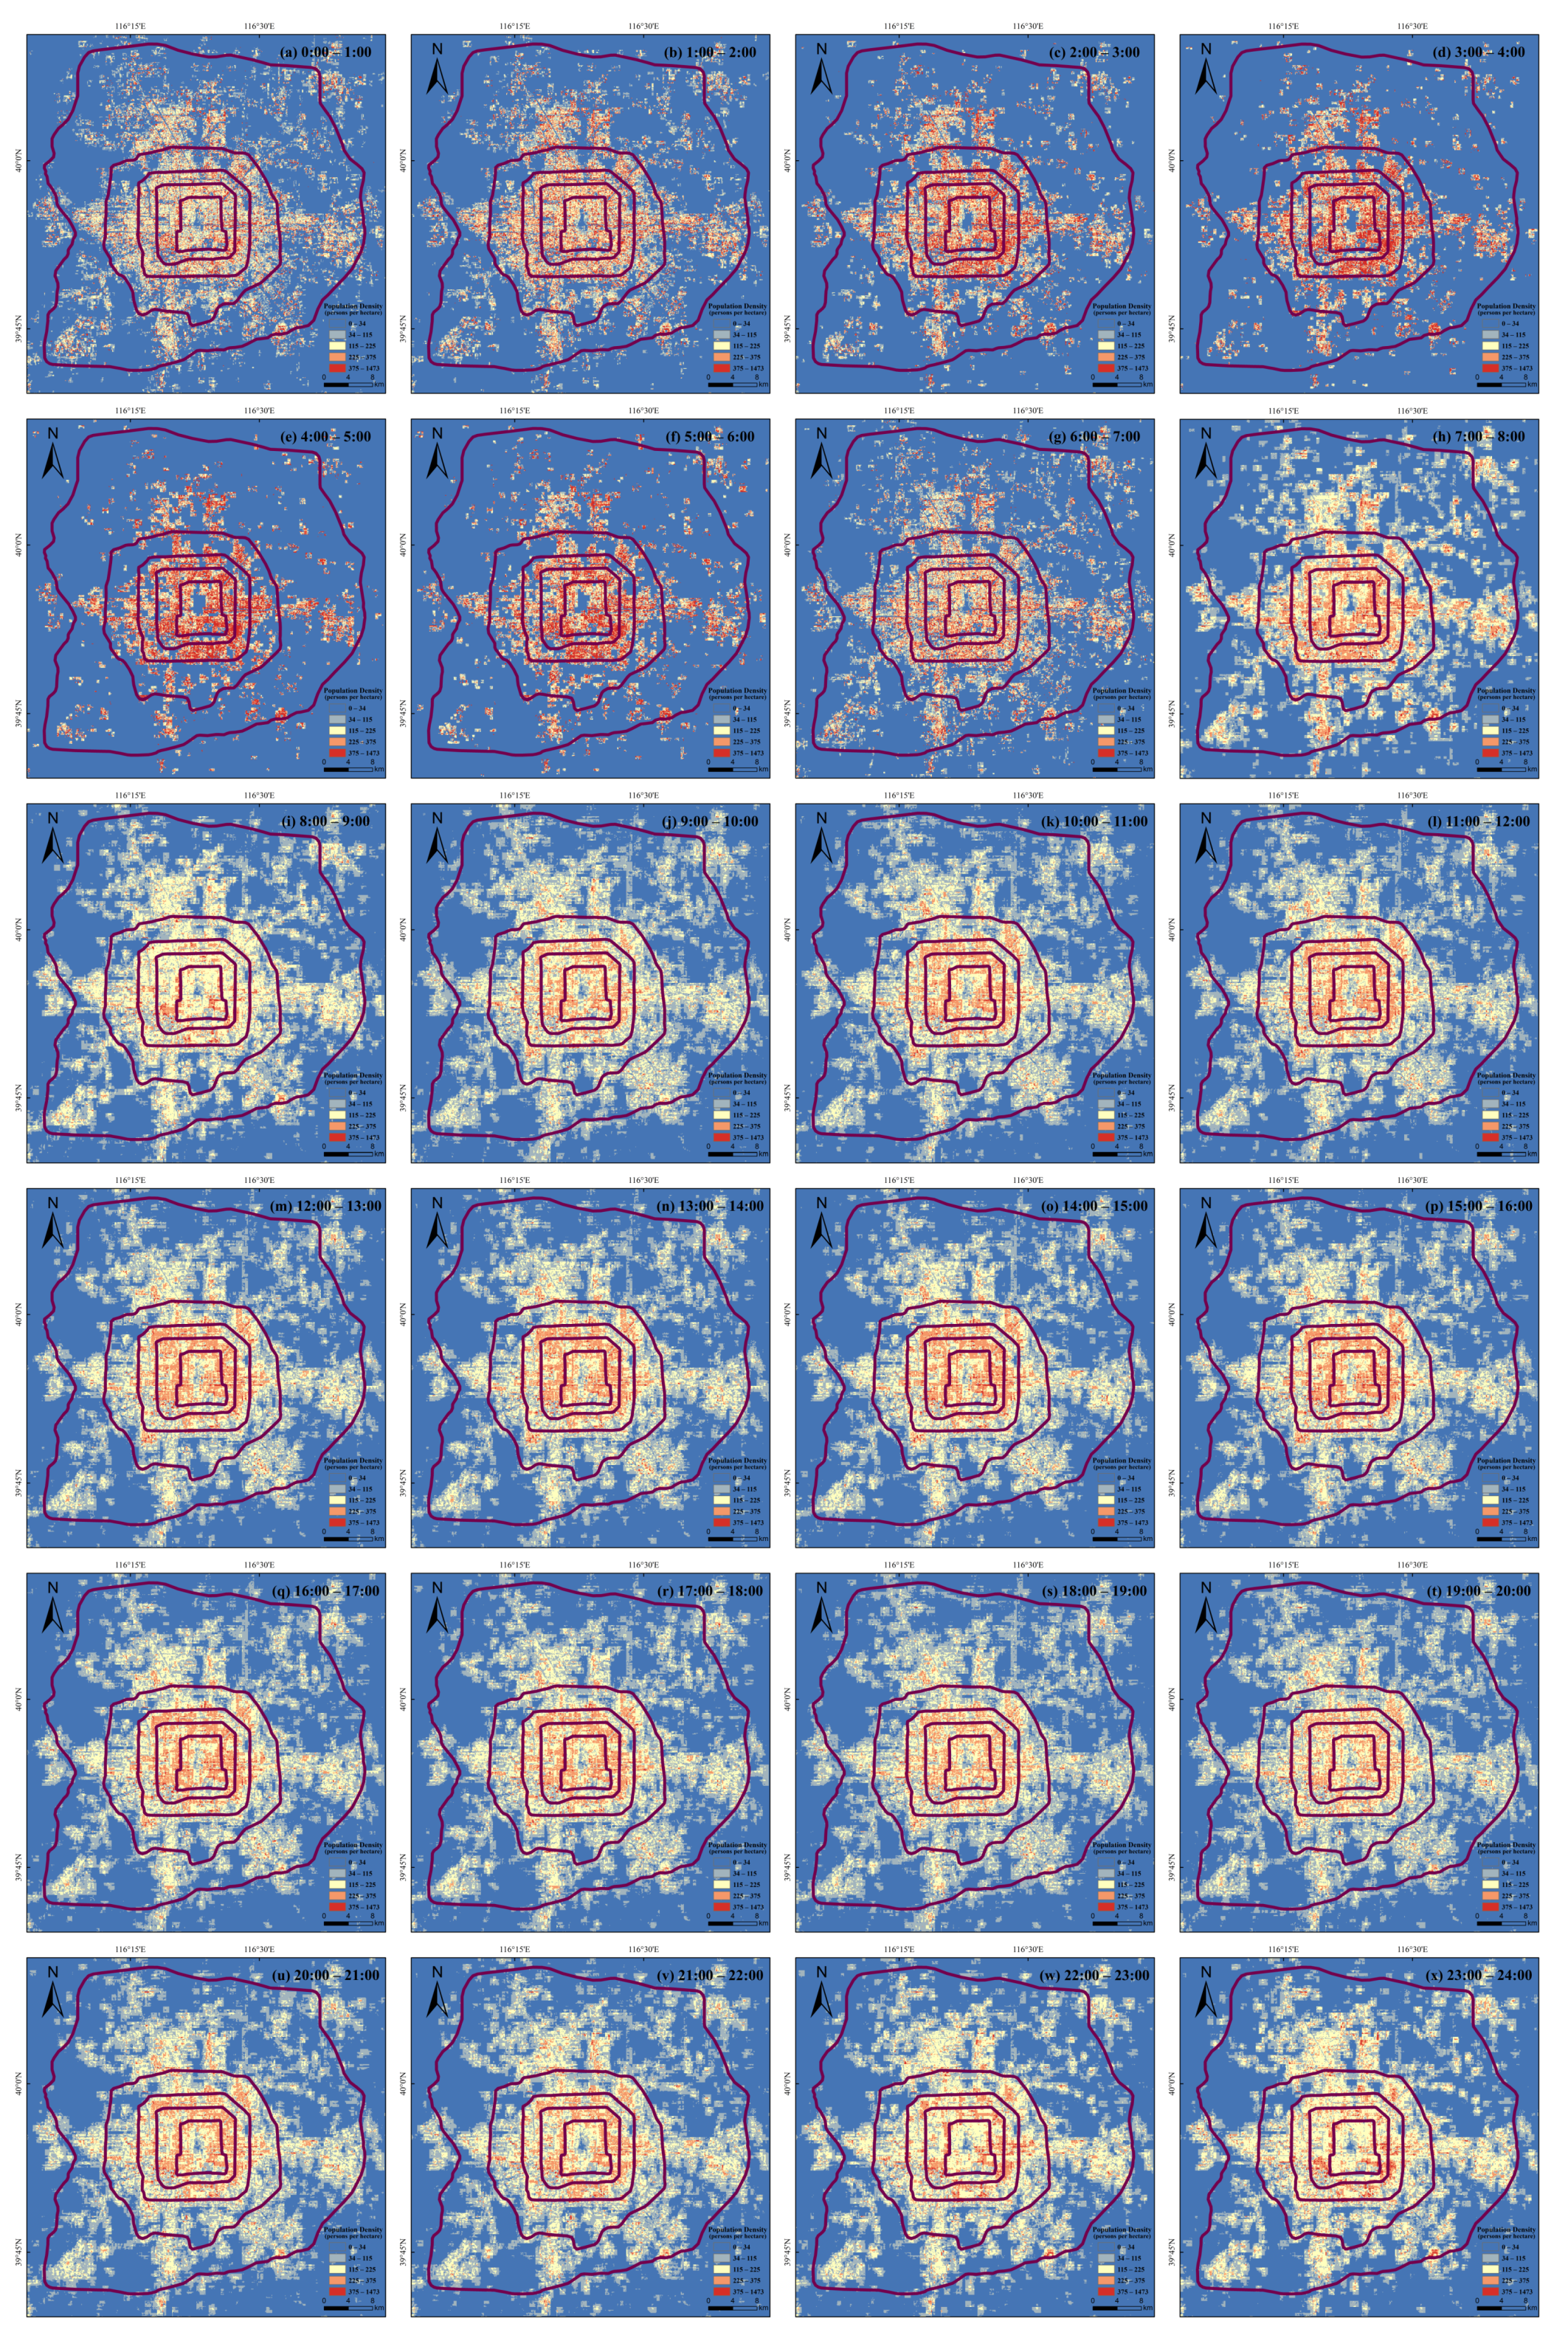
- The relevant statistical analysis indicates that the distribution of the population in Beijing on a regular weekday shows “centripetal centralization at daytime, centrifugal dispersion at night” spatiotemporal variation characteristics.
- (3)
- The results of the feature importance assessment indicate that the interaction between the purpose of residents’ activities and the spatial functional differences leads to the spatiotemporal evolution of the population distribution.
- (4)
- During the COVID-19 pandemic, China’s “surgical control and dynamic zero COVID-19” policy was strongly implemented, which ensured the life and freedom of movement of the Chinese people to the greatest extent possible.
Author Contributions
Funding
Institutional Review Board Statement
Informed Consent Statement
Data Availability Statement
Acknowledgments
Conflicts of Interest
References
- Zhao, X.; Zhou, Y.; Chen, W.; Li, X.; Li, X.; Li, D. Mapping hourly population dynamics using remotely sensed and geospatial data: A case study in Beijing, China. Gisci. Remote Sens. 2021, 58, 717–732. [Google Scholar] [CrossRef]
- Kuang, W.; Hou, Y.; Dou, Y.; Lu, D.; Yang, S. Mapping Global Urban Impervious Surface and Green Space Fractions Using Google Earth Engine. Remote. Sens. 2021, 13, 4187. [Google Scholar] [CrossRef]
- Kuang, W.; Zhang, S.; Li, X.; Lu, D. A 30 m resolution dataset of China’s urban impervious surface area and green space, 2000–Earth Syst. Sci. Data. 2021, 13, 63–82. [Google Scholar]
- Li, K.; Chen, Y.; Li, Y. The Random Forest-Based Method of Fine-Resolution Population Spatialization by Using the Inter-national Space Station Nighttime Photography and Social Sensing Data. Remote Sens. 2018, 10, 1650. [Google Scholar] [CrossRef] [Green Version]
- Li, B.; Gong, A.; Zeng, T.; Bao, W.; Xu, C.; Huang, Z. A Zoning Earthquake Casualty Prediction Model Based on Machine Learning. Remote. Sens. 2021, 14, 30. [Google Scholar] [CrossRef]
- Jia, J.S.; Lu, X.; Yuan, Y.; Xu, G.; Jia, J.; Christakis, N.A. Population flow drives spatio-temporal distribution of COVID-19 in China. Nature 2020, 582, 389–394. [Google Scholar] [CrossRef]
- Daughton, C.G. Wastewater surveillance for population-wide COVID-19: The present and future. Sci. Total. Environ. 2020, 736, 139631. [Google Scholar] [CrossRef]
- Han, Y.; Yang, L.; Jia, K.; Li, J.; Feng, S.; Chen, W.; Zhao, W.; Pereira, P. Spatial distribution characteristics of the COVID-19 pandemic in Beijing and its relationship with environmental factors. Sci. Total. Environ. 2020, 761, 144257. [Google Scholar] [CrossRef]
- Zhao, G.; Yang, M. Urban Population Distribution Mapping with Multisource Geospatial Data Based on Zonal Strategy. ISPRS Int. J. Geo-Inf. 2020, 9, 654. [Google Scholar] [CrossRef]
- Li, X.; Zhou, W. Dasymetric mapping of urban population in China based on radiance corrected DMSP-OLS nighttime light and land cover data. Sci. Total. Environ. 2018, 643, 1248–1256. [Google Scholar] [CrossRef]
- Pérez-Morales, A.; Gil-Guirado, S.; Martínez-García, V. Dasymetry Dash Flood (DDF). A Method Popul. Mapp. Flood Expo. Assess. Tour. Cities. Appl. Geography 2022, 142, 102683. [Google Scholar] [CrossRef]
- Tenerelli, P.; Gallego, J.F.; Ehrlich, D. Population density modelling in support of disaster risk assessment. Int. J. Disaster Risk Reduct. 2015, 13, 334–341. [Google Scholar] [CrossRef]
- Weber, E.M.; Seaman, V.Y.; Stewart, R.N.; Bird, T.J.; Tatem, A.J.; McKee, J.J.; Bhaduri, B.L.; Moehl, J.J.; Reith, A.E. Cen-sus-independent population mapping in northern Nigeria. Remote Sens. Environ. 2018, 204, 786–798. [Google Scholar]
- Li, L.; Li, J.; Jiang, Z.; Zhao, L.; Zhao, P. Methods of Population Spatialization Based on the Classification Information of Buildings from China’s First National Geoinformation Survey in Urban Area: A Case Study of Wuchang District, Wuhan City, China. Sensors 2018, 18, 2558. [Google Scholar] [CrossRef] [PubMed] [Green Version]
- Xie, Z. A Framework for Interpolating the Population Surface at the Residential-Housing-Unit Level. GIScience Remote Sens. 2006, 43, 233–251. [Google Scholar] [CrossRef]
- Langford, M. Obtaining population estimates in non-census reporting zones: An evaluation of the 3-class dasymetric method. Comput. Environ. Urban Syst. 2006, 30, 161–180. [Google Scholar] [CrossRef]
- Goodchild, M.F.; Lam, N. Interpolation—A Variant of the Traditional Spatial Problem. Geo-Processing 1980, 1, 297–312. [Google Scholar]
- Goodchild, M.F.; Anselin, L.; Deichmann, U. A Framework for the Areal Interpolation of Socioeconomic Data. Environ. Plan. A Econ. Space 1993, 25, 383–397. [Google Scholar] [CrossRef]
- Wang, L.; Wang, S.; Zhou, Y.; Liu, W.; Hou, Y.; Zhu, J.; Wang, F. Mapping population density in China between 1990 and 2010 using remote sensing. Remote Sens. Environ. 2018, 210, 269–281. [Google Scholar] [CrossRef]
- Lwin, K.K.; Sugiura, K.; Zettsu, K. Space–time multiple regression model for grid-based population estimation in urban areas. Int. J. Geogr. Inf. Sci. 2016, 30, 1579–1593. [Google Scholar] [CrossRef]
- Xu, Y.; Song, Y.; Cai, J.; Zhu, H. Population mapping in China with Tencent social user and remote sensing data. Appl. Geography 2021, 130, 102450. [Google Scholar] [CrossRef]
- Zhao, S.; Liu, Y.; Zhang, R.; Fu, B. China’s population spatialization based on three machine learning models. J. Clean. Prod. 2020, 256, 120644. [Google Scholar] [CrossRef]
- Qiu, G.; Bao, Y.; Yang, X.; Wang, C.; Ye, T.; Stein, A.; Jia, P. Local Population Mapping Using a Random Forest Model Based on Remote and Social Sensing Data: A Case Study in Zhengzhou, China. Remote Sens. 2020, 12, 1618. [Google Scholar] [CrossRef]
- Bao, W.; Gong, A.; Zhao, Y.; Chen, S.; Ba, W.; He, Y. High-Precision Population Spatialization in Metropolises Based on Ensemble Learning: A Case Study of Beijing, China. Remote Sens. 2022, 14, 3654. [Google Scholar] [CrossRef]
- Jia, P.; Gaughan, A.E. Dasymetric modeling: A hybrid approach using land cover and tax parcel data for mapping population in Alachua County, Florida. Appl. Geography 2016, 66, 100–108. [Google Scholar] [CrossRef]
- Gaughan, A.E.; Stevens, F.R.; Huang, Z.; Nieves, J.J.; Sorichetta, A.; Lai, S.; Ye, X.; Linard, C.; Hornby, G.M.; Hay, S.I.; et al. Spatiotemporal patterns of population in mainland China, 1990 to 2010. Sci. Data 2016, 3, 160005. [Google Scholar] [CrossRef] [Green Version]
- Zhou, Y.; Ma, M.; Shi, K.; Peng, Z. Estimating and Interpreting Fine-Scale Gridded Population Using Random Forest Re-gression and Multisource Data. ISPRS Int. J. Geo-Information. 2020, 9, 369. [Google Scholar] [CrossRef]
- Elvidge, C.D.; Baugh, K.E.; Dietz, J.B.; Bland, T.; Sutton, P.C.; Kroehl, H.W. Radiance Calibration of DMSP-OLS Low-Light Imaging Data of Human Settlements. Remote Sens. Environ. 1999, 68, 77–88. [Google Scholar] [CrossRef]
- Briggs, D.J.; Gulliver, J.; Fecht, D.; Vienneau, D.M. Dasymetric modelling of small-area population distribution using land cover and light emissions data. Remote Sens. Environ. 2007, 108, 451–466. [Google Scholar] [CrossRef]
- Lu, D.; Tian, H.; Zhou, G.; Ge, H. Regional mapping of human settlements in southeastern China with multisensor remotely sensed data. Remote Sens. Environ. 2008, 112, 3668–3679. [Google Scholar] [CrossRef]
- Kuang, W. 70 years of urban expansion across China: Trajectory, pattern, and national policies. Sci. Bull. 2020, 65, 1970–1974. [Google Scholar] [CrossRef]
- Kuang, W.; Du, G.; Lu, D.; Dou, Y.; Li, X.; Zhang, S.; Chi, W.; Dong, J.; Chen, G.; Yin, Z.; et al. Global observation of urban expansion and land-cover dynamics using satellite big-data. Sci. Bull. 2020, 66, 297–300. [Google Scholar] [CrossRef]
- Kuang, W.; Liu, J.; Tian, H.; Shi, H.; Dong, J.; Song, C.; Li, X.; Du, G.; Hou, Y.; Lu, D.; et al. Cropland redistribution to marginal lands undermines environmental sustainability. Natl. Sci. Rev. 2021, 9, nwab091. [Google Scholar] [CrossRef] [PubMed]
- Ye, T.; Zhao, N.; Yang, X.; Ouyang, Z.; Liu, X.; Chen, Q.; Hu, K.; Yue, W.; Qi, J.; Li, Z.; et al. Improved population mapping for China using remotely sensed and points-of-interest data within a random forests model. Sci. Total. Environ. 2018, 658, 936–946. [Google Scholar] [CrossRef] [PubMed]
- Wang, Y.; Huang, C.; Zhao, M.; Hou, J.; Zhang, Y.; Gu, J. Mapping the Population Density in Mainland China using NPP/VIIRS and Points-Of-Interest Data Based on a Random Forests Model. Remote Sens. 2020, 12, 3645. [Google Scholar] [CrossRef]
- Esch, T.; Brzoska, E.; Dech, S.; Leutner, B.; Palacios-Lopez, D.; Metz-Marconcini, A.; Marconcini, M.; Roth, A.; Zeidler, J. World Settlement Footprint 3D—A first three-dimensional survey of the global building stock. Remote Sens. Environ. 2022, 270, 112877. [Google Scholar] [CrossRef]
- Frantz, D.; Schug, F.; Okujeni, A.; Navacchi, C.; Wagner, W.; van der Linden, S.; Hostert, P. National-scale mapping of building height using Sentinel-1 and Sentinel-2 time series. Remote Sens. Environ. 2020, 252, 112128. [Google Scholar] [CrossRef]
- Cao, Y.; Huang, X. A deep learning method for building height estimation using high-resolution multi-view imagery over urban areas: A case study of 42 Chinese cities. Remote Sens. Environ. 2021, 264, 112590. [Google Scholar] [CrossRef]
- Dobson, J.E.; Bright, E.A.; Coleman, P.R.; Durfee, R.C.; Worley, B.A. LandScan: A global population database for estimating populations at risk. Photogramm. Eng. Remote Sens. 2000, 66, 849–857. [Google Scholar]
- Bhaduri, B.; Bright, E.; Coleman, P.; Urban, M.L. LandScan USA: A high-resolution geospatial and temporal modeling approach for population distribution and dynamics. Geojournal 2007, 69, 103–117. [Google Scholar] [CrossRef]
- Stevens, F.R.; Gaughan, A.E.; Linard, C.; Tatem, A.J. Disaggregating Census Data for Population Mapping Using Random Forests with Remotely-Sensed and Ancillary Data. PLoS ONE 2015, 10, e0107042. [Google Scholar] [CrossRef] [PubMed] [Green Version]
- Batista E Silva, F.; Freire, S.; Schiavina, M.; Rosina, K.; Marin-Herrera, M.A.; Ziemba, L.; Craglia, M.; Koomen, E.; Lavalle, C. Uncovering temporal changes in Europe’s population density patterns using a data fusion approach. Nat. Commun. 2020, 11. [Google Scholar] [CrossRef] [PubMed]
- Zheng, Z.; Zhang, G. The Prediction of Finely-Grained Spatiotemporal Relative Human Population Density Distributions in China. IEEE Access 2020, 8, 181534–181546. [Google Scholar] [CrossRef]
- Khodabandelou, G.; Gauthier, V.; Fiore, M.; El-Yacoubi, M.A. Estimation of Static and Dynamic Urban Populations with Mobile Network Metadata. IEEE Trans. Mob. Comput. 2018, 18, 2034–2047. [Google Scholar] [CrossRef]
- Deville, P.; Linard, C.; Martin, S.; Gilbert, M.; Stevens, F.R.; Gaughan, A.E.; Blondel, V.D.; Tatem, A.J. Dynamic population mapping using mobile phone data. Proc. Natl. Acad. Sci. USA 2014, 111, 15888–15893. [Google Scholar] [CrossRef] [Green Version]
- Gu, J.; Xu, P.; Pang, Z.; Chen, Y.; Ji, Y.; Chen, Z. Extracting typical occupancy data of different buildings from mobile posi-tioning data. Energ. Build. 2018, 180, 135–145. [Google Scholar]
- Panczak, R.; Charles-Edwards, E.; Corcoran, J. Estimating temporary populations: A systematic review of the empirical literature. Palgrave Commun. 2020, 6, 1–10. [Google Scholar] [CrossRef]
- Li, J.; Li, J.; Yuan, Y.; Li, G. Spatiotemporal distribution characteristics and mechanism analysis of urban population density: A case of Xi’an, Shaanxi, China. Cities 2019, 86, 62–70. [Google Scholar] [CrossRef]
- Zhang, W.; Chong, Z.; Li, X.; Nie, G. Spatial patterns and determinant factors of population flow networks in China: Analysis on Tencent Location Big Data. Cities 2020, 99, 102640. [Google Scholar] [CrossRef]
- Zhang, G.; Rui, X.; Poslad, S.; Song, X.; Fan, Y.; Wu, B. A Method for the Estimation of Finely-Grained Temporal Spatial Human Population Density Distributions Based on Cell Phone Call Detail Records. Remote Sens. 2020, 12, 2572. [Google Scholar] [CrossRef]
- Khan, W.Z.; Xiang, Y.; Aalsalem, M.Y.; Arshad, Q. Mobile Phone Sensing Systems: A Survey. IEEE Commun. Surv. Tutor. 2012, 15, 402–427. [Google Scholar] [CrossRef]
- Zhang, G.; Poslad, S.; Fan, Y.; Rui, X. Quantitative spatiotemporal impact of dynamic population density changes on the COVID-19 pandemic in China’s mainland. Geo-Spatial Inf. Sci. 2022, 1–22. [Google Scholar] [CrossRef]
- Small, C.; Pozzi, F.; Elvidge, C.D. Spatial analysis of global urban extent from DMSP-OLS night lights. Remote Sens. Environ. 2005, 96, 277–291. [Google Scholar] [CrossRef]
- Cao, X.; Hu, Y.; Zhu, X.; Shi, F.; Zhuo, L.; Chen, J. A simple self-adjusting model for correcting the blooming effects in DMSP-OLS nighttime light images. Remote Sens. Environ. 2019, 224, 401–411. [Google Scholar] [CrossRef]
- Wang, C.; Chen, Z.; Yang, C.; Li, Q.; Wu, Q.; Wu, J.; Zhang, G.; Yu, B. Analyzing parcel-level relationships between Luojia 1-01 nighttime light intensity and artificial surface features across Shanghai, China: A comparison with NPP-VIIRS data. Int. J. Appl. Earth Obs. Geoinform. 2020, 85, 101989. [Google Scholar] [CrossRef]
- Wang, L.; Fan, H.; Wang, Y. Improving population mapping using Luojia 1-01 nighttime light image and location-based social media data. Sci. Total Environ. 2020, 730, 139148. [Google Scholar] [CrossRef]
- Fan, Z.; Duan, J.; Lu, Y.; Zou, W.; Lan, W. A geographical detector study on factors influencing urban park use in Nanjing, China. Urban For. Urban Green. 2021, 59, 126996. [Google Scholar] [CrossRef]
- Zhang, S.; Zhang, W.; Wang, Y.; Zhao, X.; Song, P.; Tian, G.; Mayer, A. Comparing Human Activity Density and Green Space Supply Using the Baidu Heat Map in Zhengzhou, China. Sustainability 2020, 12, 7075. [Google Scholar] [CrossRef]
- Elvidge, C.; Zhizhin, M.; Ghosh, T.; Hsu, F.-C.; Taneja, J. Annual Time Series of Global VIIRS Nighttime Lights Derived from Monthly Averages: 2012 to 2019. Remote Sens. 2021, 13, 922. [Google Scholar] [CrossRef]
- Leyk, S.; Gaughan, A.E.; Adamo, S.B.; de Sherbinin, A.; Balk, D.; Freire, S.; Rose, A.; Stevens, F.R.; Blankespoor, B.; Frye, C.; et al. The spatial allocation of population: A review of large-scale gridded population data products and their fitness for use. Earth Syst. Sci. Data 2019, 11, 1385–1409. [Google Scholar] [CrossRef] [Green Version]
- Feng, D.; Tu, L.; Sun, Z. Research on Population Spatiotemporal Aggregation Characteristics of a Small City: A Case Study on Shehong County Based on Baidu Heat Maps. Sustainability 2019, 11, 6276. [Google Scholar] [CrossRef] [Green Version]
- Wu, C.; Ye, X.; Ren, F.; Du, Q. Check-in behaviour and spatio-temporal vibrancy: An exploratory analysis in Shenzhen, China. Cities 2018, 77, 104–116. [Google Scholar] [CrossRef]
- Anderson, T.K. Kernel density estimation and K-means clustering to profile road accident hotspots. Accid. Anal. Prev. 2009, 41, 359–364. [Google Scholar] [CrossRef] [PubMed]
- Breiman, L. Random forests. Mach. Learn. 2001, 45, 5–32. [Google Scholar] [CrossRef] [Green Version]
- Zhang, J.-H.; Chung, T.D.Y.; Oldenburg, K.R. A Simple Statistical Parameter for Use in Evaluation and Validation of High Throughput Screening Assays. SLAS Discov. Adv. Sci. Drug Discov. 1999, 4, 67–73. [Google Scholar] [CrossRef]
- Chin, K.; Huang, H.; Horn, C.; Kasanicky, I.; Weibel, R. Inferring fine-grained transport modes from mobile phone cellular signaling data. Comput. Environ. Urban Syst. 2019, 77, 101348. [Google Scholar] [CrossRef]
- Ma, Y.; Xu, W.; Zhao, X.; Li, Y. Modeling the Hourly Distribution of Population at a High Spatiotemporal Resolution Using Subway Smart Card Data: A Case Study in the Central Area of Beijing. ISPRS Int. J. Geo-Inf. 2017, 6, 128. [Google Scholar] [CrossRef] [Green Version]
- Zhu, S.; Feng, S.; Ning, X.; Zhou, Y. Analysis of China’s fight against COVID-19 from the perspective of policy tools-policy capacity. Front. Public Health 2022, 10, 951941. [Google Scholar] [CrossRef]


| Category | Datasets | Format | Time | Sources |
|---|---|---|---|---|
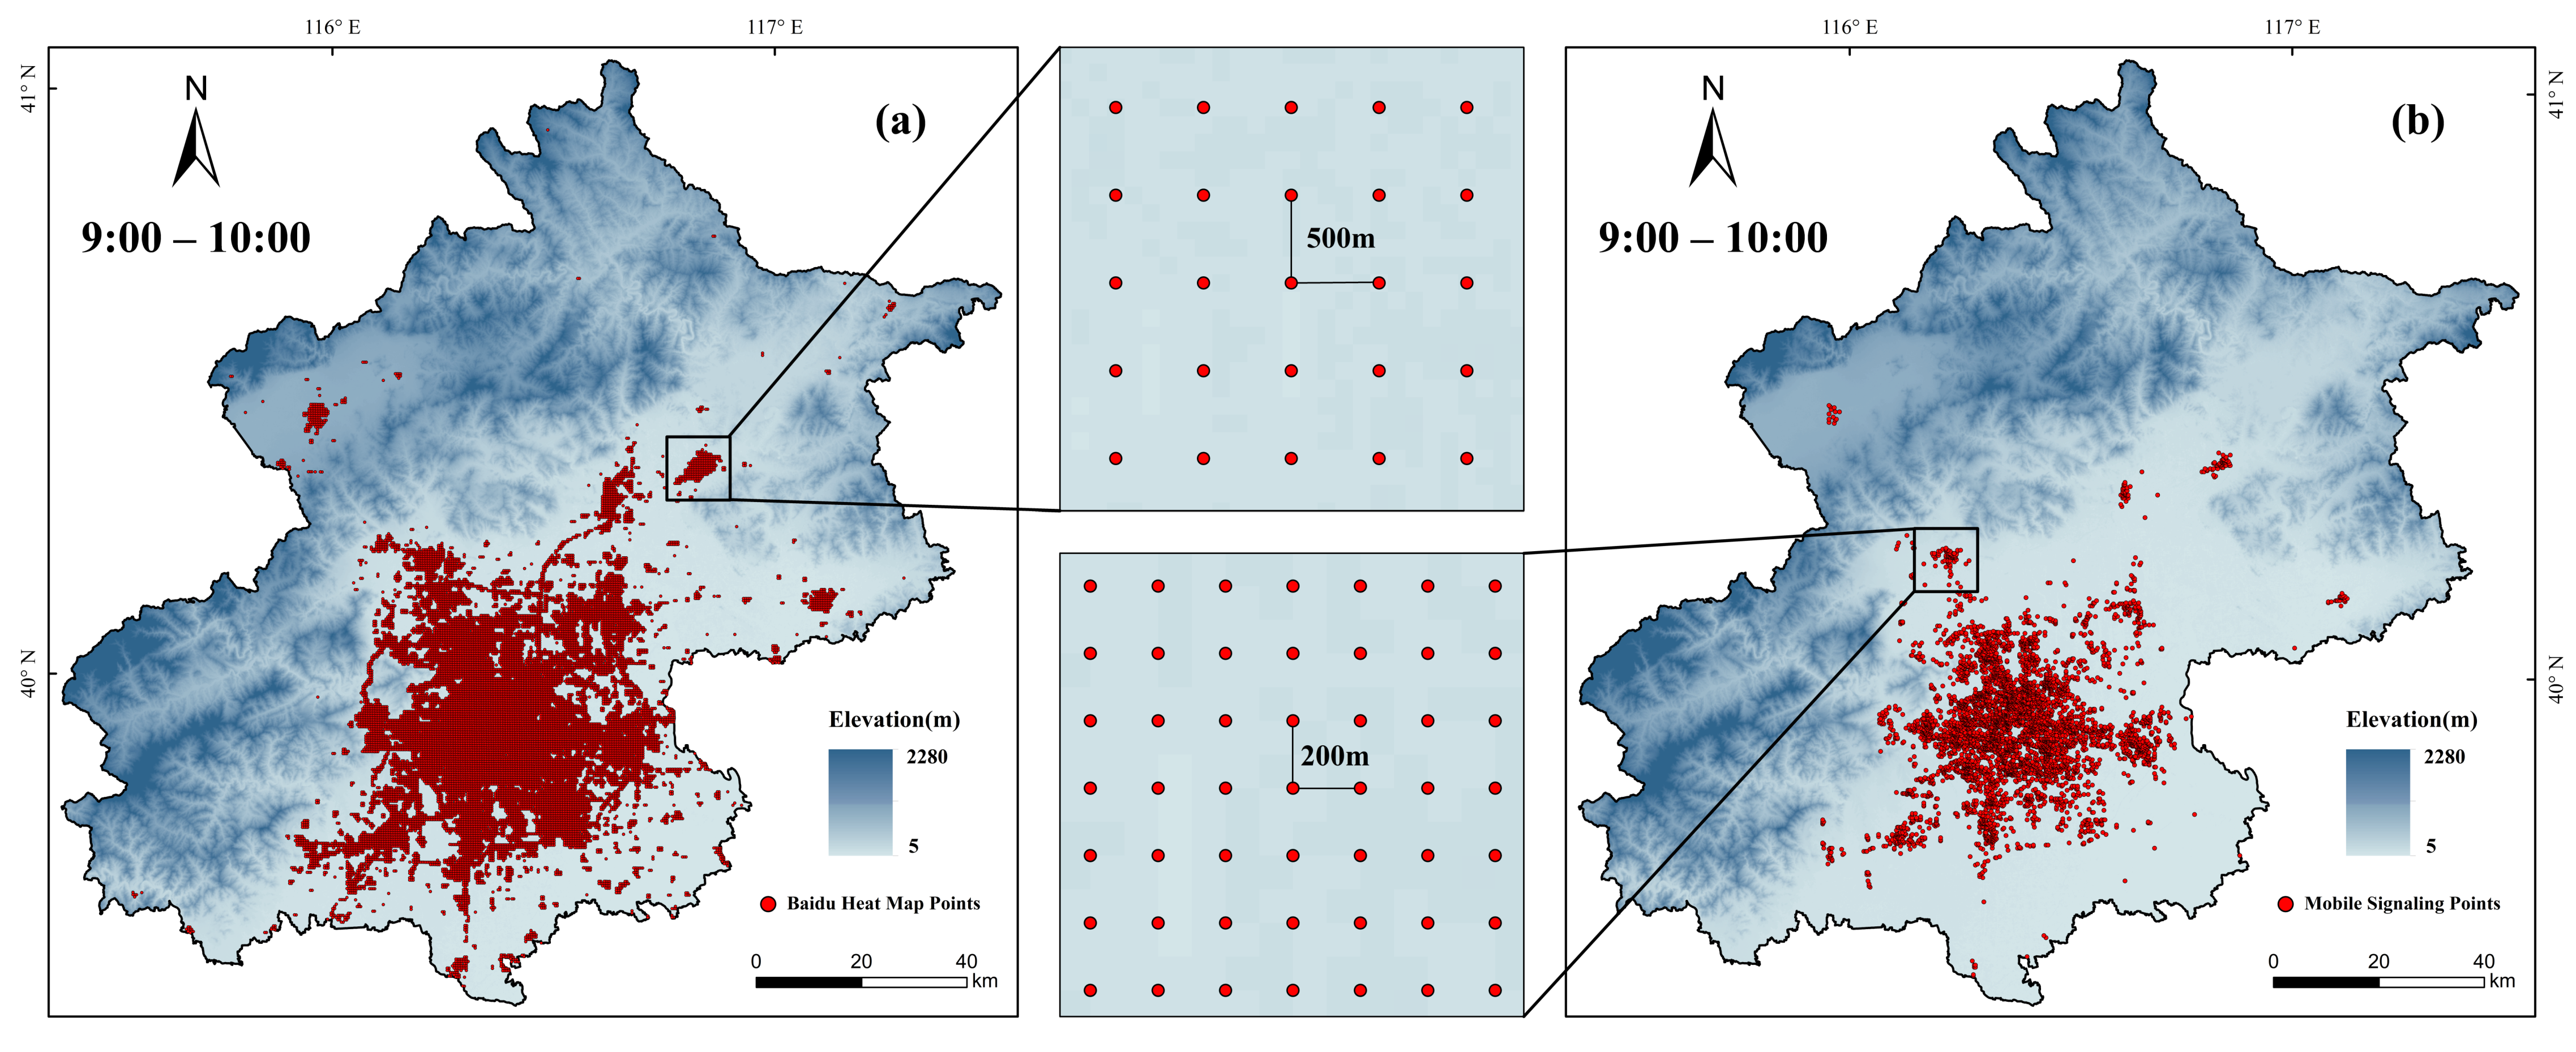
| Geospatial big data | Baidu heat map | Vector (Point) | 17 August 2022 | Baidu Map Services, China |
| Point of interest | Vector (Point) | 2020 | AMap Services, China | |
| Building volume | Vector (Polygon) | 2020 | Baidu Map Services, China | |
| Remote sensing data | Luojia 1-01 nighttime light image | Raster (130 m) | 6 September 2018 | Hubei Data and Application Center, China |
| NPP-VIIRS nighttime light image | Raster (500 m) | September 2018 | Earth Observation Group, USA | |
| Population data | Census data | Table | 2020 | Beijing Government, China |
| Ambient population | Raster (100 m) | 2020 | Bao et al. [24] | |
| Validation data | Mobile signaling | Vector (Point) | 17 August 2022 | China Mobile Operator China Unicom Operator China Telecom Operator |
| Basic geographic data | Ring roads | Vector (Polyline) | 2020 | Map World, China |
| Boundary maps | Vector (Polygon) | 2020 | Map World, China |
| Functional Category | Big Category | Mid Category |
|---|---|---|
| Office | Enterprises | All |
| Medical Service | All | |
| Daily Life Service | All | |
| Commercial House | Industrial Park and Building | |
| Finance and Insurance Service | All except ATM | |
| Science/Culture and Education Service | All except school | |
| Governmental Organization and Social Group | All | |
| Education | Science/Culture and Education Service | School |
| Recreation | Tourist Attraction | All |
| Sports and Recreation | All | |
| Residential | Commercial House | Residential Area |
| Open Space | Place Name and Address | Natural Place Name |
| Commercial | Shopping | All |
| Auto Repair | All | |
| Auto Service | All | |
| Auto Dealers | All | |
| Motorcycle Service | All | |
| Food and Beverages | All | |
| Accommodation Service | All | |
| Transportation | Road Furniture | All |
| Transportation Service | All except parking lot | |
| Place Name and Address | Transportation Place Name | |
| Unclassified | Pass Facilities | All |
| Public Facility | All | |
| Indoor facilities | All | |
| Commercial House | Commercial House Related | |
| Incidents and Events | All | |
| Transportation Service | Parking Lot | |
| Place Name and Address | All except natural place name and transportation place name | |
| Finance and Insurance Service | ATM |
| Residential Compound | Building | District | Status | Latitude (N) | Longitude (E) |
|---|---|---|---|---|---|
| Jintaichengliwan | Number 9 | Fengtai | Low-risk (Open) | 39.868516 | 116.335501 |
| Lixinjiayuannanqu | Number 1 | Fengtai | High-risk (Lockdown) | 39.871384 | 116.336488 |
| Jinbaohuayuanbeiqu | Number 8 | Shunyi | Low-risk (Open) | 40.176438 | 116.656291 |
| lunengqihaoyuanxiyuan | Number 36 | Shunyi | High-risk (Lockdown) | 40.182606 | 116.659425 |
| Bolinzaixian | Number 2 | Changping | Low-risk (Open) | 40.110905 | 116.449914 |
| Rongshangweilai | Number 1 | Changping | High-risk (Lockdown) | 40.109944 | 116.459685 |
Disclaimer/Publisher’s Note: The statements, opinions and data contained in all publications are solely those of the individual author(s) and contributor(s) and not of MDPI and/or the editor(s). MDPI and/or the editor(s) disclaim responsibility for any injury to people or property resulting from any ideas, methods, instructions or products referred to in the content. |
© 2023 by the authors. Licensee MDPI, Basel, Switzerland. This article is an open access article distributed under the terms and conditions of the Creative Commons Attribution (CC BY) license (https://creativecommons.org/licenses/by/4.0/).
Share and Cite
Bao, W.; Gong, A.; Zhang, T.; Zhao, Y.; Li, B.; Chen, S. Mapping Population Distribution with High Spatiotemporal Resolution in Beijing Using Baidu Heat Map Data. Remote Sens. 2023, 15, 458. https://doi.org/10.3390/rs15020458
Bao W, Gong A, Zhang T, Zhao Y, Li B, Chen S. Mapping Population Distribution with High Spatiotemporal Resolution in Beijing Using Baidu Heat Map Data. Remote Sensing. 2023; 15(2):458. https://doi.org/10.3390/rs15020458
Chicago/Turabian StyleBao, Wenxuan, Adu Gong, Tong Zhang, Yiran Zhao, Boyi Li, and Shuaiqiang Chen. 2023. "Mapping Population Distribution with High Spatiotemporal Resolution in Beijing Using Baidu Heat Map Data" Remote Sensing 15, no. 2: 458. https://doi.org/10.3390/rs15020458
APA StyleBao, W., Gong, A., Zhang, T., Zhao, Y., Li, B., & Chen, S. (2023). Mapping Population Distribution with High Spatiotemporal Resolution in Beijing Using Baidu Heat Map Data. Remote Sensing, 15(2), 458. https://doi.org/10.3390/rs15020458


