1. Introduction
In the age of technological innovation, information is key to development, and is a critical resource. Thus, geospatial information systems (GISs) are integral to any operator of modern engineering communications. The paradigm is similar to the central databases established at a national level [
1] to maintain highly detailed, topographic (HDTI), predefined and classified information. Engineering infrastructure operators, typically, are not limited to these requirements; however, a broad utilization of the functionality and opportunities offered by GISs is preferable. For example, planning, prediction, information collection, prioritization, operation management, and behavioral pattern modeling are used to digitalize and automate processes, thus increasing management efficiency. Digital transformation is a current strategic goal in several sectors [
2,
3].
Therefore, this study focuses on electric power systems, one of the most critical resources in any country [
4]. The scope of this research relates to the infrastructure of the medium-voltage overhead distribution power system (6–20 kV) and its inspection process automatization via the employment of digital twin and 3D modeling.
Although 3D modeling techniques are already being explored for electric power transmission networks, their employment for medium-voltage overhead distribution power systems is not covered in the literature. Several studies [
5,
6,
7] describe the modeling of the transmission network using light-detection and ranging (LiDAR) data. They highlight the importance of knowing the exact location of the transmission network elements as a prerequisite to implementing the analysis of transmission line safety under simulated operating conditions.
Business demands yearly growth in data processing intensity and quality [
8], including cyber security aspects [
9]. Being a corporate system with geo-information and infrastructure assets, the GIS is a component of IT architecture integrated with several other systems, such as customer relationship management, meter data management, and operational systems. Data flows and their comprehensive analyses allow decision-making for network management and improvements in technical strategy (see
Figure 1). GISs access data for interaction and updates. The development of digital twins offers the potential to use information from the analysis of heterogeneous data, e.g., RGB images joined with the point cloud.
New data formats such as 3D modeling or digital twin creation can help infrastructure operators identify the precise location of power system infrastructure elements in the field. Furthermore, they offer additional opportunities for process automation. For example, the verification process can involve data-driven remote analysis with reliable, accurate measurements.
The digital twin is a powerful tool and has found applications in various fields, from industrial production based on real-time IoT sensor data to organizational and business process management, without focusing solely on sensor data [
10]. The technology has great potential in engineering infrastructure management, including distribution systems, since it provides faster network inspection and anomaly-detection capabilities, more efficient asset management, and improvements in overall system safety and maintenance productivity [
11]. These can be considered the main reasons for the increase in theoretical research [
12] and practical applications of digital twins in electric power systems worldwide. Research on applying digital twins to processes in distribution network management has recently been explored, and received strong interest in various industrial applications. For example, ref. [
13] describes a concept for a network digital twin for the electrical power network in the São Paulo region, Brazil, based on four layers: a dynamic device and sensor data layer, a twin intelligence layer, a foundation layer, and a human interface layer. It applies thermal cameras, images, and point cloud data to model substations and grids. Another use case is described in [
14], which proposes a power distribution network solution based on digital 3D twin panoramic modeling. The research mentioned above shows several methods for digital twin creation and substantiates its necessity. Recent publications also use digital twin models to control the operation of substations [
15] and to assess faults and outages in distribution networks [
16,
17,
18].
This paper focuses on analyzing digital twin usage for the digitalization of the inspection process in medium-voltage distribution networks. Due to technical difficulty, this is still performed manually, including the planned and unplanned determination of the technical condition of infrastructure elements (poles, lines) and their components, as well as vegetation management. Automating the process provides opportunities to reduce infrastructure maintenance costs and raise efficiency. Moreover, climatic and location conditions sometimes result in an additional necessity for the automation of the inspection process. For example, manual access to assets is limited in the case of water-dense areas (see
Figure 2).
The potential of a 3D model for medium-voltage overhead distribution infrastructure is broad, with high data accuracy, remote analysis, simulation under given conditions, and reliable data-based results. Methods for the 3D modeling of medium-voltage overhead distribution network infrastructure are yet to be studied, and require multilateral analysis. Therefore, this study focuses on analyzing the possibilities of creating a digital twin infrastructure model and preparing information from the analysis of heterogeneous data from a GIS, as well as defining potential use cases for infrastructure management processes meeting the above requirements and facilitating the development of data use. The paper analyzes a particular digital twin application for the infrastructural inspection of a medium-voltage overhead distribution network. The analysis of the novel application concept of the digital twin is based on the Latvian medium-voltage overhead distribution network with the support of the Latvian distribution system operator “Sadales tīkls” JSC. It operates in line with the experimental studies on monitoring automatization possibilities implemented in 2022.
The paper consists of four sections. The first section substantiates the necessity to modernize the electric power system inspection process. The second section describes the properties of the electric power system and methods for its digital twin and 3D model creation for automated infrastructure inspection and monitoring purposes. The third section verifies the proposed digital twin concept based on the Latvian medium-voltage overhead distribution network and considers different use-case analyses. The fourth section presents the conclusions of this work, and provides steps for future investigations.
2. Systems and Methods
This section presents the electric power system and compares the properties of the overhead distribution network with the transmission network describing the necessity and main difficulties of automated infrastructure inspection implementation. An analysis of the requirements of the medium-voltage overhead distribution network digital twin is given, and its creation capabilities are observed. As the proposed digital twin is based on a data-driven approach that efficiently adapts the digital twin model to data mining, processing, and analysis from heterogeneous data sources, the data types and collection methods for 3D modeling are described and compared. As an example, the infrastructure of the Latvian distribution network is used.
2.1. Electric Power System
Energetics is a vast and complex sector of the national economy. The stable operation and financing of energy sector enterprises is crucial for the economy of the countries. The solution to this problem is the attraction of financial resources through bank loans and capital markets [
19]. The best modern practice is the example of the Baltic energy companies Enefit and Ignitis [
20]. The development and modernization of industry, transport, agriculture, and other sectors of the national economy is closely related to the consumption of energy resources [
21]. The electric power system is one of the most critical infrastructures in any country. In turn, energy management includes the following elements:
The generation of electric power in power plants (as finite sources) or via renewable sources (i.e., wind, geothermal, hydro, biomass, or solar power);
The transmission of power over a long distance via a transmission line;
The distribution of power to load via a distribution system.
The energy system assumes that power plants are connected to each other with power lines to ensure consumers are provided with electric power. The general scheme of the energy system is given in
Figure 3. The whole process starts with power generation. Next, the generated power is transmitted through the transmission network via overhead lines or cable lines. Latvian transmission networks primarily use 110 and 330 kV lines. After transmission through the network, substations with step-down transformers are required. The power is distributed along medium-voltage (6–20 kV) and low-voltage (0.4 kV) distribution networks and supplied to industrial consumers and households.
Supply quality requirements and standards differ and are based on the specifics and characteristics of the country [
22]. The parameters [
23,
24] of the Latvian electricity system are assembled in
Table 1. The data show that the distribution infrastructure volume (km) is much larger than the transmission network due to the large number of components.
Figure 4 shows that the dimensions of the elements (poles, spans, insulators) are smaller for the distribution network (transmission tower height—up to 100 m; distribution pole height—up to 14 m). Therefore, data collection is a more complicated process for distribution infrastructure than transmission infrastructure.
The distribution system can be divided into medium-voltage and low-voltage networks. The main applied nominal network voltages in the Latvian distribution system are 6, 10, and 20 kV for medium-voltage and 0.23, 0.4, and 1 kV for low-voltage networks. Mostly, these can be either feeding or distribution networks; however, medium voltage is exploited for power distribution in the last stage of power supply to the end user. Medium-voltage networks include power distribution lines and transformer substations.
One of the core processes for the management of the distribution systems’ infrastructure is inspection, i.e., regularly determining the technical condition of infrastructure elements to detect and record deviations from technical regulatory requirements. The inspection process identifies defects in network elements resulting from external factors (storms, mechanical damage by animals or other objects, etc.). Infrastructure defects can be classified into several types: visual defects of infrastructure elements (wire damage, insulator damage, protection zone violations, etc.) and geometrical defects (distance of the wires in the pole between the lines of different circuits, pole leaning at a vertical axis, etc.). Another critical network management process is vegetation management in protection zones, i.e., determining vegetation volume on the line track (e.g., existence of vegetation on the line corridor, minimum distance between greenery and line wire in the line span), or dangerous tree identification outside the corridor.
2.2. Digital Twin of Distribution Network
Creating a digital twin of the overhead line infrastructure can radically transform the network management processes [
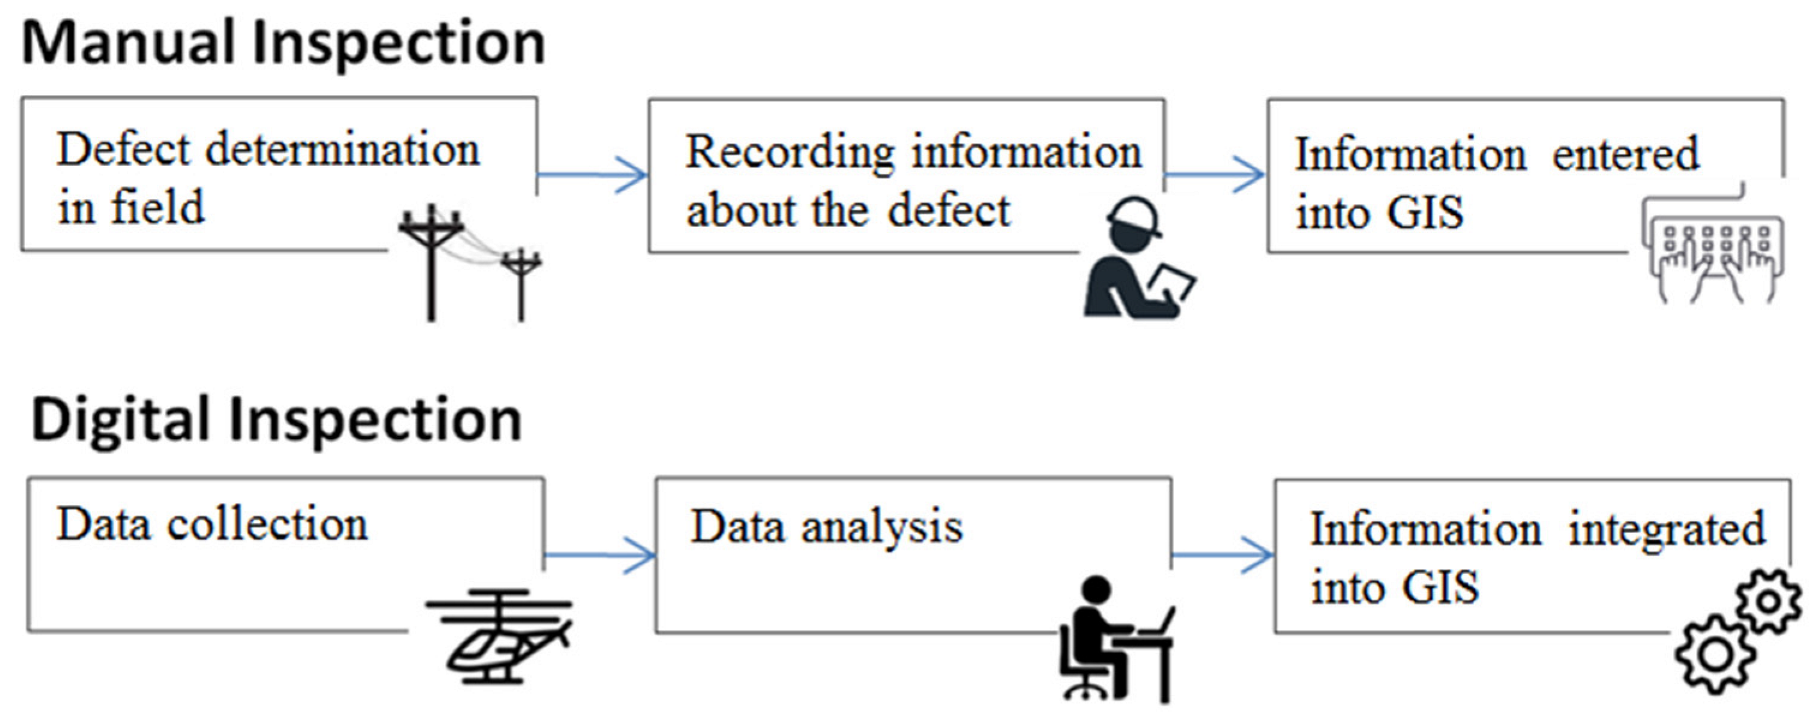
25]. Establishing the digital twin involves data collection and analysis, and results in automated data-driven medium-voltage overhead infrastructure inspection.
Figure 5 shows the transition from traditional inspection in the field and the recording of human-identified defects (with the possibility of subjectivity) to fully remote data analysis. The updated approach improves the accuracy and reliability of defect detection and identification. At the same time, it reduces the duration of the inspection process and manages the issues of human resource shortages and transport costs.
The term digital twin was first introduced by American computer scientist, artist, and writer, D. H. Gelernter, in 1991/1992 [
26]. The idea of a digital twin in the context of practical application was first presented by M. Grieves in 2002 at the University of Michigan to create a product life cycle management center [
27]. In 2012, the National Aeronautics and Space Administration proposed the idea of a simulation-assisted digital twin [
28], which significantly increased the focus on the concept. As a result, the digital twin is one of the leading technological trends in the world today [
29].
Despite the growing popularity and importance of the concept of the digital twin, the term still has various understandings, interpretations, and definitions, ranging from abstract and vague, such as “a set of virtual information constructs that fully describes a potential or actual physical manufactured product from the micro atomic level to the macro geometrical level” [
27] or “digital representation, sufficient to meet the requirements of a set of use cases” [
30], to solution-oriented concepts, e.g., the “digital representation of physical individuals as well as of virtual entities in an information framework that interconnects traditionally separated elements and provides an integrated view throughout life cycles” [
31]. However, despite the variety of interpretations, a common feature of digital twins is the fact that they are dynamic digital replications of physical assets that aim to support decision-making in a complex environment to reduce costs, ensure sustainability, prevent problems, and create business value. In this context, the digital twin can be defined “as a dynamic virtual representation of a physical object or system across its life cycle, using real-time data to enable understanding, learning, and reasoning” [
32].
In the original product life cycle management-oriented approach, the digital twin contained three parts [
33]:
A physical entity in real space;
A virtual entity in virtual space;
Connections of data and information tying the virtual and physical entities together.
However, the most recent concept of the digital twin contains five dimensions: the scope of the physical entity, the features of the physical entity, the form of data communication, the scope of the virtual entity, and user-specific output/value creation [
34].
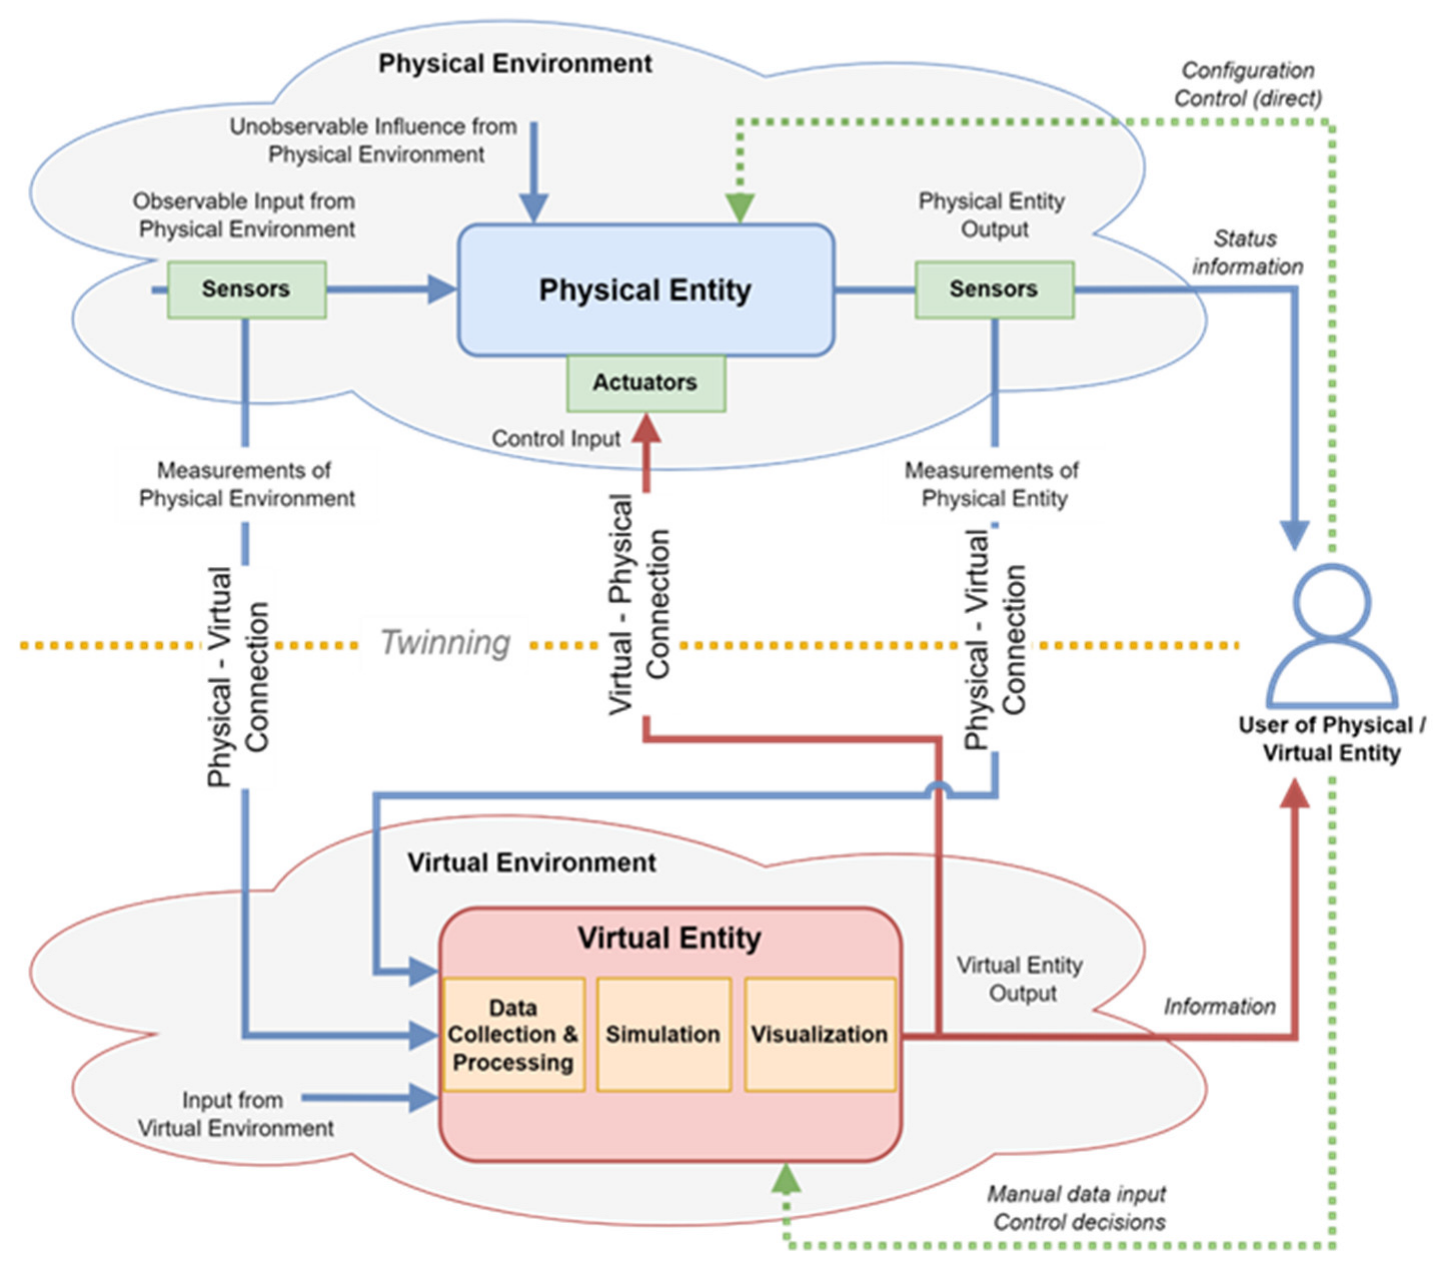
As shown in
Figure 6, the digital twin is formally organized as a digitally mirrored representation of a real-life physical environment. According to [
35], the digital twin concept is based on the interaction of physical and virtual entities in physical and virtual environments through physical–virtual and virtual–physical connections. This comprises the ‘twinning’, i.e., exchanging data between a virtual and physical counterpart. A digital twin can contain a single couple of physical and virtual entities, or multiple physical entities with corresponding virtual representations. In [
36], the real twin system and digital twin system represent a collection of physical and virtual entities. The primary components of virtual entities ensuring the functionality and accuracy of digital twins are data collection and processing, simulation, and visualization.
The present research is devoted to data collection and analysis as a part of the implementation of the digital twin concept. The automatic data collection and analysis are based on hardware equipment such as LiDAR, optical devices (visual/thermal cameras), and multimodal data-acquisition tools. These tools and methods aim to build 2D and 3D image representations and gather digital information on power distribution network assets. Appropriate transport vehicles or platforms (e.g., terrestrial, airborne, or mobile solutions) should provide the necessary mobility and accuracy for field measurements. The data collection and analysis processes require integration with a GIS and 3D modeling system, which are the pillars for creating a digital twin model of a power distribution network [
37]. The 3D modeling platform, in conjunction with the GIS, allows the storage and processing of the collected data from sensor hardware and provides interactive visualization and analytics capabilities. The monitoring parameters and types of damage are defined to perform efficient monitoring and management. The number of defects and the degree of priority of elimination are determined internally by the distribution system operator, depending on the established quality and safety indicators. Some examples of critical defects are mechanically damaged poles (see
Figure 7), geometric deviations from the technical regulatory requirements (see
Figure 8), and violations of infrastructure protection zones, i.e., the detection of objects below the lines (see
Figure 9).
A part of the abovementioned is accomplished by visual inspection, possible both in the field and by reviewing images of applicable quality. Measurements are required in several dimensions (distances, height, pole angles to the ground, etc.). The task is implementable by applying a precise 3D model. Thus, using several data formats (RGB images, LiDAR data, etc.), one can digitally duplicate infrastructure parameters, i.e., create a digital twin and replace the annual infrastructure inspection with a remote sensing method. Combining different formats of collected data as well as processing analysis and visualization into business information should be performed in conjunction with data-collection methods and their integration into the existing management system, providing higher automatization capabilities (see
Figure 10).
Concluding the application overview, the proposed digital twin focuses on data-driven modeling and thus requires data collection and analysis. The approach efficiently adapts the digital twin model to data mining, processing, and analysis from heterogeneous data sources. As a result, it is possible to minimize the need for expert knowledge when formulating corresponding digital twin models.
2.3. Types of 3D Modeling
A digital twin is impossible without the visualization of a 3D model of the object. A virtual digital twin allows us to monitor, predict and control the state and behavior of objects in real life if we know the parameters of the objects’ characteristics and the influencing environmental area.
In the current study, two of the most promising types of 3D modeling—aerial scanning data (creating a 3D model based on point cloud processing) and photogrammetry (creating a 3D model based on photo processing)—were used for comparison to identify the most economically advantageous application. The general tasks for creating a 3D model for a medium-voltage overhead infrastructure are as follows:
High measurement accuracy (as already mentioned in
Section 2.1, the dimensions of the elements of the distribution network are much smaller than those of the transmission network);
High degree of automation of the measurement process and the associated objectivity of their results;
High performance (measuring images of objects is a less time-consuming task than measuring a real object in the field);
The possibility of remote measurements in conditions where inspection in the field is unsafe for humans.
2.3.1. Aerial Laser-Scanning Data
Aerial laser-scanning data allow one to obtain a point cloud from lasers. A set of data points are defined in a particular coordinate system, establishing the shape of a real or created physical system. Point clouds are used to create 3D meshes and other models for 3D modeling. These are typically formed by 3D scanners that measure many points on the outer surfaces of surrounding objects. Points are collected using LiDAR sensors.
The pulse mode and continuous wave emission are the two main laser operation modes for determining distance during aerial laser scanning.
The pulse mode of laser operation is characterized by short-pulse (9–10 s) and high-pulse (several kilohertz) repetition rates. The time elapsed since the sending and receiving of the reflected light pulse is measured. Distance to the point on the surface of the object can thus be expressed as:
where
c is the speed of light and
t is the total travel time of the light path to and from the point of reflection.
Continuous-wave-emitting lasers measure the phase shift
φ between the emitted and received waves. The time of the passage of the light wave to the object can be expressed as:
where
is the phase shift and
T is the period of the laser light wave [
38].
There are many methods for converting a point cloud to a 3D model. One of the essential applications of point clouds is the development of digital twins from LiDAR data. In addition to the point coordinates, the system also stores auxiliary information. The following attributes are recorded and stored for each laser pulse: intensity, number of reflections, number of returns, point classification values, flight line endpoints, RGB values, GPS time, scan angle, and direction. Model construction requires the following steps:
Data collection (georeferencing);
Data processing (filtering, classification, rendering);
Data analysis (with the outcomes of the 3D model (
Figure 11) and vegetation requirements).
The main advantages of aerial laser scanning data processing are as follows:
Three-dimensional model creation capability;
Remote geometrical measurements for poles, spans and cables;
Capability of object classification;
Data-based results without human-performed measurements in the field.
2.3.2. Photogrammetry
Photogrammetry is a collection of measurements of physical objects through the analysis of photographic images. It is a coordinated 3D measurement method using photography as the primary metrology. Multiple lines of sight are created in each camera relative to points on the subject (see
Figure 12) when shooting from at least two separate locations. These lines of sight are mathematically fixed to form the 3D point coordinates.
Figure 13 shows the principles of oblique photogrammetry, with software processes and link images taken of the same object from different angles (also called stereo images) [
39].
The main advantages of the photogrammetry method are as follows:
Three-dimensional model creation capability;
Remote geometrical measurements for poles and spans;
Data-based results without human-performed measurements in the field.
Within the study framework, a 3D model of a fragment of the distribution network of the overhead line was created using the photogrammetry method described above.
Figure 14 shows the processing result (data collected by DJI Mavic air 2 drone).
3. Analysis of Inspection Use Cases
This study is devoted to the needs of medium-voltage overhead infrastructure, which can be satisfied and effectively covered by the application of a digital twin. This section summarizes potential data-driven remote sensing application scenarios with the example of the Latvian medium-voltage overhead infrastructure with experimental verification. It discusses geometrical parameter measurements, visual defect identification, vegetation management, and unplanned infrastructure inspection in a state of emergency (post-storm).
The integration of the inspection process in the network management cycle is shown in
Figure 15. The quality and operability of the inspection results particularly impact such network management processes as network planning. The data-based inspection allows for accurate decisions on field operations (e.g., completely reconstructing the object or repairing elements).
3.1. Geometrical Parameter Measurements
One of the benefits of 3D modeling is the ability to use digital geometrical measurements (
Figure 16). This feature has several use cases:
High accuracy: It is important to note that accuracy depends on several factors, e.g., the calibration parameters of LiDAR system components. For example, according to technical specifications, RIEGL miniVUX-1UAV laser scanner accuracy is ±15 mm [
40], and Livox AVIA laser accuracy is ±2 cm [
41]. Point density, flight parameters, and data processing methods are also important, as is the location of the point objects (essential since the exact locations of network assets are not always precisely known).
Horizontal distance between point objects (infrastructure objects, for example, poles).
Vertical distance to infrastructure facilities, e.g., measurements of cable dimensions (height of pole above the ground, lowest point to the ground in each span, etc.).
Pole lean analysis to detect critical pole axis deviation from normal to the ground.
Figure 17 shows the field measurement process that requires the presence of an expert (with expenses related to wage, transport, and measurement device amortization). This process can be replaced with a measurement in the digital environment by applying a point cloud. The approach allows the automatic start of a regular procedure based on predefined algorithms, establishing the ability to identify out-of-norm areas automatically.
Methods for analyzing LiDAR data can be developed and expanded. One of the directions is automatic procedures for identifying infrastructure inconsistencies based on developed algorithms that provide a ready-made report with element identifiers, a given priority, and a description of the defect.
Figure 18 represents the analysis steps of geometrical parameter measurements. With the aid of data-based inspection and analysis, geometric deviations for infrastructure elements are determined. The machine learning algorithms are applied for classification tasks and geometrical defect identification based on sets of norms.
3.2. Visual Defect Identification
As mentioned in
Section 2.2, the digital twin of the distribution operator’s infrastructure is a complex solution providing data in different format for analysis. High-resolution RGB image collection of infrastructure elements with geo-location information will bring additional value for the business, for example, by determining the visual technical condition of the infrastructure elements. Potential development directions for the use of RGB images include (see
Figure 19):
Recognition of the specific infrastructure asset (power line poles, wires, insulators, stubs, etc.);
Identification of element damage or defect (damaged insulators, damaged stubs, damaged hook bond, existence of stork nests on power line poles, etc.).
The steps for detecting visual defects are recognizing an infrastructure element and concluding defect compliance with the predefined defect catalog.
Figure 20 shows the visual defect identification workflow for an infrastructure element. Automatic defect identification is performed with the aid of machine learning algorithms. The collection of images of infrastructure elements and their defects accumulated during numerous manual inspections is the basis for neural network learning.
3.3. Vegetation Management
The 3D modeling of medium-voltage infrastructure is applicable for vegetation management and overhead infrastructure growth control (see
Figure 21). This is a mandatory maintenance activity for this form of infrastructure undertaken to protect objects from unwanted external effects and ensure their safe operation. The width of the protection zone and track width are determined by state regulatory documents [
42].
The vegetation in the corridor of the designated zone is removed to prevent damage to the network infrastructure elements. Using LiDAR data or photogrammetric data analysis (
Figure 22), it is possible to:
Determine the height of trees/shrubs below the line;
Determine the area of forest in the landfills of the network protection zone;
Predict the growth rate, since the provided accuracy of LiDAR data allows the operator to identify distinct tree species (e.g., birch, pine, etc.).
However, research still needs to resolve the issue of how to identify so-called ‘dangerous trees’ outside the protection zone, for example, trees that are strongly bent to one side or withered, from the data of the 3D network model.
This method will make it possible to determine the volume of vegetation in protection zone areas and to detect other violations in the protection zone, as shown in
Figure 23.
Figure 24 shows the workflow of managing the level of vegetation in the protection zones of overhead infrastructure and identifying risk areas where it is necessary to clean the track.
3.4. Unplanned (Emergency) Network Infrastructure Inspection
The condition where the number of outages in the network exceeds the specified limit is commonly known as a mass outage in the maintenance of the electrical system. In Latvia, this usually occurs due to climatic conditions, for example, after strong storms (
Figure 25), and requires a quick assessment of the situation and prompt repair. Photogrammetry data, obtained using drones or helicopters, or from ordering data from space satellites, help us to understand the problem quickly and identify all dangerous places. Predefined algorithms (comparing the position of a network element with updated information in the GIS) must identify any critical damage to the infrastructure.
Figure 26 shows the workflow of the post-storm infrastructure monitoring. Recognizing changes and defects is performed by comparing images collected before and after high risk accidents such as natural disasters. The analysis method appeared efficient for the operational monitoring of risk areas in emergency situations (infrastructure control after a storm).
4. Conclusions
This article has proposed the novel concept of digital twin application for medium-voltage overhead distribution network inspection. The aspects, properties, and requirements of digital twin application have been investigated and analyzed. Main-use cases and digital twin employment for their realization have been studied. As a result, the proposed digital twin concept consists of several layers, as shown in
Figure 27. The following aspects should be considered during digital twin development for medium-voltage overhead distribution network inspection:
Data-collection transport depends on the amount of data and the speed of data collection, e.g., for massive volumes of infrastructure elements (e.g., an overhead line length of 250 km) it is convenient to use larger-capacity tools, such as helicopters or drones;
Data-collection equipment (sensors, cameras);
Data-processing software with the support of industry-employed data formats;
Data extraction (data conversion into information);
GIS integration of base data (assets) to import and supply the required information.
The effective combination of each aspect of the technical solution provides:
The automatic detection of specific defects (in cases of anomalies from standard measurements);
A corridor of power line cleaning control and vegetation management;
Remote analysis of infrastructure changes after an emergency event (for example, post-storm).
However, network inspection is a complex process. The 3D modeling method does not cover the needs of the process entirely; for example, it cannot replicate the visual inspection of each element of the infrastructure or rot detection on wooden poles. Attention should be paid to these aspects to perform the inspection with a combination of methods without losing the overall quality.
This research has shown that the digital twin for medium-voltage overhead distribution network inspection employing heterogeneous datasets, such as RGB images and point clouds, has the potential to be successfully implemented. Data can be collected in different ways, e.g., walking with sensors, using drones or helicopters, or taking data from satellites. Therefore, a future step would be to compare the advantages and disadvantages of each data-collection method to estimate the risks and find an economically optimal strategy to move from the traditional manual inspection process to remote sensing, including evaluation of such parameters as inspection time and quality of results. A focus on machine learning techniques should be explored as a possible future research direction.
The study of digital twin technology shows potential applications in the data-based remote management of engineering infrastructure. The obtained results show that the use of digital twin technology is expected to play an increasing role in the power management and distribution sector in the future. However, the effective use of this technology requires additional work and improvements in the quality and accuracy of data measurement, processing, analysis methods, and tools in integrated digital twin frameworks.


 ,
, 


