Article

Lithium-Bearing Pegmatite Identification, Based on Spectral Analysis and Machine Learning: A Case Study of the Dahongliutan Area, NW China

1
State Key Laboratory of Desert and Oasis Ecology, Xinjiang Institute of Ecology and Geography, Chinese Academy of Sciences, Urumqi 830011, China
2
Xinjiang Key Laboratory of Mineral Resources and Digital Geology, Urumqi 830011, China
3
Xinjiang Research Center for Mineral Resources, Chinese Academy of Sciences, Urumqi 830011, China
4
University of Chinese Academy of Sciences, Beijing 100049, China
5
Geological Survey Academy of Xinjiang, Urumqi 830000, China
*
Author to whom correspondence should be addressed.
Remote Sens. 2023, 15(2), 493; https://doi.org/10.3390/rs15020493
Submission received: 12 November 2022 / Revised: 10 January 2023 / Accepted: 11 January 2023 / Published: 13 January 2023
(This article belongs to the Section Remote Sensing in Geology, Geomorphology and Hydrology)

Abstract

:
Lithium (Li) resources are widely used in many strategic emerging fields; recently, several large-scale to super-large-scale pegmatite-type lithium deposits have been discovered in Dahongliutan, NW China. However, the natural environmental conditions in the Dahongliutan area are extremely harsh; hence, manpower in field exploration is difficult to achieve. Efficient and rapid methods for identifying Li-rich pegmatites, based on hyperspectral remote sensing technology, have great potential for promoting the discovery of lithium resources. Ground spectral research is the cornerstone of regional hyperspectral imaging (HSI) for geological mapping. Direct observation and analysis by the naked eye are part of a process that is mainly dependent upon abundant experience and knowledge from experts. Machine learning (ML) technology has the advantages of automatic feature extraction and relationship characterization. Therefore, identifying the spectral features of Li-rich pegmatite via ML can accurately and efficiently distinguish the spectral characteristics of Li-rich pegmatites and Li-poor pegmatites, enabling further excavation to identify the strongest predictors of Li-pegmatite and laying a foundation for the accurate extraction of Li-rich pegmatites in the West Kunlun region using HSI. The spectral characteristics of pegmatite in the visible near-infrared and shortwave infrared (VNIR–SWIR) spectra were observed and analyzed. Li-rich pegmatite was identified based on the diagnostic spectral waveform characteristic parameters of the local wavelength range. The results demonstrated that the pegmatite ML recognition model was based on spectral characteristic parameters of the local wavelength range, with good model explicability, and the area under the curve (AUC) calculated for the model is 0.843. A recognition model based on full-range spectrum data achieved a higher precision, and the AUC value was up to 0.977. The evaluation of the Gini coefficient presented the strongest predictors, which were used to map the spatial distribution lithology, based on GF-5, in Akesayi and the 509 mines, producing encouraging lithological mapping results (Kappa > 0.9, OA > 94%).

Graphical Abstract

1. Introduction

The elemental metal, lithium, and its compounds have the advantages of low density, strong corrosion resistance, and fatigue resistance, making them basic raw materials for different resources, such as light alloys, atomic reactors, and lithium batteries. With the rise of strategic emerging industries, such as aerospace, and its use in nuclear and new forms of energy, the demand for lithium increases with each passing day, which further highlights its use [1,2,3]. Therefore, there has been an increase in the exploration of lithium resources and research on accessing lithium resources. In recent years, the Dahongliutan large-scale pegmatite-type Li-Be (Nb, Ta) deposit, Bailongshan Li-Rb granitic pegmatite deposit, 507 pegmatitic lithium deposit, Aksayi pegmatite-type Li deposit, 509 pegmatite-type Li deposit, and Fulugou medium-sized Li-Rb polymetallic deposit have been found in the West Kunlun-Karakorum area of Xinjiang. Lithium is expected to become a new rare metal reserve in China and has attracted extensive attention from all circles of society [4,5,6].
However, it is extremely difficult to perform field explorations in these regions because of the high altitude, thin oxygen layer, high temperature variations between day and night, strong terrain cutting, poor infrastructure, and inconvenient transportation in the Dahongliutan area of West Kunlun. In addition, geophysical exploration shows that granite pegmatites are characterized by medium–high magnetic susceptibility, low density, low-gravity anomaly, high resistivity, and little in the way of physical property differences from the surrounding rock [7]. This means that it is difficult to distinguish ore bodies from the surrounding rocks using geophysical methods. Moreover, geochemical exploration is costly, time-consuming, and inefficient [8]. Considering these problems, remote sensing models for pegmatite identification should be developed. With the rapid development of satellite sensor technology and satellite platforms [9,10], more than 5000 satellites have been launched around the world, sending back massive amounts of remote sensing data with high spatial, temporal, and spectral resolutions. This facilitates the application of remote sensing technology for the identification of mineral resources and provides the advantages of convenient data acquisition, high efficiency, wide identification range, and reduced demand for manpower and financial resources [11,12]. Therefore, hyperspectral imaging has become an important tool for regional mineral resource exploration [13,14]. Ground spectrum measurement technology is the cornerstone of regional satellite remote sensing surveys [15,16]. The regional investigation is inseparable from lithological investigation and identification. Rocks are composed of different minerals, at different levels, forming different spectral characteristics. Large rock and mineral spectral libraries, such as United States Geological Survey (USGS) [17], ECOsystem Spaceborne Thermal Radiometer Experiment on Space Station (ECOSTRESS) [18], and Jet Propulsion Laboratory (JPL), have previously been established. In comparison, regional lithologic mapping based on the locally measured lithologic spectrum is superior to mapping with standard libraries [19], especially in West Kunlun, where the tectonic location is unusual, magmatic activity is intense, and rock metamorphism and weathering are serious [20], and the spectrum of actual rock and ore is quite different from that in the standard library [21]. Therefore, summarizing and extracting the specific characteristics of the lithology in the study area can improve the accuracy of regional lithology identification via remote sensing [21]. Existing methods for identifying rocks and minerals can be divided into local diagnostic spectral feature parameters [22] and full spectral reflectance features [23,24,25]. The mineral structure and composition show subtle changes in position in terms of the spectral feature parameters of absorption, including an absorption spectrum curve change such as depth. Therefore, the former is more sensitive to subtle differences in the mineral spectrum, and only the use of certain forms of identification is diagnostic, such as the full width at half maximum (FWHM), absorption position, absorption depth, absorption area, and degree of asymmetry. It is significantly affected by uncertain factors, such as the signal-to-noise ratio and spectral reconstruction accuracy. The latter is simple and is less affected by illumination and spectral reconstruction accuracy, but it is difficult to distinguish subtle differences in rock spectra, and the calculation cost is high in the case of a large data volume [25].
Pegmatite-type lithium deposits mainly occur in the form of Li2O in spodumene, a single-chain silicate mineral [26]. The molecular vibration and fundamental frequency of spodumene, an anhydrous and hydroxyl-free silicate mineral, is characterized by its absorption in the TIR (thermal infrared spectrum (8–14 µm)) [27]. Some researchers have studied the spectral characteristics of spodumene, based on spectral data in the thermal infrared range, and found that the characteristic absorption peaks of spodumene were located at 9.155 µm, 9.39 µm, 11.67 µm, etc. [28,29]. Compared with VNIR–SWIR, TIR image data is rarely used, but these datasets are critical for the exploration of pegmatite-type lithium deposits. There have been successful applications of Li-bearing and related granite mapping, using Landsat-8 and ASTER’s TIR [6,30,31,32,33,34]. The spectral characteristics of the VNIR region (0.38–1.1 µm) are mainly caused by the vibration of transition metal cations (such as Fe, Mn, and Cu), while the SWIR region (1.1–2.5 µm) mainly reflects hydroxyl, carbonate, and water molecules. However, spodumene crystals do not contain structural water and exhibit no direct absorption characteristics in VNIR–SWIR. Altered minerals generally have chemical bonds, such as hydroxyl and carbonate, and the absorption band in the VNIR spectrum is significant and common. Mineralized rocks have different degrees of alteration, and minerals of different origins have different types of alteration. All the different types of alteration in minerals are indicators of numerous ore deposits and are important links in remote sensing-based geological prospecting. The enrichment of rare metals is affected by the metasomatism of albitite; moreover, silicification, chloritization, epidotization, and other alterations in the surrounding rocks easily occur, and these can be used as an indirect indicator of pegmatite-type lithium deposits. Domestic and foreign scholars have also carried out research on the spectral characteristics of pegmatite-type lithium ore in different areas in the VNIR–SWIR range. According to Zhang’s research in 2008, the VNIR–SWIR spectral characteristics of tourmaline in different sub-zones of pegmatite-type lithium ore, seen in the Koktokay No. 3 vein, correspond well with the evolution process of magmatic-hydrothermal processes [35]. Dai et al. [36] conducted a spectral analysis of the typical minerals in the Jiajika pegmatite-type lithium ore. The results showed that the absorption characteristics of pegmatites containing spodumene and Li-poor pegmatites are different at 1413 nm, 1911 nm, and 2200 nm. Other scholars have studied the Dahongliutan pegmatite lithium deposit in West Kunlun and found first-order absorption wavelengths of Li-rich pegmatite at 1413 nm, 1911 nm, and 2200 nm. The secondary absorption wavelength of 2350 nm has reflective characteristics at 560–760 nm. The absorption of Li-poor pegmatites is significant at 2350 nm [6]. Morsli et al. [33] collected pegmatite spectra in the Angarf region in 2021 and found absorption wavelengths at 900 nm, 1400 nm, 1900 nm, 2200 nm, 2350 nm, and 2450 nm. Based on this finding, pegmatite was searched for using ASTER. Cardoso-Fernandes et al. studied the spodumene-related absorption characteristics of Fregeneda–Almendra pegmatite-type lithium ore in the vicinity of 1412, 1913, and 2205 nm, with the secondary absorption in the vicinity of 2352 nm and 2440 nm [31,37]. The aforementioned studies suggested that the SWIR spectral characteristics of pegmatite are mainly located near 1413 nm, 1911 nm, 2200 nm, 2350 nm, and 2450 nm, while the absorption depth at 1911 nm has a significant positive correlation with the lithium content of pegmatite and has a drift at 2200 nm. The existing pegmatite-type lithium ore is mainly based on the study of spectral characteristics in the range of VNIR-SWIR; studies using ML to evaluate the capacity of the selected features to discriminate Li-rich pegmatite [38] are still scarce.
Accordingly, this study aims at: (i) exploring the difference in waveform parameters between Li-rich pegmatite and Li-poor pegmatite in the Dahongliutan area and evaluating the effect of quantitative waveform parameters on the identification of Li-rich pegmatite and Li-poor pegmatite; (ii) choosing the best strategy for the automatic identification of Li-rich pegmatite using full-range wavelength spectral reflectance, without the precondition of expert knowledge; (iii) identifying key factors to influence spectral model generalization and mapping identification predictors, based on GF-5 AHSI hyperspectral data, and effectively using them to map the spatial distribution of Li-rich pegmatite and other related lithological strata in mines. In this study, granitic pegmatites containing spodumene and granitic Li-poor pegmatites were collected from the Dahongliutan area, West Kunlun. Li-rich pegmatites and Li-poor pegmatites were identified via thin-section microscopy, then the VNIR–SWIR spectroscopy curves were analyzed. First, pegmatites were identified based on the characteristic parameters of local spectral diagnosis and absorption; the spectral data that were pre-processed by the SG filter were removed for continuum removal, and an interval with characteristic absorption was selected, based on previous studies and actual observations. Five parameters, namely, the characteristic wavelength position, depth, full width at half-maximum, area, and asymmetry in the corresponding interval were extracted to form the spectral characteristic parameter set. The differences and rules of the location characteristic index of Li-rich pegmatites and Li-poor pegmatites in the characteristic absorption band were analyzed. Next, pegmatites were identified based on the absorption band of full spectral reflectance characteristics, and continuum removal spectra and first derivative transform were carried out to select the best spectral resolution. From a classification point of view, two-feature selection methods, the least angular regression (LARS), and the genetic algorithm (GA) were used to select the spectral feature subset, and six band-feature subsets were formed. The dataset obtained in the above two methods was divided into a training set and a test set at a ratio of 3:1. Data enhancement was performed, based on principal component analysis, to expand the number of training set samples and compare the changes in recognition accuracy before and after data enhancement. Next, the expanded training data and spectral characteristic parameter sets were input into the random forest model to carry out identification research into Li-rich pegmatite and Li-poor pegmatite. The grid search method was used to select the best parameters, then the identification results of the Li-rich pegmatite were evaluated using receiver operating characteristics (ROC). The Gini coefficient was used to evaluate the importance of the strongest predictors in the model with optimal parameter training. Using remote sensing image data, machine learning, statistical analysis, and intelligent processing technologies to mine the potential spectral recognition features of pegmatites, improve the automatic classification accuracy of pegmatite spectral features, and lay the foundation for the subsequent extraction of Li-rich pegmatite, will enable the large-area exploration of lithium resources in West Kunlun.

2. Materials and Methods

2.1. Sample Collection and Spectral Measurement

The study area is located in the West Kunlun-Karakorum Dahongliutan region, bordering the Tarim basin in the north, bounded by the Kangxiwa thrust-slip fault in the east-west direction, the plateau in the south, and the Dahongliutan–Guozhacuo fault in the west-southeast direction in the north (Figure 1). In the Late Triassic period, the area entered the tectonic evolution stage of intra-continental collision orogeny, and the Tianshuihai terranes were in an extensional environment. Partial melting of the Precambrian metamorphic basement formed a magmatic melt of the biotite granitic body [39]. The magma melt of the biotite granite upwelled along the fault, and the strata of the Triassic Bayankala Formation partially melted to form a melt of two-mica monzonite and muscovite granite, with the evolution of granite melt-differentiated pegmatite magma. When the magma chamber reaches homogenization, crystals begin to precipitate; the minor metals and volatiles are incompatible elements that are enriched in the residual melt. After continuous fractionation of the residual melt/fluid, the water-rich residual magma, which is enriched with minor metals, such as Li and Be, crystallizes to form lithium beryllium granitic pegmatite [40]. Spatially, the mineralogical zonation is evident, and the Li-rich pegmatite is related to the relative distance of the rock mass.
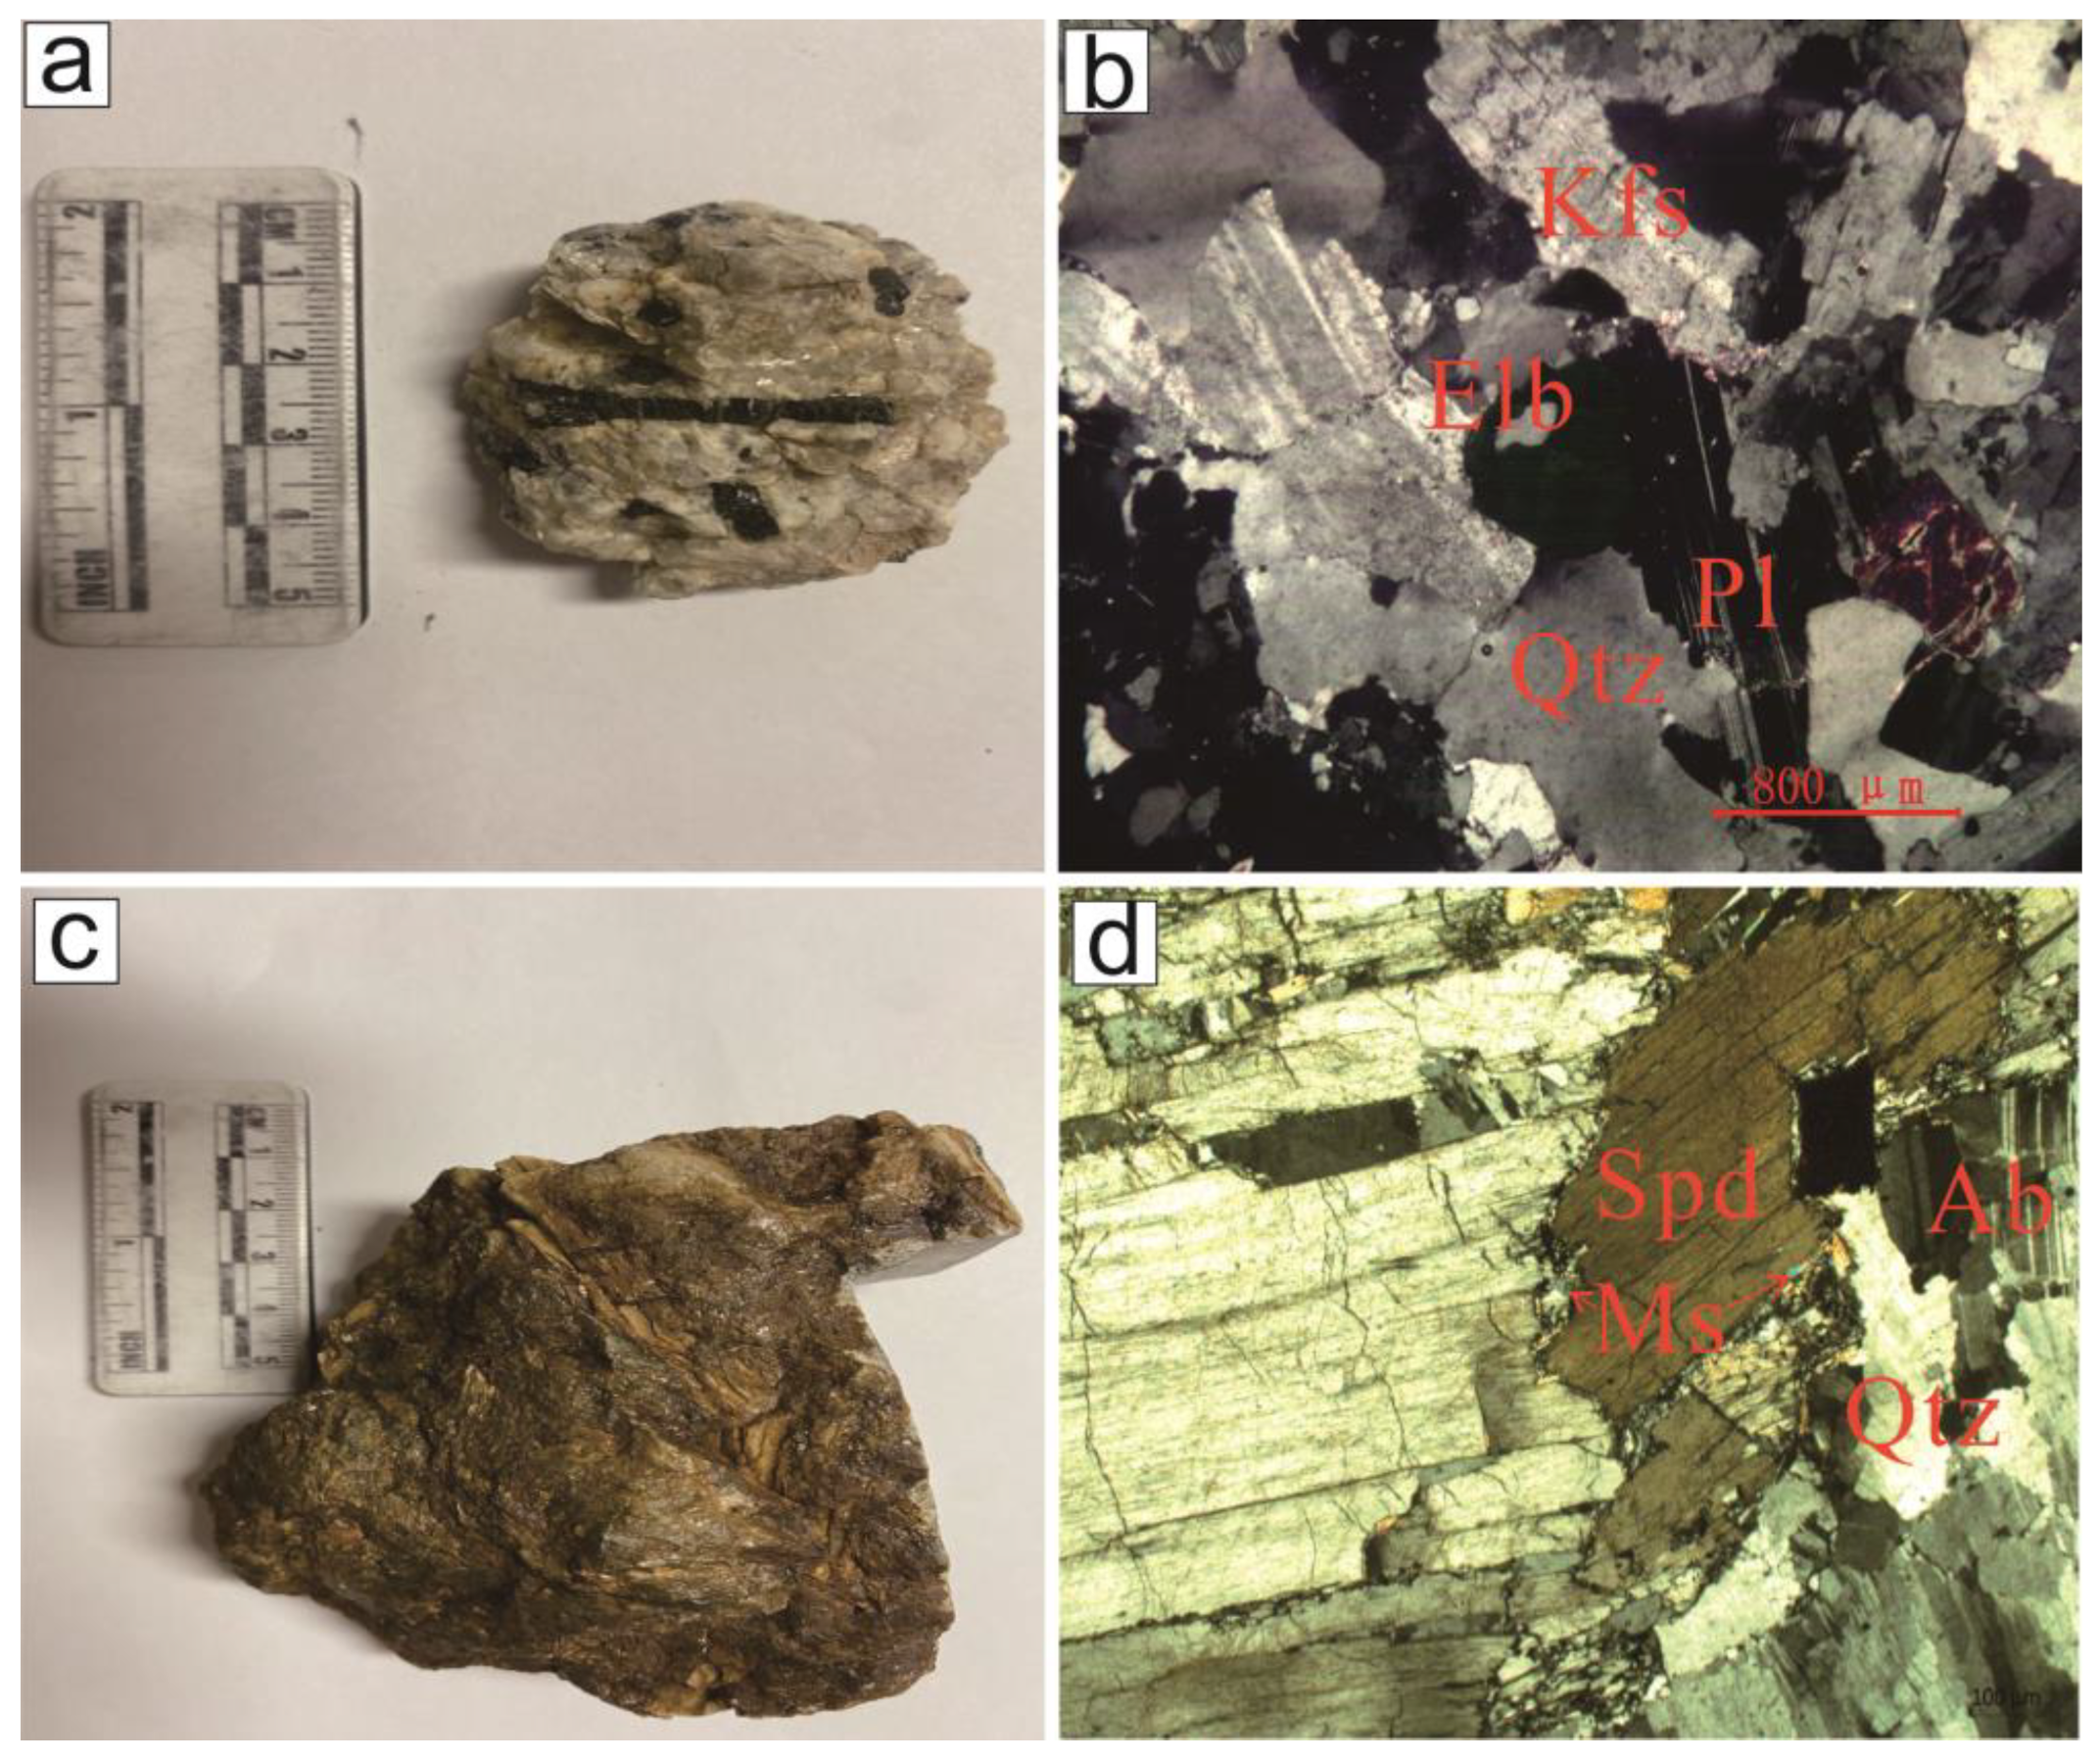
Microscopic identification showed that the altered minerals in pegmatite were mainly calcite, kaolin, sericite, chlorite, and zoisite. The West Kunlun region has an average elevation of 5290 m, with thin oxygen, rugged and steep terrain, a sparse population, poor infrastructure, and no guarantee of sourcing materials; hence, it is impossible to conduct manual sampling over a long period. Because of economic and manpower reasons, sampling sites should be able to deal with the heterogeneity of mineral distribution in pegmatite, and it should be ensured that the limited samples collected are representative, common, and indicative of the required study samples. In July 2021, the researchers in the west Kunlun Dahongliutan area worked from the northwest to the southeast, in turn, to assess the distribution of the Aksaiyi (Figure 2a), 509 (Figure 2b), and Longmenshan (Figure 2c) pegmatitic lithium deposits, following the design of a vertical pegmatite prospecting line to ensure that each pegmatite vein yielded samples, and they collected a total of 49 pegmatite samples. Granitic pegmatite minerals have a large grain size, uneven distribution, and obvious zonation in the horizontal space [39]. From the results of the sample identification, the photomicrographs show that the main mineral combination of Li-poor pegmatite is potash feldspar-quartz-tourmaline (Figure 3a,b), while the Li-rich pegmatite is feldspar-quartz-spodumene, with small amounts of muscovite (Figure 3c,d).
The reflectance signatures of the extracted rock samples were collected; in this experiment, the near-infrared spectral mineral analyzer, oreXpress, manufactured by Spectral Evolution (Haverhill, MA, USA), was used to obtain the laboratory-derived spectral information. The device, as calibrated by the factory, collects signals in the VNIR-SWIR range, with wavelengths of 350–2500 nm, from a probe with a 20-millimeter-diameter circular window. Laboratory measurements were performed using a halogen lamp as the test light source. Each sample was measured five times, on average.

2.2. Spectral Data Processing Method

2.2.1. Pre-Processing Techniques

In order to quickly and efficiently apply full-range wavelength spectral reflectance to identify Li-rich and Li-poor pegmatites, to augment the spectral signatures of the pegmatite samples, we used spectral preprocessing techniques, namely, Savitzky–Golay (SG) filtering, continuum removal, and first-order derivatives. The spectral data acquisition process may be disturbed by certain factors, such as noise and baseline shift, which may make it difficult to achieve satisfactory results through direct lithological identification. Therefore, the spectral data need to be pre-processed, such as by subjecting the data to abnormal data removal, smoothing, continuum removal, and derivation before spectral analysis, to reduce noise and improve the quality of the spectral data. SG filtering is often used to remove spectral noise. The basic principle is to carry out an n-order term least-square fitting within the specified length window [41].
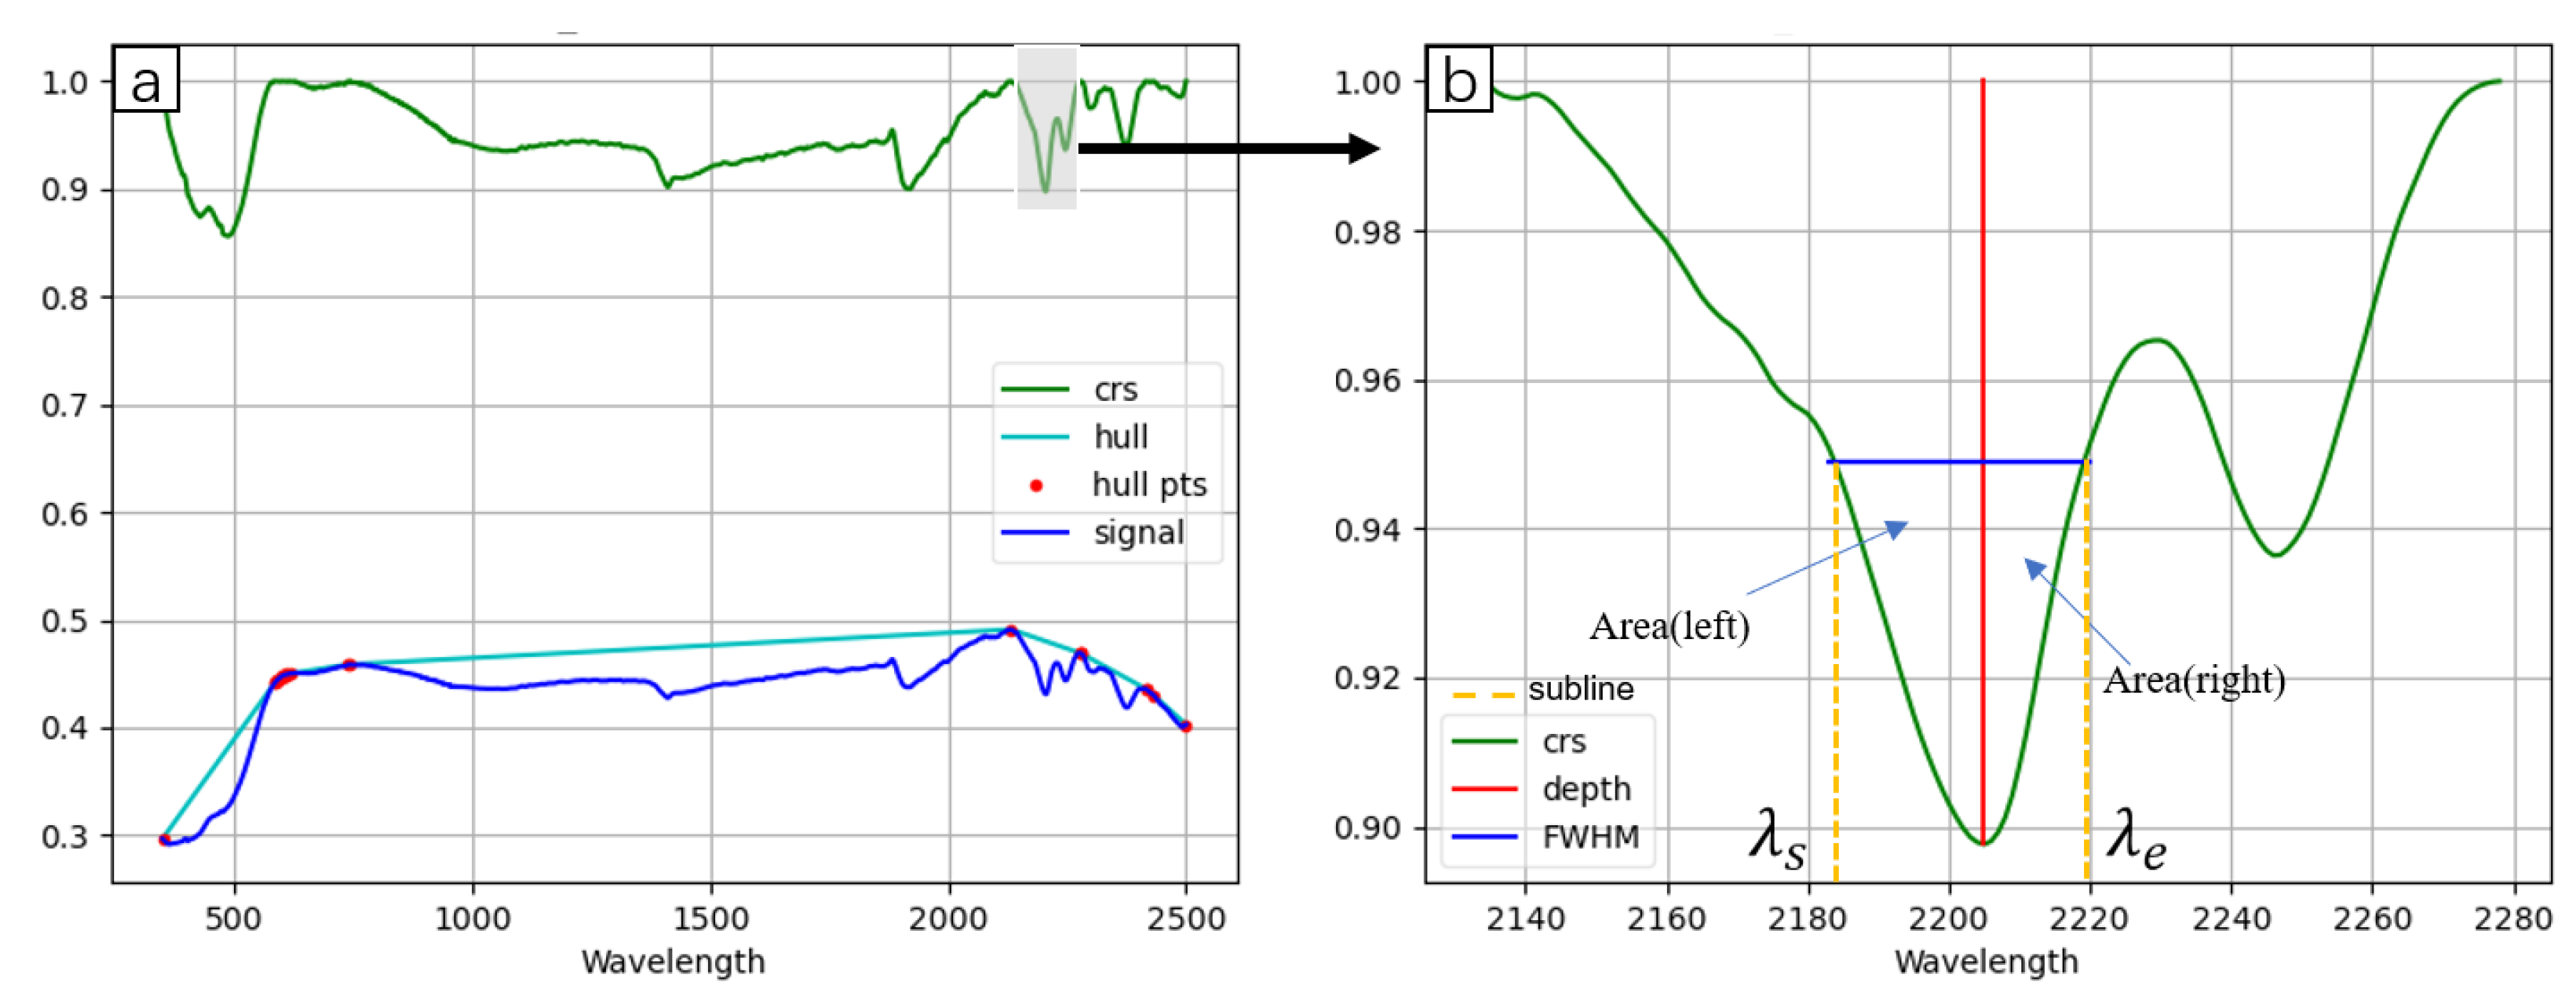
We selected the optimal spectral resolution, based on SG filtering, and then performed continuum removal and calculated the first derivative. Continuum removal was first proposed by Clark et al. [42] in 1894, and it is widely used in the field of rock and mineral spectral data identification. It can weaken the background information and amplify the spectral absorption characteristics. The specific method used is to search the local peak point hull points (Figure 4a) of the spectral data, point by point, and form the continuum removal spectra (Figure 4a) by connecting the straight lines with an external angle of > 180°. Finally, the final continuum removal result was obtained by dividing the continuum removal spectra by the original spectral curve at the corresponding band position. For the baseline shift problem, the first derivative is the most common solution. The first derivative was calculated using the difference algorithm.

2.2.2. Extraction Method for Spectral Feature Analysis

Convex hull removal and absorption features were automatically extracted using the pysptools library [43] in Python 3.6 (Python Software Foundation, Wilmington, DE, USA). First, the continuum was removed by dividing it into the original spectrum, then the irrelevant background of the spectral absorption characteristics was removed, as shown in Figure 4a. Next, the characteristic absorption bands at the more stable wavelength positions in the continuum removal spectra were analyzed. Finally, the characteristic parameters were extracted, including the spectral absorption position, the absorption depth, full width at half-maximum, the absorption area, and the absorption symmetry. The calculation steps and geological significance were as follows [23,24]:
(1)
Spectral absorption band position P. The band interval of interest was determined, followed by a search for the minimum value of the continuum removal data in the interval.
(2)
Depth H: H = 1 DH. This reflects the content of the altered minerals.
(3)
Full width at half-maximum (FWHM) corresponding to depth. H1 = H/2 corresponds to the wavelength value at the left and right absorption shoulders of λe, λs, W = λe − λs, as shown in Figure 4b.
(4)
Area A: A = Aleft + Aright.
(5)
Asymmetry, S: the area of the left part (Aleft) and right part (Aright).

2.2.3. Characteristic Wavelength Selection Method

Feature wavelength selection is an effective means of realizing a simple, fast, and highly accurate spectral automatic classification model [44]. Through minimum angle regression and a genetic algorithm, the location of the feature wavelength was selected, then the subset of the feature wavelength was established and input into the final recognition model.
The minimum angle regression algorithm is similar to forward stepwise regression, in that it constructs the independent variable, ‘xij’, and the dependent variable ‘yi’ regression model, sets the constraint value, ‘t’, of the absolute sum of the regression coefficient via the minimum informatization criterion, and constantly adjusts the regression coefficient, β (Equation (1)). The square difference between the predicted value and the actual dependent variable was calculated, and the result with the smallest square difference was selected. The corresponding independent variable at a small constraint value was deleted, and the optimal set of wavelength point variables was determined, via continuous iterations, to find the variables most closely related to the predicted value [45].
m i n S ( β ) = i = 1 n y i j = 1 p x i j β j 2 j = 1 p | β j | t t 0
The genetic algorithm is a supervised random global probability search method. Combined with the decision tree classification model, 1 and 0 represent the selection and elimination of the wave value points to complete the binary coding of chromosome G (recorded as G = (s1, s2, …, sp). According to the number of wavelength points, the chromosome population size, chromosome length P, iteration times, and other parameters were used to initialize the chromosome population. Next, the chromosomes were decoded, the decision tree was used for identification, and the tenfold cross-verification results were used to obtain the average value of the average correct recognition rate and the average correct rejection rate. Based on this figure, the value of the fitness function was calculated, and the next generation of chromosomes was selected, crossed, and mutated, followed by iterations until the fitness function F(X) converged [46]:
F X = 1 i = 1 n y ^ i y i 2
where y ^ i is the mean value of the average correct recognition rate and yi is the average correct rejection rate.

2.2.4. Data Augmentation Strategy

Machine learning requires a large amount of data, and, in this case, the number of current samples was limited. Data enhancement was used to obtain additional training data. Previous studies have shown that data enhancement can effectively expand the number of samples in the machine-learning process. For example, Qin Kai et al. used the Hapke model to enhance the mineral spectral dataset to obtain a better quantitative inversion depth learning model [47]; they studied the reasonable expansion of the training dataset, based on the PCA transformation strategy [48]. The principle of doubling the training set is as follows:
If we suppose that the ‘n’ samples and ‘p’ spectral variables form a data matrix X of n × p order, the sample data is standardized, and the standardization matrix Zij (Equation (3)) and correlation coefficient matrix R (Equation (4)) are calculated, then the eigenvalue λp and its corresponding eigenvector, ei, are solved. The eigenvalues were sorted from large to small, and the corresponding eigenvectors formed a projection matrix.
Z i j = x i j x j s j , i = 1 , 2 , , n ; j = 1 ,   2 , , p
x j = i = 1 n x i j n , the average value of characteristic j.
s j 2 = i = 1 n x i j x j 2 n 1 , the variance of the dataset.
R = r i j p × p = Z T Z n 1
Here, rij is the correlation coefficient, the solutions for the characteristic equation of the sample correlation matrix |λiR| = 0, and p is the number of the eigenvalue, sorting the characteristic value to be λ1λ2 ≥ … ≥ λp ≥ 0. For each eigenvalue, λi, the corresponding eigenvector, ei (i = 1, 2, …, p), should be determined:
I i j = λ j e i j i = 1 , 2 , , p ; j = 1 ,   2 , , m
X n e w = X t r a i n + α i λ i P C i
where Xnew is the generated dataset, Xtrain is the training dataset, αi is a random constant satisfying the normal distribution, λi is the corresponding eigenvalue, and PCi is the ith principal component.

2.2.5. Machine Learning Model Recognition Method

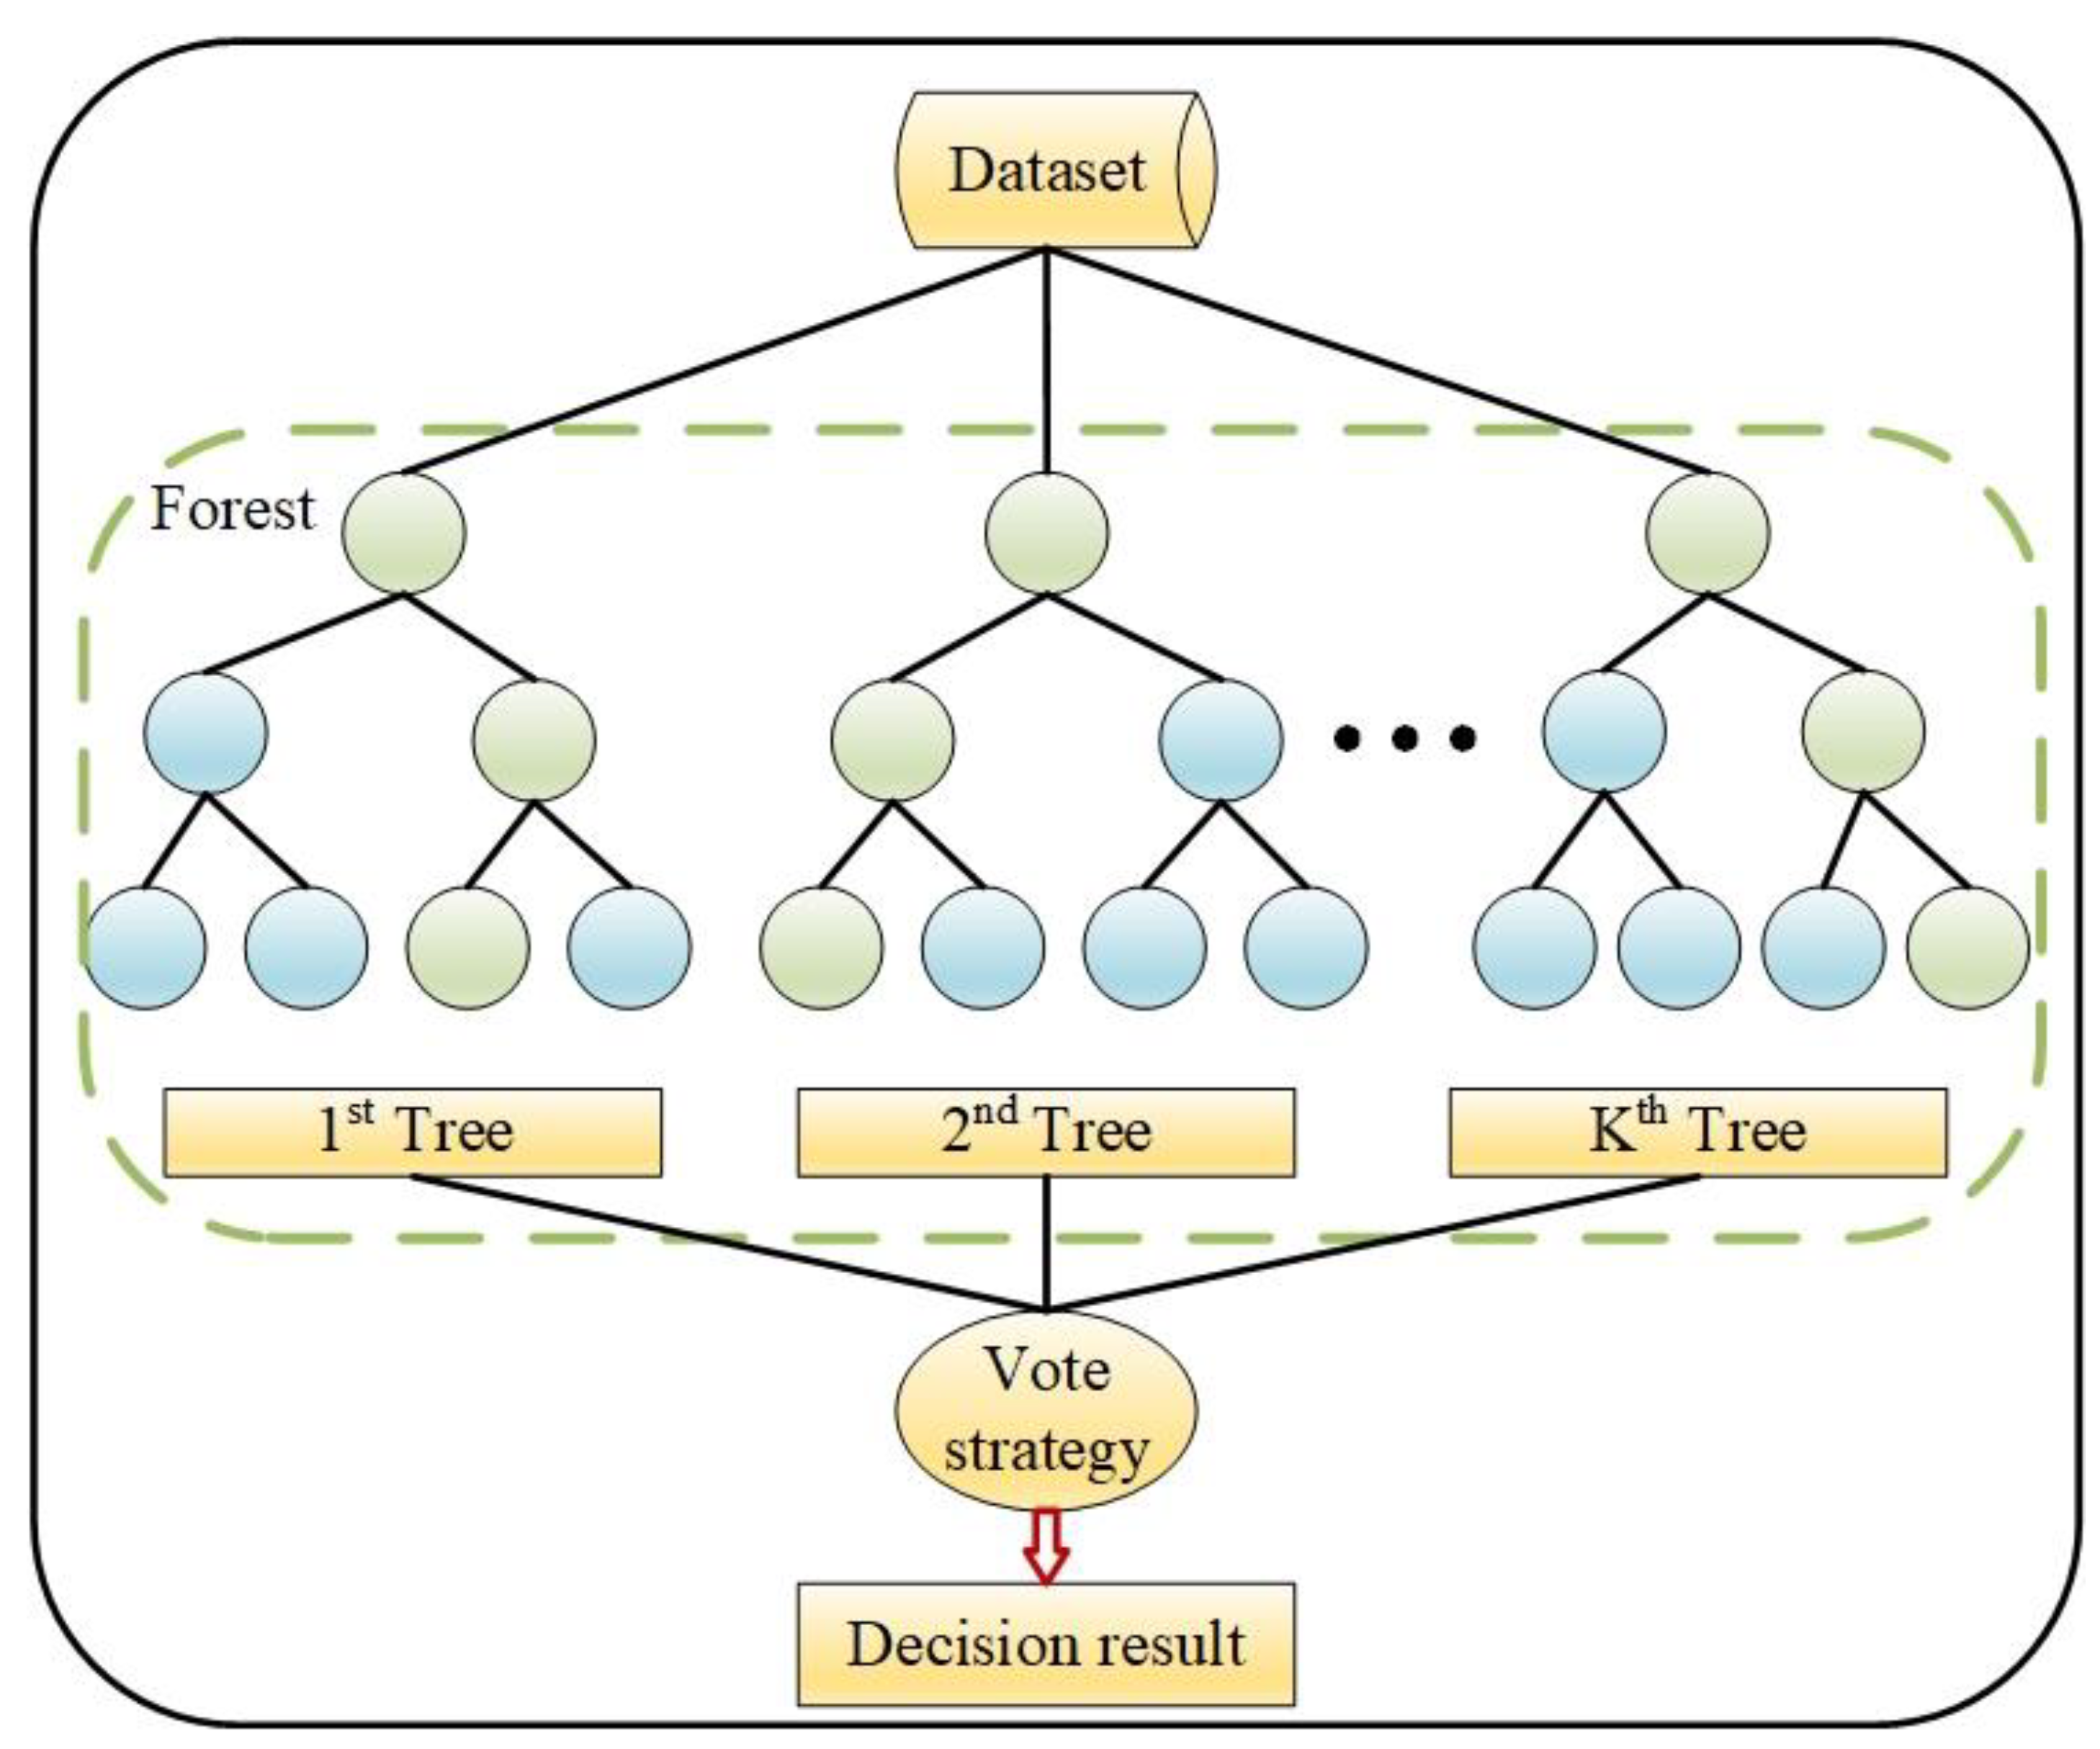
The random forest model is a classifier integrated with several decision trees, using the bagging method. Using the bootstrap method, a new set of training samples was obtained by extracting n times from the training set. Each subset of the training samples was input into the decision tree as a single classification tree, and the Gini coefficient (Equation (7)) was used as an index to divide the optimal split nodes. The child nodes are classified by the Gini coefficient; all the decision trees are used to determine the final classification result, and this establishes the generalization ability of the model [49] (Figure 5).
G i n i D = 1 k = 1 k C k D 2

2.2.6. Result Verification Method

P is the number of Li-rich pegmatites, and N is the number of Li-poor pegmatites. Based on the characteristic band dataset of VNIR–SWIR, the characteristic band data and classification were carried out using ML. T is the number of Li-rich pegmatites and F is the number of Li-poor pegmatites. There are four possible results for each unit in the validation set: if the labeling and prediction results are of Li-rich pegmatite, it is regarded as a ‘true positive’; if it is marked as Li-rich pegmatite and is misclassified as Li-poor pegmatite, it will be regarded as a ‘false positive’; if Li-poor pegmatite is misjudged as Li-rich pegmatite, it is regarded as a ‘false negative’; if it is Li-poor pegmatite and the classification results are consistent, it is regarded as a ‘true negative’. A confusion matrix (also known as an association table) was constructed to represent these results (Table 1).
The receiver operating characteristics (ROC) curve is a visualization, organization, and selection technology based on classifier performance [50], which has been used in signal detection theory to describe the relationship between the hit rate and false positive rate of classifiers. The ROC curve can be used to verify the effectiveness of the spatial prediction model, and it is stable and insensitive to changes in class distribution. If the proportion of positive and negative samples in the test set changes, the ROC curve will not change.
Using the confusion matrix, two concepts of the ROC curve are defined. The true-positive rate (TPR) is also known as the recall rate, and the calculation formula is as follows:
T P R = T P P .
The false-positive rate (FPR) is also called the false-alarm rate, and its calculation formula is as follows:
F P R = F P N .
The ROC curve was drawn using TPR (Equation (8)) as the y-axis and FPR (Equation (9)) on the x-axis. The area beneath the ROC curve is known as the area under the curve (AUC), which is the result of summarizing the ROC performance into a single index. The AUC is a part of the unit square area. Because the ROC curve is generally above the diagonal between (0, 0) and (1, 1), the value range of the AUC is between 0.5 and 1. When the AUC value is >0.5, the performance of the prediction method is better. The closer the AUC value is to 1, the steeper the ROC curve, and the better the performance of the prediction method.
The performance of the classification accuracy of the model was evaluated by calculating the area under the ROC curve (AUC), AUC standard deviation (SAUC), and the statistical difference (ZAUC) between AUC and AUC = 0.5 under random conditions.
AUC is often used as an evaluation index to measure the classification effect of the two classification models. The AUC calculation formula is as follows:
A U C = 1 P × N i = 1 P j = 1 N φ y i + , y j
φ y i + , y j = 1       y i + > y j 0.5       y i + = y j 0       y i + < y j
where yi+ (i = 1, 2, …, P) represents the predicted number of Li-rich pegmatite samples, yj (i = 1, 2, …, N) represents the predicted number of Li-poor pegmatite samples. P is the number of Li-rich pegmatite samples, and N is the number of Li-poor pegmatite samples. The closer the AUC value is to 1, the better the model classification effect.

3. Results and Discussion

3.1. Extraction and Analysis of the Absorption Characteristic Parameters, Based on Local Spectrum Diagnosis

Waveform parameters are directly linked to the mineral composition and content, such as absorption feature position (Pos) and depth (Dep) [24]. In the following analysis, the waveform parameters of Li-bearing pegmatite and barren-bearing pegmatite will be extracted, and the difference in waveform parameters will be analyzed. Finally, the extracted quantitative values will be used for automatic recognition via machine learning.

3.1.1. Spectral Feature Interval Selection

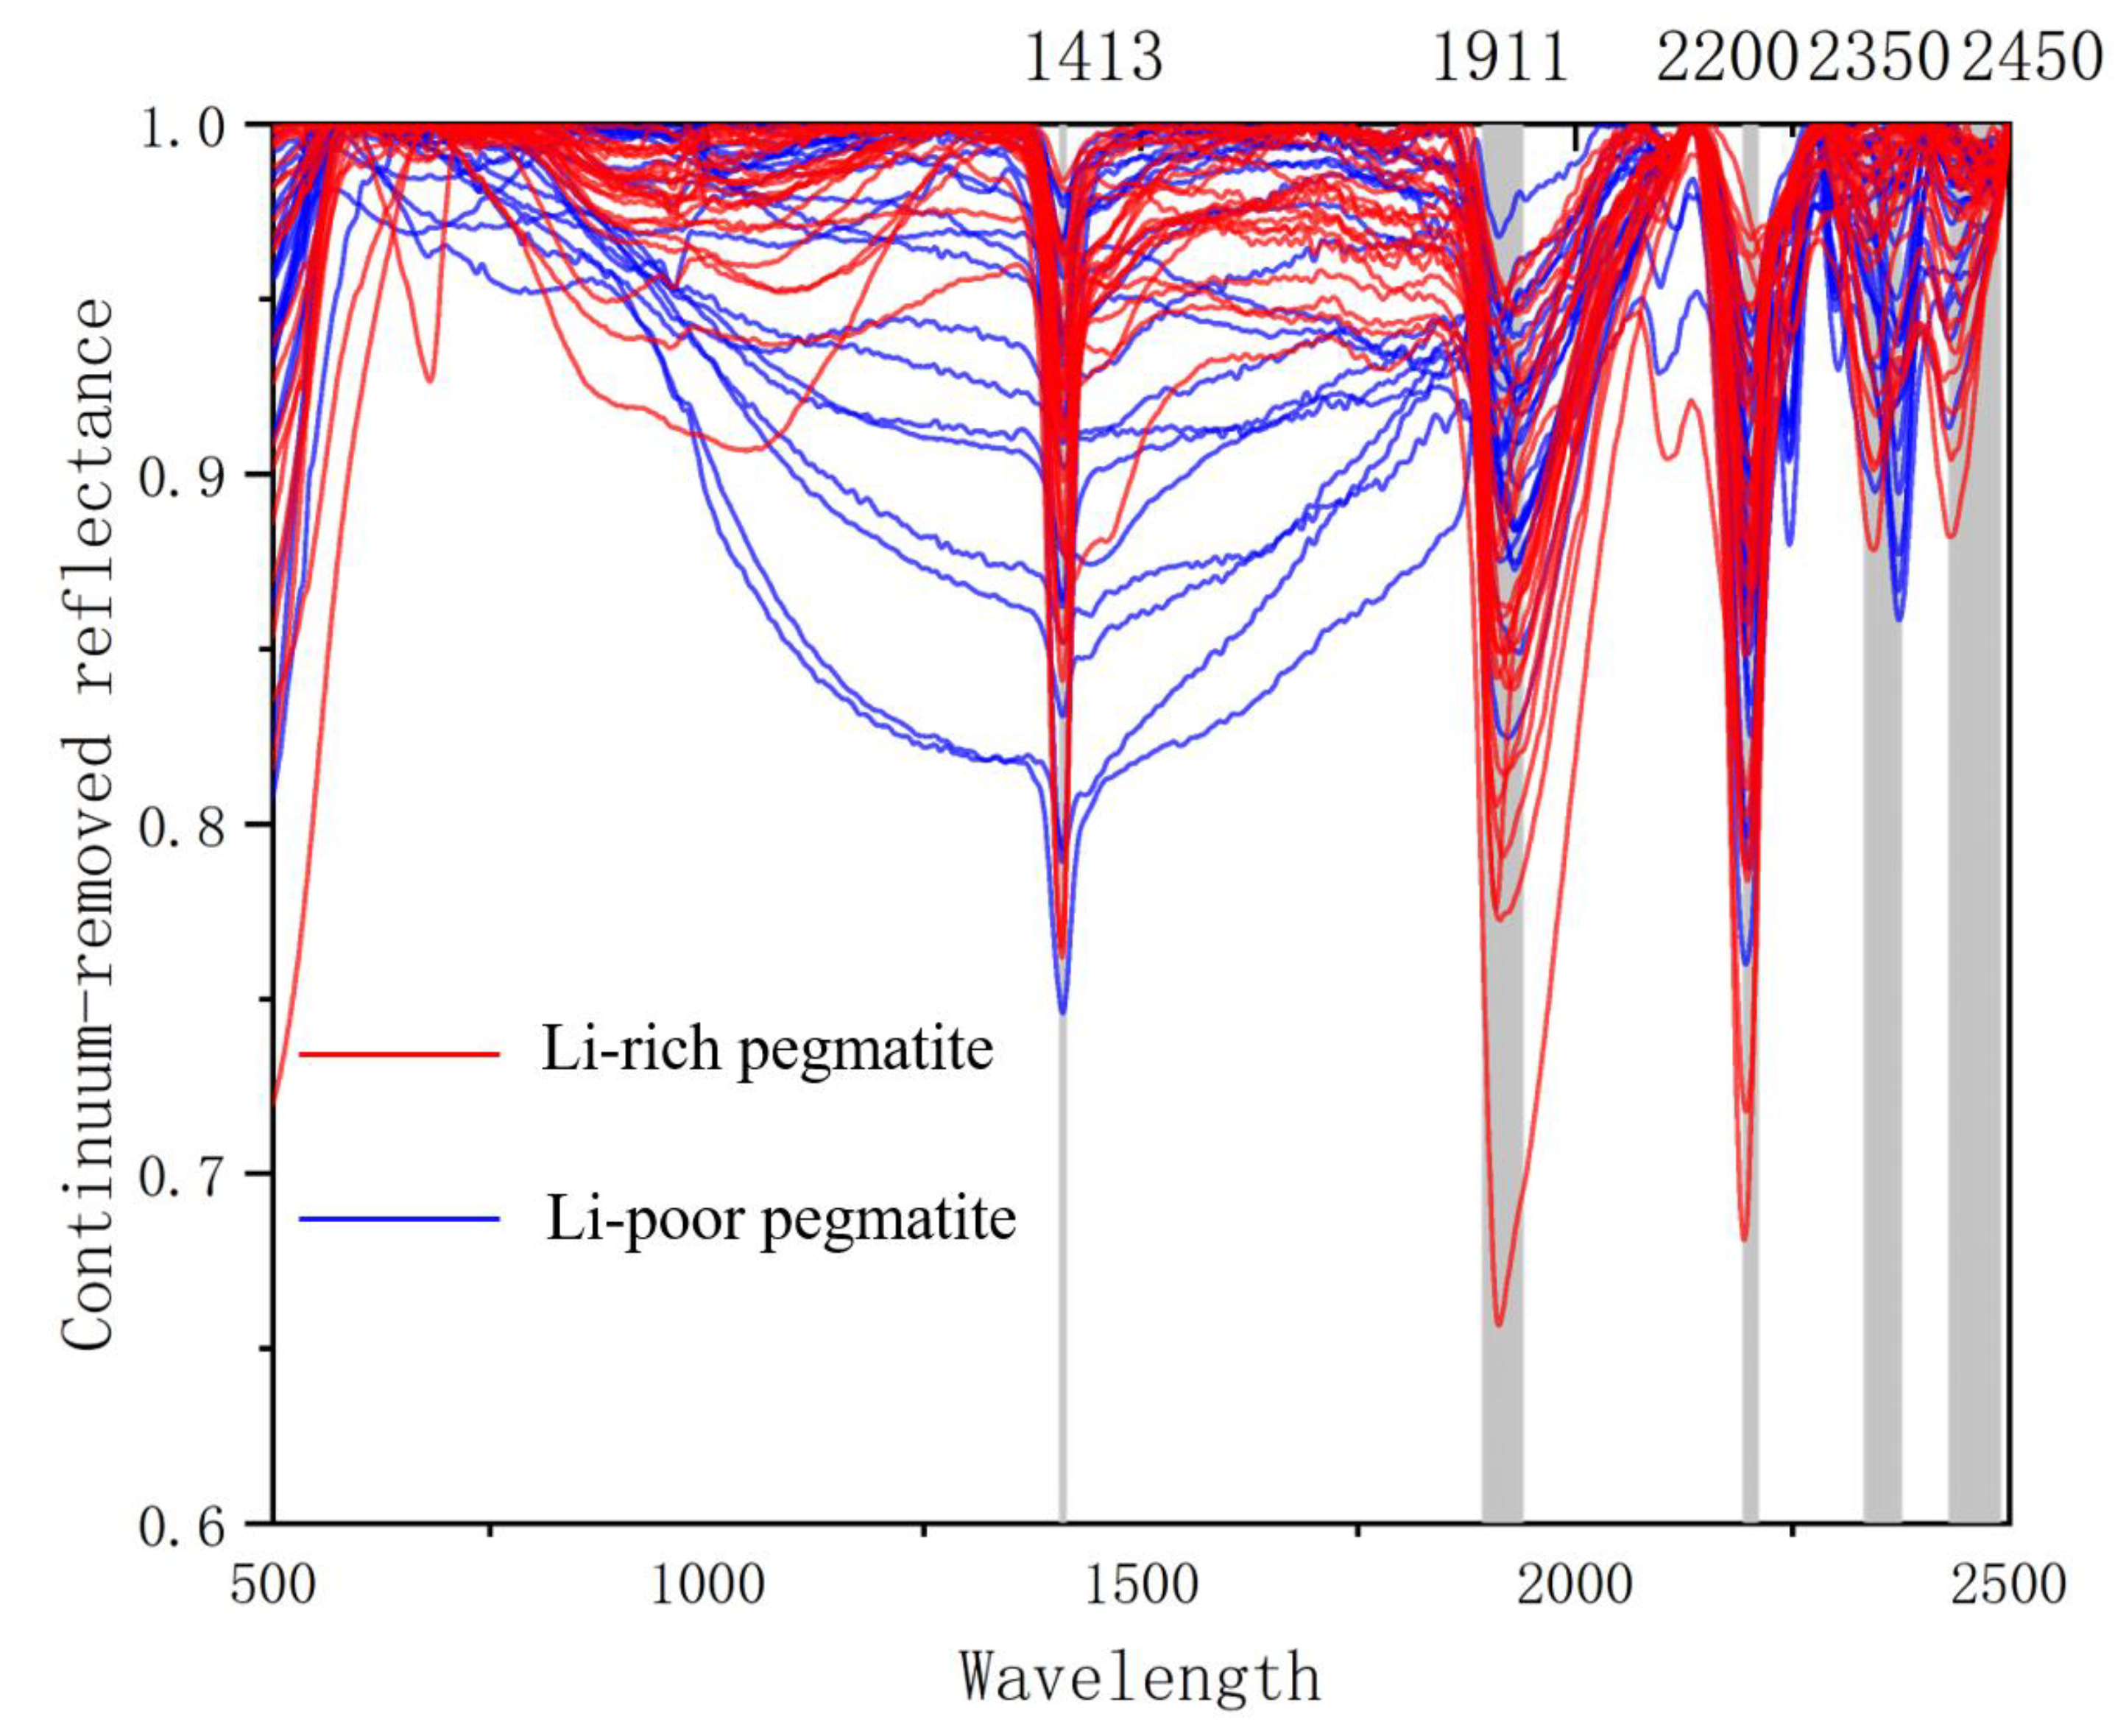
Based on the results of previous studies [6,36,39], the characteristic range of the stable absorption of both Li-rich pegmatite and Li-poor pegmatite was selected (as shown in the shaded part of Figure 6): 1408–1413 nm, 1895–1939 nm, 2195–2210 nm, 2335–2375 nm, and 2432–2489 nm (Figure 6). Although there were some differences between Li-rich pegmatite and Li-poor pegmatite identified by observing the waveform, the absorption characteristics of some samples were not obvious, and it was difficult to capture subtle characteristics. It was also not easy to distinguish Li-rich pegmatite and Li-poor pegmatite lithologies solely by visual observation; hence, it was necessary to further extract the specific parameters in the spectral feature interval for analysis.

3.1.2. Spectral Characteristic Parameter Analysis

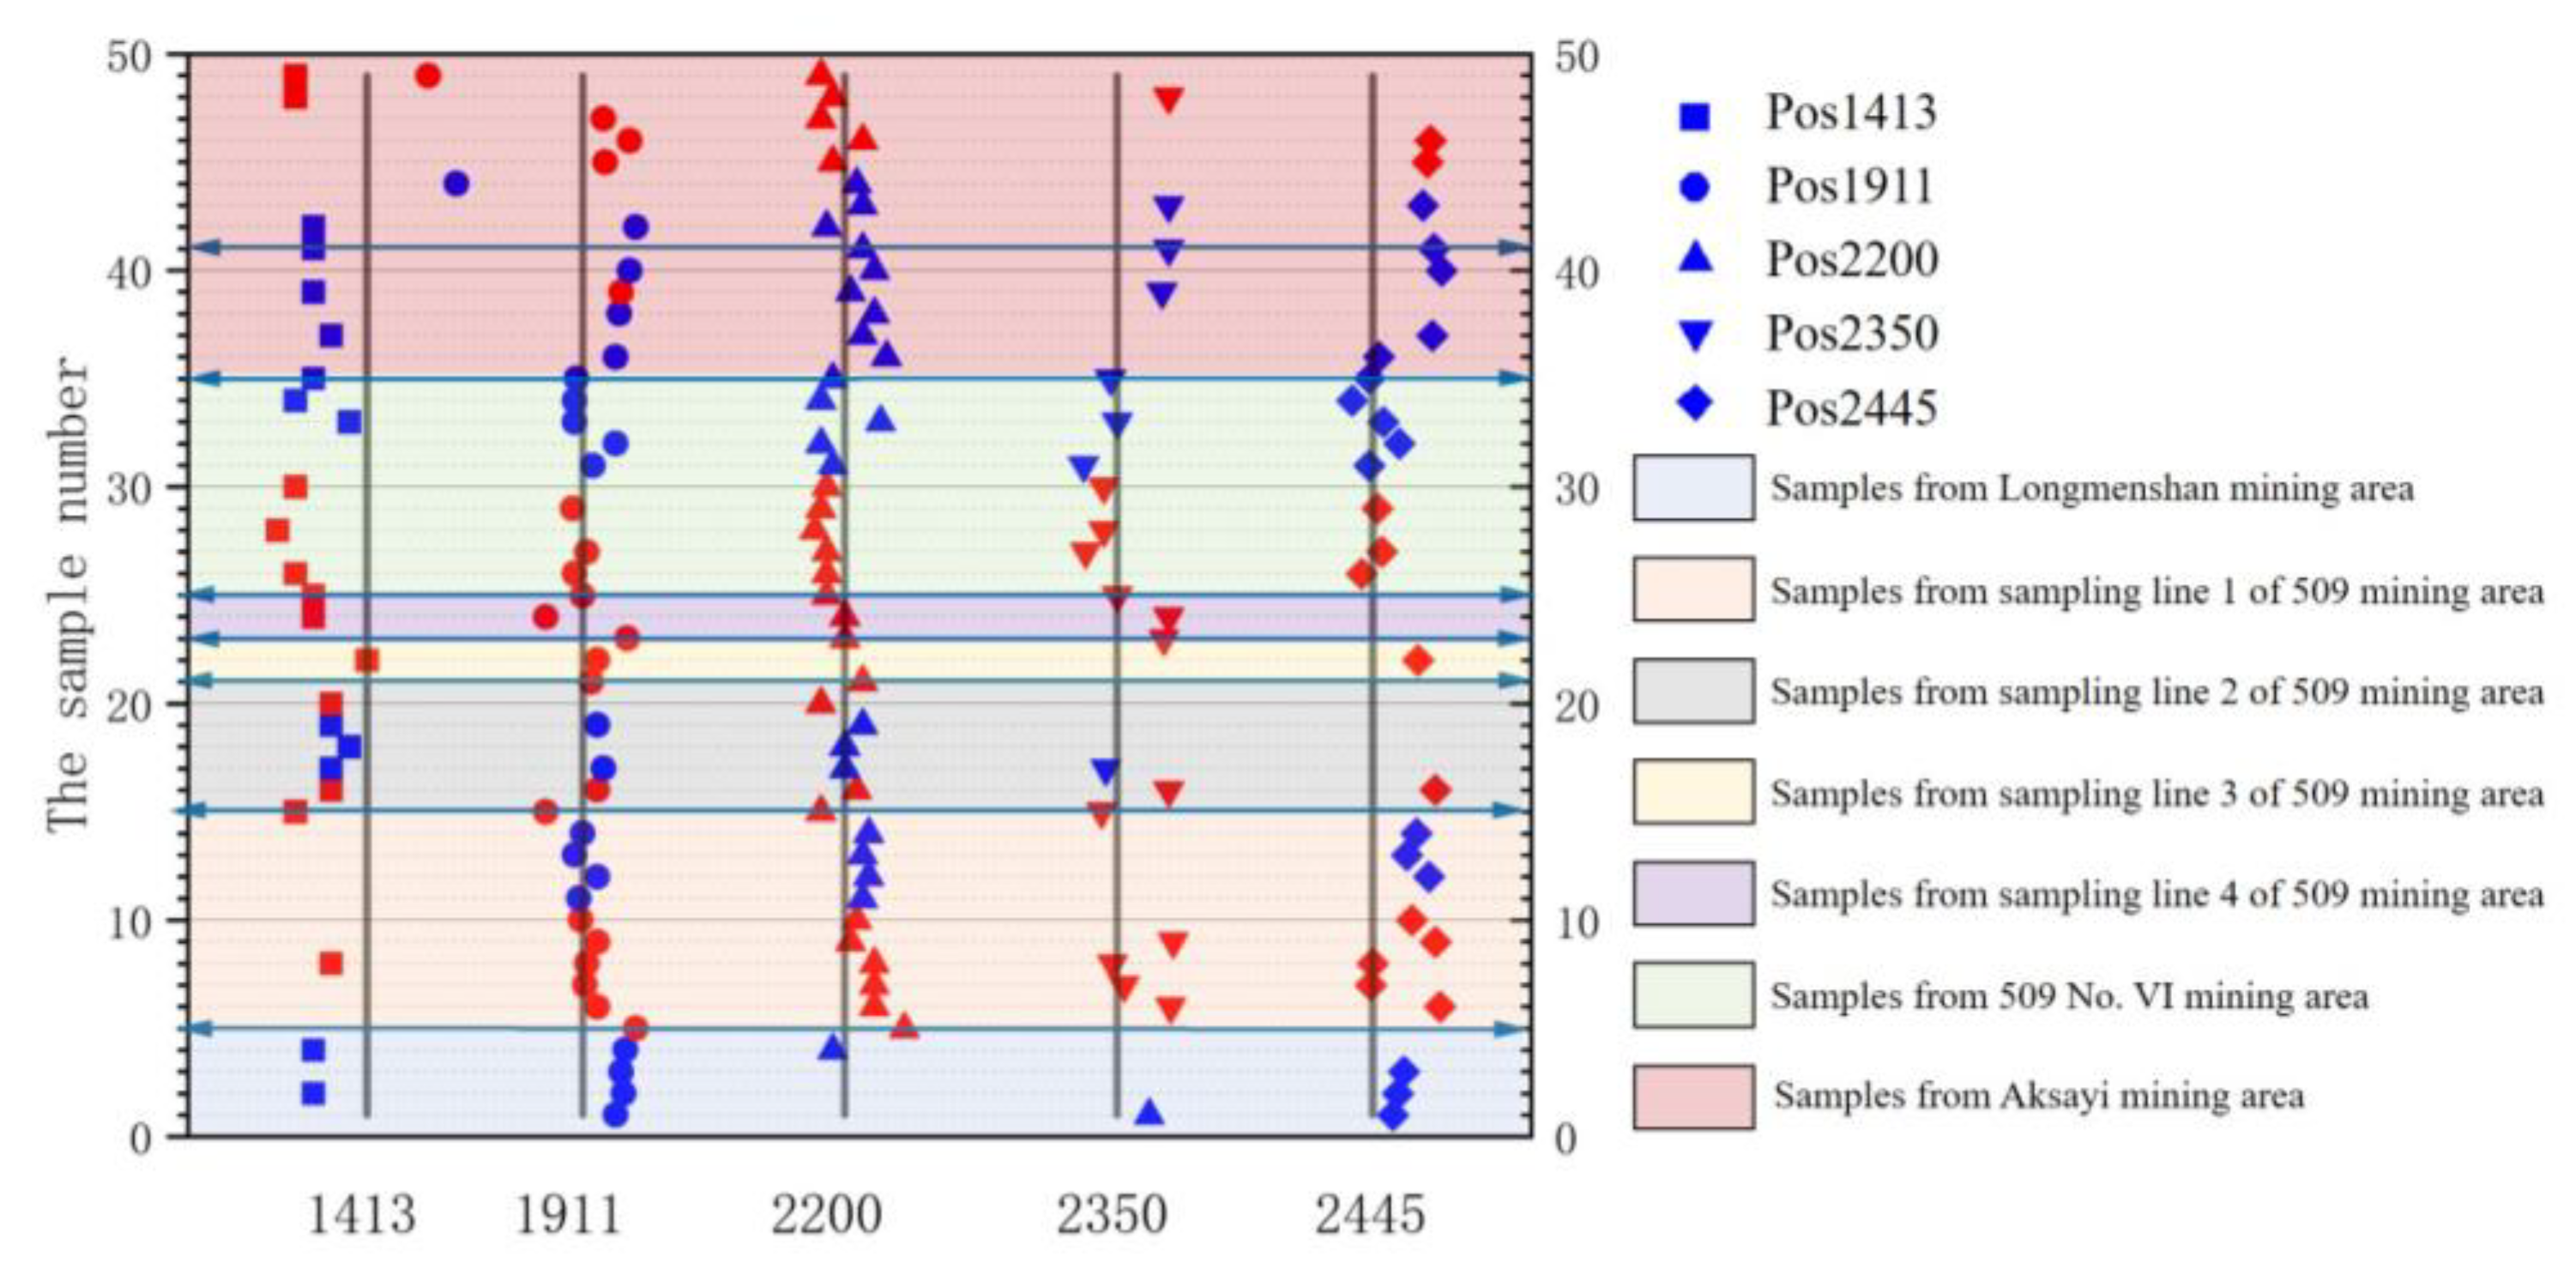
Different mineral combinations exist in different rocks, and the interaction between minerals may cause a shift in the position of the characteristic spectral band. For example, the wavelength position of the original absorption peak shifts to that of the impurity absorption characteristics, owing to the influence of the impurity absorption characteristics [24,51]. The displacement of the diagnostic wavelength absorption is also reflected in the cation exchange in the altered minerals found in geological processes. For example, the Alvi in mica is replaced by Fe and Mg plasma, and the position of the Al-OH diagnostic absorption wavelength shifts to a longer wavelength [52,53,54]. In total, 49 samples were extracted, and the diagnostic wavelength absorption position in the search spectral feature interval corresponded to five feature segments: Pos1413 (1408–1413 nm), Pos1911 (1895–1939 nm), Pos2200 (2195–2210 nm), Pos2350 (2335–2375 nm), and Pos2450 (2432–2489 nm) (Figure 7), which are described as follows.
The overall trend of the spatial location of samples 1–49 was from southeast to west. Samples 1–5 were located in the Longmenshan pegmatitic lithium deposit, samples 6–15 were located in sampling line 1 of the 509 pegmatitic lithium deposit, with samples 16–21 in sampling line 2 of the 509 pegmatitic lithium deposit, with samples 22–23 in sampling line 3 of the 509 pegmatitic lithium deposit, samples 24–25 in sampling line 4 of the 509 pegmatitic lithium deposit, samples 26–35 in the 509 pegmatitic lithium deposits, and samples 36–49 in the Aksayi pegmatitic lithium deposit. The variation range of Pos1413nm was between 1408 and 1413 nm, which corresponded to the absorption peak of crystalline water. The absorption position Pos1413nm of pegmatite in the Dahongliutan area generally drifted more toward the short-wave direction by approximately 2 nm, and most of them gathered at 1410 nm or 1411 nm in the Dahongliutan area, compared with the previously reported absorption position of pegmatites in other regions at 1413 nm. Samples 26–35 in the No. 509 VI mine were more offset, the absorption position exhibiting a minimum position of 1408 nm, which may be affected by the ferritization alteration. Field exploration also confirmed that there was strong ferritization in the No. 509 VI mine whence samples 26–35 were sourced. Pos1911 corresponded to the result of frequency doubling or the frequency combination (OH + H2O) of bond vibration. The variation range of Pos1911 was 1895–1939 nm, which corresponded to the absorption peak of adsorbed water. The Pos1911 of most samples was concentrated at 1908–1936 nm, and the number of samples below 1908 nm only accounted for a small proportion. In general, the left and right offsets of Pos1911 were small and the wavelength position was relatively stable. Most of the samples numbered 26–35 in the 509 pegmatitic lithium deposits had a Pos1911 spectral band, and there was no Pos1413 spectral band, which indicated that the rock samples in this area only contained adsorbed water, with no crystal water. The variation range of Pos2200 was between 2198 nm and 2224 nm, which corresponded to the Al-OH of altered minerals, such as sericite. The Pos2200 of most samples was concentrated in the range of 2205–2215 nm, and the number of samples below 2200 nm only accounted for a small part. Pos2200, measured in Li-rich pegmatite, was generally excursed toward the short wavelength at about 10 nm, compared with that measured for Li-poor pegmatite. Li-rich pegmatites were generally around 2197 nm. Pos2200 is related to the contents of AlVI. The shift of Pos2200 to the shortwave direction of Li-rich pegmatite has been observed, it is possible that Li was a substitution for AlVI in octahedral sites [37,55,56,57]. The variation range of Pos2350 was between 2335 nm and 2375 nm. The Li-poor pegmatite in the Longmenshan pegmatitic lithium deposit had no absorption characteristics, or, at least, the absorption characteristics were not obvious, which corresponded to Mg-OH or CO32−. Specifically, the symmetry parameters of the absorption characteristics must be analyzed further [58]. The variation range of Pos2445 was between 2432 nm and 2489 nm, and there was no marked drift difference or spatial law between Li-rich pegmatite and Li-poor pegmatite visible with the naked eye.
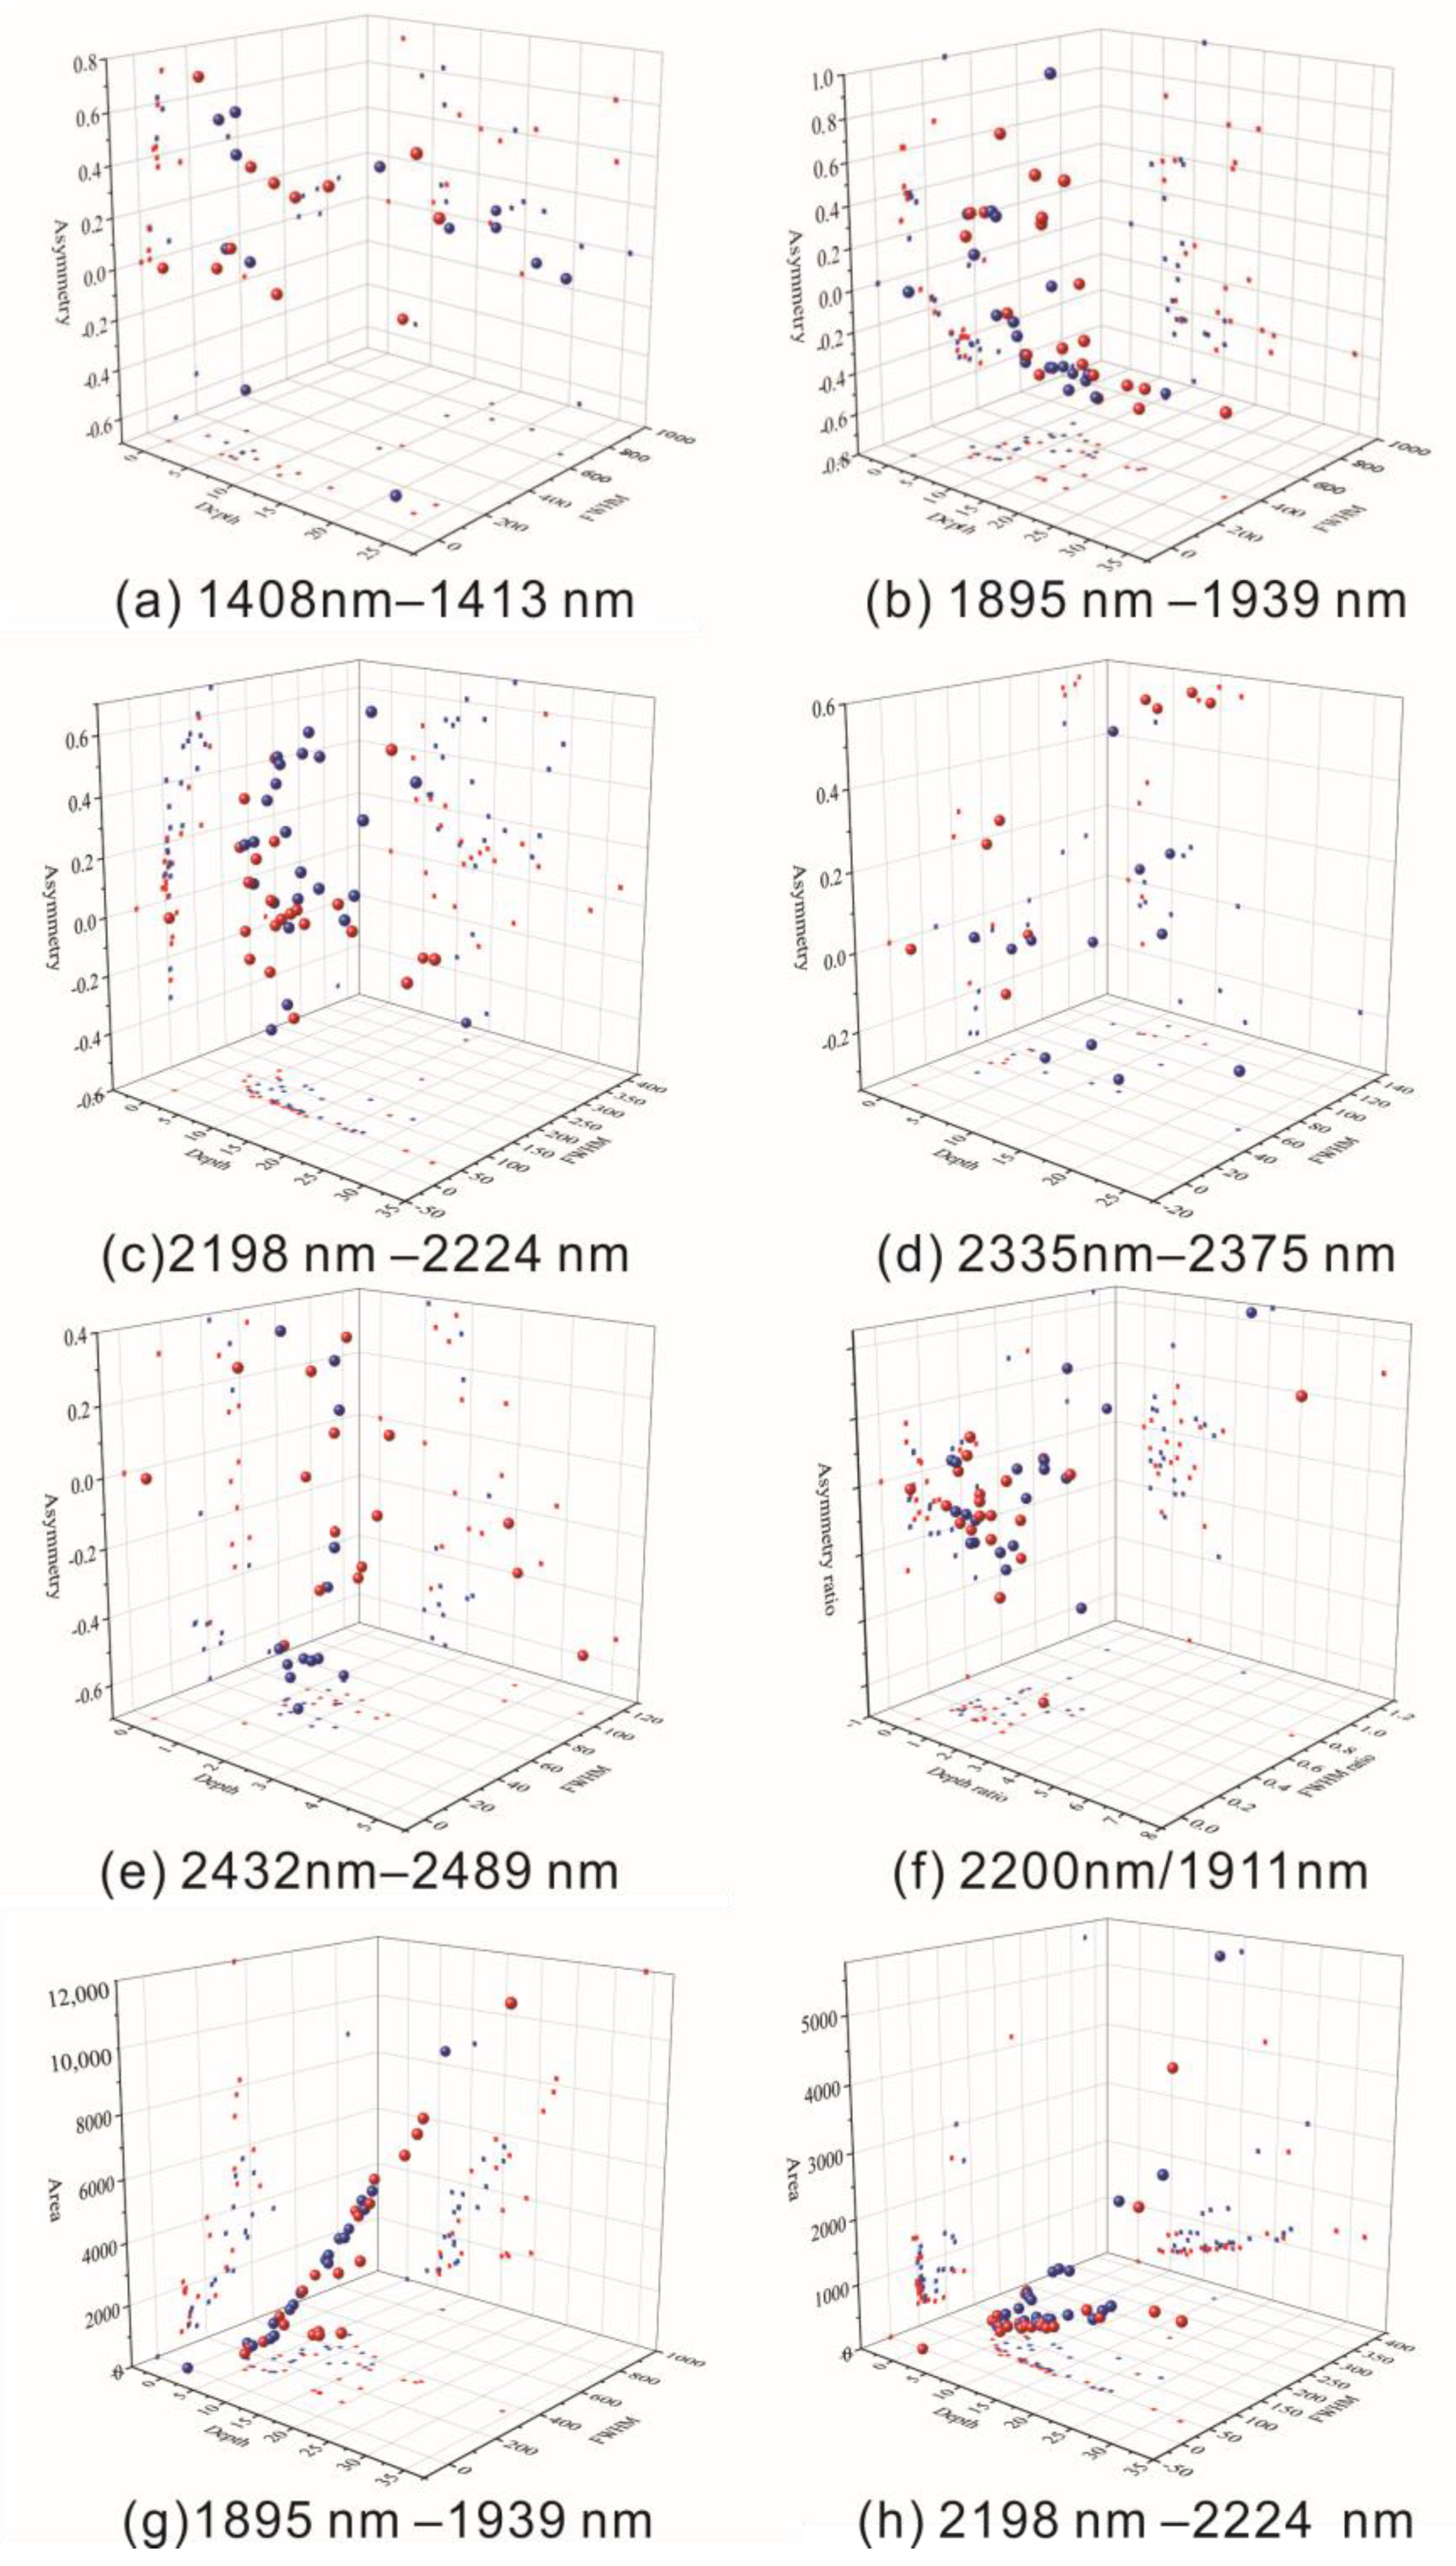
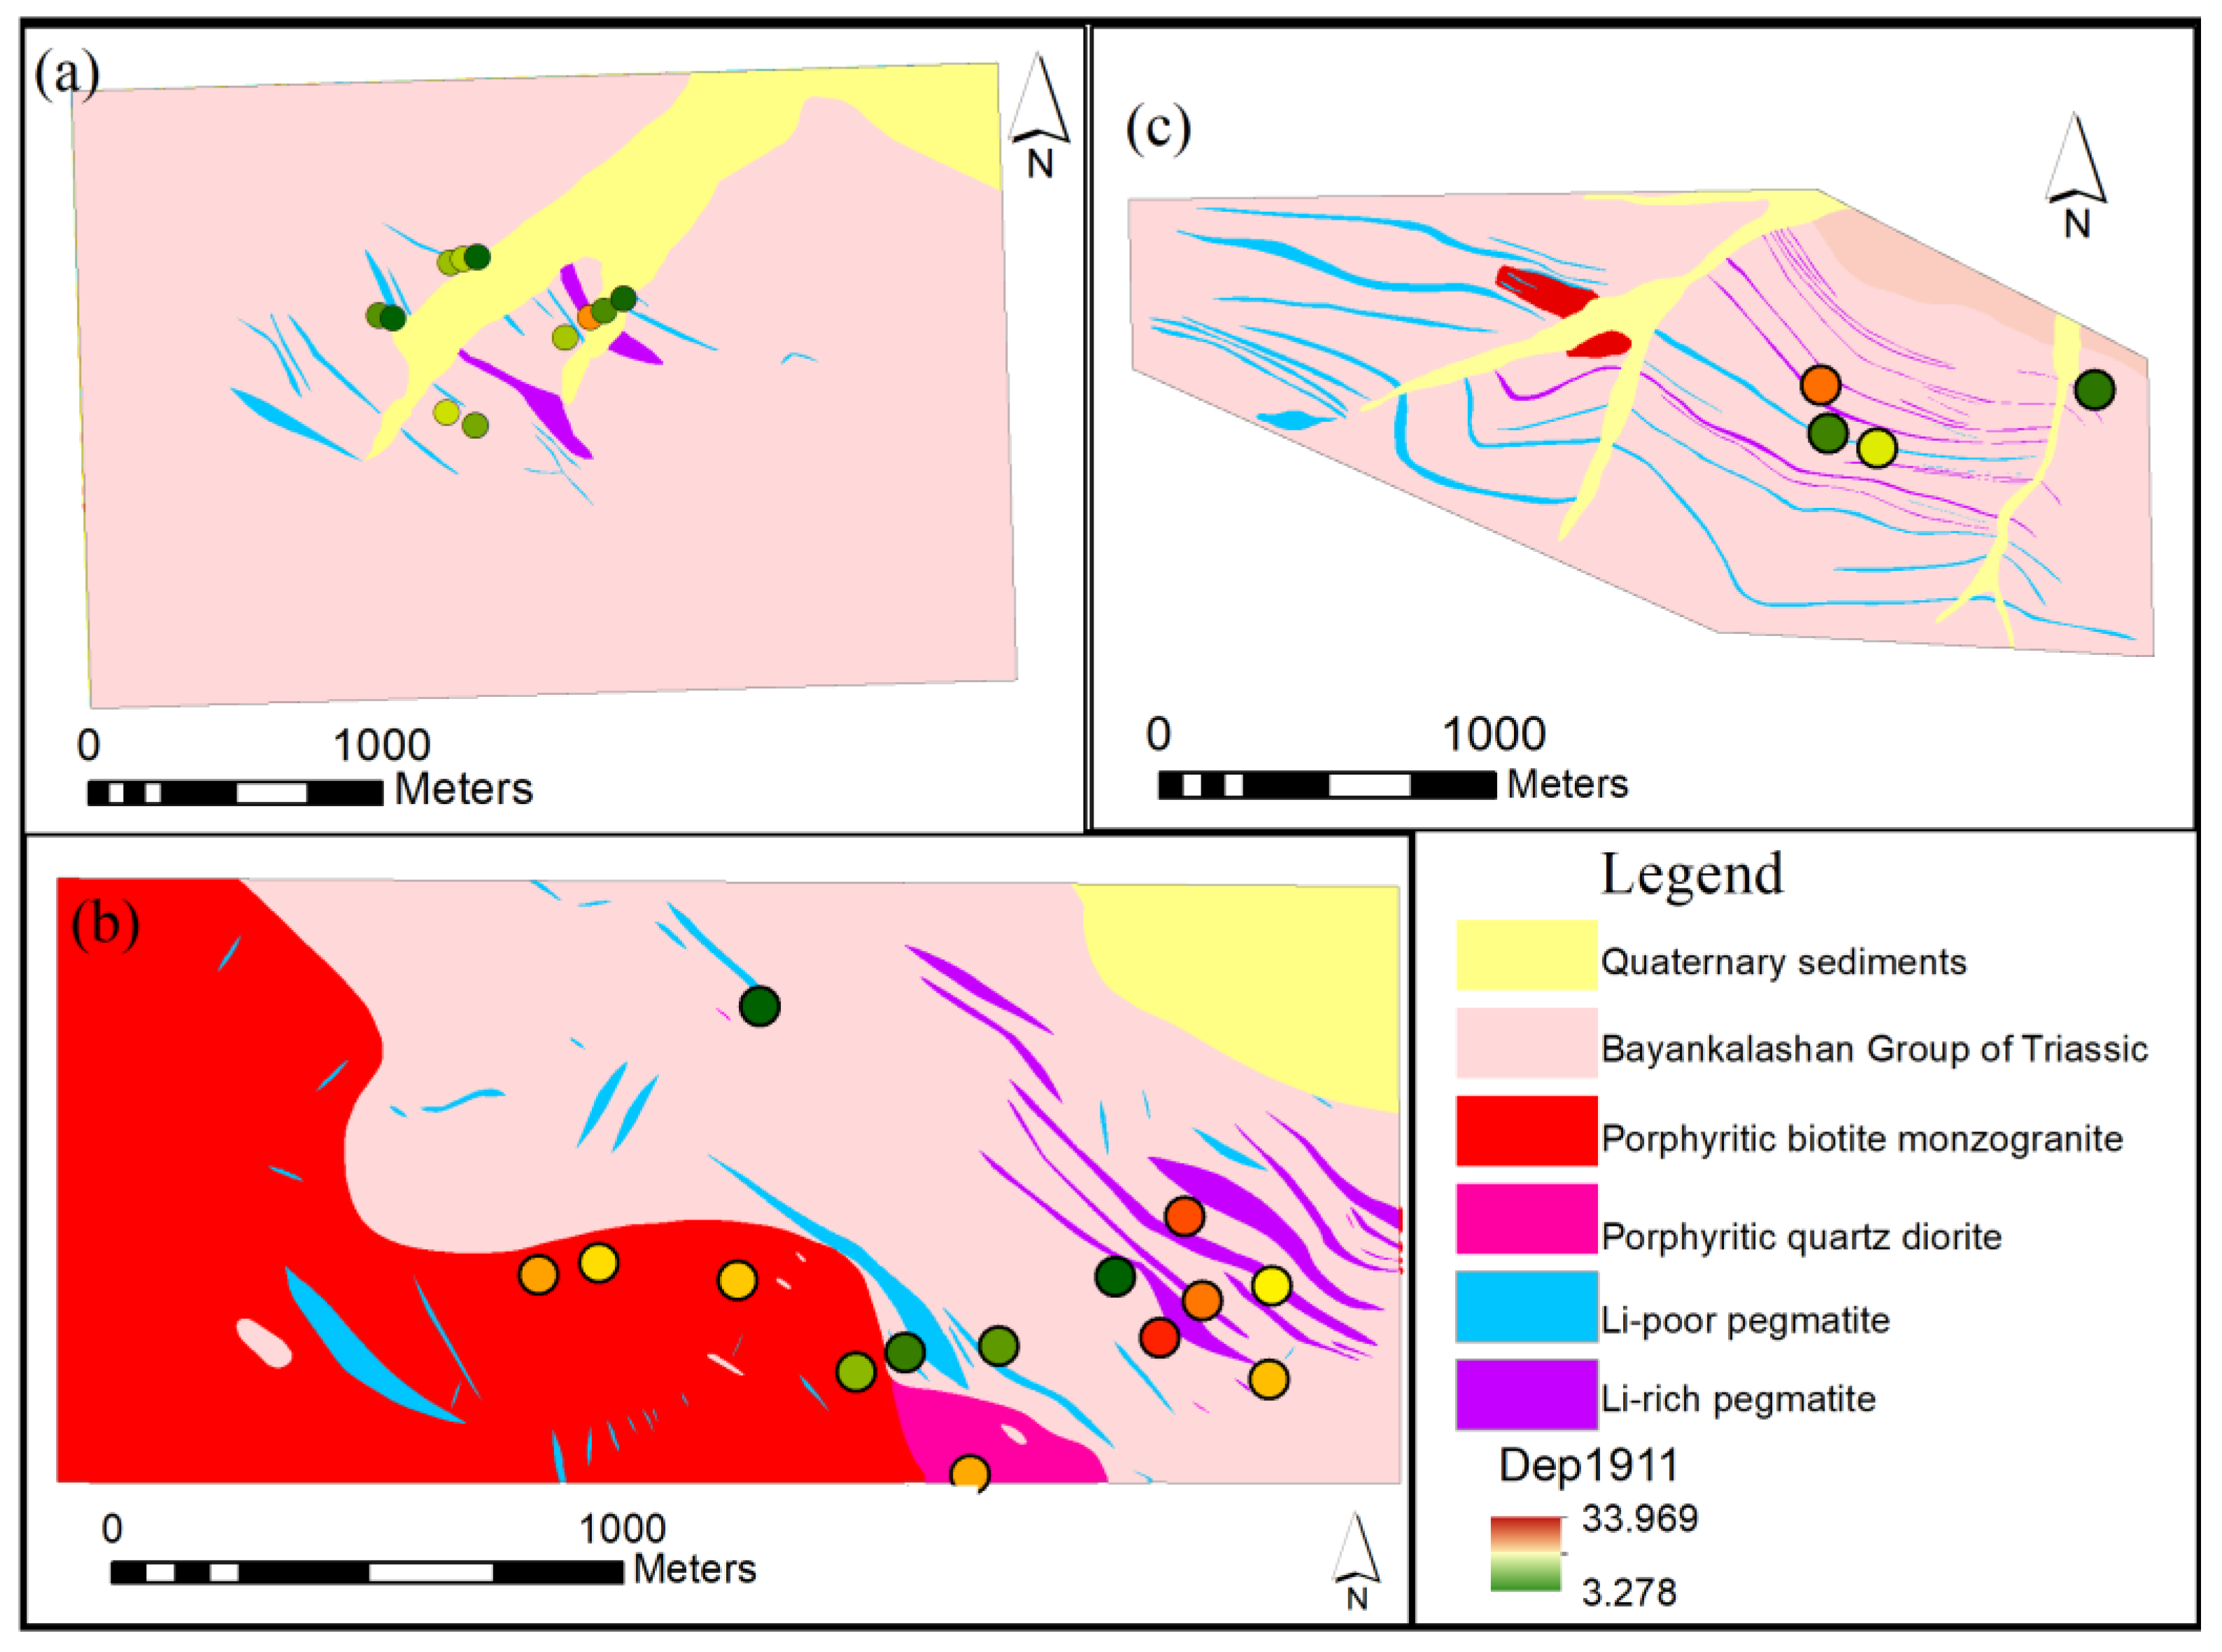
The characteristic of depth (Dep), full width at half maximum (FWHM) (nm), asymmetry (Asy), and area corresponded to the spectral characteristic absorption position of each sample (see Figure 8a–e for the 3D scatter plot, showing obvious indicative significance). FWHM was at 1413 (1408–1413 nm, Figure 8a) for the full width at half-maximum of Li-rich pegmatite; it was smaller than that of Li-poor pegmatite, and it was mainly concentrated in the range of 0–200 nm. The full width at half-maximum of Li-poor pegmatite can reach 857.9 nm. At a depth of 1895–1939 nm, the Dep1911 of some Li-rich pegmatite was >15 nm (Figure 8b), corresponding to an absorption depth greater than that of Li-poor pegmatite. When the H2O content in the minerals increased, the depth of the H2O absorption peak at 1900 nm (Dep1911) of the rocks increased, and the absorption depth parameter of ore pegmatite at approximately 1911 nm (that is, Dep1911) was projected onto the geological map (Figure 9). From Figure 9, it can be seen that the change in absorption depth near 1911 nm reflects the distribution law for lithium content, which is basically consistent with the geological fact of the spatial zoning of Li-rich pegmatite [5] along with a previous report that the lithium content was positively correlated with the clay-related absorption depth, Dep1911.
In the corresponding 2198–2224 nm range of Al-OH absorption characteristics, the characteristic parameter, FWHM 2200, of most pegmatite bands was relatively stable, concentrated at approximately 50 nm, and the asymmetry of the Li-poor pegmatite Asy2200 was significantly higher (see Figure 8c). The absorption of the spectral band in the 2335–2375 nm section may have been caused by the Mg-OH or CO32− shown in Figure 8d. The spectral characteristics of CO32− are wide on the left and narrow on the right [58]; that is, Asy2350 was greater than 0, and while most Li-rich pegmatite meet this value, most Li-poor pegmatites (Asy2350) are less than 0. In the band interval of the 2432–2489 nm section (Figure 8e), the FWHM2450 value of Li-rich pegmatite was more than that of Li-poor pegmatite. The asymmetry of the Li-rich pegmatite in this interval was studied.
It has been shown that the ratio of the 2200 nm absorption peak depth to the 1911 nm absorption peak depth, namely, Dep2200/Dep1911, can characterize the crystallinity of the altered minerals [59]. Figure 8f shows the ratio of the Al-OH/H2O characteristic parameters of the Li-rich and Li-poor pegmatites, where direct observation has no obvious regularity. The near-infrared spectral characteristics of the Al-OH chemical bond were mainly manifested in a single strong absorption peak and some secondary absorption peaks nearby, at approximately 2200 nm. Minerals containing Al-OH include kaolinite and muscovite, which make effective exploration indicators for the mineralized alteration minerals [57]. An analysis of Figure 8g,h, the absorption depth, and full width at half-maximum jointly affect the changes in the absorption area, as seen in the visual observation of the Li-bearing pegmatite and the Li-poor pegmatite. The discrimination between the two sets of data projected on the Depth-Area and FWHM-Area surfaces is not obvious.

3.2. Spectral Selection Based on Full Spectral Reflectance Characteristics

Compared with local waveform parameters, full spectral reflectance is commonly used for identification [48], but it is extremely susceptible to spectral resolution. Spectral characteristics subsets and spectral reflectance characteristic subsets in different transformed forms were selected by GA and Lars, and the subsets were used later for choosing the best strategy to discriminate Li-rich pegmatite samples.

3.2.1. Selection of the Best Spectral Resolution

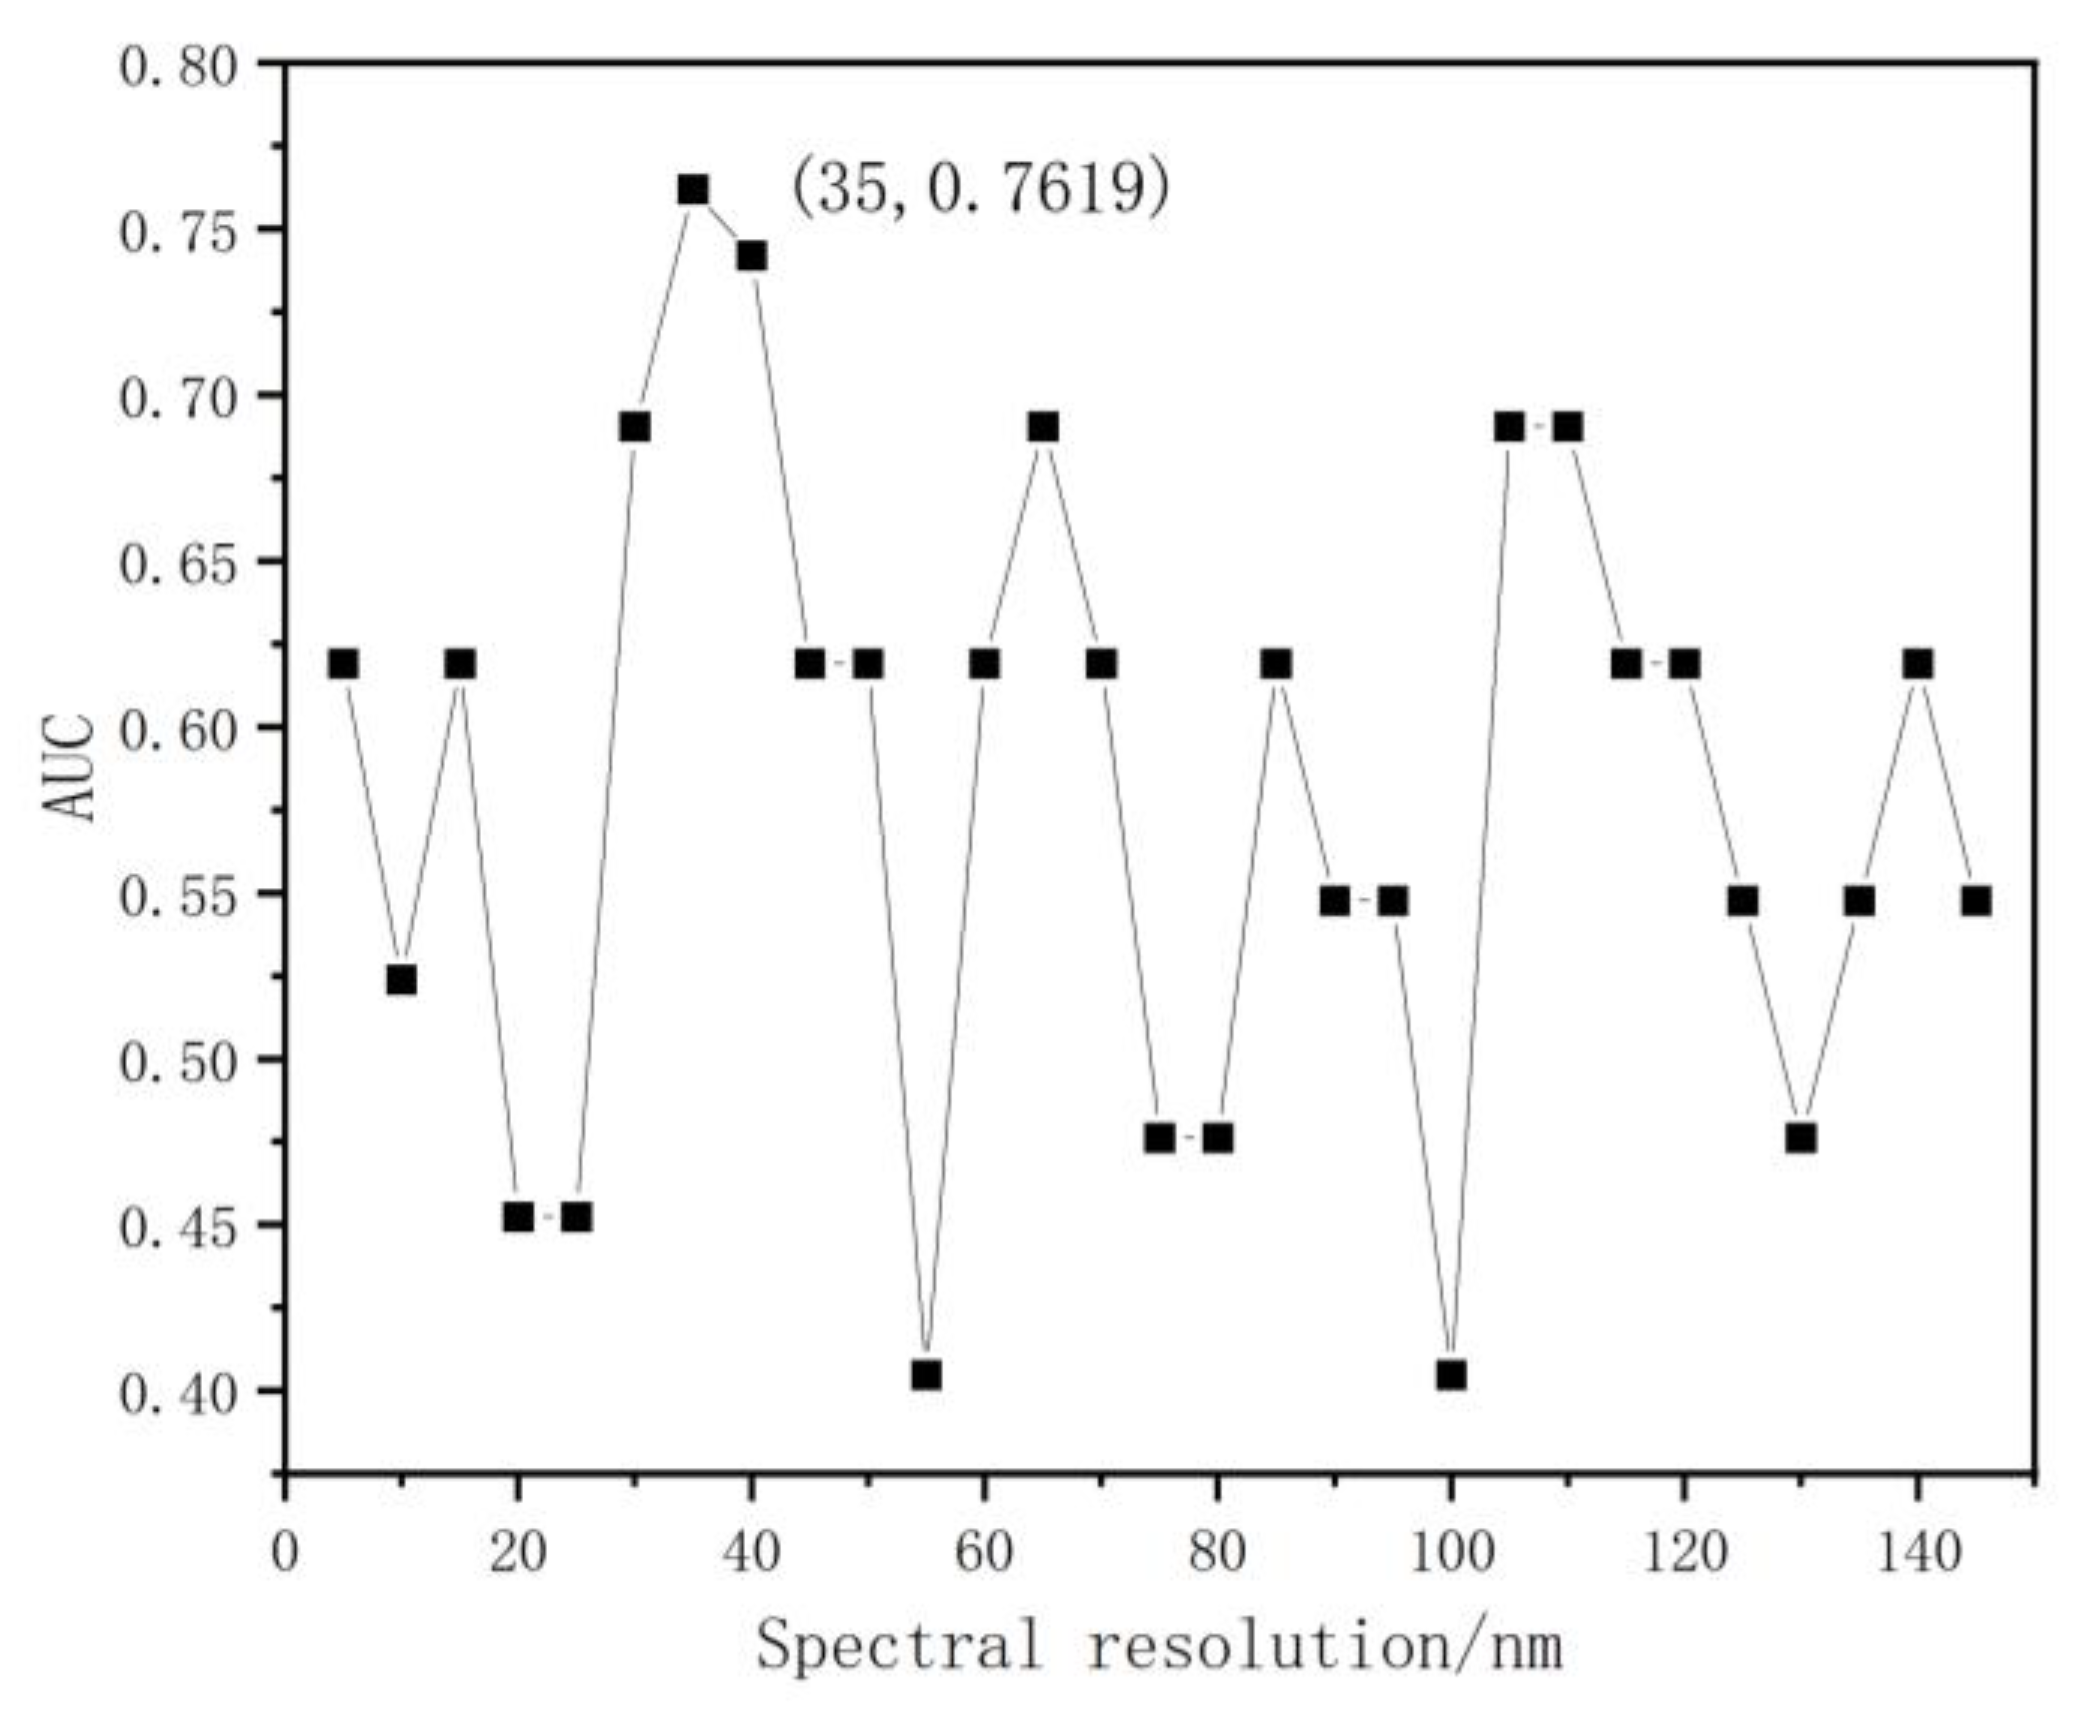
The band spacing of each spectral dataset measured by the near-infrared spectrum mineral analyzer was 1 nm, with a total of 2150 channels. The correlation between band data is strong, and there is redundancy between the adjacent spectra, which not only affects the model classification results but also reduces the operation speed [60]. Resampling the spectral curve can reduce the number of channels, but if the sampling width is too large, it may weaken the weak difference in the pegmatite spectrum; therefore, it is necessary to choose the best spectral resolution. First, the spectrum was sampled at 5–145 nm, with different resolutions. The random forest algorithm was then used to select the optimal spectral resolution of the samples. For the test set, 70% of the samples were randomly selected, and 30% were used as the training set. The classification accuracy of the different sampling widths was evaluated according to the AUC value, as shown in Figure 10. When the spectral resolution was 35 nm, the classification effect was at its best and the AUC value was 0.7619. Therefore, we used the VNIR–SWIR full spectral data with a sampling interval of 35 nm for the subsequent pegmatite identification tests.

3.2.2. Automatic Selection of Spectral Features

Selecting the optimal spectral subset not only simplifies the recognition model but also improves the calculation speed of the model, which has been demonstrated in many studies [61]. From the perspective of classification, in order to maximize the separability of Li-rich pegmatite and Li-poor pegmatite, the minimum angle-fitting algorithm and genetic algorithm were used to select the optimal band combination. The minimum angle-fitting algorithm selected the top 20 optimal bands. The spectral selection results are shown in Figure 11a–c. The genetic algorithm was used to select the sample features. For the test set, 70% of the samples were selected, then 30% of the samples were selected for the training set. Based on the previous reports and the actual characteristics of the data, the genetic algorithm parameters were set, including a chromosome length of 59, an initial population size of 100, a maximum breeding algebra of 200, a crossover rate of 0.5, and a mutation rate of 0.05. The feature-extraction results are shown in Figure 11d–f. The grey band indicates the selected band positions. It can be seen that the characteristic bands screened by the minimum angle regression algorithm are concentrated in the near-infrared range. For the original data, the intervals of 1015–1050 nm, 1295–1365 nm, 1435–1505 nm, 1575–1610 nm, 1680–1715 nm, 1855–1995 nm, and 2065–2170 nm were relatively dense (Figure 11a). For the data continuum removal spectra, the selected wavelength points were in the range of 1295–1700 nm, 1800–900 nm, and 2000–2200 nm (Figure 11b); as shown in Figure 11c, the selected band points in the first derivative data were approximately 1400–1550 nm, 1680–1850 nm, 2000 nm, and 2200–2300 nm. For the genetic algorithm, the original data are relatively dense in 740–1050 nm, 1200–1750 nm, 2300–2450 nm, and other intervals (Figure 11d); the features selected for the continuum removal spectra dataset are 300–600 nm, approximately 850 nm, 1200–1300 nm, 1500 nm, and 2300 nm (Figure 11e), while the feature locations of the first derivative dataset are 350–400 nm, 600–750 nm, 800–1225 nm, 1600–1800 nm, and 2250–2350 nm (Figure 11f). As mentioned above, the band features selected by the two methods formed a total of six characteristic segment subsets of raw data, continuum removal spectra, and first-derivative data.

3.3. Establishment and Verification of the Identification Model

ML algorithms have shown excellent performance in rock mineral identification; in this study, the random forest algorithm was employed. Random forest has a fast calculation speed, few parameter requirements, few statistical assumptions for training data, low sensitivity to noise or overfitting, and high extracting accuracy for spectral information. The random forest algorithm was used to establish the recognition model for Li-rich pegmatite and Li-poor pegmatite. Based on the full-range band, we input six feature band subsets, extracted by two algorithms and three forms into the model, respectively. Based on the local range features, we input four parameters extracted from five band intervals, including depth, full width at half maximum, area, and asymmetry. The grid search method was used to find the optimal super parameters and set the parameters of the original spectral data model according to the optimization results, as shown in Table 2 (Initialize random forest model parameters: n_Estimator: number of decision trees, Max_Depth: maximum depth of decision tree, min_samples_Leaf: the minimum number of samples required for a leaf node, min_samples_Split: the minimum number of samples required for segmentation) input the training set data, extract the training subset with a bootstrap, generate the decision tree, train the regression classification tree, and then evaluate the random forest model using the test dataset (OOB).
The West Kunlun environment is extremely harsh; the human and financial resource consumption of field sample collection is huge, and hence, a limited number of samples were collected. To ensure the accuracy of ML, many scholars have introduced methods for expanding the number of samples. Using the existing data enhancement method based on principal component analysis for reference [48], this study generated 72 new training sample sets with a sample size of twice the original datasets, based on the principal component transformation of two feature band subset training sets.
The ROC verification results are shown in Figure 12. From the subset of feature bands selected by minimum angular regression on the continuum removal data can be seen that, in addition to the RawLars data recognition model for the original data selected by minimum angular regression algorithm, the recognition effect before data enhancement (AUCRawLars = 0.685) was slightly better than that after data enhancement (AUCaug_RawLars = 0.680), and the recognition accuracy of the other groups were improved by different degrees after enhancement. The feature band subset was selected by a genetic algorithm on the first derivative data, and the random forest method employed after Aug_D1GA was used to identify the Li-rich pegmatite; the best effect was achieved, and the AUC value was 0.977. The genetic algorithm was used to select the recognition model data established by the original spectral data subset (RawGA). After Aug_RawGA, the recognition effect was significantly improved, and the AUC value increased from 0.778 to 0.969. On the whole, the model recognition effect of the amplified dataset is better and more stable. The AUC value of the recognition model based on local feature parameters is 0.843.
The grid search optimization results in Table 2, used to set the parameters of the random forest model, set the Gini coefficient of the random forest as the evaluation index of the key variable, calculate the importance of the characteristics and sort them; the top five identify variables were then selected and a statistical chart of the importance of the predictors of Li-rich pegmatite (Figure 13) was obtained. It can be seen from Figure 13a that the difference in the absorption area of approximately 2200 nm (Are2200) is the strongest predictor for the identification of Li-rich pegmatites, based on local spectral feature parameters, which have been mentioned in previous studies of the spodumene pegmatite and are difficult to observe directly by the naked eye (Figure 8h). The area is a comprehensive reflection of the absorption depth and full width at half-maximum. In the parameter analysis (Figure 8c), we found that FWHM2200 is relatively stable, with a narrow range of variation. Dep2200 is the main determinant of Area2200, so we speculate that the Al content is related to the Li-rich pegmatites. It can be observed that the absorption position of Li-rich pegmatites was excursed toward the short wavelength of about 10 nm, compared with Li-poor pegmatites (Figure 7). This phenomenon, corresponding to the asymmetry of approximately 2200 nm (Asy2200), is the second most important predictor for the identification of spodumene pegmatites. In previous studies, Dep1911 is positively correlated with the lithium content in rocks, which is considered to be an important factor for identifying spodumene pegmatite [6,36,37]; however, the model results in this study show that Area1911 is more important for the identification of Li-rich pegmatites. In the spectral studies of the altered minerals in porphyry copper mines, a full width at half-maximum feature of approximately 2200 nm is mostly used as an indicator of the crystallinity of clay minerals, and Dep2200/Dep1911 is commonly used for the value of favorable indications in the prospecting area [42,62], which are related to metallogenic temperature. Given that Are2200 and Are1911 were the strongest predictors for Li-rich pegmatite in the West Kunlun area, Dep2200/Dep1911, a ratio of the depth parameters related to these areas may also be of great significance for lithium resource exploration in this region. In Figure 13b, the band range of the strongest predictors in the optimal model of data enhancement, based on a feature subset selected by the genetic algorithm for the first-order derivative, were 1155–1190 nm, 1295–1330 nm, 1190–1225 nm, 1750–1785 nm, and 910–945 nm. Among them, the first derivative change near 1155–1225 nm may be caused by Fe2+. OH may cause the first derivative changes of 1750–1785 nm, 1295–1330 nm, and 910–945 nm, which may be caused by the presence of Fe3+ [63].
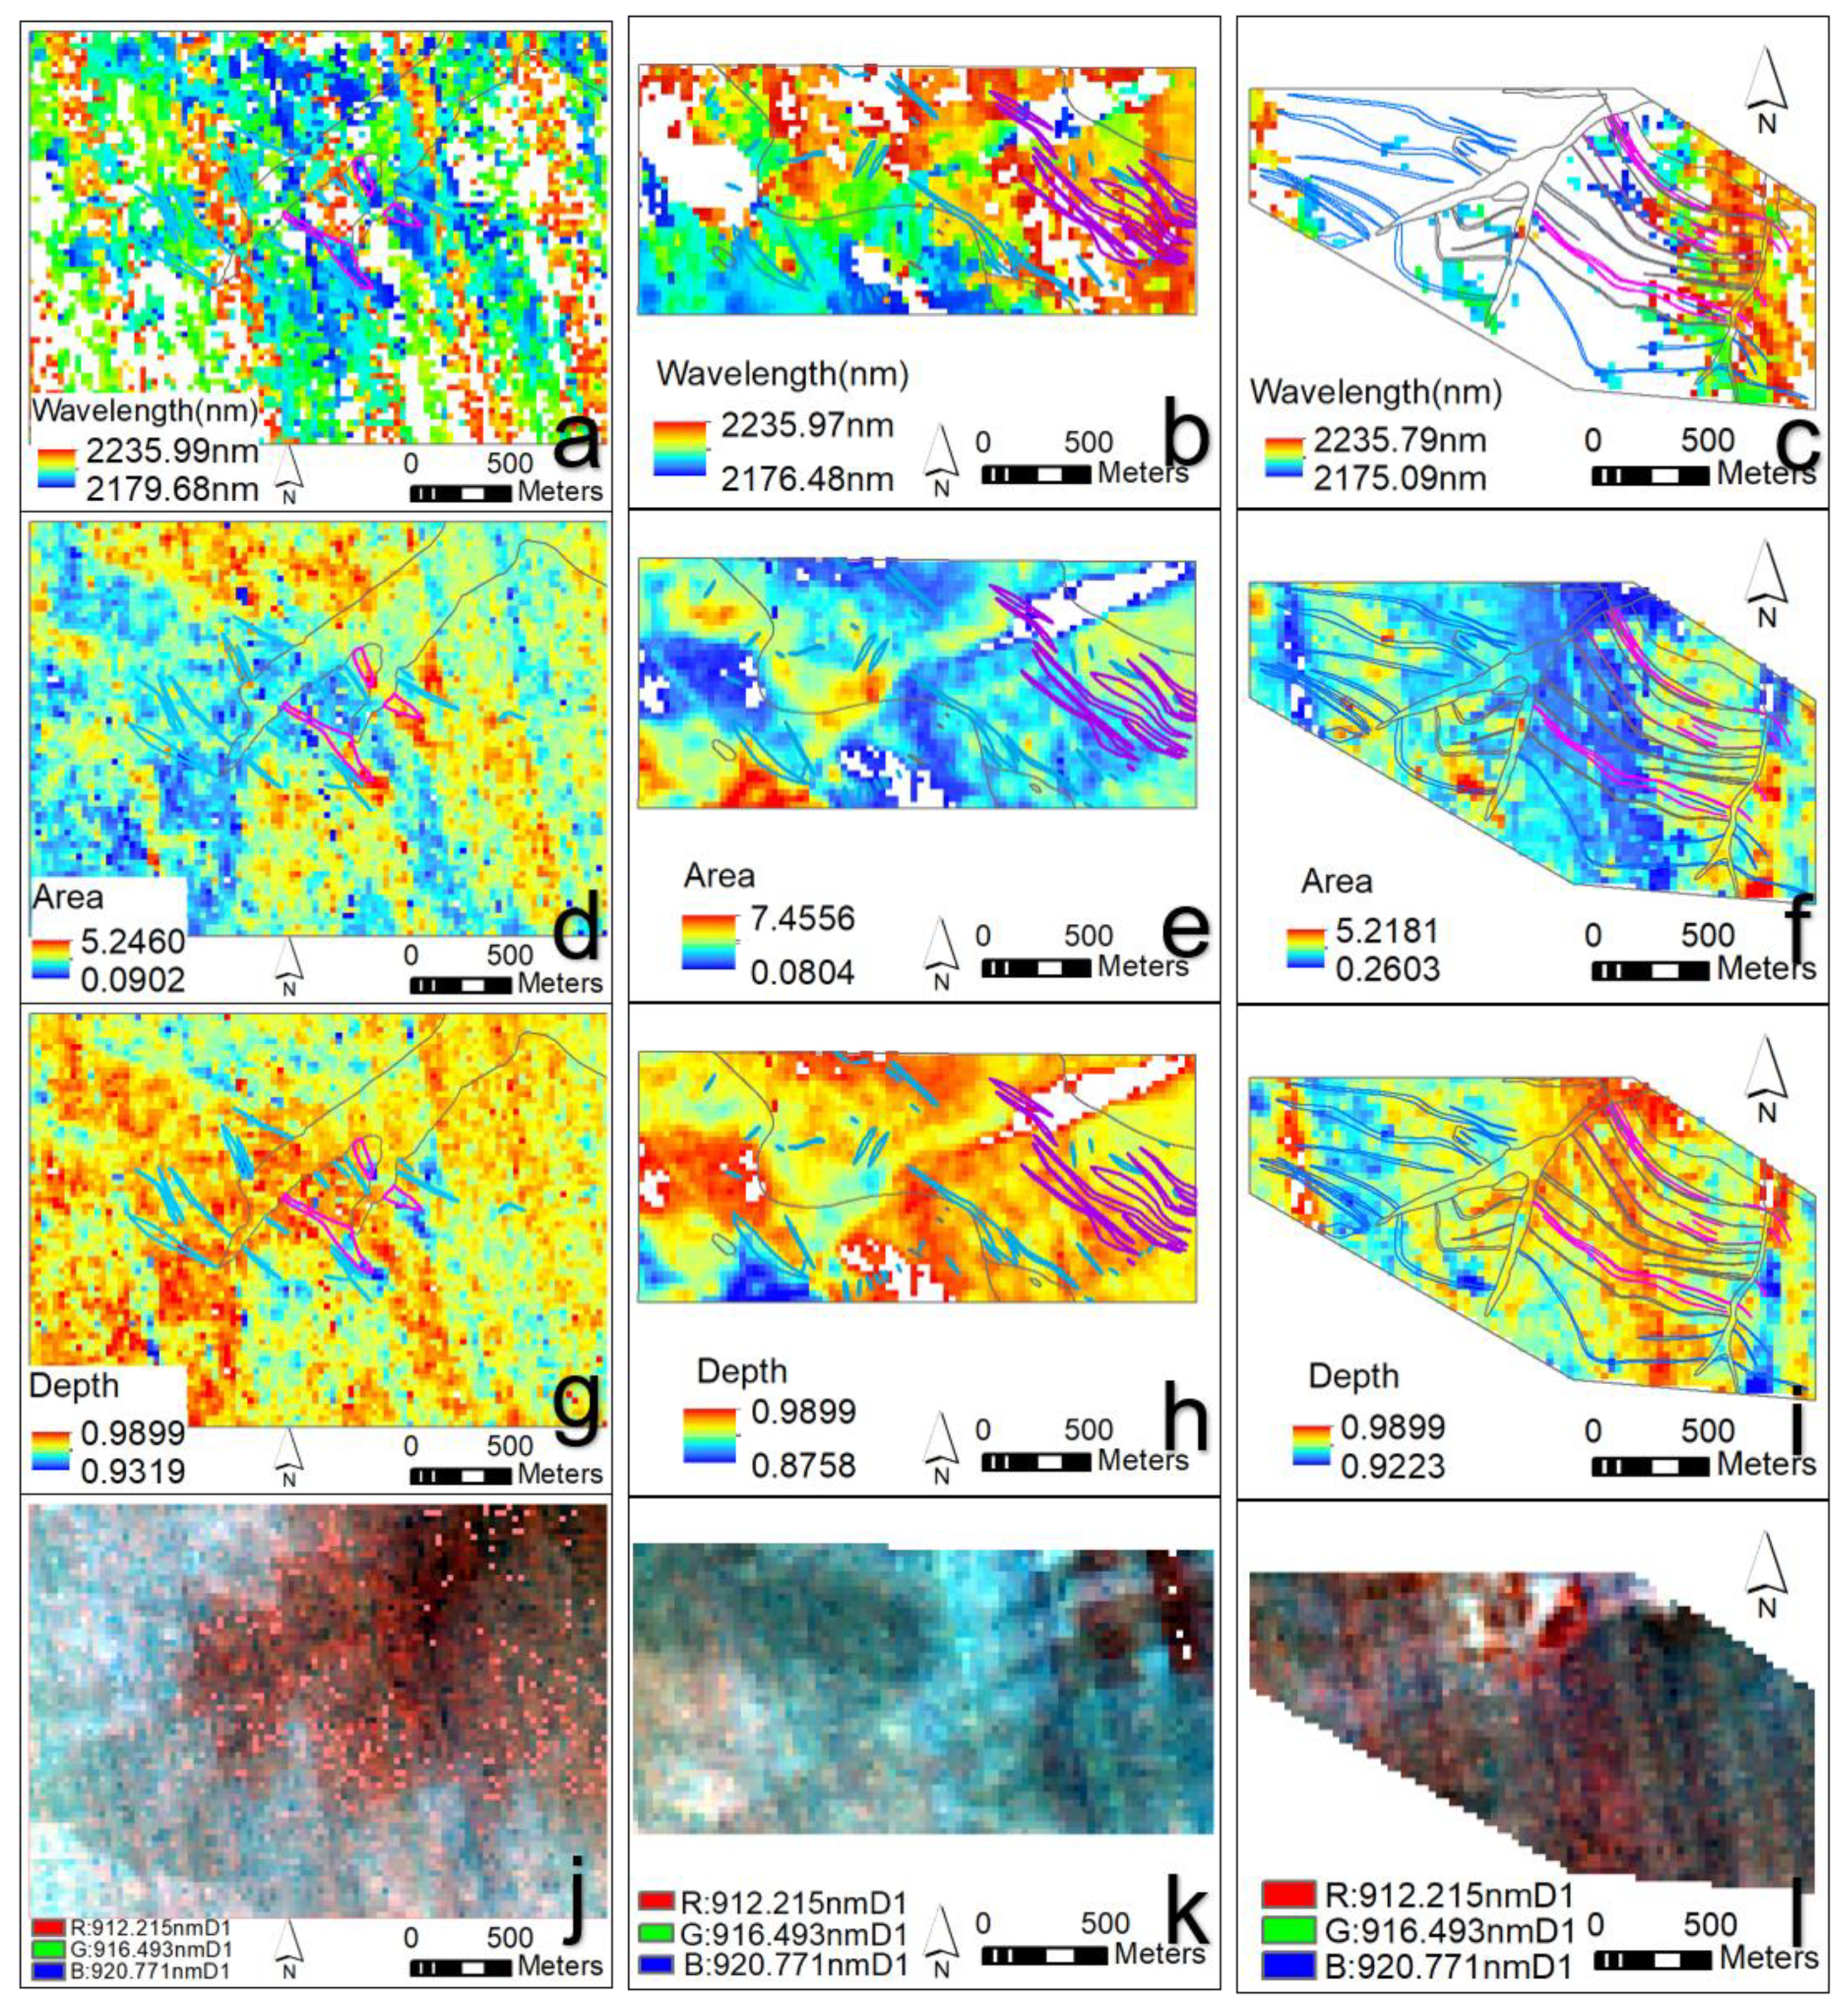
The previous analyses, combined with the above indicative factors, have been used to map the absorption features, namely, the absorption wavelengths, areas, and depths. GF-5 advanced hyperspectral imaging (AHSI) was selected to extract the corresponding variables. The spectra around 1413 nm and 1911 nm of the GF-5 AHSI imagery cannot be used, due to an intense overprint caused by the corrections intended to remove the effects of atmospheric absorption from water vapor, and the stripe noise interference near 2350 nm is serious. Therefore, only the absorption features around 2200 nm were used to map in the GF-5 AHSI imagery, including the area around the 2200 absorption wavelength position (Figure 14a–c), 2200 Area (Figure 14d–f), absorption depth (Figure 14g–i) around 2200, and the first-order derivative of the bands (Figure 14j–l), while the random forest algorithm was used as the classifier. The results are shown in Figure 13, below. The layer-stacked image was then fed into the RF training model to recognize the distribution of the Li mine lithological classes (Figure 15). The metasediment of the Bayankalashan group of Triassic deposits shows an absorption position around 2200 nm at longer wavelengths, Li-rich pegmatite at shorter wavelengths, greater absorption area, and smaller absorption depth. The phenomenon is most obvious in Akesayi. However, these findings are all consistent with the characteristics of Li-rich micas that we mentioned earlier in this research.
It can be seen from the confusion matrix in Figure 16 that pegmatite is easily misclassified into the metamorphic rocks of the Bayankalashan group with a certain probability, especially in the Longmenshan mining area, with its narrow veins (0.6 m–15.1 m) and distribution. This may be because the spatial resolution of the Gaofen-5 data is only 30 m, which is much larger than the pegmatite vein scale. In the future, airborne systems with higher spatial resolution and a wider spectral range will have the advantage of the greater spatial identification of Li-rich pegmatite.
The F1-score, the kappa, and the overall accuracy (OA) evaluation measures are used to judge the lithological mapping performance. The F1-score is the harmonic mean of precision and recall; the Kappa statistic corresponds to a measure of agreement between the classifier output and the reference data. OA is the ratio between the number of correct predictions of the model on all test sets and the number of populations. In terms of the result (Table 3), Akesayi and the 509 mine produced encouraging lithological mapping results (kappa > 0.9, OA > 94%). However, the classification results of Longmengshan have relatively low accuracy. Due to the wide pegmatite veins of Longmengshan, which are too small for mapping, mixed pixels lead to their being wrongly classified; in addition, this may also be caused by the classification imbalance. Aksayi and the 509 mine, with pegmatite outcrops, performed well, with high identification accuracy. The F1 scores of the Li-bearing pegmatite for these areas are 0.771 and 0.602, respectively.

4. Conclusions

Based on the local spectral diagnostic absorption characteristic parameter and the full spectral reflectance characteristic spectral datasets, the recognition models of Li-rich pegmatite were established, and the following conclusions were drawn:
(1)
The absorption waveform characteristic parameters of the local spectral diagnosis of the Li-rich pegmatite and Li-poor pegmatite at Dahongliutan were mainly located at 1408–1413 nm, 1895–1939 nm, 2195–2210 nm, 2335–2375 nm, and 2432–2489 nm, with five intervals according to the analysis of spectral curve waveform parameters, compared with Li-poor pegmatite. Mostly, the FWHM value of Li-rich pegmatite was smaller; the absorption depth was larger around 1911 nm. The absorption position around 2200 nm has a 10 nm drift toward the short-wave direction; the symmetry is greater than 0 around 2350 nm, the FWHM is larger, and the symmetry is higher around 2445 nm.
(2)
Using spectrum diagnosis waveform parameter quantitative values as variables, the local parameter identification effect was good, and the AUC value was 0.843, as calculated by the ROC curve. For the full spectral reflectance characteristics recognition model, the spectrum was resampled to 35 nm; then, using the genetic algorithm to select the first-order derivative data feature subset to enhance it, the data recognition model has the best effect. The highest AUC value was 0.977.
(3)
The Gini coefficient of the random forest model was taken as the key variable evaluation index to compare the importance of identification predictors in the model. Some of the waveform parameters were used for mapping on GF-5 and were then combined with the first-order derivative data of the important classification band position used for mapping the spatial distribution of Li-rich pegmatite and other related lithology in three different mines. The results show that the identification effect is better in those areas with large outcrops in the Aksayi and 509 mine; the kappa coefficients are 0.907 and 0.910, respectively.
Based on the above insights, we hold the opinion that the interpretation of absorption characteristic parameters in local spectral diagnosis is stronger when based on the full-range spectrum spectral reflectance characteristics of recognition; accuracy is higher and more efficient. Combining machine learning algorithms and feature parameters can further reveal the Li-rich pegmatite spectrum law of potential and achieve the Li-rich pegmatite spectral characteristics for comprehensive representation. The relevant research in this paper will also provide more accurate feature information and a research basis for the recognition of Li-rich pegmatite, based on remote sensing technology.

Author Contributions

L.C.: Conceptualization, data curation, software, formal analysis, methodology, visualization, writing—original draft. N.Z.: The proposer and designer of the research idea, conceptualization, methodology, funding acquisition, project administration, supervision, writing—review and editing. T.Z.: Conceptualization, data curation, funding acquisition. H.Z.: Data curation. J.C.: Data curation. J.T.: Data curation, writing—review and editing. Y.C.: Data curation. All authors have read and agreed to the published version of the manuscript.

Funding

This work was supported by the Young Scholars in Western China; the Chinese Academy of Sciences (grant number 2020-XBQNXZ-014); the Xinjiang Science Foundation for Distinguished Young Scholars (grant number 2022D01E01); the Major Science and Technology Project of Xinjiang Uygur Autonomous Region (grant number 2021A03001-4); the Geological Exploration Project of the Geological and Mineral Exploration and Development Bureau of Xinjiang Uygur Autonomous Region (XGMB202143).

Data Availability Statement

Not applicable.

Conflicts of Interest

The authors declare that they have no known competing financial interests or personal relationships that could have influenced the work reported in this study.

References

  1. Gourcerol, B.; Gloaguen, E.; Melleton, J.; Tuduri, J.; Galiegue, X. Re-assessing the European lithium resource potential—A review of hard-rock resources and metallogeny. Ore Geol. Rev. 2019, 109, 494–519. [Google Scholar] [CrossRef] [Green Version]
  2. Linnen, R.L.; Samson, I.M.; Jones, A.E.W.; Chakhmouradian, A. Geochemistry of the Rare-Earth Element, Nb, Ta, Hf, and Zr Deposits. In Treatise on Geochemistry, 2nd ed.; Elsevier: Amsterdam, The Netherlands, 2014; pp. 543–568. [Google Scholar]
  3. Linnen, R.L.; Lichtervelde, M.V.; Cerny, P. Granitic pegmatites as sources of strategic metals. Elements 2012, 8, 275–280. [Google Scholar] [CrossRef]
  4. Wang, H.; Gao, H.; Zhang, X.Y.; Yan, Q.H.; Xu, Y.; Zhou, K.; Dong, R.; Li, P. Geology and geochronology of the super-large Bailongshan Li–Rb–(Be) rare-metal pegmatite deposit, West Kunlun orogenic belt, NW China. Lithos 2020, 360–361, 105449. [Google Scholar] [CrossRef]
  5. Yin, R.; Huang, X.; Xu, Y.; Wang, C.; Wang, H.; Yuan, C.; Ma, Q.; Sun, X.; Chen, L. Mineralogical constraints on the magmatic–hydrothermal evolution of rare-elements deposits in the Bailongshan granitic pegmatites, Xinjiang, NW China. Lithos 2020, 352–353, 105208. [Google Scholar] [CrossRef]
  6. Gao, Y.; Bagas, L.; Li, K.; Jin, M.; Liu, Y.; Teng, J. Newly Discovered Triassic Lithium Deposits in the Dahongliutan Area, NorthWest China: A Case Study for the Detection of Lithium-Bearing Pegmatite Deposits in Rugged Terrains Using Remote-Sensing Data and Images. Front. Earth Sci. 2020, 8, 591966. [Google Scholar] [CrossRef]
  7. Galliski, M.A.; Perino, E.; Gasquez, J.; Zavalia, M.; Olsina, R. K-feldspar and white mica trace-element contents as a eeochemical guide for pegmatite exploration in the Panwean Pegmatitic Province. Rev. Asoc. Geológico Argent. 1997, 52, 24–32. [Google Scholar]
  8. Acosta, I.C.C.; Khodadadzadeh, M.; Delgado, R.T.; Gloaguen, R. Drill-core hyperspectral and geochemical data integration in a superpixel-based machine learning framework. IEEE J. Sel. Top. Appl. Earth Observ. Remote Sens. 2020, 13, 4214–4228. [Google Scholar] [CrossRef]
  9. Booysenab, R.; Lorenza, S.; Thiele, S.T.; Fuchsloch, W.C.; Marais, T.; Nex, P.A.M.; Gloaguen, R. Accurate hyperspectral imaging of mineralised outcrops: An example from lithium-bearing pegmatites at Uis, Namibia—ScienceDirect. Remote Sens. Environ. 2021, 269, 112790. [Google Scholar] [CrossRef]
  10. Liu, L.; Feng, J.; Rivard, B.; Xu, X.; Zhou, J.; Han, L.; Yang, J.; Ren, G. Mapping alteration using imagery from the Tiangong-1 hyperspectral spaceborne system: Example for the Jintanzi gold province, China. Int. J. Appl. Earth Obs. Geoinf. 2018, 64, 275–286. [Google Scholar] [CrossRef]
  11. Okada, N.; Maekawa, Y.; Owada, N.; Haga, K.; Kawamura, Y. Automated Identification of Mineral Types and Grain Size Using Hyperspectral Imaging and Deep Learning for Mineral Processing. Minerals 2020, 10, 809. [Google Scholar] [CrossRef]
  12. Schulz, B.; Merker, G.; Gutzmer, J. Automated SEM Mineral Liberation Analysis (MLA) with Generically Labelled EDX Spectra in the Mineral Processing of Rare Earth Element Ores. Minerals 2019, 9, 527. [Google Scholar] [CrossRef]
  13. King, T.V.V.; Clark, R.N. Spectral Characteristics of Serpentines and Chlorites Using High Resolution Reflectance Spectroscopy. Meteoritics 1986, 21, 412. [Google Scholar] [CrossRef]
  14. Zhang, X.; Li, P. Lithological mapping from hyperspectral data by improved use of spectral angle mapper. Int. J. Appl. Earth Obs. Geoinf. 2014, 31, 95–109. [Google Scholar] [CrossRef]
  15. Hunt Graham, R. Near-infrared (1.3–2.4 mu m) spectra of alteration minerals; potential for use in remote sensing. Geophysics 1979, 44, 1974. [Google Scholar] [CrossRef]
  16. Hunt, G.R. Spectral signature of particular minerals, in the visible and infrared. Geophysics 1977, 42, 501–513. [Google Scholar] [CrossRef] [Green Version]
  17. Clark, R.N.; Swayze, G.A.; Livo, K.E.; Kokaly, R.F.; Sutley, S.J.; Dalton, J.B.; McDougal, R.R.; Gent, C.A. Imaging spectroscopy: Earth and planetary remote sensing with the USGS Tetracorder and expert systems. J. Geophys. Res. Planets 2003, 108, 5131. [Google Scholar] [CrossRef]
  18. Meerdink, S.K.; Hook, S.J.; Roberts, D.A.; Abbott, E.A. The ECOSTRESS spectral library version 1.0. Remote Sens. Environ. 2019, 230, 111196. [Google Scholar] [CrossRef]
  19. van der Meer, F.D. Near-infrared laboratory spectroscopy of mineral chemistry: A review. Int. J. Appl. Earth Obs. Geoinf. 2018, 65, 71–78. [Google Scholar] [CrossRef]
  20. Wang, Z. Tectonic evolution of the western Kunlun orogenic belt, western China. J. Asian Earth Sci. 2004, 24, 153–161. [Google Scholar] [CrossRef]
  21. Harraden, C.L.; Mcnulty, B.A.; Gregory, M.J.; Lang, J.R. Shortwave Infrared Spectral Analysis of Hydrothermal Alteration Associated with the Pebble Porphyry Copper-Gold-Molybdenum Deposit, Iliamna, Alaska. Econ. Geol. 2013, 108, 483–494. [Google Scholar] [CrossRef]
  22. Hecker, C.; van Ruitenbeek, F.J.A.; Bakker, W.H.; Fagbohun, B.J.; Riley, D.; van der Werff, H.M.A.; van der Meer, F.D. Mapping the wavelength position of mineral features in hyperspectral thermal infrared data. Int. J. Appl. Earth Obs. Geoinf. 2019, 79, 133–140. [Google Scholar] [CrossRef]
  23. Xie, B.; Mao, W.; Peng, B.; Zhou, S.; Wu, L. Thermal-Infrared Spectral Feature Analysis and Spectral Identification of Monzonite Using Feature-Oriented Principal Component Analysis. Minerals 2022, 12, 508. [Google Scholar] [CrossRef]
  24. van der Meer, F.D. Analysis of spectral absorption features in hyperspectral imagery. Int. J. Appl. Earth Obs. Geoinf. 2004, 5, 55–68. [Google Scholar] [CrossRef]
  25. Chen, C.; Jiang, F.; Yang, C.; Rho, S.; Shen, W.; Liu, S.; Liu, Z. Hyperspectral classification based on spectral–spatial convolutional neural networks. Eng. Appl. Artif. Intell. 2018, 68, 165–171. [Google Scholar] [CrossRef]
  26. David, L. Reading Pegmatites: Part 3—What Lithium Minerals Say. Rocks Miner. 2017, 92, 144–157. [Google Scholar] [CrossRef]
  27. van der Meer, F.D.; van der Werff, H.M.A.; van Ruitenbeek, F.J.A.; Hecker, C.A.; Bakker, W.H.; Noomen, M.F.; van der Meijde, M.; Carranza, E.J.M.; Smeth, J.B.d. and Woldai, T. Multi- and hyperspectral geologic remote sensing: A review. Int. J. Appl. Earth Obs. Geoinf. 2012, 14, 112–128. [Google Scholar] [CrossRef]
  28. Zhang, H.; Gao, Q.; Guo, D. Thermal Infrared Reflectance Spectral Characteristics of Granitic Pegmatite Type Lithium Ore and Quantitative Inversion of Lithium Element. Mineral. Petrol. 2021, 41, 25–31. [Google Scholar] [CrossRef]
  29. Hui, G.; Gao, Q.; Song, L. Thermal Infrared Spectra Characteristics of Rare Metal Minerals and Rock in the Keketuohai Deposit, Xinjiang. Rock Miner. Anal. 2021, 40, 134–144. [Google Scholar] [CrossRef]
  30. Abdelkader, M.A.; Watanabe, Y.; Shebl, A.; El-Dokouny, H.A.; Dawoud, M. and Csámer, Á. Effective delineation of rare metal-bearing granites from remote sensing data using machine learning methods: A case study from the Umm Naggat Area, Central Eastern Desert, Egypt. Ore Geol. Rev. 2022, 150, 105184. [Google Scholar] [CrossRef]
  31. Cardoso-Fernandes, J.; Teodoro, A.C.; Lima, A. Remote sensing data in lithium (Li) exploration: A new approach for the detection of Li-bearing pegmatites. Int. J. Appl. Earth Obs. Geoinf. 2019, 76, 10–25. [Google Scholar] [CrossRef]
  32. Mashkoor, R.; Ahmadi, H.; Rahmani, A.B.; Pekkan, E. Detecting Li-bearing pegmatites using geospatial technology: The case of SW Konar Province, Eastern Afghanistan. Geocarto Int. 2022, 37, 1–22. [Google Scholar] [CrossRef]
  33. Morsli, Y.; Zerhouni, Y.; Maimouni, S.; Alikouss, S.; Kadir, H.; Baroudi, Z. Pegmatite mapping using spectroradiometry and ASTER data (Zenaga, Central Anti-Atlas, Morocco). J. Afr. Earth Sci. 2021, 177, 104153. [Google Scholar] [CrossRef]
  34. Wang, Z.; Zuo, R.; Dong, Y. Mapping of Himalaya Leucogranites Based on ASTER and Sentinel-2A Datasets Using a Hybrid Method of Metric Learning and Random Forest. IEEE J. Sel. Top. Appl. Earth Observ. Remote Sens. 2020, 13, 1925–1936. [Google Scholar] [CrossRef]
  35. Zhang, A.; Wang, R.; Li, Y.; Hu, H.; Lu, X.; Ji, J.; Zhang, H. Tourmalines from the Koktokay No. 3 pegmatite, Altai, NW China: Spectroscopic characterization and relationships with the pegmatite evolution. Eur. J. Mineral. 2008, 20, 143–154. [Google Scholar] [CrossRef]
  36. Dai, J.; Wang, D.; Dai, H. Reflectance Spectral Characteristics of Rocks and Minerals in Jiajika Lithium Deposits in West Sichuan. Rock Miner. Anal. 2018, 37, 507–517. [Google Scholar] [CrossRef]
  37. Cardoso-Fernandes, J.; Silva, J.; Perrotta, M.M.; Lima, A.; Teodoro, A.C.; Ribeiro, M.A.; Dias, F.; Barrès, O.; Cauzid, J.; Roda-Robles, E. Interpretation of the Reflectance Spectra of Lithium (Li) Minerals and Pegmatites: A Case Study for Mineralogical and Lithological Identification in the Fregeneda-Almendra Area. Remote Sens. 2021, 13, 3688. [Google Scholar] [CrossRef]
  38. Cardoso-Fernandes, J.; Teodoro, A.C.; Lima, A.; Roda-Robles, E. Semi-Automatization of Support Vector Machines to Map Lithium (Li) Bearing Pegmatites. Remote Sens. 2020, 12, 2319. [Google Scholar] [CrossRef]
  39. Tu, Q.; Han, Q.; Li, P.; Wang, D.; Li, J. Basic characteristics and exploration progress of the spodumene ore deposit in the Dahongliutan area, West Kunlun. Acta Geol. Sin. 2019, 93, 2862–2873. [Google Scholar]
  40. Tang, J.; Ke, Q.; Xu, X.; Kang, k.; Li, H.; Tan, K.; Dong, L.; Liu, Y. Magma evolution and mineralization of Longmenshan lithium-beryllium pegmatite in Dahongliutan area. West Kunlun. Acta Petrol. Sin. 2022, 38, 655–675. [Google Scholar] [CrossRef]
  41. Schmidt, K.S.; Skidmore, A.K. Smoothing vegetation spectra with wavelets. Int. J. Remote Sens. 2004, 25, 1167–1184. [Google Scholar] [CrossRef]
  42. Clark, R.N.; Roush, T.L. Reflectance spectroscopy: Quantitative analysis techniques for remote sensing applications. J. Geophys. Res. Solid Earth 1984, 89, 6329–6340. [Google Scholar] [CrossRef]
  43. Therien, C. Welcome to the PySptools Documentation. Available online: https://pysptools.sourceforge.io/ (accessed on 11 November 2022).
  44. Rinnan, Å.; van den Berg, F.; Engelsen, S.B. Review of the most common pre-processing techniques for near-infrared spectra. Trends Anal. Chem. 2009, 28, 1201–1222. [Google Scholar] [CrossRef]
  45. Efron, B.; Hastie, T.; Johnstone, I.; Tibshirani, R. Least angle regression. Ann. Stat. 2004, 32, 407–499. [Google Scholar] [CrossRef] [Green Version]
  46. Wang, J.; Cui, L.; Gao, W.; Shi, T.; Yin, G. Prediction of low heavy metal concentrations in agricultural soils using visible and near-infrared reflectance spectroscopy. Geoderma 2014, 216, 1–9. [Google Scholar] [CrossRef]
  47. Qin, K.; Ge, F.; Zhao, Y.; Zhu, L.; Li, M.; Zhou, X. Hapke Data Augmentation for Deep Learning-Based Hyperspectral Data Analysis With Limited Samples. IEEE Geosci. Remote Sens. Lett. 2020, 18, 886–890. [Google Scholar] [CrossRef]
  48. Charifi, R.; Es-sbai, N.; Zennayi, Y.; Hosni, T.; Bourzeix, F.; Mansouri, A. Sedimentary phosphate classification based on spectral analysis and machine learning. Comput. Geosci. 2021, 150, 104696. [Google Scholar] [CrossRef]
  49. Breiman, L.; Breiman, L.; Cutler, R.A. Random Forests Machine Learning. J. Clin. Microbiol. 2001, 2, 199–228. [Google Scholar] [CrossRef] [Green Version]
  50. Fawcett, T. An introduction to ROC analysis Tom. Pattern Recognit. Lett. 2006, 27, 861–874. [Google Scholar] [CrossRef]
  51. Yang, K.; Huntington, J.F.; Gemmell, J.B.; Scott, K.M. Variations in composition and abundance of white mica in the hydrothermal alteration system at Hellyer, Tasmania, as revealed by infrared reflectance spectroscopy. J. Geochem. Explor. 2011, 108, 143–156. [Google Scholar] [CrossRef]
  52. Scott, K.M.; Yang, K. Spectral Reflectance Studies of White Micas; Australian Mineral Industries Research Association Ltd.: Parkville, Australia, 1997; Volume 439, p. 35. [Google Scholar]
  53. Post, J.L.; Noble, P.N. The near-infrared combination band frequencies of dioctahedral smectites, micas, and illites. Clays Clay Miner. 1993, 41, 639–644. [Google Scholar] [CrossRef]
  54. Duke and Edward, F. Near infrared spectra of muscovite, Tschermak substitution, and metamorphic reaction progress: Implications for remote sensing. Geology 1994, 22, 621–624. [Google Scholar] [CrossRef]
  55. Laukamp, C.; Rodger, A.; LeGras, M.; Lampinen, H.; Lau, I.C.; Pejcic, B.; Stromberg, J.; Francis, N.; Ramanaidou, E. Mineral Physicochemistry Underlying Feature-Based Extraction of Mineral Abundance and Composition from Shortwave, Mid and Thermal Infrared Reflectance Spectra. Minerals 2021, 11, 347. [Google Scholar] [CrossRef]
  56. Foster, M.D. Interpretation of the Composition of Lithium Micas; United States Geological Survey Professional Paper; United States Government Printing Office: Washington, DC, USA, 1960; pp. 115–147.
  57. Yang, K.; Lian, C.; Huntington, J.F.; Peng, Q.; Wang, Q. Infrared spectral reflectance characterization of the hydrothermal alteration at the Tuwu Cu–Au deposit, Xinjiang, China. Miner. Depos. 2005, 40, 324–336. [Google Scholar] [CrossRef]
  58. Clark, R.N. Spectroscopy of rocks and minerals, and principles of spectroscopy. Remote Sens. Earth Sci. Man. Remote Sens. 1999, 3, 3–58. [Google Scholar]
  59. Han, J.; Chu, G.; Chen, H.; Hollings, P.; Sun, S.; Chen, M. Hydrothermal alteration and short wavelength infrared (SWIR) characteristics of the Tongshankou porphyry-skarn Cu-Mo deposit, Yangtze craton, Eastern China. Ore Geol. Rev. 2018, 101, 143–164. [Google Scholar] [CrossRef]
  60. Mariotto, I.; Thenkabail, P.S.; Huete, A.; Slonecker, E.T.; Platonov, A. Hyperspectral versus multispectral crop-productivity modeling and type discrimination for the HyspIRI mission. Remote Sens. Environ. 2013, 139, 291–305. [Google Scholar] [CrossRef]
  61. Li, H.D.; Liang, Y.Z.; Long, X.X.; Yun, Y.H.; Xu, Q.S. The continuity of sample complexity and its relationship to multivariate calibration: A general perspective on first-order calibration of spectral data in analytical chemistry. Chemom. Intell. Lab. Syst. 2013, 122, 23–30. [Google Scholar] [CrossRef]
  62. Laakso, K.; Peter, J.M.; Rivard, B.; White, H.P. Short-Wave Infrared Spectral and Geochemical Characteristics of Hydrothermal Alteration at the Archean Izok Lake Zn-Cu-Pb-Ag Volcanogenic Massive Sulfide Deposit, Nunavut, Canada: Application in Exploration Target Vectoring. Econ. Geol. 2016, 111, 1223–1239. [Google Scholar] [CrossRef]
  63. Hunt, G.R.; Ashley, R.P. Spectra of altered rocks in the visible and near infrared. Econ. Geol. 1979, 74, 1613–1629. [Google Scholar] [CrossRef]
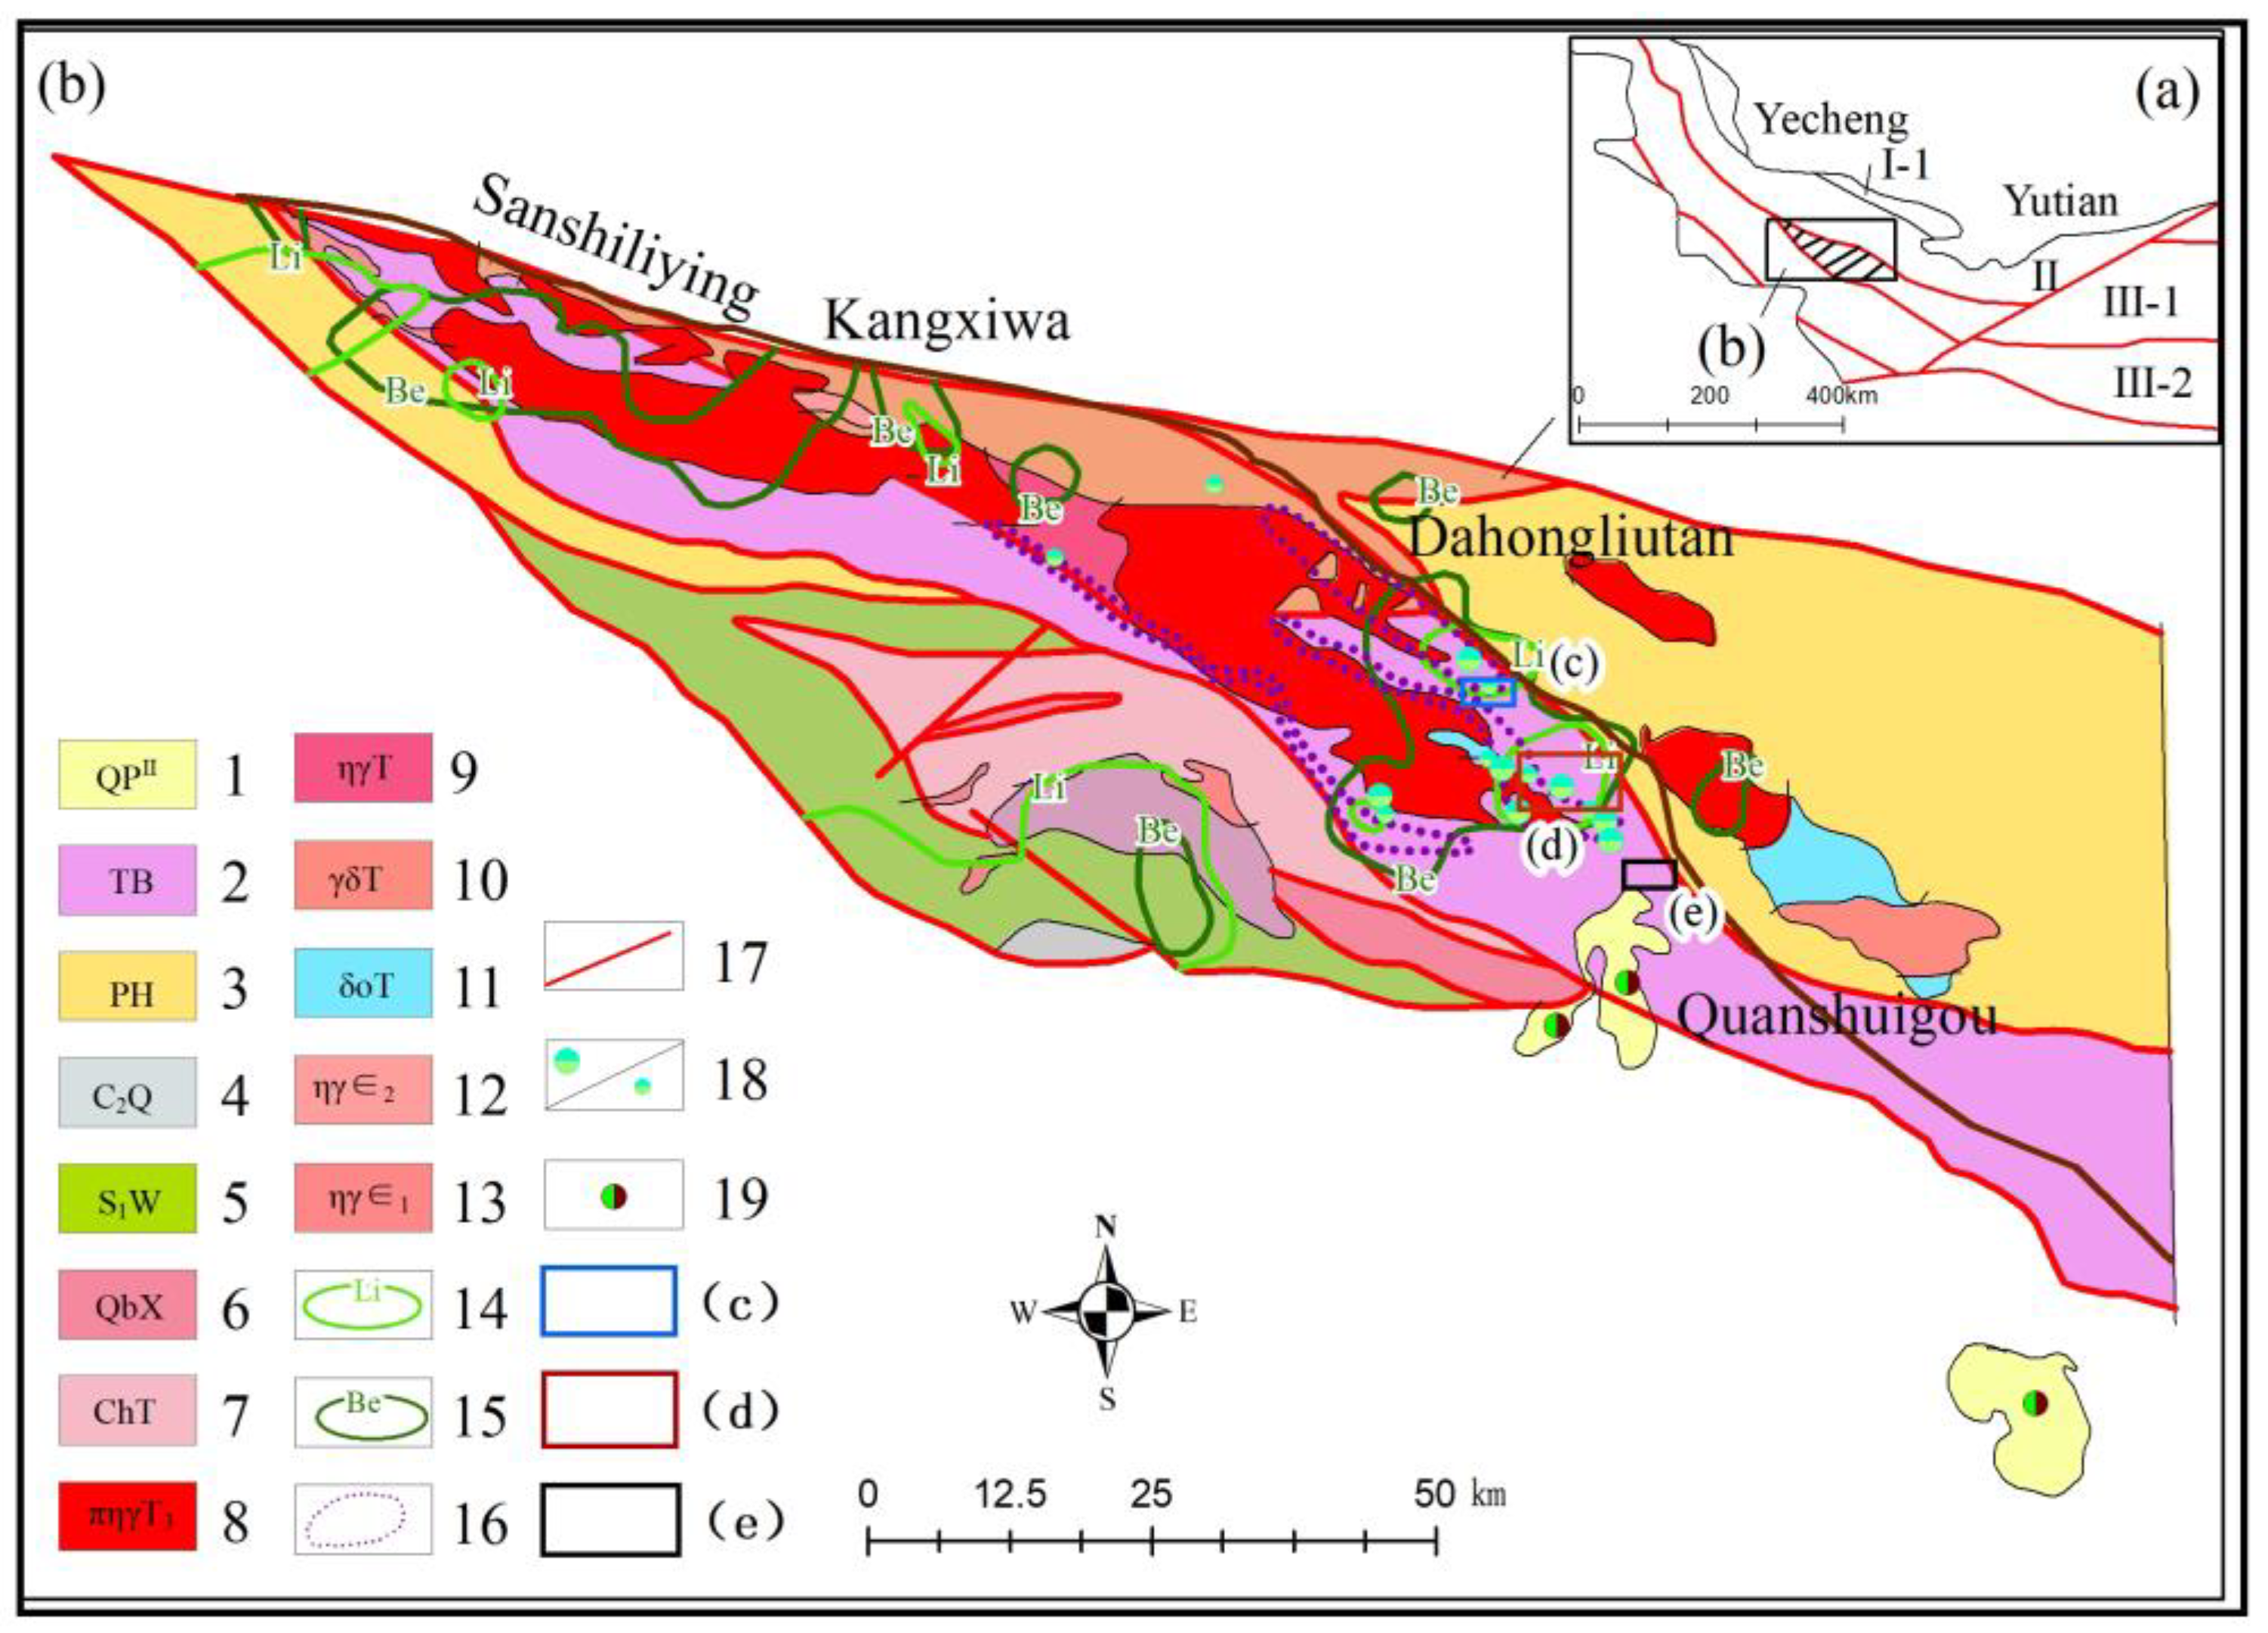
Figure 1. Geographical location of the research area (revision from [39]). 1—Quaternary salt lake; 2—Bayankalashan group of the Triassic; 3—Permian Huangyangling group; 4—Upper Carboniferous Qiatier group; 5—Wenquan Gou group of the Lower Silurian; 6—Qingbaikou system, Xiaoer Valley formation; 7—Tianshuihai group of the Changcheng system; 8—Late Triassic two-mica monzogranite; 9—Triassic monzogranite; 10—Triassic granodiorite; 11—Triassic quartz diorite; 12—Middle Cambrian monzogranite; 13—Early Cambrian monzogranite; 14—Li unit system anomaly of 500,000 geochemical explorations; 15—an anomaly of the Be unit system in 500,000 geochemical explorations; 16—Ore–zone boundary; 17—main fault structures; 18—pegmatite-type lithium beryllium deposit/ore site; 19—salt lake brine-type lithium mine. (a) Location of Dahongliutan area. (b) Distribution map of lithium deposits in Dahongliutan area. (c) Location of Akesayi. (d) Location of 509. (e) Location of Longmengshan.
Remotesensing 15 00493 g001
Figure 2. Distribution of the sampling points: (a) Akesayi mine, (b) the 509 mine, and (c) Longmengshan mine.
Remotesensing 15 00493 g002
Figure 3. Photos of specimens and microscopic images of pegmatites. (a) Li-poor pegmatite specimens; (b) Li-poor pegmatite microscopic images; (c) Li-rich pegmatite specimens; (d) Li-rich pegmatite microscopic images. Spd—spodumene; Qtz—quartz; Elb—tourmaline; Ab—albite; Pl—plagioclase; Kfs—K-feldspar; Ms—muscovite.
Remotesensing 15 00493 g003
Figure 4. Spectrum characteristic parameter diagram: (a) continuum removal; (b) feature parameter extraction.
Remotesensing 15 00493 g004
Figure 5. Diagram showing the principles of the random forest method.
Remotesensing 15 00493 g005
Figure 6. Spectral feature interval selection of the continuum removal spectra.
Remotesensing 15 00493 g006
Figure 7. Characteristic band location map. (Red represents Li-rich pegmatite, and blue represents Li-poor pegmatite.).
Remotesensing 15 00493 g007
Figure 8. Three-dimensional scatter diagram of depth (Dep), full width at half-maximum (FWHM), and the asymmetry (Asy) area (Are). (Red represents Li-rich pegmatite, and blue represents Li-poor pegmatite.)
Remotesensing 15 00493 g008
Figure 9. The spatial distribution of the characteristic parameters: (a) Akesayi mine, (b) the 509 mine, (c) Longmengshan mine).
Remotesensing 15 00493 g009
Figure 10. Selection of the optimal spectral resolution.
Remotesensing 15 00493 g010
Figure 11. Automatic selection results of spectral features (red represents Li-rich pegmatite, blue represents Li-poor pegmatites, and the gray band indicates the selected band position). (a) Minimum angle regression feature selection of the original spectrum. (b) Minimum angle regression feature selection of continuum removal spectra. (c) Minimum angle regression feature selection of the first derivative. (d) Genetic algorithm feature selection of the original spectrum. (e) Genetic algorithm feature selection of the continuum removal spectra. (f) Genetic algorithm feature selection of the first derivative.
Remotesensing 15 00493 g011
Figure 12. ROC curves.
Remotesensing 15 00493 g012
Figure 13. (a,b) Statistical chart of importance and the ranking of the predictors.
Remotesensing 15 00493 g013
Figure 14. Predictor map (around the 2200 absorption wavelength position) of the: (a) Akesayi mine, (b) 509 mine, (c) Longmengshan mine, 2200 Area, (d) Akesayi mine, (e) 509 mine, (f) Longmengshan mine (absorption depth of around 2200), (g) Akesayi mine, (h) 509 mine, and (i) Longmengshan mine, and the first-order derivative of the bands of the (j) Akesayi mine, (k) 509 mine, and (l) Longmengshan mine).
Remotesensing 15 00493 g014
Figure 15. Classification map, based on the RF classifiers, with GF-5 AHSI data: (a) Akesayi mine, (b) 509 mine, and (c) Longmengshan mine.
Remotesensing 15 00493 g015
Figure 16. Confusion matrix for the RF classifiers. The rows and columns of the matrix represent the actual and predictive lithologic units, respectively: (a) Akesayi mine, (b) 509 mine, (c) Longmengshan mine. Q—Quaternary sediments, TB—Bayankalashan group of Triassic, ρ—Li-poor pegmatite, Li-ρ—Li-rich pegmatite, Granite—porphyritic biotite monzogranite, Diorite—porphyritic quartz diorite).
Remotesensing 15 00493 g016
Table 1. Confusion matrix of the classification results.
Predicted
Real
Validation Dataset
PN
Predictive datasetTTrue PositiveFalse Positive
FTrue NegativeFalse Negative
(T: True; P: Positive; F: False; N: Negative).
Table 2. Identify the model parameter list.
DatasetPre-ProcessingParameter
n_EstimatorMax_DepthMin_Samples_LeafMin_Samples_Split
Full-rangeLarsRaw53012
CR54014
D1251514
GARaw52024
CR251014
D1253022
Aug-LarsRaw54512
CR55024
D152513
Aug-GARaw101512
CR102023
D1101012
local features102512
Table 3. Comparison of the different evaluation measures for RF classifiers.
F1-ScoreKappaOA (%)
QTBρLi-ρGraniteDiorite
Akesayi0.9590.9890.4640.771--0.90798.045%
5090.9670.9510.5760.6020.9810.9290.91094.522%
Longmengshan0.7940.9440.4260.1540.821-0.58389.897%
(Q: Quaternary sediments, TB: Bayankalashan group of Triassic, ρ: Li-poor pegmatite, Li-ρ: Li-rich pegmatite, Granite: porphyritic biotite monzogranite, Diorite: porphyritic quartz diorite).
Disclaimer/Publisher’s Note: The statements, opinions and data contained in all publications are solely those of the individual author(s) and contributor(s) and not of MDPI and/or the editor(s). MDPI and/or the editor(s) disclaim responsibility for any injury to people or property resulting from any ideas, methods, instructions or products referred to in the content.