Article

Long-Term Tibetan Alpine Vegetation Responses to Elevation-Dependent Changes in Temperature and Precipitation in an Altered Regional Climate: A Case Study for the Three Rivers Headwaters Region, China

1
Shenzhen Institute of Information Technology, College of Transportation and Environment, Shenzhen 518109, China
2
Water Science and Environmental Engineering Research Center, College of Chemical and Environmental Engineering, Shenzhen University, Shenzhen 518060, China
3
State Key Laboratory of Hydroscience and Engineering, Tsinghua University, Beijing 100190, China
4
School of Environment and Civil Engineering, Dongguan University of Technology, Dongguan 523820, China
5
State Key Laboratory of Plateau Ecology and Agriculture, Qinghai University, Xining 810016, China
*
Author to whom correspondence should be addressed.
Remote Sens. 2023, 15(2), 496; https://doi.org/10.3390/rs15020496
Submission received: 30 November 2022 / Revised: 10 January 2023 / Accepted: 10 January 2023 / Published: 13 January 2023
(This article belongs to the Special Issue Remote Sensing for Climate Change)

Abstract

:
Recent studies offer more evidence that the rate of warming is amplified with elevation, indicating thereby that high-elevation ecosystems tend to be exposed to more accelerated changes in temperature than ecosystems at lower elevations. The phenomenon of elevation-dependent warming (EDW), as one of the regional climate-change impacts, has been observed across the Tibetan Plateau. Studies have often found large-scale greening trends, but the drivers of vegetation dynamics are still not fully understood in this region, such that the local implications of vegetation change have been infrequently discussed. This study was designed to quantify and characterize the seasonal changes in vegetation across the Three Rivers Headwaters Region (TRHR), where the land cradles the headwaters of the Yangtze, the Yellow, and the Lancang (Mekong). By mapping the normalized difference vegetation index (NDVI) over the growing season from 1982 to 2015, we were able to evaluate seasonal changes in vegetation cover over time. The results show a slightly increased tendency in green vegetation cover, which could possibly be attributed to sustained warming in this region over the past three decades, whereas a decline in the green-up rate with elevation was found, indicating an inconsistent trend of vegetation greening with EDW. The cause of the green-up rate decline at high elevations could be linked to the reduced soil water availability induced by the fast increase in warming rates associated with EDW. The findings of this study have important implications for devising adaptation strategies for alpine ecosystems in a changing climate.

1. Introduction

Climate change has become a recognized cause of major alterations to natural ecosystems, with many climate-driven changes already being observed in biotic community structure and plant species composition [1,2]. Growing evidence suggests that the rate of warming is amplified with elevation, such that high-elevation ecosystems tend to be exposed to more accelerated changes in temperature than ecosystems at lower elevations [3,4,5]. The phenomenon of elevation-dependent warming (EDW), as one of the regional climate-change impacts, has been observed and recognized as a contributing cause of shifts in species distribution, hydrological regimes, and biochemical cycles in high-elevation regions [6]. Alpine ecosystems are known to be particularly susceptible to climate change because of their unique thermodynamic properties [7]. In light of the vulnerability of ecosystem services in alpine regions, e.g., biodiversity, water cycling, and carbon sequestration, shifts in ecosystem composition, structure, and function are likely to have far-reaching social and economic implications for local and regional areas [8]. Vegetation is a vital part of healthy, functioning ecosystems, and serves as a foundation for terrestrial food webs and habitat for animals [9,10]. It helps to cycle energy and nutrients throughout an ecosystem as well as improving water quality and reducing soil erosion [11,12,13]. Therefore, monitoring vegetation change across remote regions and quantifying ecosystem feedbacks to climate change has become a topic of increasing interest among academics in recent years [14,15]. Rapid technological advancement has accelerated the growth of remote sensing and enabled a more comprehensive assessment of vegetation change across a variety of spatial and temporal scales [16,17,18,19,20]. The normalized difference vegetation index (NDVI) is a standardized metric that describes the difference between visible and near-infrared reflectance of vegetation cover, allowing for more detailed information that links vegetation greening patterns to drivers [21]. Moreover, because of its simple estimation, high availability, and noise elimination, the NDVI has been widely used for regional-to-global-scale vegetation monitoring and assessment [22,23,24,25,26].
It has been successfully used by many researchers to measure trends in greening at northern latitudes and high elevations [27,28,29,30]. In general, the interactions between different climatic variables, such as precipitation, temperature, and solar-radiation-driven evapotranspiration, could affect vegetation greenness [31]. It is reported that high warming rates are recognized as the essential driver of vegetation growth [32]. However, different results may be obtained for different terrestrial characteristics and regional climate environments. For instance, Angert et al. found drought-induced reduction in photosynthesis throughout the growing season at both middle and high latitudes, indicating that the relationship between temperature changes and vegetation growth may change with elevation [33]. Trujillo et al. demonstrated that vegetation greening trends varied with elevation and maximum greenness could be observed in mid-latitude mountain regions [34]. Piao et al. suggested that vegetation growth was generally positively correlated with high warming rates but the correlation could change over time following alternations in other environmental factors, particularly in areas above a latitude of 30 degrees north [35]. Kumari et al. indicated that vegetation growth was more related to evapotranspiration than precipitation in the UKR Basin in the Himalayas [25]. These findings indicate that the driving mechanism of the correlation between elevation-dependent warming (EDW) and vegetation greening is not yet fully understood and that there are large uncertainties regarding climate change impacts at higher elevations. Given the knowledge gaps in the current understanding of EDW and high-elevation vegetation change, expanded efforts to shed further light on this research topic could advance the understanding of the exact driving mechanism.
The Three Rivers Headwaters Region (TRHR) lies in the hinterland of the Tibetan Plateau, and its 363,000 km2 of land cradles the headwaters of the Yangtze, the Yellow, and the Lancang (Mekong). This region is also known as China’s water tower, providing runoff for these three rivers as well as for several hundred million people downstream. Specifically, The TRHR provides 25% of the annual runoff of the Yangtze, 49% of the Yellow, and 15% of the Lancang [36]. The alpine ecosystem of the TRHR is characterized by high biodiversity, including endemic species not found anywhere else, and a high-plateau climate, meaning large diurnal and monthly temperature variations across the region. The phenomenon of EDW, as one of the regional climate-change impacts, has been commonly observed here, possibly owing to the warming rate in this region, which is twice as high as the global average [37]. The increased rate of warming could have a profound effect on the biosphere processes in the TRHR, with many and diverse impacts on local biological resources, e.g., common vegetation and habitat types. In addition, the distinctive landform and geologic characteristics have also made the TRHR highly vulnerable to climate change; for example, soils in this region are thin and coarse-textured, making them more susceptible to soil erosion [38]. The TRHR is of significant value to nature conservation and ecological services within regional and national contexts, and has become a hotspot of regional climate concerns due to the escalating number of droughts, vegetation degradation, and extreme-climate-related conditions. Additionally, further research on this region can also improve the understanding of ecosystem dynamics and vegetation change at high altitudes [8,39,40,41]. However, some studies within this region also find positive ecological feedbacks associated with the local anthropogenic and climatic changes. For example, grassland productivity has been found to be significantly improved, possibly as a result of successful efforts to implement alpine conservation and ecological restoration programs as well as consistent increases in temperature [42,43] Given the spatial heterogeneity of vegetation change in high-elevation regions, researchers often focus their attention on ecological and environmental impacts with regard to specific factors, e.g., climate change, grazing activities, water-use patterns, and environmental conservation programs [43,44,45]. However, another factor in vegetation change, also driven by EDW, has not been studied adequately in the TRHR. As aforementioned, many studies have found that EDW plays a potentially important role in altering vegetation growth patterns at higher elevation. Therefore, there is a need to ensure adequate analysis and interpretation of EDW in this hotspot region. In addition, the TRHR is composed of a variety of vegetation cover types, including grasslands, barren lands, forests, croplands, wetlands, etc. In light of the diverse vegetation cover types, the vegetation patterns and dynamics within the TRHR may also be altered fundamentally by warmer temperatures, but few researchers have discussed the potential impacts of vegetation composition on vegetation change in this region. It is therefore imperative that researchers make new efforts to advance the understanding of the internal vegetation variability across vegetation types and the external drivers associated with spatial heterogeneity.
This study was designed to quantify and characterize the seasonal changes in vegetation using more than 30 years of remote sensing data across the TRHR so as to help further the understanding of the role of EDW in changing alpine vegetation growth patterns in this region. Specifically, our research steps included: (i) investigating the interannual variability in the growing-season NDVI (NDVIgs) from May to September across the TRHR between 1982 and 2015; (ii) examining the correlation between NDVIgs and elevation as well as driving forces behind changes in NDVIgs using multiple statistical approaches; (iii) assessing the effects of temperature and precipitation changes on vegetation over time so as to identify the climate variables that most affect vegetation productivity; and (iv) exploring the linkages between vegetation composition and greening trends to help further the understanding of NDVIgs change across vegetation types. Results from this study will be beneficial for advancing the understanding of EDW in high-elevation regions, e.g., the TRHR, and of particular value to the local authorities in evaluating ecological and environmental conservation programs.

2. Materials and Methods

2.1. Study Area

The TRHR (31°39′–37°10′ N, 89°24′–102°27′ E) is located in the northeastern part of the Qinghai–Tibet Plateau, with a total area of about 363,000 km2. The elevation in the TRHR ranges from about 2000 m in the northeastern corners to above 6800 m in the ridges of the western mountains, and the average elevation of the region is nearly 4500 m (Figure 1). This region has a typical continental climate with warm, humid summers and cold, arid winters [46]. Additionally, there is significant temporal variability in precipitation and temperature across the TRHR. For instance, about 60% of the region’s annual rainfall occurs in the summer months, and the monthly average temperature is above 0 °C only during the growing season, from May to September [47]. Over the past decades, the TRHR has experienced a striking change in local climate and been confronted with a series of climate-related issues, such as grassland degradation, soil erosion, glacier retreat, and lake and wetland decline [48]. Therefore, central and local governments have long undertaken ecological interventions to reverse the degradation of local ecosystems and to help them regain their ecological functionality in a changing climate. The central government has also set aside protected land for the Three-Rivers Nature Reserve in this region to preserve the natural heritage of the Tibetan Plateau.

2.2. Remote Sensing Data

2.2.1. Land Cover Data

The land cover data were derived from the Finer Resolution Observation and Monitoring of Global Land Cover dataset (FROM-GLC 2017v1, http://data.ess.tsinghua.edu.cn/ (accessed on 1 December 2021)). The FROM-GLC dataset is the first 30 m resolution global land cover product generated using Landsat Thematic Mapper (TM) and Enhanced Thematic Mapper Plus (ETM+) data, and is publicly accessible from Tsinghua University. As shown in Figure 2, the categories of grassland and barren land are the most prevalent in the TRHR and the most common types of land cover, accounting for about 94% coverage of the region (Figure 2b). The other categories account for the remaining 6%.

2.2.2. NDVI Data

We used the Global Inventory Monitoring and Modeling Studies (GIMMS) NDVI3g dataset in this study. This dataset was generated from several advanced very high resolution radiometer (AVHRR) sensors onboard the U.S. National Oceanic and Atmospheric Administration (NOAA) series satellites at 0.083° over the years 1982 through 2015. The GIMMS-NDVI3g dataset has been calibrated for sensor degradation, inter-sensor differences, cloud cover, solar zenith angle, etc., and has also been widely proved to be suitable for assessing temporal changes in vegetation [49,50]. The monthly NDVI data were calculated using the semi-monthly values and synthesized using the maximum-value composite method. This method can help greatly reduce the impact of clouds and aerosols on the vegetation index retrieval algorithm [51]. The mean growing-season NDVI (NDVIgs) was used to map the vegetation greenness changes across the TRHR (Figure 2a).

2.2.3. Climatic Data

The monthly precipitation data were obtained from the Climate Hazards Group InfraRed Precipitation with Stations (CHIRPS) dataset at 0.05° resolution for 1982 to 2015. The monthly temperature data were derived from the European Centre for Medium-Range Weather Forecasts (ECMWF) dataset at 0.125° resolution for 1982 to 2015. In order to allow for a finer resolution of data analysis, the climatic datasets were interpolated to a higher resolution, 0.0833°, to ensure the compliance of the climate data’s resolution with that of the NDVI data.

2.2.4. Evapotranspiration Estimation from GLEAM

The monthly evapotranspiration (ET) and potential ET (PET) data were obtained from the Global Land Evaporation Amsterdam Model (GLEAM) dataset at 0.25° resolution for 1982 to 2015, which can reasonably capture the evaporation variability in all vegetation types and climate conditions [52,53]. GLEAM-ET is estimated by using reanalysis net radiation and air temperature, satellite-, reanalysis-, and gauge-based precipitation, satellite-based vegetation optical depth, and snow water equivalents. The ET modeling algorithm is defined by Martens et al. [52] as follows:
  E T = E p S + E i  
where Ep is the potential evapotranspiration, estimated using the Priestley and Taylor equation driven by observations of surface net radiation and near-surface air temperature; S is the evaporative stress factor, calculated from the observations of microwave vegetation optical depth (VOD) and estimates of root-zone soil moisture; Ei is the interception loss, calculated using a Gash analytical model.
The general information of data used in this study has been summarized in Table 1.

2.2.5. Methods

Multiple analysis methods were used in this study to reflect the characteristics of NDVI trends at different elevations. Firstly, the non-parametric Mann–Kendall (MK) test was used to evaluate long-term changes in vegetation cover and to identify greening patterns across the TRHR. Previous studies indicated that serial correlation in hydrological or climatic series may result in larger standard errors and lead to misleading trend estimates [54,55,56] Thus, the trend-free pre-whitening (TFPW) procedure was integrated with the MK test to improve the reliability of trend analysis [55]. After application of the TFPW-MK test, the trend slope was estimated as follows:
  b = Median x j     x i j     i ,   i   <   j
where b is the trend slope; xi denotes the ith datum.
Next, by using both average-data and pixel-based methods, the trend changes in the NDVI across the region were linked to drivers such as elevation. This allows for a better understanding of the role of elevation in driving vegetation changes across elevational gradients.
The relationships between trends in the NDVI and climatic variables were investigated using the following linear least-squares regression model:
  y i = ax i + b + ε i ,   i = 1 , , n
where yi denotes the dependent variable; x denotes the independent variable; n is the sample size; a is the slope; b is the intercept; and εi is the random error.
The correlations between the trend changes in the NDVI and elevation as well as relevant climatic variables could be evaluated with Spearman rank correlation analysis:
r = i x i x ¯ y i y ¯ i x i x ¯ 2 i y i y ¯ 2 , i = 1 , , n
where x and y are the variables; n is the sample size. Student’s t-test was applied to evaluate the statistical significance in a trend analysis.
With regard to the roles of climatic factors in vegetation growth, their effects on elevation-dependent changes in NDVI trends can be understood through partial correlation analysis. Partial correlation analysis is an effective way to investigate the net effect of one independent variable when multiple independent variables act on a dependent variable simultaneously [57,58]. The partial correlation coefficient is defined as follows:
  R xy z = r xy     r xz r yz ( 1     r xz 2 ) ( 1     r yz 2 )
where x and y denote the independent variables; z denotes the dependent variable; r denotes the correlation coefficient between different variables; and R represents the degree of correlation. The null hypothesis assumed that there was no linear correlation between the two independent variables, and the significance level of the hypothesis test was set at α = 0.05 in this study.

3. Results

3.1. Spatiotemporal Variations in NDVIgs and Climatic Variables

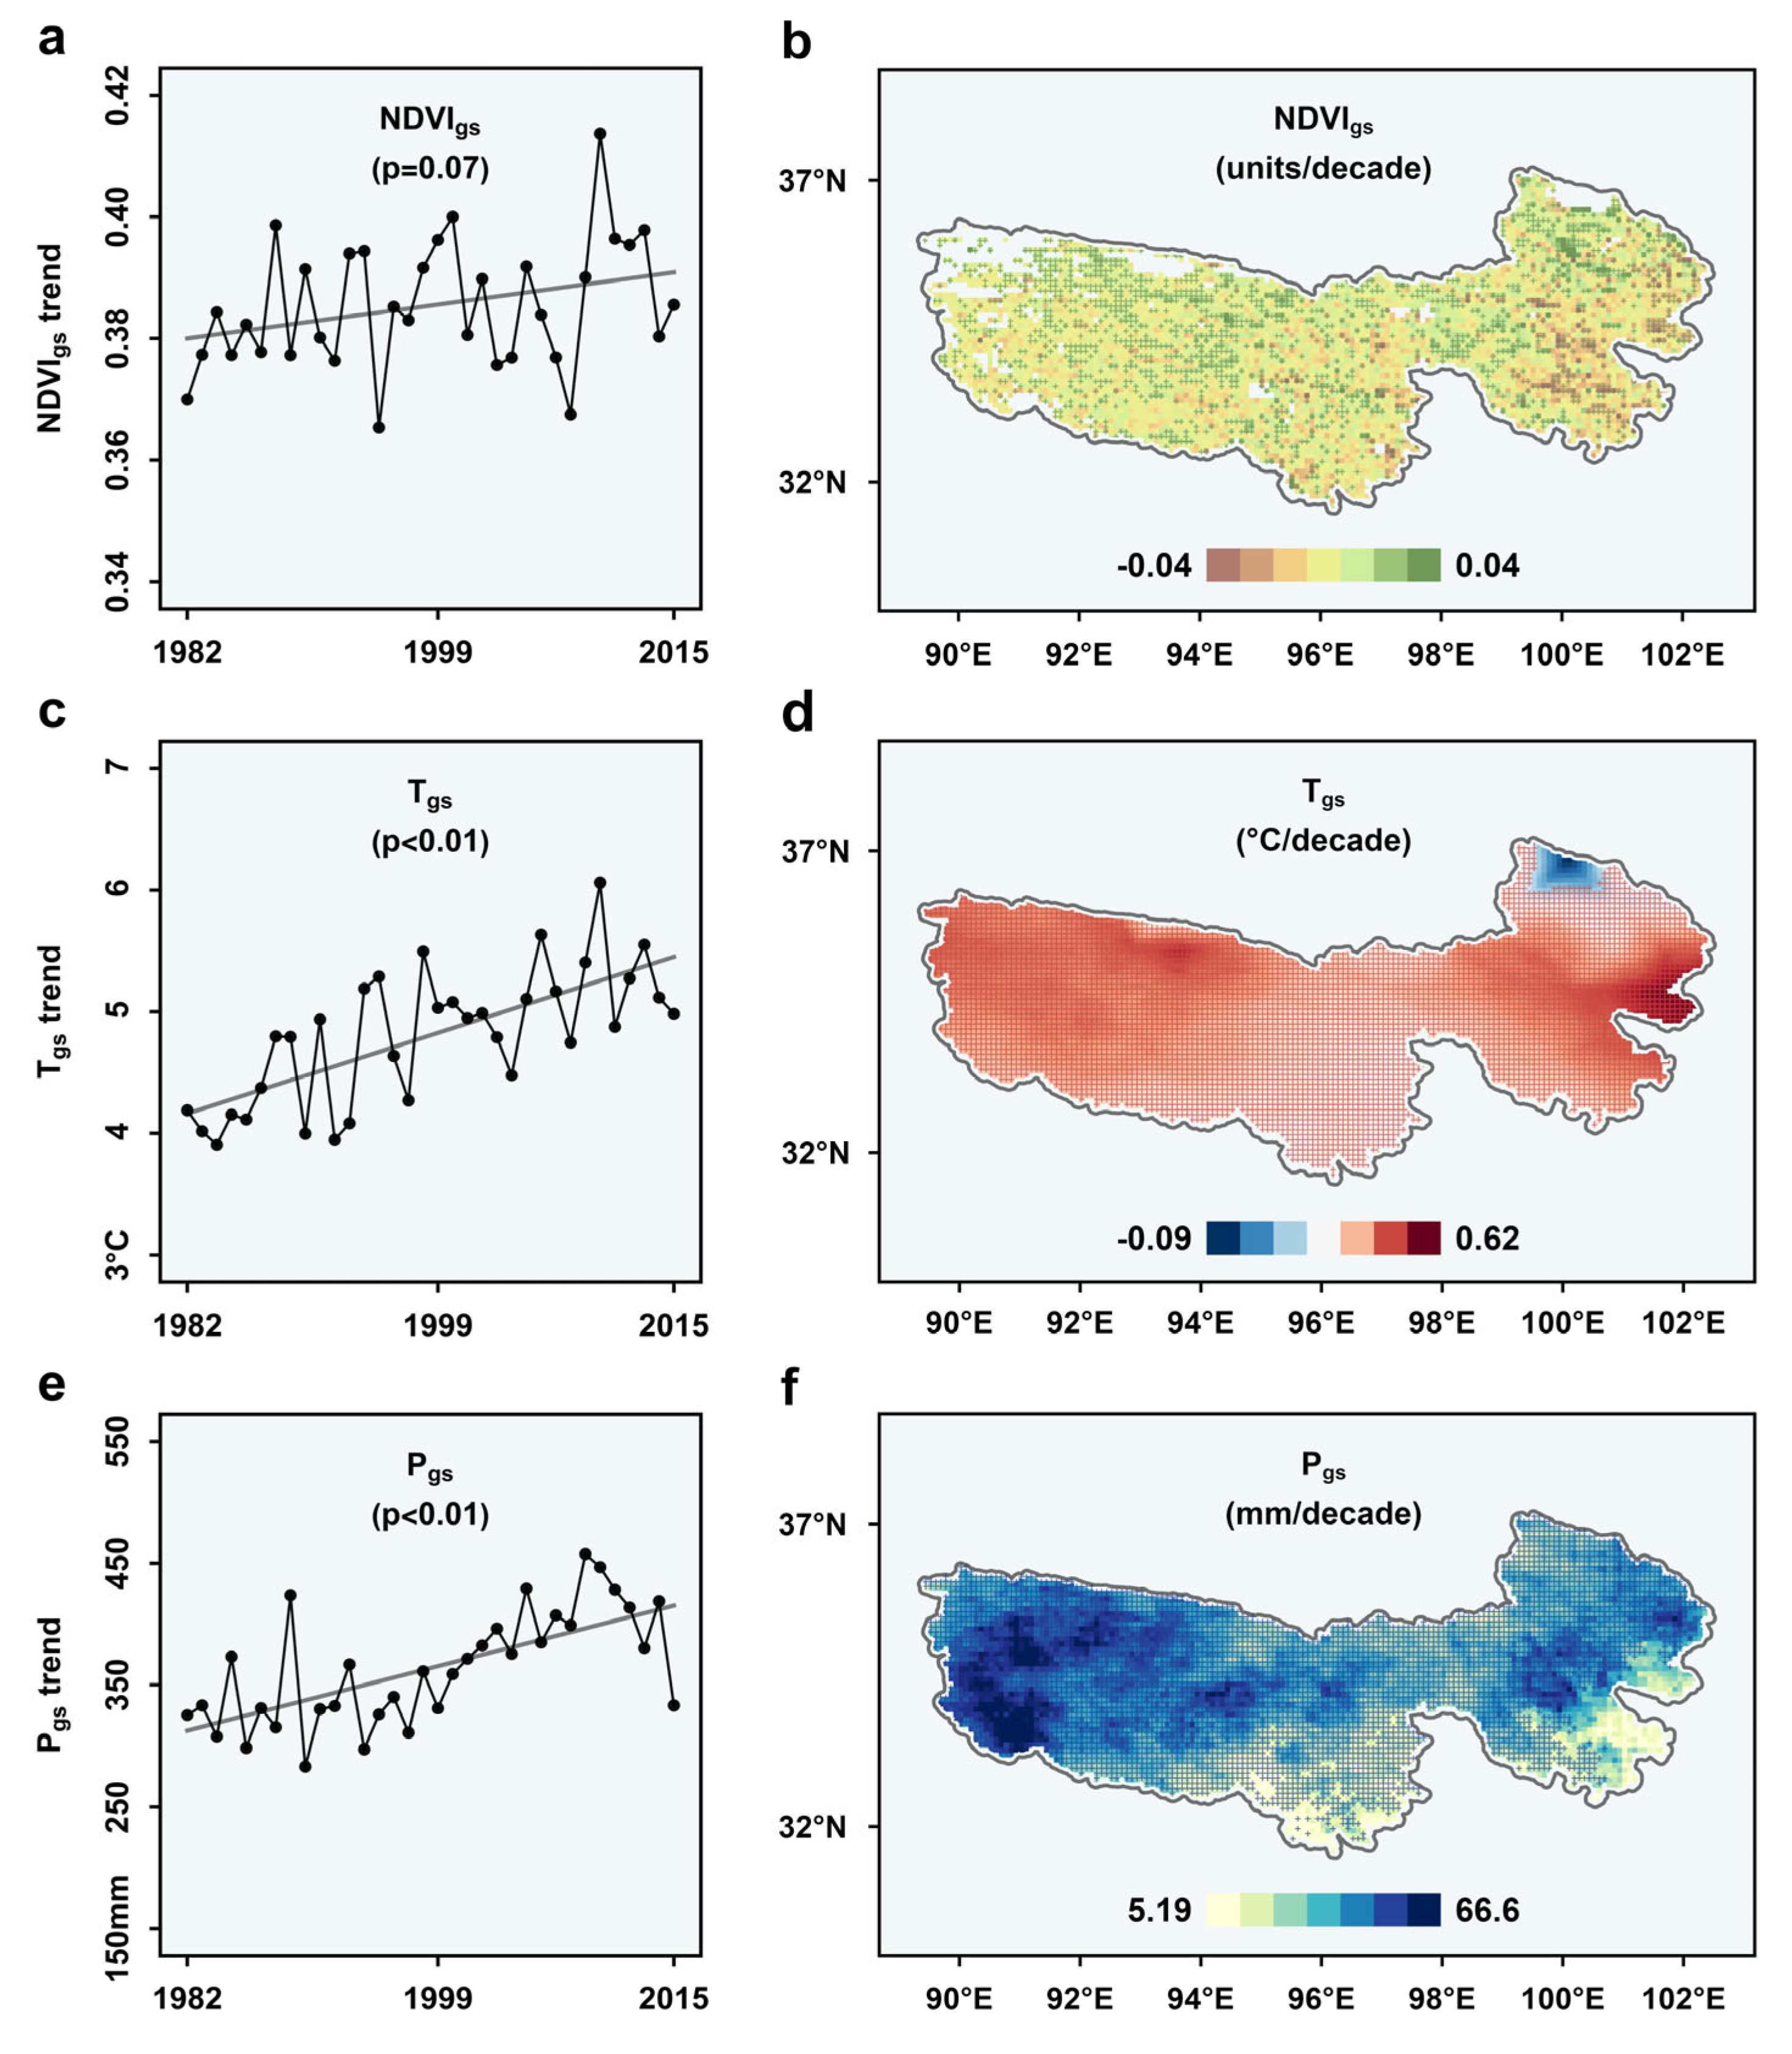
According to Figure 2a, the 34-year average growing-season NDVI greenness map demonstrated clear spatial delineations of vegetation changes in greenness. The southeast part of the TRHR was mostly covered in grassland with NDVIgs values spanning from 0.5 to 0.7, whereas barren land was prevalent in the northwest part with NDVIgs values of less than 0.2. To further investigate the spatiotemporal variations in vegetation and climatic variables across the TRHR, we applied trend analysis to the NDVI and related climatic variables in this study. Comparisons of trend patterns among long-term vegetation and climate records across the study region showed similar yet statistically divergent results with respect to the temporal changes in NDVIgs and climatic variables. First, there was a slight upward trend in NDVIgs at an average rate of 0.003 per decade during the period 1982–2015 (Figure 3a), although this overall trend (p > 0.05) was not sufficiently statistically significant to indicate that greening trends across the region became more prominent over time. However, expansive changes in NDVIgs over space showed that over 70% of the region experienced greening between 1982 and 2015, and the greening pattern was spatially fragmented (Figure 3b). Negative NDVIgs trends were found mainly in the southeastern corners of the region, whereas positive NDVIgs trends were more prevalent in the western and northeastern parts. Second, there was a clear uptrend in the growing-season temperature (Tgs) over time, as evident from the statistically significant p value (p < 0.01). The average increase rate was about 0.39 °C per decade during the period 1982–2015 (Figure 3c). Although the overall warming trend was evident across the TRHR, the northeastern corners of the region, near Qinghai Lake, had flat changes or declining trends in temperature; interestingly, the eastern half of the region also experienced the highest warming rate, whereas the most widespread warming was seen in the mostly higher-elevation western half (Figure 3d). The phenomenon of EDW appears to exist within the TRHR as well. Third, the growing-season precipitation (Pgs) also showed a statistically significant uptrend at an average rate of 31 mm per decade during the period 1982–2015 (Figure 3e). The westernmost parts of the TRHR had experienced greater increases in precipitation than others, while a few mountainous areas in the southern and southeastern corners had seen minimal and insignificant increases in precipitation (Figure 3f). We conducted correlation analysis to assess the association between NDVIgs and the two climatic variables (i.e., Tgs and Pgs). We found that there was a weak positive correlation between NDVIgs and Tgs (r = 0.43, p < 0.05), while no statistically significant correlation was found between NDVIgs and Pgs (r = 0.18, p > 0.05). These findings indicate that the vegetation change could be mainly attributed to the growing-season warming across the TRHR.

3.2. Elevation-Dependent Responses of Climatic Variables to NDVIgs

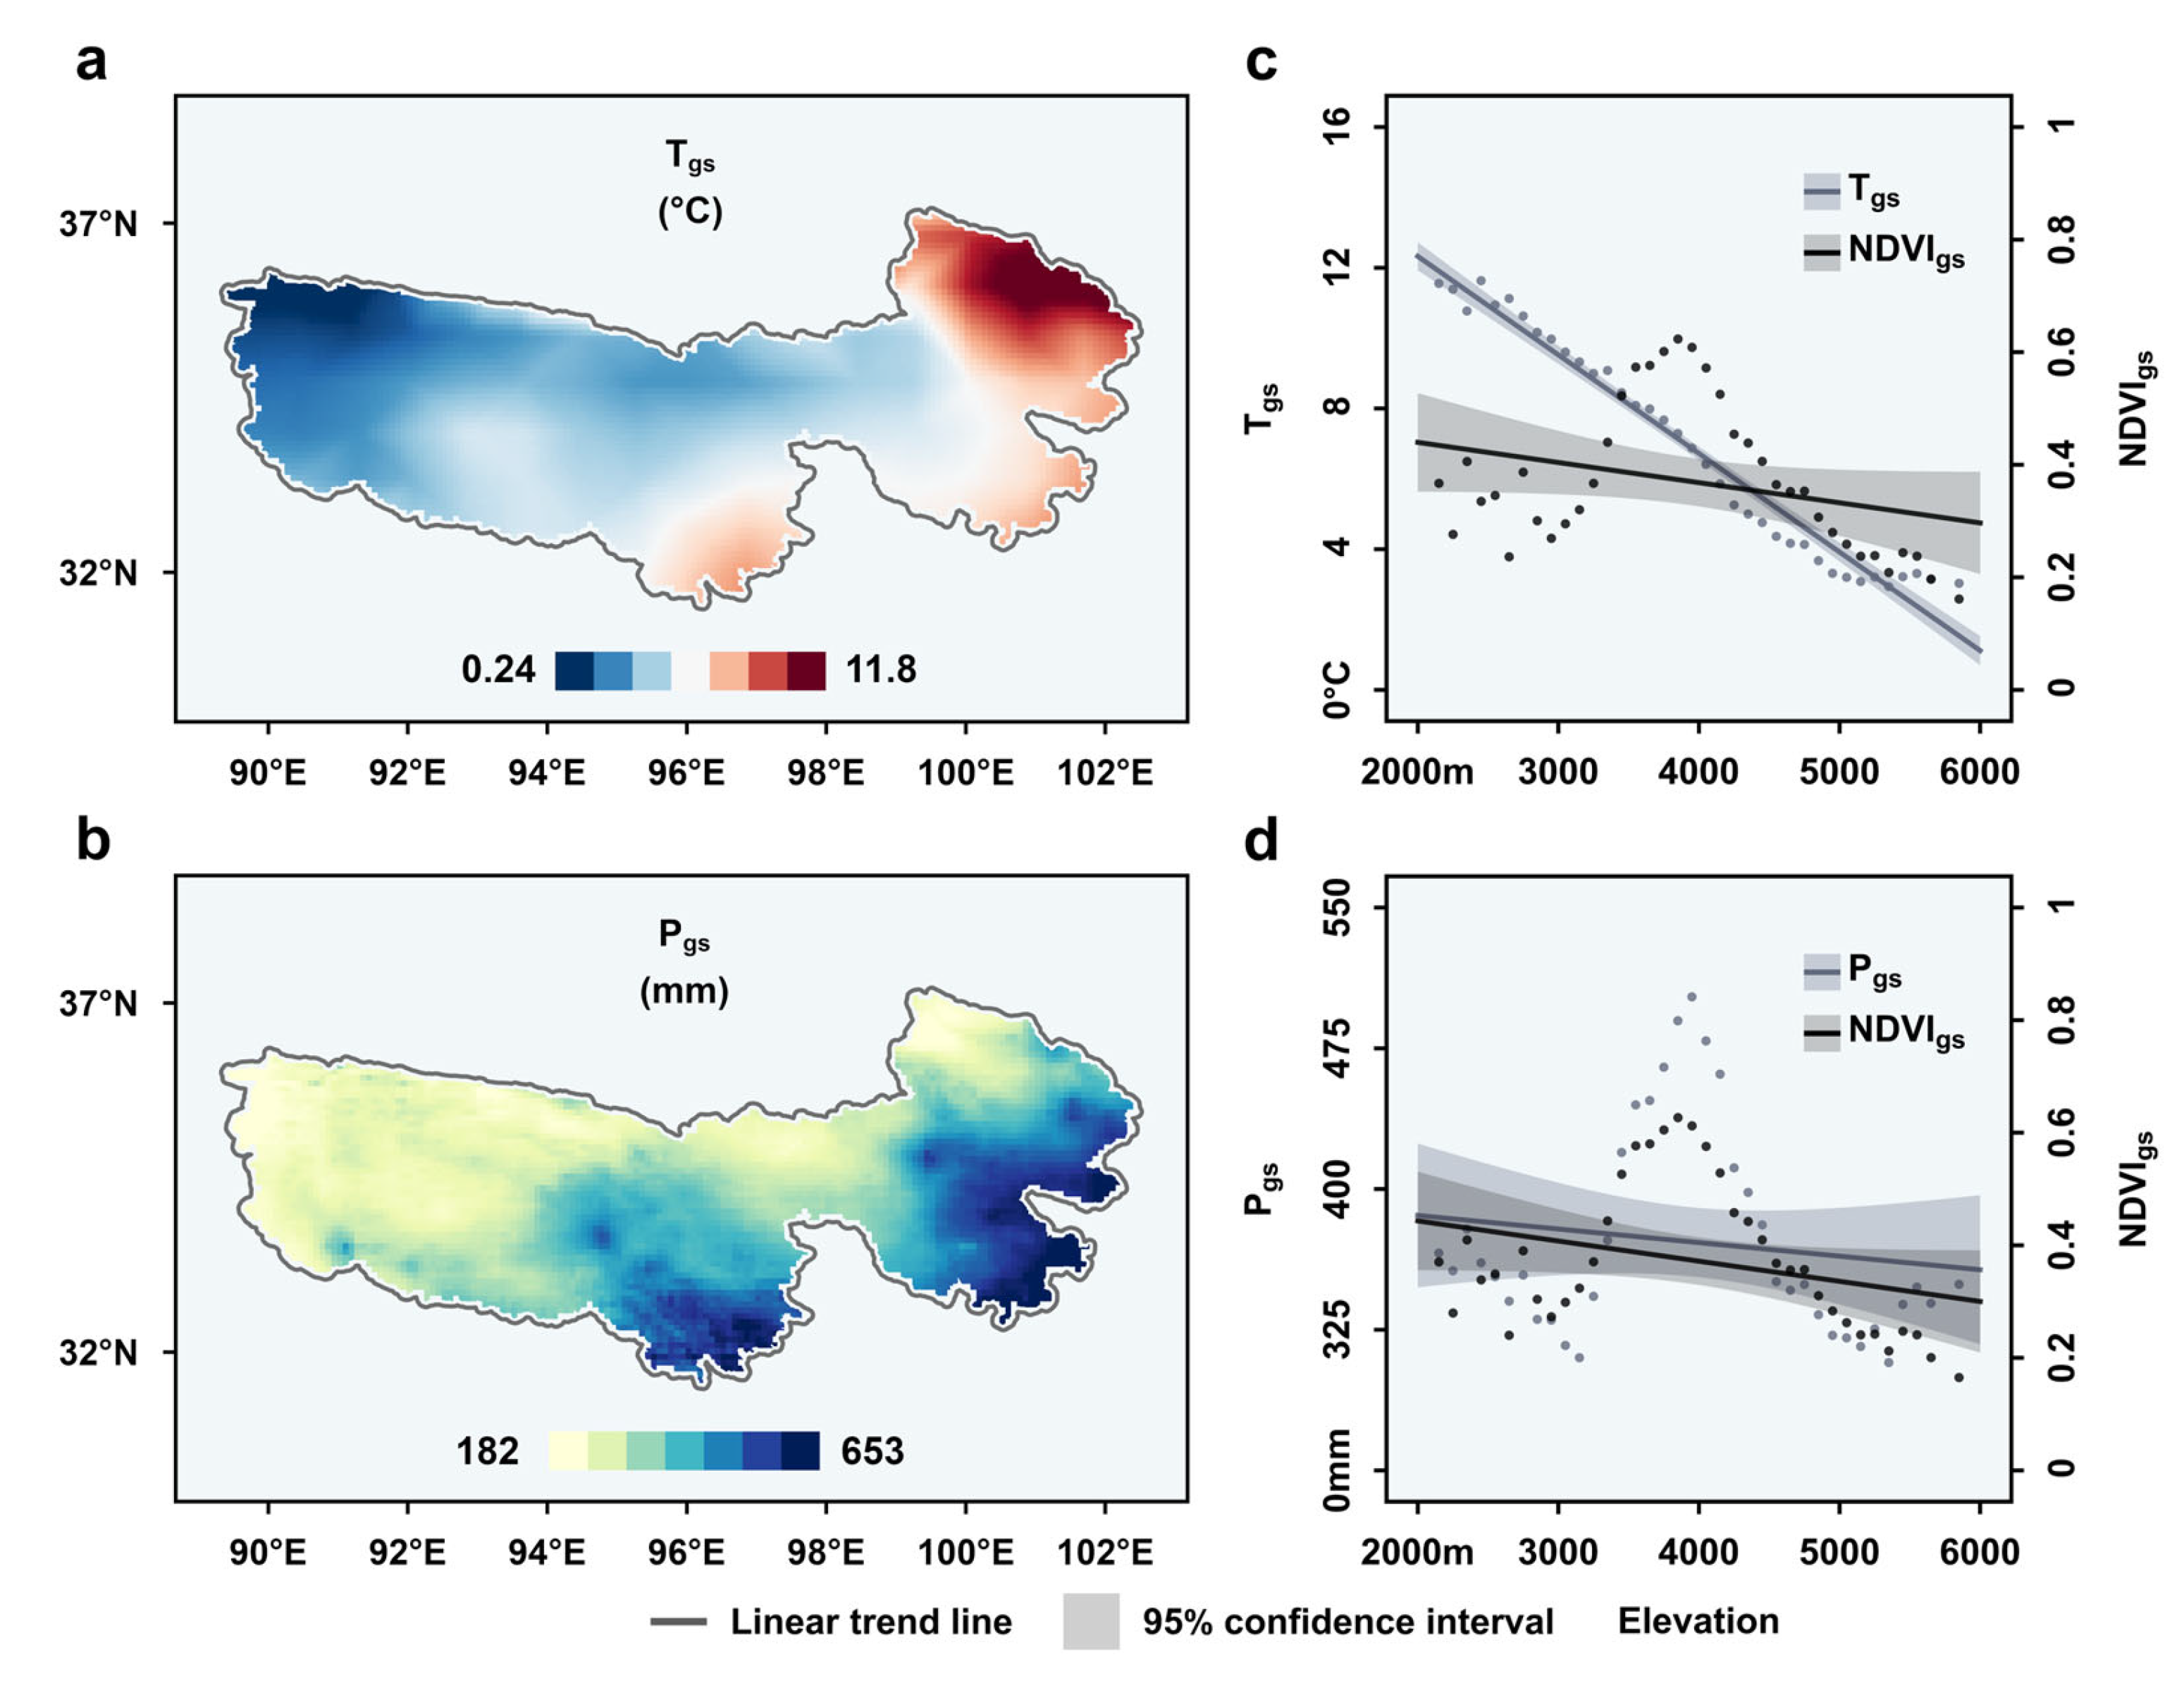
We used multi-year averages of the indicators to account for effects of the elevational gradient on spatial disparity in temperature and precipitation, and to investigate linkages between elevation-dependent changes in temperature and precipitation and trends in NDVIgs. Spatially, the TRHR showed a gradual increase in the average temperature from 0.24 °C in the westernmost parts to 11.8 °C in the northeastern corners, indicating a strong correlation between temperature and elevation; temperature gradually increased as elevation decreased (Figure 4a). Mountainous areas in the southern and southeastern parts received much more annual rainfall than the flat-lying areas in the west and northeast, indicating that variations in precipitation are closely tied to landscapes rather than elevations (Figure 4b). The NDVIgs values show an inverted V-shape trend across elevational gradients, peaking at around 3900 m (Figure 4c). By comparing both NDVIgs and Tgs trends at different elevations, we noticed a negative correlation between NDVIgs and Tgs in low-elevation areas, which gradually turned positive with increases in elevation. In contrast, there was a stronger correlation between NDVIgs and Pgs over elevational gradients as a similar inverted V-shape trend was observed for the two indicators (Figure 4d).

3.3. Elevation-Dependent Changes in Climatic and NDVIgs Trends

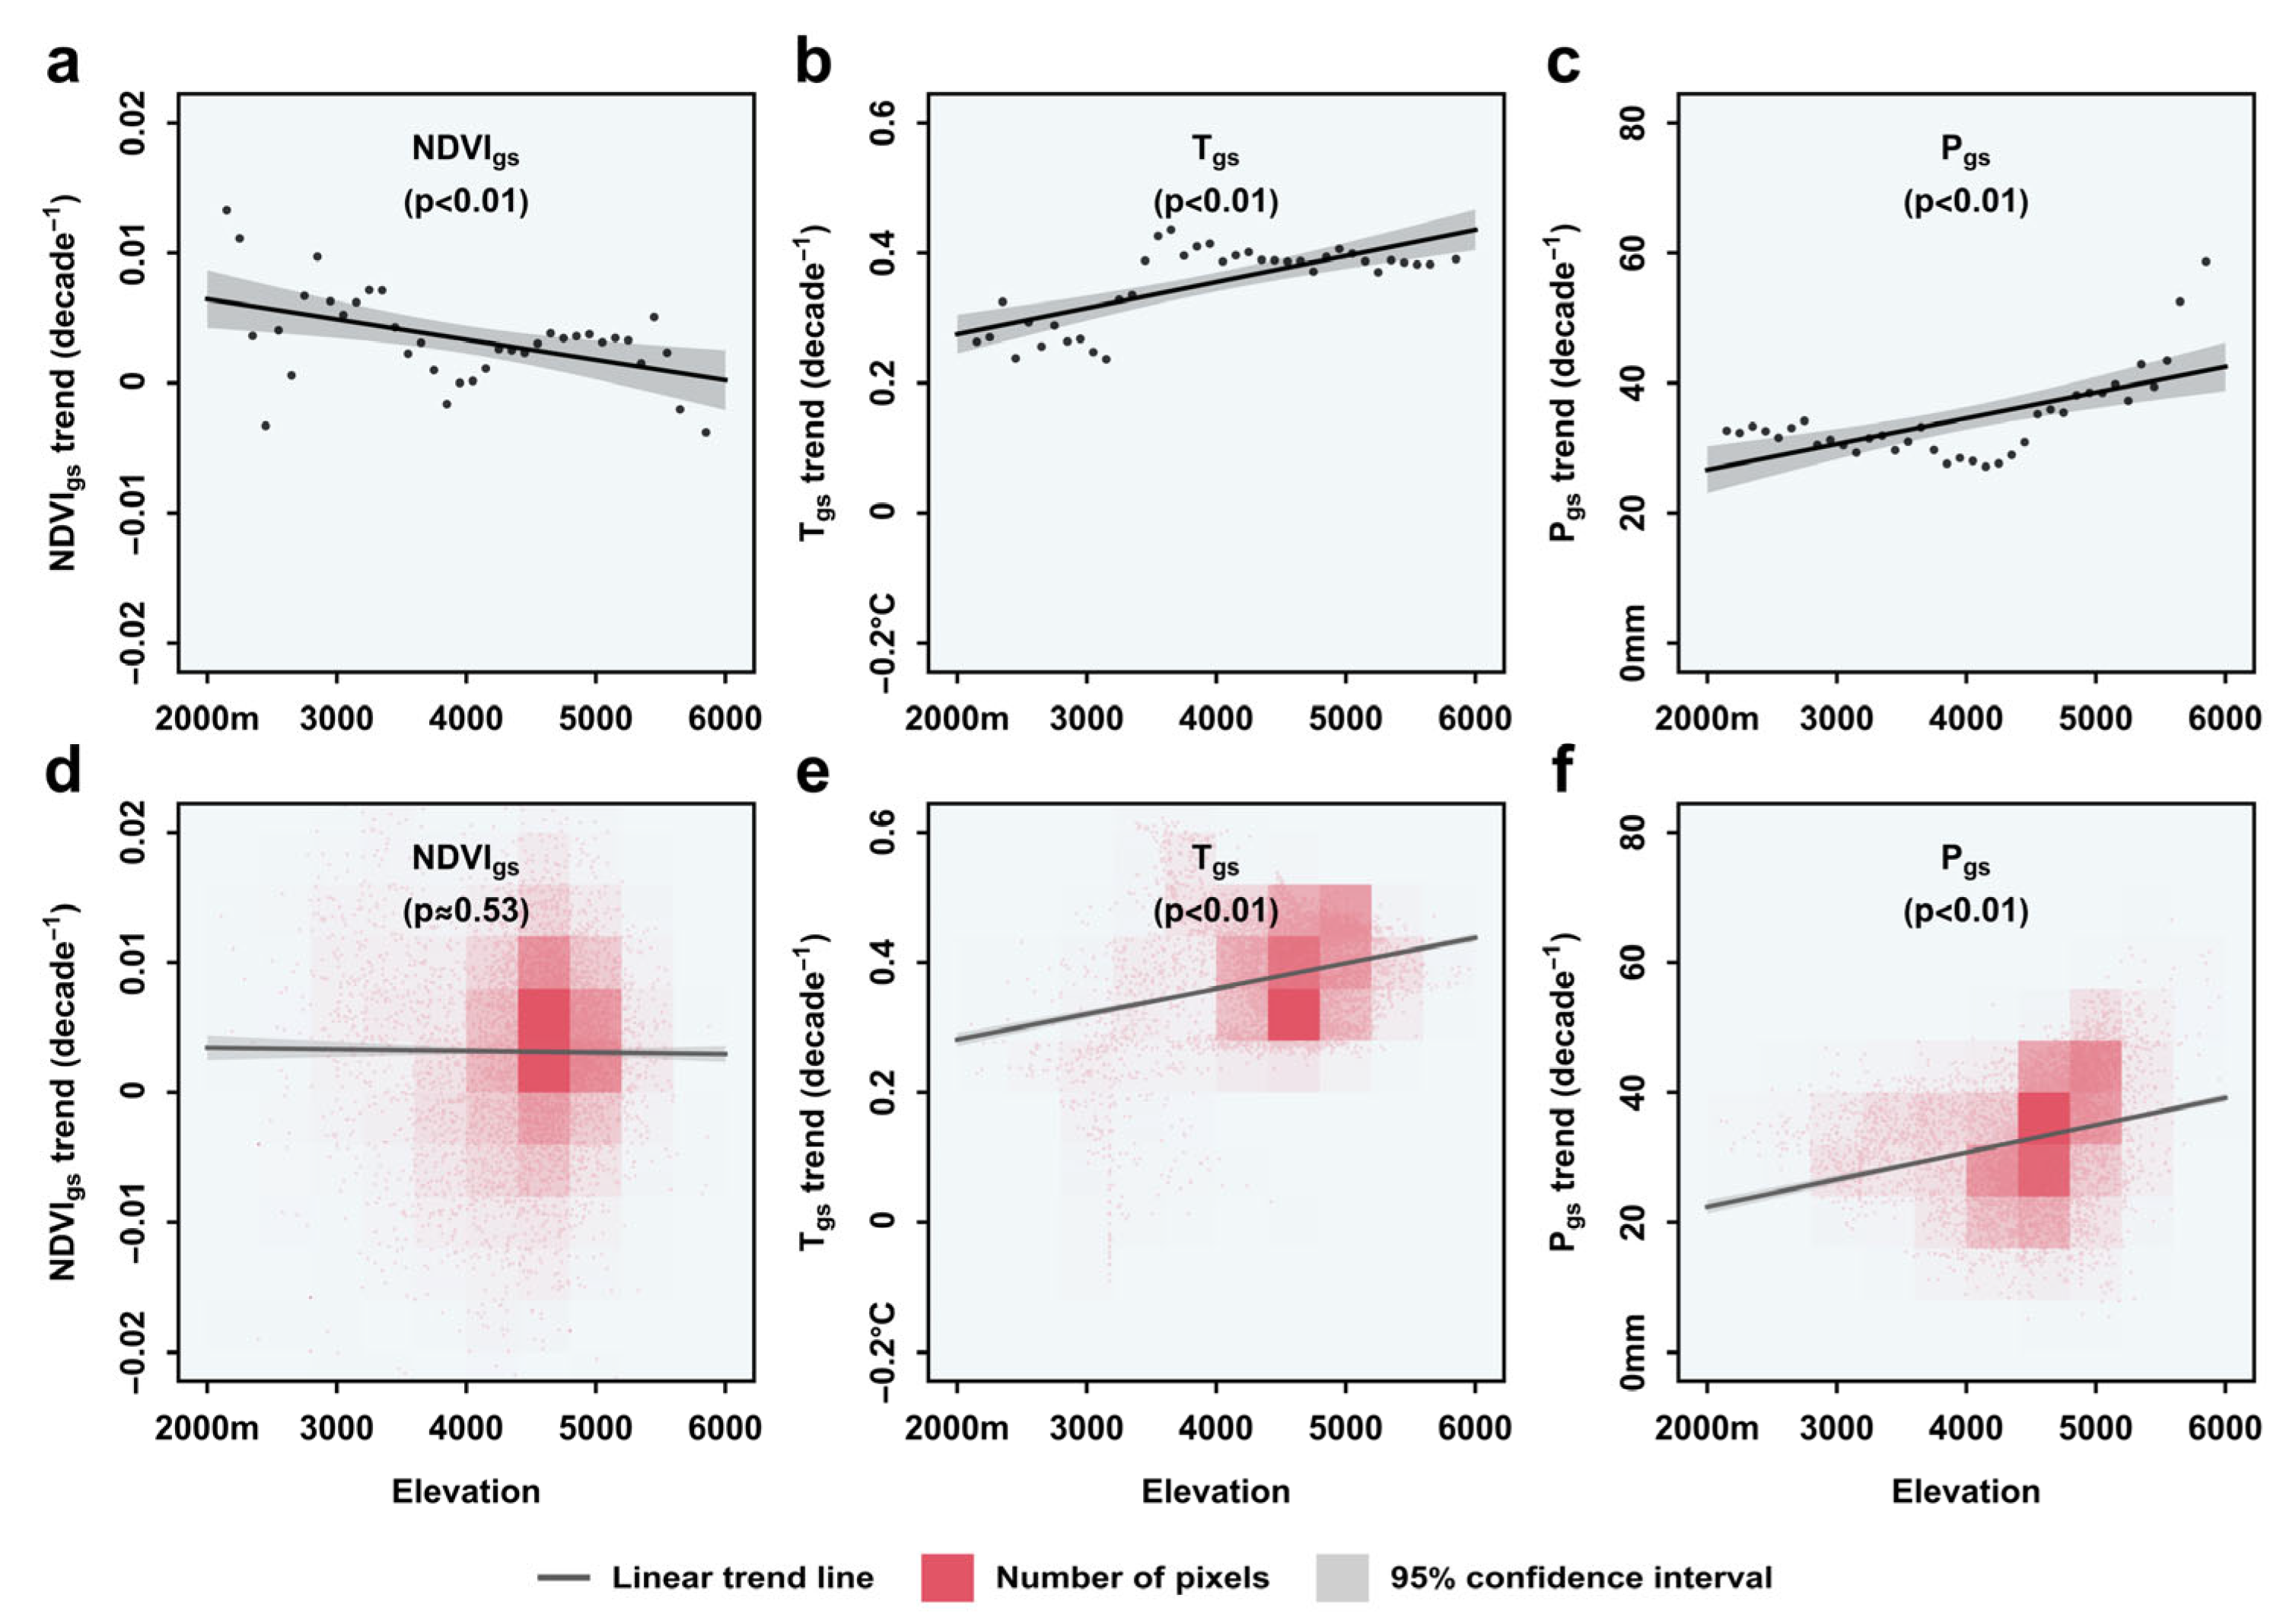
In order to better understand the rate trends in temperature, precipitation, and vegetation over elevation within the study region, we used both average-data and pixel-based methods to conduct a trend analysis. The average NDVIgs values showed a statistically significant declining trend with elevation, indicating that the green-up rate was slower at high elevations (Figure 5a). However, this type of trend analysis failed to factor in differences in the landscapes throughout the TRHR, so the statistical significance could be more or less over-stated. After re-analyzing the NDVIgs value across each pixel grid within the region, we found that the declining trend was confirmed but less statistically significant (Figure 5d). The phenomenon of EDW was highlighted in the results from both analysis methods, suggesting that the rate of warming was amplified at high elevations (Figure 5b,e). In fact, this regional manifestation of global warming had also been observed in other high-elevation regions across the Tibetan Plateau. In addition, the high-elevation areas within the TRHR experienced much greater yearly precipitation increments than the low-elevation areas between 1982 and 2015, and the widespread changes in precipitation exhibited a statistically significant dependency on elevation (Figure 5c,f). Overall, elevation-dependent changes in temperature and precipitation appeared to be happening faster at high elevations, whereas changes in the green-up rate were relatively insignificant.

3.4. Correlations between Changing Climatic Conditions and NDVIgs Trends

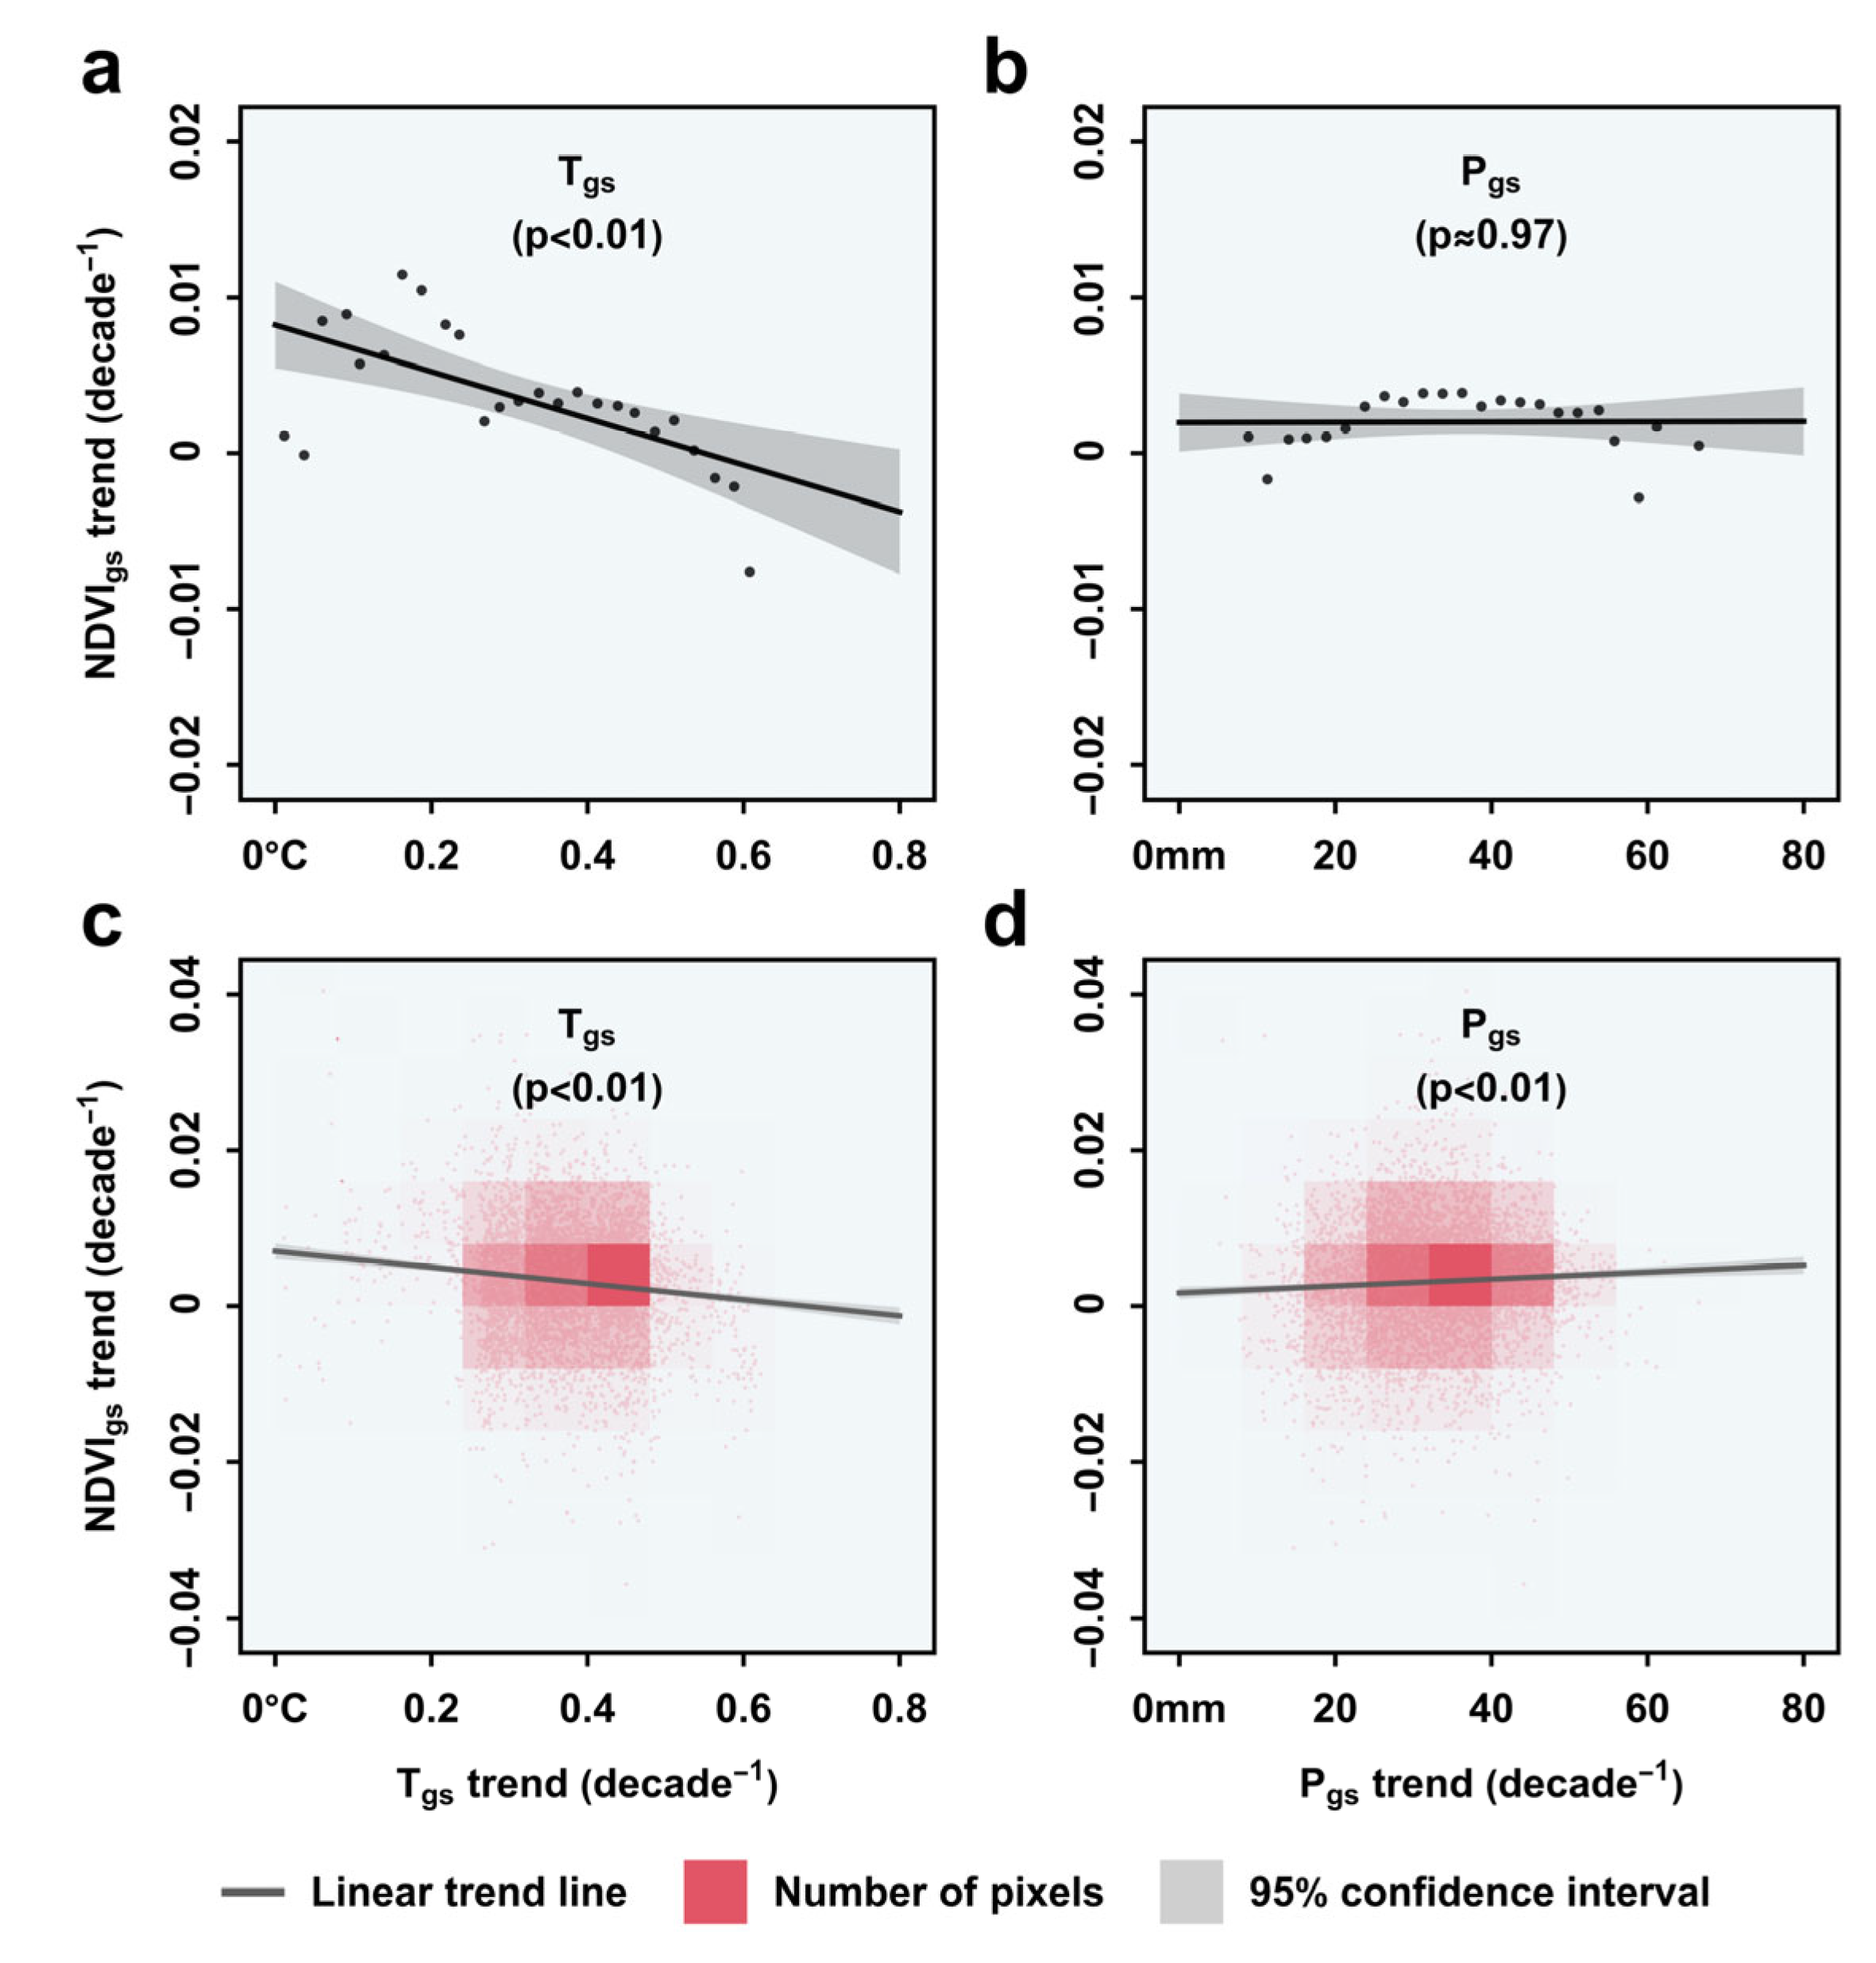
We also used both average-data and pixel-based methods to conduct a correlation analysis to improve our understanding of greening trends and drivers in an altered local climate. Both methods showed a statistically significant correlation between Tgs changes and NDVIgs trends (Figure 6a,c), and this correlation was overall negative (i.e., decreasing NDVIgs with warming). The average-data method found a weak positive correlation between Pgs changes and NDVIgs trends (i.e., increasing NDVIgs with higher precipitation increments), but this finding shows limited statistical significance (Figure 6b). After re-analyzing the multi-year average Pgs value across each pixel grid within the region, this weak positive correlation was confirmed statistically (Figure 6d). Despite the identified statistical significance of both climatic variables for the NDVIgs trends, temperature appeared to be a more explicit driver of vegetation change as warming resulted in more variability in NDVIgs across the study region.

3.5. Spearman’s Rank Correlation and Partial Correlation Analysis

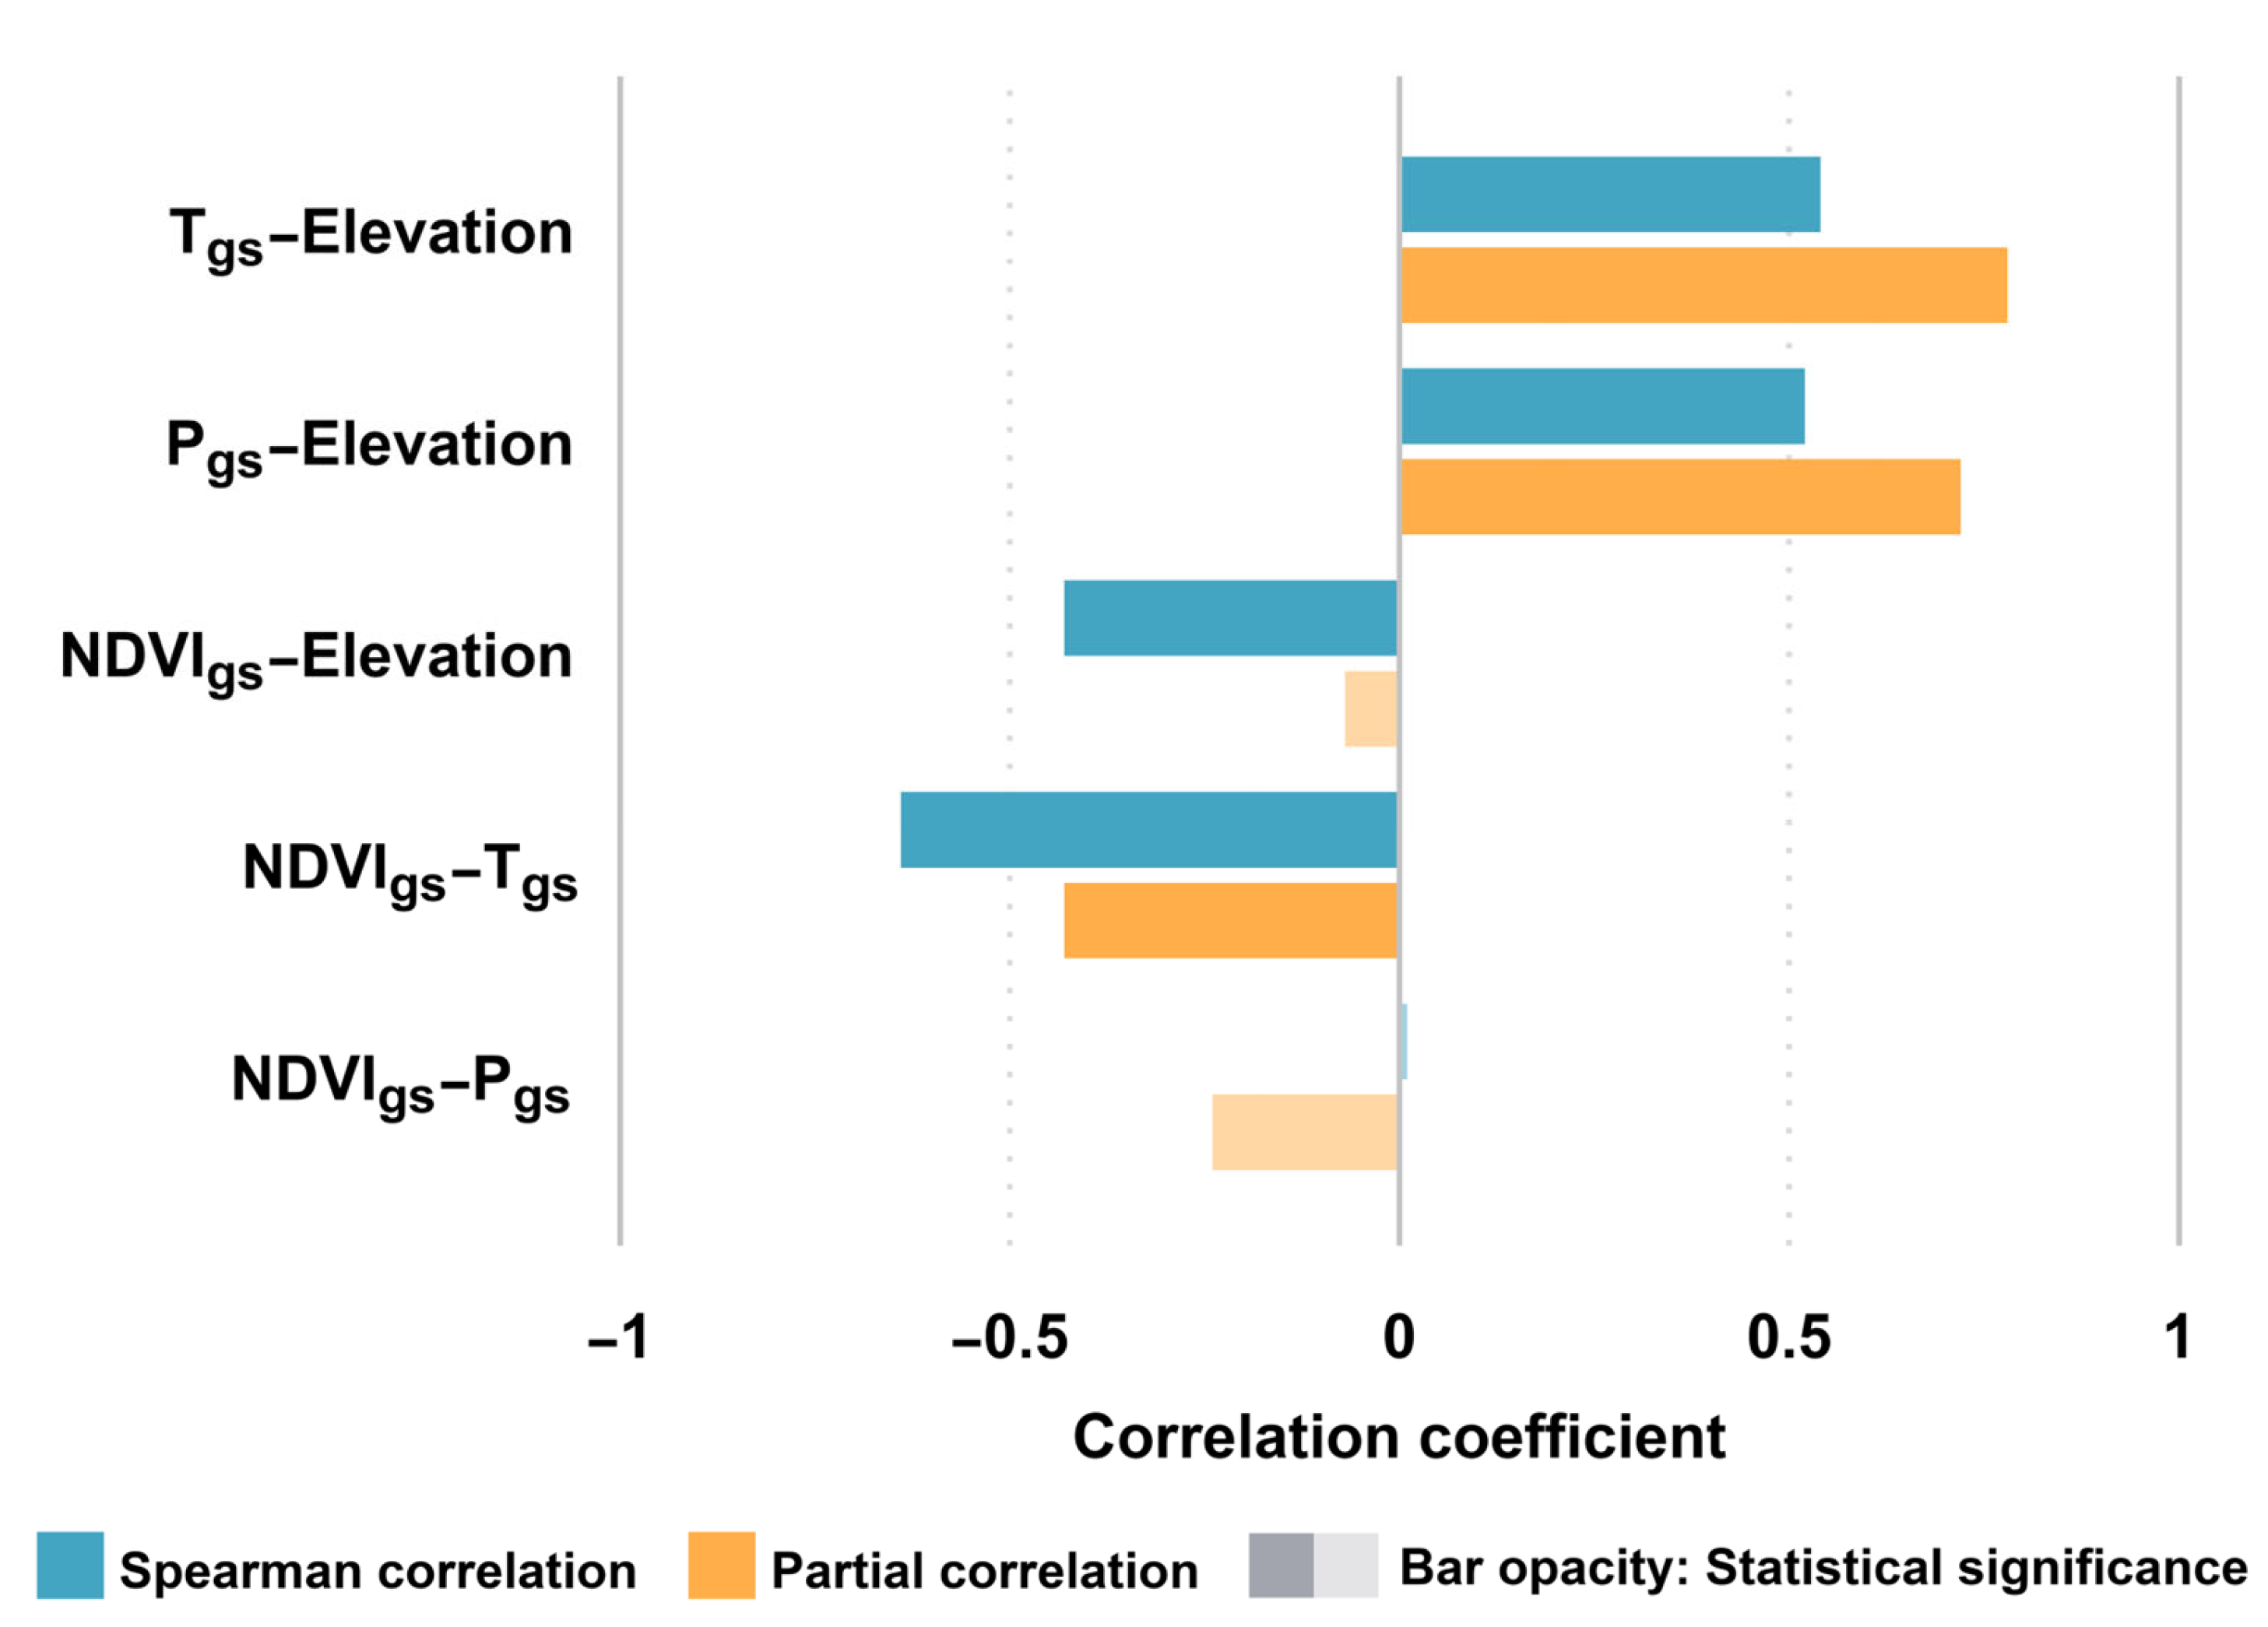
Spearman’s rank correlation and partial correlation coefficients were calculated to allow for more detailed statistical information that accounts for the elevation dependency of temperature, precipitation, and NDVIgs changes as well as the relationships between temperature and precipitation changes and NDVIgs trends (Figure 7). Both temperature and precipitation changes were positively correlated with elevation, and these strong correlations were of sufficient statistical significance. According to the Spearman correlation coefficient, NDVIgs trends were significantly and negatively correlated with elevation; however, the partial correlation coefficient suggested that this negative correlation was much less statistically significant if the confounding variables, i.e., temperature and precipitation, were factored out. This implied that elevation was not a direct driver of NDVIgs trends. In addition, NDVIgs trends were also negatively correlated with temperature changes, indicating warming is an identified driver of vegetation change. In contrast, precipitation changes exhibited no statistically significant correlation with NDVIgs trends.

3.6. Land-Cover-Based NDVIgs Quantitative Analysis

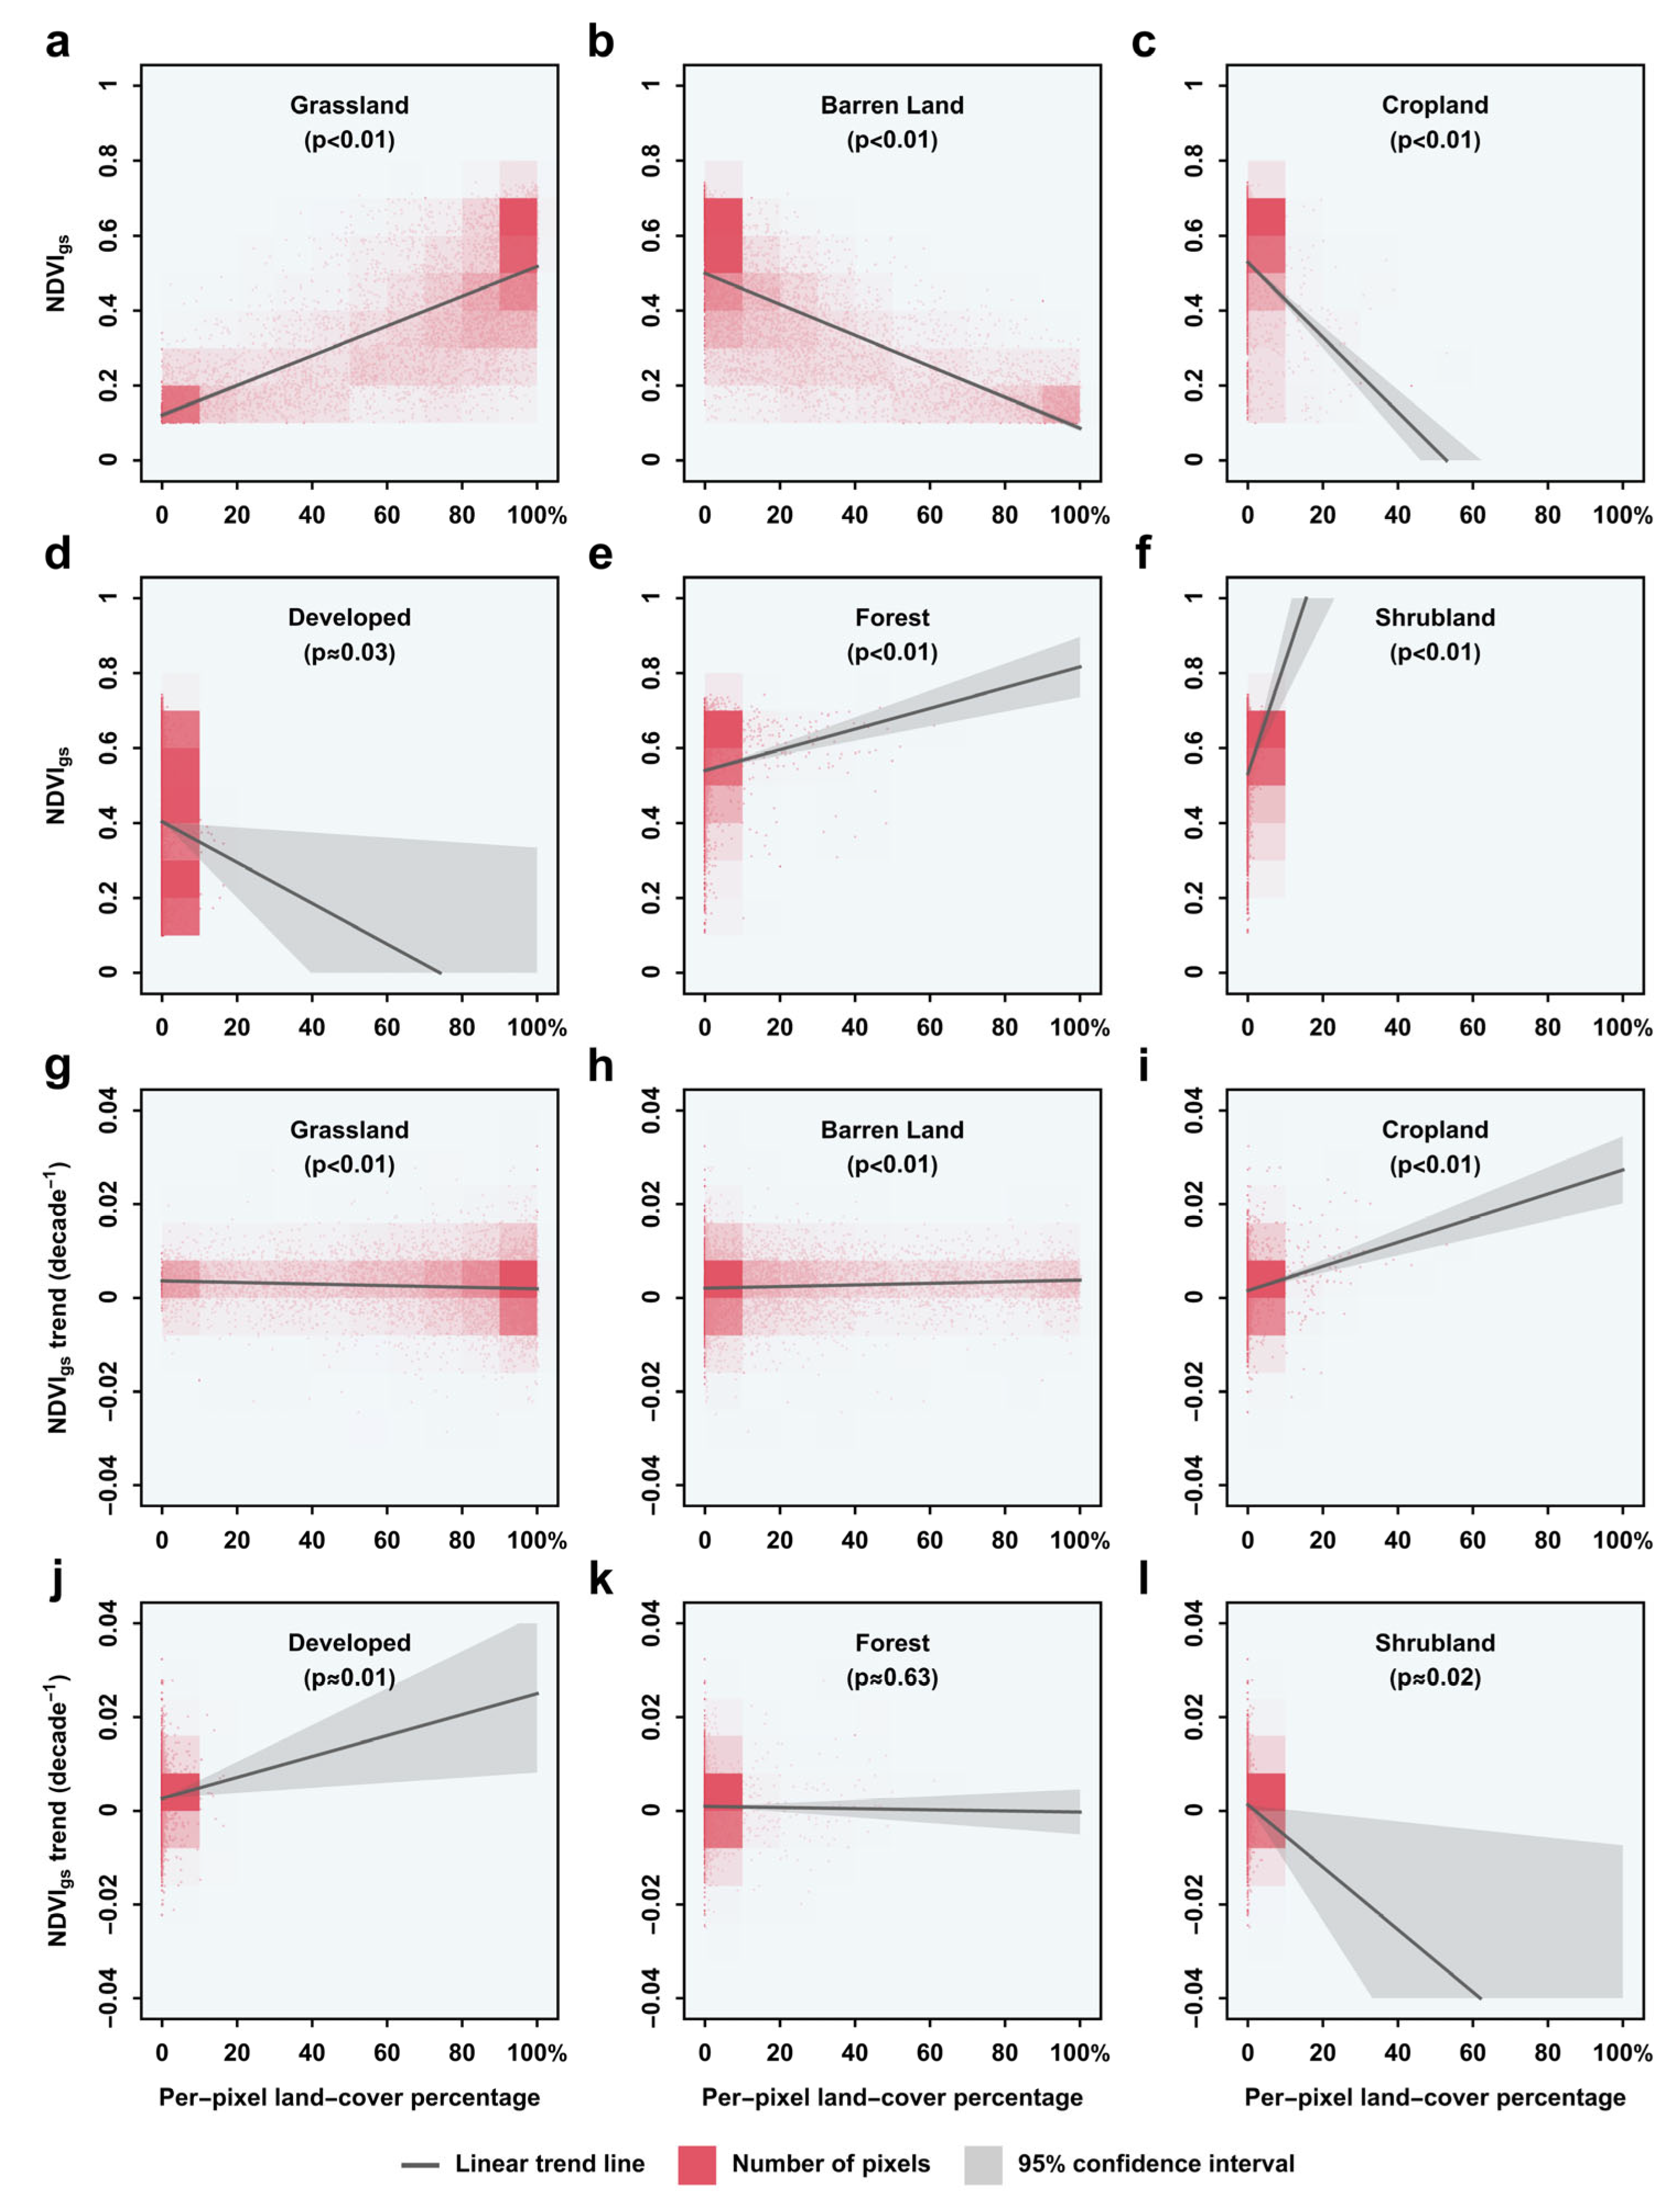
Land cover composition is an important explanatory factor when calculating NDVIgs values and evaluating their associated trends. In order to refine our understanding of the relationships between land coverage and NDVIgs values and trends, we used the pixel-based quantitative method to evaluate different land cover types, including grassland, barren land, cropland, developed land, forest and shrubland. The majority of the land within the TRHR was covered in grassland and barren land, accounting for 94% of the total land coverage. Thus, the two land cover types had more chances to have 100% coverage in a pixel grid. As the coverage of grassland increased, the NDVIgs values increased significantly (Figure 8a). In contrast, more coverage in barren land resulted in decreased NDVIgs values (Figure 8b). Furthermore, forest and shrubland, in addition to grassland, were the land cover types most positively related to the NDVIgs values (Figure 8e,f). The results from the pixel-based quantitative analysis also allowed for detection of the spatial patterns of land cover distributions. For example, cropland was mainly distributed in densely vegetated areas (Figure 8c), while developed land was evenly distributed between densely and sparsely vegetated areas (Figure 8d).
We also evaluated the decadal average NDVIgs changes for land cover types to improve the understanding of the trends of land cover changes within the TRHR between 1982 and 2015. There was a slight declining trend in the positive changes in NDVIgs with an increasing coverage rate of grassland within each pixel grid, indicating that the greening trends in grassland were likely to be slower than those in other land cover types between 1982 and 2015 (Figure 8g). The reason for this decline could be linked to the continued rise in livestock population and the adverse effects of grazing activities. In contrast, more areas covered in barren land appeared to experience slight positive changes in NDVIgs, indicating a growing trend of barren land greening within the TRHR (Figure 8h). This implied that the significant changes in temperature and precipitation across the TRHR could probably have facilitated the process of vegetation rehabilitation in barren areas, while the warmer temperature and increased precipitation during the growing season could also have greatly slowed down the progress of grassland degradation. Both cropland and developed land had lower coverage rates within each pixel grid; however, more pronounced changes in greening were found in areas partially covered by these two land cover types (Figure 8i,j). This implies that the local government’s long-term efforts to deliver targeted interventions for ecological restoration, e.g., the Grain for Green program, have brought positive results in areas where human activities are concentrated. Forest showed no specific trend that was of statistical significance (Figure 8k), while shrubland seemed to experience a negative decline in NDVIgs changes (Figure 8l).

4. Discussion

It is now accepted that continued climate warming could further boost vegetation growth at high elevations as warmer temperatures and increased rainfalls might potentially create more favorable growing environments in local areas. Our results show that since 1982, most parts of the TRHR have experienced a sustained warming trend, and are getting wetter during the growing season (Figure 3). This is consistent with findings from other studies in this region [37,59,60]. Moreover, the interannual variability in NDVIgs was found to be positively correlated with Tgs at a high significance level based on the correlation analysis results, suggesting a driving effect of temperature on vegetation greening.
Both our study and previous studies show that temperature appears to be a dominant driver of vegetation change within the TRHR; therefore, there do seem to be reasons to suppose that the change in the vegetation green-up rate would be consistent with the trend in warming. However, Figure 5a,d show that there was a slight downward trend in the vegetation green-up rate as elevation increased, which appears to be contradictory to the amplified effect of EDW at high elevations. This result indicates that, despite being a dominant driver of interannual vegetation greening, temperature may play a different role in the vegetation dynamics altering the green-up rate.
Water availability is critical for vegetation growth and is usually deemed to be closely related to precipitation. Our results show that high-elevation areas tend to experience greater increases in precipitation than other areas, and this tendency is statistically significant (Figure 5c,f). However, the decreased NDVIgs trend at high elevations indicates that precipitation plays a limited role in regulating the green-up rate. In fact, Figure 6b,d also presents a relatively weak correlation between Pgs and NDVIgs trends. Notwithstanding a few studies reporting a strong dependency of water availability on precipitation [30,35,48], the TRHR has seen no sign of an evident growth in water availability.
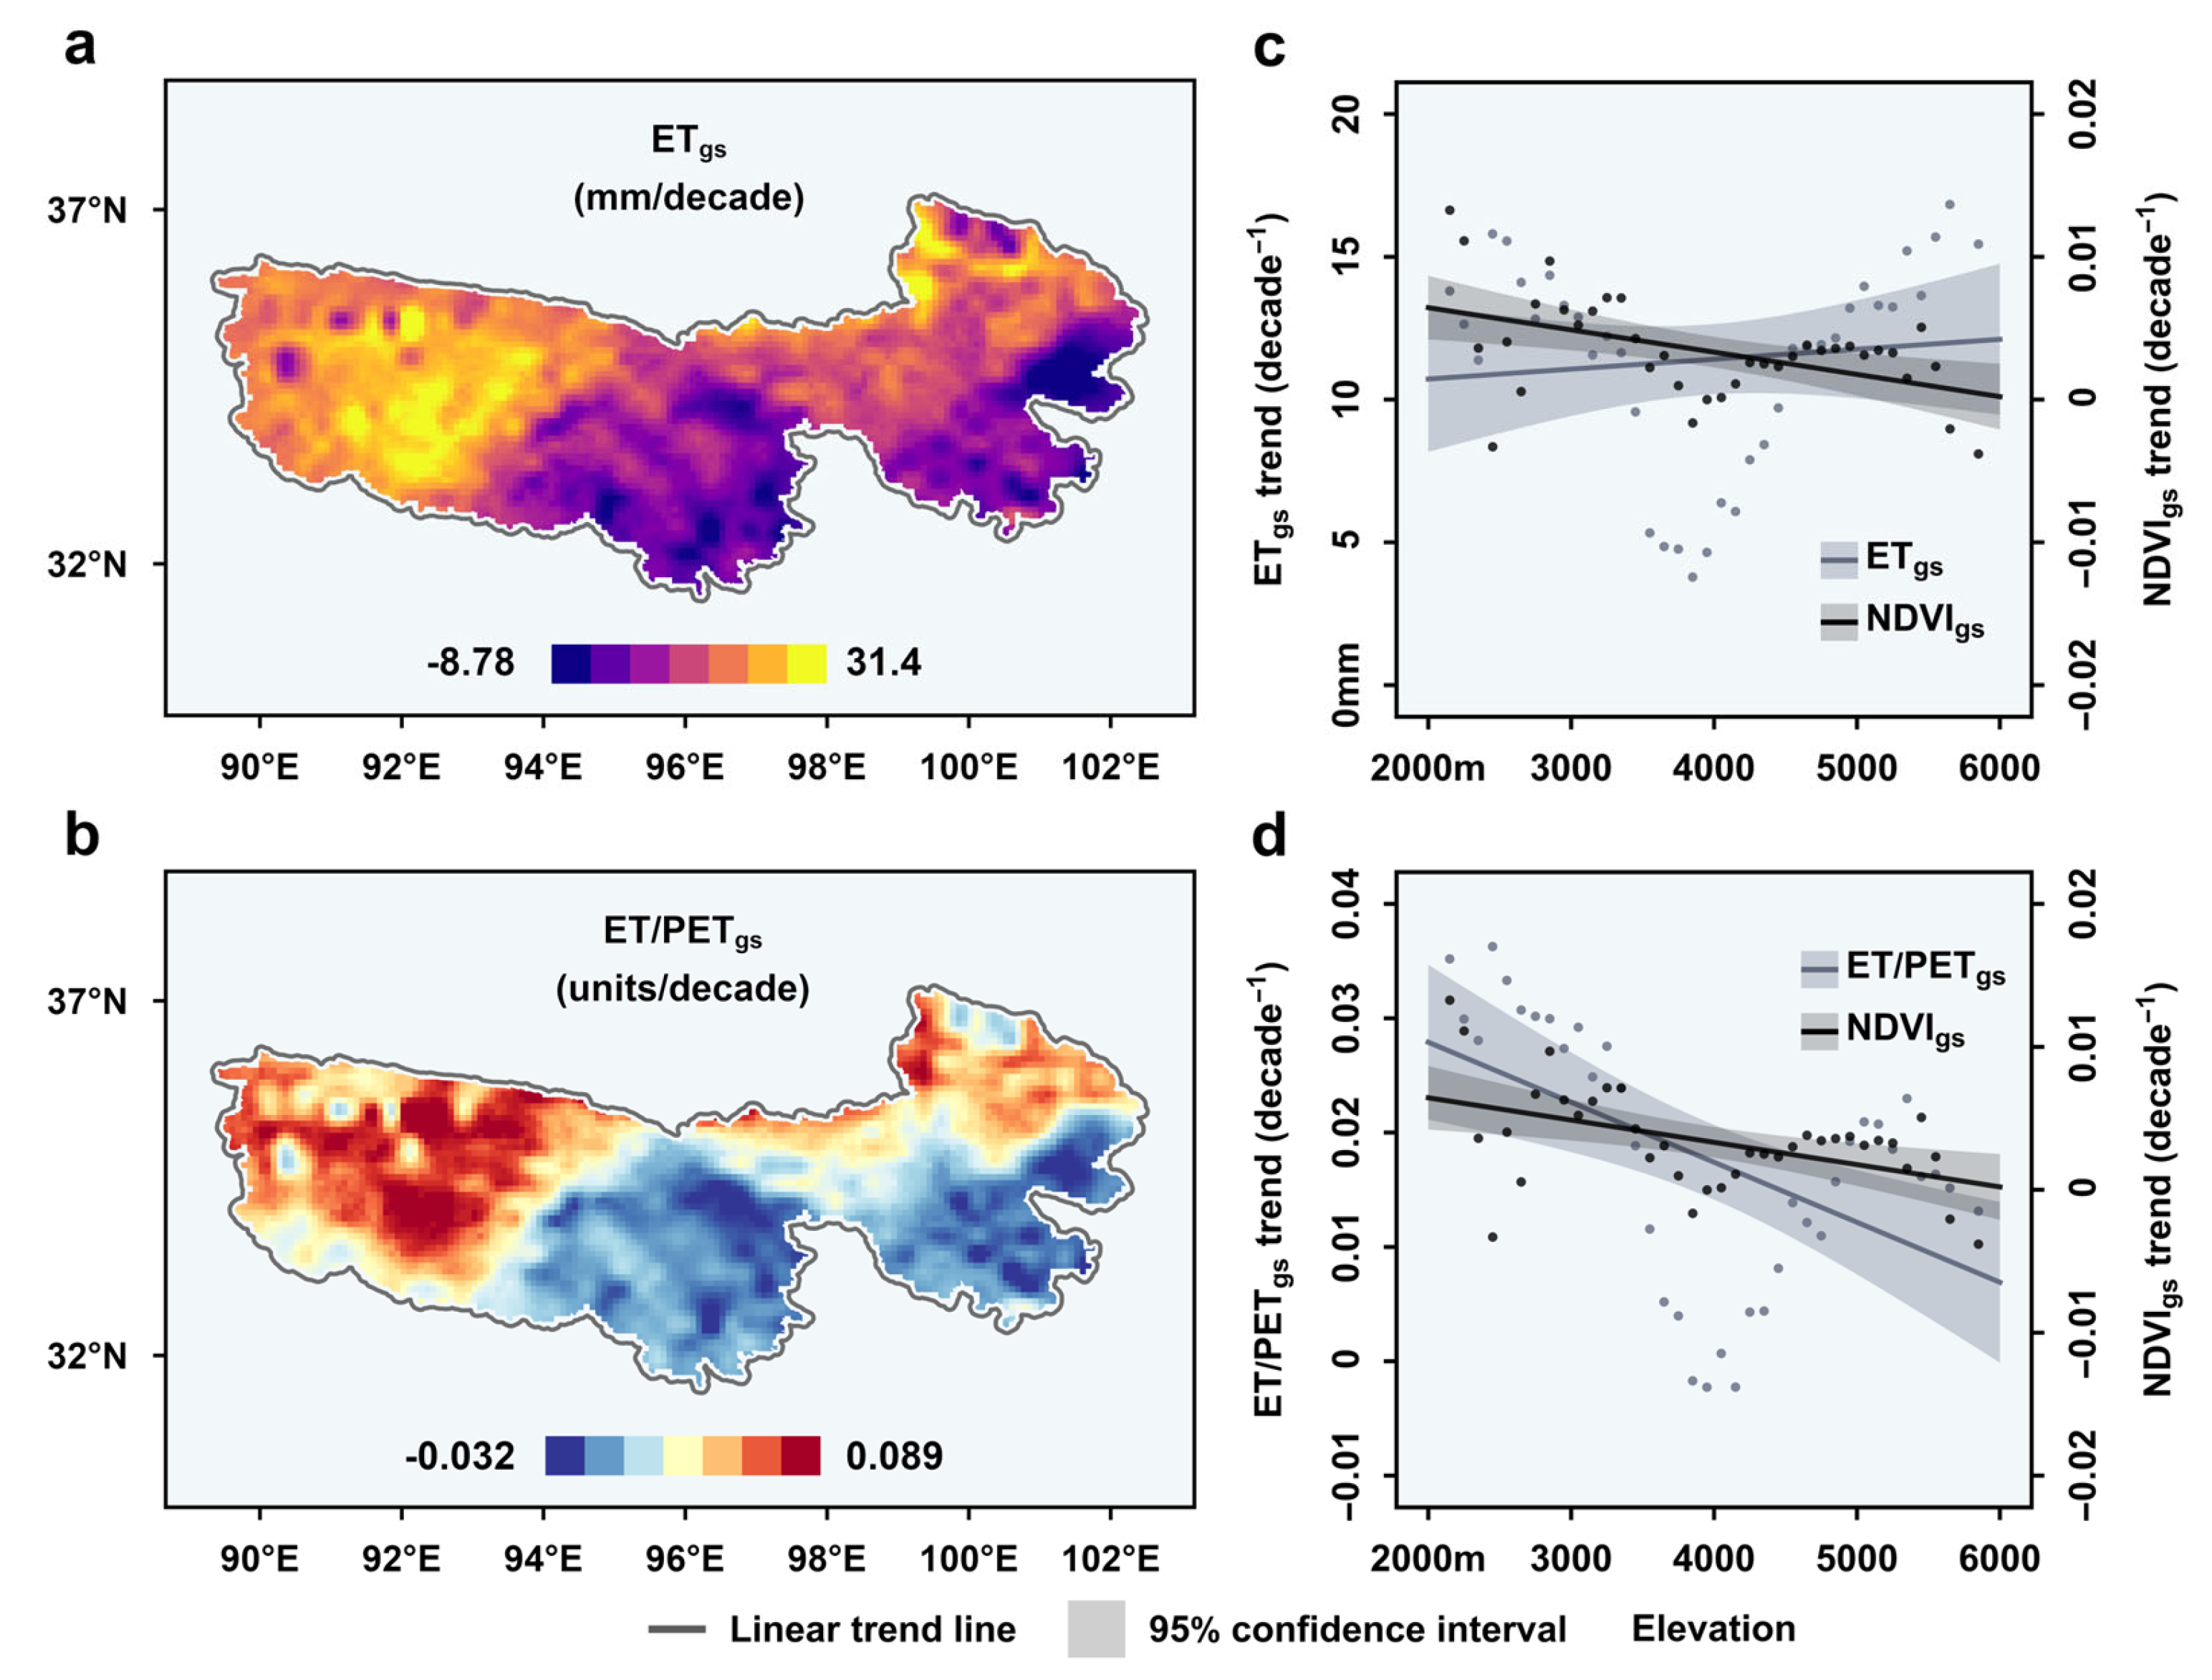
As we know, water availability on land is not only related to precipitation but may also be directly affected by increased evapotranspiration (ET). Previous studies suggest that the ratio of evapotranspiration to potential evapotranspiration (PET), i.e., ET/PET, is a useful indicator of soil moisture conditions, which can also be used to assess the water availability conditions for vegetation growth during the growing season [61]. To discern the roles of temperature and precipitation changes in altering the vegetation green-up rate, we further investigated the pattern of the growing-season ET/PET ratio (ET/PETgs) with elevation. We observed that most areas had increased decadal ETgs, particularly in the western TRHR, which is covered mostly by barren land (Figure 9a). The increased decadal ratios of ET/PETgs were mainly found in the western and northeastern parts, while the decreased ET/PETgs ratios were observed in the central and southeastern areas (Figure 9b). The ETgs values showed a V-shape trend across elevational gradients, suggesting that ET tended to increase sharply at high elevations (Figure 9c). The ET/PETgs ratios showed a statistically significant declining trend with elevation (p < 0.01), which was broadly consistent with the NDVIgs trend (Figure 9d). Moreover, we found that the vegetation green-up rate was positively correlated to the ET/PETgs ratio at a higher significance level (r = 0.52, p < 0.01) and the correlation between ET and the green-up rate was less significant (p > 0.05). Therefore, the increased ET within the TRHR could mainly be attributed to the overall increase in temperature.
Overall, the reductions in water availability brought about by climate warming could greatly slow the vegetation green-up rate at high elevations, although EDW appears to create a warmer environment for vegetation growth. In addition, the negative correlation between Tgs and NDVIgs shown in Figure 6 also highlights the adverse effect of warming on vegetation greening within high-elevation areas. Thus, the decline in the vegetation green-up rate with elevation could be attributed to the sustained reductions in water availability for vegetation growth at high elevations.

5. Conclusions

In this study, we quantified and characterized the seasonal changes in vegetation across the Three Rivers Headwaters Region (TRHR) to advance the understanding of linkages between elevation-dependent changes in temperature and precipitation and vegetation greening trends over this region. By mapping the growing-season normalized difference vegetation index (NDVIgs) from 1982 to 2015, we were able to evaluate vegetation changes across different years and detect greening trends over time. The results provide evidence that the rate and magnitude of elevation-dependent changes in temperature and precipitation may vary across elevation and vegetation types in alpine regions. The major findings of this study can be summarized as follows:
(i)
For NDVIgs across the TRHR, a more or less gradual greening trend from west to east was observed, whereas an uneven yet consistent greening trend was noticed in decadal-scale NDVIgs, indicating that about 70% of the land within the TRHR had undergone positive shifts in vegetation between 1982 and 2015.
(ii)
The trends in vegetation greening were negatively correlated with the warming rates across the region, whereas the precipitation changes generally exhibited no strong correlation with greening trends.
(iii)
The statistical results demonstrate a consistent declining trend in the growing-season green-up rate with increasing elevation within the TRHR. This trend was possibly attributed to the reduced soil water availability induced by the fast increase in warming rates associated with EDW.
(iv)
The implementation of alpine conservation and ecological restoration programs within the TRHR appear to be effective in driving barren land greening. However, the presence of anthropogenic activities could also adversely affect local alpine ecosystems, and in some cases was also deemed the primary cause of environmental degradation, e.g., via loss of productivity in grasslands with overgrazing.

Author Contributions

Conceptualization, K.W., Y.Z., J.H., C.C. and T.L.; methodology, K.W.; formal analysis, K.W., Y.Z. and J.H.; data curation, K.W. and C.C.; writing—original draft preparation, K.W. and Y.Z.; writing—review and editing, Y.Z. and T.L.; visualization, Y.Z.; funding acquisition, K.W. and Y.Z. All authors have read and agreed to the published version of the manuscript.

Funding

This research was funded by the Open Research Fund Program of the State Key Laboratory of Hydroscience and Engineering (sklhse-2022-A-02; sklhse-2021-A-02), the Science and Technology Project of Shenzhen Institute of Information Technology (SZIIT2022KJ011), and the Key Research Project of Qinghai Province (2021-SF-A7-1).

Data Availability Statement

The NDVI data are available at https://data.tpdc.ac.cn/en/data/9775f2b4-7370-4e5e-a537-3482c9a83d88/ (accessed on 1 December 2020). The monthly precipitation data are available at https://data.chc.ucsb.edu/products/CHIRPS-2.0/ (accessed on 31 December 2020). The monthly temperature data are available at https://www.ecmwf.int/en/forecasts/dataset/ecmwf-reanalysis-v5 (accessed on 31 December 2020). The monthly ET and PET data are available at https://www.gleam.eu/ (accessed on 1 December 2020).

Conflicts of Interest

The authors declare no conflict of interest.

References

  1. Blois, J.L.; Zarnetske, P.L.; Fitzpatrick, M.C.; Finnegan, S. Climate Change and the Past, Present, and Future of Biotic Interactions. Science 2013, 341, 499–504. [Google Scholar] [CrossRef] [PubMed] [Green Version]
  2. Buermann, W.; Forkel, M.; O’Sullivan, M.; Sitch, S.; Friedlingstein, P.; Haverd, V.; Jain, A.K.; Kato, E.; Kautz, M.; Lienert, S.; et al. Widespread Seasonal Compensation Effects of Spring Warming on Northern Plant Productivity. Nature 2018, 562, 110–114. [Google Scholar] [CrossRef] [PubMed] [Green Version]
  3. Palazzi, E.; Filippi, L.; von Hardenberg, J. Insights into Elevation-Dependent Warming in the Tibetan Plateau-Himalayas from CMIP5 Model Simulations. Clim. Dyn. 2017, 48, 3991–4008. [Google Scholar] [CrossRef] [Green Version]
  4. Pepin, N.; Bradley, R.S.; Diaz, H.F.; Baraer, M.; Caceres, E.B.; Forsythe, N.; Fowler, H.; Greenwood, G.; Hashmi, M.Z.; Liu, X.D.; et al. Elevation-Dependent Warming in Mountain Regions of the World. Nat. Clim. Chang. 2015, 5, 424–430. [Google Scholar] [CrossRef] [Green Version]
  5. Rangwala, I.; Miller, J.R. Climate Change in Mountains: A Review of Elevation-Dependent Warming and Its Possible Causes. Clim. Chang. 2012, 114, 527–547. [Google Scholar] [CrossRef]
  6. Zhang, L.; Guo, H.D.; Wang, C.Z.; Ji, L.; Li, J.; Wang, K.; Dai, L. The Long-Term Trends (1982–2006) in Vegetation Greenness of the Alpine Ecosystem in the Qinghai-Tibetan Plateau. Environ. Earth Sci. 2014, 72, 1827–1841. [Google Scholar] [CrossRef]
  7. Wang, G.; Wang, Y.; Li, Y.; Cheng, H. Influences of Alpine Ecosystem Responses to Climatic Change on Soil Properties on the Qinghai–Tibet Plateau, China. Catena 2007, 70, 506–514. [Google Scholar] [CrossRef]
  8. Liu, J.; Xu, X.; Shao, Q. Grassland Degradation in the “Three-River Headwaters” Region, Qinghai Province. J. Geogr. Sci. 2008, 18, 259–273. [Google Scholar] [CrossRef]
  9. Chen, H.; Zhu, Q.; Peng, C.; Wu, N.; Wang, Y.; Fang, X.; Gao, Y.; Zhu, D.; Yang, G.; Tian, J.; et al. The Impacts of Climate Change and Human Activities on Biogeochemical Cycles on the Qinghai-Tibetan Plateau. Glob. Chang. Biol. 2013, 19, 2940–2955. [Google Scholar] [CrossRef]
  10. Cong, N.; Shen, M.; Yang, W.; Yang, Z.; Zhang, G.; Piao, S. Varying Responses of Vegetation Activity to Climate Changes on the Tibetan Plateau Grassland. Int. J. Biometeorol. 2017, 61, 1433–1444. [Google Scholar] [CrossRef]
  11. Hamid, M.; Khuroo, A.A.; Malik, A.H.; Ahmad, R.; Haq, S.M. Early Evidence of Shifts in Alpine Summit Vegetation: A Case Study From Kashmir Himalaya. Front. Plant Sci. 2020, 11, 421. [Google Scholar] [CrossRef] [Green Version]
  12. Sarkar, S.; Kafatos, M. Interannual Variability of Vegetation over the Indian Sub-Continent and Its Relation to the Different Meteorological Parameters. Remote Sens. Environ. 2004, 90, 268–280. [Google Scholar] [CrossRef]
  13. Kumari, N.; Saco, P.M.; Rodriguez, J.F.; Johnstone, S.A.; Srivastava, A.; Chun, K.P.; Yetemen, O. The Grass Is Not Always Greener on the Other Side: Seasonal Reversal of Vegetation Greenness in Aspect-Driven Semiarid Ecosystems. Geophys. Res. Lett. 2020, 47, e2020GL088918. [Google Scholar] [CrossRef]
  14. Cotto, O.; Wessely, J.; Georges, D.; Klonner, G.; Schmid, M.; Dullinger, S.; Thuiller, W.; Guillaume, F. A Dynamic Eco-Evolutionary Model Predicts Slow Response of Alpine Plants to Climate Warming. Nat. Commun. 2017, 8, 15399. [Google Scholar] [CrossRef] [Green Version]
  15. Holzinger, B.; Hülber, K.; Camenisch, M.; Grabherr, G. Changes in Plant Species Richness over the Last Century in the Eastern Swiss Alps: Elevational Gradient, Bedrock Effects and Migration Rates. Plant Ecol. 2008, 195, 179–196. [Google Scholar] [CrossRef]
  16. Srivastava, A.; Sahoo, B.; Raghuwanshi, N.S.; Singh, R. Evaluation of Variable-Infiltration Capacity Model and MODIS-Terra Satellite-Derived Grid-Scale Evapotranspiration Estimates in a River Basin with Tropical Monsoon-Type Climatology. J. Irrig. Drain. Eng. 2017, 143, 04017028. [Google Scholar] [CrossRef] [Green Version]
  17. Pandey, R.; Kumar, P.; Archie, K.M.; Gupta, A.K.; Joshi, P.K.; Valente, D.; Petrosillo, I. Climate Change Adaptation in the Western-Himalayas: Household Level Perspectives on Impacts and Barriers. Ecol. Indic. 2018, 84, 27–37. [Google Scholar] [CrossRef]
  18. Xie, Y.; Sha, Z.; Yu, M. Remote Sensing Imagery in Vegetation Mapping: A Review. J. Plant Ecol. 2008, 1, 9–23. [Google Scholar] [CrossRef]
  19. Boegh, E.; Soegaard, H.; Hanan, N.; Kabat, P.; Lesch, L. A Remote Sensing Study of the NDVI-Ts Relationship and the Transpiration from Sparse Vegetation in the Sahel Based on High-Resolution Satellite Data. Remote Sens. Environ. 1999, 69, 224–240. [Google Scholar] [CrossRef]
  20. Autovino, D.; Minacapilli, M.; Provenzano, G. Modelling Bulk Surface Resistance by MODIS Data and Assessment of MOD16A2 Evapotranspiration Product in an Irrigation District of Southern Italy. Agric. Water Manag. 2016, 167, 86–94. [Google Scholar] [CrossRef]
  21. Tucker, C.J. Red and Photographic Infrared Linear Combinations for Monitoring Vegetation. Remote Sens. Environ. 1979, 8, 127–150. [Google Scholar] [CrossRef] [Green Version]
  22. Bounoua, L.; Collatz, G.J.; Los, S.O.; Sellers, P.J.; Dazlich, D.A. Sensitivity of Climate to Changes in NDVI. J. Clim. 2000, 13, 2277. [Google Scholar] [CrossRef]
  23. Chakraborty, A.; Seshasai, M.V.R.; Reddy, C.S.; Dadhwal, V.K. Persistent Negative Changes in Seasonal Greenness over Different Forest Types of India Using MODIS Time Series NDVI Data (2001–2014). Ecol. Indic. 2018, 85, 887–903. [Google Scholar] [CrossRef]
  24. Wang, R.; Gamon, J.A.; Montgomery, R.A.; Townsend, P.A.; Zygielbaum, A.I.; Bitan, K.; Tilman, D.; Cavender-Bares, J. Seasonal Variation in the NDVI–Species Richness Relationship in a Prairie Grassland Experiment (Cedar Creek). Remote Sens. 2016, 8, 128. [Google Scholar] [CrossRef] [Green Version]
  25. Kumari, N.; Srivastava, A.; Dumka, U.C. A Long-Term Spatiotemporal Analysis of Vegetation Greenness over the Himalayan Region Using Google Earth Engine. Climate 2021, 9, 109. [Google Scholar] [CrossRef]
  26. Shahzaman, M.; Zhu, W.; Bilal, M.; Habtemicheal, B.A.; Mustafa, F.; Arshad, M.; Ullah, I.; Ishfaq, S.; Iqbal, R. Remote Sensing Indices for Spatial Monitoring of Agricultural Drought in South Asian Countries. Remote Sens. 2021, 13, 2059. [Google Scholar] [CrossRef]
  27. Bastos, A.; Ciais, P.; Park, T.; Zscheischler, J.; Yue, C.; Barichivich, J.; Myneni, R.B.; Peng, S.; Piao, S.; Zhu, Z. Was the Extreme Northern Hemisphere Greening in 2015 Predictable? Environ. Res. Lett. 2017, 12, 44016. [Google Scholar] [CrossRef] [Green Version]
  28. Ding, Z.; Peng, J.; Qiu, S.; Zhao, Y. Nearly Half of Global Vegetated Area Experienced Inconsistent Vegetation Growth in Terms of Greenness, Cover, and Productivity. Earth’s Futur. 2020, 8, e2020EF001618. [Google Scholar] [CrossRef]
  29. Lucht, W.; Prentice, I.C.; Myneni, R.B.; Sitch, S.; FriedLingstein, P.; Cramer, W.; Bousquet, P.; Buermann, W.; Smith, B. Climatic Control of the High-Latitude Vegetation Greening Trend and Pinatubo Effect. Science 2002, 296, 1687–1689. [Google Scholar] [CrossRef] [Green Version]
  30. Mao, J.; Shi, X.; Thornton, P.E.; Piao, S.; Wang, X. Causes of Spring Vegetation Growth Trends in the Northern Mid–High Latitudes from 1982 to 2004. Environ. Res. Lett. 2012, 7, 14010. [Google Scholar] [CrossRef]
  31. Srivastava, A.; Saco, P.M.; Rodriguez, J.F.; Kumari, N.; Chun, K.P.; Yetemen, O. The Role of Landscape Morphology on Soil Moisture Variability in Semi-arid Ecosystems. Hydrol. Process. 2021, 35, e13990. [Google Scholar] [CrossRef]
  32. Myneni, R.B.; Keeling, C.D.; Tucker, C.J.; Asrar, G.; Nemani, R.R. Increased Plant Growth in the Northern High Latitudes from 1981 to 1991. Nature 1997, 386, 698–702. [Google Scholar] [CrossRef]
  33. Geert, J.; Balmaseda, M.A.; Ferranti, L.; Stockdale, T.N.; Anderson, D. Evaluation of Atmospheric Fields from the ECMWF Seasonal Forecasts over a 15-Year Period. J. Clim. 2005, 18, 3250–3269. [Google Scholar] [CrossRef] [Green Version]
  34. Trujillo, E.; Molotch, N.P.; Goulden, M.L.; Kelly, A.E.; Bales, R.C. Elevation-Dependent Influence of Snow Accumulation on Forest Greening. Nat. Geosci. 2012, 5, 705–709. [Google Scholar] [CrossRef]
  35. Piao, S.; Nan, H.; Huntingford, C.; Ciais, P.; Friedlingstein, P.; Sitch, S.; Peng, S.; Ahlström, A.; Canadell, J.G.; Cong, N.; et al. Evidence for a Weakening Relationship between Interannual Temperature Variability and Northern Vegetation Activity. Nat. Commun. 2014, 5, 5018. [Google Scholar] [CrossRef] [Green Version]
  36. Zhang, Y.; Zhang, S.; Zhai, X.; Xia, J. Runoff Variation and Its Response to Climate Change in the Three Rivers Source Region. J. Geogr. Sci. 2012, 22, 781–794. [Google Scholar] [CrossRef]
  37. Wang, K.; Xu, Q.; Li, T. Does Recent Climate Warming Drive Spatiotemporal Shifts in Functioning of High-Elevation Hydrological Systems? Sci. Total Environ. 2020, 719, 137507. [Google Scholar] [CrossRef]
  38. Xu, W.; Gu, S.; Zhao, X.Q.; Xiao, J.; Tang, Y.; Fang, J.; Zhang, J.; Jiang, S. High Positive Correlation between Soil Temperature and NDVI from 1982 to 2006 in Alpine Meadow of the Three-River Source Region on the Qinghai-Tibetan Plateau. Int. J. Appl. Earth Obs. Geoinf. 2011, 13, 528–535. [Google Scholar] [CrossRef]
  39. Harris, R.B. Rangeland Degradation on the Qinghai-Tibetan Plateau: A Review of the Evidence of Its Magnitude and Causes. J. Arid Environ. 2010, 74, 1–12. [Google Scholar] [CrossRef]
  40. Yang, J.; Ding, Y.; Chen, R. Spatial and Temporal of Variations of Alpine Vegetation Cover in the Source Regions of the Yangtze and Yellow Rivers of the Tibetan Plateau from 1982 to 2001. Environ. Geol. 2006, 50, 313–322. [Google Scholar] [CrossRef]
  41. Zhang, J.; Yao, F.; Zheng, L.; Yang, L. Evaluation of Grassland Dynamics in the Northern-Tibet Plateau of China Using Remote Sensing and Climate Data. Sensors 2007, 7, 3312–3328. [Google Scholar] [CrossRef] [PubMed] [Green Version]
  42. Pan, T.; Zou, X.; Liu, Y.; Wu, S.; He, G. Contributions of Climatic and Non-Climatic Drivers to Grassland Variations on the Tibetan Plateau. Ecol. Eng. 2017, 108, 307–317. [Google Scholar] [CrossRef]
  43. Shen, X.; An, R.; Feng, L.; Ye, N.; Zhu, L.; Li, M. Vegetation Changes in the Three-River Headwaters Region of the Tibetan Plateau of China. Ecol. Indic. 2018, 93, 804–812. [Google Scholar] [CrossRef]
  44. Chen, C.; Li, T.; Sivakumar, B.; Li, J.; Wang, G. Attribution of Growing Season Vegetation Activity to Climate Change and Human Activities in the Three-River Headwaters Region, China. J. Hydroinformatics 2020, 22, 186–204. [Google Scholar] [CrossRef] [Green Version]
  45. Jiang, C.; Zhang, L. Ecosystem Change Assessment in the Three-River Headwater Region, China: Patterns, Causes, and Implications. Ecol. Eng. 2016, 93, 24–36. [Google Scholar] [CrossRef]
  46. Zhang, S.; Hua, D.; Meng, X.; Zhang, Y. Climate Change and Its Driving Effect on the Runoff in the “Three-River Headwaters” Region. Dili Xuebao/Acta Geogr. Sin. 2011, 66, 13–24. [Google Scholar] [CrossRef]
  47. Zheng, Y.; Han, J.; Huang, Y.; Fassnacht, S.R.; Xie, S.; Lv, E.; Chen, M. Vegetation Response to Climate Conditions Based on NDVI Simulations Using Stepwise Cluster Analysis for the Three-River Headwaters Region of China. Ecol. Indic. 2018, 92, 18–29. [Google Scholar] [CrossRef]
  48. Liu, L.; Wang, Y.; Wang, Z.; Li, D.; Zhang, Y.; Qin, D.; Li, S. Elevation-Dependent Decline in Vegetation Greening Rate Driven by Increasing Dryness Based on Three Satellite NDVI Datasets on the Tibetan Plateau. Ecol. Indic. 2019, 107, 105569. [Google Scholar] [CrossRef]
  49. Tucker, C.; Pinzon, J.; Brown, M.; Slayback, D.; Pak, E.; Mahoney, R.; Vermote, E.; El Saleous, N. An Extended AVHRR 8-Km NDVI Dataset Compatible with MODIS and SPOT Vegetation NDVI Data. Int. J. Remote Sens. 2005, 26, 4485–4498. [Google Scholar] [CrossRef]
  50. Beck, H.E.; Mcvicar, T.R.; Dijk, A.; Schellekens, J.; Jeu, R.; Bruijnzeel, L.A. Global Evaluation of Four AVHRR–NDVI Data Sets: Intercomparison and Assessment against Landsat Imagery. Remote Sens. Environ. 2011, 115, 2547–2563. [Google Scholar] [CrossRef]
  51. HOLBEN, B.N. Characteristics of Maximum-Value Composite Images from Temporal AVHRR Data. Int. J. Remote Sens. 1986, 7, 1417–1434. [Google Scholar] [CrossRef]
  52. Martens, B.; Miralles, D.G.; Lievens, H.; van der Schalie, R.; de Jeu, R.A.M.; Fernández-Prieto, D.; Beck, H.E.; Dorigo, W.A.; Verhoest, N.E.C. GLEAM~v3: Satellite-Based Land Evaporation and Root-Zone Soil Moisture. Geosci. Model Dev. 2017, 10, 1903–1925. [Google Scholar] [CrossRef] [Green Version]
  53. Miralles, D.G.; Holmes, T.R.H.; De Jeu, R.A.M.; Gash, J.H.; Meesters, A.G.C.A.; Dolman, A.J. Global Land-Surface Evaporation Estimated from Satellite-Based Observations. Hydrol. Earth Syst. Sci. 2011, 15, 453–469. [Google Scholar] [CrossRef] [Green Version]
  54. Wolf, L.J.; Anselin, L.; Arribas-Bel, D. Stochastic Efficiency of Bayesian Markov Chain Monte Carlo in Spatial Econometric Models: An Empirical Comparison of Exact Sampling Methods. Geogr. Anal. 2018, 50, 97–119. [Google Scholar] [CrossRef] [Green Version]
  55. Yue, S.; Wang, C.Y. Applicability of Prewhitening to Eliminate the Influence of Serial Correlation on the Mann-Kendall Test. Water Resour. Res. 2002, 38, 4–1–4–7. [Google Scholar] [CrossRef]
  56. Zhang, X.; Vincent, L.A.; Hogg, W.D.; Niitsoo, A. Temperature and Precipitation Trends in Canada during the 20th Century. Atmos.-Ocean 2000, 38, 395–429. [Google Scholar] [CrossRef]
  57. Yang, Q.; Zhang, H.; Peng, W.; Lan, Y.; Luo, S.; Shao, J.; Chen, D.; Wang, G. Assessing Climate Impact on Forest Cover in Areas Undergoing Substantial Land Cover Change Using Landsat Imagery. Sci. Total Environ. 2019, 659, 732–745. [Google Scholar] [CrossRef]
  58. Liu, Y.; Li, Y.; Li, S.; Motesharrei, S. Spatial and Temporal Patterns of Global NDVI Trends: Correlations with Climate and Human Factors. Remote Sens. 2015, 7, 13233–13250. [Google Scholar] [CrossRef] [Green Version]
  59. Kuang, X.; Jiao, J.J. Review on Climate Change on the Tibetan Plateau during the Last Half Century. J. Geophys. Res. D. Atmos. JGR 2016, 121, 3979–4007. [Google Scholar] [CrossRef] [Green Version]
  60. Zhang, D.; Huang, J.; Guan, X.; Chen, B.; Zhang, L. Long-Term Trends of Precipitable Water and Precipitation over the Tibetan Plateau Derived from Satellite and Surface Measurements. J. Quant. Spectrosc. Radiat. Transf. 2013, 122, 64–71. [Google Scholar] [CrossRef]
  61. Seddon, A.W.R.; Macias-Fauria, M.; Long, P.R.; Benz, D.; Willis, K.J. Sensitivity of Global Terrestrial Ecosystems to Climate Variability. Nature 2016, 531, 229–232. [Google Scholar] [CrossRef] [PubMed]
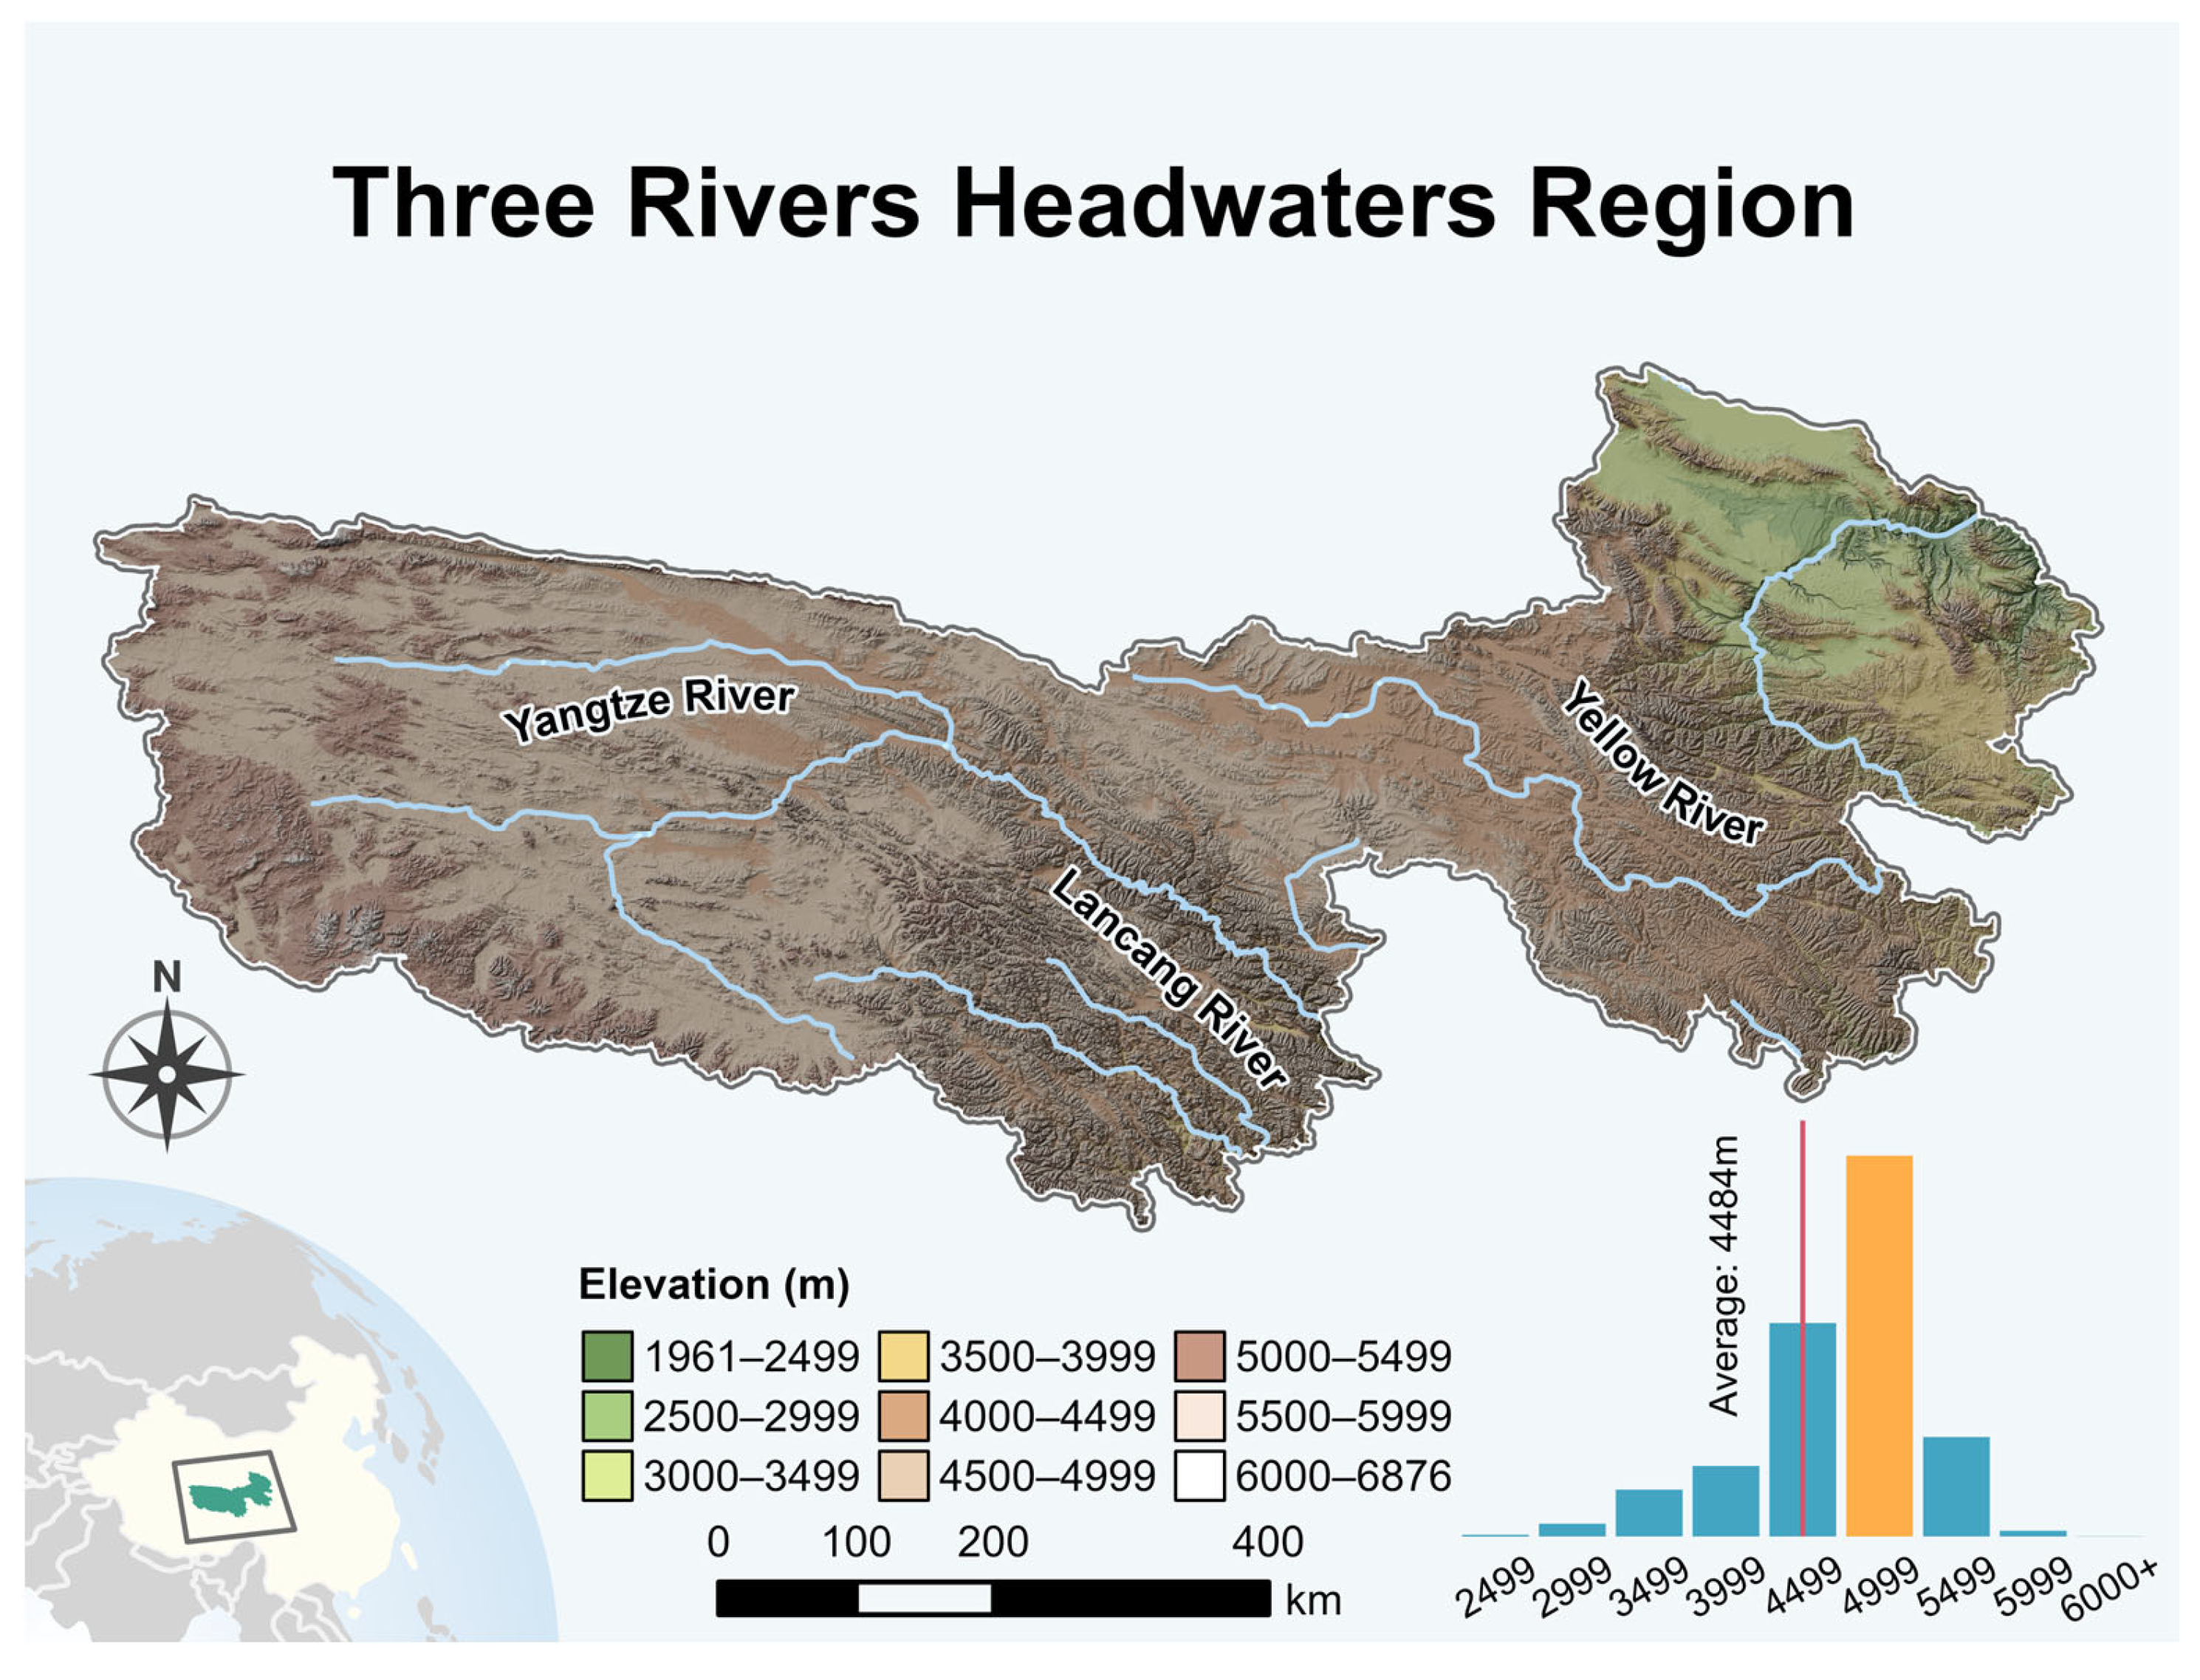
Figure 1. Location of study area in the Qinghai–Tibet Plateau, China. The TRHR cradles the headwaters of the Yangtze, the Yellow, and the Lancang, and is known as China’s water tower. The elevation in the area ranges from 1961 m to 6876 m. The average elevation is 4484 m, but most of the area is above 4500 m.
Remotesensing 15 00496 g001
Figure 2. (a) The 34-year average growing-season NDVI greenness map for the TRHR (the pixels with NDVIgs values smaller than 0.01 were deemed to be non-vegetation areas and displayed as blank); (b) the land cover map for the TRHR, represented by nine land cover categories.
Remotesensing 15 00496 g002
Figure 3. The average trends in (a) NDVI, (c) temperature, and (e) precipitation during the growing season from 1982 to 2015; the decadal changes in (b) NDVI, (d) temperature, and (f) precipitation across the TRHR. The pixels with significant changes at the 95% confidence level are marked by crosses.
Remotesensing 15 00496 g003
Figure 4. The growing-season (a) temperature and (b) precipitation patterns across the TRHR from 1982 to 2015; comparisons of elevational trends in (c) temperature and NDVIgs, and (d) precipitation and NDVIgs.
Remotesensing 15 00496 g004
Figure 5. The elevational trends in (a) NDVIgs, (b) temperature, and (c) precipitation using the average-data method; the elevational trends in (d) NDVIgs, (e) temperature, and (f) precipitation using the pixel-based method.
Remotesensing 15 00496 g005
Figure 6. Correlation analysis between trends in temperature and precipitation and trend in NDVIgs. (a,b) Correlations from the average-data method, and (c,d) correlations from the pixel-based method.
Remotesensing 15 00496 g006
Figure 7. Summary of Spearman correlation and partial correlation analysis. Bar opacity represents statistical significance at the 95% confidence level.
Remotesensing 15 00496 g007
Figure 8. Correlations between NDVIgs and per-pixel land cover percentage (af); correlations between NDVIgs trend and per-pixel land cover percentage (gi).
Remotesensing 15 00496 g008
Figure 9. The growing-season (a) ETgs and (b) ET/PETgs patterns across the TRHR from 1982 to 2015; comparisons of elevational trends in (c) ETgs and NDVIgs, and (d) ET/PETgs and NDVIgs.
Remotesensing 15 00496 g009
Table 1. Summary of data sources used for this study.
Data TypesData SourcesTemporal ResolutionSpatial ResolutionTemporal Coverage
NDVIGIMMS NDVI3g15 days0.083°1982 to 2015
Precipitation CHIRPSMonth0.05°1982 to 2015
Temperature ERA-InterimMonth0.125°1982 to 2015
Evapotranspiration/Potential evapotranspiration GLEAMMonth0.25°1982 to 2015
Disclaimer/Publisher’s Note: The statements, opinions and data contained in all publications are solely those of the individual author(s) and contributor(s) and not of MDPI and/or the editor(s). MDPI and/or the editor(s) disclaim responsibility for any injury to people or property resulting from any ideas, methods, instructions or products referred to in the content.