Mapping of the Successional Stage of a Secondary Forest Using Point Clouds Derived from UAV Photogrammetry
Abstract
:1. Introduction
2. Materials and Methods
2.1. Study Area
2.2. Methods
2.2.1. Traditional Forest Inventory
2.2.2. Classification of the Successional Stage
2.2.3. Digital Aerial Photogrammetry (DAP)
UAV Photos
Structure from Motion Processing
2.2.4. Light Detection and Ranging (LiDAR)
Data Collection
Pre-Elaboration of Point Clouds
2.2.5. Digital Terrain Model (DTM)
2.2.6. Structural Metrics
2.2.7. DAP-UAV Validation
DTM Validation
Validation of the Vertical Structure of DAP-UAV Clouds
2.2.8. Estimated Models of Mean h, Average dbh, and ba
2.2.9. Spatialization of DAP-UAV Models
2.2.10. Cost–Benefit Analysis
3. Results and Discussion
3.1. TFI Results and Classification of Stage of Plots
3.2. Validation of DAP-UAV Data
3.2.1. Digital Terrain Model
3.2.2. Heights of Trees
Maximum Height x Hmax
Dominant Height HP95
3.3. Selected Models
3.3.1. Average Total Height
3.3.2. Average dbh
3.3.3. Basal Area (ba)
3.4. Spatialization Maps of DAP-UAV Models
3.5. Cost-Benefit Analysis
4. Conclusions
Author Contributions
Funding
Acknowledgments
Conflicts of Interest
Appendix A
| Component | Sub-Component | Item | Quantity | Unit | Value | Total |
|---|---|---|---|---|---|---|
| Equipment | Equipment | Stakes | 1 | Ensemble | R$ 490.00 | R$ 490.00 |
| Equipment | Equipment | Telescopic ruler 15 m | 1 | Unit | R$ 500.00 | R$ 500.00 |
| Equipment | Equipment | Clinometer | 1 | Unit | R$ 1,899.00 | R$ 1,899.00 |
| Equipment | Equipment | Trena + nylon + measuring tape | 1 | Kit | R$ 186.55 | R$ 186.55 |
| Equipment | Equipment | Ppe | 3 | Kit | R$ 300.00 | R$ 900.00 |
| Equipment | Equipment | Computer Dell precision 3930 Rack + Monitor Dell 34" WQHD | 1 | Unit | R$ 35,722.23 | R$ 35,722.23 |
| Equipment | Software | Native Forest | 1 | License | R$ 1417.00 | R$ 1417.00 |
| Equipment | Software | Office Suite | 1 | License | R$ 329.16 | R$ 329.16 |
| Data acquisition | Data acquisition | Access to the parcel | 13 | Hour/man | R$ 459.00 | R$ 5967.00 |
| Data acquisition | Data acquisition | Plot demarcation | 59 | Hour/man | R$ 459.00 | R$ 27,081.00 |
| Data acquisition | Data acquisition | Data collection | 106 | Hour/man | R$ 459.00 | R$ 48,654.00 |
| Data acquisition | Data acquisition | Car Rental | 24 | Daily | R$ 224.00 | R$ 5376.00 |
| Data acquisition | Data acquisition | Host | 24 | Daily | R$ 210.00 | R$ 5040.00 |
| Data processing and analysis | Data processing and analysis | Data tabbing | 8 | Hour/man | R$ 153.00 | R$ 1224.00 |
| Data processing and analysis | Data processing and analysis | Data processing and analysis | 8 | Hour/man | R$ 153.00 | R$ 1224.00 |
| Total | 3.6 ha | R$ 136,009.94 | ||||
| Cost per hectare | Equipment | R$ 41,443.94 | ||||
| acquisition and analysis of data per hectare | 1 ha | R$ 26,268.33 |
| Component | Sub-Component | Item | Quantity | Unit | Value | Total |
|---|---|---|---|---|---|---|
| Equipment | Equipment | Horizom Zeb | 1 | Unit | R$ 367,700.00 | R$ 367,700.00 |
| Equipment | Equipment | Rent RTK | 160 | R$/dot | R$ 16.85 | R$ 2696.00 |
| Equipment | Equipment | Computer Dell precision 3930 Rack + Monitor Dell 34" WQHD | 1 | Unit | R$ 35,722.23 | R$ 35,722.23 |
| Equipment | Equipment | Machete | 3 | Unit | R$ 24.64 | R$ 73.92 |
| Equipment | Equipment | Ppe | 3 | Kit | R$ 300.00 | R$ 900.00 |
| Equipment | Software | Geoslam | 1 | License | R$ - | |
| Data acquisition | Data acquisition | Access to the parcel | 13 | Hour/man | R$ 459.00 | R$ 5967.00 |
| Data acquisition | Data acquisition | Data collection | 10 | Hour/man | R$ 459.00 | R$ 4590.00 |
| Data acquisition | Data acquisition | Collection of GCPs with RTK | 86,4 | Hour/man | R$ 459.00 | R$ 39,657.60 |
| Data acquisition | Data acquisition | Car Rental | 15 | Daily | R$ 224.00 | R$ 3360.00 |
| Data acquisition | Data acquisition | Hosting | 15 | Daily | R$ 210.00 | R$ 3150.00 |
| Data processing and analysis | Data processing and analysis | Point Clouds Processing | 6,6 | Hour/man | R$ 153.00 | R$ 1009.80 |
| Data processing and analysis | Data processing and analysis | Georeferencing of point clouds | 3,3 | Hour/man | R$ 153.00 | R$ 504.90 |
| Data processing and analysis | Data processing and analysis | Normalization of point clouds | 3,3 | Hour/man | R$ 153.00 | R$ 504.90 |
| Data processing and analysis | Data processing and analysis | Extraction of metrics | 1,76 | Hour/man | R$ 153.00 | R$ 269.28 |
| Data processing and analysis | Data processing and analysis | Application of models | 1,33 | Hour/man | R$ 153.00 | R$ 203.49 |
| Total | 3.6 ha | R$ 466,309.12 | ||||
| Cost per hectare | Equipment | R$ 407,092.15 | ||||
| acquisition and analysis of data per hectare | 1 ha | R$ 16,449.16 |
| Component | Sub-Component | Item | Quantity | Unit | Value | Total |
|---|---|---|---|---|---|---|
| Equipment | Equipment | DJI Mavic 2 pro + kit fly more + SD card | 1 | Unit | R$ 21,999.00 | R$ 21,999.00 |
| Equipment | Equipment | Rent RTK | 40 | R$/dot | R$ 16.85 | R$ 674.00 |
| Equipment | Equipment | Computer Dell precision 3930 Rack + Monitor Dell 34" WQHD | 1 | Unit | R$ 35,722.23 | R$ 35,722.23 |
| Equipment | Software | Agisoft | 1 | License | R$ 28,500.00 | R$ 28,500.00 |
| Data acquisition | Data acquisition | Flight planning | 1 | Hour/man | R$ 153.00 | R$ 153.00 |
| Data acquisition | Data acquisition | Collection of GCPs with RTK | 21,62 | Hour/man | R$ 459.00 | R$ 9923.58 |
| Data acquisition | Data acquisition | Flight | 1,45 | Hour/man | R$ 459.00 | R$ 665.55 |
| Data acquisition | Data acquisition | Car Rental | 5 | Daily | R$ 224.00 | R$ 1120.00 |
| Data acquisition | Data acquisition | Hosting | 5 | Daily | R$ 210.00 | R$ 1050.00 |
| Data processing and analysis | Data processing and analysis | Photo alignment | 2 | Hour/man | R$ 153.00 | R$ 306.00 |
| Data processing and analysis | Data processing and analysis | GPCs pointing | 2 | Hour/man | R$ 153.00 | R$ 306.00 |
| Data processing and analysis | Data processing and analysis | Point Cloud Cleanup | 1,33 | Hour/man | R$ 153.00 | R$ 203.49 |
| Data processing and analysis | Data processing and analysis | Dense cloud construction | 8,7 | Hour/man | R$ 154.00 | R$ 1339.80 |
| Data processing and analysis | Data processing and analysis | Normalization of point clouds | 8 | Hour/man | R$ 153,00 | R$ 1224.00 |
| Data processing and analysis | Data processing and analysis | Extraction of metrics | 1,76 | Hour/man | R$ 153.00 | R$ 269.28 |
| Data processing and analysis | Data processing and analysis | Application of models | 1,33 | Hour/man | R$ 153.00 | R$ 203.49 |
| Total | 201 ha | R$ 103,659.42 | ||||
| Cost per hectare | Equipment | R$ 86,895.23 | ||||
| acquisition and analysis of data per hectare | 1 ha | R$ 83.40 |
References
- ONU. Relatório Anual Das Nações Unidas No Brasil 2021–Portal ODS. Available online: https://portalods.com.br/publicacoes/relatorio-anual-das-nacoes-unidas-no-brasil-2021/ (accessed on 4 August 2022).
- Mma, M.d.M.A. ENREDD+ National REDD+ Strategy; Ministry of the Environment: Brasília, Brasil, 2016. [Google Scholar]
- Andrade, D.T.; Romeiro, A.R. Degradação Ambiental e Teoria Econômica. Rev. Econ. A 2011, 12, 3–26. [Google Scholar]
- Cunha, N.R.d.S.; Cunha, S.; Eustáquio De Lima, J.; Fernandes, M.; Gomes, M.; Braga, M.J. A Intensidade Da Exploração Agropecuária Como Indicador Da Degradação Ambiental Na Região Dos Cerrados, Brasil. Rev. De Econ. E Sociol. Rural. 2008, 46, 291–323. [Google Scholar] [CrossRef]
- Muñoz-Rojas, M.; Pereira, P.; Brevik, E.C.; Cerdà, A.; Jordán, A. Soil Mapping and Processes Models for Sustainable Land Management Applied to Modern Challenges. In Soil Mapping and Process Modeling for Sustainable Land Use Management; Elsevier: Amsterdam, The Netherlands, 2017; pp. 151–190. [Google Scholar]
- Dhakal, C.; Khadka, S.; Park, C.; Escalante, C.L. Climate Change Adaptation and Its Impact on Household Farm Income and Revenue Risk Exposure. Resour. Environ. Sustain. 2022, 10, 1–51. [Google Scholar] [CrossRef]
- DeVries, B.; Verbesselt, J.; Kooistra, L.; Herold, M. Robust Monitoring of Small-Scale Forest Disturbances in a Tropical Montane Forest Using Landsat Time Series. Remote Sens. Environ. 2015, 161, 107–121. [Google Scholar] [CrossRef]
- Campo, A.D.d.; Segura-Orenga, G.; Bautista, I.; Ceacero, C.J.; González-Sanchis, M.; Molina, A.J.; Hermoso, J. Assessing Reforestation Failure at the Project Scale: The Margin for Technical Improvement under Harsh Conditions. A Case Study in a Mediterranean Dryland. Sci. Total Environ. 2021, 796, 148952. [Google Scholar] [CrossRef] [PubMed]
- Pellico Netto, S.; Brena, D.A. Inventário Florestal, 1st ed.; UFPR: Curitiba, Brazil, 1997. [Google Scholar]
- Goodbody, T.R.H.; Coops, N.C.; Marshall, P.L.; Tompalski, P.; Crawford, P. Unmanned Aerial Systems for Precision Forest Inventory Purposes: A Review and Case Study. For. Chron. 2017, 93, 71–81. [Google Scholar] [CrossRef] [Green Version]
- Tompalski, P.; Coops, N.C.; White, J.C.; Wulder, M.A. Enhancing Forest Growth and Yield Predictions with Airborne Laser Scanning Data: Increasing Spatial Detail and Optimizing Yield Curve Selection through Template Matching. Forests 2016, 7, 255. [Google Scholar] [CrossRef] [Green Version]
- Higuchi, N.P.; dos Santos, J.; Jardim, F.C.S. Tamanho de Parcela Amostral Para Inventários Florestais. Acta Amaz. 1982, 12, 91–103. [Google Scholar]
- Nogueira, M.M.; Lentini, M.W.; Pires, I.P.; Bittencourt, P.G.; Zweede, J.C. Procedimentos Simplificados em Segurança e Saúde do Trabalho no Manejo Florestal Manual Técnico, 1st ed.; Instituto Floresta Tropical-Fundação Floresta Tropical: Belém, Brazil, 2010. [Google Scholar]
- White, J.C.; Coops, N.C.; Wulder, M.A.; Vastaranta, M.; Hilker, T.; Tompalski, P. Remote Sensing Technologies for Enhancing Forest Inventories: A Review. Can. J. Remote Sens. 2016, 42, 619–641. [Google Scholar] [CrossRef] [Green Version]
- Morin, D.; Planells, M.; Baghdadi, N.; Bouvet, A.; Fayad, I.; le Toan, T.; Mermoz, S.; Villard, L. Improving Heterogeneous Forest Height Maps by Integrating GEDI-Based Forest Height Information in a Multi-Sensor Mapping Process. Remote Sens. 2022, 14, 2079. [Google Scholar] [CrossRef]
- Kangas, A.; Gobakken, T.; Puliti, S.; Hauglin, M.; Næsset, E. Value of Airborne Laser Scanning and Digital Aerial Photogrammetry Data in Forest Decision Making. Silva Fennica 2018, 52, 1–19. [Google Scholar] [CrossRef] [Green Version]
- Pommerening, A. Approaches to quantifying forest structures. Forestry 2002, 75, 305–324. [Google Scholar] [CrossRef]
- Lorenzoni-Paschoa, L.; Abreu, K.M.P.; Silva, G.F.; Dias, H.M.; Machado, L.A.; Silva, L.D. Estágio sucessional de uma floresta estacional semidecidual secundária com distintos históricos de uso do solo no sul do Espírito Santo. Rodriguésia 2019, 70, 1–18. [Google Scholar] [CrossRef]
- Bergen, K.M.; Dronova, I. Observing succession on aspen-dominated landscapes using a remote sensing-ecosystem approach. Landsc. Ecol. 2007, 22, 1395–1410. [Google Scholar] [CrossRef]
- Bispo, P.D.C.; Pardini, M.; Papathanassiou, K.P.; Kugler, F.; Balzter, H.; Rains, D.; dos Santos, J.R.; Rizaev, I.G.; Tansey, K.; dos Santos, M.N.; et al. Mapping forest successional stages in the Brazilian Amazon using forest heights derived from TanDEM-X SAR interferometry. Remote. Sens. Environ. 2019, 232, 111194. [Google Scholar] [CrossRef]
- Kolecka, N.; Kozak, J.; Kaim, D.; Dobosz, D.; Ginzler, C.; Psomas, A. Mapping secondary forest succession on abandoned agricultural land with LiDAR point clouds and terrestrial photography. Remote Sens. 2015, 7, 8300–8322. [Google Scholar] [CrossRef] [Green Version]
- Myers, N.; Mittermeier, R.A.; Mittermeier, C.G.; da Fonseca, G.A.B.; Kent, J. Biodiversity hotspots for conservation priorities. Nature 2000, 403, 853–858. [Google Scholar]
- Ribeiro, M.C.; Metzger, J.P.; Martensen, A.C.; Ponzoni, F.; Hirota, M.M. BrazilianAtlantic forest: How much is left and how is the remaining forest distributed? Implications for conservation. Biol. Conserv. 2009, 142, 1141–1153. [Google Scholar] [CrossRef]
- INCAPER. Programa de Assistência Técnica e Extensão Rural, Proater 2020–2023; INCAPER: São Mateus, Brasil, 2020; pp. 1–55. [Google Scholar]
- Alvares, C.A.; Stape, J.L.; Sentelhas, P.C.; de Moraes Gonçalves, J.L.; Sparovek, G. Köppen’s Climate Classification Map for Brazil. Meteorol. Z. 2013, 22, 711–728. [Google Scholar] [CrossRef]
- IBGE. BDIA–Banco de Dados de Informações Ambientais. Available online: https://bdiaweb.ibge.gov.br/#/consulta/pedologia (accessed on 6 August 2022).
- Brasil. Resolução Conama 29, de 7 de dezembro de 1994 Conselho Nacional de Meio Ambiente. Available online: http://conama.mma.gov.br (accessed on 5 August 2022).
- Suunto PM-5/360 PC Clinometer–Inclination Tool for Professionals. Available online: https://www.suunto.com/Products/Compasses/Suunto-PM-5/Suunto-PM-5360-PC/ (accessed on 27 October 2022).
- Soares, C.P.B.; Paula Neto, F.; Souza, A.L. Dendrometria e Inventário Florestal; Editora UFV: Viçosa, Brazil, 2011. [Google Scholar]
- Dandois, J.P.; Olano, M.; Ellis, E.C. Optimal Altitude, Overlap, and Weather Conditions for Computer Vision UAV Estimates of Forest Structure. Remote Sens. 2015, 7, 13895–13920. [Google Scholar] [CrossRef] [Green Version]
- Brasil. ICA 100-40: Aeronaves não Tripuladas e o Acesso Aéreo Brasileiro. Available online: https://publicacoes.decea.mil.br/publicacao/ica-100-40 (accessed on 4 January 2023).
- Hung, M.N.W.B.; Sampaio, T.V.M.; Schultz, G.B.; Siefert, C.A.C.; Lange, D.R.; Marangon, F.H.S.; Santos, I. Dos levantamento com veículo aéreo não tripulado para geração demodelo digital do terreno em bacia experimental com vegetação florestal esparsa. RA’E GA–O Espac. Geogr. Em Anal. 2017, 39, 43–56. [Google Scholar] [CrossRef]
- Western Digital Corporation Cartão MicroSDXCTM SanDisk Extreme® PRO UHS-I, Melhor Cartão Micro SD|Western Digital. Available online: https://www.westerndigital.com/pt-br/products/memory-cards/sandisk-extreme-pro-uhs-i-microsd#SDSQXCD-128G-GN6MA (accessed on 7 August 2022).
- Agisoft Agisoft Metashape: Agisoft Metashape. Available online: https://www.agisoft.com/ (accessed on 7 August 2022).
- GEOSLAM ZEB Horizon: The Ultimate Mobile Mapping Solution. Available online: https://geoslam.com/solutions/zeb-horizon/ (accessed on 7 August 2022).
- GEOSLAM GeoSLAM Hub: Transform 3D Data into Actionable Information. Available online: https://geoslam.com/hub/ (accessed on 7 August 2022).
- Roussel, J.-R.; Auty, D.; Coops, N.C.; Tompalski, P.; Goodbody, T.R.H.; Meador, A.S.; Bourdon, J.-F.; de Boissieu, F.; Achim, A. LidR: An R Package for Analysis of Airborne Laser Scanning (ALS) Data. Remote Sens. Environ. 2020, 251, 112061. [Google Scholar] [CrossRef]
- R Core Team R: The R Project for Statistical Computing. Available online: https://www.r-project.org/ (accessed on 7 August 2022).
- McGaughey, R. FUSION/LDV: Software for LIDAR Data Analysis and Visualization 2022. V3.42; USDA Forest Service: Washington, DC, USA, 2022; pp. 1–212. [Google Scholar]
- Almeida, A.; Gonçalves, F.; Silva, G.; Souza, R.; Treuhaft, R.; Santos, W.; Loureiro, D.; Fernandes, M. Estimating Structure and Biomass of a Secondary Atlantic Forest in Brazil Using Fourier Transforms of Vertical Profiles Derived from UAV Photogrammetry Point Clouds. Remote Sens. 2020, 12, 3560. [Google Scholar] [CrossRef]
- Lumley, T. Package “Leaps”: Regression Subset Selection. Available online: https://cran.r-project.org/web/packages/leaps/leaps.pdf (accessed on 4 February 2022).
- SEEA; AEFES; CREA-ES. Tabela de Serviços e Honorários Profissionais No Campo Da Engenharia Agronômica Para o Estado Do Espírito Santo; SEEA: Vitória, Brazil, 2012. [Google Scholar]
- Gil, A.L.; Núñez-Casillas, L.; Isenburg, M.; Benito, A.A.; Bello, J.J.R.; Arbelo, M. A Comparison between LiDAR and Photogrammetry Digital Terrain Models in a Forest Area on Tenerife Island. Can. J. Remote Sens. 2013, 39, 396–409. [Google Scholar] [CrossRef]
- Zahawi, R.A.; Dandois, J.P.; Holl, K.D.; Nadwodny, D.; Reid, J.L.; Ellis, E.C. Using Lightweight Unmanned Aerial Vehicles to Monitor Tropical Forest Recovery. Biol. Conserv. 2015, 186, 287–295. [Google Scholar] [CrossRef] [Green Version]
- Panagiotidis, D.; Abdollahnejad, A.; Surový, P.; Chiteculo, V. Determining Tree Height and Crown Diameter from High-Resolution UAV Imagery. Int. J. Remote Sens. 2017, 38, 2392–2410. [Google Scholar] [CrossRef]
- Mlambo, R.; Woodhouse, I.; Gerard, F.; Anderson, K. Structure from Motion (SfM) Photogrammetry with Drone Data: A Low Cost Method for Monitoring Greenhouse Gas Emissions from Forests in Developing Countries. Forests 2017, 8, 68. [Google Scholar] [CrossRef] [Green Version]
- Guerra-Hernández, J.; González-Ferreiro, E.; Monleón, V.; Faias, S.; Tomé, M.; Díaz-Varela, R. Use of Multi-Temporal UAV-Derived Imagery for Estimating Individual Tree Growth in Pinus Pinea Stands. Forests 2017, 8, 300. [Google Scholar] [CrossRef]
- Kachamba, D.; Ørka, H.; Gobakken, T.; Eid, T.; Mwase, W. Biomass Estimation Using 3D Data from Unmanned Aerial Vehicle Imagery in a Tropical Woodland. Remote Sens. 2016, 8, 968. [Google Scholar] [CrossRef] [Green Version]
- Alcudia-Aguilar, A.; Alcudia-Aguilar, A.; Martínez-Zurimendi, P.; van der Wal, H.; Castillo-Uzcanga, M.M.; Suárez-Sánchez, J. Allometric Estimation of the Biomass of Musa spp. in Homegardens of Tabasco, Mexico. Trop. Subtrop. Agroecosyst. 2019, 22, 143–152. [Google Scholar]
- Meng, R.; Wu, J.; Schwager, K.L.; Zhao, F.; Dennison, P.E.; Cook, B.D.; Brewster, K.; Green, T.M.; Serbin, S.P. Using High Spatial Resolution Satellite Imagery to Map Forest Burn Severity across Spatial Scales in a Pine Barrens Ecosystem. Remote Sens. Environ. 2017, 191, 95–109. [Google Scholar] [CrossRef] [Green Version]
- Ganz, S.; Käber, Y.; Adler, P. Measuring Tree Height with Remote Sensing—A Comparison of Photogrammetric and LiDAR Data with Different Field Measurements. Forests 2019, 10, 694. [Google Scholar] [CrossRef] [Green Version]
- Dandois, J.P.; Ellis, E.C. High Spatial Resolution Three-Dimensional Mapping of Vegetation Spectral Dynamics Using Computer Vision. Remote Sens. Environ. 2013, 136, 259–276. [Google Scholar] [CrossRef] [Green Version]
- Schneider, P.R.; Schneider, P.S.P. Introdução Ao Manejo Florestal, 2nd ed.; FACOS-UFSM: Santa Maria, Brazil, 2008; ISBN 978-85-98031-51-4. [Google Scholar]
- Tompalski, P.; White, J.C.; Coops, N.C.; Wulder, M.A. Quantifying the Contribution of Spectral Metrics Derived from Digital Aerial Photogrammetry to Area-Based Models of Forest Inventory Attributes. Remote Sens. Environ. 2019, 234, 111434. [Google Scholar] [CrossRef]
- Gyawali, A.; Aalto, M.; Peuhkurinen, J.; Villikka, M.; Ranta, T. Comparison of Individual Tree Height Estimated from LiDAR and Digital Aerial Photogrammetry in Young Forests. Sustainability 2022, 14, 3720. [Google Scholar] [CrossRef]
- Goodbody, T.R.H.; Coops, N.C.; White, J.C. Digital Aerial Photogrammetry for Updating Area-Based Forest Inventories: A Review of Opportunities, Challenges, and Future Directions. Current Forestry Reports. 2019, 5, 55–75. [Google Scholar] [CrossRef] [Green Version]
- Shimizu, K.; Nishizono, T.; Kitahara, F.; Fukumoto, K.; Saito, H. Integrating Terrestrial Laser Scanning and Unmanned Aerial Vehicle Photogrammetry to Estimate Individual Tree Attributes in Managed Coniferous Forests in Japan. Int. J. Appl. Earth Obs. Geoinf. 2022, 106, 102658. [Google Scholar] [CrossRef]
- Moe, K.T.; Owari, T.; Furuya, N.; Hiroshima, T.; Morimoto, J. Application of UAV Photogrammetry with LiDAR Data to Facilitate the Estimation of Tree Locations and DBH Values for High-Value Timber Species in Northern Japanese Mixed-Wood Forests. Remote Sens. 2020, 12, 2865. [Google Scholar] [CrossRef]
- Kukkonen, M.; Maltamo, M.; Packalen, P. Image Matching as a Data Source for Forest Inventory–Comparison of Semi-Global Matching and Next-Generation Automatic Terrain Extraction Algorithms in a Typical Managed Boreal Forest Environment. Int. J. Appl. Earth Obs. Geoinf. 2017, 60, 11–21. [Google Scholar] [CrossRef]
- Iqbal, I.A.; Musk, R.A.; Osborn, J.; Stone, C.; Lucieer, A. A Comparison of Area-Based Forest Attributes Derived from Airborne Laser Scanner, Small-Format and Medium-Format Digital Aerial Photography. Int. J. Appl. Earth Obs. Geoinf. 2019, 76, 231–241. [Google Scholar] [CrossRef]
- Ullah, S.; Dees, M.; Datta, P.; Adler, P.; Schardt, M.; Koch, B. Potential of Modern Photogrammetry Versus Airborne Laser Scanning for Estimating Forest Variables in a Mountain Environment. Remote Sens. 2019, 11, 661. [Google Scholar] [CrossRef] [Green Version]
- Gobakken, T.; Bollandsås, O.M.; Næsset, E. Comparing Biophysical Forest Characteristics Estimated from Photogrammetric Matching of Aerial Images and Airborne Laser Scanning Data. Scand. J. For. Res. 2015, 30, 73–86. [Google Scholar] [CrossRef]
- Navarro, A.; Young, M.; Allan, B.; Carnell, P.; Macreadie, P.; Ierodiaconou, D. The Application of Unmanned Aerial Vehicles (UAVs) to Estimate above-Ground Biomass of Mangrove Ecosystems. Remote Sens. Environ. 2020, 242, 111747. [Google Scholar] [CrossRef]
- Pereira, I.S. Desempenho de Dispositivos Eletrônicos para Análise Estrutural da floresta de terra firme na Amazônia Central; Instituto nacional de pesquisas da Amazônia–INPA: Manaus, Brazil, 2018. [Google Scholar]
- Berbert, M.L.D.G. Potencial do LiDAR Terrestre Como Ferramenta para o Manejo de Florestas Naturais; UFRRJ: Seropédica, Brazil, 2016. [Google Scholar]
- Araújo, J.P.d.C.; Niemann, R.S.; Dourado, F.; Fernandes, M.C.; Fernandes, N.F. Revisões de Literatura de Geomorfologia Brasileira; UnB: Brasília, Brasil, 2022. [Google Scholar]
- Pires, P.F. Geociências, Sociedade e Sustentabilidade, 1st ed.; Conhecimento Livre: Piracanjuba, Brasil, 2020. [Google Scholar]
- Tang, L.; Shao, G. Drone Remote Sensing for Forestry Research and Practices. J. For. Res. 2015, 26, 791–797. [Google Scholar] [CrossRef]
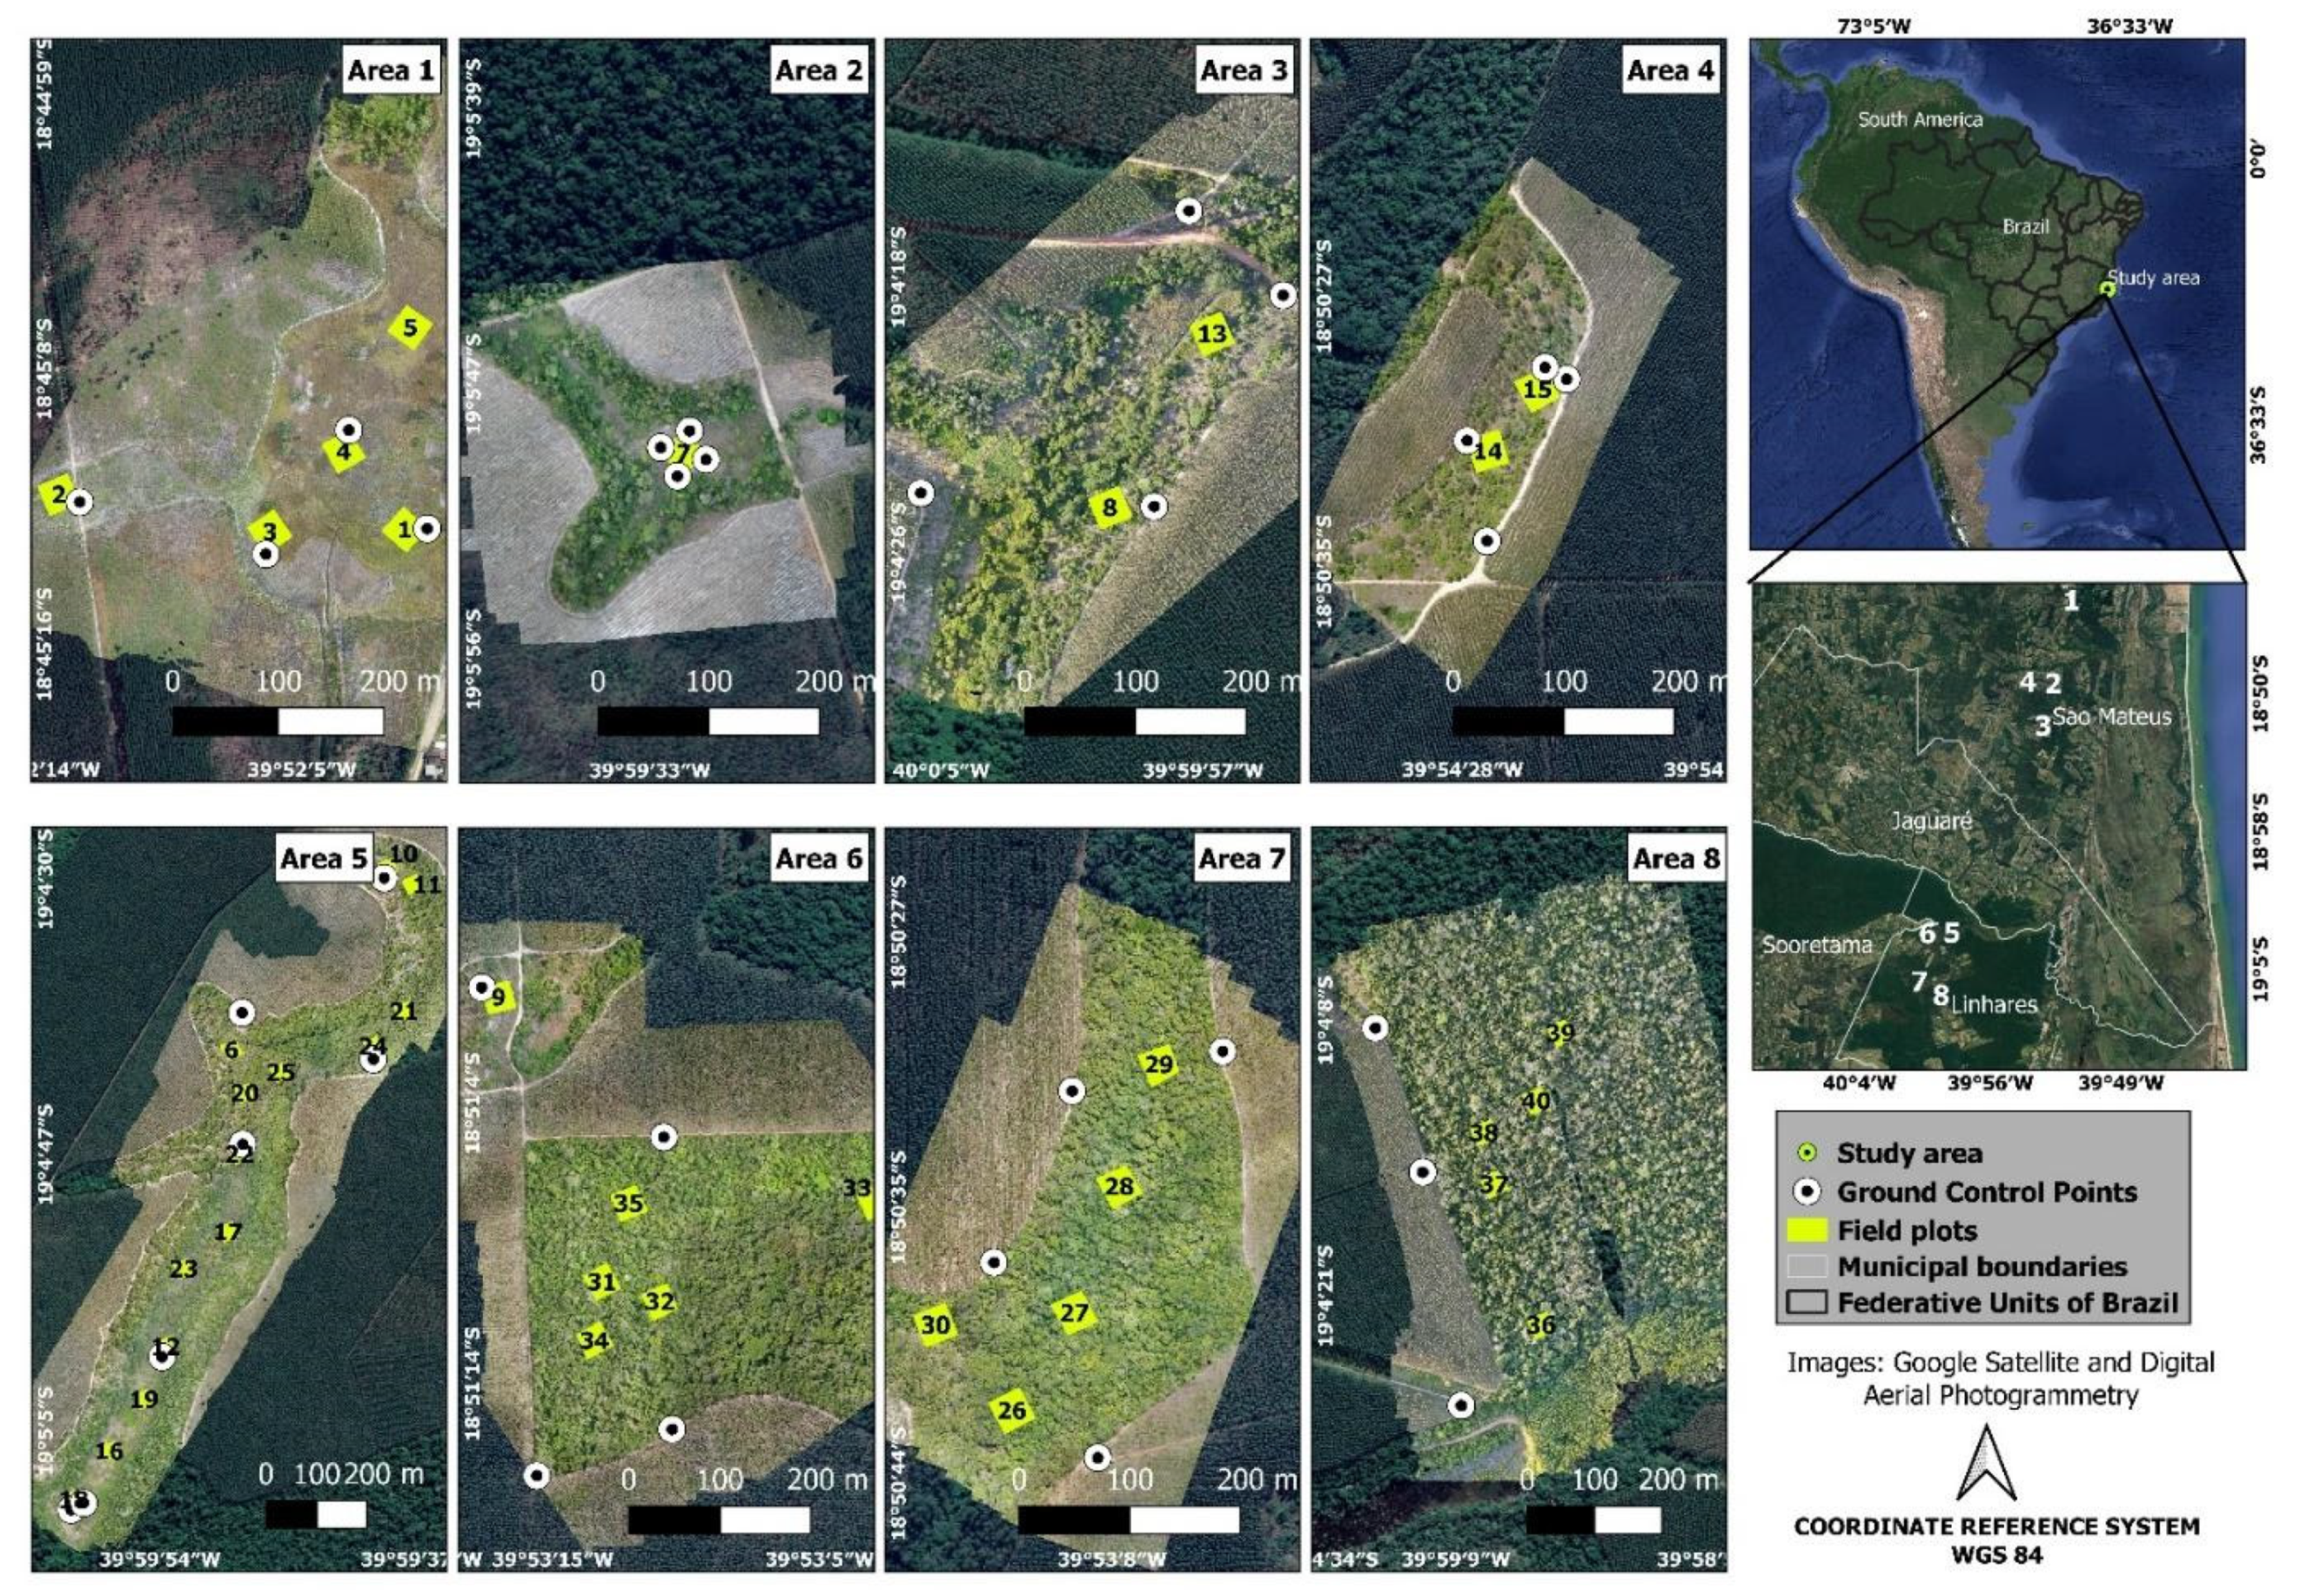
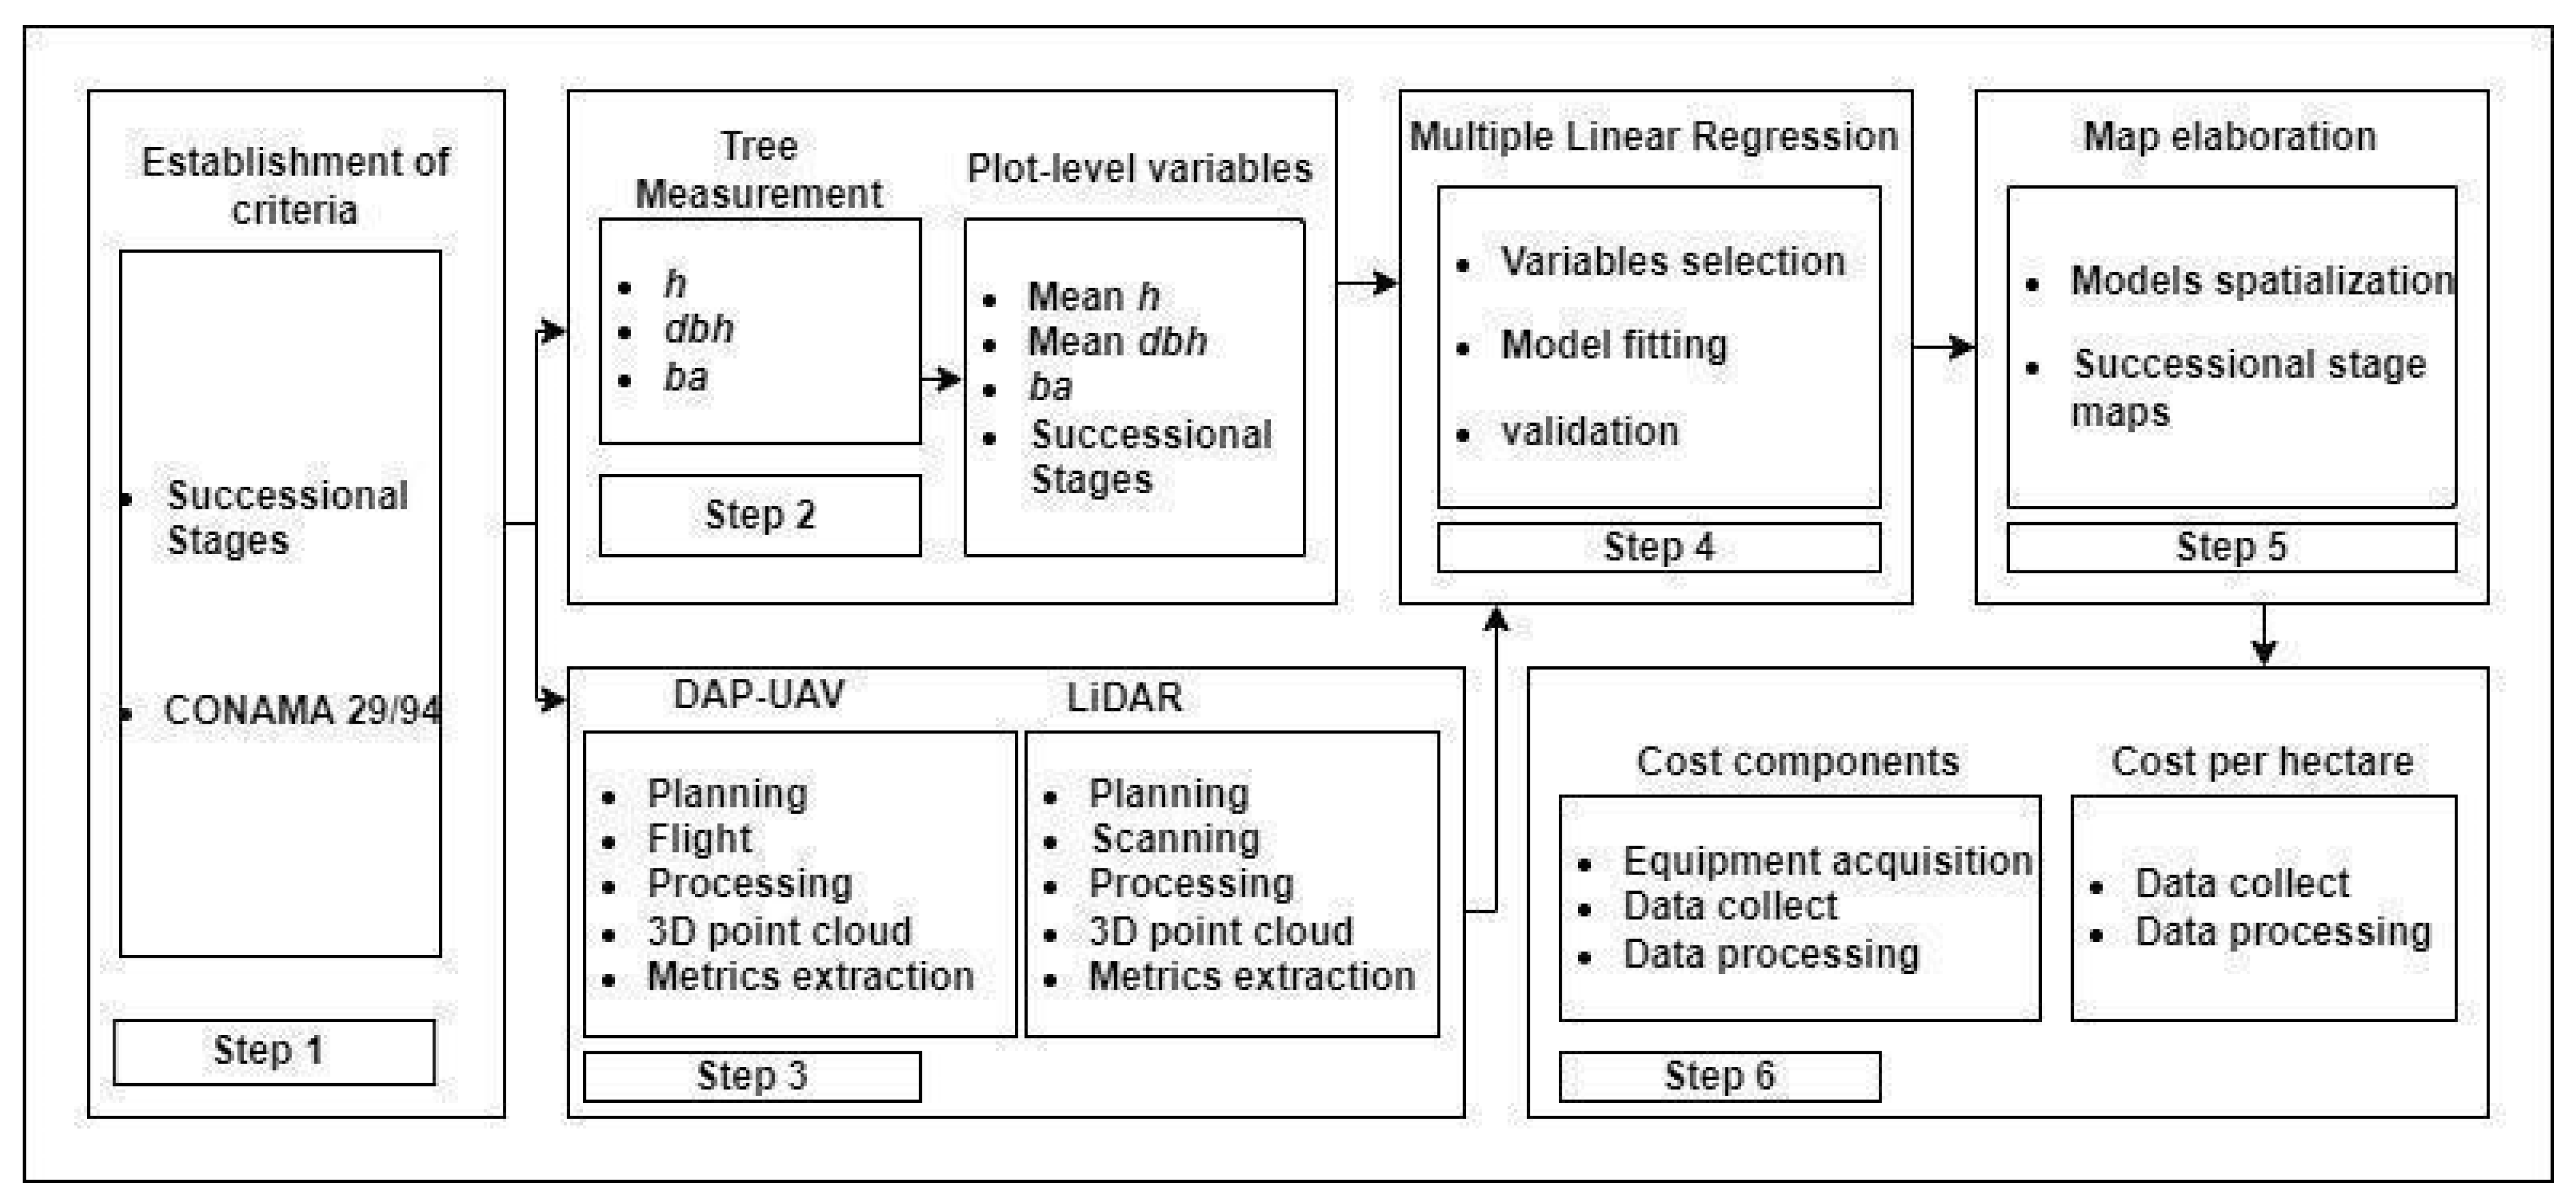

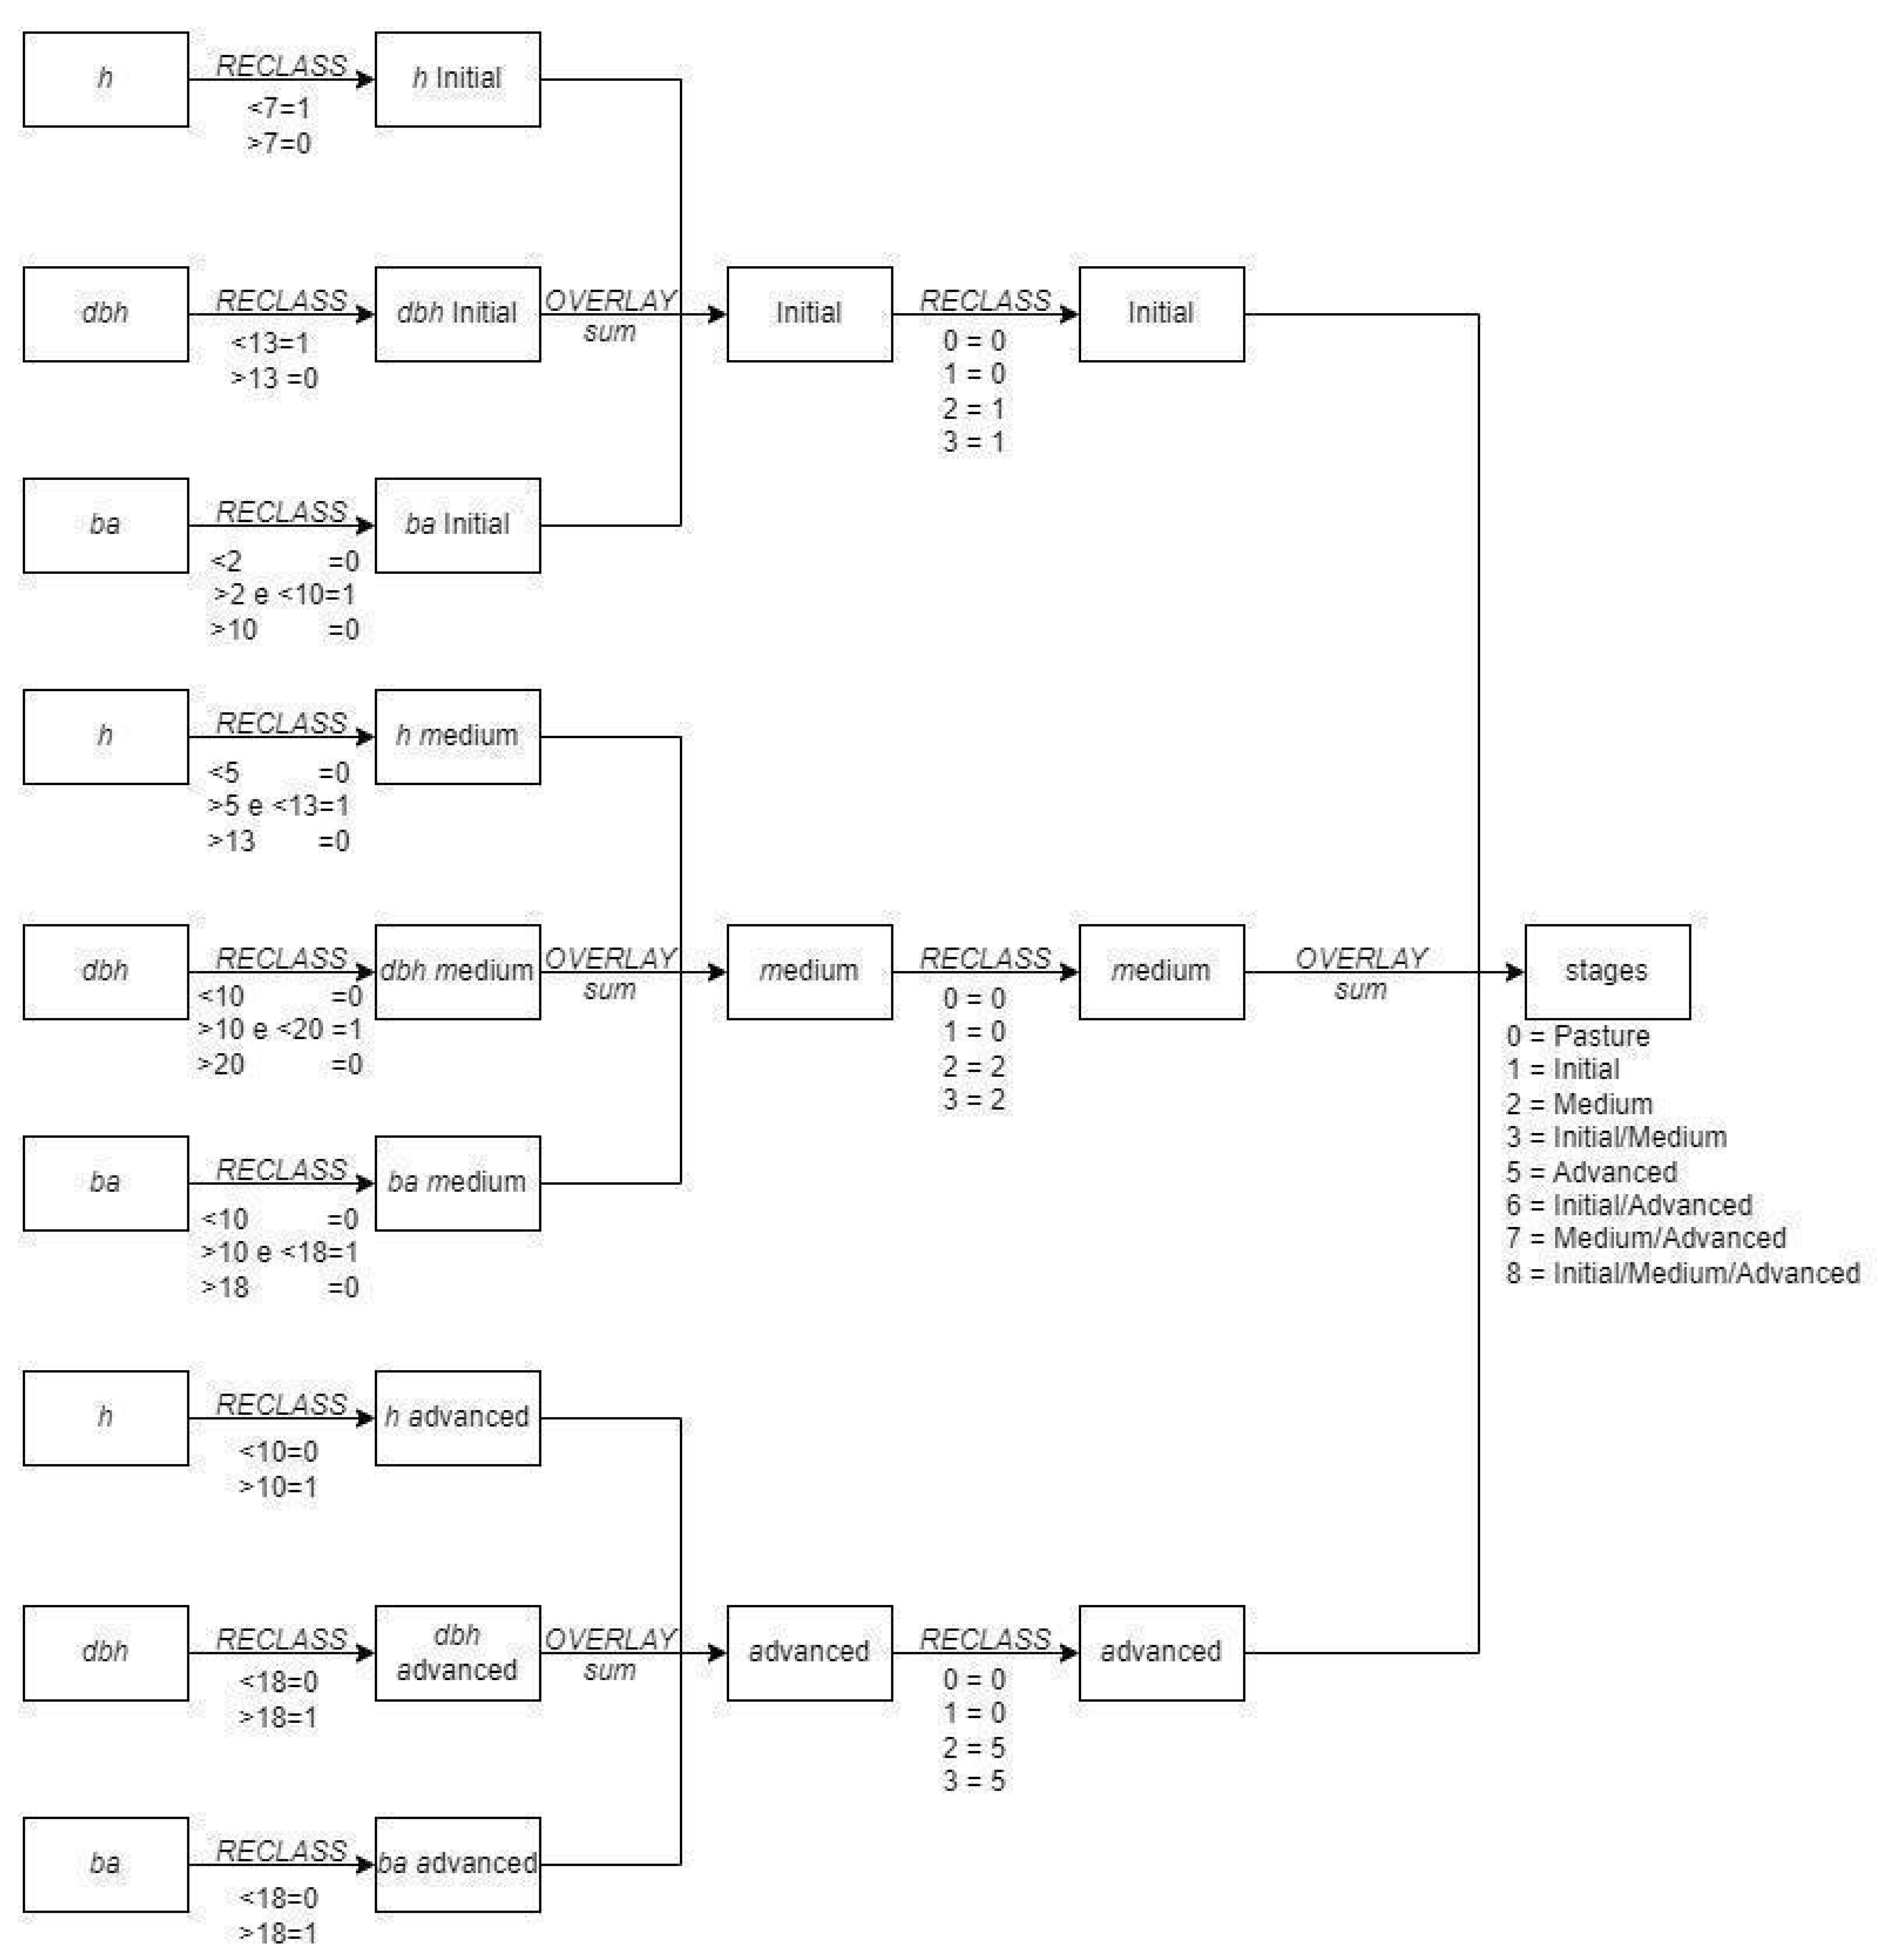
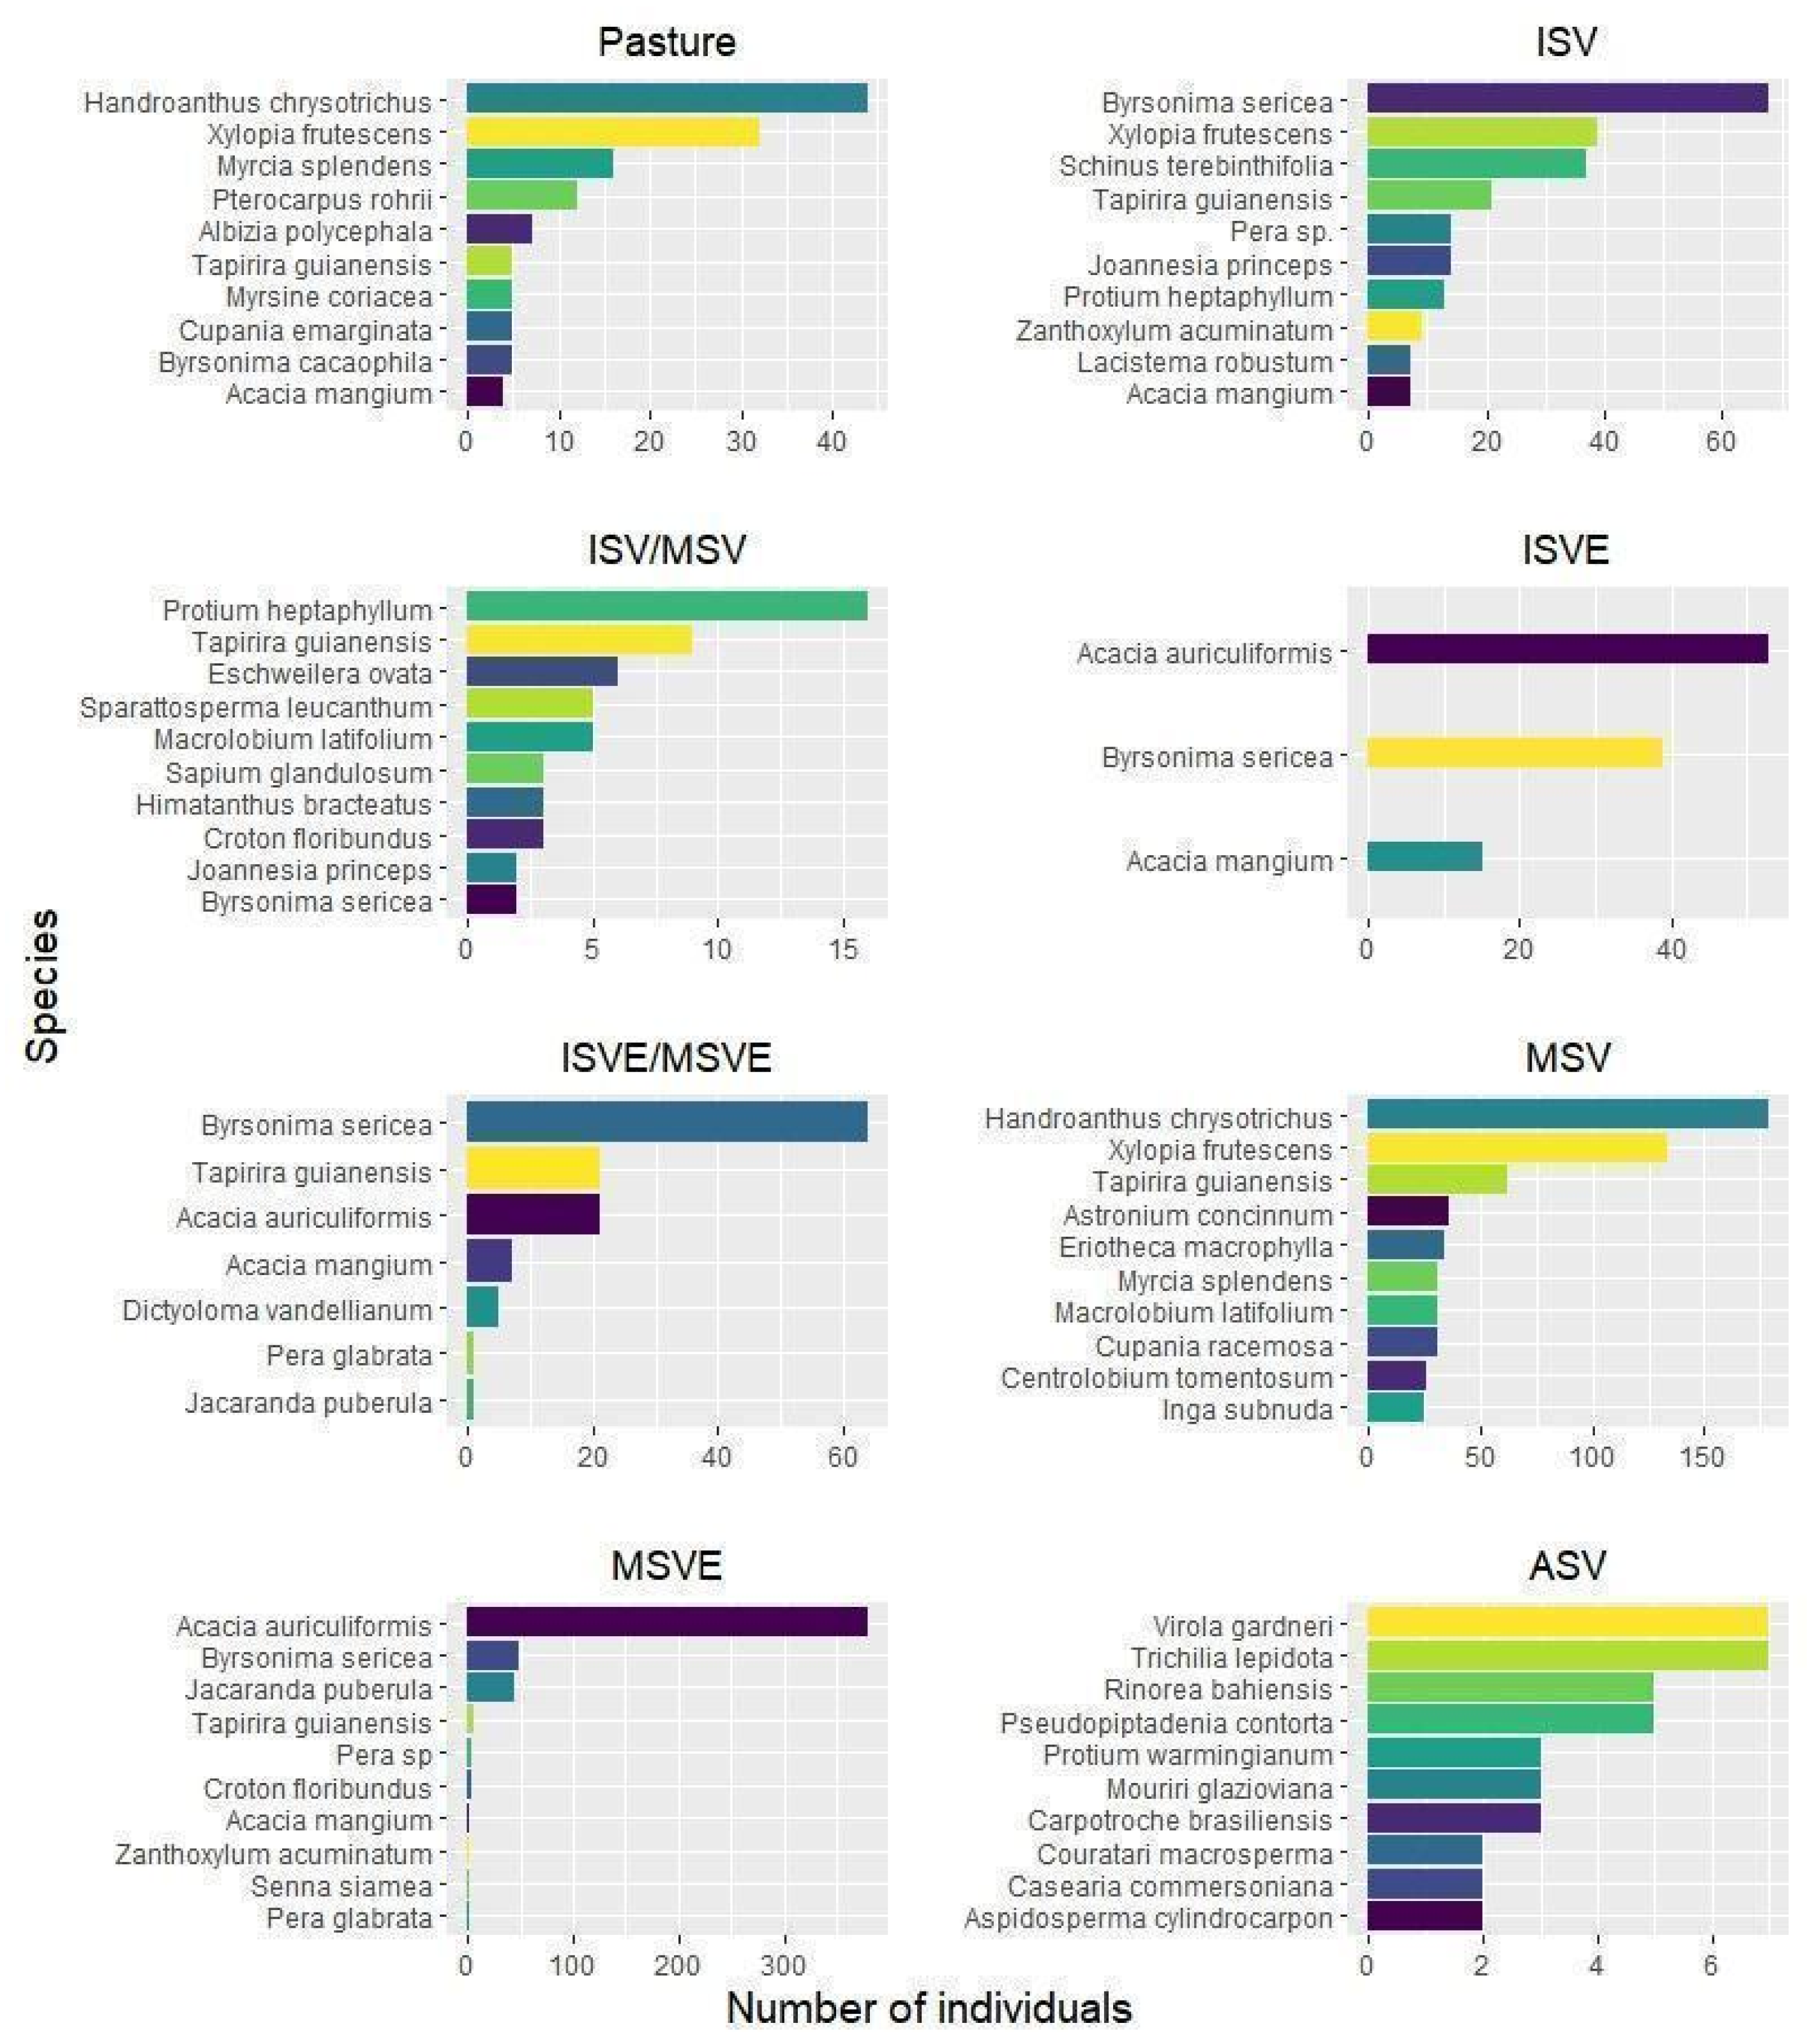
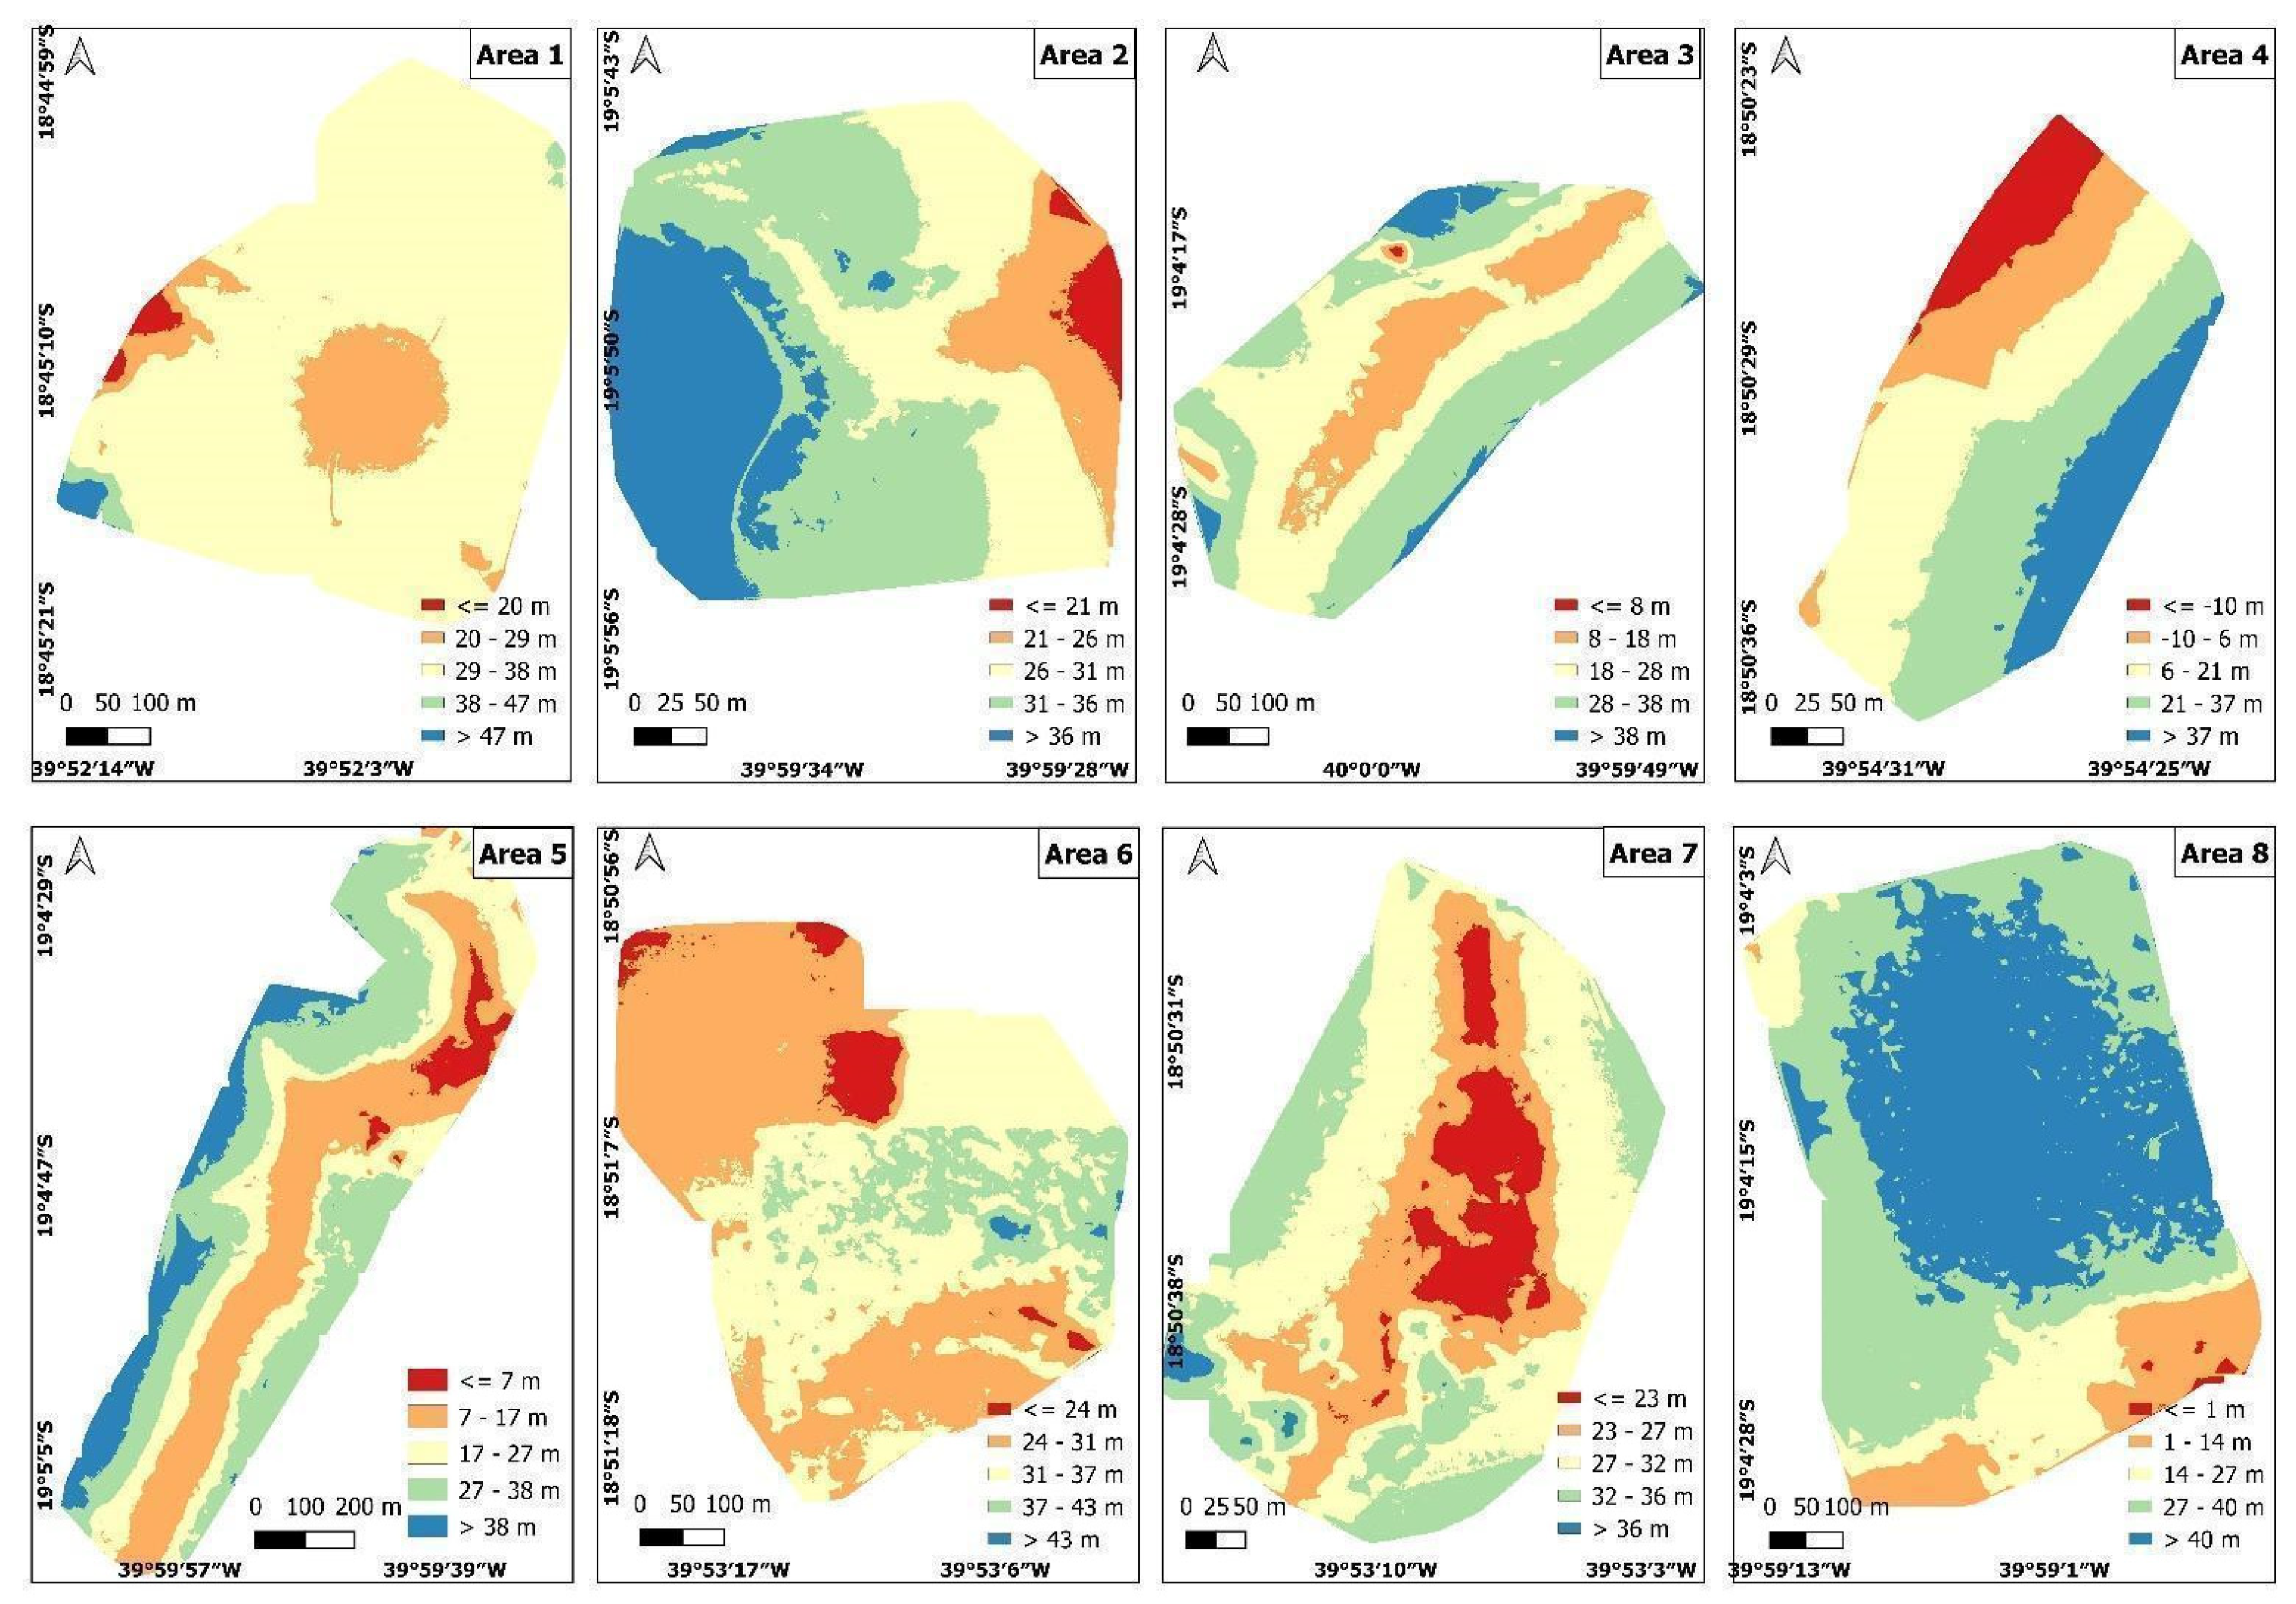
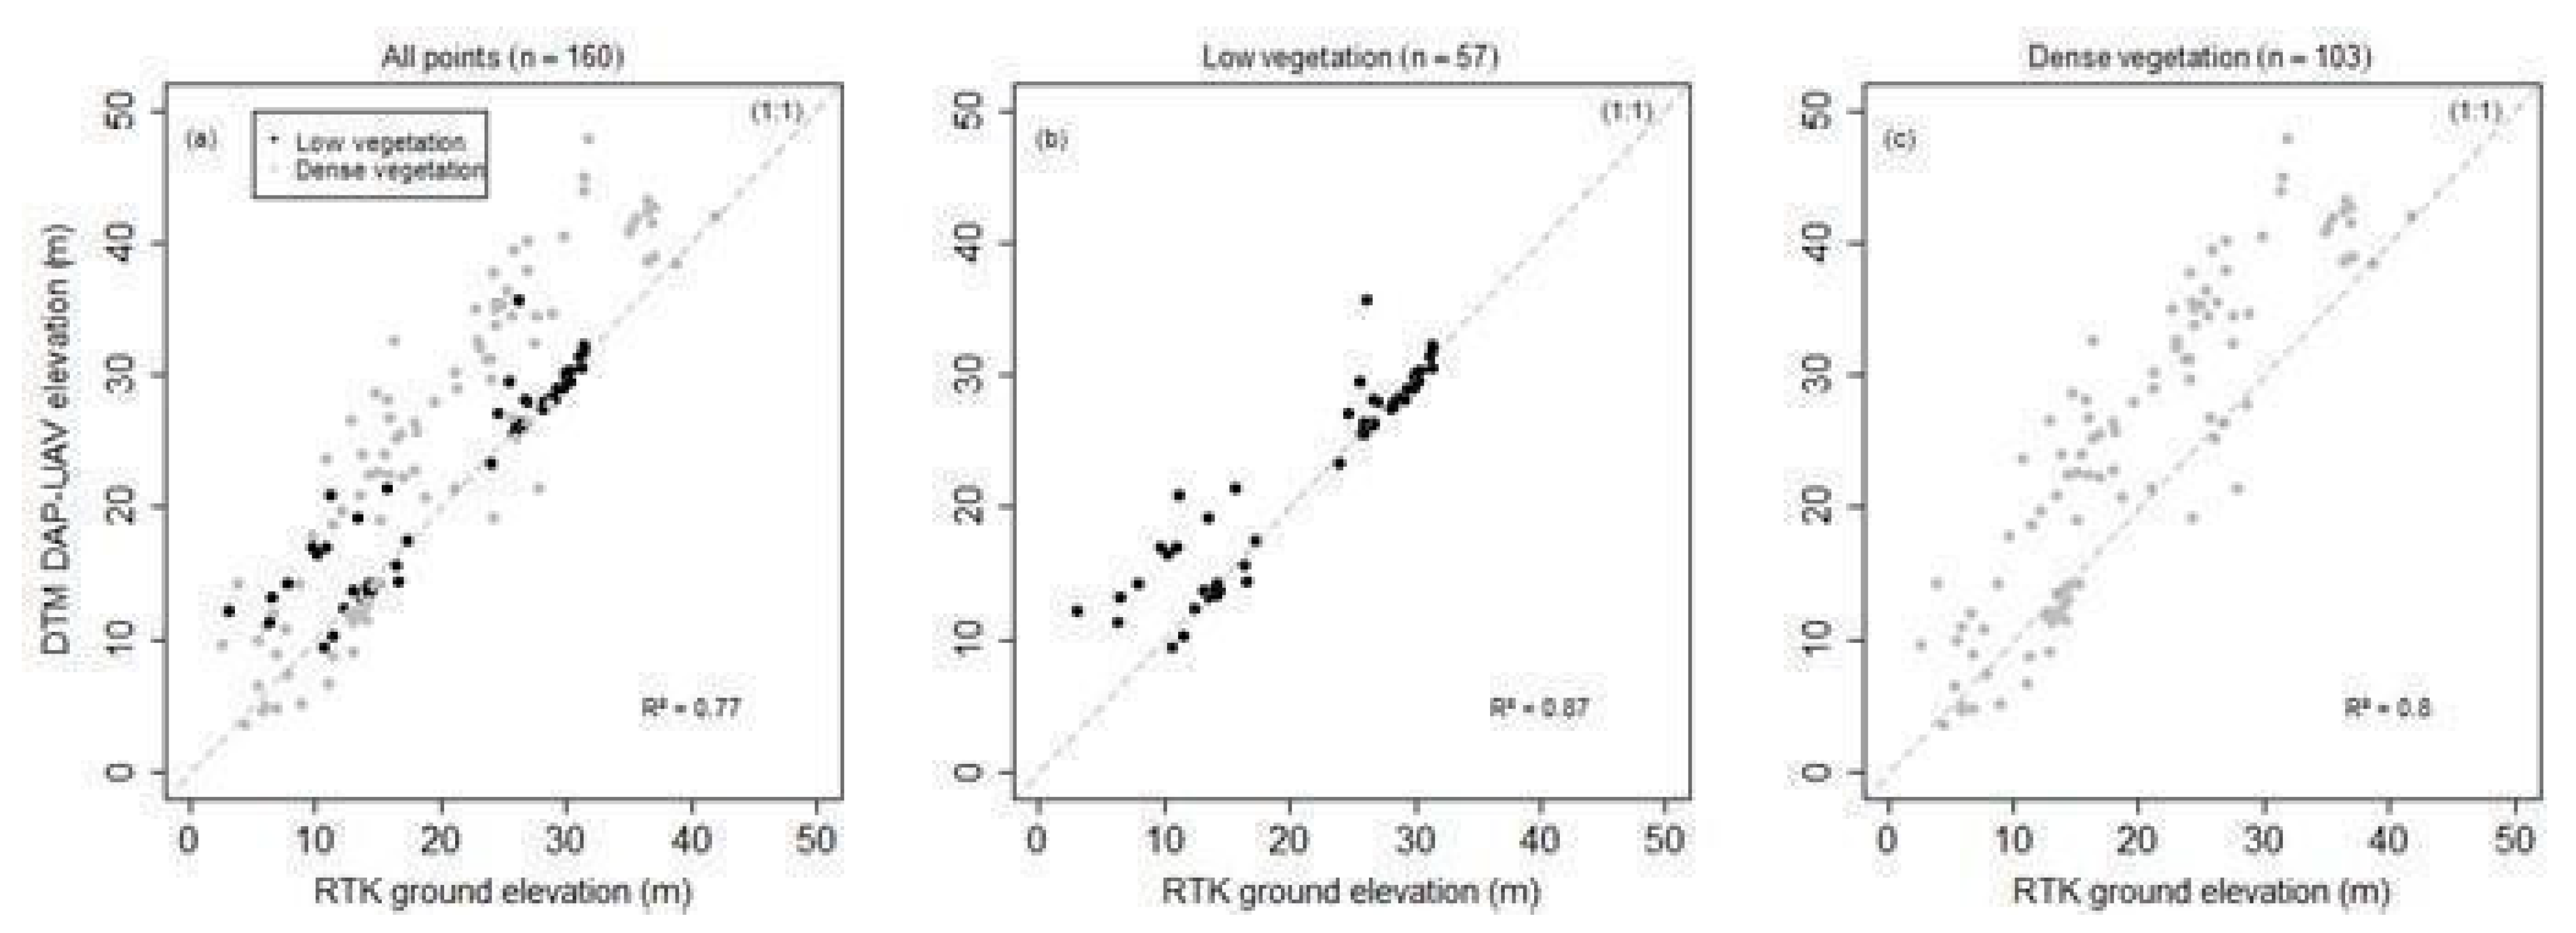
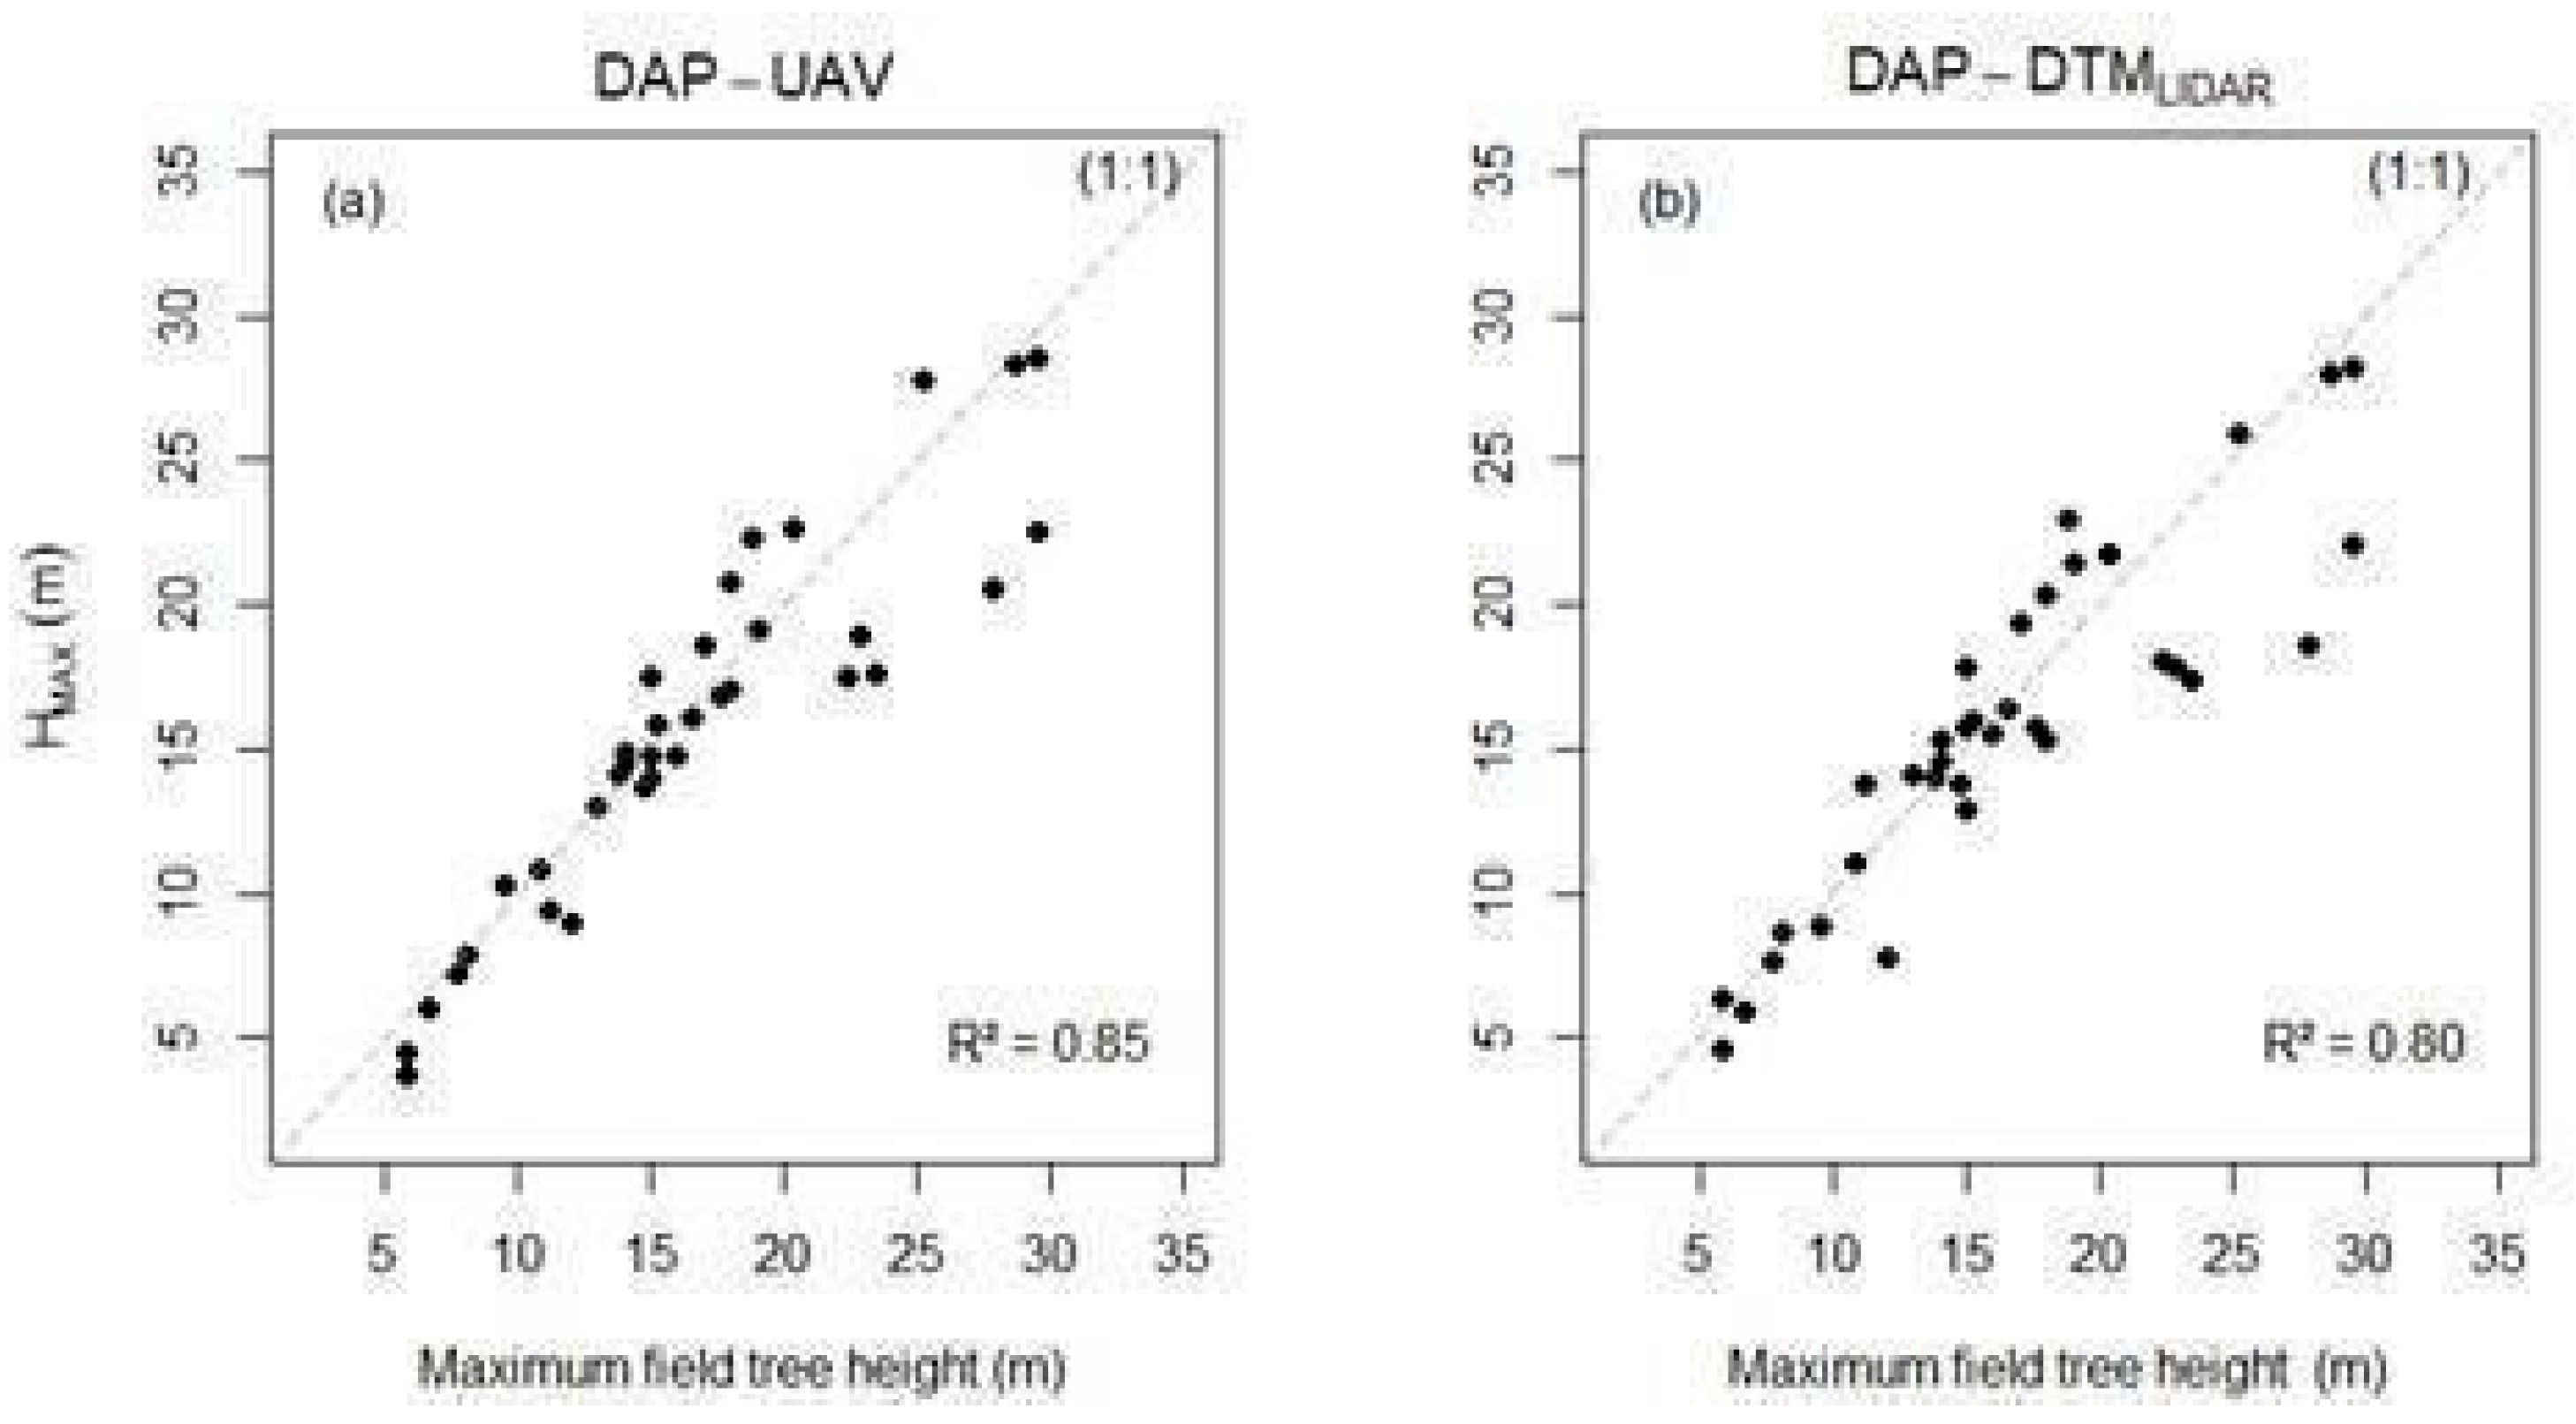
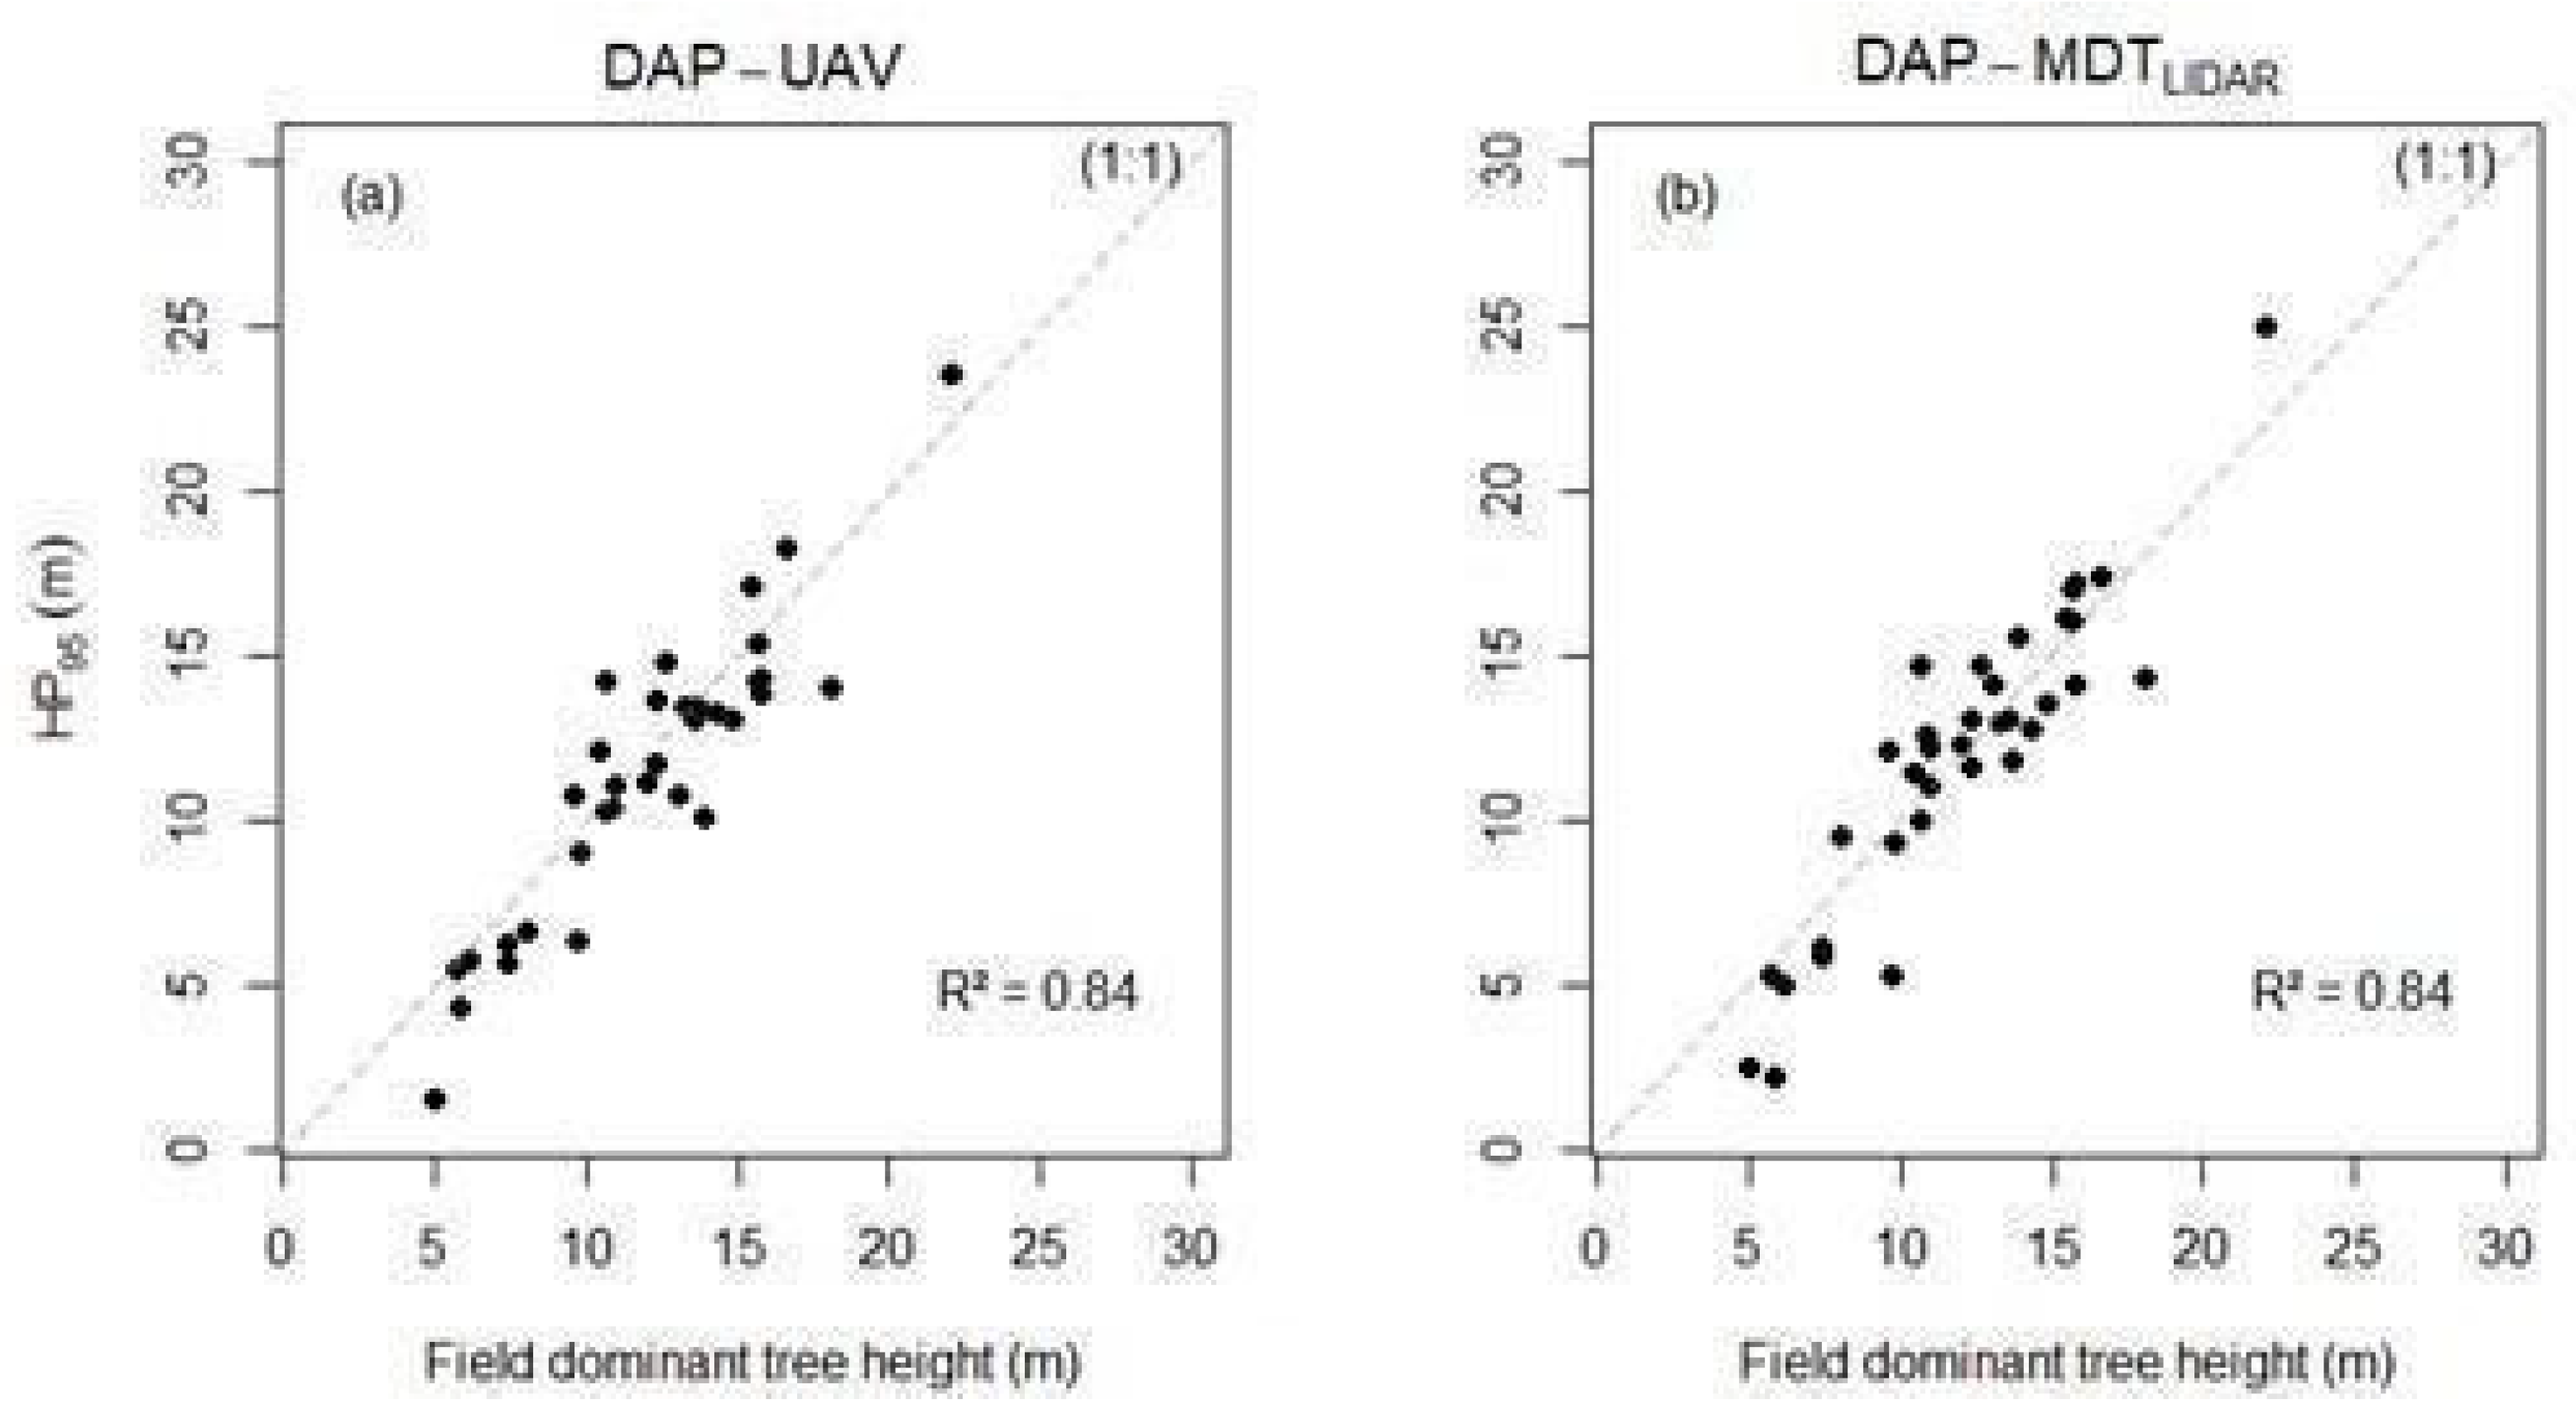

| Vegetation Class | Number of Plots |
|---|---|
| Clean Pasture (CP) | 5 |
| Sparse Dirty Pasture (SDP) | 5 |
| Dense Dirty Pasture (DDP) | 5 |
| Dense Dirty Pasture Infested with Exotics (DDPE) | 5 |
| Initial Stage Secondary Vegetation Infested with Exotics (ISVE) | 5 |
| Initial Stage Secondary Vegetation (ISV) | 5 |
| Medium-Stage Secondary Vegetation (MSV) | 5 |
| Advanced Stage Secondary Vegetation (ASV) | 5 |
| TOTAL | 40 |
| Class | Physiognomy | Average Height (m) | Mean dbh (cm) | Basal Area (m2/ha) |
|---|---|---|---|---|
| Initial stage | Herbaceous/low-sized shrub | 1 to 7 | 1 to 13 | 2.1 to 10 |
| Medium stage | Arboreal and/or shrubby prevailing over herbaceous | 5.1 to 13 | 10 to 20 | 10.1 to 18 |
| Advanced stage | Dominant arboreal over the other ones, forming a relatively uniform closed canopy in size | >10 | >18 | >18 |
| Metric Type | Variable |
|---|---|
| Height | Minimum (Hmin) |
| Max (Hmax) | |
| Mean (Hmean) | |
| Mode (Hmode) | |
| Coefficient of variation (Hcv) | |
| Standard deviation (HSD) | |
| Variance (HV) | |
| Interquartile (HIQ) | |
| Asymmetry (Hskew) | |
| Kurtosis | |
| Percentiles (HP01, HP05, HP10, HP20, HP25, HP30, HP40, HP50, HP60, HP70, HP75, HP80, HP90, HP95, HP99) | |
| Generalized square root mean (HSQRTmeanSQ) | |
| Generalized cubic root mean (HCURTmeanCUBE) | |
| Mean absolute deviation (HAAD) | |
| Median absolute deviation from median height (HMADMedian) | |
| Median Absolute Height Mode Deviation (HMADMode) | |
| Linear moments (HL1, HL2, HL3, HL4) | |
| Linear moment asymmetry height (HLskew) | |
| Linear moment kurtosis height (HLkurt) | |
| Coefficient of variation of linear moments (HLcv) | |
| Canopy Relief Ratio (HCRR) | |
| Canopy cover | Total all returns (CCH) |
| All returns above mean height (CCHmean) | |
| All returns above height mode value (CCHmode) | |
| Percentage of all returns > average height in relation to the total number of points (CC%Hmean) | |
| Percentage of all returns > mode height relative to total number of points (CC%Hmode)All returns above 1.0 m (CCH1m)Percentage of all returns > 1m height relative to total number of points |
| Plots | dbh | h | ba | ni | CONAMA |
|---|---|---|---|---|---|
| 1 | 0 | 0 | 0 | 0 | Pasture |
| 2 | 0 | 0 | 0 | 0 | Pasture |
| 3 | 0 | 0 | 0 | 0 | Pasture |
| 4 | 0 | 0 | 0 | 0 | Pasture |
| 5 | 0 | 0 | 0 | 0 | Pasture |
| 6 | 5.99 | 4.22 | 0.6057 | 14 | ISV |
| 7 | 8.86 | 5.80 | 0.1393 | 1 | ISV |
| 8 | 8.89 | 5.80 | 5.0260 | 44 | ISV |
| 9 | 6.72 | 4.98 | 0.7516 | 6 | ISV |
| 10 | 6.75 | 4.74 | 0.5210 | 8 | ISV |
| 11 | 12.61 | 8.17 | 3.6055 | 13 | ISV/MSV |
| 12 | 9.64 | 7.74 | 2.8332 | 22 | ISV |
| 13 | 13.63 | 9.61 | 10.9484 | 32 | MSVE |
| 14 | 7.56 | 5.85 | 2.6988 | 32 | ISV |
| 15 | 9,27 | 7.86 | 1.9157 | 17 | Pasture |
| 16 | 6.97 | 6.57 | 1.6313 | 22 | ISVE |
| 17 | 11.82 | 7.73 | 5.5644 | 31 | ISVE/MSVE |
| 18 | 9.87 | 8.03 | 0.5608 | 5 | Pasture |
| 19 | 10.86 | 7.12 | 3.6803 | 16 | ISVE/MSVE |
| 20 | 8.04 | 7.91 | 4.9073 | 61 | ISVE |
| 21 | 11.35 | 8.95 | 14.6125 | 84 | MSVE |
| 22 | 9.67 | 7.37 | 11.4459 | 81 | MSVE |
| 23 | 10.22 | 7.17 | 6.1436 | 44 | ISVE/MSVE |
| 24 | 11.14 | 9.76 | 14.9510 | 69 | MSVE |
| 25 | 10.35 | 11.66 | 14.8890 | 116 | MSVE |
| 26 | 12.32 | 11.14 | 9.4958 | 55 | ISV/MSV |
| 27 | 11.35 | 9.37 | 18.0306 | 106 | MSV |
| 28 | 11.45 | 9.83 | 16.6769 | 101 | MSV |
| 29 | 11.65 | 9.58 | 16.9390 | 96 | MSV |
| 30 | 8.29 | 8.63 | 7.8337 | 95 | ISV |
| 31 | 9.12 | 9.71 | 13.4685 | 154 | MSV |
| 32 | 9.91 | 9.01 | 18.0307 | 131 | Pasture |
| 33 | 9.19 | 8.00 | 13.8694 | 125 | MSV |
| 34 | 9.81 | 9.75 | 13.4069 | 120 | MSV |
| 35 | 9.45 | 8.19 | 13.0573 | 109 | MSV |
| 36 | 14.24 | 13.22 | 22.7074 | 86 | ASV |
| 37 | 11.80 | 9.93 | 19.9209 | 102 | MSV |
| 38 | 9.71 | 9.54 | 13.4571 | 120 | MSV |
| 39 | 11.51 | 9.77 | 17.9446 | 108 | MSV |
| 40 | 10.18 | 9.35 | 15.6695 | 124 | MSV |
| Vegetation | RMSE | RMSE (%) | Bias | Bias (%) | R² |
|---|---|---|---|---|---|
| No Vegetation (n = 57) | 3.30 | 15.62 | −1.28 | −6.07 | 0.87 |
| Under Vegetation (n = 103) | 7.40 | 38.13 | −5.07 | −26.16 | 0.80 |
| General (n = 160) | 6.25 | 31.23 | −3.72 | −18.60 | 0.77 |
| Method | RMSE | RMSE (%) | Bias | Vies (%) | R² |
|---|---|---|---|---|---|
| DAP-UAV | 2.63 | 15.92 | 0.77 | 4.71 | 0.85 |
| LiDAR DAP-DTM | 3.00 | 18.21 | 0.71 | 4.31 | 0.80 |
| Method | RMSE | RMSE (%) | Bias | Bias (%) | R² |
|---|---|---|---|---|---|
| DAP | 1.80 | 15.04 | 0.58 | 4.84 | 0.84 |
| DAP PLS | 1.87 | 15.63 | 0.05 | 0.44 | 0.84 |
| Source | Templates |
|---|---|
| DAP-UAV | Hcv + HMADmedian + HP30 + CC%1m |
| DAP-DTMLiDAR | Hmin + HLcv + Hlkurt + HP75 |
| LiDAR | Hiq + HLcv + HSQRTmeanSQ + CC%1m |
| Source | BIC | Fitting | Validation | ||||
|---|---|---|---|---|---|---|---|
| RMSE | RMSE% | R² | RMSE | RMSE% | R² | ||
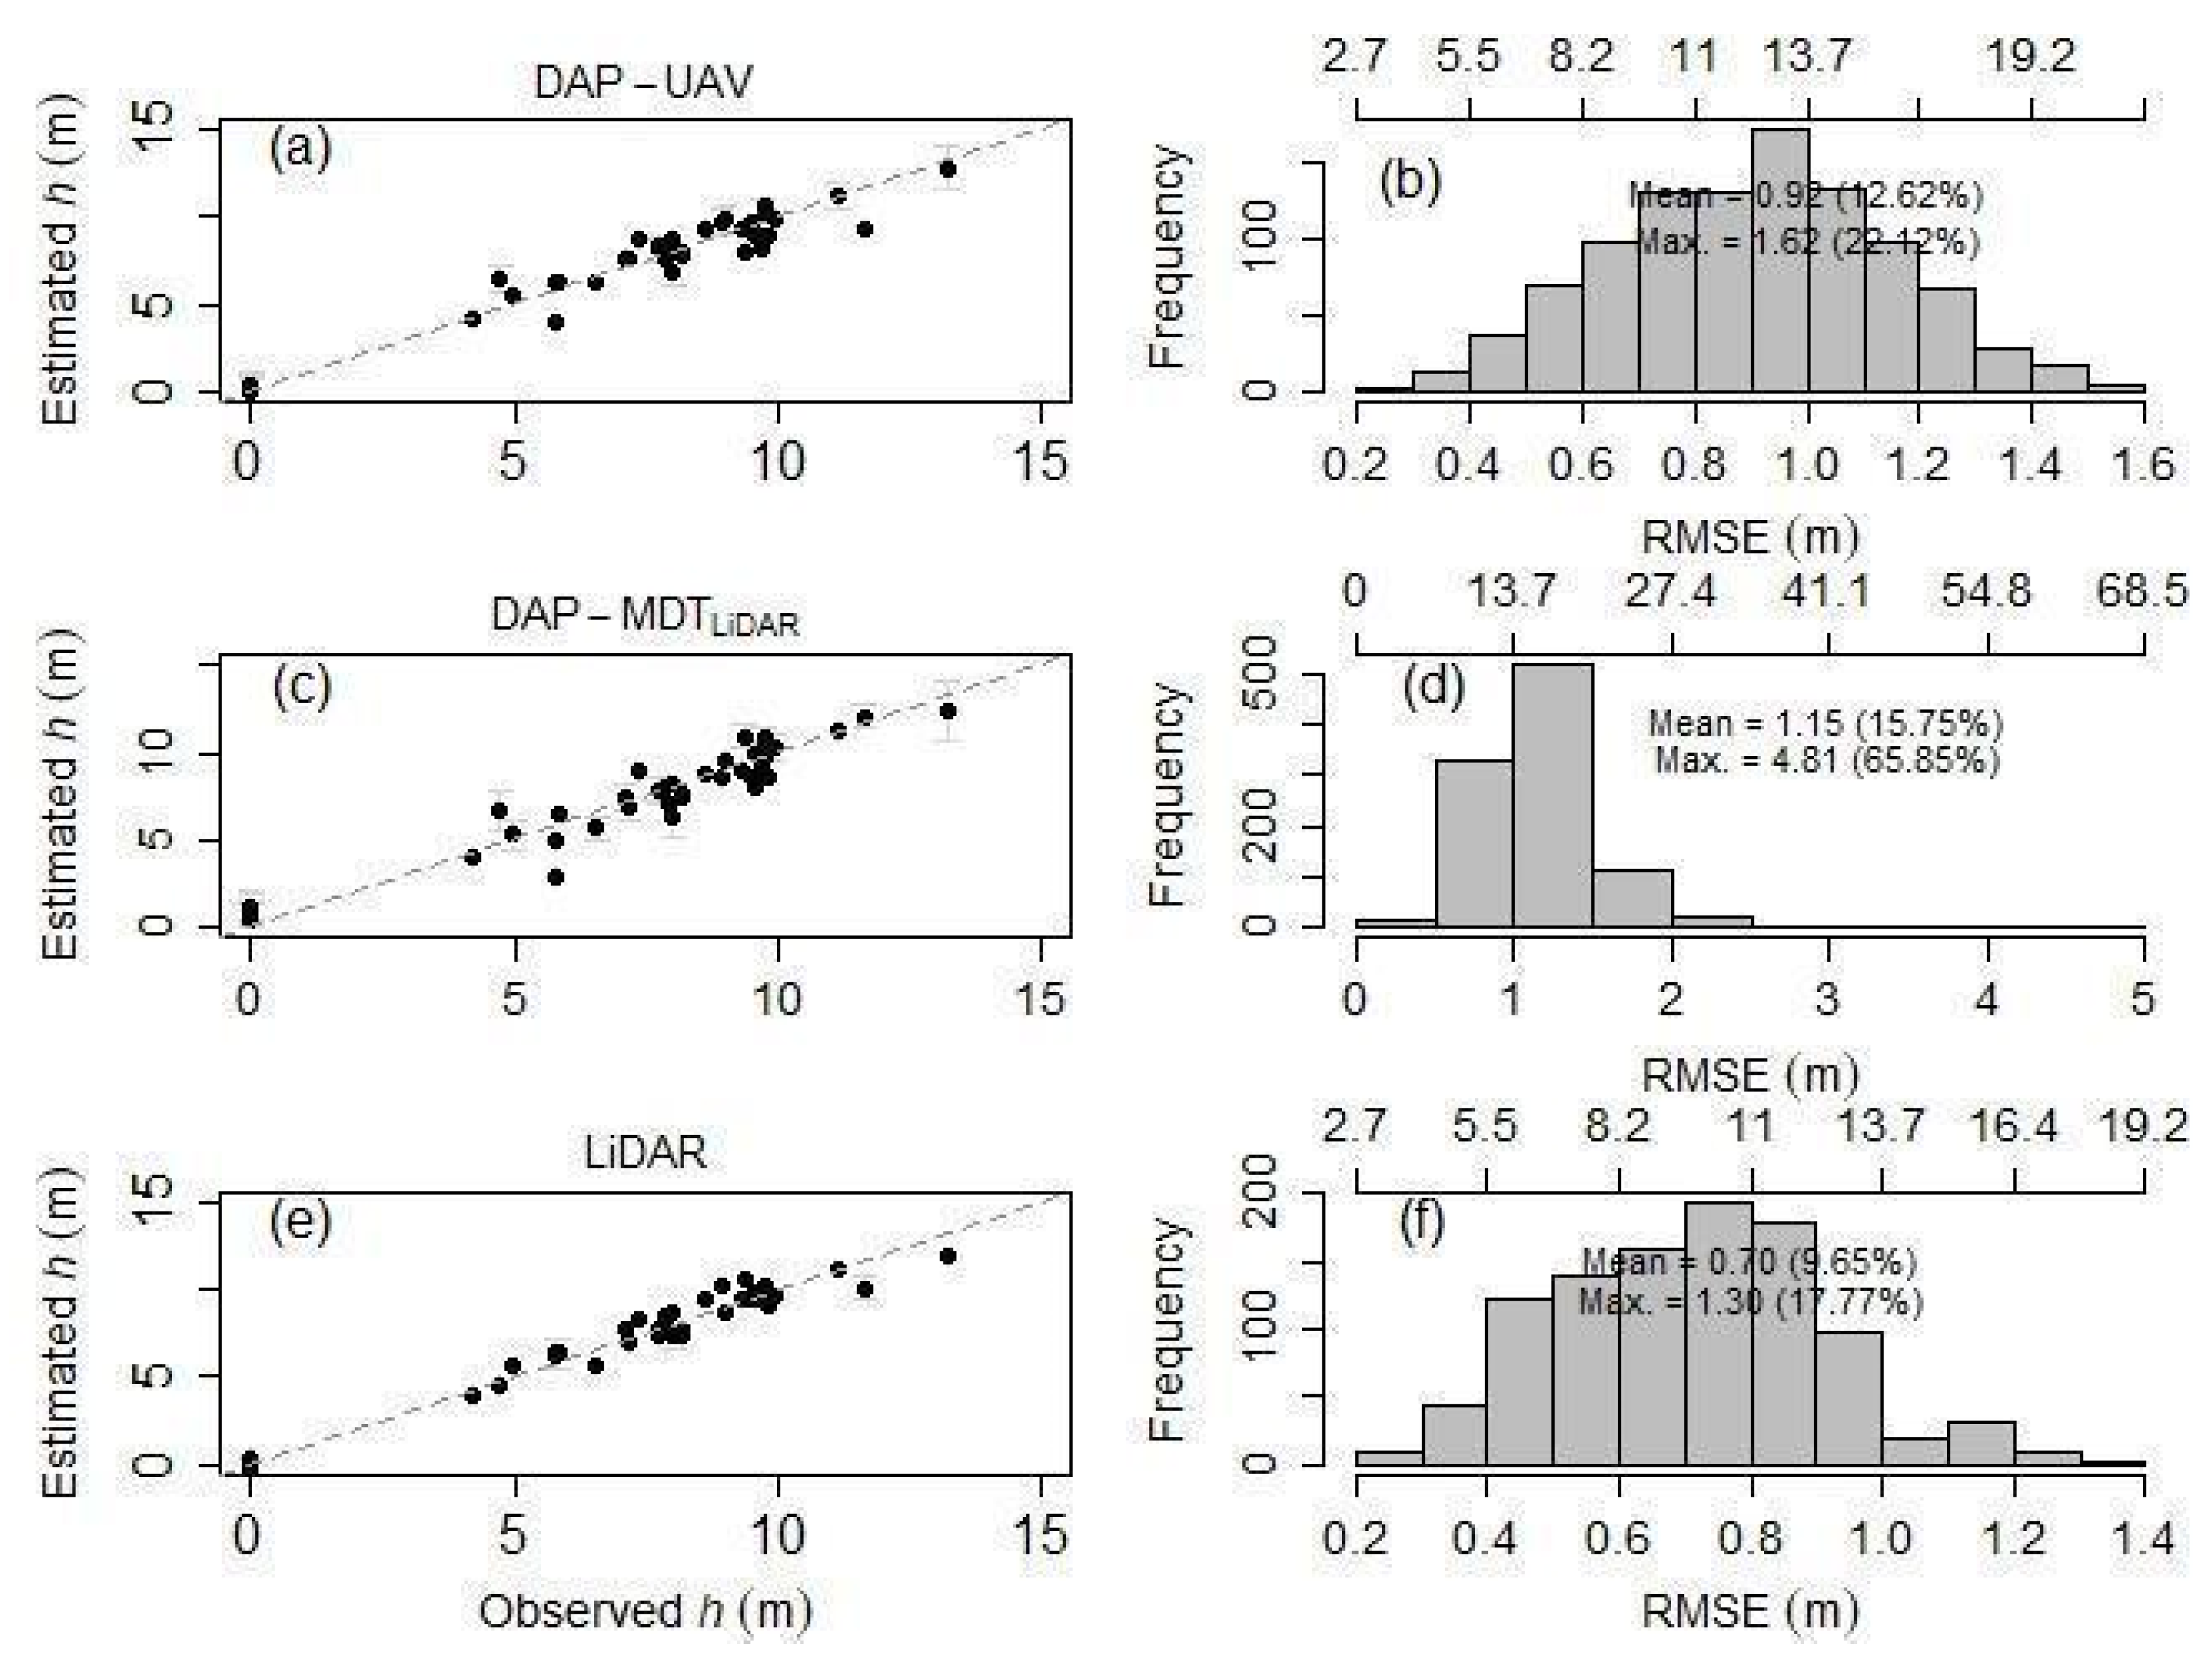
| DAP-UAV | 118.92 | 0.81 | 11.11 | 94.0% | 0.92 | 12.62 | 88.20% |
| DAP-MDTLidar | 197.82 | 0.95 | 12.97 | 91.8% | 1.15 | 15.75 | 86.58% |
| LiDAR | 98.20 | 0.63 | 8.58 | 96.4% | 0.70 | 9.65 | 93.59% |
| Source | Templates |
|---|---|
| DAP-UAV | Hmode + HLcv + HP40 + CC%1m |
| DAP-DTMLidar | Hmin + HL1 + HLcv + CC%Hmode |
| LiDAR | HLcv + Hlkurt + HP05 + HP40 |
| Source | BIC | Fitting | Validation | ||||
|---|---|---|---|---|---|---|---|
| RMSE | RMSE% | R² | RMSE | RMSE% | R² | ||
| DAP-UAV | 141.14 | 1.07 | 12.23 | 91.89% | 1.17 | 13.38 | 82.90% |
| DAP-DTMLiDAR | 197.82 | 1.59 | 18.14 | 82.16% | 1.87 | 21.31 | 69.94% |
| LiDAR | 135.96 | 1.00 | 11.47 | 92.87% | 1.11 | 12.66 | 83.25% |
| Source | Templates |
|---|---|
| DAP-UAV | Hmode + HP01 + CC%1m |
| DAP-DTMLiDAR | Hmin + Hmean + CCHmode |
| LiDAR | Hmax + Hiq + HL1 |
| Source | BIC | Fitting | Validation | ||||
|---|---|---|---|---|---|---|---|
| RMSE | RMSE% | R² | RMSE | RMSE% | R² | ||
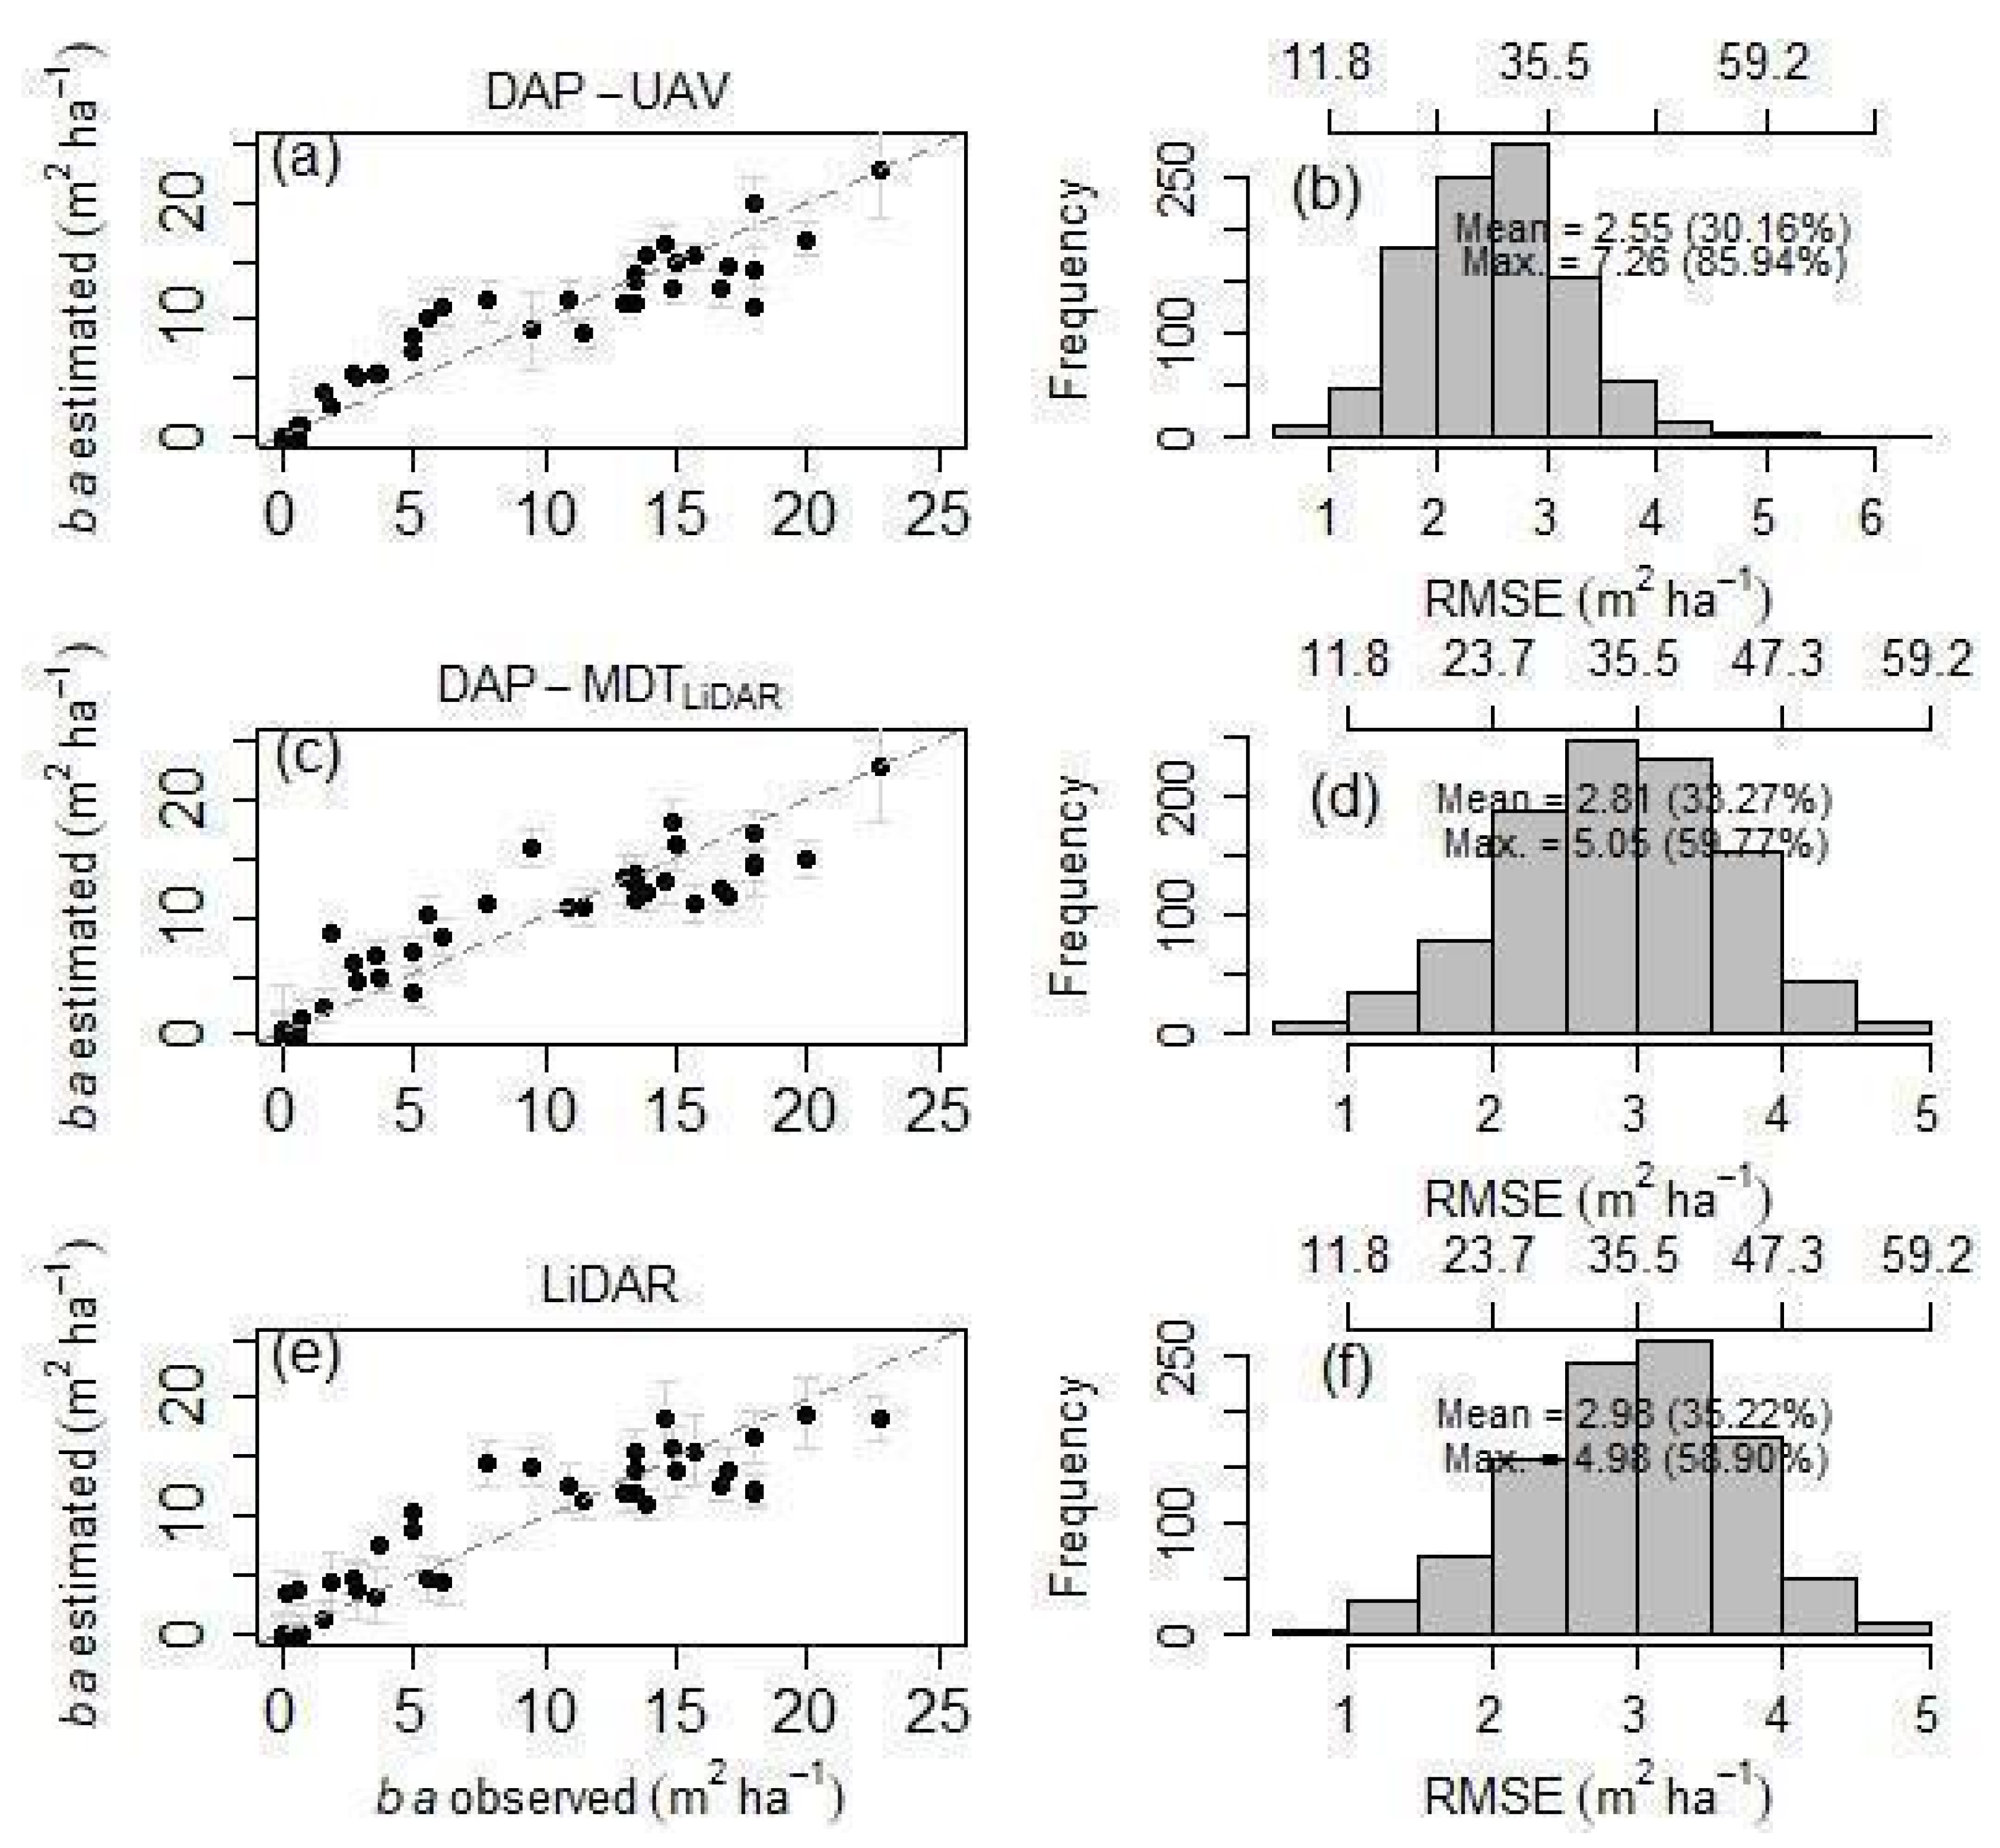
| DAP-UAV | 202.13 | 2.40 | 28.46 | 88.3% | 2.55 | 30.16 | 87.18% |
| DAP-DTMLiDAR | 213.04 | 2.75 | 32.61 | 84.6% | 2.81 | 33.27 | 84.56% |
| LiDAR | 215.51 | 2.85 | 33.63 | 83.6% | 2.98 | 35.22 | 83.41% |
| DAP-UAV | LiDAR PLS | IFT | |
|---|---|---|---|
| Component | Value | Value | Value |
| Equipment | R$ 86,895.23 | R$ 407,092.15 | R$ 41,443.94 |
| Data acquisition | R$ 12,912.13 | R$ 56,724.60 | R$ 92,118.00 |
| Data processing and analysis | R$ 3852.06 | R$ 2492.37 | R$ 2448.00 |
| Total | R$ 103,659.42 | R$ 466,309.12 | R$ 136,009.94 |
| Item | DAP-UAV | LiDAR PLS | TFI |
|---|---|---|---|
| Sample area (hectares) | 201.0 | 3.6 | 3.6 |
| Equipment cost | R$ 86,895.23 | R$ 407,092.15 | R$ 41,443.94 |
| Cost of data acquisition and processing per hectare | R$ 83.40 | R$ 16,449.16 | R$ 26,268.33 |
Disclaimer/Publisher’s Note: The statements, opinions and data contained in all publications are solely those of the individual author(s) and contributor(s) and not of MDPI and/or the editor(s). MDPI and/or the editor(s) disclaim responsibility for any injury to people or property resulting from any ideas, methods, instructions or products referred to in the content. |
© 2023 by the authors. Licensee MDPI, Basel, Switzerland. This article is an open access article distributed under the terms and conditions of the Creative Commons Attribution (CC BY) license (https://creativecommons.org/licenses/by/4.0/).
Share and Cite
Cabral, R.P.; da Silva, G.F.; de Almeida, A.Q.; Bonilla-Bedoya, S.; Dias, H.M.; De Mendonça, A.R.; Rodrigues, N.M.M.; Valente, C.C.A.; Oliveira, K.; Gonçalves, F.G.; et al. Mapping of the Successional Stage of a Secondary Forest Using Point Clouds Derived from UAV Photogrammetry. Remote Sens. 2023, 15, 509. https://doi.org/10.3390/rs15020509
Cabral RP, da Silva GF, de Almeida AQ, Bonilla-Bedoya S, Dias HM, De Mendonça AR, Rodrigues NMM, Valente CCA, Oliveira K, Gonçalves FG, et al. Mapping of the Successional Stage of a Secondary Forest Using Point Clouds Derived from UAV Photogrammetry. Remote Sensing. 2023; 15(2):509. https://doi.org/10.3390/rs15020509
Chicago/Turabian StyleCabral, Ricardo Pinheiro, Gilson Fernandes da Silva, André Quintão de Almeida, Santiago Bonilla-Bedoya, Henrique Machado Dias, Adriano Ribeiro De Mendonça, Nívea Maria Mafra Rodrigues, Carem Cristina Araujo Valente, Klisman Oliveira, Fábio Guimarães Gonçalves, and et al. 2023. "Mapping of the Successional Stage of a Secondary Forest Using Point Clouds Derived from UAV Photogrammetry" Remote Sensing 15, no. 2: 509. https://doi.org/10.3390/rs15020509
APA StyleCabral, R. P., da Silva, G. F., de Almeida, A. Q., Bonilla-Bedoya, S., Dias, H. M., De Mendonça, A. R., Rodrigues, N. M. M., Valente, C. C. A., Oliveira, K., Gonçalves, F. G., & Sarcinelli, T. S. (2023). Mapping of the Successional Stage of a Secondary Forest Using Point Clouds Derived from UAV Photogrammetry. Remote Sensing, 15(2), 509. https://doi.org/10.3390/rs15020509


