Article

Optical Properties and Vertical Distribution of Aerosols Using Polarization Lidar and Sun Photometer over Lanzhou Suburb in Northwest China

Key Laboratory for Semi-Arid Climate Change of the Ministry of Education, College of Atmospheric Sciences, Lanzhou University, Lanzhou 730000, China
*
Author to whom correspondence should be addressed.
Remote Sens. 2023, 15(20), 4927; https://doi.org/10.3390/rs15204927
Submission received: 5 September 2023 / Revised: 5 October 2023 / Accepted: 10 October 2023 / Published: 12 October 2023
(This article belongs to the Special Issue Remote Sensing of Aerosol, Cloud and Their Interactions)

Abstract

:
To better understand aerosol vertical distribution and radiation effects, the seasonal variation and vertical distribution characteristics of aerosol optical properties were analyzed based on the aerosol extinction coefficient, depolarization ratio and backscatter Ångström exponent derived from the dual-wavelength polarization lidar at the Semi-Arid Climate and Environment Observatory of Lanzhou University (SACOL) from December 2009 to November 2012. Combining the CE-318 sun photometer, the microphysical, optical and vertical distribution characteristics of aerosol during a dust process were discussed comprehensively. The results revealed that the vertical profiles of the aerosol extinction coefficient and depolarization ratio clearly had seasonal variation characteristics. The aerosol optical depth (AOD) integrating with the aerosol extinction coefficient within 0–2 km in the spring, summer, autumn and winter accounted for 48%, 45%, 56% and 58% of the total AOD, respectively. The non-spherical feature was most distinctive in the spring, followed by the winter, autumn and summer. The particle size of aerosol in the lower layer was larger than that in the upper layer according to the vertical profile of the backscatter Ångström exponent. The cluster analysis of backward trajectory showed SACOL is dominated by dust aerosol in the spring and the mixtures of dust with anthropogenic pollution in the winter. A dust event in April 2010 was selected and the analysis showed that it mainly came from the high-altitude and long-range transportation from the Taklamakan Desert. During this period, the extinction coefficient increased up to 0.9 km−1, the maximum AOD was 2.21 and the SSA ranged from 0.92 to 0.99. The radiation force in the atmosphere reached 126.15 W/m2. It can be found that the influence of aerosol on the atmospheric radiation effect cannot be ignored.

1. Introduction

Aerosols play an important role in many physical and chemical processes in the atmosphere. Aerosol particles can act as cloud condensation nuclei to change the microphysical properties of clouds and then affect their radiative forcing, which is named the indirect aerosol effect; they can also affect the energy balance of the earth–atmosphere system by scattering and absorbing solar radiation, which is called the direct aerosol effect [1,2]. In addition, dust, black carbon and other absorption aerosols lead to the reduction in surface solar radiation and the increase in atmospheric stability, affecting clouds, precipitation and temperature [3,4]. Large amounts of fine particles in the atmosphere can cause severe air pollution such as haze, which not only influences the atmospheric visibility but also endangers human health, causing respiratory diseases, etc. [5,6]. The fifth and sixth IPCC reports pointed out that atmospheric aerosol is an important factor affecting global and regional climate change and that great uncertainties in the estimation of aerosol radiative forcing still exist [7,8].
The vertical distribution of aerosols is one of the main factors causing the uncertainty in the estimation of aerosol radiative forcing [9]. It not only makes adjustments to the thermal structure and atmospheric stability by influencing the turbulence, convection and clouds, but also affects the regional environment and precipitation [10,11]. Therefore, improving the understanding of the physicochemical, geometric and optical properties of aerosols is very essential to the quantitative assessment of the aerosol radiative effect. Atmospheric remote sensing is an effective and useful means to detect the atmospheric structure and its evolution. As an active remote sensing tool, ground-based lidar can continuously observe the vertical distribution of aerosols with high spatial and temporal resolution based on the scattering characteristics of aerosols and clouds, which is extremely important for analyzing the source, distribution, generation and elimination mechanisms of pollutants [12]. Lidar has been widely used to conduct studies. Lv et al. [13] retrieved the vertical profiles of the cloud condensation nuclei number concentration using the backscattering coefficient and extinction coefficient of aerosol from the multi-wavelength lidar observation. Liu et al. [14] analyzed the relationship between the atmospheric boundary layer and temperature inversion using the observation of micro-pulse lidar (MPL) and radiosonde at the atmospheric radiation measurement (ARM) southern great plains (SGP) site. Hayasaka et al. [15] observed the vertical distribution and optical properties of non-spherical (dust) and spherical aerosols in Japan and found that dust aerosols were generally transported at higher altitudes than spherical aerosols.
However, there are significant differences in the vertical distribution of aerosol types in different regions [16,17]. Moreover, due to the heterogeneity of aerosol sources and their dependency on the meteorological conditions, the vertical distribution of aerosols shows great variation in the daily, seasonal and interannual scales. Most of the previous remote sensing studies of aerosol optical properties in Lanzhou, the semi-arid region of Northwest China, focused on the whole atmosphere layer or on short-term time periods [18,19,20,21,22,23]. In general, more long-term continuous observations on the vertical structure and distribution of aerosols are urgently needed to better understand the local aerosol vertical mixing and radiative effect.
The influence of air pollution events on the atmospheric environment, climate and human health has been of worldwide concern. The Lanzhou region is located on the transport path of Asian dust and is vulnerable to dust events. Wang et al. [24] analyzed the influence of three different types of dust events on PM10 concentration in Northern China and found that high PM10 concentration in Lanzhou was usually caused by floating dust. Wu et al. [25] studied the absorption characteristics of aerosols in the rural area of Northwest China and found that dust particles contributed significantly to the aerosol absorption coefficient, which reached 71.6% during a dust storm. Wang et al. [26] showed that dust storms had significant impact on air quality far away from their sources through analyzing the optical and physical properties of dust aerosol and its mixing with anthropogenic pollution in Northwest China. However, studies to synthesize the vertical distribution and microphysical properties of dust aerosol are still limited.
To better understand the aerosol vertical distribution and radiation effects, in this paper, the seasonal variation and vertical structure of the aerosol extinction coefficient, depolarization ratio and backscatter Ångström exponent were investigated using the observation data of dual-wavelength polarization lidar at the Semi-Arid Climate and Environment Observatory of Lanzhou University (SACOL) from December 2009 to November 2012. Combining the retrieval products of sun photometer (CE-318) and the backward trajectory model, the microphysical, optical, vertical distribution and sources of dust aerosol were analyzed.

2. Data and Methods

2.1. Site Description

Lanzhou is a typical valley city with an area of 13,085.6 km2. The Semi-Arid Climate and Environment Observatory of Lanzhou University (SACOL) is located at the top of Tsuiying Mountain (35.95°N, 104.14°E) at an elevation of 1965.8 m, about 48 km from the center of Lanzhou on the southern bank of the Yellow River in Northwest China, and the geographical location of SACOL is shown in Figure 1. The underlying surface belongs to the typical Loess Plateau landform. SACOL and its surrounding areas have a semi-arid climate with an annual mean highest temperature of 13.7 °C in July and a lowest temperature of 0.8 °C in January, and an annual precipitation of 381.8 mm [27].

2.2. Polarization Lidar and Retrieval Method

The study of aerosol vertical distribution characteristics using a dual-wavelength polarization lidar (L2S-SM II, NIES, National Institute for Environmental Studies, Tsukuba, Japan) was conducted at SACOL from 1 December 2009 to 30 November 2012. The NIES lidar uses an Nd: YAG laser as the transmitter with emission wavelengths of 1064 nm and 532 nm, and the receiver is a 20 cm diameter Cassegrain telescope with a field of view (FOV) of 1000 μrad. The pulse repetition frequency is 10 Hz and the pulse energy is 20 mJ [28]. The detectors of the lidar system are photomultiplier tubes (PMTs) at 532 nm, and avalanche photodiode (APD) at 1064 nm wavelength. With a temporal resolution of 15 min and a vertical resolution of 6 m, it can provide the backscattered signal with wavelengths at 532 nm and 1064 nm and the linear volume depolarization ratio at 532 nm wavelength. The volume depolarization ratio is the ratio of perpendicular component to parallel component of the backscattered signal, reflecting the irregularity of particle shape. According to the method by Sugimoto et al. [29], the particle depolarization ratio is derived from the volume depolarization ratio. The closer the particle shape is to a sphere, the smaller the depolarization ratio is, which can be used as an important parameter for lidar detection and the identification of different types of aerosols [30,31]. The raw lidar backscattered signal is revised by a series of background noise correction, range correction and geometric overlap correction, to obtain the normalized backscattered signal [32]. The calibration method of the depolarization ratio uses the research of Freudenthaler et al. [33]; the detailed description can be found in [33]. The following calculations on the backscatter Ångström exponent, aerosol extinction coefficient and planetary boundary layer height (PBLH) are based on the normalized backscattered signal.
Firstly, the cloud and aerosol layers were identified based on the backscattered signals to eliminate the influence of clouds on the aerosol vertical distribution characteristics. Cloud recognition used the multi-scale cloud recognition algorithm improved by Cao et al. [34] and Gao et al. [35] based on Mao et al. [36], which has the advantage of a low signal-to-noise ratio requirement. Gao et al. [35] verified the feasibility of this algorithm, which could better identify clouds, aerosols and dust. The Fernald–Klett [37] method was used to retrieve the aerosol extinction coefficient and AOD. The lidar equation is
P z = CEz 2 β 1 z + β 2 z exp 2 0 z σ 1 z + σ 2 z d z
where P(z) is the lidar backscattered signal at height z, C is the system calibration constant, and E is the emitted laser pulse energy. Subscript 1 denotes aerosol, subscript 2 denotes air molecule. β is the backscattering coefficient and σ is the extinction coefficient. According to the backward integration of the Fernald–Klett method, the aerosol extinction coefficient for each height below the calibration height zc is
σ 1 z = S 1 S 2 σ 2 z + X z exp 2 S 1 S 2 1 z z c σ 2 z ˙ d z ˙ X z c σ 1 z c + S 1 S 2 σ 2 z c + 2 0 z c X z ˙ exp 2 S 1 S 2 1 z z c σ 2 z ¨ d z ¨ d z ˙
X z = P z z 2 is the range square corrected signal. S = σ β is the extinction-to-backscatter ratio (or lidar ratio). S1 is the aerosol extinction-to-backscatter ratio and needs to be determined according to different situations, S 2 = 8 π 3 . σ 2 (z) is the molecular extinction coefficient and is calculated from the vertical profile of air molecule density provided by the American standard atmospheric model according to the Rayleigh scattering theory. For the aerosol extinction coefficient at z c , σ 1 z c is calculated by the set aerosol scattering ratio, and the formula for the aerosol scattering ratio at wavelength 532 nm is 1 + β 1 z c β 2 z c = 1.01 . The extinction coefficient σ 1 z is integrated from the surface to z c to obtain the AOD. The formula is as follows:
AOD = 0 z c σ 1 z d z
The lidar ratio is one of the important parameters for the retrieval of the aerosol extinction coefficient, which is related to the physical and chemical properties of the aerosol, such as composition, particle size distribution and shape [38,39]. In Northern China, the lidar ratio at 532 nm is 38 ± 7 [40]. In this study, in order to improve inversion accuracy for the extinction and backscattering coefficient, the appropriate lidar ratio was obtained by iterating the lidar ratio until the difference between the AOD retrieved from the NIES lidar and the AOD of CE-318 sun photometer was less than 0.02. A total of 972 moments (hourly average data) in which the lidar matched the sun photometer were selected to calculate the lidar ratio. Considering the seasonal variability of aerosol types, the average lidar ratios for spring, summer, fall, and winter were 41, 44, 47 and 46 sr, respectively.
The backscatter Ångström exponent (BAE) is an important parameter for measuring the size distribution of particles. It can be obtained as
BAE = ln β 1 , λ 1 / β 1 , λ 2 ln λ 1 / λ 2
β 1 , λ 1 and β 1 , λ 2 are aerosol backscatter coefficients at 1064 and 532 nm, respectively. The larger the backscatter Ångström exponent is, the smaller the particle size is. The PBLH can reflect the vertical distribution of aerosols and the evolution of atmospheric pollutants. The gradient method is used to determine the PBLH which uses the attenuation rate of the lidar range square corrected signal with height as the parameter [41]. The calculation formula is
D z = d P z z 2 / dz
The height corresponding to the minimum value of D z is defined to be the PBLH. In order to improve the signal-to-noise ratio, extinction coefficient, particle depolarization ratio, backscatter Ångström exponent and PBLH were hourly averaged.

2.3. Sun Photometer and AERONET Products

The Aerosol Robotic Network (AERONET) plays an important role in the study of global aerosol transportation and radiative effect, and provides long-term continuous aerosol optical, microphysical and radiative properties. The sun photometer (CIMEL, CE-318) is the basic observation instrument of AERONET with a field of view of 1.2° and a sun tracking accuracy of 0.1°. There are eight spectral channels in the visible and near-infrared bands at 340, 380, 440, 500, 675, 870, 940, 1020 and 1640 nm, respectively. AERONET retrieval products include AOD, single scattering albedo (SSA), effective radius, size distribution and complex refraction index. A more detailed description of AERONET is in [42]. In this paper, AOD, SSA, volume size distribution, Ångström exponent (AE) and radiative forcing data of Version 3, Level 2.0 quality assurance products were selected [43]. The data are available on the AERONET website (http://aeronet.gsfc.nasa.gov/ (accessed on 4 September 2023)).

2.4. Backward Trajectory Model

The HYSPLIT model is developed by the National Oceanic and Atmospheric Administration (NOAA) in cooperation with the Australian Bureau of Meteorology, and calculates simple air mass trajectories as well as simulates complex dispersion and deposition [44,45]. The simulation of the backward trajectory is based on meteorological data provided by the Global Data Assimilation System (GDAS) of the National Center for Environmental Prediction (NCEP) with the horizontal resolution of 1° × 1°. In the paper, the 72 h backward trajectories four times a day (at 00:00, 06:00, 12:00 and 18:00 (UTC)) of four seasons were calculated at the height of 500 m, and 48 h backward trajectories of aerosol particle at the height of 1 km, 2 km and 3 km were simulated during a dust event. Then the main transportation paths of aerosol were discussed based on the trajectory clustering analysis.

3. Results

3.1. Vertical Distribution and Seasonal Variation of Aerosol Optical Properties

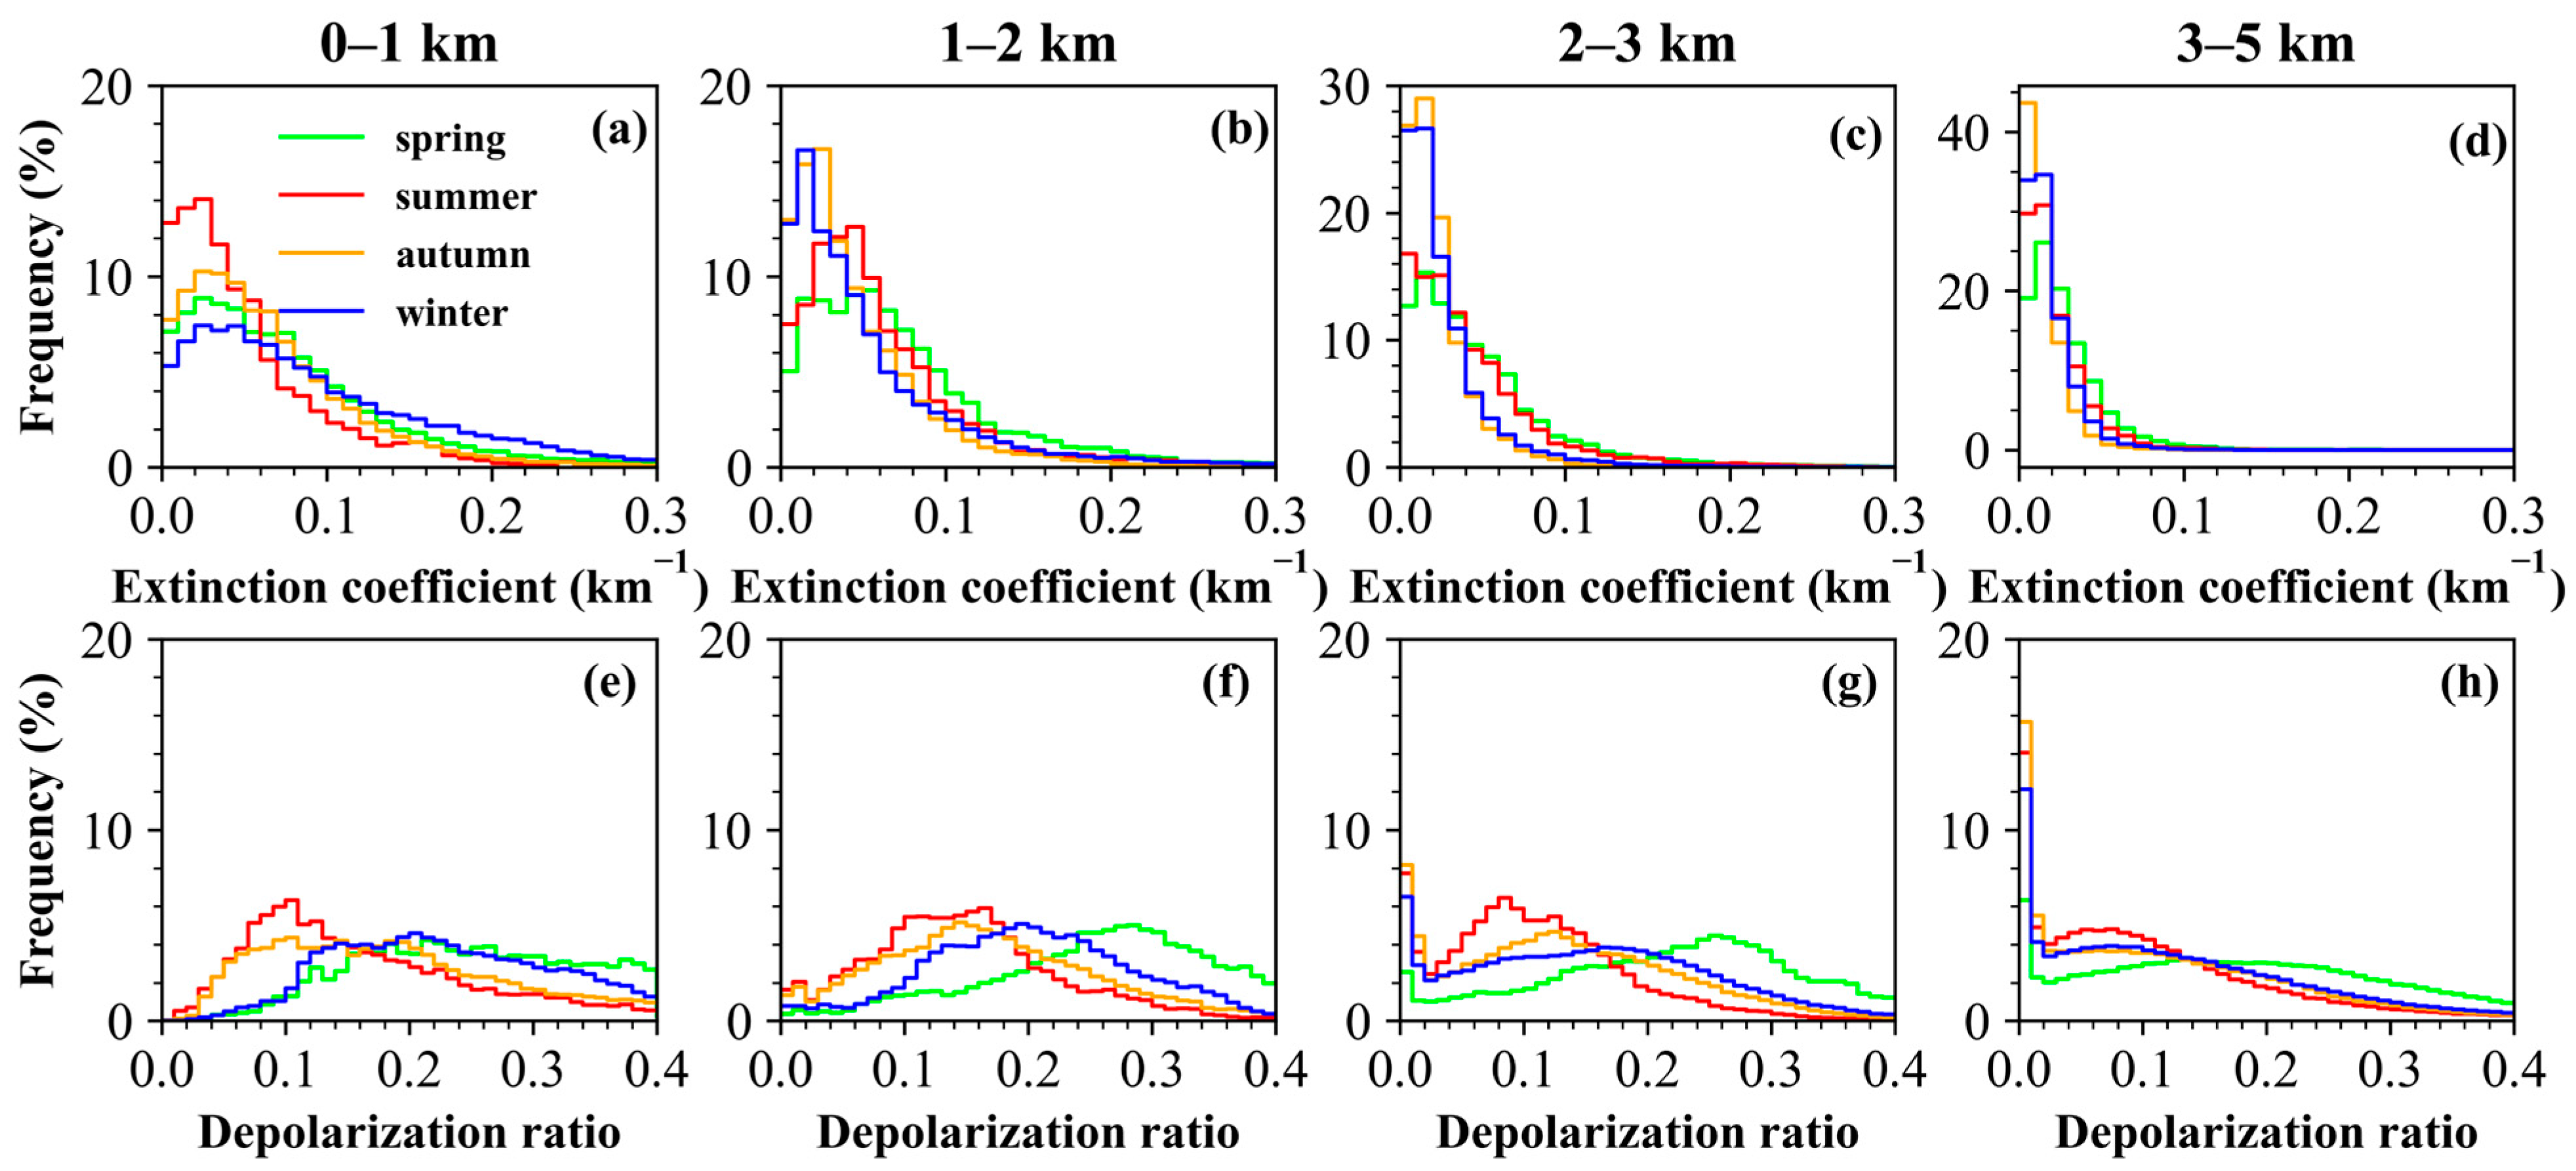
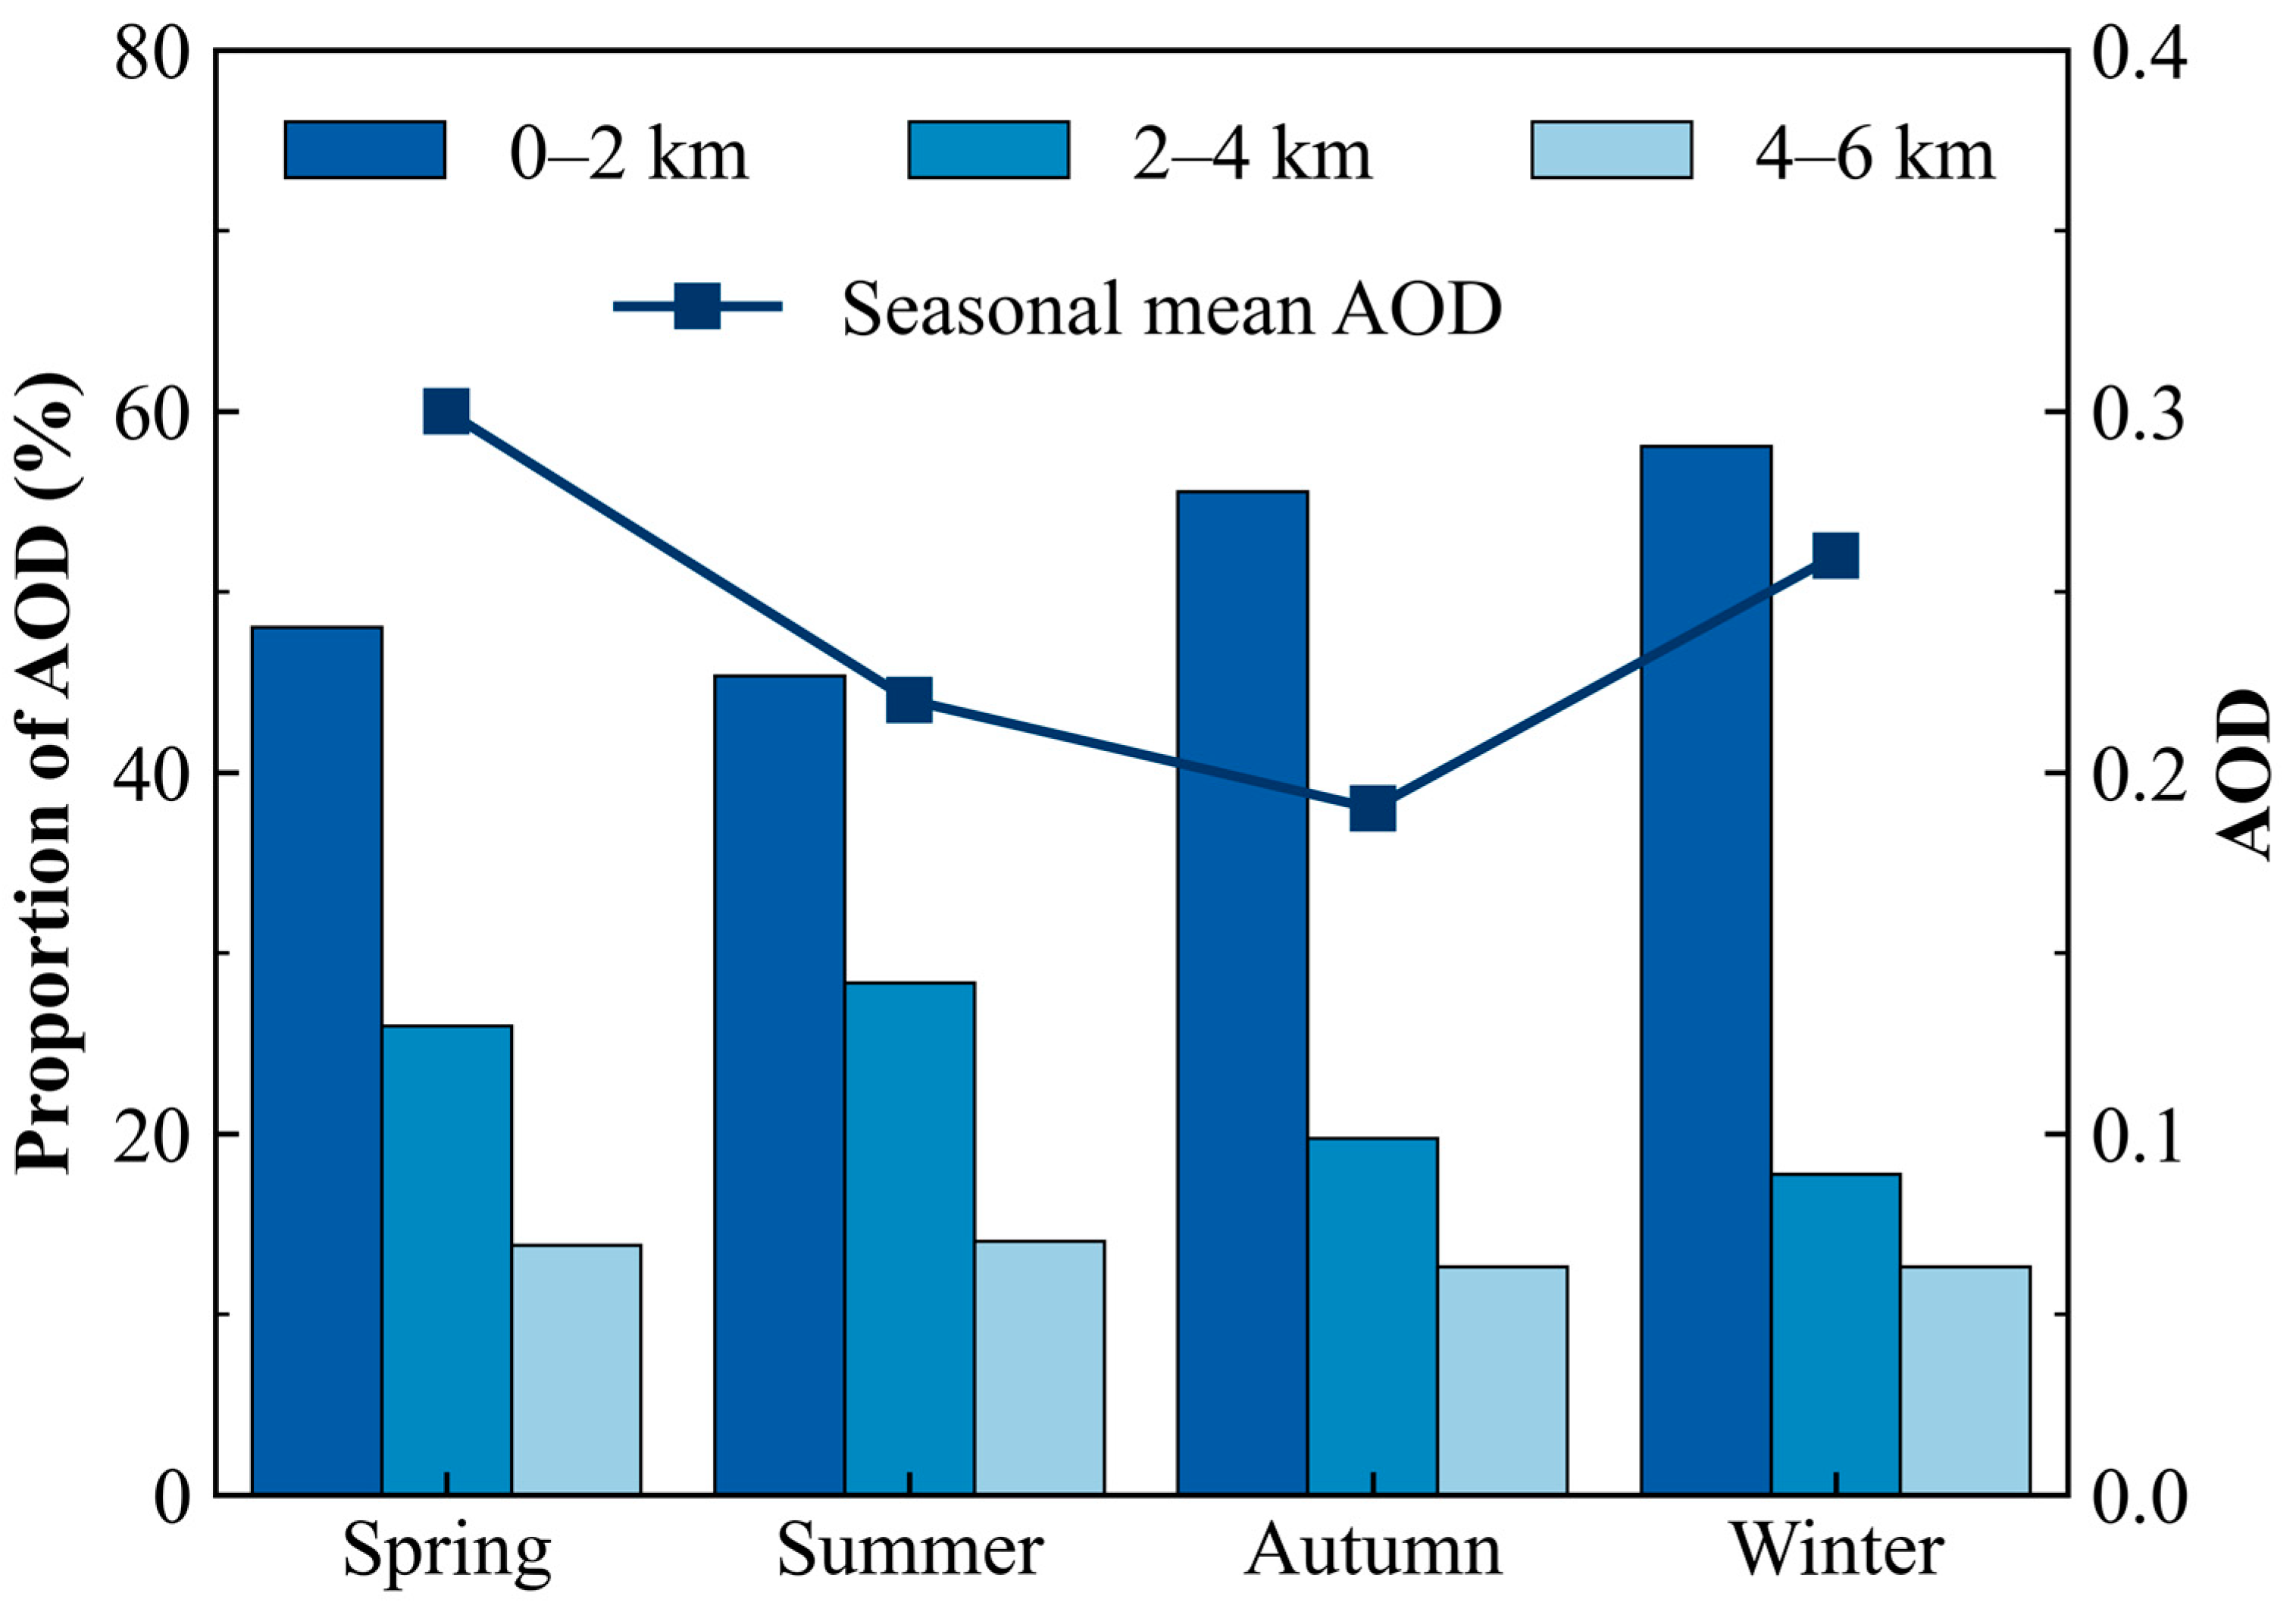
Considering the low signal-to-noise ratio of the lidar depolarization ratio above a 5 km height, the analysis focused on the height range 0–5 km. Figure 2 shows the vertical profiles of the extinction coefficient (532 nm), particle depolarization ratio (532 nm) and backscatter Ångström exponent in four seasons. The extinction coefficient and depolarization ratio clearly had seasonal variation characteristics due to the different physicochemical properties and aerosol sources. The aerosol extinction coefficient reflects the aerosol loading in the atmosphere and it is an important optical parameter indicating the scattering and absorption capacity. The maximum of the average aerosol extinction coefficient existed in winter at the lower layer (Figure 2d), where the mixture of dust with anthropogenic pollution was the dominating aerosol type during the heating period. It was the main reason for the larger aerosol extinction coefficient near the surface. Above 500 m, the aerosol extinction coefficient decreased with increasing height. In addition, the aerosol extinction coefficient decreased fastest with height in the winter, which was mainly due to the lower temperature, weaker solar radiation intensity and lower boundary layer height, resulting in aerosols concentrated in the lower height [46]. In the summer, the average extinction coefficient at the height range 0–5 km was less than 0.08 km−1 and remained almost constant below 2 km (Figure 2b). This may be due to the stronger vertical diffusion ability and the higher boundary layer height, which resulted in the uniform vertical distribution of aerosols [47]. Similar to the results of Sun et al. [48], the aerosol extinction coefficient was largest in the winter, and it decreased slowly in June and September in the Yangtze River Delta region. To understand the relevant properties of aerosols in different heights in more detail, the height range of 0–5 km was divided into four height layers: 0–1 km, 1–2 km, 2–3 km and 3–5 km, respectively (Figure 3). As shown in Figure 3, the aerosol extinction coefficient in the four seasons was mainly concentrated in the range of 0–0.1 km−1. The aerosol extinction coefficient at 0–2 km contributed most to the total aerosol extinction coefficient. It could also be found from Figure 4, which shows that the AOD in the height range of 0–2 km accounted for 48%, 45%, 56% and 58% of the total AOD in the spring, summer, autumn and winter, respectively. This result indicates that the extinction in the whole atmosphere layer depended mainly on aerosols within the boundary layer rather than those transported over long distance at high altitudes. A similar result was presented by Chew et al. [49], who found that there were large amounts of aerosols below 1.5 km and accounted for 65% of the total extinction in Singapore. The mean AODs in the spring, summer, autumn and winter were 0.30 ± 0.16, 0.22 ± 0.14, 0.19 ± 0.10 and 0.26 ± 0.15, respectively. Different from the Wuhan area, the mean AOD was largest in the summer probably due to the influence of dust, and least in the spring [50].
As to the aerosol depolarization ratio, it decreased with the increase in height in the four seasons, with the value of 0.17 near the surface in the spring being the largest among the four seasons (Figure 2e–h). The vertical profile in the summer generally showed the lowest aerosol depolarization ratio, with the mean aerosol depolarization ratio less than 0.15 at all heights (Figure 2f). The aerosol depolarization ratio is closely related to the sources of aerosols and the relative humidity of the surrounding environment, and it decreased with the increase in relative humidity [51], so the higher relative humidity may be one of the reasons for the smaller depolarization ratio in the summer. From the frequency distribution (Figure 3e–h), it can be seen that the depolarization ratio below 3 km was 0–0.35 with a wide distribution range in the spring, indicating that both non-spherical and spherical aerosols were present in the atmosphere. The depolarization ratio was largest in the spring compared with other seasons. The depolarization ratio in Beijing was mainly distributed in the range of 0.15–0.20 in spring, which was similar to this research and unlike Tsukuba in Japan, where the aerosol depolarization ratio corresponding to the maximum frequency in the spring was less than 0.1 [52].
The backscatter Ångström exponent reflects the size distribution of particles. The four seasons had similar vertical variation characteristics and it could be clearly seen that the particle size of the lower layer aerosol was larger than that of the upper layer aerosol (Figure 2i–l). The value of backscatter Ångström exponent was mainly concentrated in the range of 0–2. Mishra et al. [53] also found the similar conclusion that the aerosol particle size at 0.3–2 km was larger than that at 2–5 km in the central Indo–Gangetic belt.
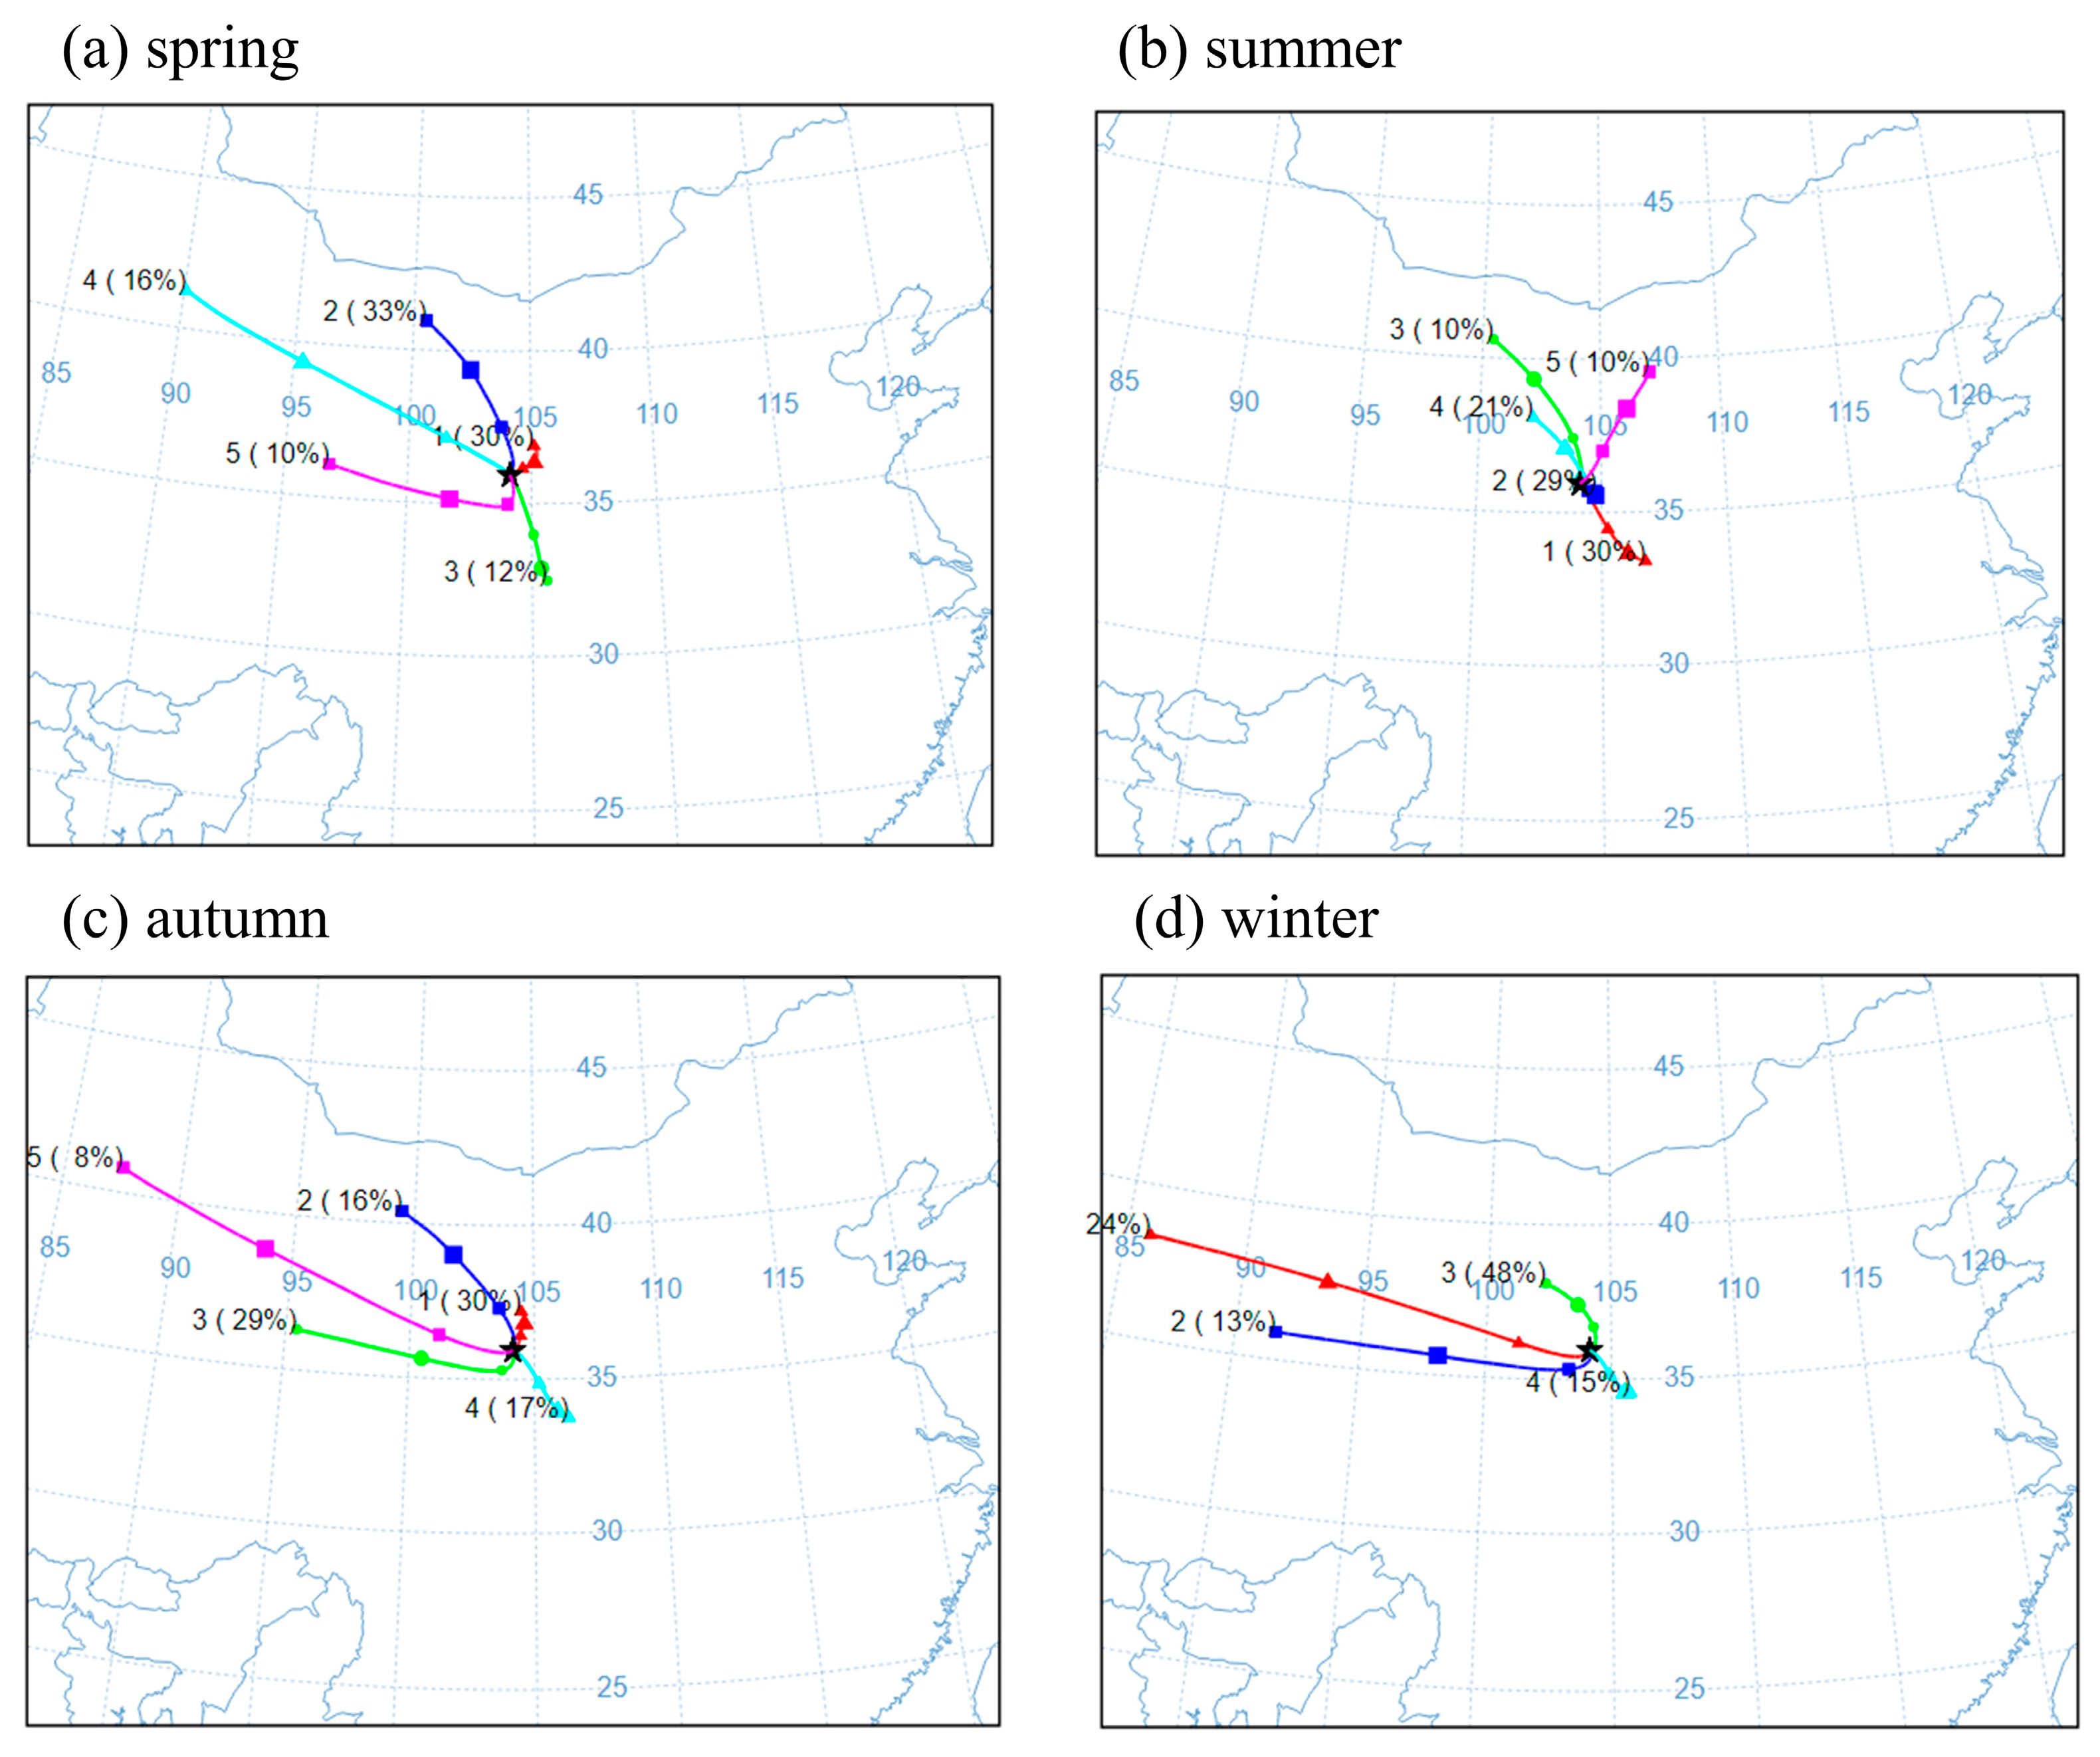
To study the transport directions of air mass and the possible sources of regional air pollution at SACOL station, we simulated the 72 h backward trajectories with the HYSPLIT model. The representative transport pathways for the four seasons were obtained by cluster analysis (Figure 5). In the spring, the air mass trajectories with long-distance transport from the northwest dominate (59%), with 16% coming from the Taklamakan Desert and 33% coming from the Gobi Desert. The spring is dominated by dust aerosols, which may be one of the reasons for the larger depolarization ratio. The trajectory lines of the air mass are relatively short in summer, and the air mass moves quickly. The southern air mass has the greatest impact (30%) compared to other seasons. In the autumn, it is also affected by aerosols from the Taklimakan Desert, but only by 8%. The air mass trajectories (37%) are from long-distance transport and 63% are from local transport in winter. The main aerosols are the mixtures of dust with anthropogenic pollution.

3.2. Vertical Distribution and Optical Microphysical Properties of a Dust Event

Through the above analysis of extinction coefficient, depolarization ratio vertical profile and backward trajectory, it can be found that the SACOL station is significantly influenced by dust aerosol in the spring. To assess the impact of dust aerosol quantitatively, we carried out the following study. According to the Dust Weather Yearbook in 2010, the dust event occurred in the central area of Gansu Province, China and started on 9 April 2010. It was selected as a typical dust event to analyze its vertical distribution and optical microphysical properties.

3.2.1. Vertical Distribution Characteristics of Aerosol in the Dust Event

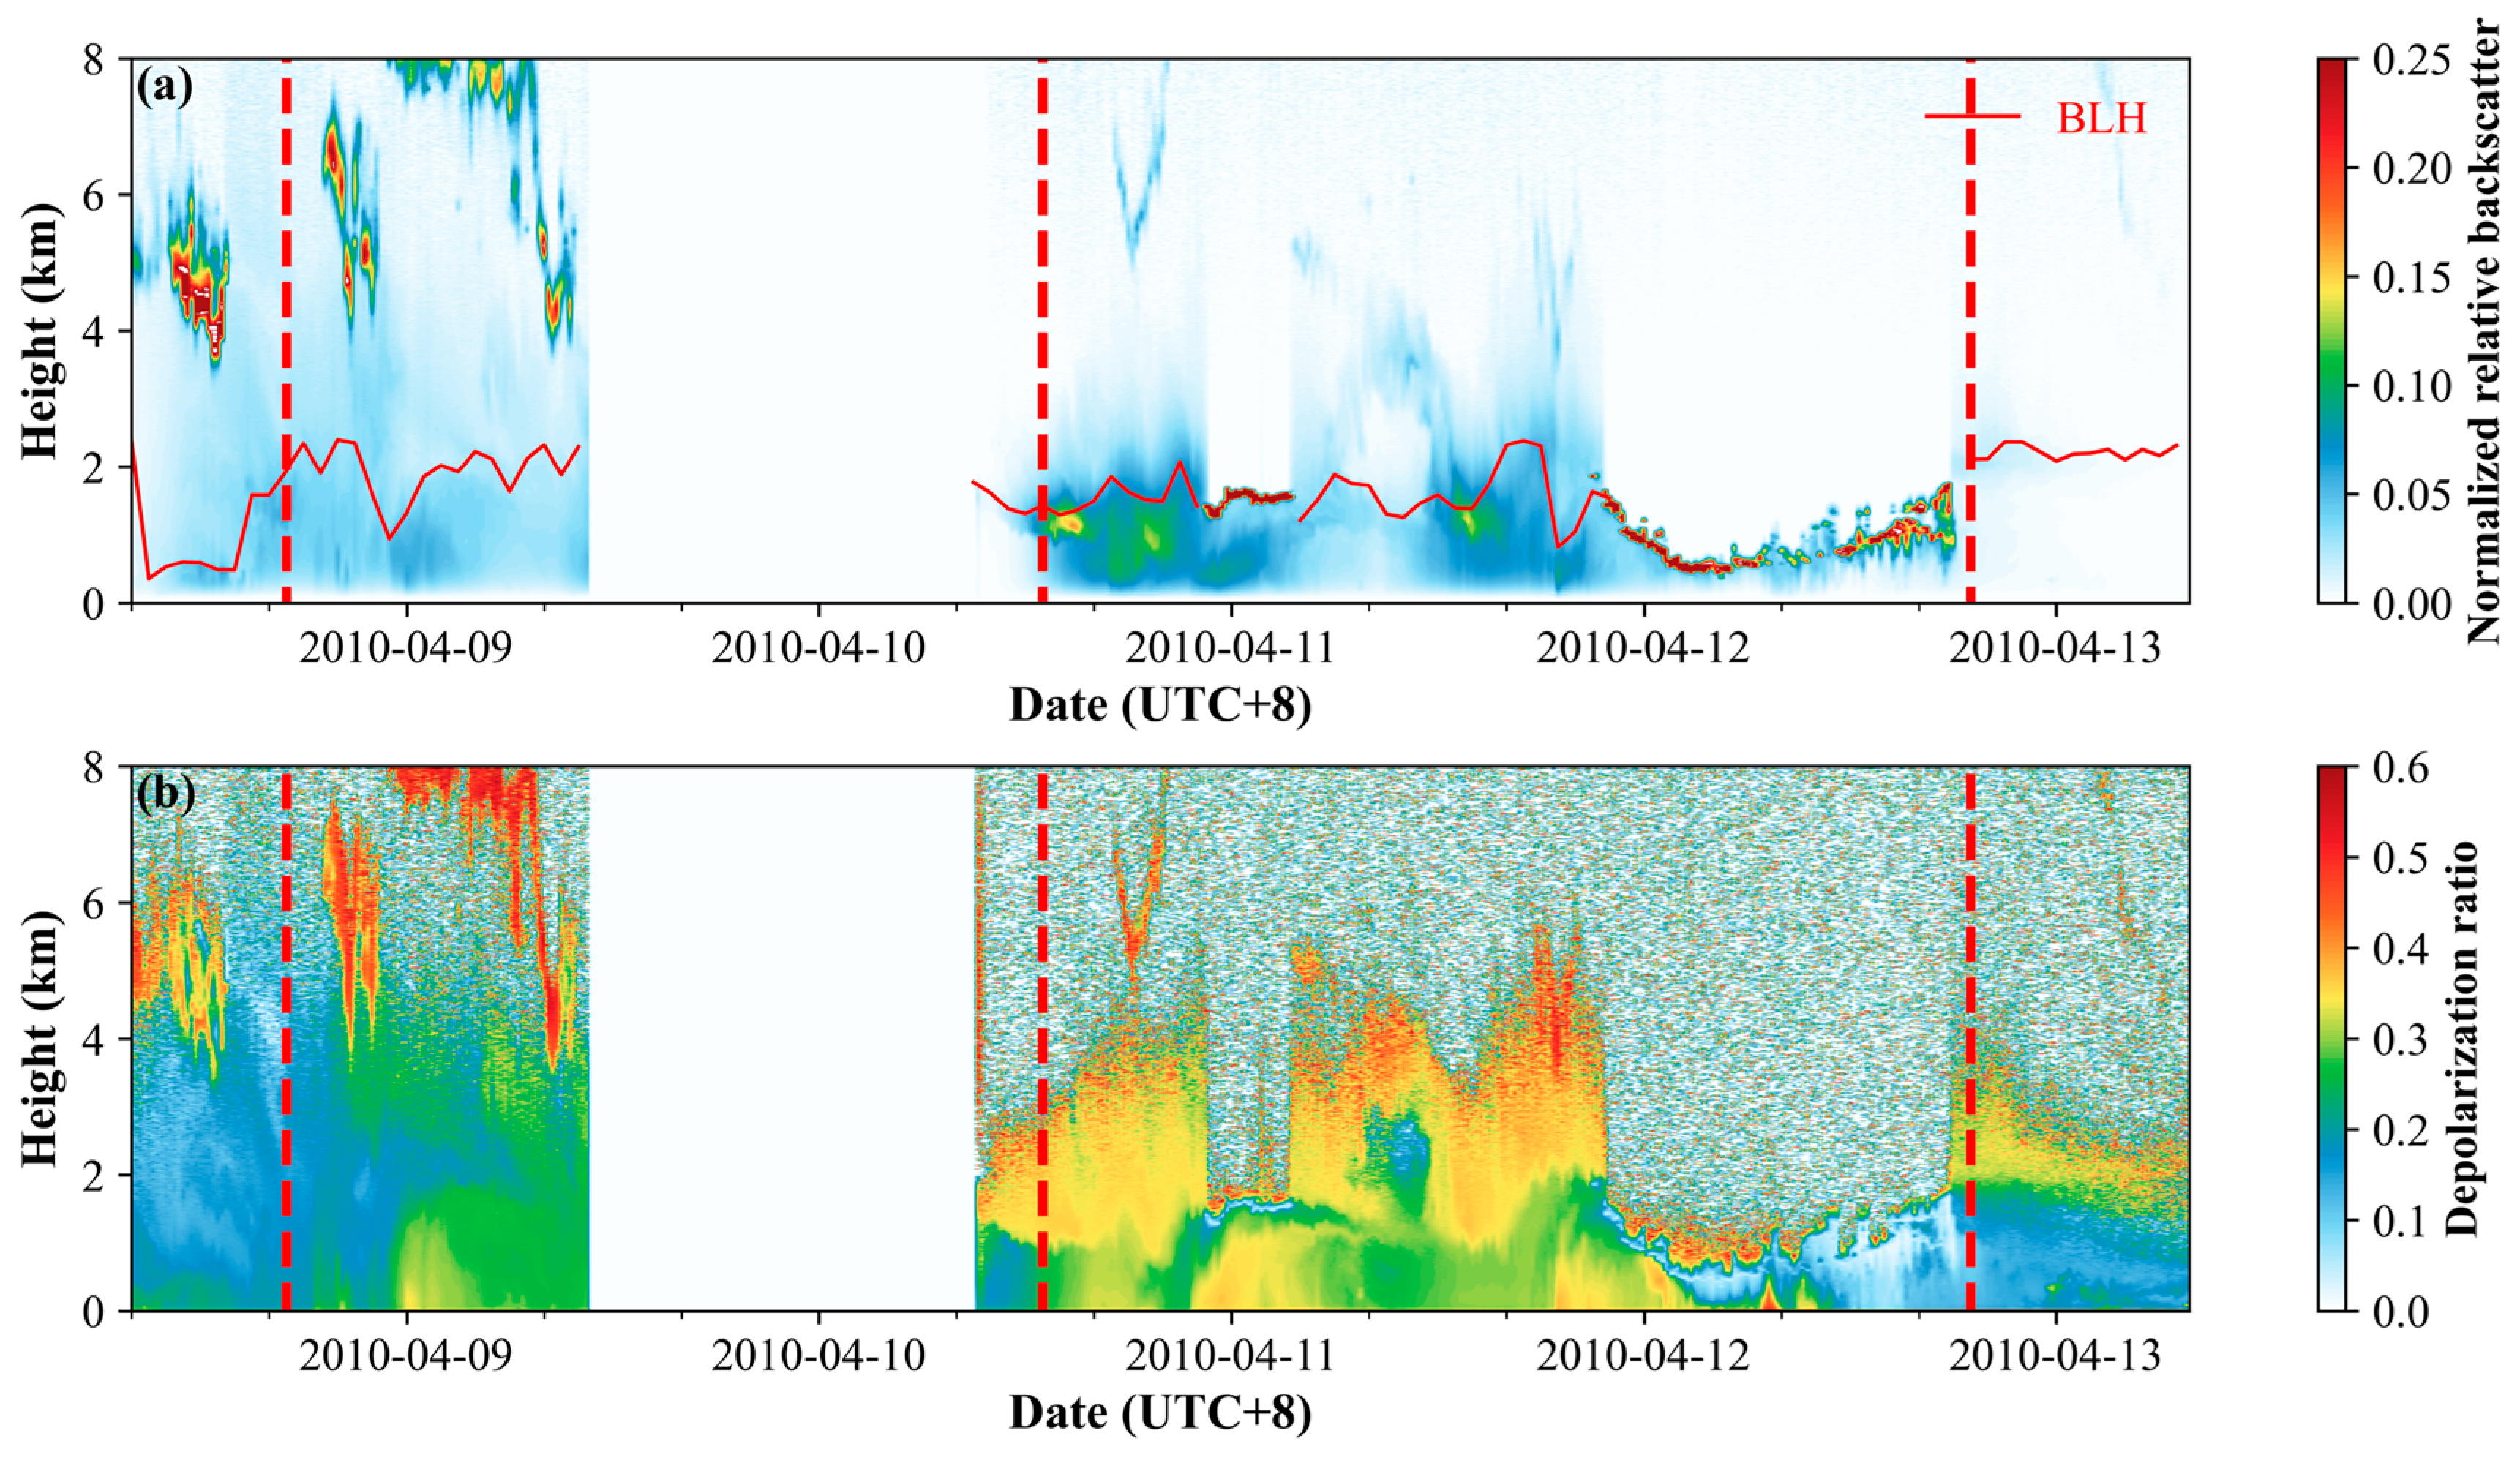
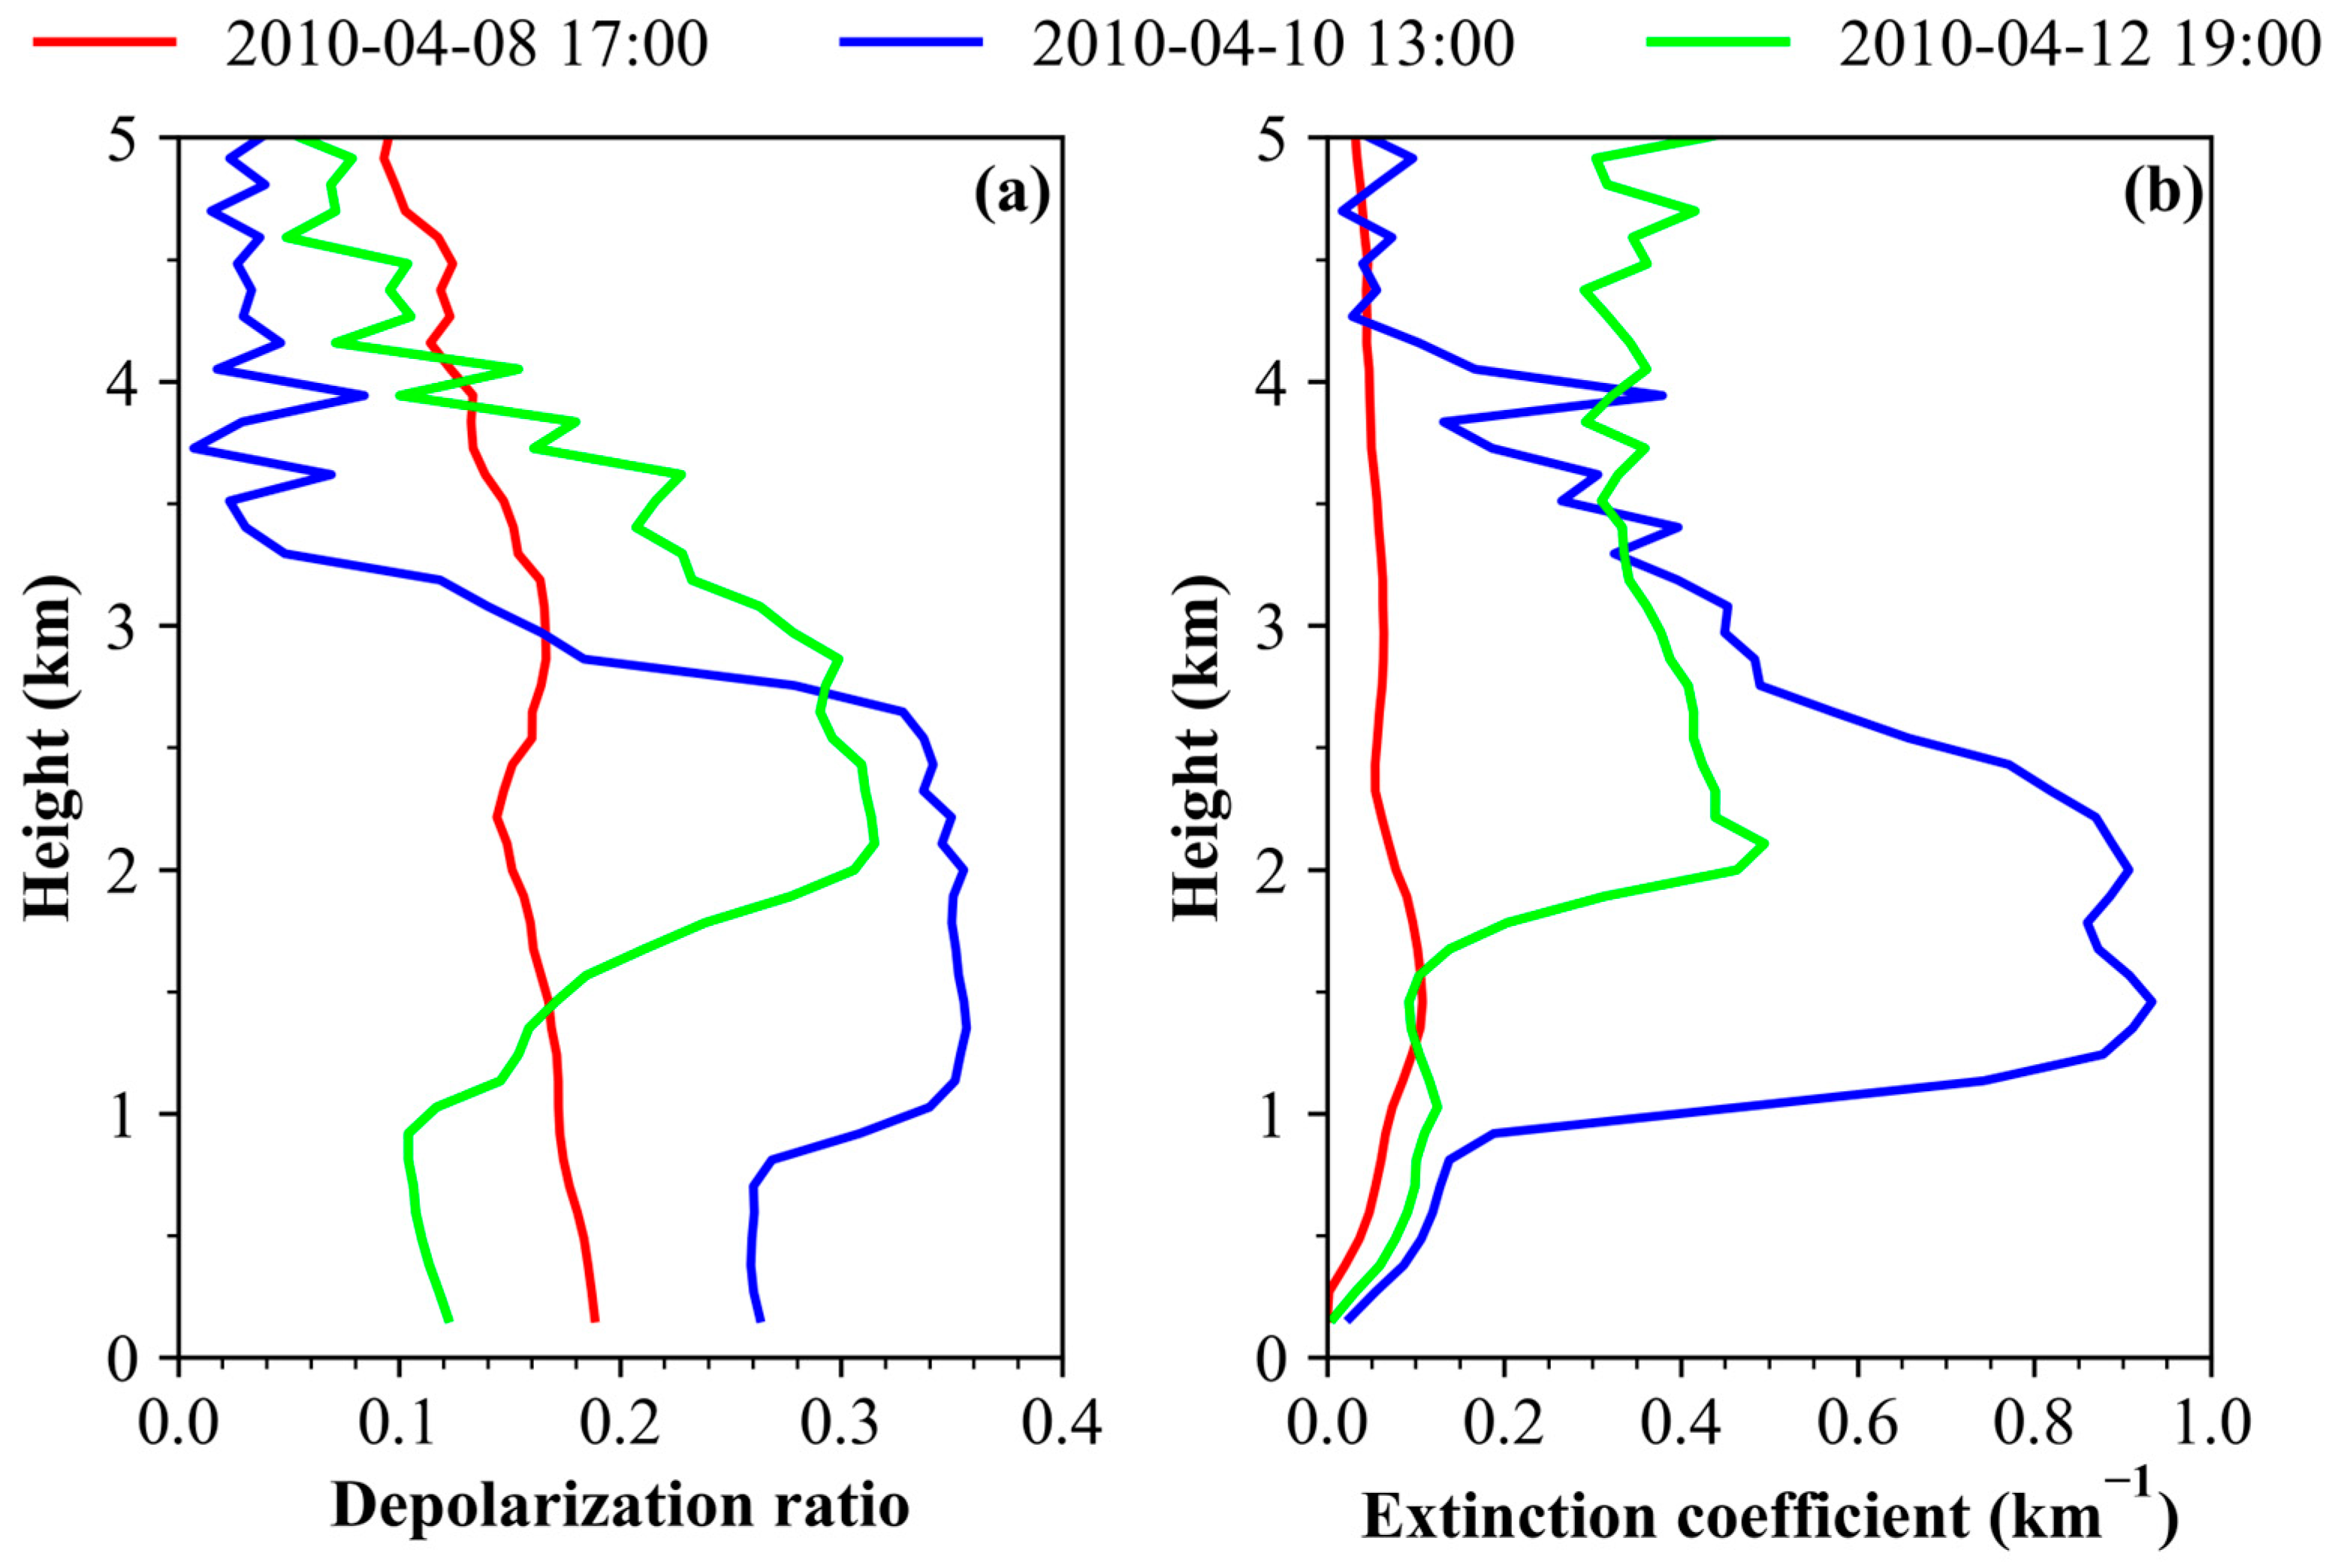
Seen from the time–height sections of the backscatter signal and depolarization ratio at SACOL (Figure 6), the dust event lasted from 9 April to 11 April 2010. Part of the data marked with a white area in Figure 6 were missing due to the influence of strong dust which attenuated the signal. The solid red line is the PBLH. The depolarization ratio reflects the degree of particle non-sphericity and is commonly used as an important parameter to distinguish the aerosol types. The previous research showed that the aerosol with depolarization ratio at 532 nm greater than 0.3 can be considered as pure dust [33,54]; the depolarization ratio of anthropogenic pollution aerosol is considered to be less than 0.1 and that of mixed anthropogenic pollution and dust aerosol is 0.1–0.3 [52,55]. As shown in Figure 6, aerosol layers with the depolarization ratio greater than 0.2 appeared at 0–2 km and 2.5–4 km from 00:00 (Beijing Time, UTC+8) on 9 April. As time went on, there was a dust layer with the depolarization ratio greater than 0.3 at 1–4 km on 10 April and 11 April, while the backscatter signal also exhibited large values. From 21:00 on 11 April to 18:00 on 12 April, the backscatter signal above 1 km was about 0 due to the obscuring effect of low clouds, and the signal-to-noise ratio of the depolarization ratio was also relatively low. From 19:00 on 12 April, the dust event generally ended. The depolarization ratio at 2.5–4 km was around 0.3, while the backscatter value was very small seen from the spatial and temporal distribution of the backscatter signal. The average PBLH during the whole dust event was 1.7 km. After the dust event, the PBLH increased to 2.1 km at 19:00 on 12 April and was maintained at about 2 km; the presence of dust aerosol could have led to the instability of the atmospheric stratification [56,57]. According to the above analysis, three representative sub-periods were selected: 17:00 on April 8, 13:00 on 10 April and 19:00 on 12 April, which represented the pre-dust, dust and post-dust periods, respectively. Figure 7 shows the vertical profiles of depolarization ratio and extinction coefficient at these three selected sub-periods. At 17:00 on 8 April, the depolarization ratio and extinction coefficient varied less below 5 km with the depolarization ratio less than 0.2 and the extinction coefficient around 0.05 km−1, indicating that the aerosols were more uniformly distributed and dominated rather by spherical particles. At 13:00 on 10 April, the depolarization ratio at 0.7–2.5 km was greater than 0.3 and the extinction coefficient increased to 0.9 km−1, indicating that high concentration of non-spherical dust aerosol dominated. Over time, at 19:00 on 12 April, the depolarization ratio was between 0.1 and 0.3 below 4 km in height, which indicated the presence of mixed anthropogenic pollution and dust aerosol; the extinction coefficient decreased and the backscatter signal also decreased significantly; therefore, the dust event gradually ended.
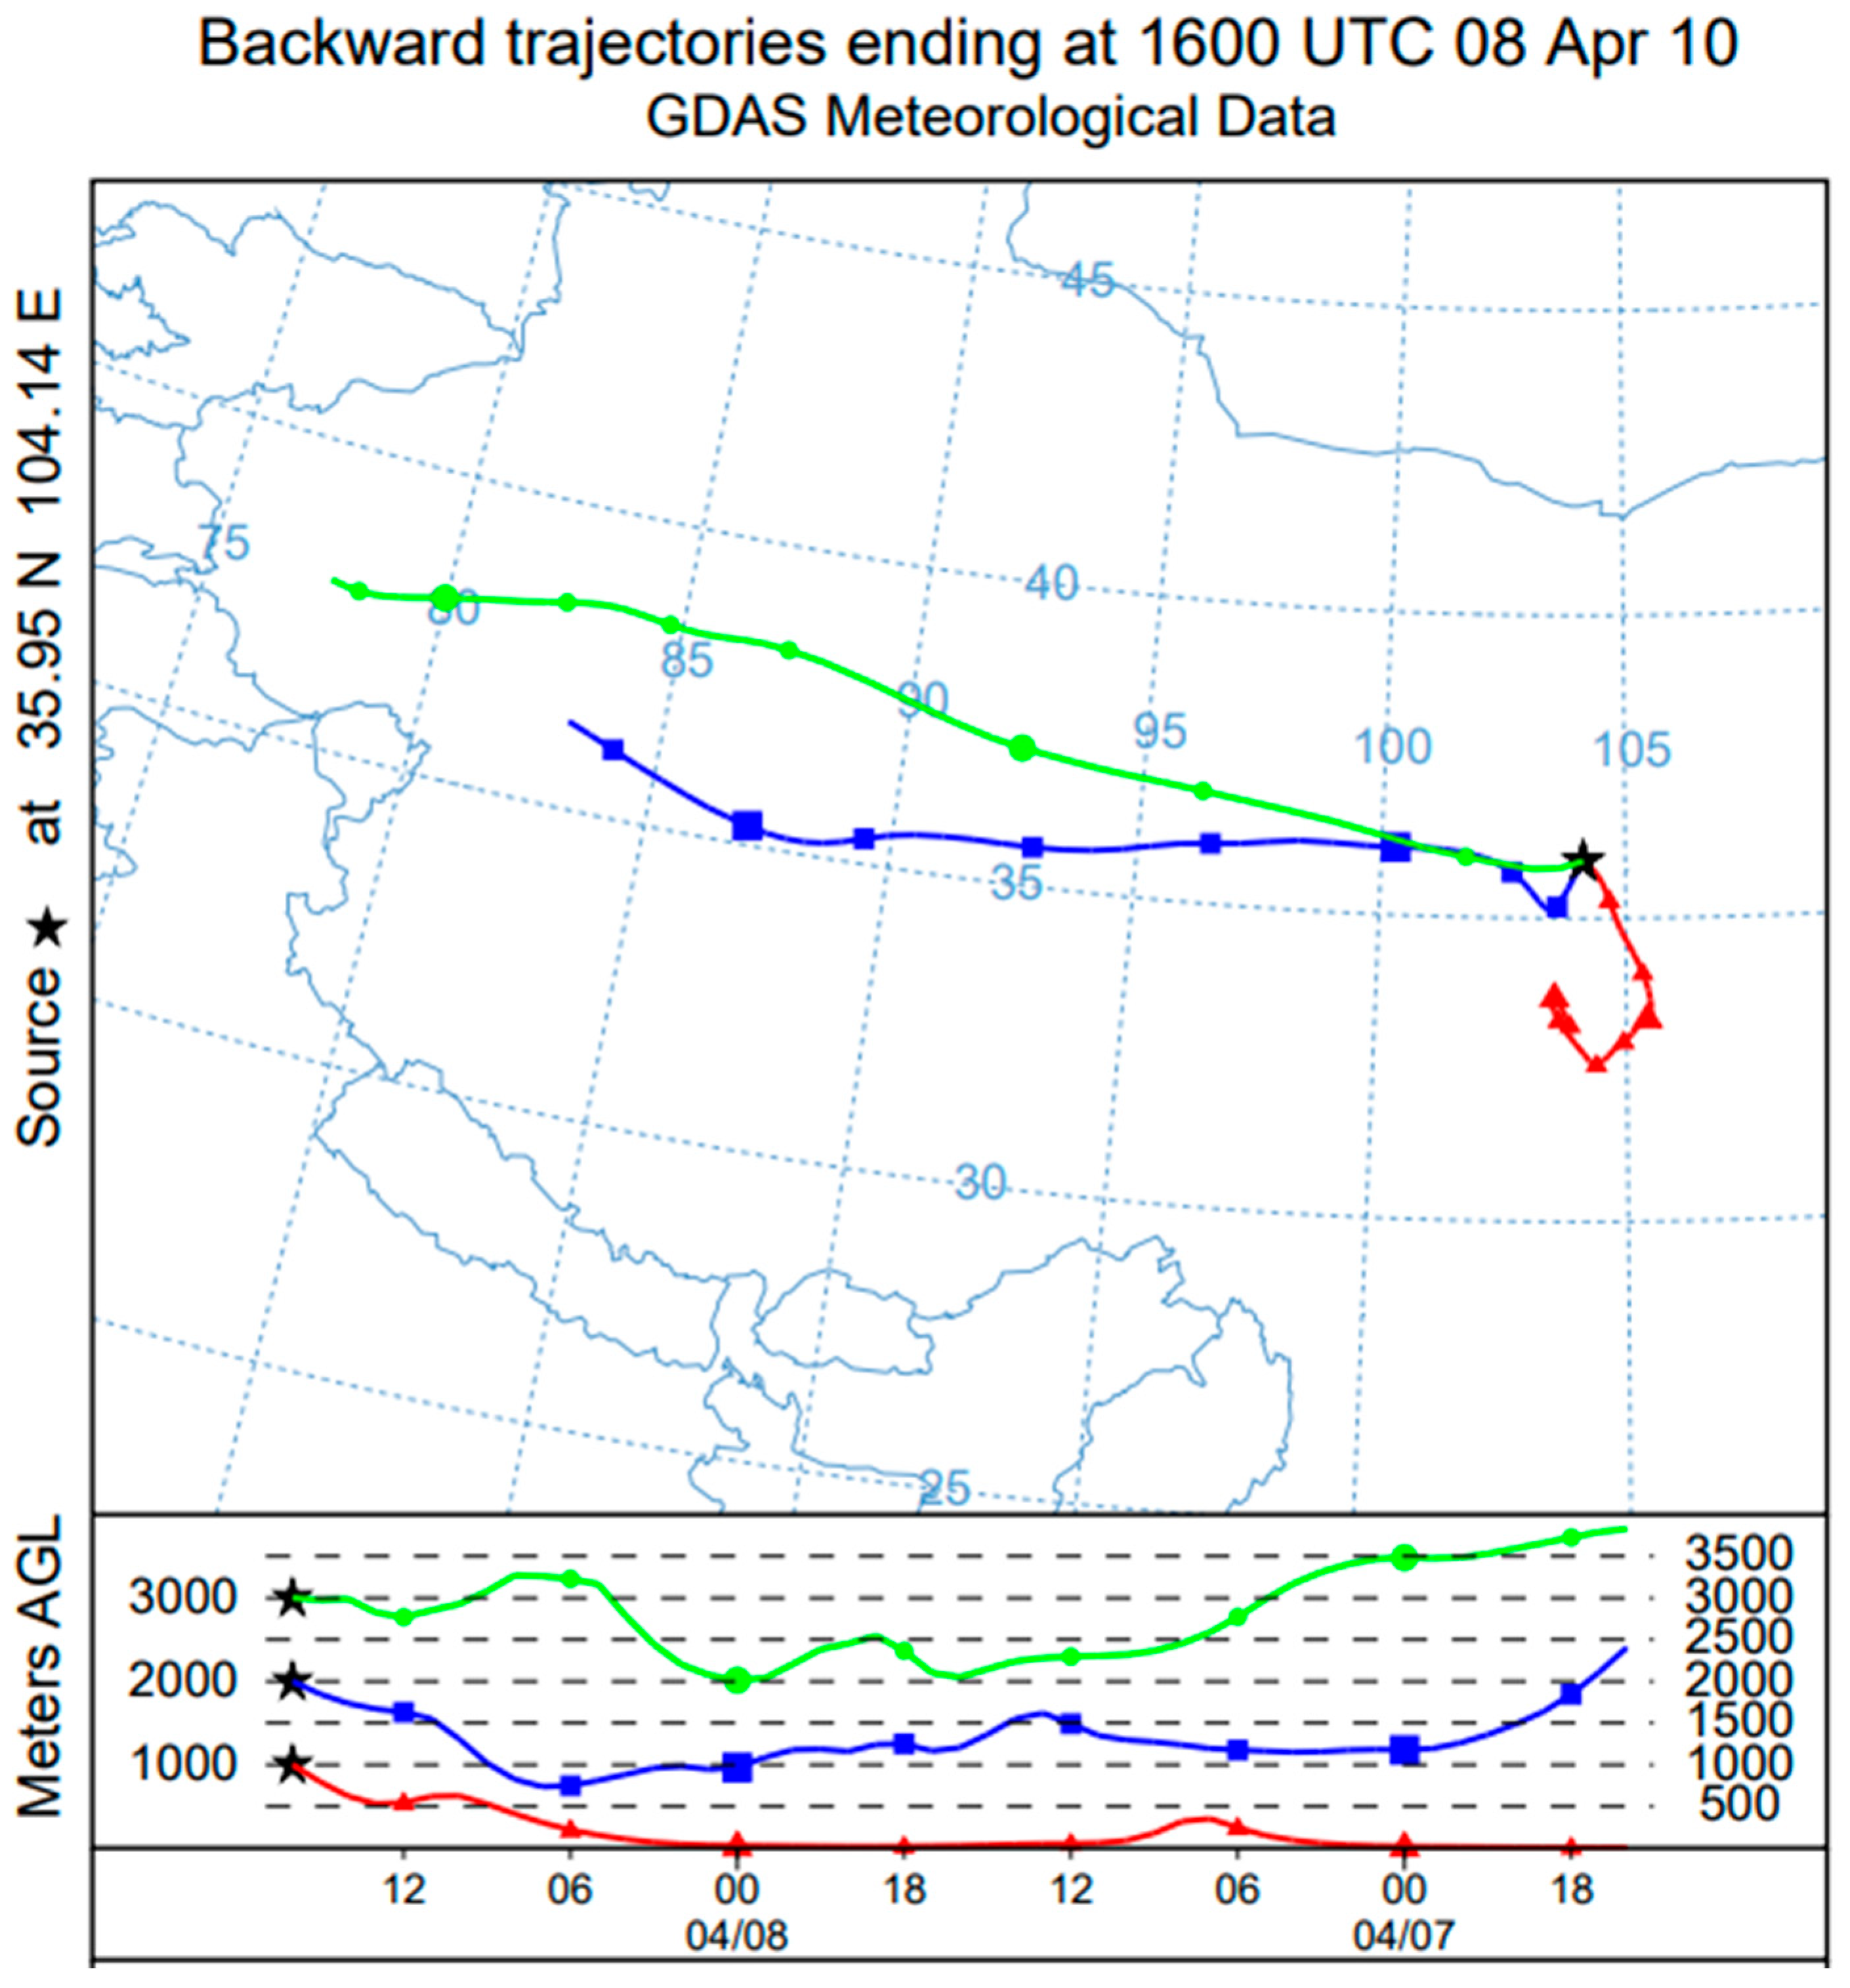
The Taklimakan Desert, Gobi Desert and Badain Jaran Desert are considered to be the most important dust sources in East Asia [58,59,60]. To study the sources of dust aerosol over SACOL, the backward trajectory started at 00:00 on 9 April 2010 and lasted 48 h, and was analyzed using the HYSPLIT model (Figure 8). The backward trajectories of air mass arriving at the 1 km, 2 km and 3 km height were simulated separately. The results show that the air mass at 1 km was mainly transported from the surrounding area near the surface; the air masses at 2 km and 3 km originated from the Taklimakan Desert and were long-distance transported from the northwest of China at a high altitude. The maximum value of AOD in the Taklimakan Desert was in April and the coarse-sized particles were the main component of aerosols in this region [61]. Zhang et al. [62] found that the depolarization ratio of Taklimakan dust was 0.32 ± 0.06 at 532 nm, which did not change significantly compared with the depolarization ratio of dust aerosol transported to SACOL.

3.2.2. Optical and Microphysical Properties of Aerosol in the Dust Event

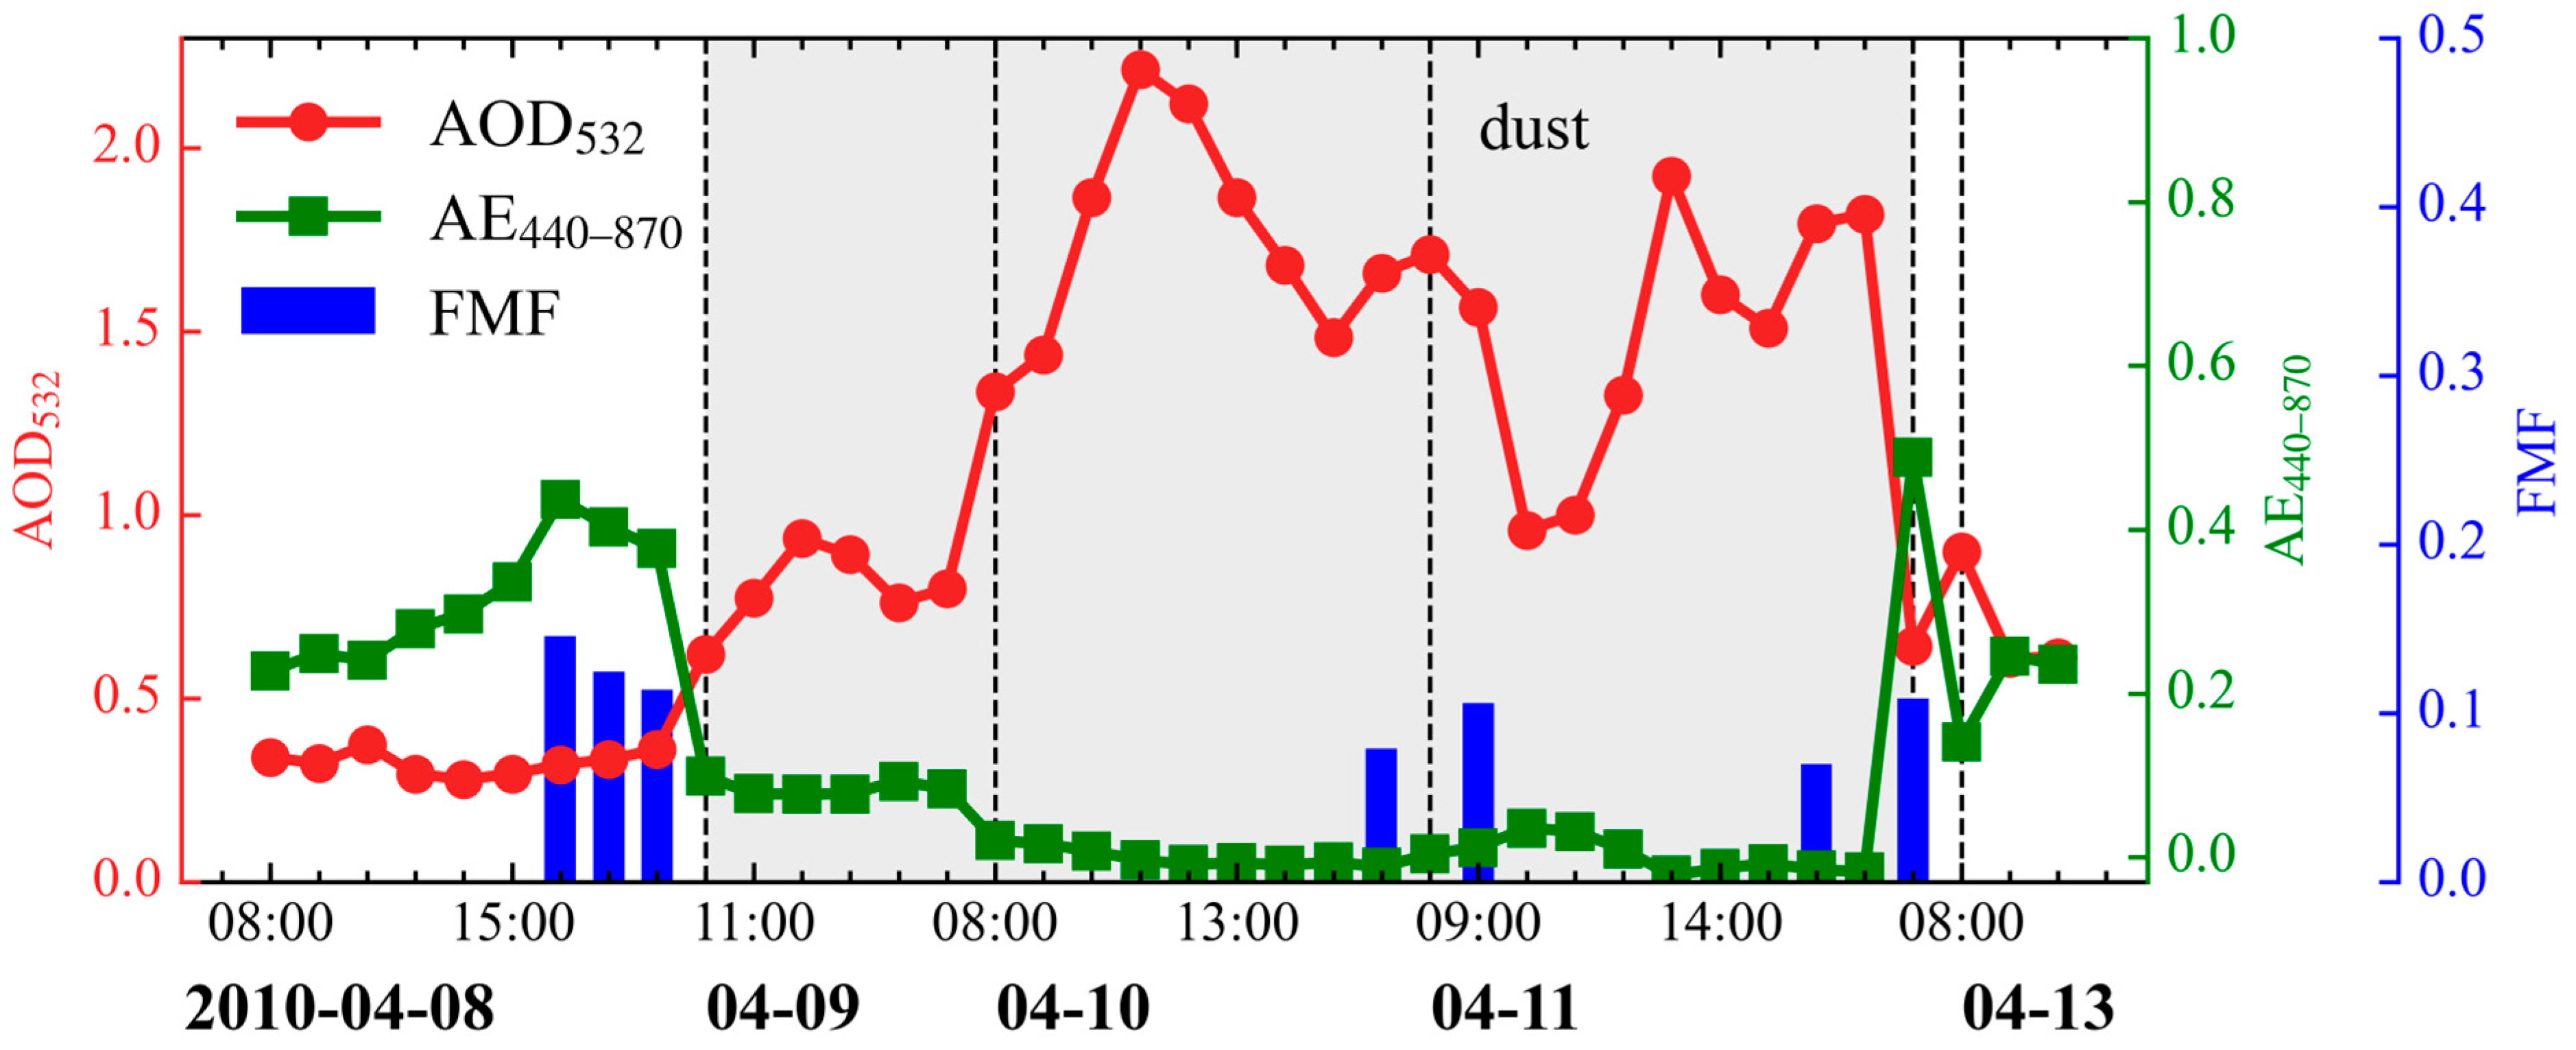
To obtain the aerosol optical and microphysical properties of the dust event, the variation characteristics of AOD, AE, SSA, volume size distribution and radiative forcing at SACOL were analyzed using observation data of lidar combined with AERONET products (see Figure 9 and Figure 10). The AOD increased significantly from 9 April 9 to 11 April, which was affected by dust, and reached a maximum value of 2.21 at 11:00 on 10 April, which was about 8 times higher than the AOD on 8 April (0.28). The increase in AOD lasted for about 3 days, and with the end of the dust event, the AOD dropped to 0.64 on April 12. From 9 April to 11 April, the average AOD was 1.43; the AEs were all less than 0.1; the fine-mode fraction (FMF) values ranged from 0.06–0.11, indicating that the increased aerosol load was dominated by the coarse-mode particles with less influence by the fine-mode particles. In addition, Bi et al. [63] defined particles with AOD440 ≥ 0.4 and AE440–870 < 0.2 as pure dust, and particles with AOD440 ≥ 0.4 and 0.2 < AE440–870 < 0.6 as long-distance transported polluted dust. Based on this criterion, the aerosol type was dominated by the pure dust in this dust event.
The large contribution of coarse-mode aerosols in the dust event could also be seen in the aerosol volume size distribution (Figure 10a). The effective radius of coarse-mode particles was 1.65 μm on 10 April; the volume concentration increased significantly from 0.21 μm3μm−2 on April 8 to 1.04 μm3μm−2 on 10 April, while the volume concentration of fine-mode particles did not change significantly. The highest volume concentration occurred on 11 April with the value of 1.18 μm3μm−2; the corresponding coarse-mode effective radius was 1.68 μm. The volume concentration dropped to 0.43 μm3μm−2 on 12 April. Similar to the volume size distribution of a dust event occurring in Beijing, the volume concentration at the peak radius was 1.12–0.92 μm3μm−2 [64]. SSA is the ratio of aerosol scattering coefficient to extinction coefficient, which is an important optical parameter to measure the radiative forcing of aerosols and reflects the scattering and absorption characteristics of aerosols [65]. Seen from the variation of SSA with wavelength for dust and non-dust in Figure 10b, the SSA significantly increased between 0.92 and 0.99 during the dust event and increased with wavelength, indicating that aerosols were dominated by the strongly scattered large particles [66]. This high SSA value and the trend with wavelength were similar to the results of other studies during dust events in China, though the different optical properties of dust from different dust sources may lead to slight differences in scattering and absorption properties [67,68]. The Middle East and Southwest Asia also exhibited a large SSA (0.99) during dust periods; however, it is possible that changes in optical properties due to the mixing of dust with other aerosols during the transportation caused the SSA in Korea and Japan to be smaller than that in the non-dust period [69,70]. Aerosol radiative forcing is one of the important parameters for assessing the impact of aerosols on climate. As shown in Figure 10c, the dust aerosol caused an increase in radiative forcing in the atmosphere (ARFATM); the maximum value reached 126.15 W/m2, which increased by 73.87 W/m2 compared to 8 April. Due to the high aerosol load, the solar radiation reaching the surface decreased and the cooling effect at the surface was enhanced. The radiative forcing at the bottom of atmosphere (ARFBOA) decreased from –70.45 W/m2 on April 8 to –225.52 W/m2 on 11 April. Similar results were obtained by Liu et al. [21] using the SBDART model (a radiative transfer model that can simulate the atmospheric and surface radiation) at SACOL; the ARFATM was 70.7 W/m2 during dust event and the heating effect of dust aerosol in the atmosphere was significant. It was found that the ARFATM was 125.55 W/m2 during the dust day in the Gobi Desert [64]; the ARFATM during two dust storms in the Indo–Gangetic basin were 124 W/m2 and 84 W/m2, respectively [71]. Above all, dust aerosol can significantly affect SSA and radiative forcing and have an important influence on the regional climate and atmospheric circulation [26].

4. Conclusions and Discussion

The vertical distribution is one of the main reasons for the uncertainty in the aerosol radiative forcing estimation. It is important to study the spatial and temporal distribution characteristics of aerosol optical properties based on long-term observation data for understanding the local aerosol vertical distribution and radiative effect. The vertical profiles of the extinction coefficient, depolarization ratio and backscatter Ångström exponent of aerosol were retrieved by dual-wavelength polarization lidar for three consecutive years from December 2009 to November 2012 at the Semi-Arid Climate and Environment Observatory of Lanzhou University (SACOL). Then the vertical distribution and seasonal variation characteristics of aerosol optical properties were analyzed. Finally, a typical dust event that occurred in April 2010 was analyzed using the observation of sun photometer and NIES lidar. The main results show the following:
(1)
The vertical profiles of the extinction coefficient and depolarization ratio show seasonal variation characteristics. In the winter, the heating and stable meteorological conditions lead to the extinction coefficient near the surface being the largest and decreased rapidly with height, while due to the strong convection mainly in the summer, the aerosols distributed uniformly below 2 km and the average extinction coefficient was the smallest.
(2)
The depolarization ratio decreased with increasing height in all four seasons, and it was the greatest near the surface in the spring, followed by the winter, autumn and summer. In the spring, the degree of non-spherical was most distinctively due to the presence of dust aerosol, and the depolarization ratio ranged from 0 to 0.35 below 3 km, while the depolarization ratio was mainly between 0 and 0.15 in the summer. The backscatter Ångström exponent had similar vertical variation characteristics in the four seasons, and the particle size of aerosol in the lower layers was larger than that in the upper layers.
(3)
The aerosol extinction coefficient at 0–2 km contributed most to the total extinction coefficient, and the AOD of spring, summer, autumn and winter accounted for 48%, 45%, 56% and 58% of the total AOD. The mean AOD was 0.30 ± 0.16, 0.22 ± 0.14, 0.19 ± 0.10 and 0.26 ± 0.15 in the spring, summer, autumn and winter, respectively. The main pollutants were dust aerosols in the spring and the mixtures of dust with anthropogenic pollution in the winter.
(4)
During the dust event from 9 April to 11 April 2010, the dust mainly originated from the Taklimakan Desert and was transported over a long distance at a high altitude. The depolarization ratio, extinction coefficient and AOD increased drastically when the dust arrived. The SSA was between 0.92 and 0.99. The AE was less than 0.1, indicating that coarse-mode particles dominated in the whole dust event. The dust aerosol resulted in the decrease in solar radiation reaching the surface and the enhancement of a cooling effect at the surface. With the increasing of radiative forcing in the atmosphere, the maximum reached 126.15 W/m2.
In general, the study of aerosol optical properties and vertical distribution characteristics helps to lay a foundation for the simulation of aerosol climate effects. It also provides important input and validation parameters for weather and climate models. In addition, the influence of dust aerosol on the atmospheric radiation effect cannot be ignored, and the atmospheric heating effect is significant.

Author Contributions

Methodology, M.L.; supervision, X.C.; visualization, M.L. and Z.Z.; conceptualization, X.C.; writing—original draft, M.L.; writing—review and editing, M.L.; formal analysis, M.L., H.J., M.Z. and Y.G.; funding acquisition, P.T.; project administration, J.L. All authors have read and agreed to the published version of the manuscript.

Funding

This research was supported by the Second Tibetan Plateau Scientific Expedition and Research Program (STEP, 2019QZKK0602) and Natural Science Foundation of Gansu Province (23JRRA1056).

Data Availability Statement

The sun photometer data are available on the AERNOET website (http://aeronet.gsfc.nasa.gov (accessed on 4 September 2023)). The NIES lidar data are available from the Semi-Arid Climate and Environment Observatory of Lanzhou University (SACOL) on request.

Acknowledgments

The authors thank the Semi-Arid Climate and Environment Observatory of Lanzhou University (SACOL) and the Aerosol Robotic Network (AERONET) for providing the observation data and retrieval products. The authors would like to thank the Air Resources Laboratory (ARL) of the National Oceanic and Atmospheric Administration (NOAA) for providing the HYSPLIT model. The authors are also grateful for the computing platform and resources provided by Lanzhou University Supercomputing Center. Finally, thanks are given to the reviewers for their valuable and critical comments.

Conflicts of Interest

The authors declare no conflict of interest.

References

  1. Twomey, S. Aerosols, Clouds and Radiation. Atmos. Environ. 1991, 25, 2435–2442. [Google Scholar] [CrossRef]
  2. Yin, Y.; Wurzler, S.; Levin, Z.; Reisin, T.G. Interactions of Mineral Dust Particles and Clouds: Effects on Precipitation and Cloud Optical Properties. J. Geophys. Res. 2002, 107, AAC 19-1–AAC 19-14. [Google Scholar] [CrossRef]
  3. Li, J.; Carlson, B.E.; Yung, Y.L.; Lv, D.; Hansen, J.; Penner, J.E.; Liao, H.; Ramaswamy, V.; Kahn, R.A.; Zhang, P.; et al. Scattering and Absorbing Aerosols in the Climate System. Nat. Rev. Earth Environ. 2022, 3, 363–379. [Google Scholar] [CrossRef]
  4. Monforte, P.; Ragusa, M.A. Temperature Trend Analysis and Investigation on a Case of Variability Climate. Mathematics 2022, 10, 2202. [Google Scholar] [CrossRef]
  5. Che, H.; Xia, X.; Zhu, J.; Wang, H.; Wang, Y.; Sun, J.; Zhang, X.; Shi, G. Aerosol Optical Properties under the Condition of Heavy Haze over an Urban Site of Beijing, China. Environ. Sci. Pollut. Res. 2015, 22, 1043–1053. [Google Scholar] [CrossRef]
  6. Manisalidis, I.; Stavropoulou, E.; Stavropoulos, A.; Bezirtzoglou, E. Environmental and Health Impacts of Air Pollution: A Review. Front. Public Health 2020, 8, 14. [Google Scholar] [CrossRef]
  7. IPCC. Climate Change 2013: The Physical Science Basis; Cambridge University Press: Cambridge, UK, 2013. [Google Scholar]
  8. IPCC. Climate Change 2021: The Physical Science Basis; Cambridge University Press: Cambridge, UK, 2021. [Google Scholar]
  9. Chung, C.E.; Ramanathan, V.; Kim, D.; Podgorny, I.A. Global Anthropogenic Aerosol Direct Forcing Derived from Satellite and Ground-Based Observations. J. Geophys. Res. 2005, 110, D24207. [Google Scholar]
  10. Satheesh, S.K.; Moorthy, K.K.; Babu, S.S.; Vinoj, V.; Dutt, C.B.S. Climate Implications of Large Warming by Elevated Aerosol over India. Geophys. Res. Lett. 2008, 35, L19809. [Google Scholar] [CrossRef]
  11. Li, J.; Jian, B.; Huang, J.; Hu, Y.; Zhao, C.; Kawamoto, K.; Liao, S.; Wu, M. Long-Term Variation of Cloud Droplet Number Concentrations from Space-Based Lidar. Remote Sens. Environ. 2018, 213, 144–161. [Google Scholar] [CrossRef]
  12. Radhakrishnan, S.R.; Satyanarayana, M.; KrishnaKumar, V.; Mahadevan pillai, V.P.; Reghunath, K. Lidar measurements on aerosol characteristics at the tropical stations Trivandrum (8.33°N, 77°E) and Gadanki (13.5°N, 79.2°E). In Proceedings of the 2009 International Conference on Ultra Modern Telecommunications & Workshops, St. Petersburg, Russia, 12–14 October 2009; pp. 1–4. [Google Scholar] [CrossRef]
  13. Lv, M.; Wang, Z.; Li, Z.; Luo, T.; Ferrare, R.; Liu, D.; Wu, D.; Mao, J.; Wan, B.; Zhang, F.; et al. Retrieval of Cloud Condensation Nuclei Number Concentration Profiles from Lidar Extinction and Backscatter Data. J. Geophys. Res. Atmos. 2018, 123, 6082–6098. [Google Scholar] [CrossRef]
  14. Liu, B.; Ma, X.; Ma, Y.; Li, H.; Jin, S.; Fan, R.; Gong, W. The Relationship between Atmospheric Boundary Layer and Temperature Inversion Layer and Their Aerosol Capture Capabilities. Atmos. Res. 2022, 271, 106121. [Google Scholar] [CrossRef]
  15. Hayasaka, T.; Satake, S.; Shimizu, A.; Sugimoto, N.; Matsui, I.; Aoki, K.; Muraji, Y. Vertical Distribution and Optical Properties of Aerosols Observed over Japan during the Atmospheric Brown Clouds–East Asia Regional Experiment 2005. J. Geophys. Res. 2007, 112, D22S35. [Google Scholar] [CrossRef]
  16. Menon, S. Current uncertainties in assessing aerosol effects on climate. Annu. Rev. Environ. Resour. 2004, 29, 1–30. [Google Scholar] [CrossRef]
  17. Liu, Y.; Lin, T.; Hong, J.; Wang, Y.; Shi, L.; Huang, Y.; Wu, X.; Zhou, H.; Zhang, J.; de Leeuw, G. Multi-Dimensional Satellite Observations of Aerosol Properties and Aerosol Types over Three Major Urban Clusters in Eastern China. Atmos. Chem. Phys. 2021, 21, 12331–12358. [Google Scholar] [CrossRef]
  18. Yu, X.; Zhu, B.; Fan, S.; Yin, Y.; Bu, X. Ground-Based Observation of Aerosol Optical Properties in Lanzhou, China. J. Environ. Sci. 2009, 21, 1519–1524. [Google Scholar] [CrossRef]
  19. Filonchyk, M.; Yan, H. The characteristics of air pollutants during different seasons in the urban area of Lanzhou, Northwest China. Environ. Earth Sci. 2018, 77, 763. [Google Scholar] [CrossRef]
  20. Cao, X.; Wang, Z.; Tian, P.; Wang, J.; Zhang, L.; Quan, X. Statistics of Aerosol Extinction Coefficient Profiles and Optical Depth Using Lidar Measurement over Lanzhou, China since 2005–2008. J. Quant. Spectrosc. Radiat. Transf. 2013, 122, 150–154. [Google Scholar] [CrossRef]
  21. Liu, Y.; Huang, J.; Shi, G.; Takamura, T.; Khatri, P.; Bi, J.; Shi, J.; Wang, T.; Wang, X.; Zhang, B. Aerosol Optical Properties and Radiative Effect Determined from Sky-Radiometer over Loess Plateau of Northwest China. Atmos. Chem. Phys. 2011, 11, 11455–11463. [Google Scholar] [CrossRef]
  22. Gong, C.; Xin, J.; Wang, S.; Wang, Y.; Zhang, T. Anthropogenic Aerosol Optical and Radiative Properties in the Typical Urban/Suburban Regions in China. Atmos. Res. 2017, 197, 177–187. [Google Scholar] [CrossRef]
  23. Yu, J.; Che, H.; Chen, Q.; Xia, X.; Zhao, H.; Wang, H.; Wang, Y.; Zhang, X.; Shi, G. Investigation of Aerosol Optical Depth (AOD) and Ångström Exponent over the Desert Region of Northwestern China Based on Measurements from the China Aerosol Remote Sensing Network (CARSNET). Aerosol Air Qual. Res. 2015, 15, 2024–2036. [Google Scholar] [CrossRef]
  24. Wang, S.; Yuan, W.; Shang, K. The Impacts of Different Kinds of Dust Events on PM10 Pollution in Northern China. Atmos. Environ. 2006, 40, 7975–7982. [Google Scholar] [CrossRef]
  25. Wu, X.; Liu, J.; Wu, Y.; Wang, X.; Yu, X.; Shi, J.; Bi, J.; Huang, Z.; Zhou, T.; Zhang, R. Aerosol Optical Absorption Coefficients at a Rural Site in Northwest China: The Great Contribution of Dust Particles. Atmos. Environ. 2018, 189, 145–152. [Google Scholar] [CrossRef]
  26. Wang, W.; Huang, J.; Zhou, T.; Bi, J.; Lin, L.; Chen, Y.; Huang, Z.; Su, J. Estimation of Radiative Effect of a Heavy Dust Storm over Northwest China Using Fu–Liou Model and Ground Measurements. J. Quant. Spectrosc. Radiat. Transf. 2013, 122, 114–126. [Google Scholar] [CrossRef]
  27. Huang, J.; Zhang, W.; Zuo, J.; Bi, J.; Shi, J.; Wang, X.; Chang, Z.; Huang, Z.; Yang, S.; Zhang, B.; et al. An Overview of the Semi-Arid Climate and Environment Research Observatory over the Loess Plateau. Adv. Atmos. Sci. 2008, 25, 906–921. [Google Scholar] [CrossRef]
  28. Shimizu, A.; Nishizawa, T.; Jin, Y.; Kim, S.-W.; Wang, Z.; Batdorj, D.; Sugimoto, N. Evolution of a Lidar Network for Tropospheric Aerosol Detection in East Asia. Opt. Eng. 2016, 56, 031219. [Google Scholar] [CrossRef]
  29. Sugimoto, N.; Huang, Z. Lidar Methods for Observing Mineral Dust. J. Meteorol. Res. 2014, 28, 173–184. [Google Scholar] [CrossRef]
  30. Murayama, T.; Okamoto, H.; Kaneyasu, N.; Kamataki, H.; Miura, K. Application of Lidar Depolarization Measurement in the Atmospheric Boundary Layer: Effects of Dust and Sea-Salt Particles. J. Geophys. Res. 1999, 104, 31781–31792. [Google Scholar] [CrossRef]
  31. Gasteiger, J.; Wiegner, M.; Groß, S.; Freudenthaler, V.; Toledano, C.; Tesche, M.; Kandler, K. Modelling Lidar-Relevant Optical Properties of Complex Mineral Dust Aerosols. Tellus B 2011, 63, 725. [Google Scholar] [CrossRef]
  32. Gao, X.; Cao, X.; Tian, P.; Zhang, L.; Huang, Z.; Zhou, T. Combined Observation of a Dust Storm over the Loess Plateau Using a Dual-Wavelength Lidar and an Aethalometer. Atmos. Pollut. Res. 2017, 8, 1103–1112. [Google Scholar] [CrossRef]
  33. Freudenthaler, V.; Esselborn, M.; Wiegner, M.; Heese, B.; Tesche, M.; Ansmann, A.; Müller, D.; Althausen, D.; Wirth, M.; Fix, A.; et al. Depolarization Ratio Profiling at Several Wavelengths in Pure Saharan Dust during SAMUM 2006. Tellus B 2009, 61, 165. [Google Scholar] [CrossRef]
  34. Cao, X.; Liang, J.; Tian, P.; Zhang, L.; Quan, X.; Liu, W. The Mass Concentration and Optical Properties of Black Carbon Aerosols over a Semi–Arid Region in the Northwest of China. Atmos. Pollut. Res. 2014, 5, 601–609. [Google Scholar] [CrossRef]
  35. Gao, X.; Cao, X.; Wang, J.; Guo, Q.; Du, T.; Zhang, L. Analysis of Aerosol Optical Properties in a Lanzhou Suburb of China. Atmos. Res. 2020, 246, 105098. [Google Scholar] [CrossRef]
  36. Mao, F.; Gong, W.; Zhu, Z. Simple Multiscale Algorithm for Layer Detection with Lidar. Appl. Opt. 2011, 50, 6591. [Google Scholar] [CrossRef]
  37. Fernald, F.G. Analysis of Atmospheric Lidar Observations: Some Comments. Appl. Opt. 1984, 23, 652. [Google Scholar] [CrossRef]
  38. Wiegner, M.; Groß, S.; Freudenthaler, V.; Schnell, F.; Gasteiger, J. The May/June 2008 Saharan dust event over Munich: Intensive aerosol parameters from lidar measurements. J. Geophys. Res. 2011, 116, D23213. [Google Scholar] [CrossRef]
  39. Mattis, I.; Ansmann, A.; Müller, D.; Wandinger, U.; Althausen, D. Dual-wavelength Raman lidar observations of the extinction-to-backscatter ratio of Saharan dust. Geophys. Res. Lett. 2002, 29, 20-1–20-24. [Google Scholar] [CrossRef]
  40. Müller, D.; Ansmann, A.; Mattis, I.; Tesche, M.; Wandinger, U.; Althausen, D.; Pisani, G. Aerosol-Type-Dependent Lidar Ratios Observed with Raman Lidar. J. Geophys. Res. 2007, 112, D16202. [Google Scholar] [CrossRef]
  41. Sheng, Z.; Che, H.; Chen, Q.; Xia, X.; Liu, D.; Wang, Z.; Zhao, H.; Gui, K.; Zheng, Y.; Sun, T.; et al. Aerosol Vertical Distribution and Optical Properties of Different Pollution Events in Beijing in Autumn 2017. Atmos. Res. 2019, 215, 193–207. [Google Scholar] [CrossRef]
  42. Holben, B.N.; Eck, T.F.; Slutsker, I.; Tanré, D.; Buis, J.P.; Setzer, A.; Vermote, E.; Reagan, J.A.; Kaufman, Y.J.; Nakajima, T.; et al. AERONET—A Federated Instrument Network and Data Archive for Aerosol Characterization. Remote Sens. Environ. 1998, 66, 1–16. [Google Scholar] [CrossRef]
  43. Giles, D.M.; Sinyuk, A.; Sorokin, M.G.; Schafer, J.S.; Smirnov, A.; Slutsker, I.; Eck, T.F.; Holben, B.N.; Lewis, J.R.; Campbell, J.R.; et al. Advancements in the Aerosol Robotic Network (AERONET) Version 3 Database—Automated near-Real-Time Quality Control Algorithm with Improved Cloud Screening for Sun Photometer Aerosol Optical Depth (AOD) Measurements. Atmos. Meas. Tech. 2019, 12, 169–209. [Google Scholar] [CrossRef]
  44. Draxler, R.R.; Hess, G.D. An Overview of the HYSPLIT_4 Modelling System for Trajectories, Dispersion, and Deposition. Aust. Met. Mag. 1998, 47, 295–308. [Google Scholar]
  45. Stein, A.F.; Draxler, R.R.; Rolph, G.D.; Stunder, B.J.B.; Cohen, M.D.; Ngan, F. NOAA’s HYSPLIT Atmospheric Transport and Dispersion Modeling System. Bull. Am. Meteorol. Soc. 2015, 96, 2059–2077. [Google Scholar]
  46. Leng, C.; Duan, J.; Xu, C.; Zhang, H.; Wang, Y.; Wang, Y.; Li, X.; Kong, L.; Tao, J.; Zhang, R.; et al. Insights into a Historic Severe Haze Event in Shanghai: Synoptic Situation, Boundary Layer and Pollutants. Atmos. Chem. Phys. 2016, 16, 9221–9234. [Google Scholar] [CrossRef]
  47. Guo, J.; Miao, Y.; Zhang, Y.; Liu, H.; Li, Z.; Zhang, W.; He, J.; Lou, M.; Yan, Y.; Bian, L.; et al. The Climatology of Planetary Boundary Layer Height in China Derived Fromradiosonde and Reanalysis Data. Atmos. Chem. Phys. 2016, 16, 13309–13319. [Google Scholar] [CrossRef]
  48. Sun, T.; Che, H.; Qi, B.; Wang, Y.; Dong, Y.; Xia, X.; Wang, H.; Gui, K.; Zheng, Y.; Zhao, H.; et al. Characterization of Vertical Distribution and Radiative Forcing of Ambient Aerosol over the Yangtze River Delta during 2013–2015. Sci. Total Environ. 2019, 650, 1846–1857. [Google Scholar] [CrossRef] [PubMed]
  49. Chew, B.N.; Campbell, J.R.; Salinas, S.V.; Chang, C.W.; Reid, J.S.; Welton, E.J.; Holben, B.N.; Liew, S.C. Aerosol Particle Vertical Distributions and Optical Properties over Singapore. Atmos. Environ. 2013, 79, 599–613. [Google Scholar] [CrossRef]
  50. Liu, B.; Ma, Y.; Gong, W.; Zhang, M. Observations of Aerosol Color Ratio and Depolarization Ratio over Wuhan. Atmos. Pollut. Res. 2017, 8, 1113–1122. [Google Scholar] [CrossRef]
  51. Sakai, T.; Shibata, T.; Kwon, S.-A.; Kim, Y.-S.; Tamura, K.; Iwasaka, Y. Free tropospheric aerosol backscatter, depolarization ratio, and relative humidity measured with the Raman lidar at Nagoya in 1994–1997: Contributions of aerosols from the Asian Continent and the Pacific Ocean. Atmos. Environ. 2000, 34, 431–442. [Google Scholar] [CrossRef]
  52. Shimizu, A. Continuous Observations of Asian Dust and Other Aerosols by Polarization Lidars in China and Japan during ACE-Asia. J. Geophys. Res. 2004, 109, D19S17. [Google Scholar] [CrossRef]
  53. Mishra, A.K.; Shibata, T. Climatological Aspects of Seasonal Variation of Aerosol Vertical Distribution over Central Indo-Gangetic Belt (IGB) Inferred by the Space-Borne Lidar CALIOP. Atmos. Environ. 2012, 46, 365–375. [Google Scholar] [CrossRef]
  54. Sugimoto, N.; Lee, C.H. Characteristics of Dust Aerosols Inferred from Lidar Depolarization Measurements at Two Wavelengths. Appl. Opt. 2006, 45, 7468. [Google Scholar] [CrossRef] [PubMed]
  55. Sugimoto, N.; Nishizawa, T.; Shimizu, A.; Matsui, I.; Kobayashi, H. Detection of internally mixed Asian dust with air pollution aerosols using a polarization optical particle counter and a polarization-sensitive two-wavelength lidar. J. Quant. Spectrosc. Radiat. Transf. 2015, 150, 107–113. [Google Scholar] [CrossRef]
  56. Zhang, X.; Xu, X.; Chen, H.; Hu, X.-M.; Gao, L. Dust-planetary boundary layer interactions amplified by entrainment and advections. Atmos. Res. 2022, 278, 106359. [Google Scholar] [CrossRef]
  57. Chen, L.; Zhang, M.; Zhu, J.; Skorokhod, A. Model Analysis of Soil Dust Impacts on the Boundary Layer Meteorology and Air Quality over East Asia in April 2015. Atmos. Res. 2017, 187, 42–56. [Google Scholar] [CrossRef]
  58. Kok, J.F.; Adebiyi, A.A.; Albani, S.; Balkanski, Y.; Checa-Garcia, R.; Chin, M.; Colarco, P.R.; Hamilton, D.S.; Huang, Y.; Ito, A.; et al. Contribution of the World’s Main Dust Source Regions to the Global Cycle of Desert Dust. Atmos. Chem. Phys. 2021, 21, 8169–8193. [Google Scholar] [CrossRef]
  59. Zhang, X.Y.; Gong, S.L.; Shen, Z.X.; Mei, F.M.; Xi, X.X.; Liu, L.C.; Zhou, Z.J.; Wang, D.; Wang, Y.Q.; Cheng, Y. Characterization of Soil Dust Aerosol in China and Its Transport and Distribution during 2001 ACE-Asia: 1. Network Observations. J. Geophys. Res. 2003, 108, ACH 3-1–ACH 3-14. [Google Scholar] [CrossRef]
  60. Huang, J.; Minnis, P.; Lin, B.; Wang, T.; Yi, Y.; Hu, Y.; Sun-Mack, S.; Ayers, K. Possible Influences of Asian Dust Aerosols on Cloud Properties and Radiative Forcing Observed from MODIS and CERES. Geophys. Res. Lett. 2006, 33, L06824. [Google Scholar] [CrossRef]
  61. Che, H.; Wang, Y.; Sun, J.; Zhang, X.; Zhang, X.; Guo, J. Variation of Aerosol Optical Properties over the Taklimakan Desert in China. Aerosol Air Qual. Res. 2013, 13, 777–785. [Google Scholar] [CrossRef]
  62. Zhang, S.; Huang, Z.; Li, M.; Shen, X.; Wang, Y.; Dong, Q.; Bi, J.; Zhang, J.; Li, W.; Li, Z.; et al. Vertical Structure of Dust Aerosols Observed by a Ground-Based Raman Lidar with Polarization Capabilities in the Center of the Taklimakan Desert. Remote Sens. 2022, 14, 2461. [Google Scholar] [CrossRef]
  63. Bi, J.; Huang, J.; Holben, B.; Zhang, G. Comparison of Key Absorption and Optical Properties between Pure and Transported Anthropogenic Dust over East and Central Asia. Atmos. Chem. Phys. 2016, 16, 15501–15516. [Google Scholar] [CrossRef]
  64. Filonchyk, M.; Peterson, M.; Hurynovich, V. Air Pollution in the Gobi Desert Region: Analysis of Dust-storm Events. Q. J. R. Meteorol. Soc. 2021, 147, 1097–1111. [Google Scholar] [CrossRef]
  65. Hansen, J.; Sato, M.; Ruedy, R. Radiative Forcing and Climate Response. J. Geophys. Res. 1997, 102, 6831–6864. [Google Scholar] [CrossRef]
  66. She, L.; Xue, Y.; Guang, J.; Che, Y.; Fan, C.; Li, Y.; Xie, Y. Towards a Comprehensive View of Dust Events from Multiple Satellite and Ground Measurements: Exemplified by the May 2017 East Asian Dust Storm. Nat. Hazards Earth Syst. Sci. 2018, 18, 3187–3201. [Google Scholar] [CrossRef]
  67. Yu, X.; Cheng, T.; Chen, J.; Liu, Y. A Comparison of Dust Properties between China Continent and Korea, Japan in East Asia. Atmos. Environ. 2006, 40, 5787–5797. [Google Scholar] [CrossRef]
  68. Eck, T.F.; Holben, B.N.; Dubovik, O.; Smirnov, A.; Goloub, P.; Chen, H.B.; Chatenet, B.; Gomes, L.; Zhang, X.-Y.; Tsay, S.-C.; et al. Columnar aerosol optical properties at AERONET sites in central eastern Asia and aerosol transport to the tropical mid-Pacific. J. Geophys. Res. 2005, 110, D06202. [Google Scholar] [CrossRef]
  69. Kim, D.-H. Aerosol Optical Properties over East Asia Determined from Ground-Based Sky Radiation Measurements. J. Geophys. Res. 2004, 109, D02209. [Google Scholar] [CrossRef]
  70. Alam, K.; Trautmann, T.; Blaschke, T.; Subhan, F. Changes in Aerosol Optical Properties Due to Dust Storms in the Middle East and Southwest Asia. Remote Sens. Environ. 2014, 143, 216–227. [Google Scholar] [CrossRef]
  71. Tiwari, S.; Kumar, A.; Pratap, V.; Singh, A.K. Assessment of Two Intense Dust Storm Characteristics over Indo-Gangetic Basin and Their Radiative Impacts: A Case Study. Atmos. Res. 2019, 228, 23–40. [Google Scholar] [CrossRef]
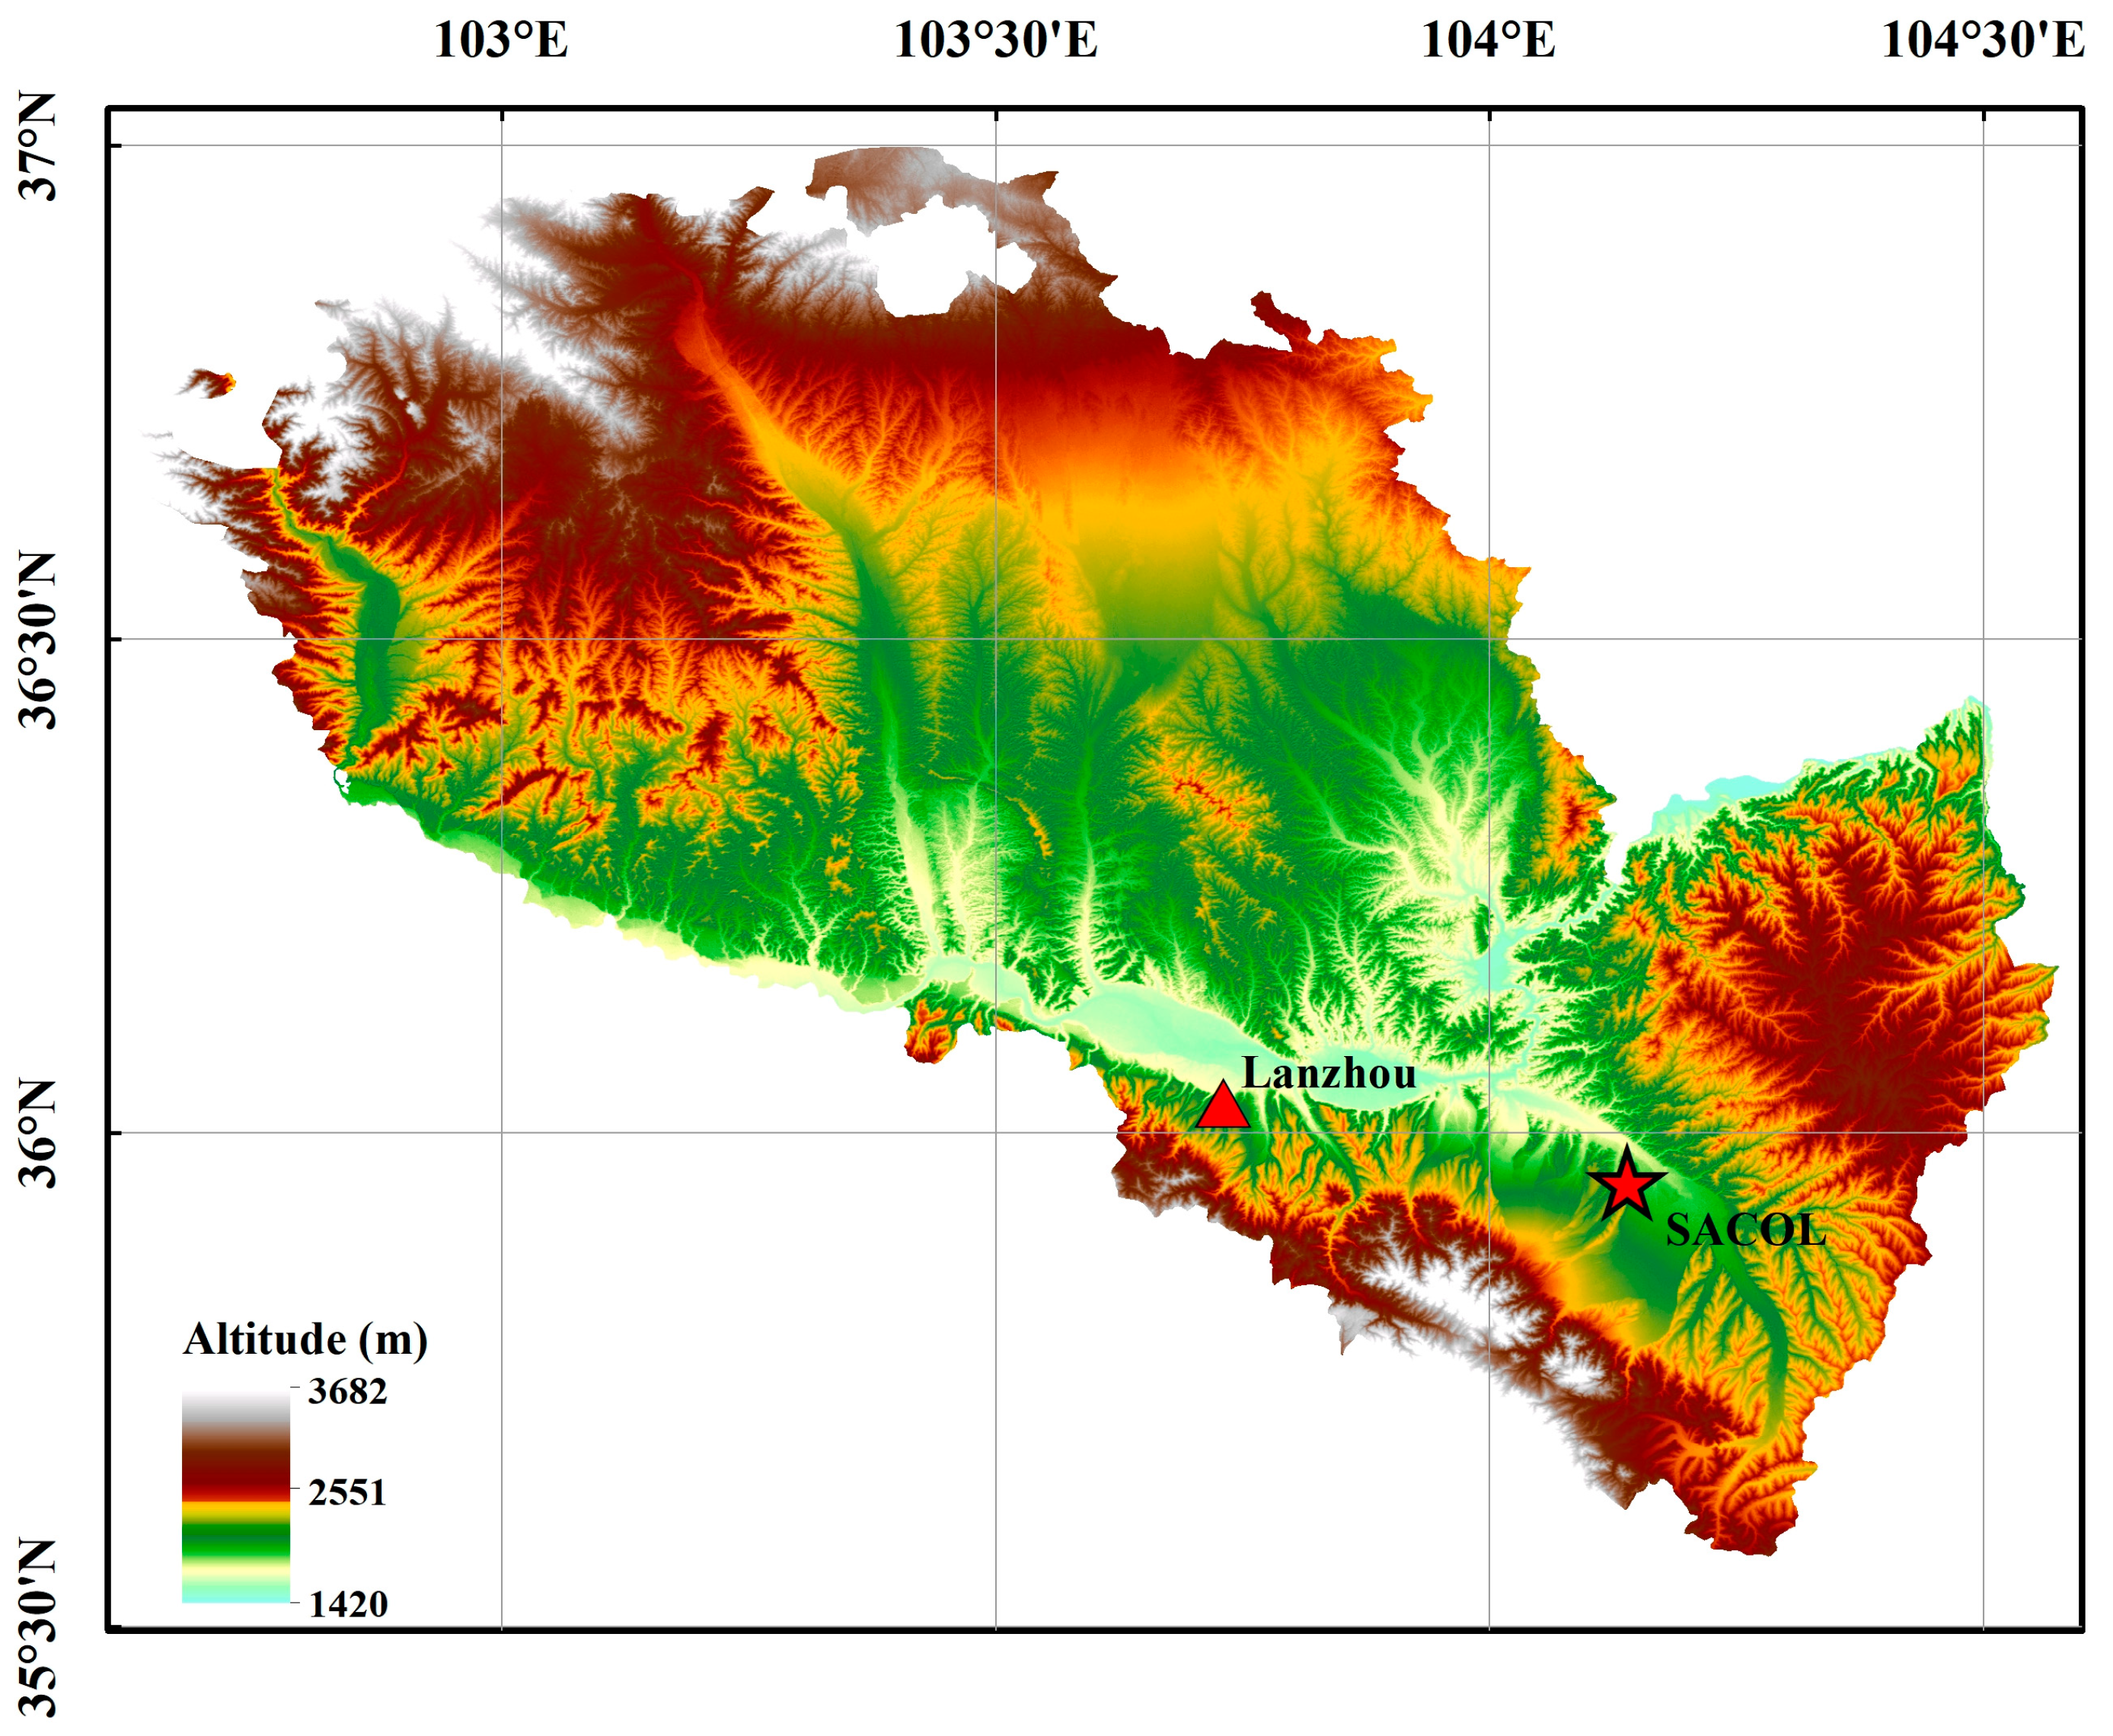
Figure 1. Terrain elevation and location of the observation site (SACOL) in Lanzhou region.
Remotesensing 15 04927 g001
Figure 2. The vertical profiles of seasonally averaged (ad) aerosol extinction coefficient, (eh) particle depolarization ratio and (il) backscatter Ångström exponent in different season (green represents spring, red represents summer, orange represents autumn and blue represents winter). The error bars are the standard deviation.
Remotesensing 15 04927 g002
Figure 3. Frequency distributions of (ad) aerosol extinction coefficient and (eh) depolarization ratio at 0–1 km, 1–2 km, 2–3 km and 3–5 km in different seasons.
Remotesensing 15 04927 g003
Figure 4. The proportion of AOD to total AOD in the height layer 0–2 km, 2–4 km and 4–6 km in different seasons and seasonal mean AOD.
Remotesensing 15 04927 g004
Figure 5. Cluster analysis of backward trajectory of (a) spring, (b) summer, (c) autumn and (d) winter.
Remotesensing 15 04927 g005
Figure 6. Time–height sections of (a) normalized relative backscatter signal and (b) depolarization ratio during the dust event. The red solid line is the PBLH, and the red dashed line is the corresponding three sub-periods in Figure 7.
Remotesensing 15 04927 g006
Figure 7. Vertical profiles of (a) depolarization ratio and (b) extinction coefficient at 17:00 on April 8, 13:00 on April 10 and 19:00 on April 12.
Remotesensing 15 04927 g007
Figure 8. HYSPLIT 48 h backward trajectory simulation started at 00:00 on 9 April 2010 (Beijing Time, UTC+8).
Remotesensing 15 04927 g008
Figure 9. Time series of AOD532, AE440–870 and FMF from 8 April 2010 to 13 April 2010 (Beijing Time, UTC+8).
Remotesensing 15 04927 g009
Figure 10. (a) Aerosol volume size distribution, (b) spectral variation of single scattering albedo (SSA) and (c) aerosol radiative forcing at the bottom of atmosphere (BOA), at the top of atmosphere (TOA) and in the atmosphere (ATM) from AERONET.
Remotesensing 15 04927 g010
Disclaimer/Publisher’s Note: The statements, opinions and data contained in all publications are solely those of the individual author(s) and contributor(s) and not of MDPI and/or the editor(s). MDPI and/or the editor(s) disclaim responsibility for any injury to people or property resulting from any ideas, methods, instructions or products referred to in the content.