Article

Remotely Sensing the Invisible—Thermal and Magnetic Survey Data Integration for Landscape Archaeology

1
Institute for the History of Material Culture, Russian Academy of Sciences, Dvortsovaya Nabereznaya 18, 191186 St. Petersburg, Russia
2
Institute of Earth Sciences, St. Petersburg State University, Universitetskaya Nabereznaya 7/9, 199034 St. Petersburg, Russia
3
Department of Archaeology, University of Sydney, The Quadrangle A14, Sydney 2006, Australia
4
Institute of Archaeological Sciences, University of Bern, Mittelstrasse 43, 3012 Bern, Switzerland
*
Author to whom correspondence should be addressed.
Remote Sens. 2023, 15(20), 4992; https://doi.org/10.3390/rs15204992
Submission received: 23 August 2023 / Revised: 28 September 2023 / Accepted: 10 October 2023 / Published: 17 October 2023
(This article belongs to the Special Issue Application of Remote Sensing in Cultural Heritage Research II)

Abstract

:
Archaeological landscapes can be obscured by environmental factors, rendering conventional visual interpretation of optical data problematic. The absence of evidence can lead to seemingly empty locations and isolated monuments. This, in turn, influences the cultural–historical interpretation of archaeological sites. Here, we assess the potential of integrating thermal and magnetic remote sensing methods in the detection and mapping of buried archaeological structures. The area of interest in an alluvial plain in Tuva Republic makes the application of standard methods like optical remote sensing and field walking impractical, as natural vegetation features effectively hide anthropogenic structures. We combined drone-based aerial thermography and airborne and ground-based magnetometry to establish an approach to reliably identifying stone structures concealed within alluvial soils. The data integration led to the discovery of nine buried archaeological structures in proximity to an Early Iron Age royal tomb, shedding light on ritual land use continuity patterns.

1. Introduction

Large Early Iron Age burial mounds are prominent features in the landscapes of the Eurasian steppes. Their role in the structural organisation of the anthropogenic landscape of the steppe has been a topic of extensive scholarly debate. Large monumental structures have been conceptualized as territorial markers [1], discussed in terms of architectural energetics and power transmission [2], and interpreted as costly signals building up prestige hierarchies and channeling political influence [3,4] (for more details on the discussion, see [5]). Large stone mounds associated with the highest elites of social groups in the Early Iron Age Eurasian steppe are far more than just simple burial structures. They have been identified as complex memorial structures, used by various social groups as places of gathering and commemoration, and for community ritual practices, effectively forming “community centres” for an extended amount of time after construction [6,7]. Over the longue durée, these monuments were nuclei for funerary ritual construction activities of subsequent cultures, heavily influencing the spatial patterns of archaeological landscapes.
The international project exploring one of the earliest royal “Scythian” burial mounds in Tuva (Southern Siberia/Inner Asia, Figure 1, [8]) clearly demonstrated this pattern of prolonged site use. Excavations combined with preliminary magnetometry surveys revealed a complex structure, involving several temporal strata. The central round burial is securely dated by a combination of dendrochronology and radiocarbon dating to the earliest stage of the Scythian period between 830 and 800 BCE [9,10]. The central feature was then surrounded by a series of Early Iron Age stone rings. In its southern periphery, an amorphous accumulation of burials of the Kokel culture formed a necropolis dating to the 2nd–4th centuries CE [11]. Yet later, the area was re-used during Turkic and Kyrgyz times to construct additional burials [12].
This palimpsest of archaeological stone structures was subject to archaeological field research by the project team over several years. The environmental context of the site has been a continuous challenge, both with regards to the visibility of archaeological structures as well as their excavation and documentation (Figure 2). The site is located in an alluvial floodplain of two small rivers, Uyuk and Tunnug, forming a swampy area which is best accessed during winter when the ground is frozen. The placement of this major Early Iron Age monument seems odd, as the ground is not favourable to large construction projects and differs significantly from locations in the rest of the valley where large burial mounds were built. Most large burials are positioned on the more elevated, and therefore dry, left bank of the Uyuk river [13]. The unusual location makes field walking surveys around the site almost impossible due to uneven swampy vegetation which obscures the usual signs of archaeological monuments (Figure 3). Analysis of remote sensing data in the visible spectrum is of little help, since the swamp vegetation in the floodplain frequently forms circular features which are not of anthropogenic origin and thus influence the results of optical remote sensing surveys [14]. Regular field walking surveys are inefficient, since large parts of the plain are inaccessible during much of the year and the features are often invisible on the surface. In most cases, stone structures are almost completely covered with moist alluvial sediments and overgrown with vegetation. The only chance to detect a stone structure in such conditions is to stumble upon it by chance and hit one or two of the stones still sticking out of the soil with one’s foot. Exactly this happened during one of the first seasons of the excavations at the site. Several stones sticking out of the ground were found in the periphery of the site. The following detailed observation of the accessible area showed that at least two additional stone structures were hidden in alluvium and vegetation to the northeast of the main royal burial mound. A short magnetometry survey confirmed this assumption and allowed us to estimate the size and form of those structures. However, given the poor visibility of stone structures in the area, further investigations were necessary.
Addressing the problem with non-invasive remote sensing survey methods in such conditions seemed to be a viable option. The application of remote sensing techniques in the study of archaeological sites is commonly considered an integral part of the research process. In order to obtain a holistic image of the research subject, the ability to operate with comprehensive datasets is crucial for adequate interpretation of a site. However, usually, the combination of several remote sensing methods and following data integration is limited to specific methodological studies and is only occasionally used as an approach in large research projects (cf. [15,16,17,18,19]). During the second field campaign at the site, a variety of remote sensing and geophysical methods were applied to evaluate the archaeological situation in the immediate vicinity of the central burial structure [14]. Among the employed geophysical techniques, magnetometry turned out to be generating the most useful results. Buried or partially buried stone structures were clearly distinguishable as anomalies with high contrast against the water-logged alluvial soil background. This was no surprise, since magnetometry had earlier shown excellent results in the steppe conditions of Southern Siberia and Inner Asia. It was widely used in the identification of burial sites [20,21,22,23,24,25], mapping of settlement structures [26], and discovery of iron production sites [27]. However, the application of ground penetrating radar failed to produce usable results, and geoelectric resistivity measurements only occasionally showed successful detections. The reasons for this lie in the water-logged clay which is present across the site. Water-logged clay only allows for minimal penetration of radar beams. Resistivity measurements show decent results in areas where the archaeological structures are located very close to the surface but unfortunately miss deeper structures [14]. Scaling up the efforts in acquiring magnetometry survey data to understand the larger context of the site thus seemed to be the most favourable option. As an on-ground application of magnetometry was infeasible because both consistent walking and driving on the terrain were impossible, we opted for a drone-based aerial magnetometry survey. This would potentially allow coverage of a much larger area in a single session and overcome the problem with the swampy terrain (cf. [28,29]).
The presence of frozen soil in the area, as well as the humid conditions of the sediments in the AOI, suggested that the heat irradiation could potentially create a good contrast between sediments and stone features (as shown in [30]), allowing for the discernibility of additional archaeological sites. Despite aerial thermography having been used in archaeological surveys under various challenging natural conditions [31,32,33,34,35], it is not a method that is commonly applied in conjunction with aerial magnetometry. We thus decided to apply aerial thermography as the second remote sensing method on this survey to create two datasets which are rarely combined in archaeology.

2. Materials and Methods

2.1. LiDAR and Optical Remote Sensing

Obtaining a detailed DEM of the survey area was the first step. Since no openly available high-resolution DEM databases exist for this part of the earth’s surface, the only way to obtain one was to create it from scratch. We used a UAV DJI Matrice 300 (SZ DJI Technology Co., Ltd., Shenzhen, China) equipped with a DJI Zenmuse L1 LiDAR sensor (for more details on quality assessment of the UAV and L1 payload, see [36,37]). The survey area was defined by using freely available Bing satellite imagery as reference data. The area was located northeast of the main burial mound. The AOI measured 1950 m × 650 m in size. Two flight missions performed at the height of 60 m AGL allowed us to obtain a highly detailed point cloud that was classified via the open source software CloudCompare v2.12.3 using the algorithm provided by Zhang et al. [38]. Subsequently, a DEM was built based on this point cloud in Agisoft Metashape 1.8 software.
The option to acquire visual information via a camera built in the L1 sensor allowed us to create a photogrammetry project and build an orthomosaic used further for reference and comparison purposes. Both projects (LiDAR data and photogrammetry data) were aligned in the WGS 84 coordinate system using the DJI RTK base station and visible ground features as ground control points.

2.2. Airborne Magnetometry

Obtaining high-quality magnetometry data requires slow and steady instrument movement near ground level [39]. Generally available airborne magnetometry solutions based on fixed-wing airplane platforms do not allow for this possibility. Using a multi-rotor platform could, however, solve this problem. We opted for an affordable industrial quadrocopter drone GEOSCAN 401 (Geoscan Group, St. Petersburg, Russia) equipped with a quantum magnetometer. This complex was earlier applied at geoarchaeological research projects in Iron Age steppe contexts in Western Siberia [40,41,42]. The whole set-up consists of a combination of an industrial-grade UAV and a magnetometer with an integrated GNSS system. The UAV specifications are presented in Table 1. The magnetometer consists of a 1.5 m long plastic rod, with a battery and a GNSS antenna with a dual-band navigation chip at its head, and, at its tail, the measuring instrument: a quantum optically pumped rubidium magnetometer, Geoshark MG30GM. The specifications are listed in Table 2. The whole construction is connected to the UAV platform via a 20 m long tether and is operated independently of the UAV. This solution allows us to avoid measures usually required to eliminate the interference from the metal parts of the drone [43]. One major drawback of this solution is the constant turbulence of the instrument, resulting in possible orientation problems, as discussed in [44]. The rolling amplitude immediately after turns is especially high when the movement of the instrument follows a rather harsh sinusoidal pattern, gradually diminishing as the UAV follows a straight line. A possible solution to this problem was found by limiting the maximal speed of the UAV—optimal speeds (below 7 m/s) which only produced a minimal roll effect. The speeds were determined experimentally. Operating at such speeds did not result in extreme sensor angles and kept the gathered data within industry standards ([44], pp. 466–467).
Diurnal variations of the Earth’s magnetic field were measured with the same version of magnetometer—the twin device being able to work in both modes—as a variation station and as a main measuring device. Post-processing of raw data was done in Geoscan’s software Geoshark v.1.1; diurnal variations were subtracted using Oasis montaj by Seequent [45,46]. Raster grids were generated in Golden Software Surfer from databases exported from Oasis montaj. Using satellite navigation solves the problem of geopositioning the measurements and allows us to quickly and easily obtain a general picture of the survey area. One remark should be added concerning the magnetometer measurement frequency, which is equal to 1000 Hz. The GNSS device takes 10 measurements per second. During post-processing, every coordinated point receives a mean magnetic field value in the range of 0.1 s. This approach allows for better reproducibility and data integrity.
Several survey missions were performed using this set of equipment consecutively, following the integration pipeline described in the method integration section.

2.3. Airborne Thermography

A control method had to be chosen to interpret the magnetometry data. General humid conditions of the alluvial substrate led us to hypothesize that aerial thermography could provide good results, showing sharp distinctive anomalies for stone structures in the evening [47]. A DJI Zenmuse H20T camera was chosen as a high-end payload for the same DJI Matrice 300 UAV platform we used to conduct the LiDAR survey. The camera characteristics are presented in Table 3.
The thermographic survey was conducted by means of a photogrammetry mission performed with the thermal camera. Data collection was performed approximately 60 min after observed sunset (cf. [30]). The flight height AGL was 30 m; automated serial photography ensured data consistency. Every thermal photo was referenced in the WGS 84 coordinate system using the DJI D-RTK2 GNSS base station. Collected data were processed in the Agisoft Metashape v.2.0.1 photogrammetry software, and a thermal orthomosaic was obtained.

2.4. Methods Integration Pipeline

The magnetometric equipment we used allowed us to obtain quick and easily processed data, but was designed for large area surveys with geological features (such as minerals deposits) in mind. Detecting more subtle and small-sized archaeological features required the creation of a specific workflow. The whole survey process was set up in five consecutive stages.
1. LiDAR survey, DEM, and orthophoto generation of the plain northeast of the main burial mound: The DEM was required for detailed magnetometry mission planning. Both the DEM and orthophoto were analysed prior to geophysical missions and used for planning and comparison.
2. Magnetometric airborne survey of a larger area: Based on the DEM obtained from the LiDAR survey, the most elevated part of the plain northeast of the main burial mound, limited by paleochannels visible on the orthophoto (Figure 4, bottom), was chosen. The goal was to obtain a general overview of the area, confirm the visibility of the two known stone structures to airborne magnetometry, and allow for limiting further surveys to a smaller area. The survey grid was created with a step of ca. 5 m between the flight lines; the elevation of the magnetometer AGL was 10 m; and the speed limit was set to 7 m/s.
3. Thermographic airborne survey of a smaller area: A limited area with possible anomalies detected was surveyed with aerial thermography with the purpose of confirming the presence of subsurface stone structures and further limiting the survey area.
4. The area selected based on thermal data was again surveyed with aerial magnetometry, this time opting for maximum available data resolution. The survey grid step was 2 m; the elevation AGL, 7 m; and the speed limit, 3 m/s.
5. Detailed inspection of the detected anomalies was performed with a ground survey, using the same magnetometer as a hand-held device. The grid step in the walking missions was limited to 0.5 m. The edge points of the survey areas were set out using a total station. The objective of the ground magnetic survey was to check the results obtained during the aerial mission and test the reliability of the aerial measurements, as well as to obtain higher spatial detail of the discovered features through obtaining larger magnetic responses by having the instrument closer to the ground and using a denser grid.
All collected data after post-processing were visualised in raster formats and integrated using the QGIS 3.28 software. All further analysis was performed by means of basic QGIS functions.

3. Results

3.1. LiDAR and Orthophoto

The LiDAR survey was the starting point for further planning and general terrain analysis. It allowed the creation of a dense point cloud (over 400 million points). The elevation model built on these data after classification had a resolution of 5.46 cm/px; the orthophoto generated by photogrammetry had a resolution of 2.57 cm/px (Figure 4). The elevated part of the floodplain stretching from the main site to the northeast is clearly visible on the DEM. At the same time, the LiDAR survey shows no elevation changes in areas of expected stone. Application of different filtering methods to the point cloud in an attempt to eliminate the steppe vegetation disturbances did not yield any better results. This clearly supports the initial impression that almost no features of the stone structures can be identified on the ground and that the features are homogeneously covered with alluvial sediments, and consequently are discernible only by geophysical methods.

3.2. Airborne Magnetometry

Three levels of detail were obtained using aerial magnetometry. The general picture obtained during the first mission demonstrates two kinds of patterns (Figure 5, top): The first is easy to identify and sharp—these anomalies are clearly associated with known stone structures, one of them being especially prominent. The best visible anomaly corresponds to one of the two stone kurgans discovered and surveyed in a previous campaign. The anomalies are found in the northern part of the surveyed area. The second, fuzzier, kind of pattern that can be observed over the whole magnetogram is related to ancient waterbeds and paleochannels surrounding the site. Comparison with the orthophoto shows a high level of correspondence between visible paleochannels and the vague signatures of water channels. The sinusoidal patterns of rolling is an important problem to discuss here. These wavy patterns are typical for the magnetometer hanging down on a 20 m long tether. They are clearly visible here and, although minimised by UAV speed control, they could not be completely eliminated during fieldwork or post-processing. Obviously, this is a drawback of the used equipment and should be taken into account when working with the same device further. We conducted the survey when wind speeds were very low, but we did not specifically measure them. It can therefore not be ruled out that there is a minimal influence of these environmental variables on our data. The minor air movements which might have occurred during the survey should, however, not change the broad picture of subsurface anomalies.
The second, more detailed, magnetogram shows very distinctive anomalies (Figure 5, bottom). This level of detail is very helpful for site identification because it allows us to define the boundaries of the site. It also makes a preliminary identification of archaeological features possible.
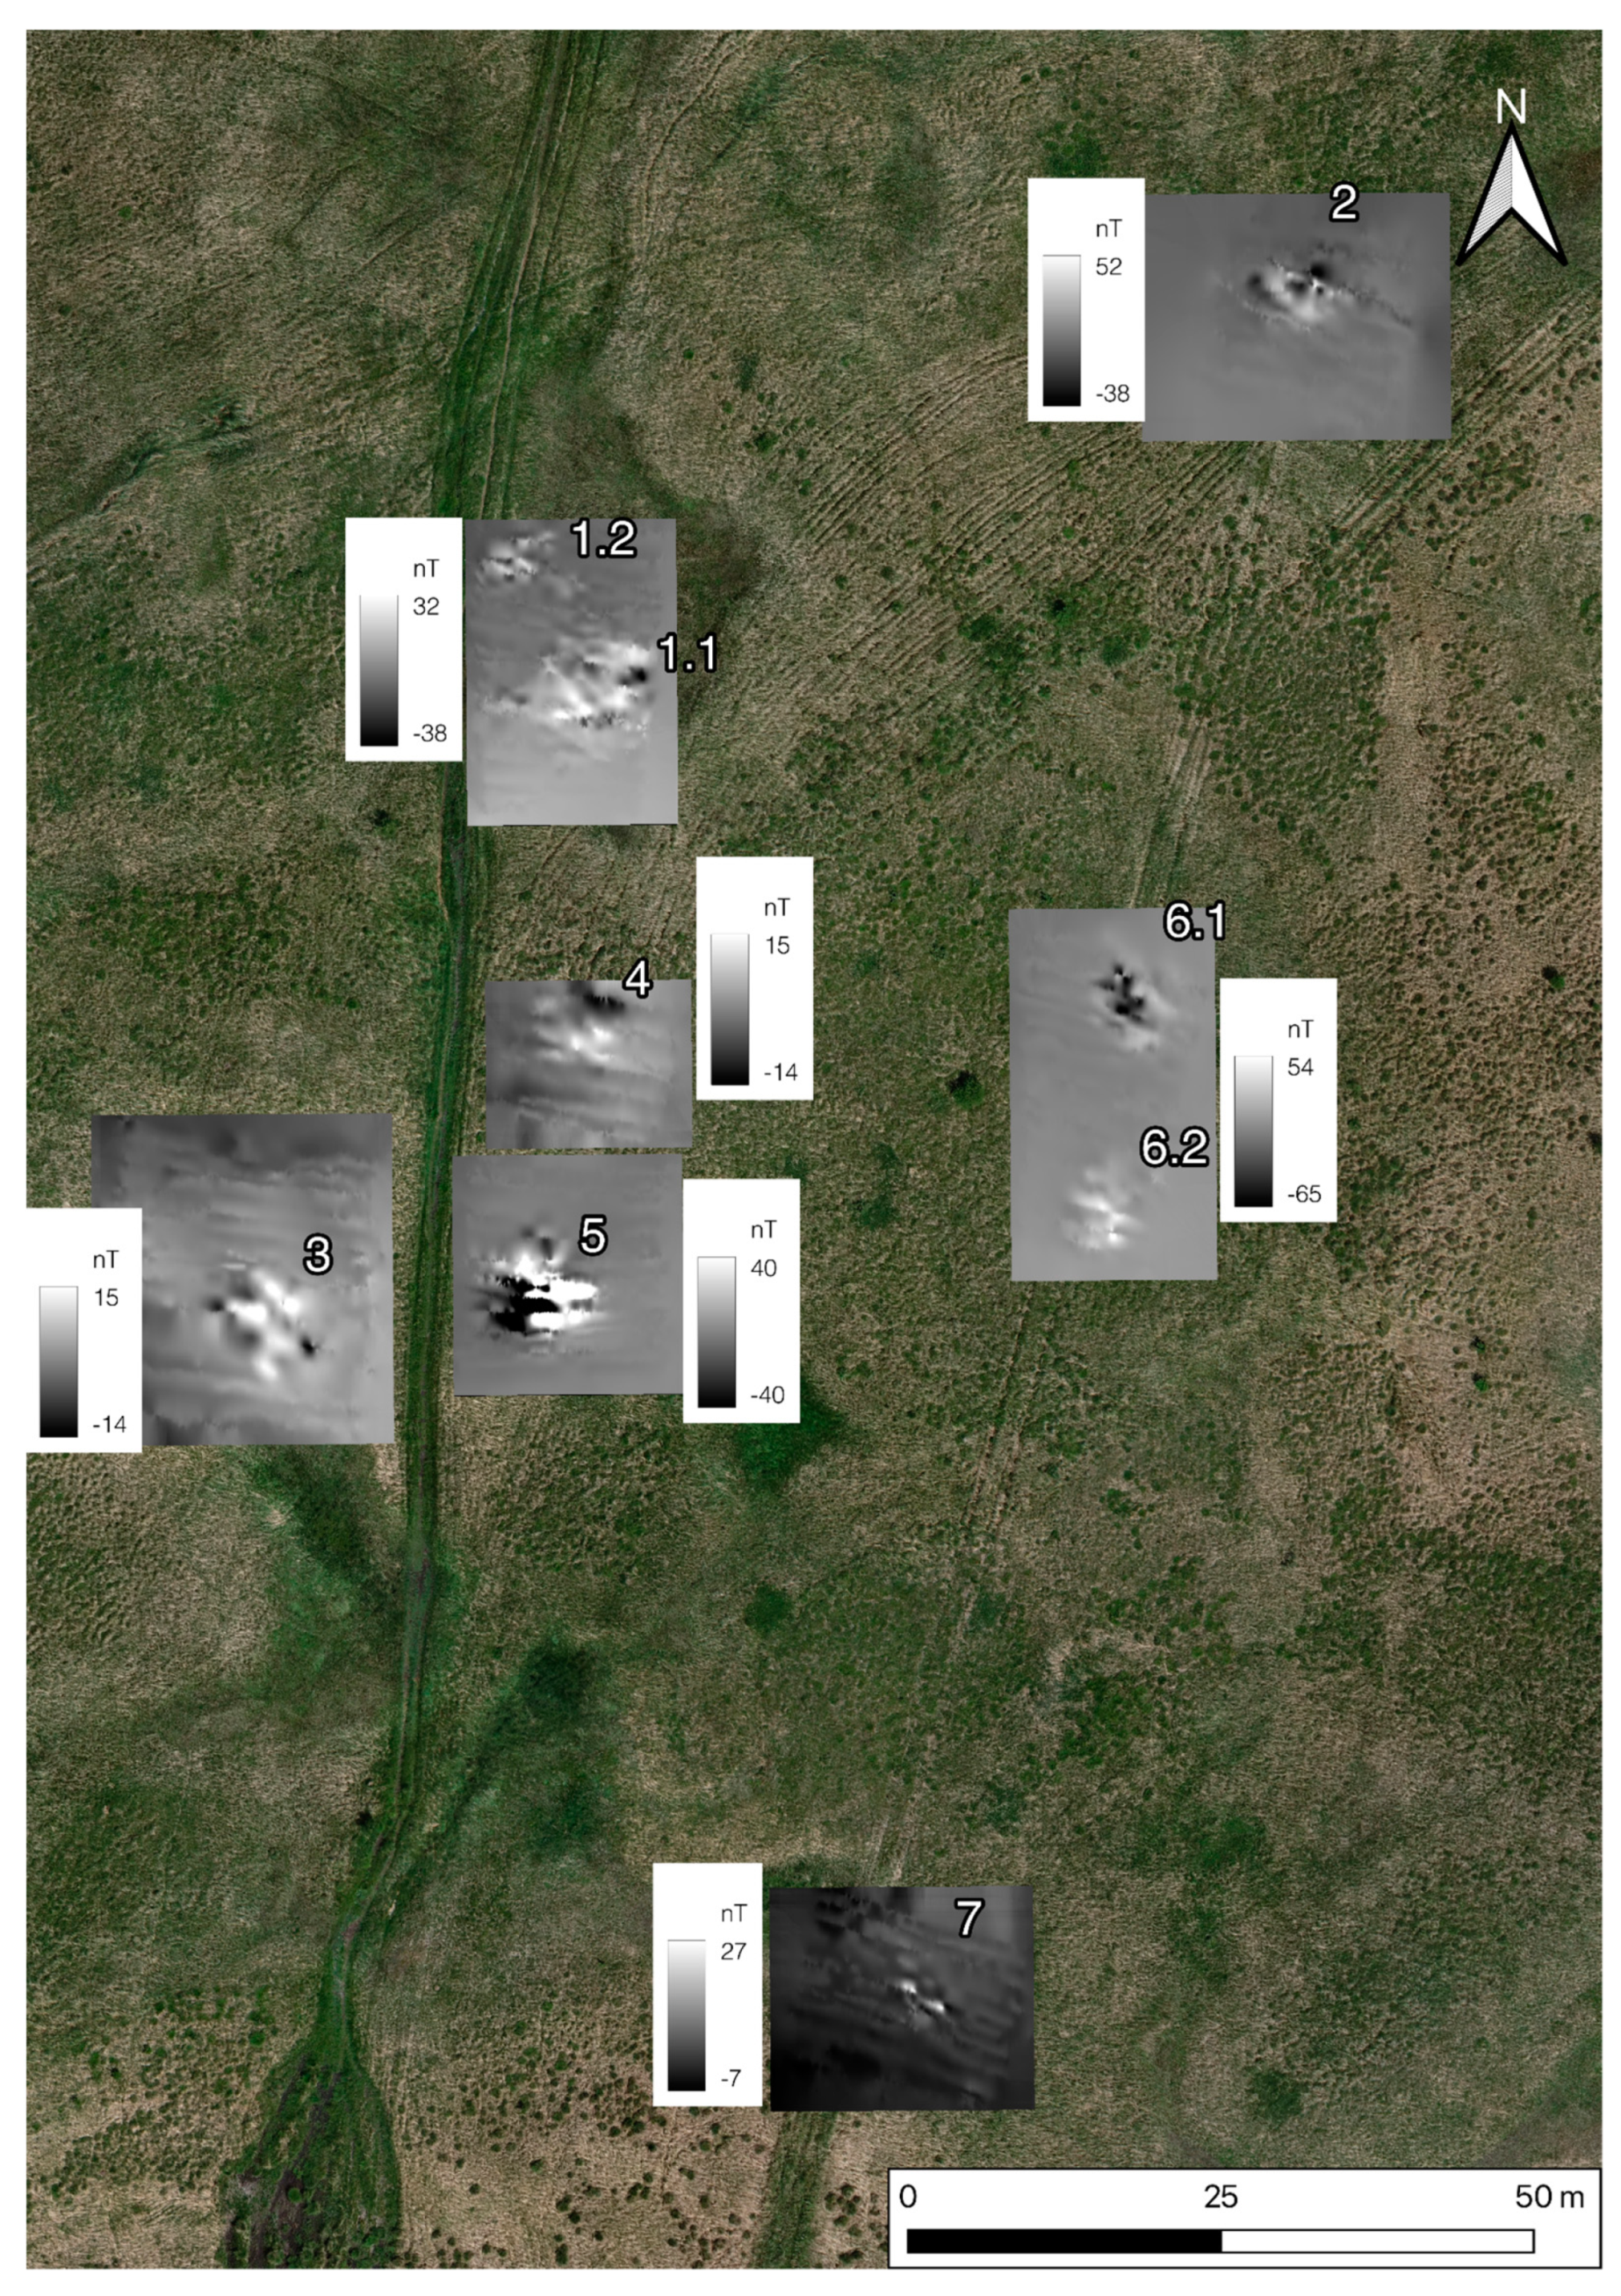
The third set of data is represented by individual ground surveys of each anomaly detected before (Figure 6). This is the highest level of detail achieved with the equipment used in our experiments. A clear distinction of a feature form is possible with this approach. In the case of area 1, we can discern two separate features (one square and one circular) located close to each other.

3.3. Airborne Thermography

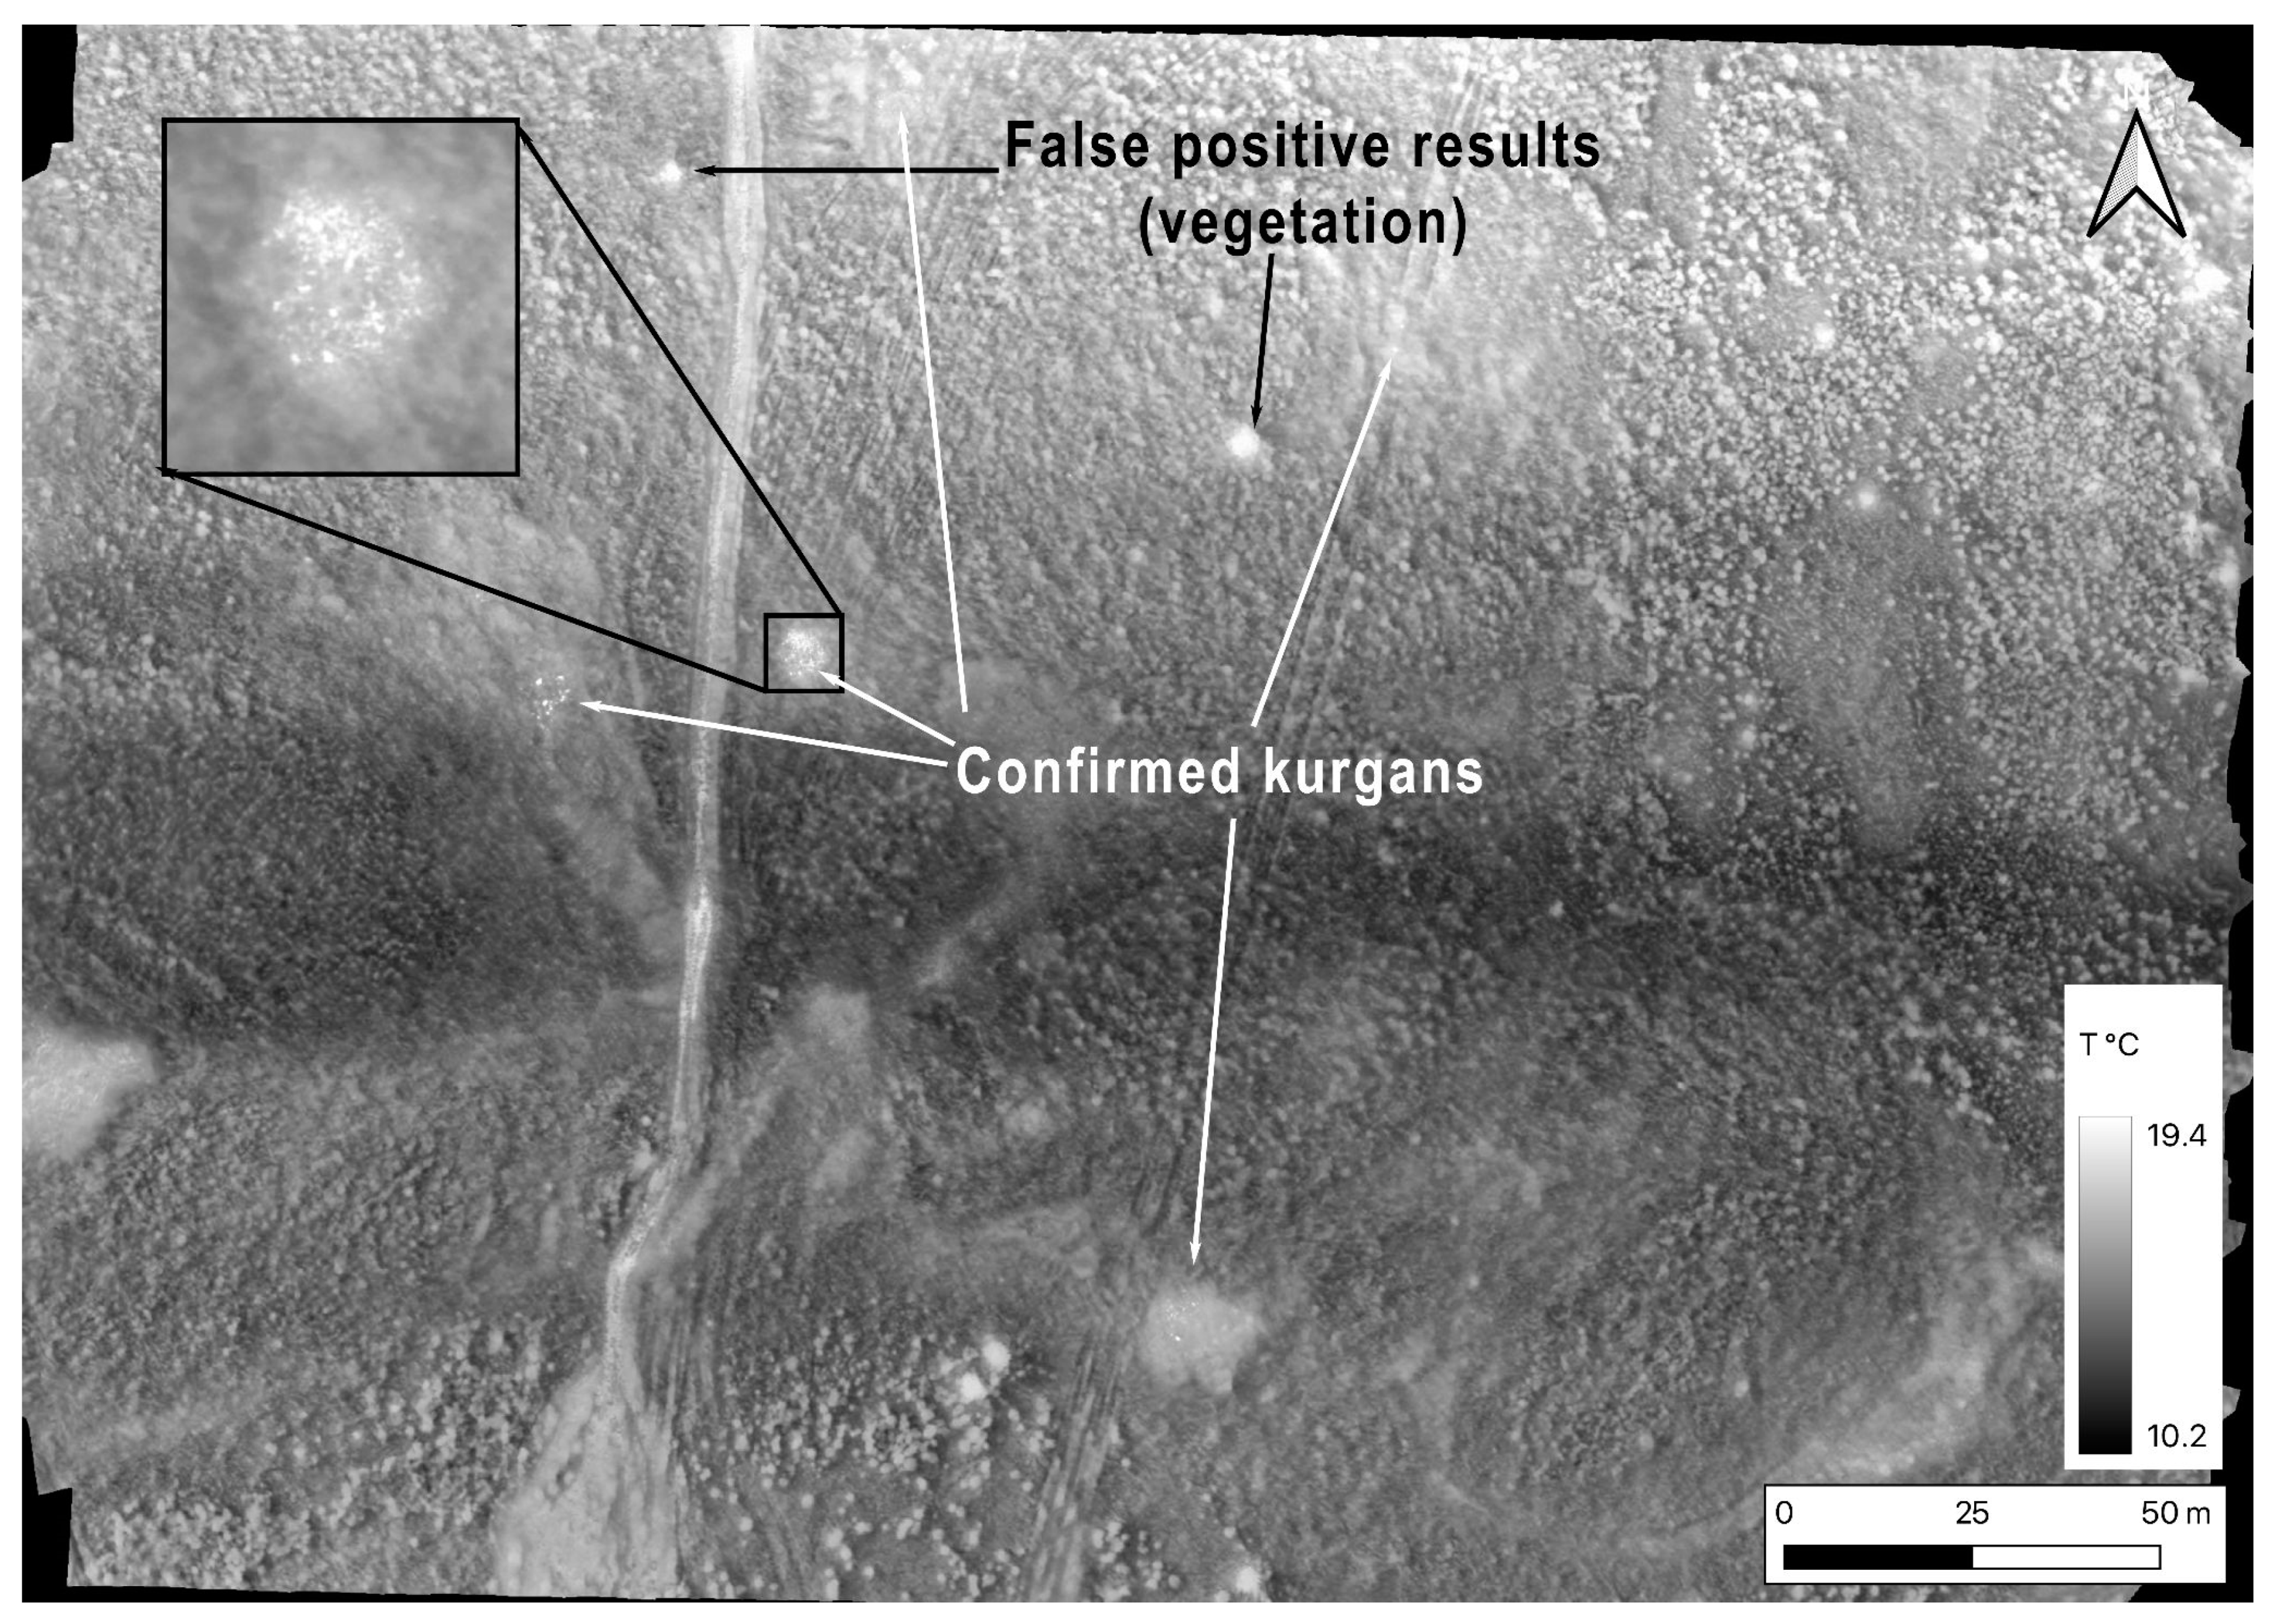
The thermal orthomosaic created in Agisoft Metashape v. 2.0.1 software showed a high discernibility of thermal anomalies (Figure 7). The results seem to correlate with the deposition depth. In cases where some stones can be observed directly on the surface—indicating that the feature is only slightly covered with alluvial sediment—the thermal image shows a full stone-setting, allowing us to identify the shape of single stone blocks. The site lies in an area of extreme continental climate with rapid and large changes in temperatures between night and day. The stone structures store heat during the day and cool down more slowly in the evening hours (when the survey was conducted) than the vegetation above it. In some cases, the features reliably identified on the magnetogram are absent on the thermal image. This could be explained by a deeper position of the stones below the surface. The results of the thermal survey are slightly obscured by false positives—some of the visible anomalies are not archaeological features. In most cases, these false positive results could be easily identified as vegetation—bushes growing in the area show higher thermal emissivity than the grass. All of these cases can be clearly sorted out by closer inspection of the anomaly. True positive results appear as a concentration of stone shapes. Even if the main feature does not fully appear on the image, at least some stones show their form and are recognisable. The bushes, on the contrary, appear as a monolithic mess of foliage and can be unmistakably distinguished.

4. Discussion

The first survey stage (aerial magnetometry at 7 m AGL) could reveal one clear structure and several disputable ones. The clearly visible structure is identical with the burial mound that was discovered during ground walking as several stones accumulated in the grass—apparently, this is by far the most visible archaeological structure in the AOI. The second magnetometry mission, combined with the thermal survey, provided a much more detailed view of the AOI and confirmed the presence of several previously unknown archaeological structures in the area, based on the first survey stage data. The third survey stage—using regular traditional field walking with the magnetometer—resulted in detailed form definition of the hidden features. These data can already be used for archaeological interpretations and excavation planning (Figure 8).
Even further detail can be obtained by integration of several of these scales. Figure 9 demonstrates the results of raster multiplication in QGIS, using thermal emissivity data and anomalous magnetic field data from the detailed aerial survey stage.
In our case, the choice of methods, exact process of their integration, and application sequence were determined by experiment and consecutive trials in the field. Overcoming the difficulties in UAV operation was a challenge, as the built-in options in the control station do not allow us to regulate speed directly. Therefore, ways around the limitation had to be found to be able to fully control the drone. Speed limits could not be adjusted in the planning software version available at the time of the survey, and building flight paths with additional flight control points had to be used. The frequency of flight control points influenced the automatically programmed speed of the drone and efficiently controlled the actual speed once the dependency was established during initial experiments. In spite of these minor drawbacks, using an integrated solution has a major advantage over constructing improvised combinations of a drone and lightweight magnetometer. Working with a factory-built platform allows us to spare a lot of effort during field work preparation, avoid unexpected problems, and concentrate on methodology and mission planning. As our experience during this research shows, a pertinent choice of methodological approach and consistently built process can provide sufficient detail and quality of data even when using survey equipment within the usually clear budgetary constraints of archaeological field surveys.
When the research project on the site Tunnug 1 started in 2017, one of the most intriguing questions was the location of the site in the unwelcoming environment of a swampy floodplain. We accepted the logical assumption expressed by most archaeologists working in the region, that this unusual position indicates the early date of the burial mound, probably its construction being followed by a catastrophic event that caused all later royal tombs to be constructed on the higher left bank of the Uyuk river. However, the discovery of later stone features in close proximity to the burial mound indicated that the area was subject to extensive reuse for at least two millennia after the central structure was built. This observation stands in clear contradiction with the idea of a catastrophic abandonment of the place. The return of different cultural communities to this anthropogenic landscape marker and the construction of additional monuments would hardly have been possible if modern hydrological conditions were also those of the past. The discovery of yet another burial ground in the same area continues to challenge the assumption of a sudden change in location deemed suitable for royal tombs in the early Iron Age. Detailed geomorphological research of the evolution of environmental conditions in the Uyuk valley is still underway. It would be premature to make far-reaching deductions based solely on limited archaeological data. But it cannot be neglected that available observations imply an extensive site usage during a considerable timespan beyond the Early Iron Age. To explain how this would be possible, a detailed geoarchaeological reconstruction is required. The available data suggest that the site and its surroundings were accessible both on horseback and on foot for centuries. However, the initial results of the current geoarchaeological research show that the floodplain stayed humid during most of its history [48]. Consequently, for the time being, we need to shift to a middle-ground hypothesis that the site was accessible in the periods after its construction, but was still too wet for regular usage. If this premise is confirmed by further research, an explanation for constant reuse will be necessary. Possible arguments could be: (1) subsistence strategies including horse grazing in wetland conditions. The rich grass vegetation of the floodplain providing ample fodder might have been considered worth taking a difficult path through marshy terrain; or (2) the site continuously playing an important cultural role in the semantics of this landscape, thus being constantly re-incorporated into cultural practices of later periods.
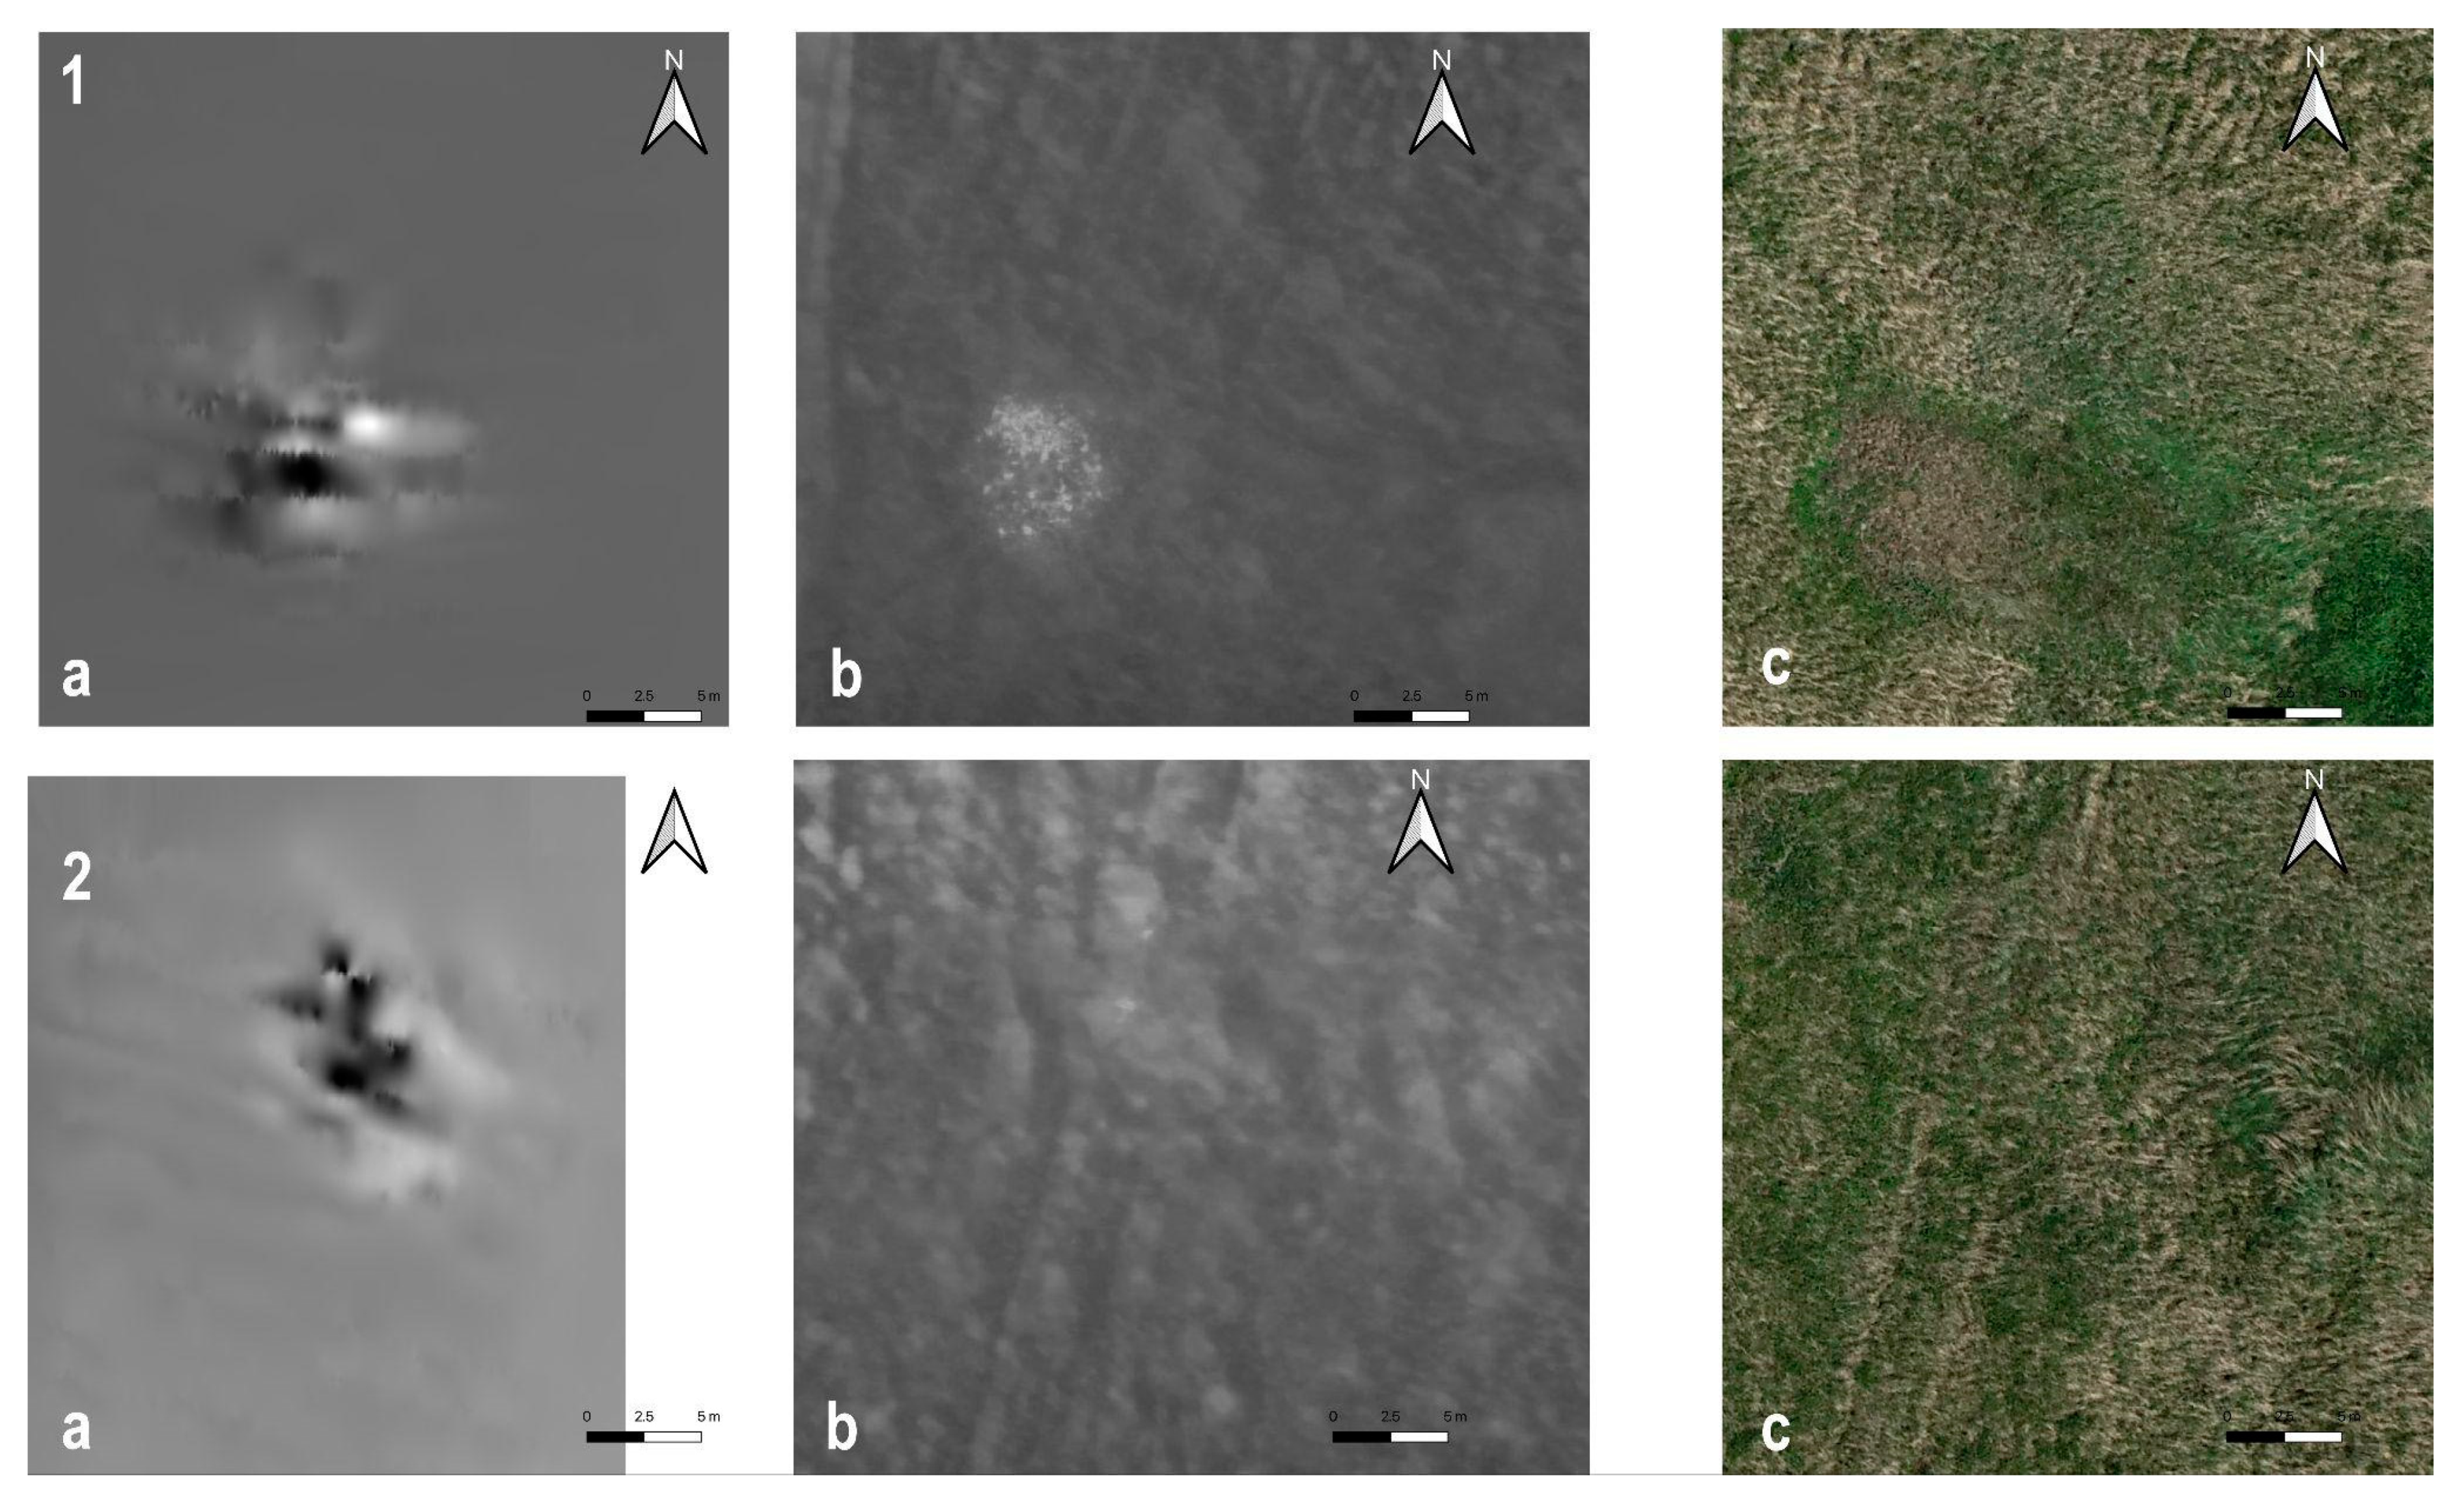
Further research and geophysical prospection of the plain around the kurgan is needed. The results of the LiDAR and orthophoto data analysis show that the floodplain of the Uyuk valley can hide complex anthropogenic stone structures with absolutely no visible surface traces (see comparisons of different datasets in Figure 8). The stone structures are located at different depths, and geophysical surveys of varying resolution are essential to obtain a clear picture. Here it is necessary to take into account the limitations imposed by the choice of equipment: the rubidium magnetometer is in many aspects not the best option for archaeological prospection. It was chosen mainly for two reasons: because of its full integration with an available drone platform as well as because it could be unmounted from the drone and used for ground walking surveys. An additional reason was the limited budget of our research campaign, making the current approach an affordable option. Following a consistent methodological process allowed us to generate data which were detailed enough to create a valuable addition to the interpretation of the archaeological landscape of the Uyuk Valley.

5. Conclusions

It can be argued that large-scale application of the presented approach can reveal new insights into the hidden landscape features of the area. Only consistent method integration and using several spatial scales of survey can provide satisfactory results—in our case, we used LiDAR and orthophotos for initial analysis and mission planning, aerial magnetometry and thermography for cross-checking, and several scales of magnetometry survey for gradually limiting the area in order to zero in on feature location. A burial ground consisting of at least nine stone structures was located and mapped in a hard-to-access, low-visibility area of the Uyuk floodplain (Figure 10).
The fact that several archaeological structures are confirmed in close proximity to the Tunnug 1 burial mound speaks against the royal mound being an isolated monument and that the floodplain of the Uyuk valley saw a more extensive funerary ritual use over a prolonged period of time. This needs further exploration in terms of including larger areas in the survey as well as explaining the possibilities of wetland exploitation as part of nomadic subsistence strategies or landscape use. Obtaining more empirical data is the next step. The methodology described here can be easily applied to larger areas of the floodplain with minimal adjustments. The method and data integration in this article shows how seemingly “empty” parts of the landscape still might contain archaeological features which are important for the interpretation of cultural dynamics and change our view of well-researched sites.
In conclusion, it should be noted that every single method in the conditions of the floodplain would return insufficient results if used on its own. Analysing solely a high-resolution DEM or optical data did not provide any information on the hidden structures at all. Planning and interpretation of airborne magnetometer missions would be impossible without the support of a DEM and orthophotos. Standards for aerial magnetometry are currently still in the making, but significant progress is being made [49]. The thermal imagery proved to be useful in independently confirming the anomalies based on a different characteristic. Thermal imagery, unfortunately, does not reveal deeper-lying structures and does not allow for initial area planning. However, it is an indispensable contextualization for the interpretation of the magnetometry results. Using different spatial scales of the magnetometry survey allowed us to efficiently cover a larger survey area and uncover the characteristics of individual monuments in different levels of detail. The results necessary for an archaeologically valuable interpretation can, in this case, only be achieved through method and data integration.

Author Contributions

Conceptualization, J.K.B., T.R.S. and G.C.; methodology, J.K.B.; software, E.A.P. and J.K.B.; validation, J.K.B. and E.A.P.; formal analysis, J.K.B.; investigation, J.K.B. and T.R.S.; resources, G.C.; data curation, J.K.B. and E.A.P.; writing—original draft preparation, J.K.B., G.C., and E.A.P.; writing—review and editing, G.C.; visualization, J.K.B. and G.C.; supervision, J.K.B., G.C., and T.R.S.; project administration, J.K.B., G.C., and T.R.S.; funding acquisition, J.K.B., G.C., and T.R.S. All authors have read and agreed to the published version of the manuscript.

Funding

T.R.S. and J.K.B. were funded within the framework of the Programs of Fundamental Scientific Research of the Russian Academy of Sciences, State Assignments No. FMZF-2022-0014 and FMZF-2022-0016, respectively. The European Space Agency supplied high-resolution satellite data, under the Project Start-Up id. 54058, to G.C.

Data Availability Statement

All relevant data are contained within the article. Raw data are available upon request.

Conflicts of Interest

The authors declare no conflict of interest.

References

  1. Renfrew, C. Monuments, Mobilization and Social Organization in Neolithic Wessex. In Man, Settlement and Urbanism; Ucko, P., Tringham, R., Dimbleby, R., Eds.; Duckworth: London, UK, 1973. [Google Scholar]
  2. Abrams, E.M.; Bolland, T.W. Architectural Energetics, Ancient Monuments, and Operations Management. J. Archaeol. Method Theory 1999, 6, 263–291. [Google Scholar] [CrossRef]
  3. Wright, J. The Honest Labour of Stone Mounds: Monuments of Bronze and Iron Age Mongolia as Costly Signals. World Archaeol. 2017, 49, 547–567. [Google Scholar] [CrossRef]
  4. Wright, J. Prehistoric Mongolian Archaeology in the Early 21st Century: Developments in the Steppe and Beyond. J. Archaeol. Res. 2021, 29, 431–479. [Google Scholar] [CrossRef]
  5. Caspari, G. Quantifying Ritual Funerary Activity of the Late Prehistoric Southern Kanas Region. Asian Perspect. 2020, 59, 421–452. [Google Scholar] [CrossRef]
  6. Chugunov, K. The Discontinuity of Construction of the “Royal” Memorials of Tuva and the Chronology of the Early Scythian Time. In Terra Scythica; Institute of Archaeology and Ethnography: Novosibirsk, Russia, 2011; pp. 358–369. [Google Scholar]
  7. Chugunov, K.V. “Royal” Burial-Commemorative Complexes of Tuva: Some Results and Research Prospects. In The Eurasian Steppe Cultures and Their Interaction with Ancient Civilizations; St. Petersburg, Russia, 2012. [Google Scholar]
  8. Caspari, G.; Sadykov, T.; Blochin, J.; Hajdas, I. Tunnug 1 (Arzhan 0)—An Early Scythian Kurgan in Tuva Republic, Russia. Archaeol. Res. Asia 2018, 15, 82–87. [Google Scholar] [CrossRef]
  9. Caspari, G.; Sadykov, T.; Blochin, J.; Bollinger, M.; Szidat, S. New Evidence for a Bronze Age Date of Chariot Depictions in the Eurasian Steppe. Rock Art Res. 2020, 37, 53–58. [Google Scholar]
  10. Sadykov, T.; Caspari, G.; Blochin, J. Kurgan Tunnug 1—New Data on the Earliest Horizon of Scythian Material Culture. J. Field Archaeol. 2020, 45, 556–570. [Google Scholar] [CrossRef]
  11. Sadykov, T.; Caspari, G.; Blochin, J.; Lösch, S.; Kapinus, Y.; Milella, M. The Kokel of Southern Siberia: New Data on a Post-Xiongnu Material Culture. PLoS ONE 2021, 16, e0254545. [Google Scholar] [CrossRef]
  12. Chan, A.; Sadykov, T.; Blochin, J.; Hajdas, I.; Caspari, G. The Polymorphism and Tradition of Funerary Practices of Medieval Turks in Light of New Findings from Tuva Republic. PLoS ONE 2022, 17, e0274537. [Google Scholar] [CrossRef]
  13. Caspari, G. Mapping and Damage Assessment of “Royal” Burial Mounds in the Siberian Valley of the Kings. Remote Sens. 2020, 12, 773. [Google Scholar] [CrossRef]
  14. Caspari, G.; Sadykov, T.; Blochin, J.; Buess, M.; Nieberle, M.; Balz, T. Integrating Remote Sensing and Geophysics for Exploring Early Nomadic Funerary Architecture in the “Siberian Valley of the Kings”. Sensors 2019, 19, 3074. [Google Scholar] [CrossRef] [PubMed]
  15. Wilkinson, T.J. Archaeological Landscapes of the Near East; University of Arizona Press: Tucson, AZ, USA, 2003. [Google Scholar]
  16. Kvamme, K.L. Integrating Multidimensional Geophysical Data. Archaeol. Prospect. 2006, 13, 57–72. [Google Scholar] [CrossRef]
  17. Green, A.S.; Orengo, H.A.; Alam, A.; Garcia-Molsosa, A.; Green, L.M.; Conesa, F.; Ranjan, A.; Singh, R.N.; Petrie, C.A. Re-Discovering Ancient Landscapes: Archaeological Survey of Mound Features from Historical Maps in Northwest India and Implications for Investigating the Large-Scale Distribution of Cultural Heritage Sites in South Asia. Remote Sens. 2019, 11, 2089. [Google Scholar] [CrossRef]
  18. Laugier, E.J.; Casana, J. Integrating Satellite, UAV, and Ground-Based Remote Sensing in Archaeology: An Exploration of Pre-Modern Land Use in Northeastern Iraq. Remote Sens. 2021, 13, 5119. [Google Scholar] [CrossRef]
  19. Garcia-Molsosa, A.; Orengo, H.A.; Petrie, C.A. Reconstructing Long-Term Settlement Histories on Complex Alluvial Floodplains by Integrating Historical Map Analysis and Remote-Sensing: An Archaeological Analysis of the Landscape of the Indus River Basin. Herit. Sci. 2023, 11, 141. [Google Scholar] [CrossRef]
  20. Gorka, T.; Fassbinder, J.W. Classification and Documentation of Kurgans by Magnetometry. In Proceedings of the Archaeological Prospection, Extended Abstracts, 9th International Conference on Archaeological Prospection, Izmir, Turkey, 19–24 September 2011; pp. 183–186. [Google Scholar]
  21. Fassbinder, J.; Gorka, T.; Chemyakina, M.; Molodin, V.; Parzinger, H.; Nagler, A. Prospecting of Kurgans by Magnetometry: Case Studies from Kazakhstan, Siberia and the Northern Caucasus; The State Heremitage Publishers: St. Petersburg, Russia, 2013; pp. 50–57. [Google Scholar]
  22. Oleszczak, Ł.; Przybyła, M.M.; Pieńkos, I.; Chugunov, K.V.; Zhogova, N.A. The Magnetic Survey of the Early Scythian Burial Site and Settlements in the Turan-Uyuk Valley in Tuva. Acta Archaeol. Carpathica 2020, 55, 343–368. [Google Scholar] [CrossRef]
  23. Ardelean, A.C.; Sărășan, A.; Bălărie, A.; Akmatov, K.; Tabaldiev, K.; Wehrheim, R. Above Ground and Underground—An Integrated Approach of the Burial Mounds within the Suusamyr Plateau, Kyrgyzstan. Archaeol. Res. Asia 2023, 35, 100463. [Google Scholar] [CrossRef]
  24. Epov, M.I.; Molodin, V.I.; Manshtein, A.K.; Balkov, E.V.; Dyad’kov, P.G.; Matasova, G.G.; Kazansky, A.Y.; Bortnikova, S.B.; Pozdnyakova, O.A.; Karin, Y.G.; et al. Integrated Archeological and Geophysical Studies in West Siberia. Russ. Geol. Geophys. 2016, 57, 473–482. [Google Scholar] [CrossRef]
  25. Epov, M.I.; Chemyakina, M.A. Geophysical Methods in the Research of Archaeological Sites in Western Siberia and Altai: Results and Perspectives. ArchéoSciences 2009, 33, 271–274. [Google Scholar] [CrossRef]
  26. Becker, H.; Fassbinder, J.W. Magnetometry of a Scythian Settlement in Siberia near Cicah in the Baraba Steppe 1999. ICOMOS–Hefte Dtsch. Natl. 1999, 33, 168–172. [Google Scholar]
  27. Brosseder, U.; Pohl, E.; Tseveendorzh, D.; Munkhbayar, L.; Osinska, A.; Linzen, S. The Innovation of Iron and the Xiongnu—A Case Study from Central Mongolia. Asian Archaeol. 2023, 7, 29–61. [Google Scholar] [CrossRef]
  28. Stele, A.; Linck, R.; Schikorra, M.; Fassbinder, J.W.E. UAV Magnetometer Survey in Low-Level Flight for Archaeology: Case Study of a Second World War Airfield at Ganacker (Lower Bavaria, Germany). Archaeol. Prospect. 2022, 29, 645–650. [Google Scholar] [CrossRef]
  29. Schmidt, V.; Becken, M.; Schmalzl, J. A UAV-Borne Magnetic Survey for Archaeological Prospection of a Celtic Burial Site. First Break 2020, 38, 61–66. [Google Scholar] [CrossRef]
  30. Cool, A.C. Aerial Thermography in Archaeological Prospection: Applications & Processing. Ph.D. Thesis, University of Arkansas, Fayetteville, AR, USA, 2015. [Google Scholar]
  31. Lundén, B. Aerial Thermography—A Remote Sensing Technique Applied to Detection of Buried Archaeological Remains at a Site in Dalecarlia, Sweden. Geogr. Ann. Ser. Phys. Geogr. 1985, 67, 161–166. [Google Scholar]
  32. Carlomagno, G.M.; Maio, R.D.; Fedi, M.; Meola, C. Integration of Infrared Thermography and High-Frequency Electromagnetic Methods in Archaeological Surveys. J. Geophys. Eng. 2011, 8, S93. [Google Scholar] [CrossRef]
  33. Casana, J.; Kantner, J.; Wiewel, A.; Cothren, J. Archaeological Aerial Thermography: A Case Study at the Chaco-Era Blue J Community, New Mexico. J. Archaeol. Sci. 2014, 45, 207–219. [Google Scholar] [CrossRef]
  34. Walker, S. Low-Altitude Aerial Thermography for the Archaeological Investigation of Arctic Landscapes. J. Archaeol. Sci. 2020, 117, 105126. [Google Scholar] [CrossRef]
  35. Waagen, J.; Sánchez, J.G.; Van Der Heiden, M.; Kuiters, A.; Lulof, P. In the Heat of the Night: Comparative Assessment of Drone Thermography at the Archaeological Sites of Acquarossa, Italy, and Siegerswoude, The Netherlands. Drones 2022, 6, 165. [Google Scholar] [CrossRef]
  36. Štroner, M.; Urban, R.; Línková, L. A New Method for UAV Lidar Precision Testing Used for the Evaluation of an Affordable DJI ZENMUSE L1 Scanner. Remote Sens. 2021, 13, 4811. [Google Scholar] [CrossRef]
  37. Diara, F.; Roggero, M. Quality Assessment of DJI Zenmuse L1 and P1 LiDAR and Photogrammetric Systems: Metric and Statistics Analysis with the Integration of Trimble SX10 Data. Geomatics 2022, 2, 254–281. [Google Scholar] [CrossRef]
  38. Zhang, W.; Qi, J.; Wan, P.; Wang, H.; Xie, D.; Wang, X.; Yan, G. An Easy-to-Use Airborne LiDAR Data Filtering Method Based on Cloth Simulation. Remote Sens. 2016, 8, 501. [Google Scholar] [CrossRef]
  39. Fassbinder, J.W.E. Magnetometry for Archaeology. In Encyclopedia of Geoarchaeology; Gilbert, A.S., Ed.; Encyclopedia of Earth Sciences Series; Springer: Dordrecht, The Netherlands, 2023; pp. 499–514. ISBN 978-94-007-4827-9. [Google Scholar]
  40. Balkov, E.; Karin, Y.; Pozdnyakova, O.; Dyadkov, P.; Goglev, D. The Aul-Koshkul-1 Cemetery in the Baraba Forest-Steppe: Findings of a Multidisciplinary Study. Archaeol. Ethnol. Anthropol. Eurasia 2022, 50, 138–146. [Google Scholar]
  41. Balkov, E.V.; Karin, Y.G.; Pozdnyakova, O.A.; Dyadkov, P.G. Modern Unmanned Technology in Archaeogeophysical Studies. Eng. Min. Geophys. 2020, 2020, 1–11. [Google Scholar] [CrossRef]
  42. Pozdnyakova, O.A.; Balkov, E.V.; Dyadkov, P.G.; Marchenko, Z.V.; Grishin, A.E.; Evmenov, N.D. Integrative Geophysical Studies at the Novaya Kurya-1 Cemetery in the Kulunda Steppe. Archaeol. Ethnol. Anthropol. Eurasia 2022, 49, 69–79. [Google Scholar] [CrossRef]
  43. Zheng, Y.; Li, S.; Xing, K.; Zhang, X. Unmanned Aerial Vehicles for Magnetic Surveys: A Review on Platform Selection and Interference Suppression. Drones 2021, 5, 93. [Google Scholar] [CrossRef]
  44. Walter, C.A.; Braun, A.; Fotopoulos, G. Impact of Three-Dimensional Attitude Variations of an Unmanned Aerial Vehicle Magnetometry System on Magnetic Data Quality: Impact of Attitude Variations on Magnetic Data. Geophys. Prospect. 2019, 67, 465–479. [Google Scholar] [CrossRef]
  45. Geosoft Oasis Montaj. Data Processing and Analysis Systems for Earth Science Applications, Version 8.3.3; Geosoft Inc.: Toronto, ON, Canada, 2015. [Google Scholar]
  46. Mohamed, A.; Ella, E.M.A.E. Magnetic Applications to Subsurface and Groundwater Investigations: A Case Study from Wadi El Assiuti, Egypt. Int. J. Geosci. 2021, 12, 77–101. [Google Scholar] [CrossRef]
  47. Casana, J.; Wiewel, A.; Cool, A.; Hill, A.C.; Fisher, K.D.; Laugier, E.J. Archaeological Aerial Thermography in Theory and Practice. Adv. Archaeol. Pract. 2017, 5, 310–327. [Google Scholar] [CrossRef]
  48. Bronnikova, M.A.; Chugunov, K.V.; Sadykov, T.R.; Panin, A.V. Reconstruction of the environment of Turan-Uyuk depression in the Scythian time according to paleosoils research of Chinge-Tey-I and Tunnug-1 burial-memorial complexes. In Eurasia from the Eneolithic (Chalcolithic) Era to the Early Middle Ages (Innovations, Contacts, Transmission of Ideas and Technologies); Institute for the History of Material Culture RAS: St. Petersburg, Russia, 2022; pp. 220–223. [Google Scholar]
  49. Stele, A.; Kaub, L.; Linck, R.; Schikorra, M.; Fassbinder, J.W. Drone-based magnetometer prospection for archaeology. J. Archaeol. Sci. 2023, 158, 105818. [Google Scholar] [CrossRef]
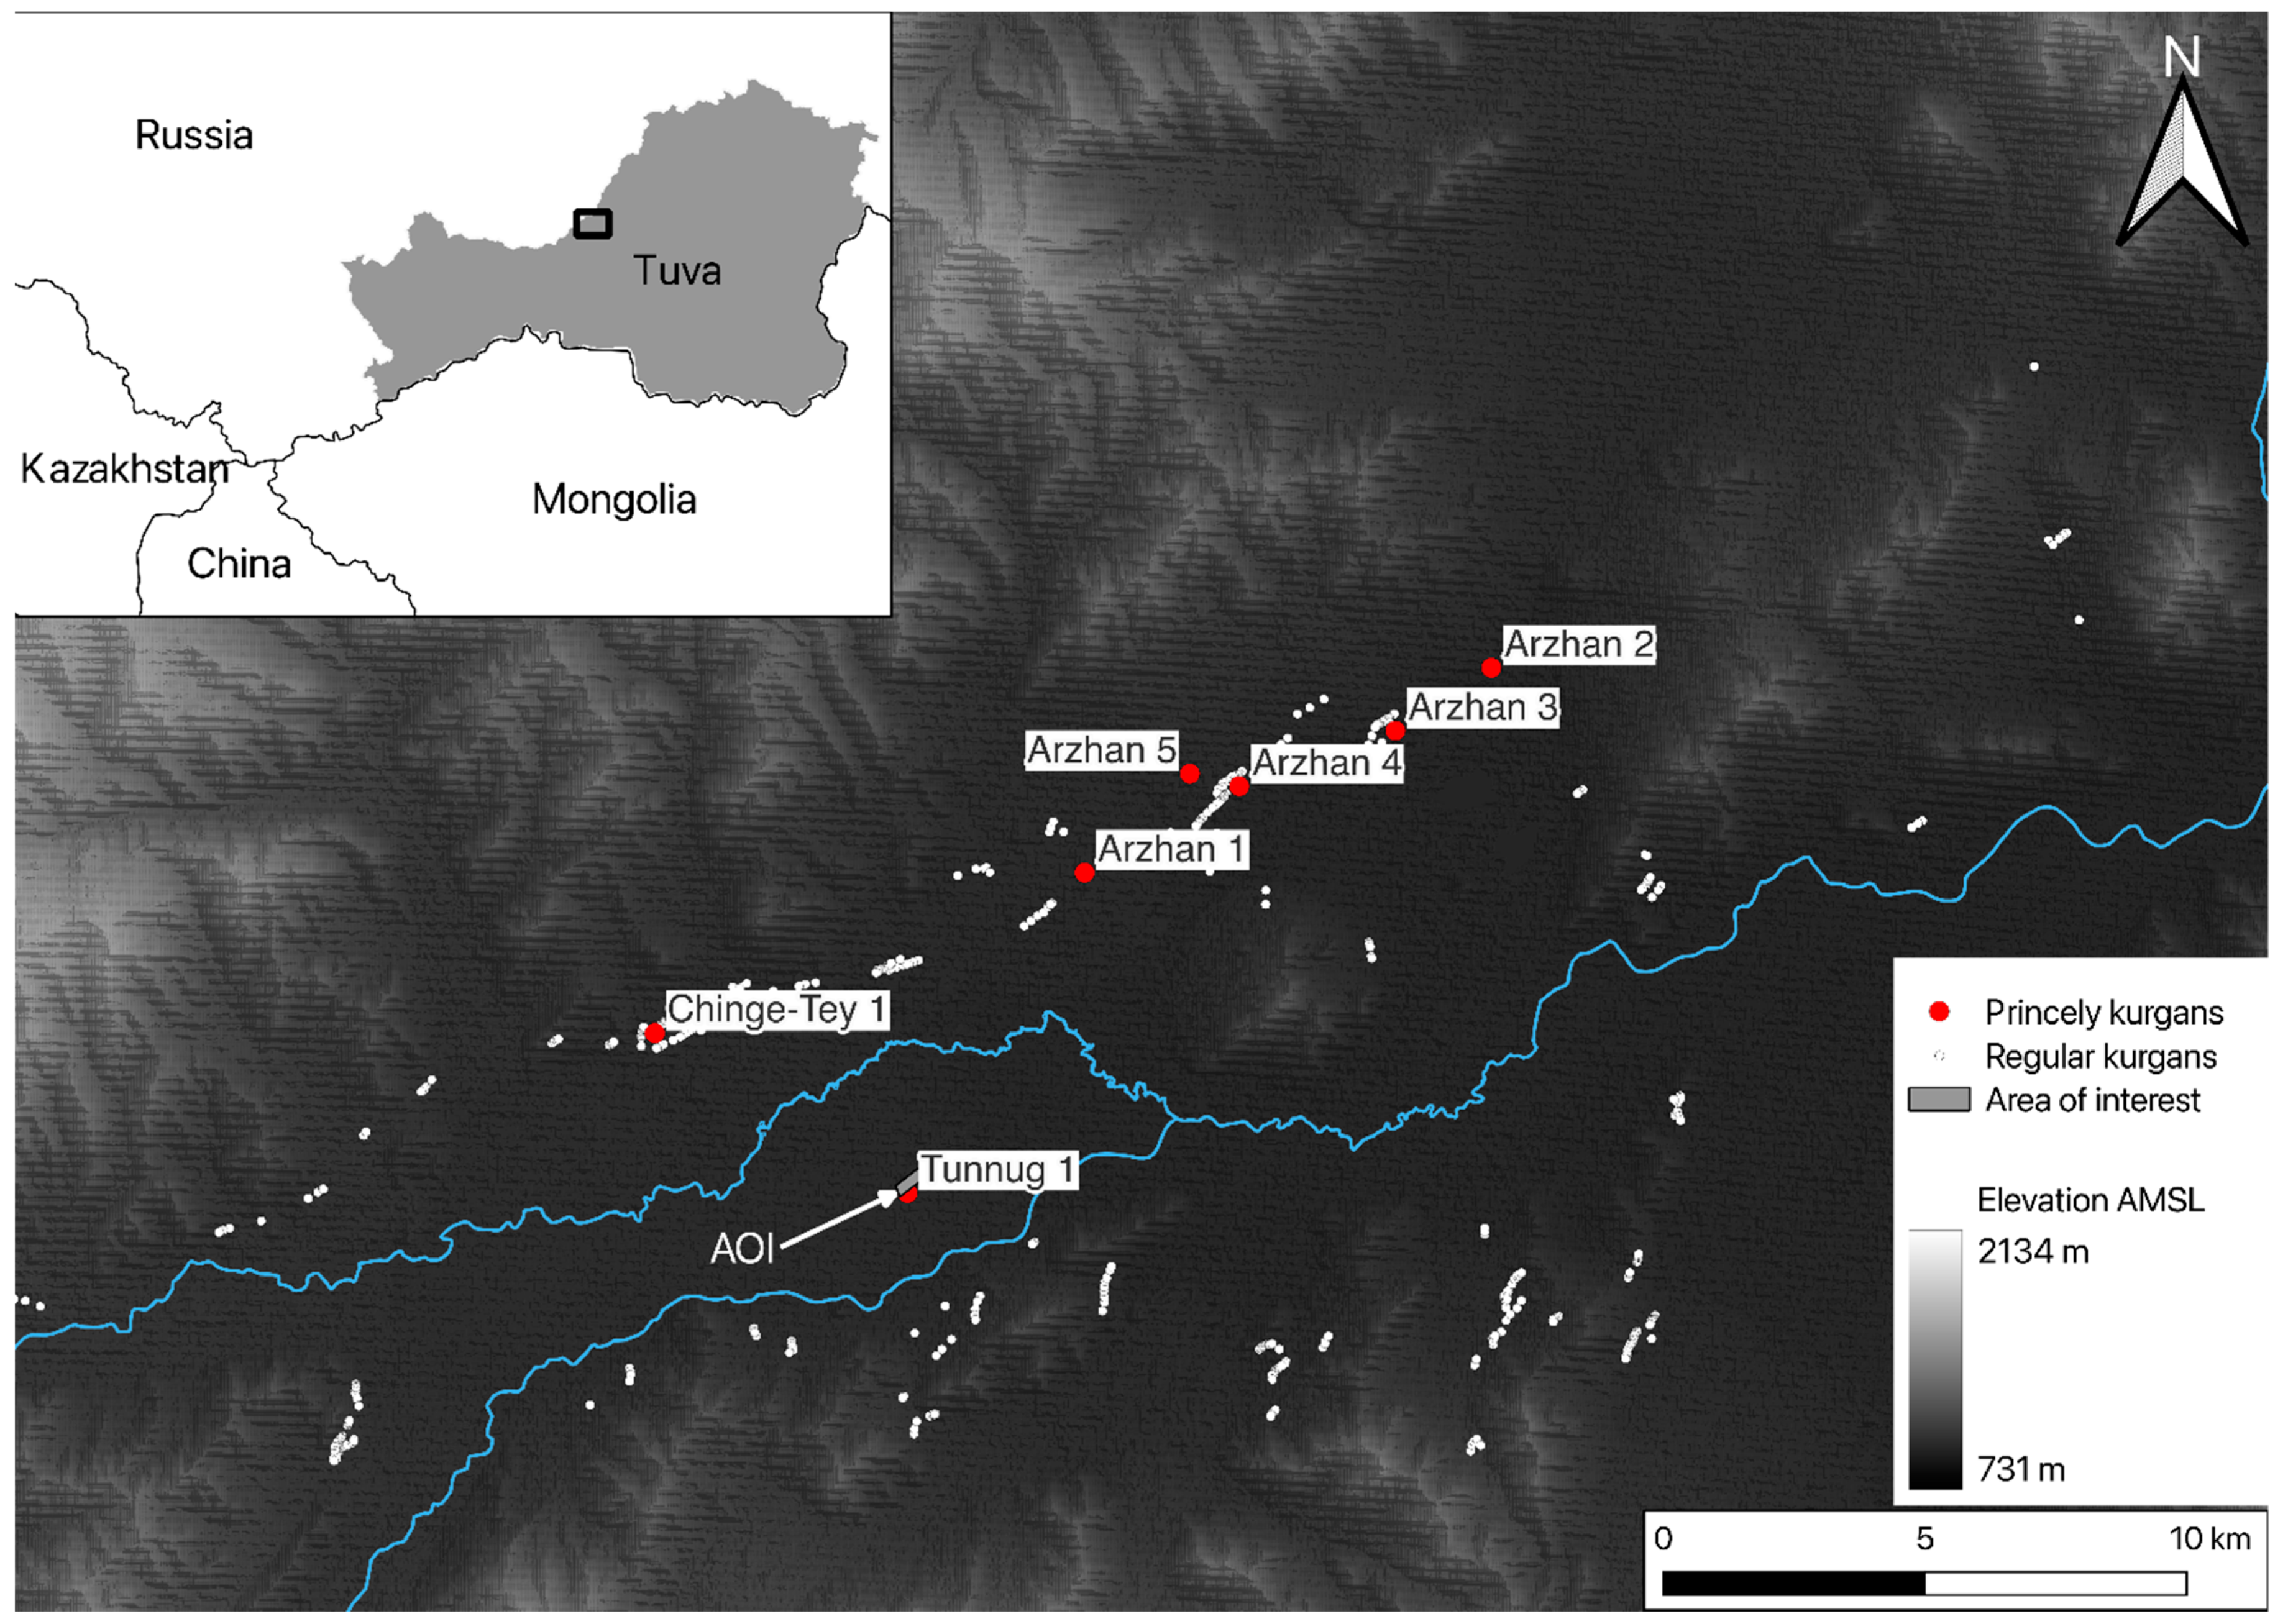
Figure 1. The location of the site in the context of southern Siberia. The Uyuk valley contains one of the largest concentrations of monumental burial mounds from the Early Iron Age (basemap—SRTM 1 arcsecond data).
Remotesensing 15 04992 g001
Figure 2. (Top) High-resolution WorldView-2 imagery (pansharpened) illustrating the difference in visibility of monuments on the arid steppe with arrows indicating individual burial mounds (bottom right) and the plethora of natural circular features in the swampy floodplain (top left). (Bottom) A general overview of the survey area demonstrating the low visibility and heterogeneous vegetation.
Remotesensing 15 04992 g002
Figure 3. (Left)—oblique view of a surveyed feature. Photograph created in maximum visibility conditions in early May. (Right) View of a similar stone mound excavated in the southern periphery of Tunnug 1.
Remotesensing 15 04992 g003
Figure 4. LiDAR (top) and visible spectrum imagery (bottom) of the floodplain area northeast of Tunnug 1.
Remotesensing 15 04992 g004
Figure 5. Anomalous magnetic field ∆Ta, airborne mission data: general overview mission (top), high-detail mission (bottom), scales in nT.
Remotesensing 15 04992 g005
Figure 6. Anomalous magnetic field ∆Ta in ground survey areas, scales in nT.
Remotesensing 15 04992 g006
Figure 7. Thermal anomaly map. True and false positive results indicated. Stone shapes are easily recognised on the image.
Remotesensing 15 04992 g007
Figure 8. Comparison of individual features: Top Row (1): feature 5, located close to the surface; Bottom Row (2): feature 6, a deeply buried structure. (a) magnetometry data, (b) thermal data, (c) aerial photo (visible spectrum).
Remotesensing 15 04992 g008
Figure 9. Through multiplying the resulting rasters of magnetic and thermal remote sensing data, the visibility of buried stone structures becomes better and identification is improved, except in the case of structure 4 (Compare with Figure 6).
Remotesensing 15 04992 g009
Figure 10. Overview map of newly discovered burial accumulation and the royal Early Iron Age tomb in the bottom left. Nine new structures have been identified through combining magnetometry and thermography.
Remotesensing 15 04992 g010
Table 1. UAV Geoscan 401 specifications.
Flight time:up to 40–45 min (with magnetometric equipment)
Max. route length:22 km (per flight)
Wind resistance:12 m/s
Cruise speed:up to 50 km/h
Dimensions:While folded: 70 × 25 × 20 cm
Ready-to-flight: 150 × 150 × 43 cm
Min. safe flight altitude:above 25 m
Max. flight altitude:500 m
Operating temperatures:from −20 to +40 °C
(optional expansion up to −40 °C is possible)
Motors:4, electric, brushless
Take-off:vertically, automatically, from platform 5 × 5
Table 2. Geoshark MG30GM magnetometer specifications.
Sensitivity1 pT/√HZ
Measurement range20,000 nTl–100,000 nTl
General deviation error<0.3 nTl
Measurement frequency1000 Hz
Feedback loop bandwidth30 Hz
Sensor angle range±45°
Operating temperature rangefrom −20 to +40 °C
Table 3. DJI Zenmuse H20T thermal camera characteristics.
SensorUncooled VOx Microbolometer
LensDFOV: 40.6°
Focal length: 13.5 mm (equivalent: 58 mm)
Aperture: f/1.0
Focus: 5 m to ∞
Digital Zoom1×, 2×, 4×, 8×
Video Resolution640 × 512 @ 30 Hz
Video FormatMP4
Image Resolution640 × 512
Image FormatR-JPEG (16 bit)
Pixel Pitch12 μm
Spectral Band8–14 μm
Sensitivity (NETD)≤50 mK @ f/1.0
Disclaimer/Publisher’s Note: The statements, opinions and data contained in all publications are solely those of the individual author(s) and contributor(s) and not of MDPI and/or the editor(s). MDPI and/or the editor(s) disclaim responsibility for any injury to people or property resulting from any ideas, methods, instructions or products referred to in the content.