Article

Assessing the Allometric Scaling of Vectorized Branch Lengths of Trees with Terrestrial Laser Scanning and Quantitative Structure Modeling: A Case Study in Guyana

1
School of Earth and Space Sciences, Peking University, Beijing 100871, China
2
Foundation Department, Shanxi Agricultural University, Taigu 030801, China
*
Author to whom correspondence should be addressed.
Remote Sens. 2023, 15(20), 5005; https://doi.org/10.3390/rs15205005
Submission received: 25 July 2023 / Revised: 28 September 2023 / Accepted: 3 October 2023 / Published: 18 October 2023

Abstract

:
Allometric scaling is closely related to the morphology, function and behavior of trees, which are of great significance to the study of ecology. However, most of the traditional allometric scaling studies used the scalar attributes of trees, without considering the 3D vector mode of tree growth. In order to investigate the allometric relationships between branch lengths in 3D vector mode, in this study, an accurate and detailed quantitative structure model was used to reconstruct tree architectures from 3D point cloud data collected by terrestrial laser scanning and extract the structural parameters of each branch (length, branching level and zenith angle). The standardized major axis was used to establish and analyze the scalar and vector allometric relationships between branch lengths. Our results show that at the same branching level and using the same allometric model, the scaling exponents between the lengths of branches and the lengths of cumulative child (descendant) branches (no matter whether the lengths are in scalar or vector form) are similar among trees, and there is no significant difference between the scaling exponents of most trees. And the scaling exponents between the lengths of the horizontal components of branches and the cumulative lengths of the horizontal components of the child (descendant) branches are much larger than those between the lengths of the vertical components of branches and the cumulative lengths of vertical components of the child (descendant) branches. At different branching levels, the scaling exponents between the lengths of branches and the cumulative lengths of descendant branches tend to decrease with the increase in the branching level. The allometric models in terms of the cumulative lengths of horizontal components of the child (descendant) branches and the allometric models in terms of the cumulative lengths of child (descendant) branches have similar model accuracy and scaling exponents. The study results of allometric relationships between tree branch lengths in 3D mode are of great importance for understanding the crown morphology and the branching rule, which is helpful to further understand the growth strategies and adaptation mechanisms of trees and explain the growth and development mechanisms of trees from a physiological perspective.

1. Introduction

As a common phenomenon, the allometric growth of trees has attracted more and more attention. In recent years, with the increasing impact of ecological and climate change on forests and trees, the importance of allometric growth research has become more and more prominent [1,2,3,4,5,6], and it has become an important component of forest ecology research. The allometric theory describes the disproportionate scaling of different parts of an organism [1,7] and often uses power laws to characterize growth patterns, which is convenient for measuring the sizes of parts that are usually difficult to measure. The power-law models can be described as allometric scaling equations in the form Y = a X b , where Y or X is an attribute (in this study, tree branch length), a is a normalization constant (intercept in a log–log plot), and b is a scaling exponent (slope in a log–log plot).
Branches are carriers of leaves, flowers and other organs. The topology of branches determines the tree crown architecture and directly affects light capture, water transport, mechanical support and wind resistance [8]. Therefore, it is very important to understand the topological relationship between tree branches, and a simple and effective method may be to study the allometric relationship between the lengths of tree branches. The establishment of the allometric relationship between branches at different branching levels plays an important role in understanding the tree crown morphology and branching law [9] and helps to further understand the growth strategies and adaptation mechanisms of trees, as well as to explain the growth and development mechanisms of trees from a physiological perspective. In addition, the branch size of a tree also plays an important role in the study of the forest carbon budget [10] and the estimation of the branch volume. Hence, it is very meaningful to study the allometric relationship between the lengths of tree branches. However, an accurate measurement of branch information is key to the establishment of the allometric relationship. The traditional method of acquiring branch information is to conduct destructive experiments on trees and obtain data by manual measurements. This method is time-consuming and highly labor-intensive and is susceptible to human or non-human influences. Therefore, establishing the allometric relationship between branches becomes particularly difficult when obtaining a huge amount of data from traditional measurements. However, the development of terrestrial laser scanning (TLS) technology could fill this gap in obtaining the branch information.
TLS can obtain the three-dimensional coordinates of the target surface by sending laser pulses [11], providing a new method for the non-destructive and objective acquisition of tree structures [12,13,14]. Several studies have successfully used TLS to extract tree attributes such as tree diameter [15], height [10] and crown structural properties [16]; classify species [17,18]; and estimate biomass [15]. To quickly and accurately extract more detailed topological or structural properties from the TLS point cloud, quantitative structure model (QSM) (e.g., TreeQSM [19], SimpleTree [20], accurate and detailed quantitative structure model (AdQSM) [21]) reconstruction methods have been developed. QSM is a geometric tree model that describes the geometry and topology of the tree trunk and branches by fitting a series of cylinders [19,21]. By combining TLS and QSM, the tree volume, biomass [3,12,15,22,23,24,25] and branching architecture [26] can be estimated.
It has been shown that QSM is sufficient to estimate the stem and branch volume (or biomass) at the level of the individual tree with very low bias [21,22,24,27]. In the development of the allometric equation, QSM can overcome almost all of the difficulties associated with traditional sampling. Hence, QSM can make it possible to assess the scaling allometry of branch parameters within a tree, and few studies have explored it until now. At present, most allometric relationships are constructed using the scalar characteristic parameters of trees. Since the morphological structure of trees can be fully represented by the high-density three-dimensional point cloud from TLS, the allometric equation constructed in three-dimensional space can better reflect the physiological, biomechanical and ecological characteristics of plant organs. Therefore, based on the concept of 3D allometry proposed by Lin and Hyyppä [28], we preliminarily discuss the allometric relationship between branch lengths in scalar and vector modes, which can help us to understand the growth law of trees, predict and assess the adaptability of trees to environmental changes and climate changes, and further explore the laws of ecological evolution, biodiversity and ecosystem functions. The objectives of this study are (i) to establish and compare the scaling allometry of the branch lengths of a tree in scalar and vector modes by coupling TLS and QSM; (ii) to investigate the general knowledge of scaling exponents of branch lengths at different branching levels.

2. Materials and Methods

2.1. Study Area

In this study, a large tropical tree dataset collected from Vaitarna Holding’s concession, central Guyana, located between 6°2′2.4″N, 58°41′56.4″W and 6°2′20.4″N, 58°41′38.4″W by de Tanago et al. (2018), was used, which was created to estimate the above-ground biomass of large tropical trees. Ten plots were established in a lowland tropical moist forest, which had a mean stem density of 516 stems per ha when trees with a diameter at breast height greater than 10 cm were considered [12]. The study area had a mean elevation of 117 m above sea level and a mean rainfall of 2195 mm per year. In each plot, one tree was selected based on its harvestable diameter and its suitability for harvesting. A total of seven Eperua grandiflora, one Pithecellobium jupunba, one Ormosia coutinhoi and one Eperua falcata were harvested. The mean total tree height measured with tape after harvest was about 32.5 m, and the mean diameter at breast height of these harvested trees was about 73.7 cm.

2.2. TLS Data

The plot was scanned with TLS once it was set up, and then the selected tree was harvested and the geometry of the tree was measured. These TLS datasets were collected using a RIEGL VZ-400 V-Line 3D terrestrial laser scanner with a wavelength of 1550 nm and a beam divergence of 0.35 mrad (RIEGL Laser Measurement Systems GmbH, Horn, Austria). The beam scan range is 360° in the azimuth and 100° in the zenith. A total of thirteen scan locations were set up in each plot, and each scan had an angular resolution of 0.06° [12]. Two scans were taken at each scan location; one was taken with the scanner perpendicular to the ground, and the other was taken with the scanner parallel to the ground. More detailed information about the configuration of the scanner and sampling design can be found in [12]. These datasets have been used for 3D reconstruction with QSMs by some researchers [21,26,29].

2.3. 3D Reconstruction of Tree Architecture

The 3D architecture of each tree was reconstructed using the AdQSM algorithm [21]. In this study, AdQSM version 1.7 was used (https://github.com/GuangpengFan/AdQSM, accessed on 29 September 2022). AdQSM does not need to assume the tree structure in advance, nor does it depend on the limited tree structure parameters. AdQSM uses a series of steps and methods to finely reconstruct the geometric structure of an individual tree, including constructing a Delaunay triangulation map and weighting it, extracting the initial skeleton of the tree with the minimum spanning tree algorithm, simplifying the skeleton, smoothing the skeleton of the tree, and fitting the trunk and branches of the tree using a series of cylinders. There are two important parameters in tree modeling (high segmentation (HS) and cloud parameter (CP)). The variation in the HS parameter does not affect the branch lengths of the reconstructed tree. And according to the test results of [21], it is not recommended to frequently change the value of CP. Therefore, in this experiment, we adopted the default values when rebuilding the architecture of a single tree from the 3D point cloud. The default values are 0.50 and 0.003 for HS and CP, respectively. Once the 3D shape of the tree was obtained, we extracted the attribute parameters of the branch (such as order, length and zenith angle). Here, the level of the trunk was set to 0, branches growing from the trunk were set as the first-level branches, branches growing from the first-level branches were set as the second-level branches and so on.

2.4. Comparison of Scalar and Vector Allometric Models

To reveal more about the relationships between branches in 3D space, the scalar and vector allometries between branch lengths and the cumulative lengths of child (descendant) branches at different branching levels were established for each individual tree. Nine allometric models were formed from different combinations of the lengths of branches, the lengths of horizontal components of branches, the lengths of vertical components of branches, the cumulative lengths of child (descendant) branches, the cumulative lengths of horizontal components of child (descendant) branches and the cumulative lengths of vertical components of child (descendant) branches for each branching level. To establish each allometric model, all data were transformed to the natural logarithm and plotted on a graph with a logarithmic scale (log–log graph). The standardized major axis (SMA) [30] method was used to describe the allometric relationship between tree branch lengths. The DOS-based SMATR package [30] performs testing for homogeneity among SMA regression slopes via a permutation test, and if the regression slopes are homogeneous, a common slope is estimated, and elevation shifts and the shift along the common slope are tested. As a comparison, linear relationships between these branch length parameters were also analyzed.

3. Results

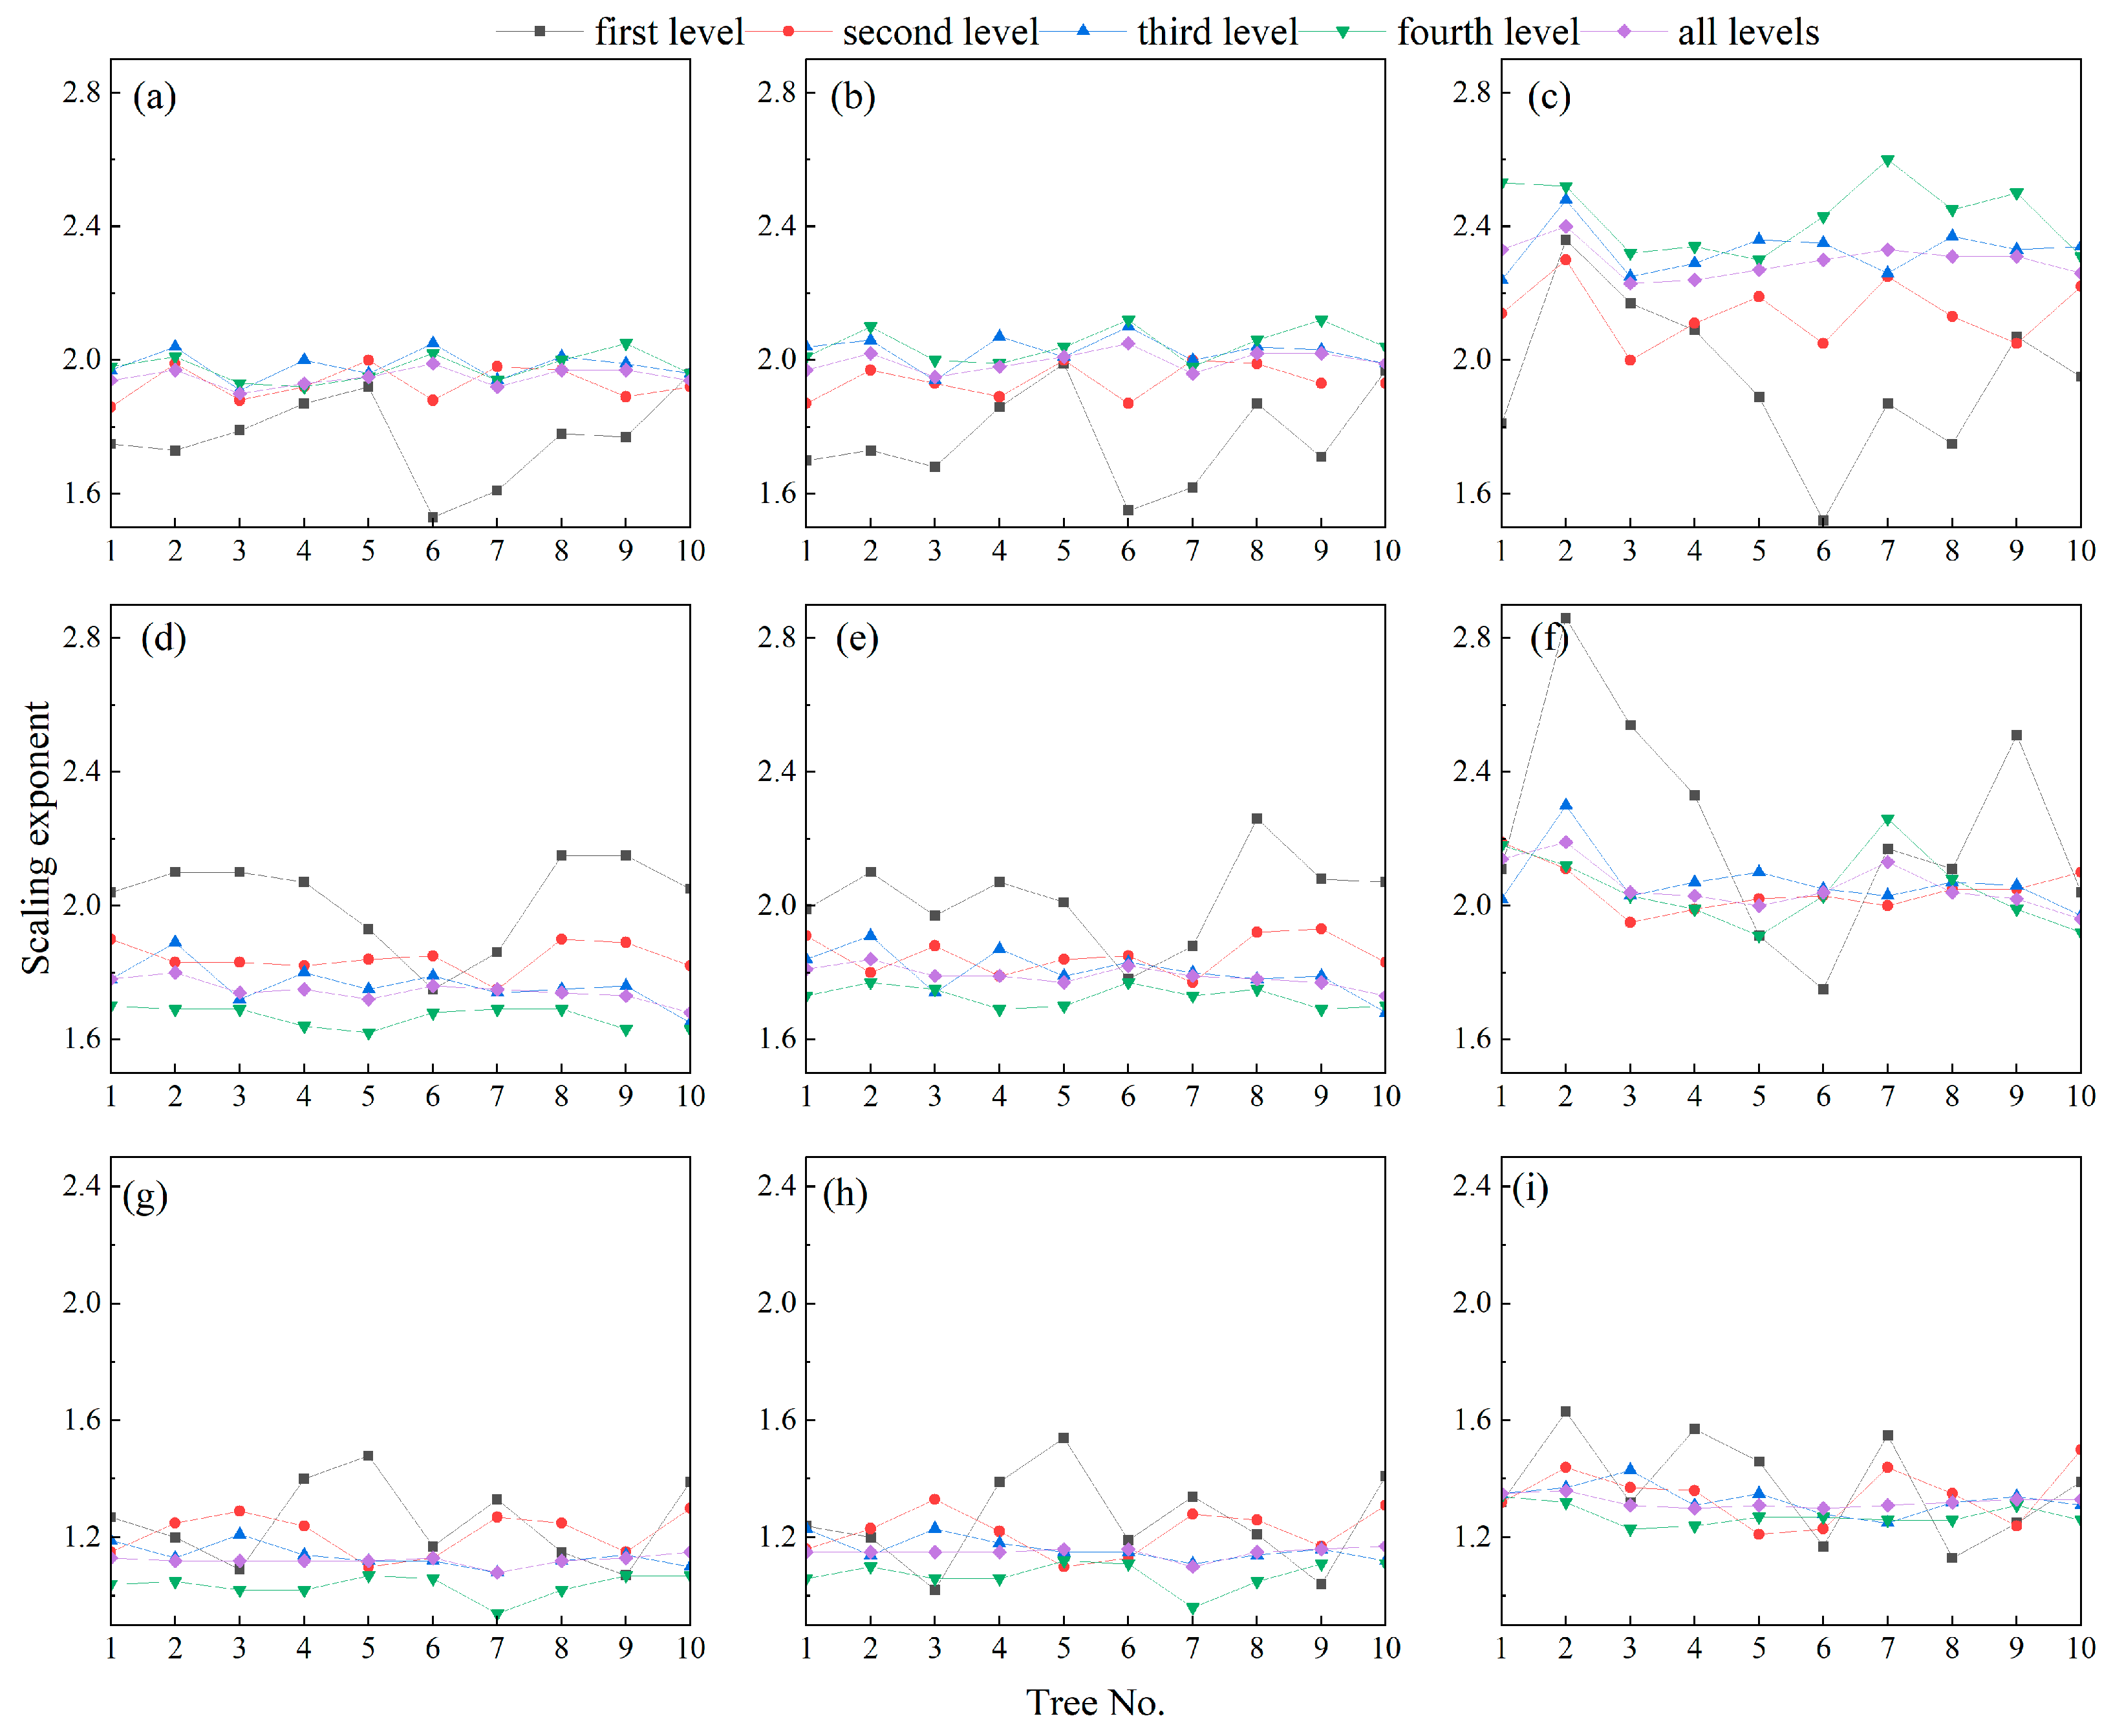
3.1. Tree Branch Information from QSM

The 3D geometric and topological structures of each tree were reconstructed by AdQSM, and the number of tree branches and the total length of these branches at each branching level were calculated (see Table 1). For each tree, more than 10,000 branches were reconstructed, almost restoring the entire structure of the tree in a few seconds. From the reconstructed tree branches, the number of branches and the total length of branches first increase and then decrease with the increase in the branching level and reach the maximum value when the branching level is 4 or 5. The average length of the branches at the same branching level decreases rapidly with the increase in the branching level, and when the branching level is 5, it is about 0.4~0.5 m per branch. Hence, the branches at branching levels of 1~5 were considered for the next scaling exponent analysis.

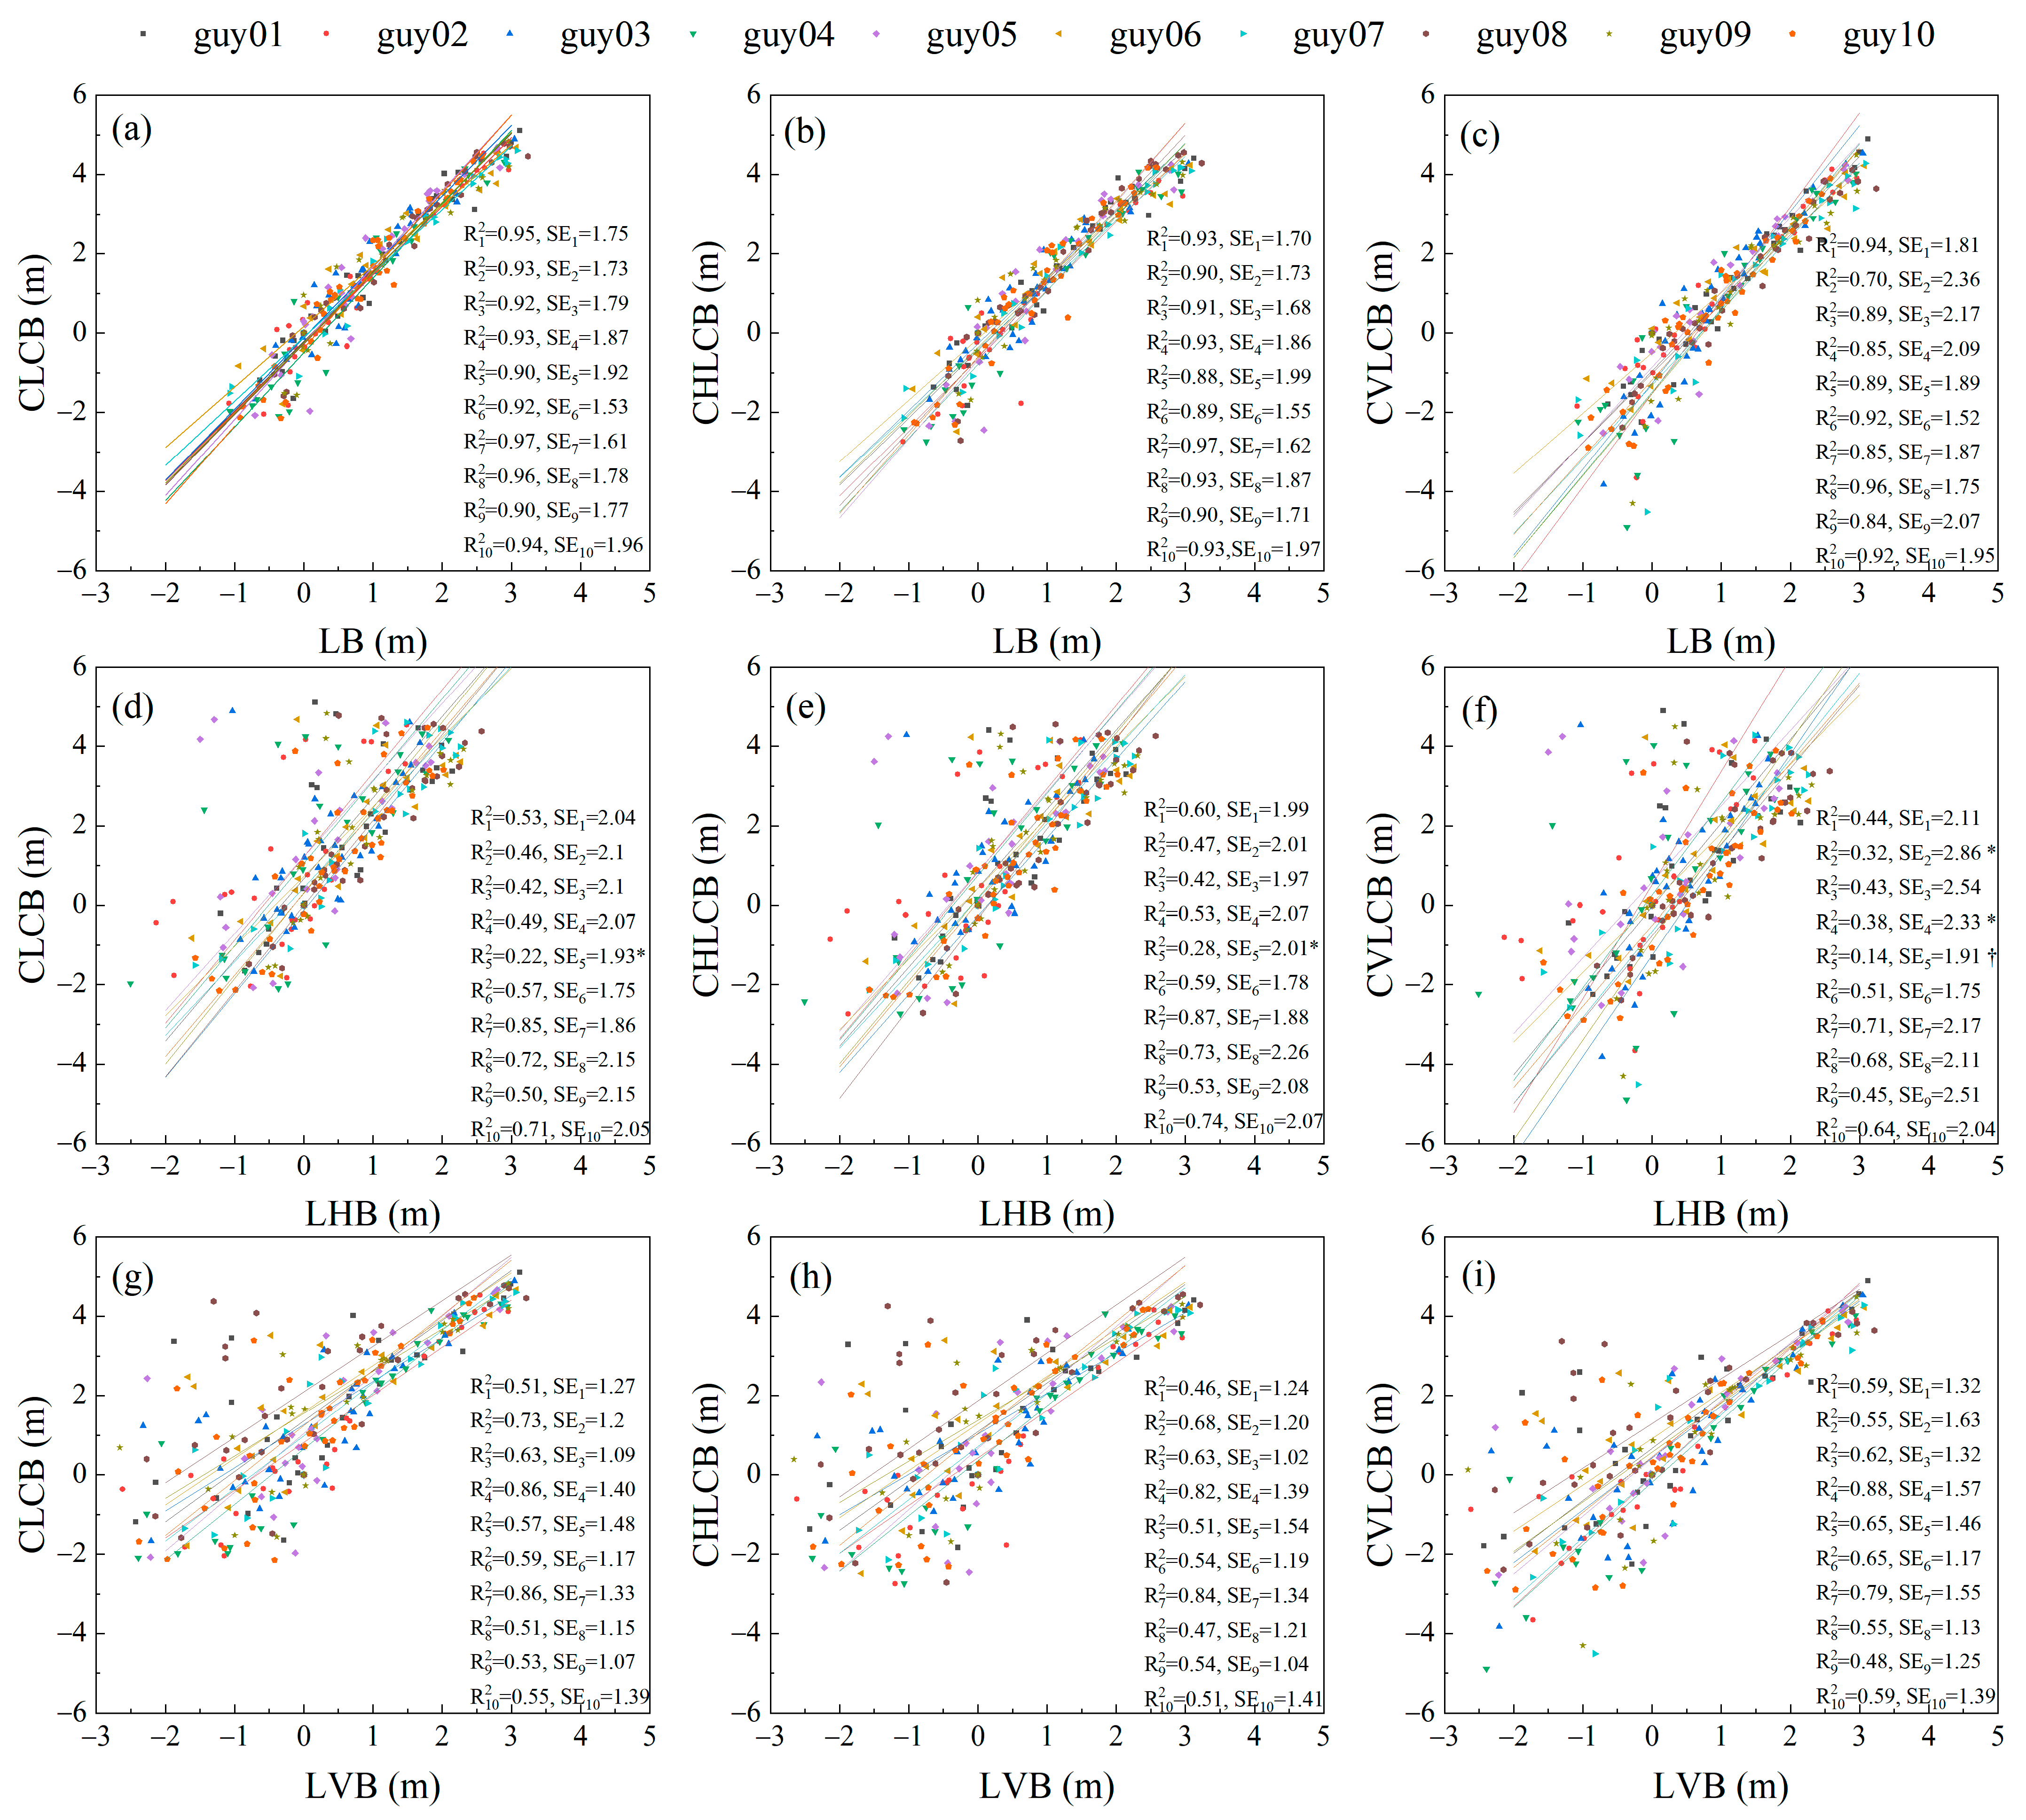
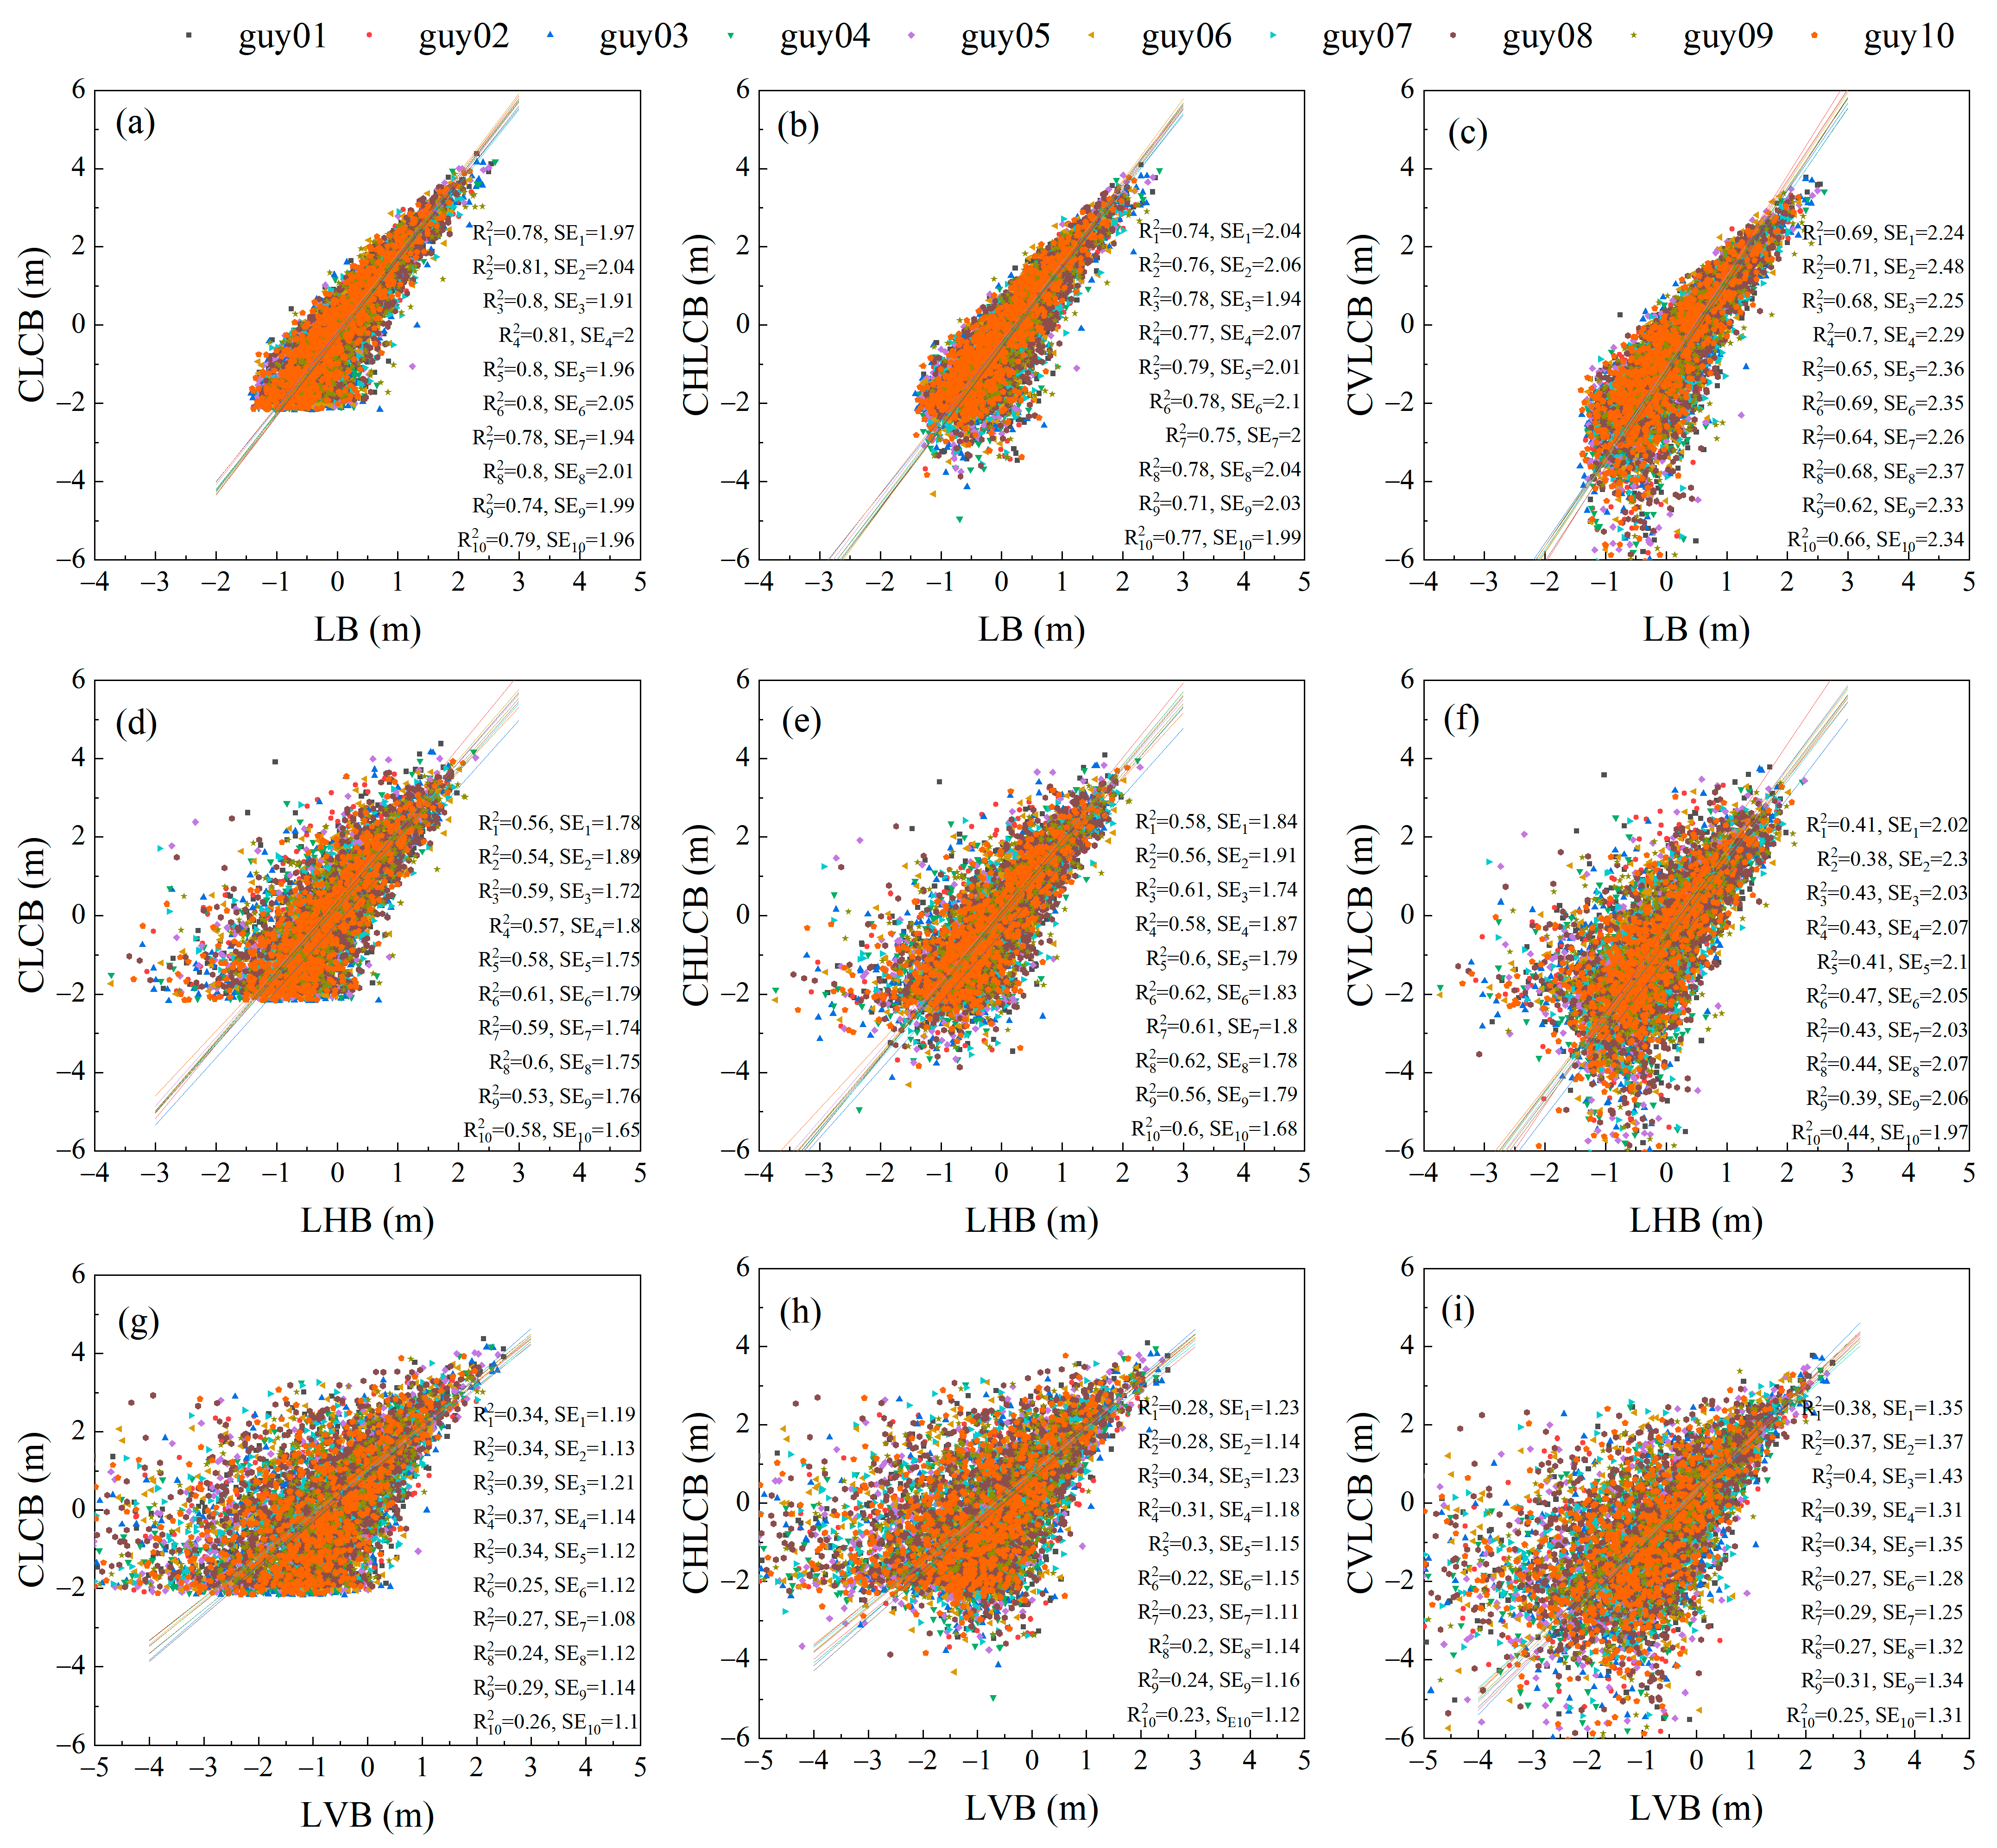
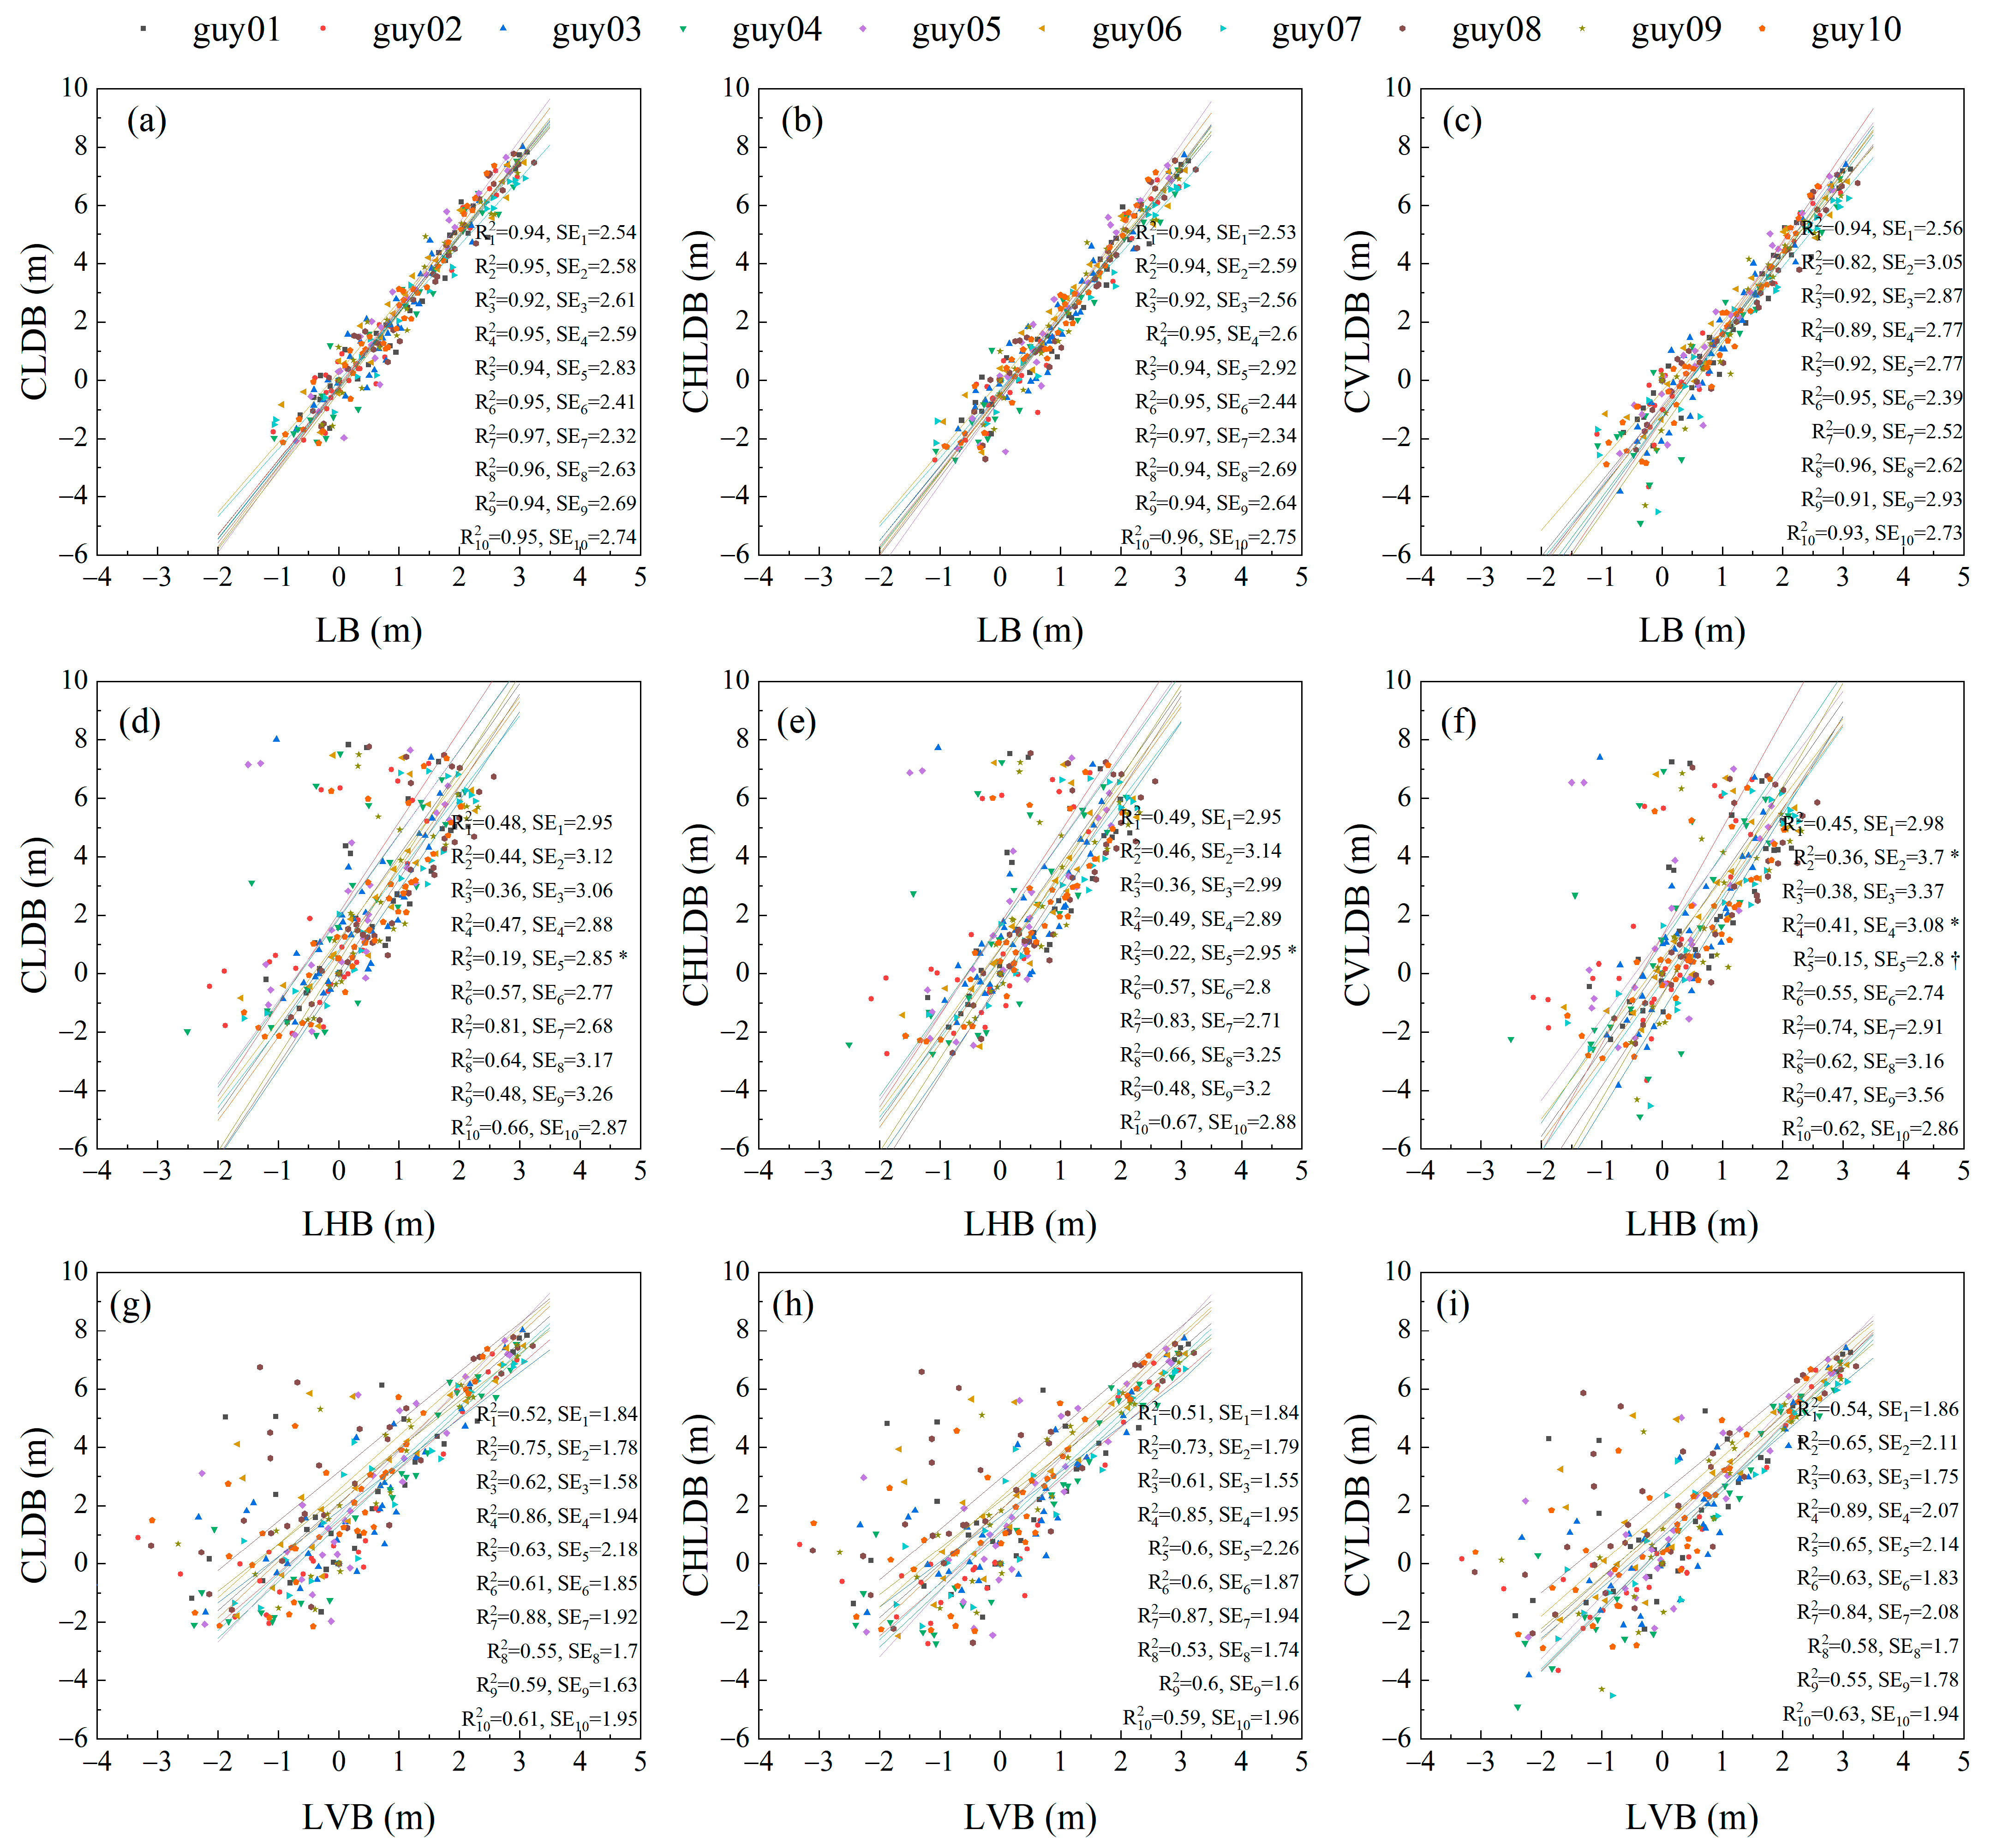
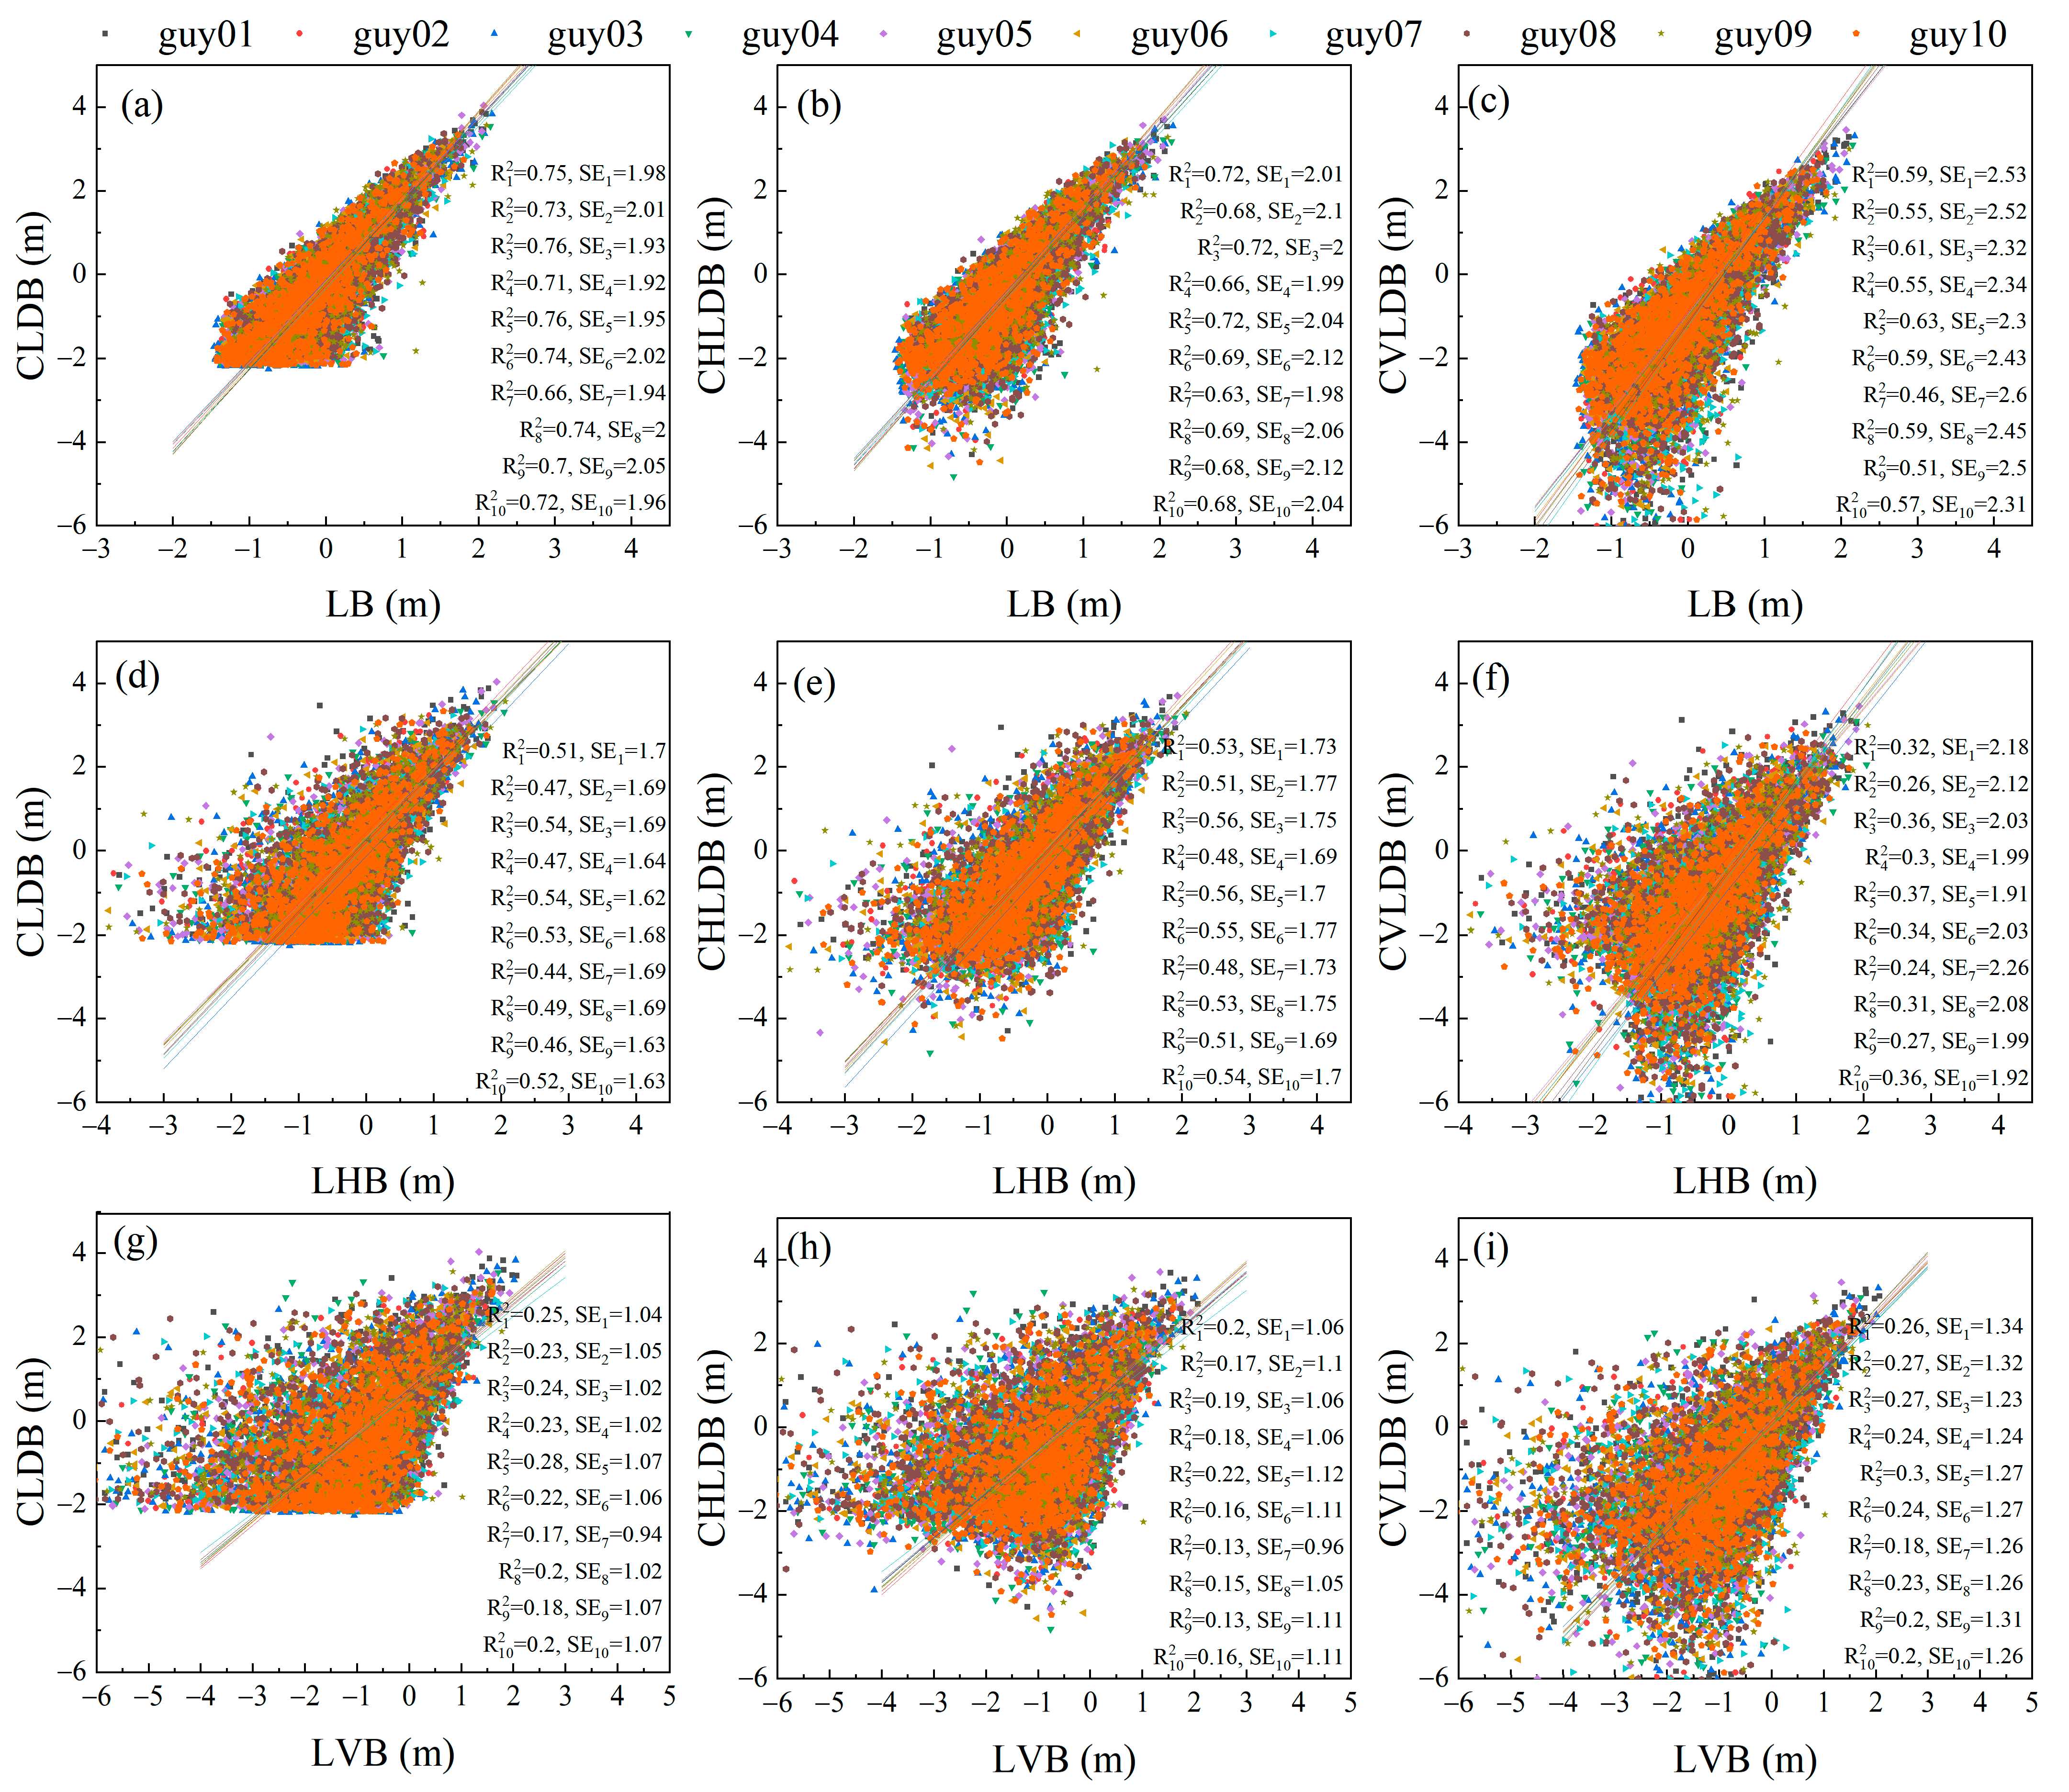
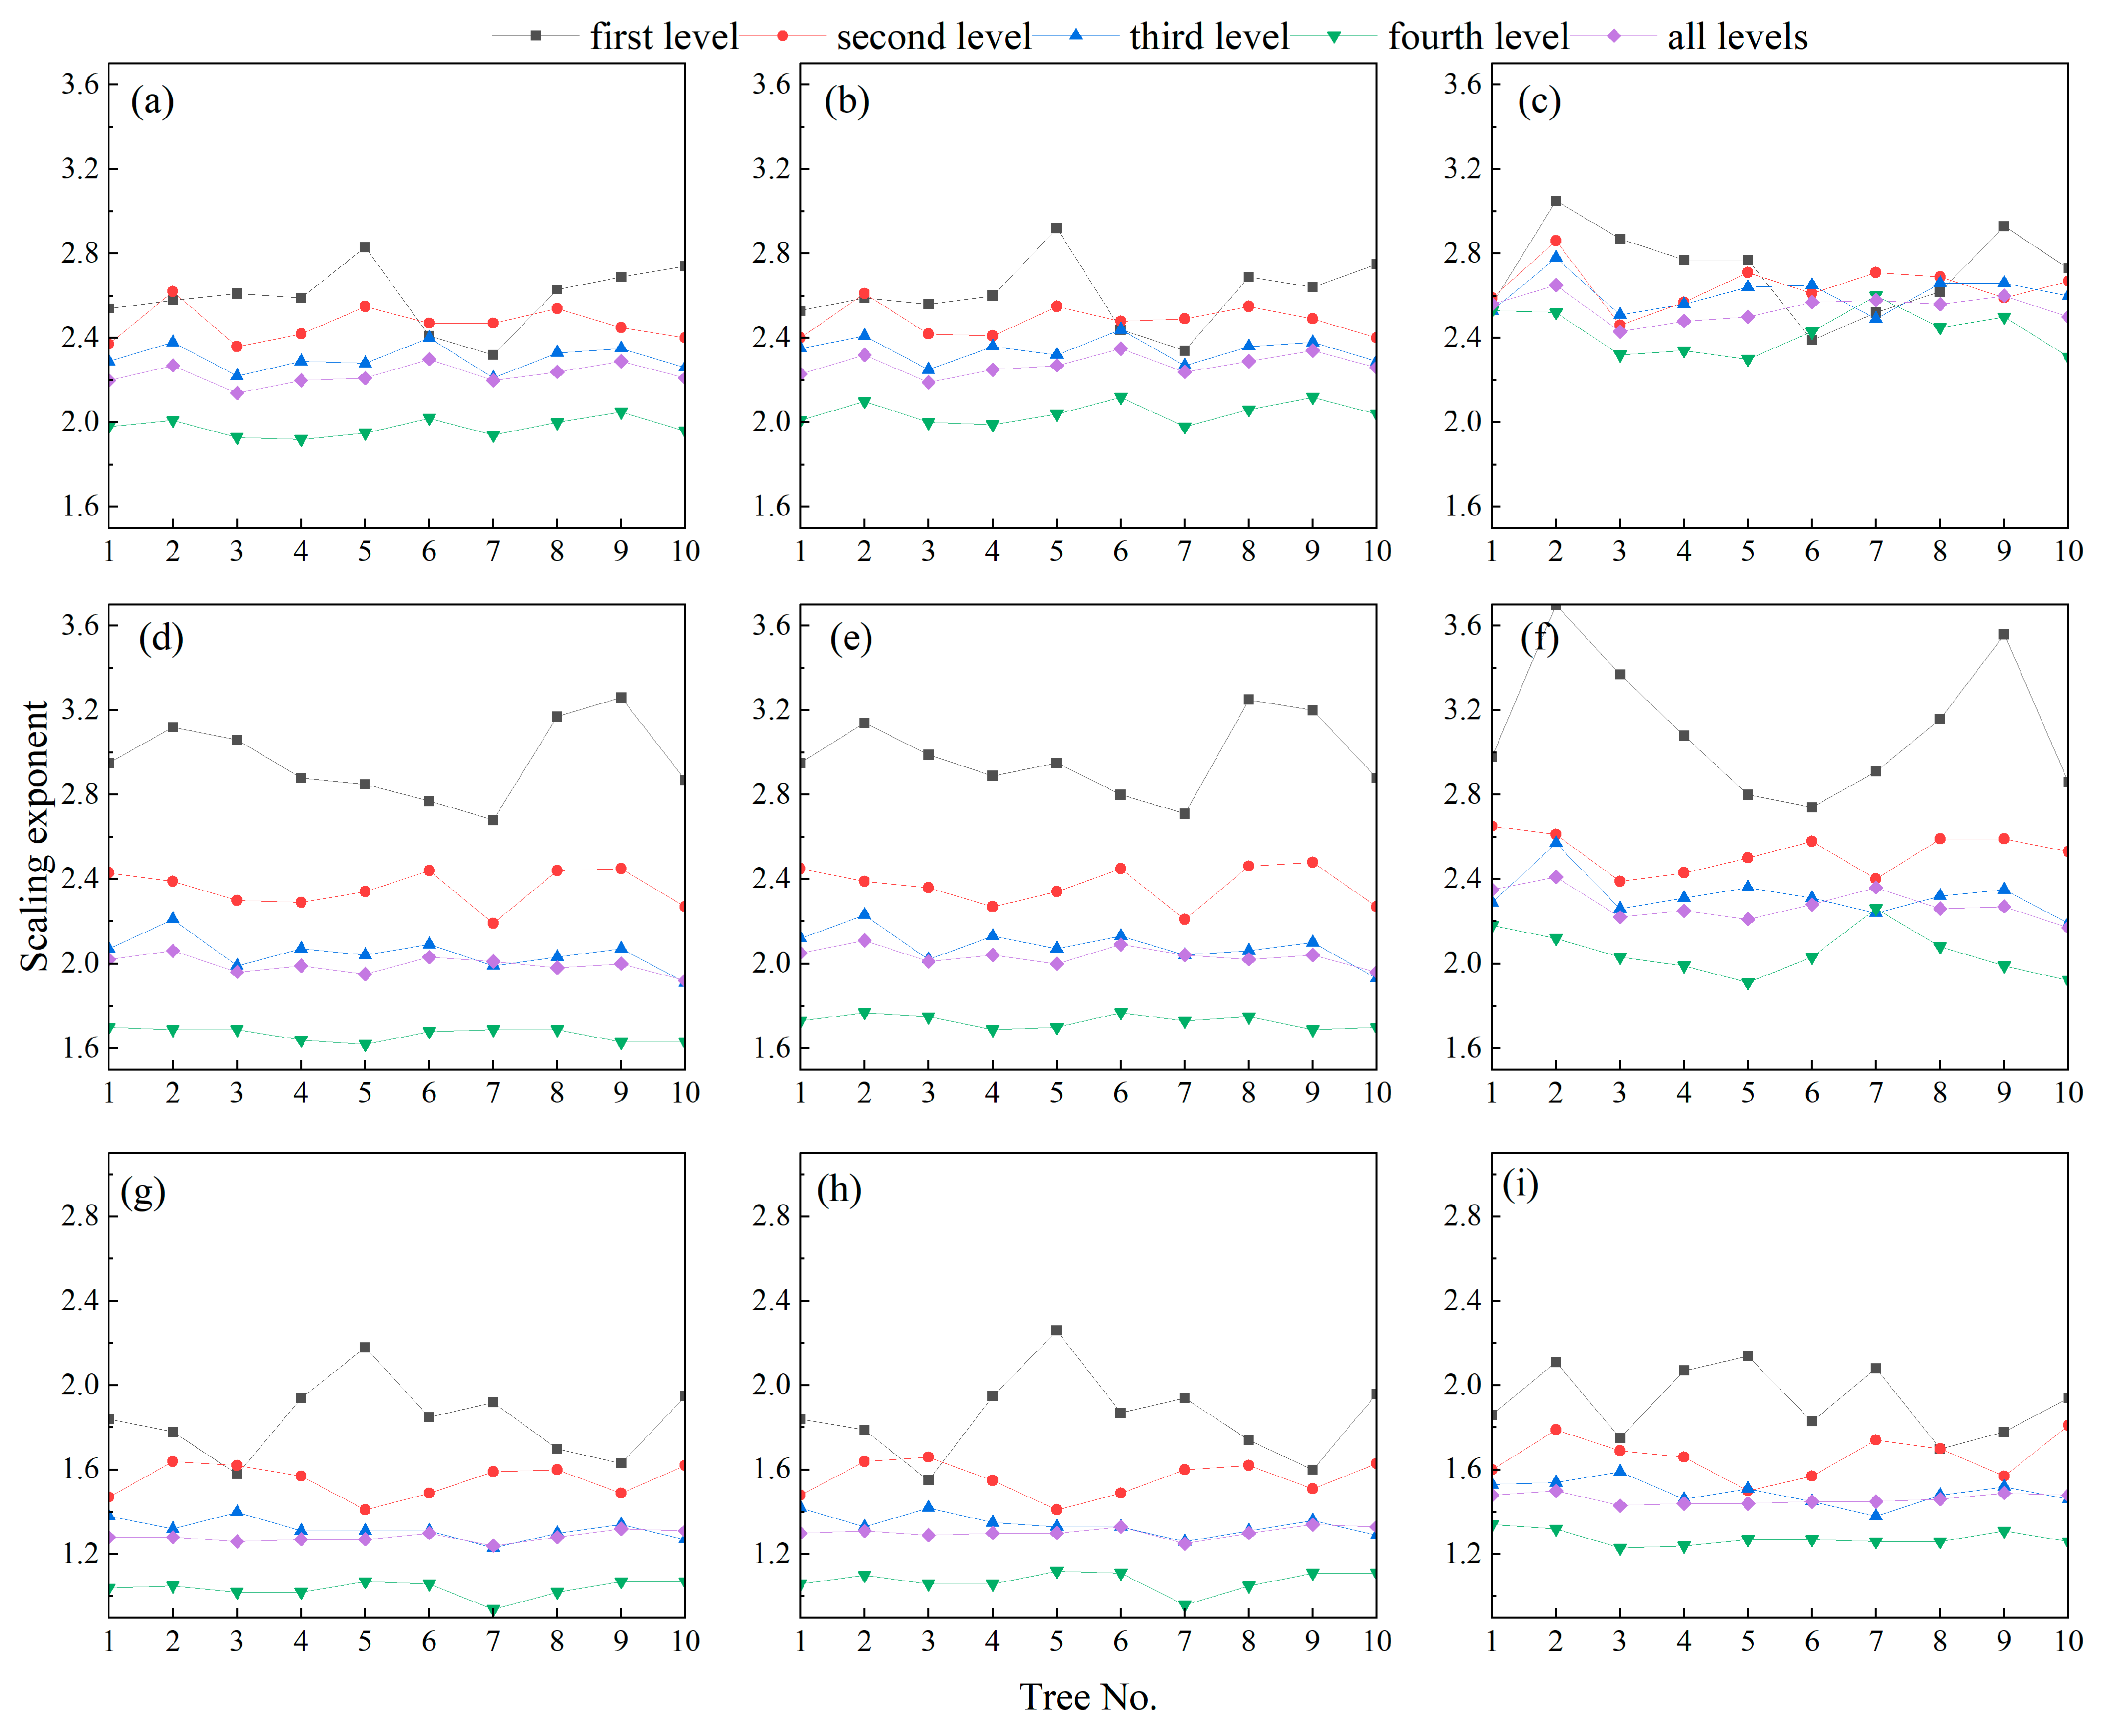
3.2. Comparison of Scalar and Vector Allometry between Branch Lengths and Cumulative Child Branch Lengths

For each tree, log–log linear relationships at branching levels 1–4 between the branch lengths (LB) and the cumulative lengths of child branches (CLCB), LB and the cumulative lengths of horizontal components of the child branches (CHLCB), LB and the cumulative lengths of vertical components of the child branches (CVLCB), the lengths of horizontal components of branches (LHB) and CLCB, LHB and CHLCB, LHB and CVLCB, the lengths of vertical components of branches (LVB) and CLCB, LVB and CHLCB, and LVB and CVLCB are displayed in Figure 1, Figure 2, Figure 3 and Figure 4, respectively. Except for a few allometric models (with * or † symbol in Figure 1), allometric relationships in other allometric models are found to be significant (p < 0.001) for individual trees.
On the whole, there are obvious differences among the 3D allometric models at the same branching levels. Compared with LHB and LVB, the LB-based allometric models have the best fitting accuracy (Figure 1a–c, Figure 2a–c, Figure 3a–c and Figure 4a–c). The fitting relationships between LHB and CHLCB are better than those between LHB and CLCB or CVLCB (Figure 1d–f, Figure 2d–f, Figure 3d–f and Figure 4d–f). And the fitting relationships between LVB and CVLCB are better than those between LVB and CLCB or CHLCB (Figure 1g–i, Figure 2g–i, Figure 3g–i and Figure 4g–i). Except for the first branching level, the fitting relationships between LHB and CHLCB are generally better than those between LVB and CVLCB (Figure 2e,i, Figure 3e,i and Figure 4e,i). However, with the increase in the branching level, the fitting accuracy of the same allometric model decreases. Taking the allometric model established with LB and CLCB as an example, the coefficient of determination (R2) is higher than 0.9 at the first branching level but lower than 0.8 at the fourth branching level (Figure 1a, Figure 2a, Figure 3a and Figure 4a). Other allometric models have similar results.
The scaling exponents of allometric models established from the first-level branches vary greatly among trees, but the difference in scaling exponents among trees for most allometric models tends to decrease with the increase in the branching level (Figure 5). Compared with the LVB-based allometric models, the scaling exponents of the LHB-based allometric models are close to those of the LB-based allometric models. Compared with the CVLCB-based allometric models, the scaling exponents of the CHLCB-based allometric models are close to those of the CLCB-based allometric models. The difference in the scaling exponents of the CHLCB-based allometric models and the CLCB-based allometric models is less than 0.1 for each tree. It is worth noting that the variation trend of scaling exponents is different for different models. For example, for each tree, the scaling exponents between LB and CLCB tend to stabilize with the increase in the branching level (Figure 5a), while the scaling exponents between LHB and CLCB tend to slightly decrease with the increase in the branching level (Figure 5d). The scaling exponents of the allometric models based on all branching levels from 1 to 4 are close to those of the allometric models based on the third branching level. Through SMA analysis with a confidence interval of 95%, the LB-CLDB, LHB-CHLDB and LVB-CHLVB allometric models constructed with first-level branches, except for tree 10, share common scaling exponents among trees, and the common scaling exponents are 1.74, 2.02 and 1.41, respectively. For the second-level branches, except for tree 10, the common scaling exponents are 1.93, 1.86 and 1.33, respectively. For the third-level branches, except for trees 2 and 10, the common scaling exponents are 1.98, 1.80 and 1.33, respectively. For the fourth-level branches, except for tree 9, the common scaling exponents are 1.97, 1.73 and 1.27, respectively. For all branch levels, except for tree 6, the common scaling exponents are 1.95, 1.78 and 1.32, respectively.
As shown in Figure 1g–i, Figure 2g–i, Figure 3g–i and Figure 4g–i, the fitting accuracy of LVB-based allometric models is relatively low, and the scaling exponents are around 1.3, which may imply that the relationship between LVB and CLCB or LVB and CHLCB or LVB and CVLCB is unlikely to be allometric. R2s between allometric and linear models using the first~fourth-level branches are compared (see Table 2, Table 3, Table 4 and Table 5, respectively). No matter which branching level is used to build the model, the LVB-based linear models have higher fitting accuracy than the LVB-based allometric models, which indicates that the relationships between these parameters are closer to isometric growth. However, the relationships between LHB and CLCB, LHB and CHLCB, and LHB and CVLCB are more complicated. The fitting accuracy of LHB-based allometric models is better than that of linear models when the branching level is lower than 2, while the fitting accuracy of LHB-based linear models is better than that of allometric models when the branching level is greater than 2. This implies that the relationships between LHB and CLCB, LHB and CHLCB, and LHB and CVLCB are more likely to first be allometric growth and then turn into isometric growth with the increase in the branching level.

3.3. Comparison of Scalar and Vector Allometry between Branch Lengths and Cumulative Descendant Branch Lengths

As in Section 3.2, log–log linear relationships at branching levels 1–4 between the LB and the cumulative lengths of descendant branches (CLDB), LB and the cumulative lengths of horizontal components of the descendant branches (CHLDB), LB and the cumulative lengths of vertical components of the descendant branches (CVLDB), LHB and CLDB, LHB and CHLDB, LHB and CVLDB, LVB and CLDB, LVB and CHLDB, and LVB and CVLDB for each tree are displayed in Figure 6, Figure 7, Figure 8 and Figure 9, respectively. Except for a few allometric models (with * (†) symbol in Figure 6), allometric relationships in other allometric models are found to be significant (p < 0.001) for individual trees.
Similar to the results of the relationships between branch lengths and cumulative child branch lengths, the LB-based allometric models have the best fitting accuracy (Figure 6a–c, Figure 7a–c, Figure 8a–c and Figure 9a–c). The fitting relationships between LHB and CHLDB are better than those between LHB and CLDB or CVLDB (Figure 6d–f, Figure 7d–f, Figure 8d–f and Figure 9d–f). And the fitting relationships between LVB and CVLDB are better than those between LVB and CLDB or CHLDB (Figure 6g–i, Figure 7g–i, Figure 8g–i and Figure 9g–i). Except for the first branching level, the fitting relationships between LHB and CHLDB are generally better than those between LVB and CVLDB (Figure 7e,i, Figure 8e,i and Figure 9e,i). With the increase in the branching level, the fitting accuracy of the same allometric model decreases.
For each tree, the scaling exponents of allometric models decrease with the increase in the branching level, and the decreasing speed of scaling exponents is slightly different for different allometric models (Figure 10). Compared with the CVLDB-based allometric models, the scaling exponents of the CHLDB-based allometric models are close to those of the CLDB-based allometric models. The difference in the scaling exponents of the CHLDB-based allometric models and the CLDB-based allometric models is less than 0.1 for each tree. Except for the first branching level, the scaling exponents of the same allometric model vary slightly among trees. Through SMA analysis with a confidence interval of 95%, the LB-CLDB, LHB-CHLDB and LVB-CHLVB allometric models constructed with first-level branches have common scaling exponents among trees, and the common scaling exponents are 2.59, 2.94 and 1.95, respectively. For the second-level branches, the common scaling exponents are 2.47, 2.37 and 1.66, respectively. For the third-level branches, except for trees 2 and 6, the common scaling exponents are 2.28, 2.06 and 1.49, respectively. It is worth noting that the results based on the cumulative child branch lengths of the fourth-level branches are the same as those based on the cumulative descendant branch lengths of the fourth-level branches. In our experiment, we just considered the first–fifth-level branches as the research object, so the cumulative descendant branch lengths of the fourth-level branches degenerate into the cumulative child branch lengths of the fourth-level branches here.
Compared with the scaling exponents between branch lengths and cumulative child branch lengths, the scaling exponents between branch lengths and cumulative descendant branch lengths are larger. But the fitting accuracy of LVB-based allometric models is also relatively low, so the linear models between these parameters were also established (see Table 6, Table 7, Table 8 and Table 9). The results are consistent with those in Section 3.2, and the only difference is that the relationships between LHB and CLDB, LHB and CHLDB, and LHB and CVLDB change from allometric to isometric when the branching level is greater than 3.

4. Discussion

4.1. Possible Influencing Factors of Allometric Model

The accurate estimation of QSM is difficult, because obtaining a huge amount of accurate reference data is particularly difficult from traditional measurements. Hence, the results of the allometric models established in this study may be affected by the following factors: (1) measurement noise of trees during scanning; (2) errors from the AdQSM algorithm, such as an error in the modeling process of slender branches or twigs by AdQSM due to the influence of too low point cloud quality or an error in the modeling of curved branches by AdQSM; (3) errors in the results of the branch lengths and cumulative descendant branch lengths due to only using branches up to the fifth branching level. Through the statistical analysis of branches simulated by AdQSM, we found that the proportion of branches larger than 1 m is less than 1/3 of branches with a branching level greater than 5. These data should have little influence on the results. In order to verify this hypothesis, we established allometric models using all branches simulated by AdQSM and found that the difference in scaling exponents between them is about 0.1. Therefore, in order to reduce the influence of (2), the allometric models established in this study using the branches of the first–fifth branching levels (including approximately 76% of AdQSM-simulated branches) are feasible. In addition, the research results of Fan et al. [21] indicated that AdQSM slightly overestimated the volume of the largest trees due to too many twigs or smaller branches modeled by AdQSM and suggested removing some higher-level branches or twigs. As mentioned by Lau et al. [29], uncertainty in the derived branch lengths led to uncertainty in the estimation of scaling exponents, reducing the error in model estimations needed to improve the point cloud quality.

4.2. Scaling of Branch Lengths and Cumulative Child (Descendant) Branch Lengths

To our knowledge, this study is the first to investigate the 3D vector allometry of branch lengths using 3D point clouds and QSM. We not only investigated the allometric relationships between branch lengths in scalar mode but also tried to investigate the relationships between branch lengths in vector mode (vertical and horizontal directions). Not only the allometric models but also the linear models between the parameters of branch lengths were established. Our results show that the CHLCB-based (CHLDB-based) allometric models and the CLCB-based (CLDB-based) allometric models have similar model accuracy and scaling exponents: that is to say, compared with CVLCB (CVLDB), CHLCB (CHLDB) is closer to CLCB (CLDB), suggesting that most branches tend to grow closer to the horizontal direction, especially twigs. Not only are the scaling exponents of LHB-CHLCB (CHLDB) larger than those of LVB-CVLCB (CVLDB), but the slopes of LHB-CHLCB (CHLDB) are also larger than those of LVB-CVLCB (CVLDB) in the linear models, which indicates that the growth rate of branch lengths in the horizontal direction is much faster than that in the vertical direction, providing more growth space for leaves for photosynthesis. Through the statistical analysis of the zenith angles of branches simulated by AdQSM, we found that about 60% of branches have zenith angles between 50 and 110°, and the total length of branches in this interval accounts for 60% of the total length of branches of a tree, which further verifies that the growth rate in the horizontal direction is faster than that in the vertical direction.
From the above results, we also found that the scaling exponents of some trees are significantly different from those of other trees in a certain model, for example, the allometric model based on the first-level branches of tree 6, and this phenomenon is probably caused by the low simulation accuracy or incorrect simulation of some twigs by AdQSM.
Our results show that at the same branching level and using the same allometric model (LB-CLCB (CLDB), LHB-CHLCB (CHLDB), LVB-CVLCB (CVLDB)), there is an approximate scaling exponent among trees, especially for a higher branching level. This at least implies that the similarity in branching systems among trees becomes closer with increasing branching levels. However, the sample size in this study is small (10 trees), and the samples are only from three tree species in one place; the results may not be suitable for other trees, so more tree species from different forest types in different regions need to be studied. In addition, although the SMA analysis results indicate that common scaling exponents exist among trees at the first branching level, as shown in Figure 5 and Figure 10, it is obvious that the scaling exponents vary greatly among trees. This is partly due to the limitations of AdQSM in simulating twigs. Small errors in the simulation of twig length could lead to larger errors in scaling exponents. Another possibility is that the number of first-level branches involved in modeling is small (about 20–40), leading to differences in scaling exponents among trees. For these reasons, there may be some errors between our results and the real values, which requires further validation in the future.

5. Conclusions

This study explores the allometric relationships between tree branch lengths in 3D scalar and vector modes based on TLS and QSM. Our results show that in 3D space, the performance of allometric models based on branch lengths is the best, followed by those based on the horizontal and vertical components of branch lengths. At the same branching level and using the same allometric model, the scaling exponents of the branch length and cumulative child (descendant) branch lengths (no matter whether the lengths are scalar or vector) are similar among trees. And the scaling exponents for the horizontal component of branch lengths are much larger than those for the vertical component of branch lengths, which are close to the scaling exponents for the branch lengths in scalar form. The allometric models based on the cumulative lengths of horizontal components of the child (descendant) branches and the allometric models based on the cumulative lengths of child (descendant) branches have similar model accuracy and scaling exponents. With the increase in the branching level, the scaling exponents of branch lengths and cumulative descendant branch lengths tend to decrease. The 3D vector allometric relationships of branch lengths and cumulative child branch lengths at different branching levels provide us with insight to understand the crown morphology and the growth law of branches. The 3D vector allometric relationships of branch lengths and cumulative descendant branch lengths at different branching levels provide convenience for measuring the total length of descendant branches. Our results lack the validation of reference data due to the difficulty of whole-tree measurements, but they still represent an important step in the study of tree structure based on TLS and QSM, which could accelerate our understanding of plant structure–function relationships. In this study, our sample size is small (10 trees) and dominated by one tree species; the allometric relationships derived from different tree species in different regions may be different, so we can conduct further research based on different tree species in the future.

Author Contributions

Conceptualization, J.S. and Y.L.; methodology, J.S.; software, J.S.; validation, J.S.; formal analysis, J.S. and Y.L.; investigation, J.S.; resources, J.S.; data curation, J.S.; writing—original draft preparation, J.S.; writing—review and editing, Y.L.; visualization, J.S.; supervision, Y.L.; project administration, Y.L.; funding acquisition, J.S. and Y.L. All authors have read and agreed to the published version of the manuscript.

Funding

This research was funded by the National Key R&D Program Project (grant number 2022YFE0112700); the National Natural Science Foundation of China (grant number 32171782); Shanxi Province Basic Research Project (grant number 20210302124236); and Shanxi Agricultural University Doctoral Research Project (grant number 2021BQ99).

Data Availability Statement

The individual tree TLS point cloud in this study is from Gonzalez de Tanago, J.; Lau, A.; Bartholomeus, H.; Herold, M.; Avitabile, V.; Raumonen, P.; Martius, C.; Goodman, R.C.; Disney, M.; Manuri, S.; Burt, A.; Calders, K. TLS tree point cloud data. 2018. https://doi.org/10.4121/21552084.

Acknowledgments

We would like to thank all the authors of the paper “Estimation of above-ground biomass of large tropical trees with terrestrial LiDAR” for their contributions to the data disclosure.

Conflicts of Interest

The authors declare no conflict of interest.

References

  1. Duncanson, L.I.; Dubayah, R.O.; Enquist, B.J. Assessing the General Patterns of Forest Structure: Quantifying Tree and Forest Allometric Scaling Relationships in the United States. Glob. Ecol. Biogeogr. 2015, 24, 1465–1475. [Google Scholar] [CrossRef]
  2. Komiyama, A.; Poungparn, S.; Kato, S. Common Allometric Equations for Estimating the Tree Weight of Mangroves. J. Trop. Ecol. 2005, 21, 471–477. [Google Scholar] [CrossRef]
  3. Momo Takoudjou, S.; Ploton, P.; Sonké, B.; Hackenberg, J.; Griffon, S.; Coligny, F.; Kamdem, N.G.; Libalah, M.; Mofack, G.I.; Le Moguédec, G.; et al. Using Terrestrial Laser Scanning Data to Estimate Large Tropical Trees Biomass and Calibrate Allometric Models: A Comparison with Traditional Destructive Approach. Methods Ecol. Evol. 2018, 9, 905–916. [Google Scholar] [CrossRef]
  4. Smith-Martin, C.M.; Xu, X.; Medvigy, D.; Schnitzer, S.A.; Powers, J.S. Allometric Scaling Laws Linking Biomass and Rooting Depth Vary across Ontogeny and Functional Groups in Tropical Dry Forest Lianas and Trees. New Phytol. 2020, 226, 714–726. [Google Scholar] [CrossRef] [PubMed]
  5. Vieilledent, G.; Vaudry, R.; Andriamanohisoa, S.F.D.; Rakotonarivo, O.S.; Randrianasolo, H.Z.; Razafindrabe, H.N.; Rakotoarivony, C.B.; Ebeling, J.; Rasamoelina, M. A Universal Approach to Estimate Biomass and Carbon Stock in Tropical Forests Using Generic Allometric Models. Ecol. Appl. 2012, 22, 572–583. [Google Scholar] [CrossRef] [PubMed]
  6. Zhou, X.; Yang, M.; Liu, Z.; Li, P.; Xie, B.; Peng, C. Dynamic Allometric Scaling of Tree Biomass and Size. Nat. Plants 2021, 7, 42–49. [Google Scholar] [CrossRef]
  7. Enquist, B.J. Universal Scaling in Tree and Vascular Plant Allometry: Toward a General Quantitative Theory Linking Plant Form and Function from Cells to Ecosystems. Tree Physiol. 2002, 22, 1045–1064. [Google Scholar] [CrossRef]
  8. Farnsworth, K.D.; Niklas, K.J. Theories of Optimization, Form and Function in Branching Architecture in Plants. Funct. Ecol. 1995, 9, 355. [Google Scholar] [CrossRef]
  9. Remphrey, W.R.; Powell, G.R. Crown Architecture of Larix Laricina Saplings: An Analysis of Higher Order Branching. Can. J. Bot. 1987, 65, 268–279. [Google Scholar] [CrossRef]
  10. Krooks, A.; Kaasalainen, S.; Kankare, V.; Joensuu, M.; Raumonen, P.; Kaasalainen, M. Predicting Tree Structure from Tree Height Using Terrestrial Laser Scanning and Quantitative Structure Models. Silva Fenn. 2014, 48, 1125. [Google Scholar] [CrossRef]
  11. Bazezew, M.N.; Hussin, Y.A.; Kloosterman, E.H. Integrating Airborne LiDAR and Terrestrial Laser Scanner Forest Parameters for Accurate Above-Ground Biomass/Carbon Estimation in Ayer Hitam Tropical Forest, Malaysia. Int. J. Appl. Earth Obs. Geoinf. 2018, 73, 638–652. [Google Scholar] [CrossRef]
  12. Gonzalez de Tanago, J.; Lau, A.; Bartholomeus, H.; Herold, M.; Avitabile, V.; Raumonen, P.; Martius, C.; Goodman, R.C.; Disney, M.; Manuri, S.; et al. Estimation of Above-ground Biomass of Large Tropical Trees with Terrestrial LiDAR. Methods Ecol. Evol. 2018, 9, 223–234. [Google Scholar] [CrossRef]
  13. Malhi, Y.; Jackson, T.; Patrick Bentley, L.; Lau, A.; Shenkin, A.; Herold, M.; Calders, K.; Bartholomeus, H.; Disney, M.I. New Perspectives on the Ecology of Tree Structure and Tree Communities through Terrestrial Laser Scanning. Interface Focus. 2018, 8, 20170052. [Google Scholar] [CrossRef] [PubMed]
  14. Wilkes, P.; Lau, A.; Disney, M.; Calders, K.; Burt, A.; Gonzalez de Tanago, J.; Bartholomeus, H.; Brede, B.; Herold, M. Data Acquisition Considerations for Terrestrial Laser Scanning of Forest Plots. Remote Sens. Environ. 2017, 196, 140–153. [Google Scholar] [CrossRef]
  15. Calders, K.; Newnham, G.; Burt, A.; Murphy, S.; Raumonen, P.; Herold, M.; Culvenor, D.; Avitabile, V.; Disney, M.; Armston, J.; et al. Nondestructive Estimates of Above-ground Biomass Using Terrestrial Laser Scanning. Methods Ecol. Evol. 2015, 6, 198–208. [Google Scholar] [CrossRef]
  16. Bayer, D.; Seifert, S.; Pretzsch, H. Structural Crown Properties of Norway Spruce (Picea Abies [L.] Karst.) and European Beech (Fagus Sylvatica [L.]) in Mixed versus Pure Stands Revealed by Terrestrial Laser Scanning. Trees 2013, 27, 1035–1047. [Google Scholar] [CrossRef]
  17. Lin, Y.; Jiang, M. Toward Extending Terrestrial Laser Scanning Applications in Forestry: A Case Study of Broad- and Needle-Leaf Tree Classification. J. Appl. Remote Sens. 2017, 11, 016037. [Google Scholar] [CrossRef]
  18. Xi, Z.; Hopkinson, C.; Rood, S.B.; Peddle, D.R. See the Forest and the Trees: Effective Machine and Deep Learning Algorithms for Wood Filtering and Tree Species Classification from Terrestrial Laser Scanning. ISPRS J. Photogramm. Remote Sens. 2020, 168, 1–16. [Google Scholar] [CrossRef]
  19. Raumonen, P.; Kaasalainen, M.; Åkerblom, M.; Kaasalainen, S.; Kaartinen, H.; Vastaranta, M.; Holopainen, M.; Disney, M.; Lewis, P. Fast Automatic Precision Tree Models from Terrestrial Laser Scanner Data. Remote Sens. 2013, 5, 491–520. [Google Scholar] [CrossRef]
  20. Hackenberg, J.; Spiecker, H.; Calders, K.; Disney, M.; Raumonen, P. SimpleTree —An Efficient Open Source Tool to Build Tree Models from TLS Clouds. Forests 2015, 6, 4245–4294. [Google Scholar] [CrossRef]
  21. Fan, G.; Nan, L.; Dong, Y.; Su, X.; Chen, F. AdQSM: A New Method for Estimating Above-Ground Biomass from TLS Point Clouds. Remote Sens. 2020, 12, 3089. [Google Scholar] [CrossRef]
  22. Dalla Corte, A.P.; de Vasconcellos, B.N.; Rex, F.E.; Sanquetta, C.R.; Mohan, M.; Silva, C.A.; Klauberg, C.; de Almeida, D.R.A.; Zambrano, A.M.A.; Trautenmüller, J.W.; et al. Applying High-Resolution UAV-LiDAR and Quantitative Structure Modelling for Estimating Tree Attributes in a Crop-Livestock-Forest System. Land 2022, 11, 507. [Google Scholar] [CrossRef]
  23. Krishna Moorthy, S.M.; Raumonen, P.; Van den Bulcke, J.; Calders, K.; Verbeeck, H. Terrestrial Laser Scanning for Non-Destructive Estimates of Liana Stem Biomass. For. Ecol. Manag. 2020, 456, 117751. [Google Scholar] [CrossRef]
  24. Lau, A.; Calders, K.; Bartholomeus, H.; Martius, C.; Raumonen, P.; Herold, M.; Vicari, M.; Sukhdeo, H.; Singh, J.; Goodman, R.C. Tree Biomass Equations from Terrestrial LiDAR: A Case Study in Guyana. Forests 2019, 10, 527. [Google Scholar] [CrossRef]
  25. Muumbe, T.P.; Tagwireyi, P.; Mafuratidze, P.; Hussin, Y.; van Leeuwen, L. Estimating Above-Ground Biomass of Individual Trees with Terrestrial Laser Scanner and 3D Quantitative Structure Modelling. South. For. A J. For. Sci. 2021, 83, 56–68. [Google Scholar] [CrossRef]
  26. Lau, A.; Bentley, L.P.; Martius, C.; Shenkin, A.; Bartholomeus, H.; Raumonen, P.; Malhi, Y.; Jackson, T.; Herold, M. Quantifying Branch Architecture of Tropical Trees Using Terrestrial LiDAR and 3D Modelling. Trees 2018, 32, 1219–1231. [Google Scholar] [CrossRef]
  27. Rodda, S.R.; Nidamanuri, R.R.; Mayamanikandan, T.; Rajashekar, G.; Jha, C.S.; Dadhwal, V.K. Non-Destructive Allometric Modeling for Tree Volume Estimation in Tropical Dry Deciduous Forests of India Using Terrestrial Laser Scanner. J. Indian. Soc. Remote Sens. 2023, 51, 1–15. [Google Scholar] [CrossRef]
  28. Lin, Y.; Hyyppä, J. Towards 3D Basic Theories of Plant Forms. Commun. Biol. 2022, 5, 703. [Google Scholar] [CrossRef]
  29. Lau, A.; Martius, C.; Bartholomeus, H.; Shenkin, A.; Jackson, T.; Malhi, Y.; Herold, M.; Bentley, L.P. Estimating Architecture-Based Metabolic Scaling Exponents of Tropical Trees Using Terrestrial LiDAR and 3D Modelling. For. Ecol. Manag. 2019, 439, 132–145. [Google Scholar] [CrossRef]
  30. Warton, D.I.; Wright, I.J.; Falster, D.S.; Westoby, M. Bivariate Line-Fitting Methods for Allometry. Biol. Rev. 2006, 81, 259. [Google Scholar] [CrossRef]
Figure 1. Three-dimensional allometric models between branch lengths and the cumulative lengths of the child branches based on the first-level branches of individual trees. (a) LB-CLCB allometric model; (b) LB-CHLCB allometric model; (c) LB-CVLCB allometric model; (d) LHB-CLCB allometric model; (e) LHB-CHLCB allometric model; (f) LHB-CVLCB allometric model; (g) LVB-CLCB allometric model; (h) LVB-CHLCB allometric model; (i) LVB-CVLCB allometric model. LB: length of branch; LHB: length of horizontal component of the branch; LVB: length of vertical component of the branch; CLCB: cumulative lengths of child branches; CHLCB: cumulative lengths of horizontal components of child branches; CVLCB: cumulative lengths of vertical components of child branches; R2i: coefficient of determination of tree i; SEi: scaling exponent of tree i; †: not significant at 0.05 probability level; *: significant at 0.05 probability level; without *(†): significant at 0.001 probability level.
Remotesensing 15 05005 g001
Figure 2. Three-dimensional allometric models between branch lengths and the cumulative lengths of the child branches based on the second-level branches of individual trees. (a) LB-CLCB allometric model; (b) LB-CHLCB allometric model; (c) LB-CVLCB allometric model; (d) LHB-CLCB allometric model; (e) LHB-CHLCB allometric model; (f) LHB-CVLCB allometric model; (g) LVB-CLCB allometric model; (h) LVB-CHLCB allometric model; (i) LVB-CVLCB allometric model. LB: length of branch; LHB: length of horizontal component of the branch; LVB: length of vertical component of the branch; CLCB: cumulative lengths of child branches; CHLCB: cumulative lengths of horizontal components of child branches; CVLCB: cumulative lengths of vertical components of child branches; R2i: coefficient of determination of tree i; SEi: scaling exponent of tree i. All models are significant at 0.001 probability level.
Remotesensing 15 05005 g002
Figure 3. Three-dimensional allometric models between branch lengths and the cumulative lengths of the child branches based on the third-level branches of individual trees. (a) LB-CLCB allometric model; (b) LB-CHLCB allometric model; (c) LB-CVLCB allometric model; (d) LHB-CLCB allometric model; (e) LHB-CHLCB allometric model; (f) LHB-CVLCB allometric model; (g) LVB-CLCB allometric model; (h) LVB-CHLCB allometric model; (i) LVB-CVLCB allometric model. LB: length of branch; LHB: length of horizontal component of the branch; LVB: length of vertical component of the branch; CLCB: cumulative lengths of child branches; CHLCB: cumulative lengths of horizontal components of child branches; CVLCB: cumulative lengths of vertical components of child branches; R2i: coefficient of determination of tree i; SEi: scaling exponent of tree i. All models are significant at 0.001 probability level.
Remotesensing 15 05005 g003
Figure 4. Three-dimensional allometric models between branch lengths and the cumulative lengths of the child branches based on the fourth-level branches of individual trees. (a) LB-CLCB allometric model; (b) LB-CHLCB allometric model; (c) LB-CVLCB allometric model; (d) LHB-CLCB allometric model; (e) LHB-CHLCB allometric model; (f) LHB-CVLCB allometric model; (g) LVB-CLCB allometric model; (h) LVB-CHLCB allometric model; (i) LVB-CVLCB allometric model. LB: length of branch; LHB: length of horizontal component of the branch; LVB: length of vertical component of the branch; CLCB: cumulative lengths of child branches; CHLCB: cumulative lengths of horizontal components of child branches; CVLCB: cumulative lengths of vertical components of child branches; R2i: coefficient of determination of tree i; SEi: scaling exponent of tree i. All models are significant at 0.001 probability level.
Remotesensing 15 05005 g004
Figure 5. The variation in scaling exponents of allometric models between branch lengths and the cumulative lengths of the child branches for individual trees at different branching levels. (a) LB-CLCB allometric model; (b) LB-CHLCB allometric model; (c) LB-CVLCB allometric model; (d) LHB-CLCB allometric model; (e) LHB-CHLCB allometric model; (f) LHB-CVLCB allometric model; (g) LVB-CLCB allometric model; (h) LVB-CHLCB allometric model; (i) LVB-CVLCB allometric model. LB: length of branch; LHB: length of horizontal component of the branch; LVB: length of vertical component of the branch; CLCB: cumulative lengths of child branches; CHLCB: cumulative lengths of horizontal components of child branches; CVLCB: cumulative lengths of vertical components of the child branches.
Remotesensing 15 05005 g005
Figure 6. Three-dimensional allometric models between branch lengths and the cumulative lengths of the descendant branches based on the first-level branches of individual trees. (a) LB-CLDB allometric model; (b) LB-CHLDB allometric model; (c) LB-CVLDB allometric model; (d) LHB-CLDB allometric model; (e) LHB-CHLDB allometric model; (f) LHB-CVLDB allometric model; (g) LVB-CLDB allometric model; (h) LVB-CHLDB allometric model; (i) LVB-CVLDB allometric model. LB: length of branch; LHB: length of horizontal component of the branch; LVB: length of vertical component of the branch; CLDB: cumulative lengths of descendant branches; CHLDB: cumulative lengths of horizontal components of descendant branches; CVLDB: cumulative lengths of vertical components of descendant branches; R2i: coefficient of determination of tree i; SEi: scaling exponent of tree i; †: not significant at 0.05 probability level; *: significant at 0.05 probability level; without *(†): significant at 0.001 probability level.
Remotesensing 15 05005 g006
Figure 7. Three-dimensional allometric models between branch lengths and the cumulative lengths of the descendant branches based on the second-level branches of individual trees. (a) LB-CLDB allometric model; (b) LB-CHLDB allometric model; (c) LB-CVLDB allometric model; (d) LHB-CLDB allometric model; (e) LHB-CHLDB allometric model; (f) LHB-CVLDB allometric model; (g) LVB-CLDB allometric model; (h) LVB-CHLDB allometric model; (i) LVB-CVLDB allometric model. LB: length of branch; LHB: length of horizontal component of the branch; LVB: length of vertical component of the branch; CLDB: cumulative lengths of descendant branches; CHLDB: cumulative lengths of horizontal components of descendant branches; CVLDB: cumulative lengths of vertical components of descendant branches; R2i: coefficient of determination of tree i; SEi: scaling exponent of tree i. All models are significant at 0.001 probability level.
Remotesensing 15 05005 g007
Figure 8. Three-dimensional allometric models between branch lengths and the cumulative lengths of the descendant branches based on the third-level branches of individual trees. (a) LB-CLDB allometric model; (b) LB-CHLDB allometric model; (c) LB-CVLDB allometric model; (d) LHB-CLDB allometric model; (e) LHB-CHLDB allometric model; (f) LHB-CVLDB allometric model; (g) LVB-CLDB allometric model; (h) LVB-CHLDB allometric model; (i) LVB-CVLDB allometric model. LB: length of branch; LHB: length of horizontal component of the branch; LVB: length of vertical component of the branch; CLDB: cumulative lengths of descendant branches; CHLDB: cumulative lengths of horizontal components of descendant branches; CVLDB: cumulative lengths of vertical components of descendant branches; R2i: coefficient of determination of tree i; SEi: scaling exponent of tree i. All models are significant at 0.001 probability level.
Remotesensing 15 05005 g008
Figure 9. Three-dimensional allometric models between branch lengths and the cumulative lengths of the descendant branches based on the fourth-level branches of individual trees. (a) LB-CLDB allometric model; (b) LB-CHLDB allometric model; (c) LB-CVLDB allometric model; (d) LHB-CLDB allometric model; (e) LHB-CHLDB allometric model; (f) LHB-CVLDB allometric model; (g) LVB-CLDB allometric model; (h) LVB-CHLDB allometric model; (i) LVB-CVLDB allometric model. LB: length of branch; LHB: length of horizontal component of the branch; LVB: length of vertical component of the branch; CLDB: cumulative lengths of descendant branches; CHLDB: cumulative lengths of horizontal components of descendant branches; CVLDB: cumulative lengths of vertical components of descendant branches; R2i: coefficient of determination of tree i; SEi: scaling exponent of tree i. All models are significant at 0.001 probability level.
Remotesensing 15 05005 g009
Figure 10. The variation in scaling exponents of allometric models between branch lengths and the cumulative lengths of the descendant branches for individual trees at different branching levels. (a) LB-CLDB allometric model; (b) LB-CHLDB allometric model; (c) LB-CVLDB allometric model; (d) LHB-CLDB allometric model; (e) LHB-CHLDB allometric model; (f) LHB-CVLDB allometric model; (g) LVB-CLDB allometric model; (h) LVB-CHLDB allometric model; (i) LVB-CVLDB allometric model. LB: length of branch; LHB: length of horizontal component of the branch; LVB: length of vertical component of the branch; CLDB: cumulative lengths of descendant branches; CHLDB: cumulative lengths of horizontal components of descendant branches; CVLDB: cumulative lengths of vertical components of descendant branches.
Remotesensing 15 05005 g010
Table 1. Branch information.
TreeIDBranching Level
12345678910
GUY0142/163408/7052082/17544561/26685498/27795055/21483128/1077954/275176/4781/21
GUY0242/119291/4291369/11083222/16914108/16393068/10221377/397391/10075/18-
GUY0342/136440/5251746/12843737/19825137/20974103/14722540/8291176/340384/9796/23
GUY0442/137360/4931559/12013575/18013946/15642670/8821302/394492/134158/41-
GUY0537/119375/5271925/13704024/21325263/22894631/18253225/10531441/405403/10481/21
GUY0633/144354/5171717/14054094/22795114/21703662/12851666/501498/12992/24-
GUY0731/169354/6551870/15973687/20243344/14131835/698792/287288/96--
GUY0837/204488/9413017/25977028/39277819/34345070/18662202/729628/175106/27-
GUY0936/137353/5051438/11862930/16533259/15782594/10361255/414338/10580/27-
GUY1044/141475/5151727/11783648/17324063/15342722/9151406/407462/119--
Note: The value before the forward slash means the number of branches; the value after the forward slash means the total length of these branches, and the unit is m.
Table 2. Comparison of coefficients of determination (R2) between allometric and linear models using the cumulative lengths of the child branches based on the first-level branches.
TreeIDLB-CLCBLB-CHLCBLB-CVLCBLHB-CLCBLHB-CHLCBLHB-CVLCBLVB-CLCBLVB-CHLCBLVB-CVLCB
GUY010.9/0.950.87/0.930.85/0.940.05/0.530.16/0.60/0.440.84/0.510.71/0.460.88/0.59
GUY020.89/0.930.82/0.90.89/0.70.47/0.460.49/0.470.46/0.320.88/0.730.81/0.680.89/0.55
GUY030.96/0.920.96/0.910.94/0.890.15/0.420.23/0.420.12/0.430.94/0.630.93/0.630.93/0.62
GUY040.92/0.930.8/0.930.93/0.850.34/0.490.48/0.530.14/0.380.87/0.860.72/0.820.95/0.88
GUY050.94/0.90.89/0.880.94/0.890.09/0.220.17/0.280.02/0.140.86/0.570.77/0.510.93/0.65
GUY060.9/0.920.88/0.890.88/0.920.08/0.570.13/0.590.04/0.510.87/0.590.79/0.540.93/0.65
GUY070.96/0.970.95/0.970.85/0.850.48/0.850.52/0.870.35/0.710.92/0.860.9/0.840.84/0.79
GUY080.87/0.960.88/0.930.81/0.960.26/0.720.29/0.730.19/0.680.67/0.510.66/0.470.68/0.55
GUY090.87/0.90.95/0.90.73/0.840.08/0.50.16/0.530.02/0.450.87/0.530.9/0.540.79/0.48
GUY100.92/0.940.91/0.930.86/0.920.35/0.710.38/0.740.27/0.640.87/0.550.84/0.510.88/0.59
Note: The value before the forward slash means the R2 of the linear model; the value after the forward slash means the R2 of the allometric model. LB: length of branch; LHB: length of horizontal component of the branch; LVB: length of vertical component of the branch; CLCB: cumulative lengths of child branches; CHLCB: cumulative lengths of horizontal components of child branches; CVLCB: cumulative lengths of vertical components of child branches.
Table 3. Comparison of coefficients of determination (R2) between allometric and linear models using the cumulative lengths of the child branches based on the second-level branches.
TreeIDLB-CLCBLB-CHLCBLB-CVLCBLHB-CLCBLHB-CHLCBLHB-CVLCBLVB-CLCBLVB-CHLCBLVB-CVLCB
GUY010.9/0.860.84/0.830.87/0.780.49/0.630.55/0.640.39/0.540.82/0.490.73/0.430.86/0.5
GUY020.91/0.880.85/0.870.85/0.790.62/0.570.73/0.610.45/0.450.84/0.560.7/0.510.88/0.57
GUY030.88/0.870.9/0.840.79/0.840.35/0.630.45/0.620.23/0.580.83/0.590.8/0.540.8/0.59
GUY040.89/0.880.88/0.870.85/0.850.62/0.750.68/0.750.51/0.690.77/0.430.71/0.40.82/0.46
GUY050.87/0.880.88/0.870.78/0.810.42/0.560.52/0.590.27/0.460.77/0.370.71/0.330.77/0.42
GUY060.9/0.880.87/0.870.89/0.810.62/0.70.64/0.710.53/0.620.73/0.430.66/0.390.8/0.44
GUY070.9/0.870.88/0.860.85/0.750.79/0.680.79/0.70.71/0.540.6/0.380.56/0.360.63/0.38
GUY080.85/0.890.84/0.880.78/0.820.64/0.810.66/0.810.53/0.720.61/0.410.56/0.380.66/0.43
GUY090.88/0.850.87/0.840.82/0.770.58/0.720.61/0.730.46/0.620.77/0.440.72/0.410.79/0.45
GUY100.88/0.880.89/0.870.8/0.760.72/0.780.77/0.790.59/0.650.68/0.450.65/0.420.72/0.4
Note: The value before the forward slash means the R2 of the linear model; the value after the forward slash means the R2 of the allometric model. LB: length of branch; LHB: length of horizontal component of the branch; LVB: length of vertical component of the branch; CLCB: cumulative lengths of child branches; CHLCB: cumulative lengths of horizontal components of child branches; CVLCB: cumulative lengths of vertical components of child branches.
Table 4. Comparison of coefficients of determination (R2) between allometric and linear models using the cumulative lengths of the child branches based on the third-level branches.
TreeIDLB-CLCBLB-CHLCBLB-CVLCBLHB-CLCBLHB-CHLCBLHB-CVLCBLVB-CLCBLVB-CHLCBLVB-CVLCB
GUY010.81/0.780.8/0.740.77/0.690.48/0.560.54/0.580.35/0.410.67/0.340.6/0.280.75/0.38
GUY020.85/0.810.82/0.760.82/0.710.51/0.540.58/0.560.39/0.380.66/0.340.58/0.280.73/0.37
GUY030.84/0.80.82/0.780.78/0.680.56/0.590.61/0.610.45/0.430.71/0.390.65/0.340.73/0.4
GUY040.84/0.810.82/0.770.83/0.70.67/0.570.68/0.580.6/0.430.68/0.370.64/0.310.74/0.39
GUY050.83/0.80.82/0.790.8/0.650.61/0.580.64/0.60.53/0.410.63/0.340.59/0.30.67/0.34
GUY060.81/0.80.8/0.780.74/0.690.62/0.610.65/0.620.53/0.470.56/0.250.52/0.220.57/0.27
GUY070.8/0.780.78/0.750.75/0.640.67/0.590.69/0.610.57/0.430.44/0.270.38/0.230.49/0.29
GUY080.79/0.80.78/0.780.74/0.680.6/0.60.64/0.620.49/0.440.45/0.240.39/0.20.54/0.27
GUY090.79/0.740.79/0.710.68/0.620.68/0.530.72/0.560.52/0.390.53/0.290.48/0.240.55/0.31
GUY100.81/0.790.81/0.770.76/0.660.64/0.580.68/0.60.55/0.440.51/0.260.47/0.230.56/0.25
Note: The value before the forward slash means the R2 of the linear model; the value after the forward slash means the R2 of the allometric model. LB: length of branch; LHB: length of horizontal component of the branch; LVB: length of vertical component of the branch; CLCB: cumulative lengths of child branches; CHLCB: cumulative lengths of horizontal components of child branches; CVLCB: cumulative lengths of vertical components of child branches.
Table 5. Comparison of coefficients of determination (R2) between allometric and linear models using the cumulative lengths of the child branches based on the fourth-level branches.
TreeIDLB-CLCBLB-CHLCBLB-CVLCBLHB-CLCBLHB-CHLCBLHB-CVLCBLVB-CLCBLVB-CHLCBLVB-CVLCB
GUY010.79/0.750.78/0.720.75/0.590.57/0.510.62/0.530.46/0.320.56/0.250.5/0.20.61/0.26
GUY020.75/0.730.74/0.680.71/0.550.55/0.470.6/0.510.43/0.260.49/0.230.43/0.170.55/0.27
GUY030.79/0.760.79/0.720.73/0.610.61/0.540.64/0.560.52/0.360.56/0.240.53/0.190.58/0.27
GUY040.79/0.710.77/0.660.72/0.550.68/0.470.71/0.480.54/0.30.37/0.230.31/0.180.46/0.24
GUY050.77/0.760.77/0.720.73/0.630.66/0.540.69/0.560.58/0.370.5/0.280.46/0.220.53/0.3
GUY060.75/0.740.73/0.690.72/0.590.58/0.530.59/0.550.49/0.340.45/0.220.4/0.160.51/0.24
GUY070.67/0.660.64/0.630.66/0.460.56/0.440.58/0.480.46/0.240.32/0.170.26/0.130.41/0.18
GUY080.74/0.740.72/0.690.69/0.590.57/0.490.59/0.530.46/0.310.39/0.20.34/0.150.46/0.23
GUY090.73/0.70.72/0.680.67/0.510.62/0.460.64/0.510.51/0.270.36/0.180.32/0.130.41/0.2
GUY100.77/0.720.76/0.680.7/0.570.59/0.520.62/0.540.49/0.360.45/0.20.4/0.160.5/0.2
Note: The value before the forward slash means the R2 of the linear model; the value after the forward slash means the R2 of the allometric model. LB: length of branch; LHB: length of horizontal component of the branch; LVB: length of vertical component of the branch; CLCB: cumulative lengths of child branches; CHLCB: cumulative lengths of horizontal components of child branches; CVLCB: cumulative lengths of vertical components of child branches.
Table 6. Comparison of coefficients of determination (R2) between allometric and linear models using the cumulative lengths of the descendant branches based on the first-level branches.
TreeIDLB-CLDBLB-CHLDBLB-CVLDBLHB-CLDBLHB-CHLDBLHB-CVLDBLVB-CLDBLVB-CHLDBLVB-CVLDB
GUY010.82/0.940.83/0.940.81/0.940/0.480/0.490/0.450.86/0.520.86/0.510.85/0.54
GUY020.84/0.950.84/0.940.83/0.820.38/0.440.38/0.460.38/0.360.84/0.750.84/0.730.83/0.65
GUY030.8/0.920.8/0.920.79/0.920.01/0.360.01/0.360.01/0.380.83/0.620.84/0.610.82/0.63
GUY040.72/0.950.73/0.950.7/0.890.06/0.470.07/0.490.04/0.410.74/0.860.75/0.850.73/0.89
GUY050.86/0.940.86/0.940.85/0.920.02/0.190.02/0.220.01/0.150.87/0.630.87/0.60.87/0.65
GUY060.8/0.950.79/0.950.81/0.950.02/0.570.02/0.570.02/0.550.85/0.610.84/0.60.88/0.63
GUY070.92/0.970.93/0.970.92/0.90.3/0.810.3/0.830.3/0.740.95/0.880.96/0.870.94/0.84
GUY080.81/0.960.81/0.940.8/0.960.07/0.640.08/0.660.06/0.620.8/0.550.78/0.530.81/0.58
GUY090.77/0.940.79/0.940.74/0.910/0.480.01/0.480/0.470.87/0.590.88/0.60.84/0.55
GUY100.71/0.950.71/0.960.7/0.930.2/0.660.2/0.670.19/0.620.77/0.610.78/0.590.77/0.63
Note: The value before the forward slash means the R2 of the linear model; the value after the forward slash means the R2 of the allometric model. LB: length of branch; LHB: length of horizontal component of the branch; LVB: length of vertical component of the branch; CLDB: cumulative lengths of child branches; CHLDB: cumulative lengths of horizontal components of child branches; CVLDB: cumulative lengths of vertical components of child branches.
Table 7. Comparison of coefficients of determination (R2) between allometric and linear models using the cumulative lengths of the descendant branches based on the second-level branches.
TreeIDLB-CLDBLB-CHLDBLB-CVLDBLHB-CLDBLHB-CHLDBLHB-CVLDBLVB-CLDBLVB-CHLDBLVB-CVLDB
GUY010.77/0.860.76/0.850.76/0.820.36/0.630.38/0.640.33/0.570.75/0.50.73/0.460.76/0.51
GUY020.81/0.90.81/0.890.78/0.840.49/0.590.53/0.620.42/0.510.79/0.550.77/0.520.79/0.57
GUY030.6/0.870.62/0.850.57/0.850.12/0.610.13/0.610.1/0.580.64/0.580.64/0.550.62/0.59
GUY040.71/0.890.71/0.880.7/0.870.37/0.740.38/0.750.35/0.70.74/0.450.73/0.430.75/0.47
GUY050.6/0.880.62/0.880.59/0.840.16/0.560.17/0.580.14/0.490.64/0.370.64/0.340.64/0.4
GUY060.76/0.880.75/0.880.76/0.840.45/0.690.45/0.70.43/0.640.7/0.440.68/0.420.72/0.45
GUY070.74/0.880.74/0.870.72/0.80.66/0.70.67/0.720.63/0.610.48/0.370.47/0.350.48/0.37
GUY080.6/0.890.61/0.880.58/0.850.37/0.80.38/0.80.34/0.740.55/0.410.54/0.40.57/0.44
GUY090.76/0.850.76/0.850.75/0.810.45/0.710.46/0.720.42/0.650.7/0.460.69/0.440.72/0.47
GUY100.66/0.880.67/0.870.65/0.80.49/0.770.5/0.780.47/0.690.63/0.440.62/0.420.64/0.42
Note: The value before the forward slash means the R2 of the linear model; the value after the forward slash means the R2 of the allometric model. LB: length of branch; LHB: length of horizontal component of the branch; LVB: length of vertical component of the branch; CLDB: cumulative lengths of child branches; CHLDB: cumulative lengths of horizontal components of child branches; CVLDB: cumulative lengths of vertical components of child branches.
Table 8. Comparison of coefficients of determination (R2) between allometric and linear models using the cumulative lengths of the descendant branches based on the third-level branches.
TreeIDLB-CLDBLB-CHLDBLB-CVLDBLHB-CLDBLHB-CHLDBLHB-CVLDBLVB-CLDBLVB-CHLDBLVB-CVLDB
GUY010.62/0.790.62/0.760.6/0.720.3/0.560.33/0.570.25/0.440.57/0.340.54/0.30.61/0.38
GUY020.74/0.810.74/0.780.73/0.740.41/0.540.45/0.560.34/0.420.61/0.340.57/0.290.65/0.37
GUY030.68/0.810.68/0.790.65/0.720.41/0.590.43/0.610.36/0.470.62/0.390.6/0.360.62/0.41
GUY040.72/0.810.7/0.790.73/0.730.56/0.570.56/0.580.54/0.460.62/0.370.59/0.320.66/0.4
GUY050.7/0.810.7/0.80.69/0.690.48/0.580.5/0.60.45/0.440.57/0.340.56/0.310.59/0.36
GUY060.68/0.810.68/0.790.65/0.730.5/0.610.51/0.620.46/0.50.51/0.260.49/0.230.53/0.28
GUY070.66/0.780.64/0.760.66/0.680.57/0.590.58/0.610.53/0.470.33/0.270.29/0.230.38/0.29
GUY080.65/0.80.64/0.790.64/0.720.49/0.590.51/0.620.42/0.470.39/0.240.35/0.210.46/0.28
GUY090.67/0.740.66/0.730.66/0.660.57/0.540.58/0.560.53/0.420.48/0.290.45/0.250.52/0.32
GUY100.65/0.790.65/0.780.62/0.70.51/0.580.53/0.60.46/0.470.42/0.260.4/0.230.45/0.26
Note: The value before the forward slash means the R2 of the linear model; the value after the forward slash means the R2 of the allometric model. LB: length of branch; LHB: length of horizontal component of the branch; LVB: length of vertical component of the branch; CLDB: cumulative lengths of child branches; CHLDB: cumulative lengths of horizontal components of child branches; CVLDB: cumulative lengths of vertical components of child branches.
Table 9. Comparison of coefficients of determination (R2) between allometric and linear models using the cumulative lengths of the descendant branches based on the fourth-level branches.
TreeIDLB-CLDBLB-CHLDBLB-CVLDBLHB-CLDBLHB-CHLDBLHB-CVLDBLVB-CLDBLVB-CHLDBLVB-CVLDB
GUY010.79/0.750.78/0.720.75/0.590.57/0.510.62/0.530.46/0.320.56/0.250.5/0.20.61/0.26
GUY020.75/0.730.74/0.680.71/0.550.55/0.470.6/0.510.43/0.260.49/0.230.43/0.170.55/0.27
GUY030.79/0.760.79/0.720.73/0.610.61/0.540.64/0.560.52/0.360.56/0.240.53/0.190.58/0.27
GUY040.79/0.710.77/0.660.72/0.550.68/0.470.71/0.480.54/0.30.37/0.230.31/0.180.46/0.24
GUY050.77/0.760.77/0.720.73/0.630.66/0.540.69/0.560.58/0.370.5/0.280.46/0.220.53/0.3
GUY060.75/0.740.73/0.690.72/0.590.58/0.530.59/0.550.49/0.340.45/0.220.4/0.160.51/0.24
GUY070.67/0.660.64/0.630.66/0.460.56/0.440.58/0.480.46/0.240.32/0.170.26/0.130.41/0.18
GUY080.74/0.740.72/0.690.69/0.590.57/0.490.59/0.530.46/0.310.39/0.20.34/0.150.46/0.23
GUY090.73/0.70.72/0.680.67/0.510.62/0.460.64/0.510.51/0.270.36/0.180.32/0.130.41/0.2
GUY100.77/0.720.76/0.680.7/0.570.59/0.520.62/0.540.49/0.360.45/0.20.4/0.160.5/0.2
Note: The value before the forward slash means the R2 of the linear model; the value after the forward slash means the R2 of the allometric model. LB: length of branch; LHB: length of horizontal component of the branch; LVB: length of vertical component of the branch; CLDB: cumulative lengths of child branches; CHLDB: cumulative lengths of horizontal components of child branches; CVLDB: cumulative lengths of vertical components of child branches.
Disclaimer/Publisher’s Note: The statements, opinions and data contained in all publications are solely those of the individual author(s) and contributor(s) and not of MDPI and/or the editor(s). MDPI and/or the editor(s) disclaim responsibility for any injury to people or property resulting from any ideas, methods, instructions or products referred to in the content.

