Article

Analysis of the Controlling Effect of Excess Topography on the Distribution of Coseismic Landslides during the Iburi Earthquake, Japan, on 6 September 2018

1
Institute of Geology, China Earthquake Administration, Beijing 100029, China
2
Key Laboratory of Seismic and Volcanic Hazards, China Earthquake Administration, Beijing 100029, China
3
National Institute of Natural Hazards, Ministry of Emergency Management of China, Beijing 100085, China
4
Key Laboratory of Compound and Chained Natural Hazards Dynamics, Ministry of Emergency Management of China, Beijing 100085, China
*
Author to whom correspondence should be addressed.
Remote Sens. 2023, 15(20), 5035; https://doi.org/10.3390/rs15205035
Submission received: 12 September 2023 / Revised: 10 October 2023 / Accepted: 18 October 2023 / Published: 20 October 2023

Abstract

:
Coseismic landslides cause changes in the hillside material, and this erosion process plays an important role in the evolution of the topography. Previous studies seldom involved research on the influence of excess topography on the occurrences of coseismic landslides. The Iburi earthquake, which occurred in Japan on 6 September 2018 and triggered a large number of landslides, provided a research example to explore the relationship between coseismic landslides and excess topography. We used the average slope of the lithology as the threshold slope of the corresponding stratum to calculate the excess topography of the different lithological units. Based on the advanced spaceborne thermal emission and reflection radiometer (ASTER) digital elevation model (DEM) with a resolution of 30 m, a quantitative analysis was conducted on the excess topography in the study area. The results indicate that the excess topography in the study area was mainly distributed in the valleys on both sides of the river, and the thickness of the excess topography on the high and steep ridges was generally greater than that at the foot of the slope, which has a relatively flat topography or a low elevation. In the area affected by the earthquake, approximately 94.66% of the coseismic landslides (with an area of approximately 28.23 m2) developed in the excess topography area, indicating that the distribution of the excess topography had a strong controlling influence on the spatial distribution of the coseismic landslides. The Iburi earthquake mainly induced shallow landslides, but the thickness of the landslide body was much smaller than the excess topography height in the landslides-affected area. This may imply that the excess topography was not completely removed by the coseismic landslides, and the areas where the earthquake landslides occurred still have the possibility of producing landslides in the future.

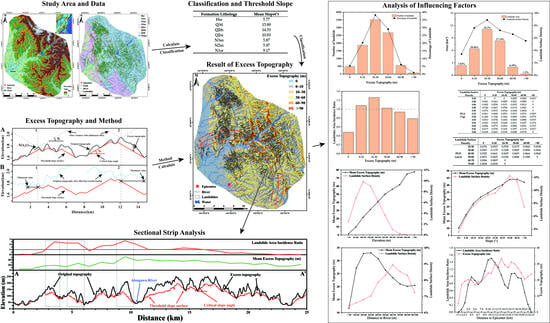
Graphical Abstract

1. Introduction

Coseismic landslides have an increasingly serious impact on human society because of their suddenness, wide distribution, and high degree of harm [1]. In addition, the denudation and accumulation caused by coseismic landslides cause significant changes in the geomorphology of the earthquake area, thus playing a very important role in the evolution of the geomorphology. Therefore, prediction of the potential locations of landslides is important for assessment of landslide hazards at a regional scale.
It is well known that landslides are a result of the balance between rock uplift and erosion, which is reflected by topography [2,3,4,5,6,7,8,9]. From an engineering geological perspective, the key controls on hillslope stability include the material strength controlled by the cohesion and internal friction, the slope and discontinuity geometry, and the transient loading imposed by the water content and seismic ground acceleration. Under seismic conditions, the strong shaking of an earthquake changes the internal structure of the slope, and thus destroys its stability, leading to the development of a landslide. Hence, the weight of the slope material, which can be represented by its topographic features, plays an important role in the occurrences of landslides because of limitations in material strength.
In addition, the topography can also affect the development of landslides [10,11,12,13]. Many studies have shown that areas with a high and steep topography are prone to landslides. For example, the threshold slope is the average value of the internal friction angle that controls the stability of a hill [14]. The internal friction angle is one of the shear strength indicators that can reflect the size of the internal friction between the particles inside the rock and soil. Internal friction is the mechanism of landslide development. From an engineering geological perspective, the key controls on hillslope stability include the material strength controlled by the cohesion and internal friction, the slope and discontinuity geometry, and the transient loading imposed by the water content and seismic ground acceleration. Based on the recognition of the threshold slope, Blöthe et al. first proposed the concept of excess topography [15]. Excess topography refers to a potentially unstable mountain with a slope greater than the threshold slope, which is an important material basis for the occurrence of landslides. When the slope is close to the threshold slope, the time scale on which some topography evolution models can be applied is greatly affected [16]. Quantification of the excess topography allows for a clear analysis of the importance of slope erosion in regional topographic evolution. If the gravitational potential energy generated by the topography through the height and slope exceeds the range that the mountain can bear, landslides may occur to unload the excess topography and reduce the gravitational potential energy of the mountain [15]. Thus, it becomes possible to recognize the potential locations of landslides through the location of excess topography.
The scale and distribution of earthquake landslides are closely related to the seismogenic fault, magnitude, and local geological and geomorphological conditions. Previous studies mainly analyzed the spatial distribution characteristics of earthquake landslides through the inherent characteristics of the slope itself and the external triggering conditions of earthquakes and focused on the control of landslides by the slope, elevation, and aspect in terms of the topographic factors [17,18,19,20,21,22,23,24]. However, existing studies have shown that there are significant differences in the development characteristics of coseismic landslides in different regions and under different topographic conditions [13]. This hints at the complexity of landslide-prone environments and their influencing factors. In general, less consideration has been given to geomorphic processes [25].
The geological and geomorphic background of the Iburi earthquake in Japan was significantly different from that in the Himalayan region where Blöthe et al. initially applied the concept of excess topography to study large landslides [15]. Therefore, the Iburi earthquake provides an example for studying the influence of excess topography on coseismic landslides from multiple perspectives and can further verify the validity of such methods. In this paper, we use the average slope of different strata as the threshold slope. We analyze the distribution of the coseismic landslides caused by the Iburi earthquake based on the geomorphic characteristics at the regional scale. Then, by calculating the excess topography in the study area, we quantitatively analyze its relationship with the distribution of coseismic landslides. We also discuss the influence of the geomorphologic features on coseismic landslides, which is helpful for predicting the hazard areas by investigating the geomorphological characteristics in a special area. The excess topography can be used for potential risk analysis of earthquake landslides and assessment of remaining unstable slopes after disasters.

2. Study Area

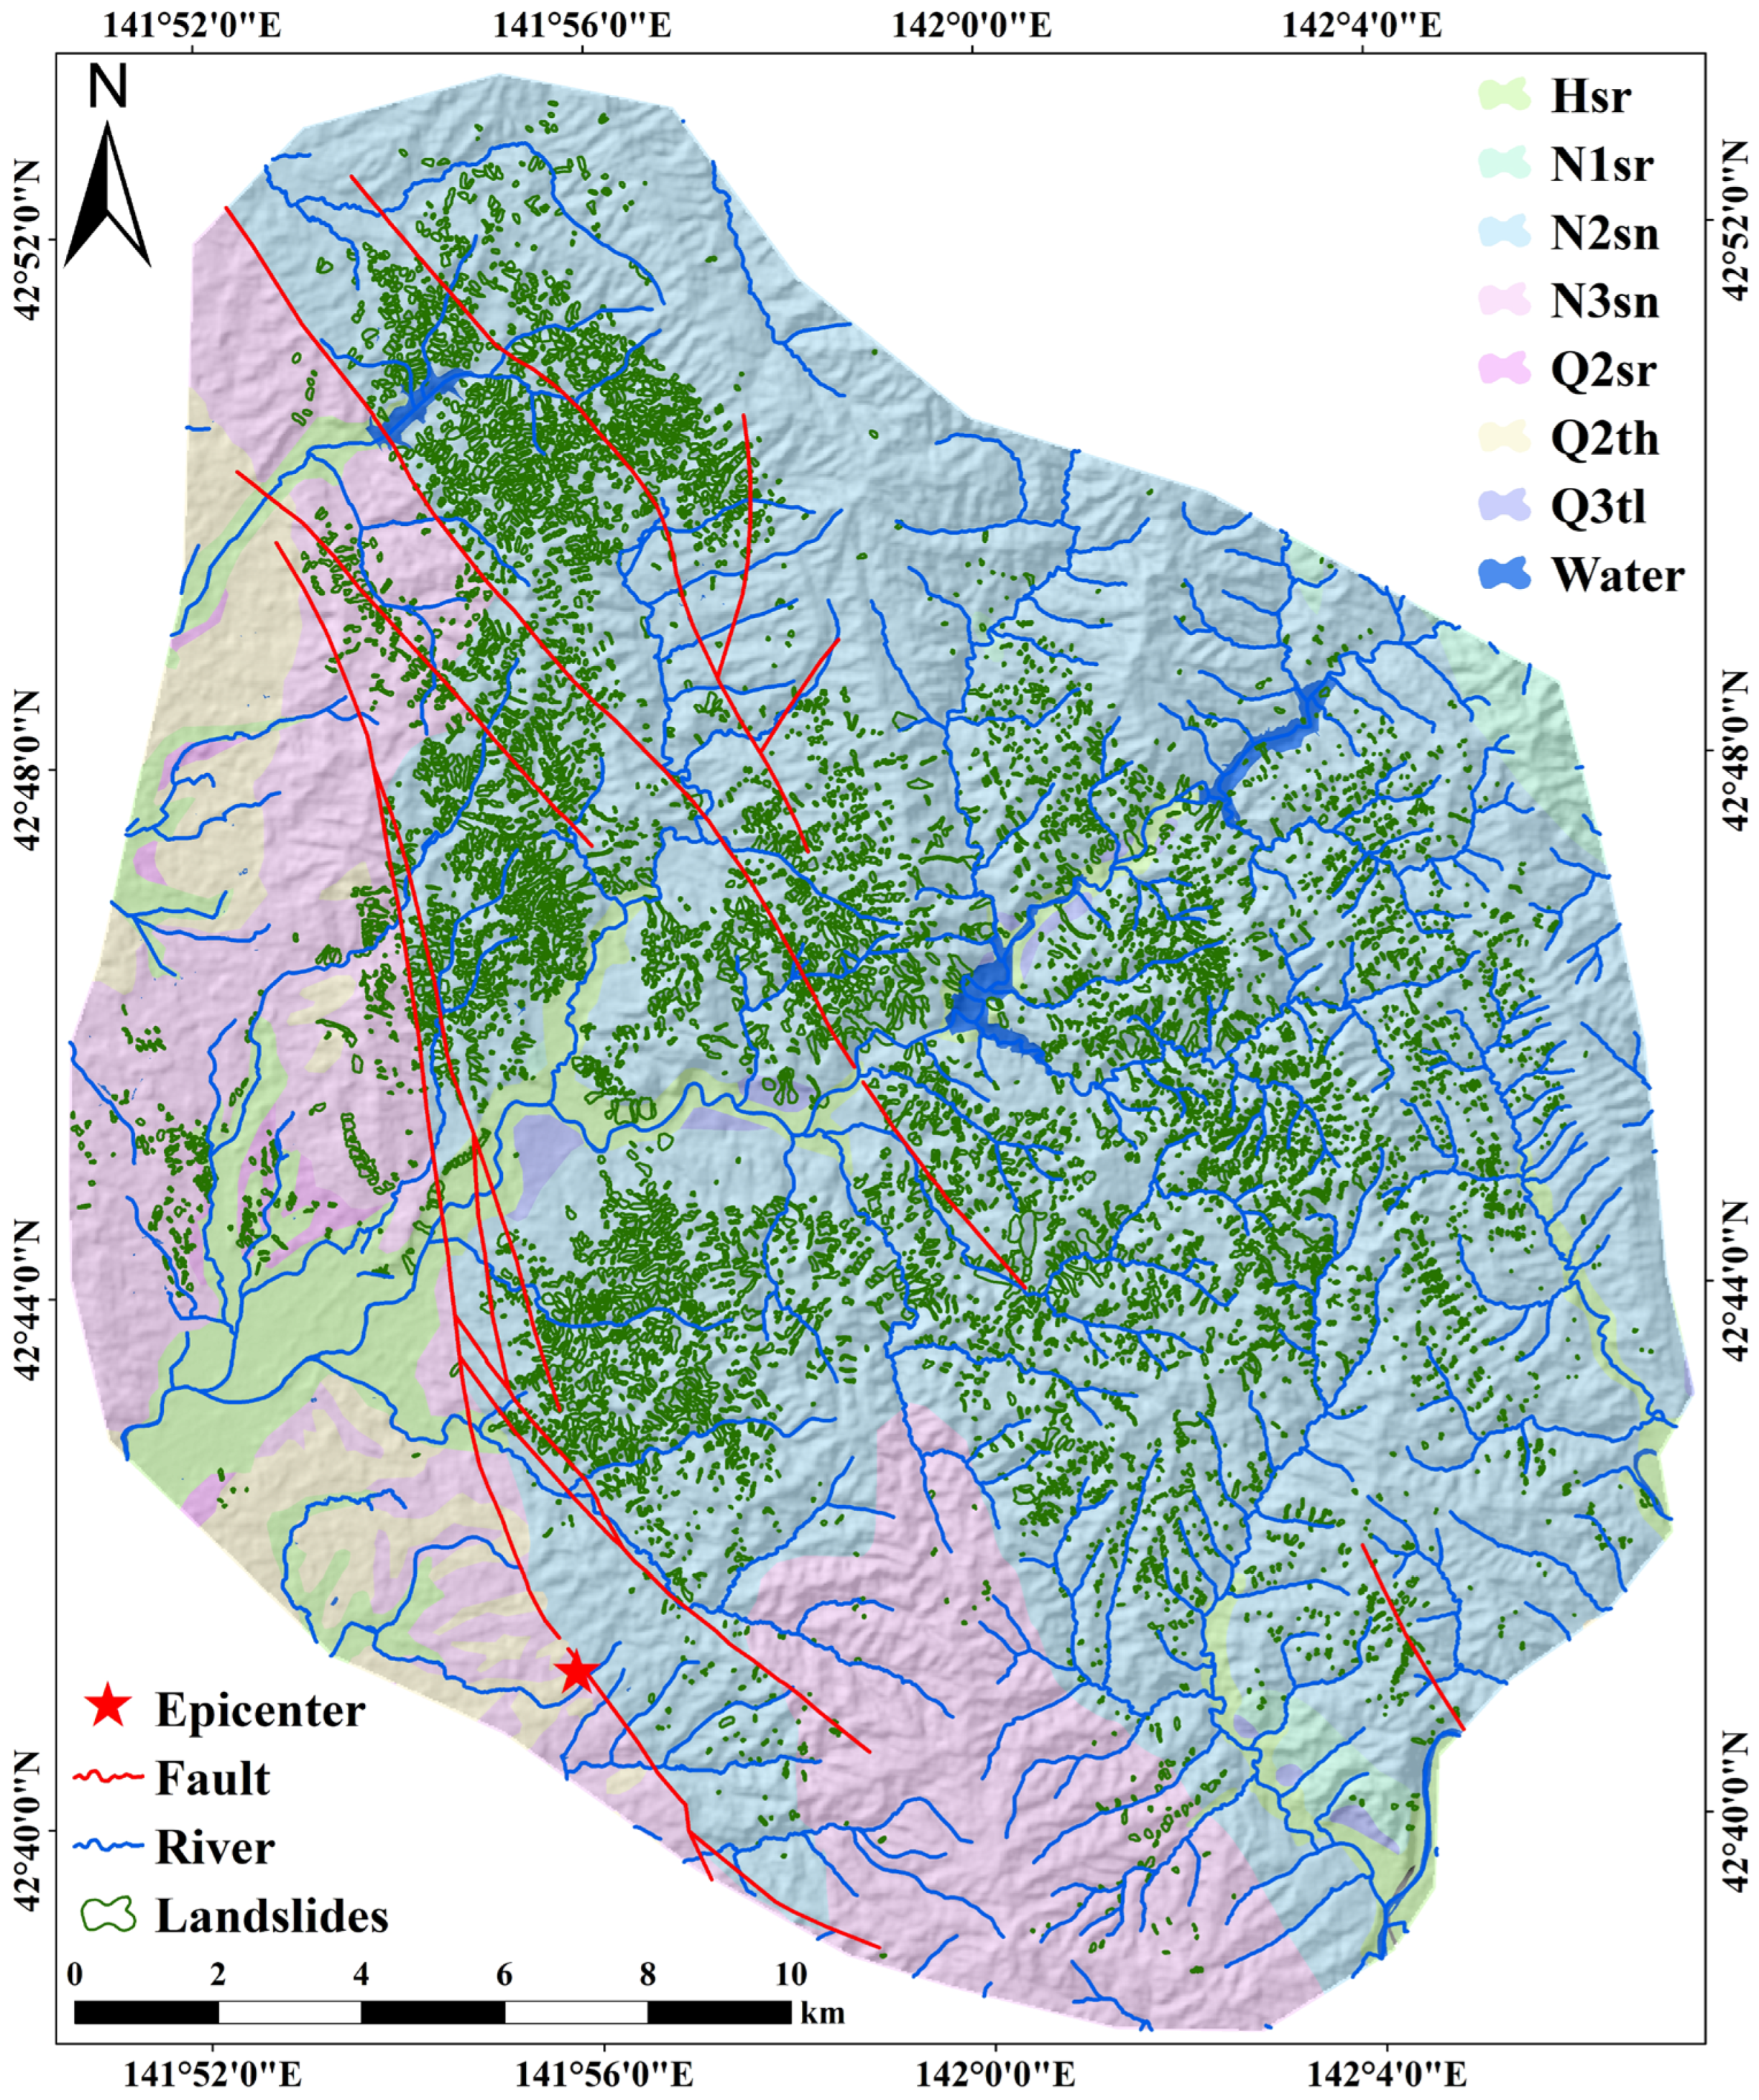
At 03:08 a.m. on 6 September 2018 (Japan Time), an Mw 6.6 earthquake occurred in the Oshima Belt region, east of Tomakomai on the island of Hokkaido, Japan. The epicenter was located at 42.72°N, 142.0°E (Figure 1). The seismic region was located at the junction of the North American Plate and the Eurasian Plate. The area to the southwest of the epicenter is a plain residential area, while the area to the northeast is hilly and mountainous. The Atsugawa River is mainly developed nearby. The study area is irregular, and the Atsugawa River is mainly distributed to the northeast of the epicenter.
The area is dominated by hills with a medium gradient. The maximum height is less than 500 m, and the mean elevation is 146 m. The lithology data were from a 1:200,000 geological map of the study area [27] and were divided into seven categories according to stratigraphic age groups (Figure 2): Late Pleistocene to Holocene marine and non-marine sediments (Hsr), Late Pleistocene lower terrace (Q3tl), Middle Pleistocene higher terrace (Q2th), Middle Pleistocene marine and non-marine sediments (Q2sr), Late Miocene to Pliocene marine and non-marine sediments (N3sn), Middle to Late Miocene marine and non-marine sediments (N2sn), and Early Miocene to Middle Miocene marine and non-marine sediments (N1sr). The focal mechanism solution of the mainshock shows that it was a reverse-faulting event with a compressional axis in the NEE-SWW direction [28]. The rupture started as a small left-lateral strike-slip fault in the stepover segment, and afterward, two large reverse faults were triggered in the northern and southern segments. The development of the east–west compression tectonics since the Neogene, the anticline, the syncline, and the fault extending from north-northwest to south-southeast can be seen. In terms of the geological structure, it seems that there were many collapses near the anticline structure and few near the syncline structure [29].
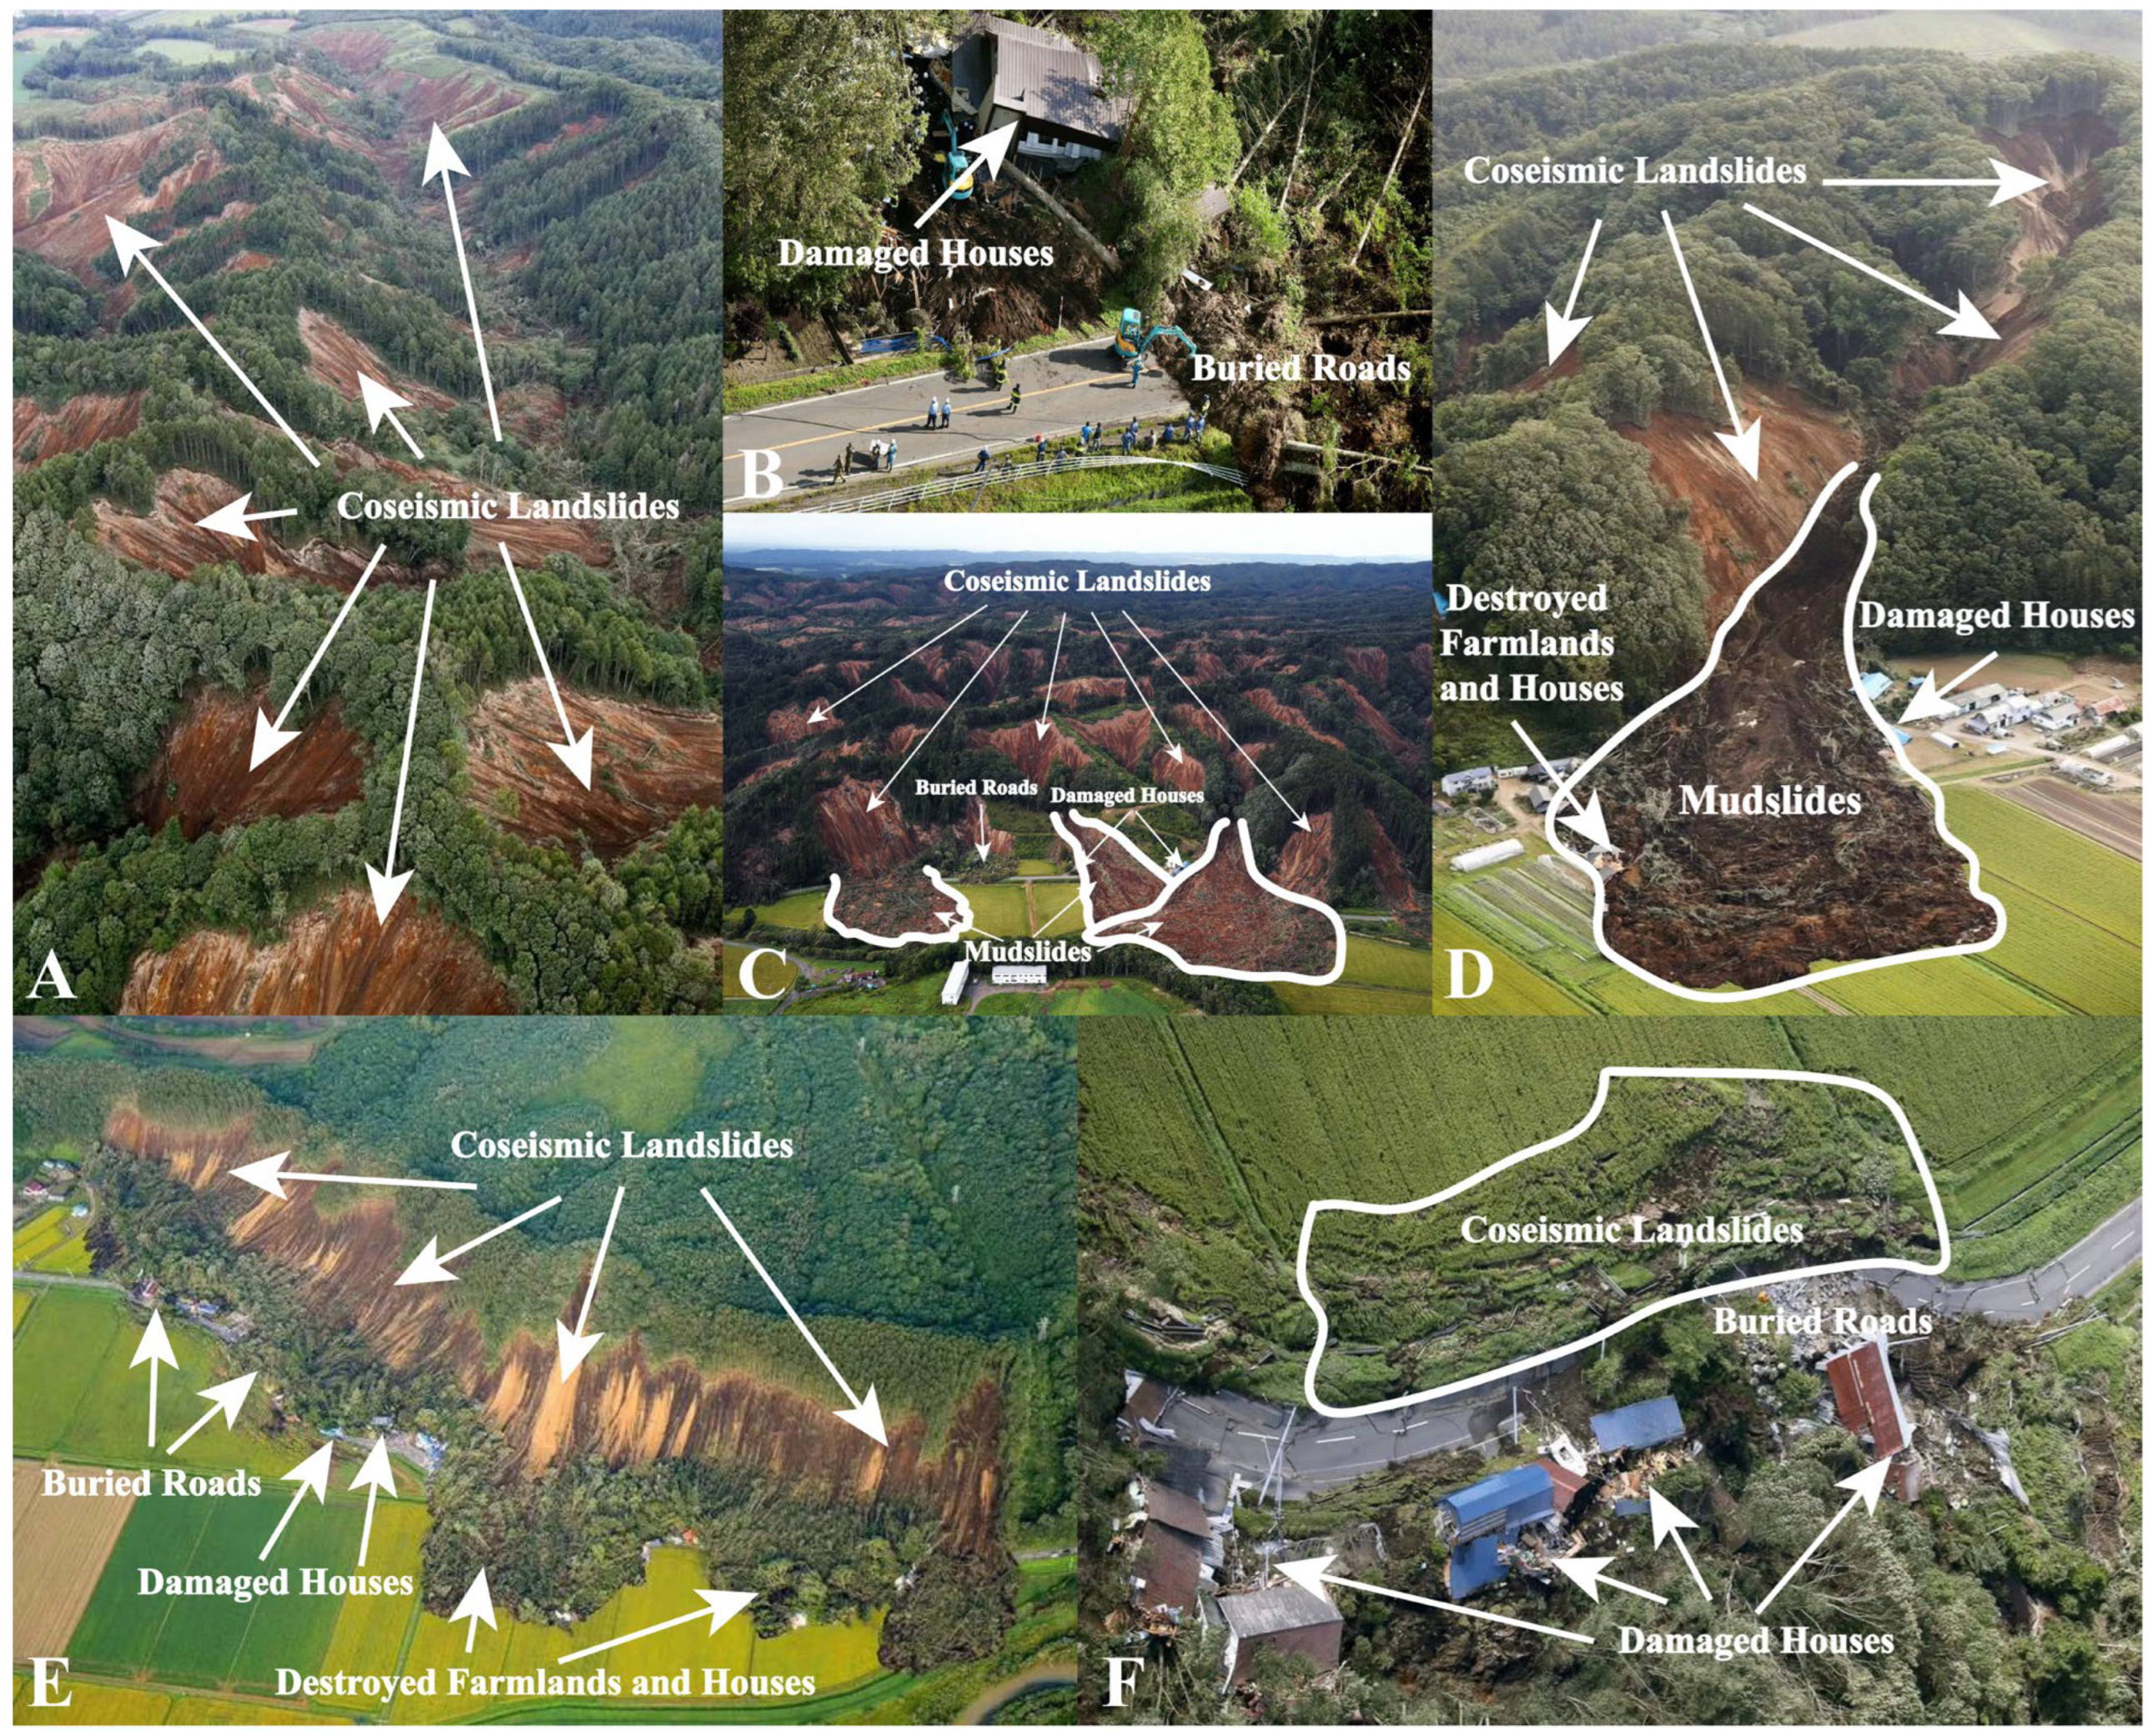
Figure 3 presents aerial photos of landslides caused by the Iburi earthquake in 2018. Apparently, the density of the landslides triggered by this earthquake was relatively high, and most of these landslides were shallow slope failures with continuous distribution. The coseismic landslides changed the topography. After the landslide occurred, the mountain collapsed, and a great amount of rocks and soil were mixed and piled up at the foot of the slope and on the flat ground. This changed the original topographic features. It has been reported that the volume of collapsed soil caused by the landslides and slope failures was 30 million m3. The thickness of the collapsed sediment layer was approximately 2.2 m [32]. The magnitude scale for the landslide event, mL, was equivalent to that of an area struck by an earthquake of Mw = 7.0 to 7.4 with high rollover [33].

3. Data

3.1. Digital Elevation Model

The digital elevation model (DEM) provided the basic data for calculating the excess topography in this study, and the position and elevation information contained in it were used as the basis for the topography analysis. The 30 m spatial resolution advanced spaceborne thermal emission and reflection radiometer (ASTER) global DEM data (Figure 1) used in this study were all obtained from the National Aeronautics and Space Administration (NASA) data sharing platform (https://www.earthdata.nasa.gov/, accessed on 9 June 2023).

3.2. Landslide Inventory

The Iburi earthquake’s landslide inventory map (Figure 2) was prepared using our visual interpretation of Planet satellite images, which were acquired within 5 days after the earthquake [35]. In the study area, visual interpretation revealed that at least 9249 landslides were triggered by the 2018 Iburi earthquake. The coseismic landslides of the Iburi earthquake mainly developed on the northwest side of the seismogenic fault. The total landslide area was approximately 30.757 km2, accounting for approximately 7% of the study area. The landslide areas differed in size, in the range of 50–115,437 m2.

4. Methods

4.1. Excess Topography

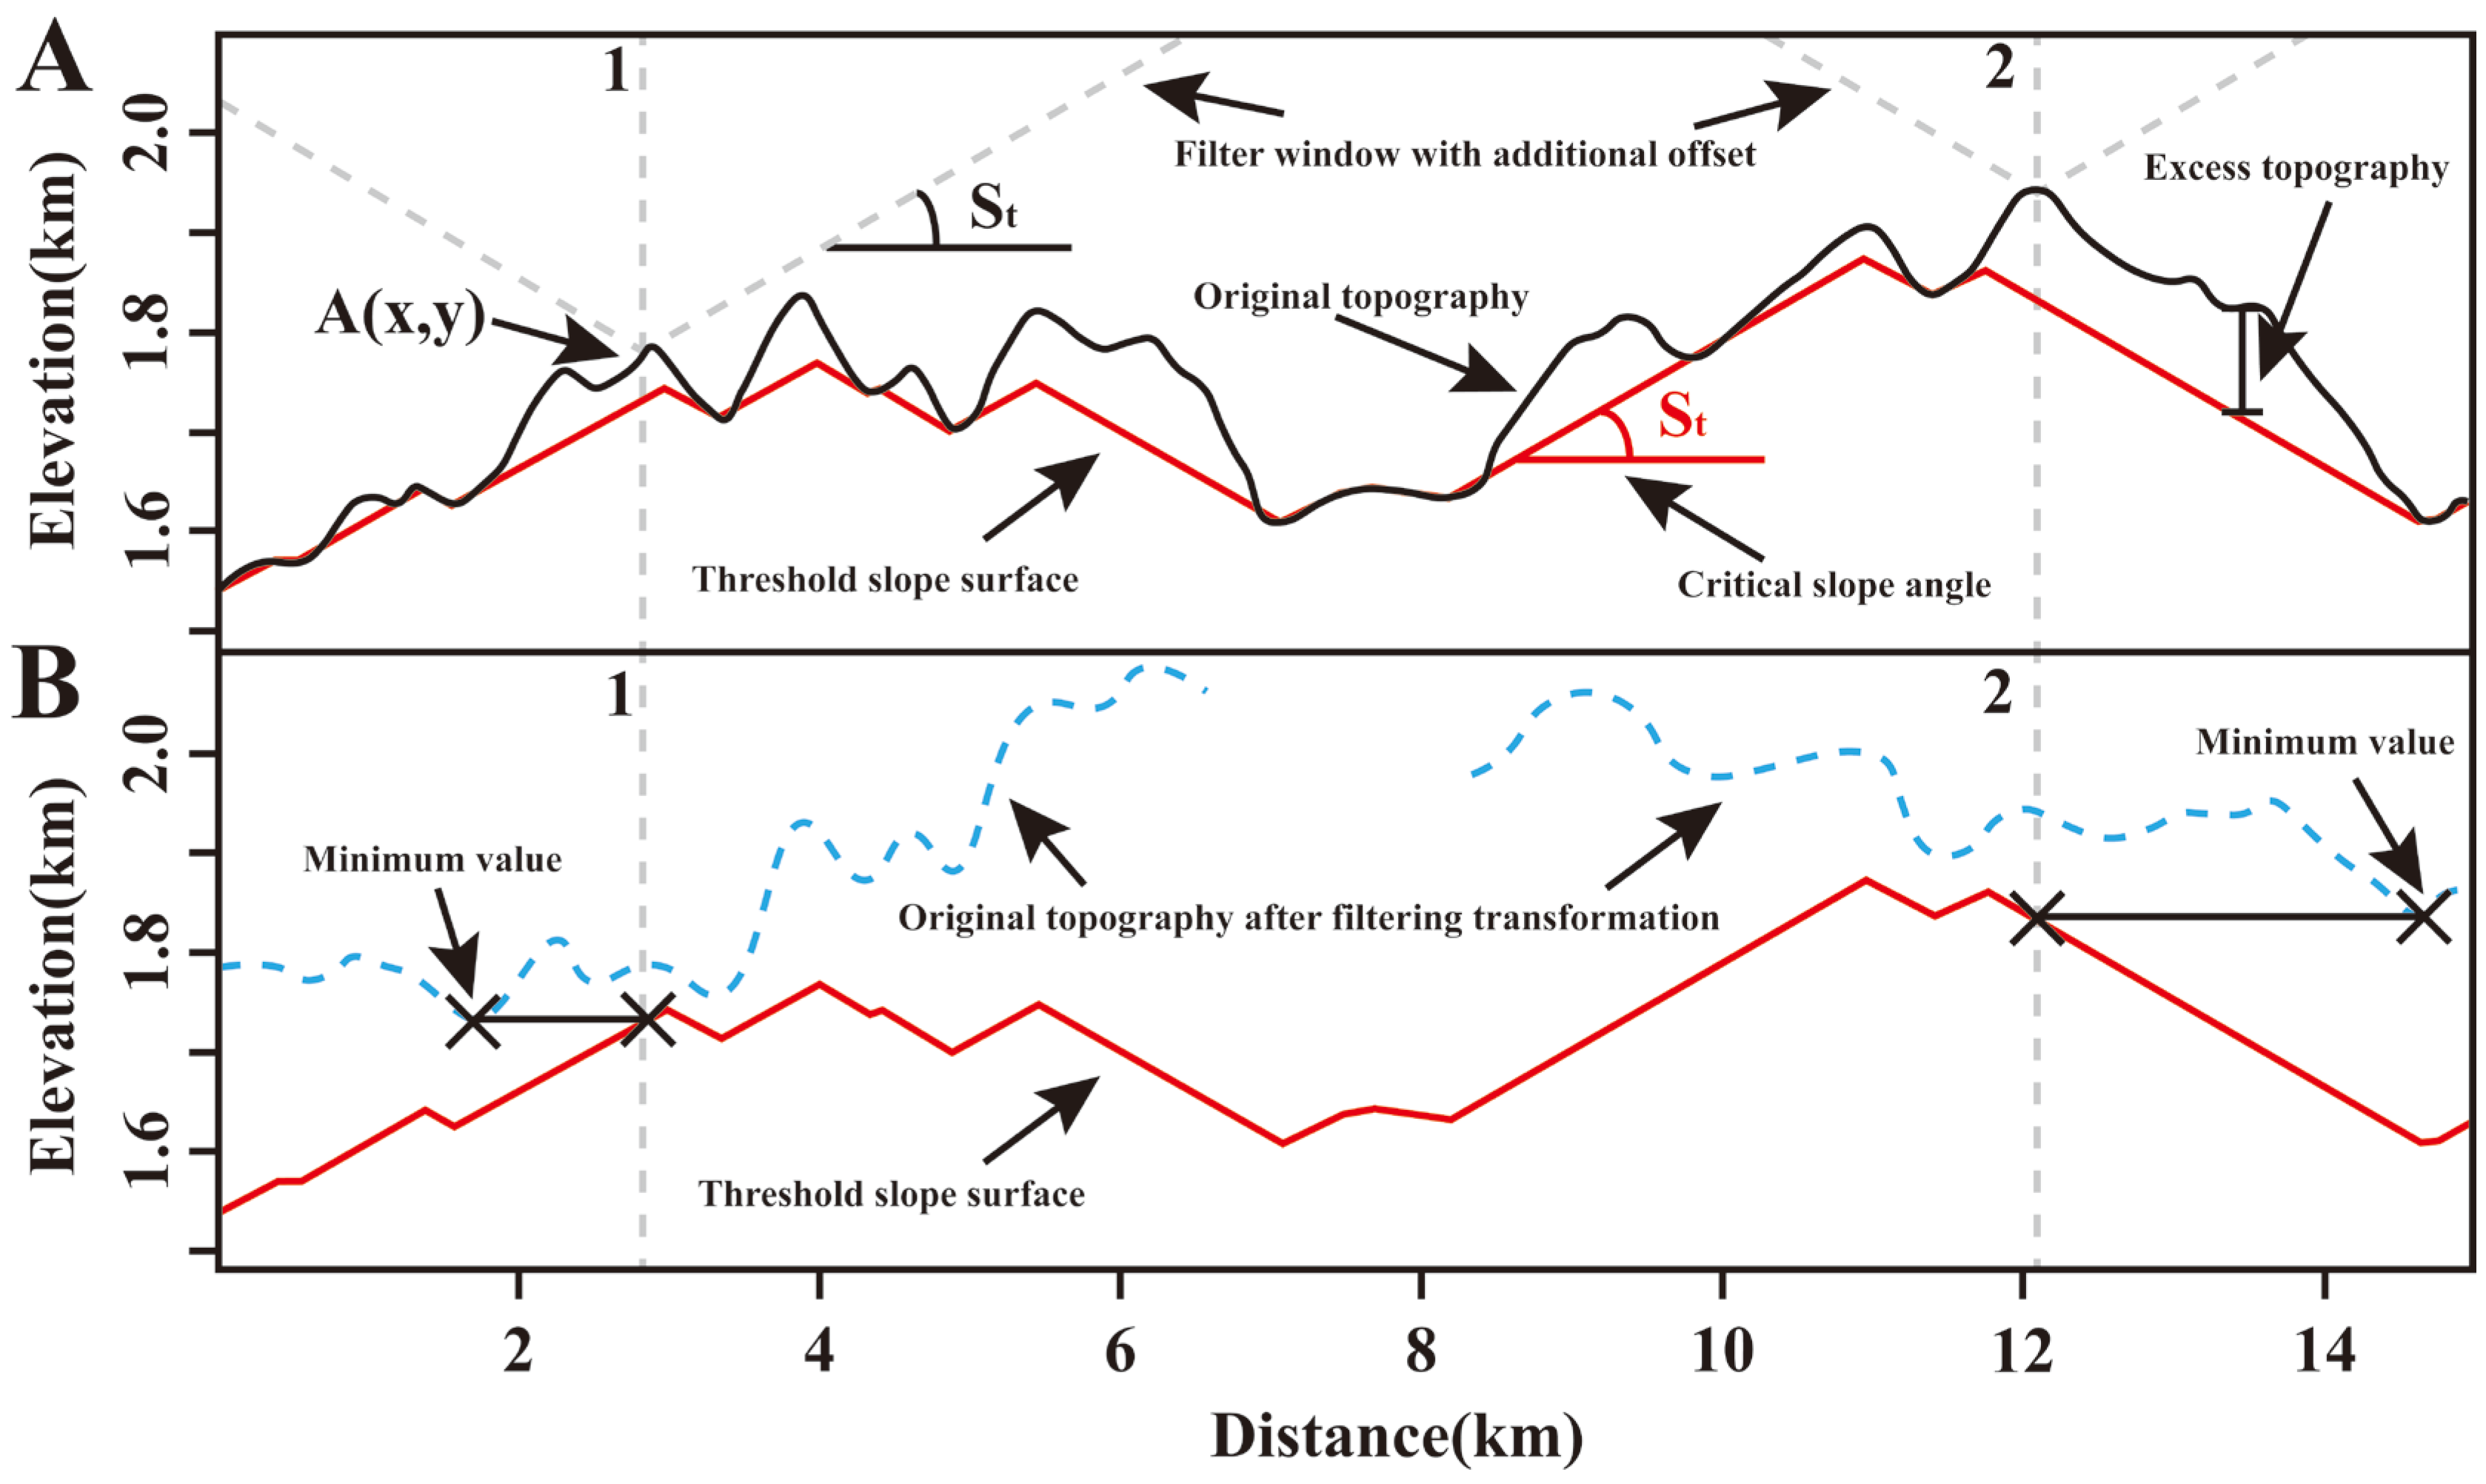
Excess topography can be understood as a relative definition. The threshold slope can be considered to be the average value of the angle of internal friction that controls the stability of the mountain slope. Usually, the larger the angle of internal friction, the higher the strength of the rock mass. Assuming that the threshold slope and excess topography always exist, quantifying the excess topography in the study area can be used to analyze the contribution of slope erosion to the evolution of the regional topography. Blöthe et al. introduced excess topography for quantifying potentially unstable rock mass volumes based on DEM analysis [15]. In their study, excess topography was described as the column of rock material located between the terrain surface and an idealized topography with slopes less than or equal to a given threshold hillslope angle, so that it is an important material basis for landslide occurrences. Indeed, excess topography refers to potentially unstable rock masses located above the threshold slope surface. The determination of the threshold slope surface is a prerequisite for calculating the excess topography, which is limited by the DEM elevation and the threshold slope surface. During the process of excess topography calculation, a threshold slope surface is an ideal surface defined from the digital elevation model (DEM), which contains an inclined surface with an arbitrarily set critical slope. The threshold slope surface at a specific location A (x, y) is calculated as shown in Figure 4.
Z ˙ x , y = min s , t , + Z x + s , y + t + s t s 2 + t 2
where the elevation Z ˙ of the idealized threshold hillslope surface is introduced, Z is the original elevation of the topography, (x, y) is the coordinate point, s t is the threshold hillslope value (obtained by analyzing the distribution of the slopes in the study area), and s 2 + t 2 is the distance from the filter center to point (x, y).
Finally, the elevation of the excess topography Z E can be obtained by subtracting the elevation of the critical slope surface ( Z ˙ ) from the actual surface elevation (z).
Z E x , y = Z x , y Z ˙ x , y
The extraction of the excess topography is performed on the 30 m DEM of the study area using Matlab’s TopoToolbox (version 2.3.1) [36].

4.2. Threshold Slope Value

The determination of the threshold slope is the premise of the extraction of the excess topography. Where the surface is undulating and the slope exceeds the threshold slope, the landslide erosion process is prone to occur [15]. Also, this process is often accompanied by a series of triggering mechanisms. Many studies have shown that the threshold slope for slope erosion is 30–35° [3,14,15,37,38,39]. These studies were all conducted in deep-cut canyon basins with large elevation differences and steep slopes.
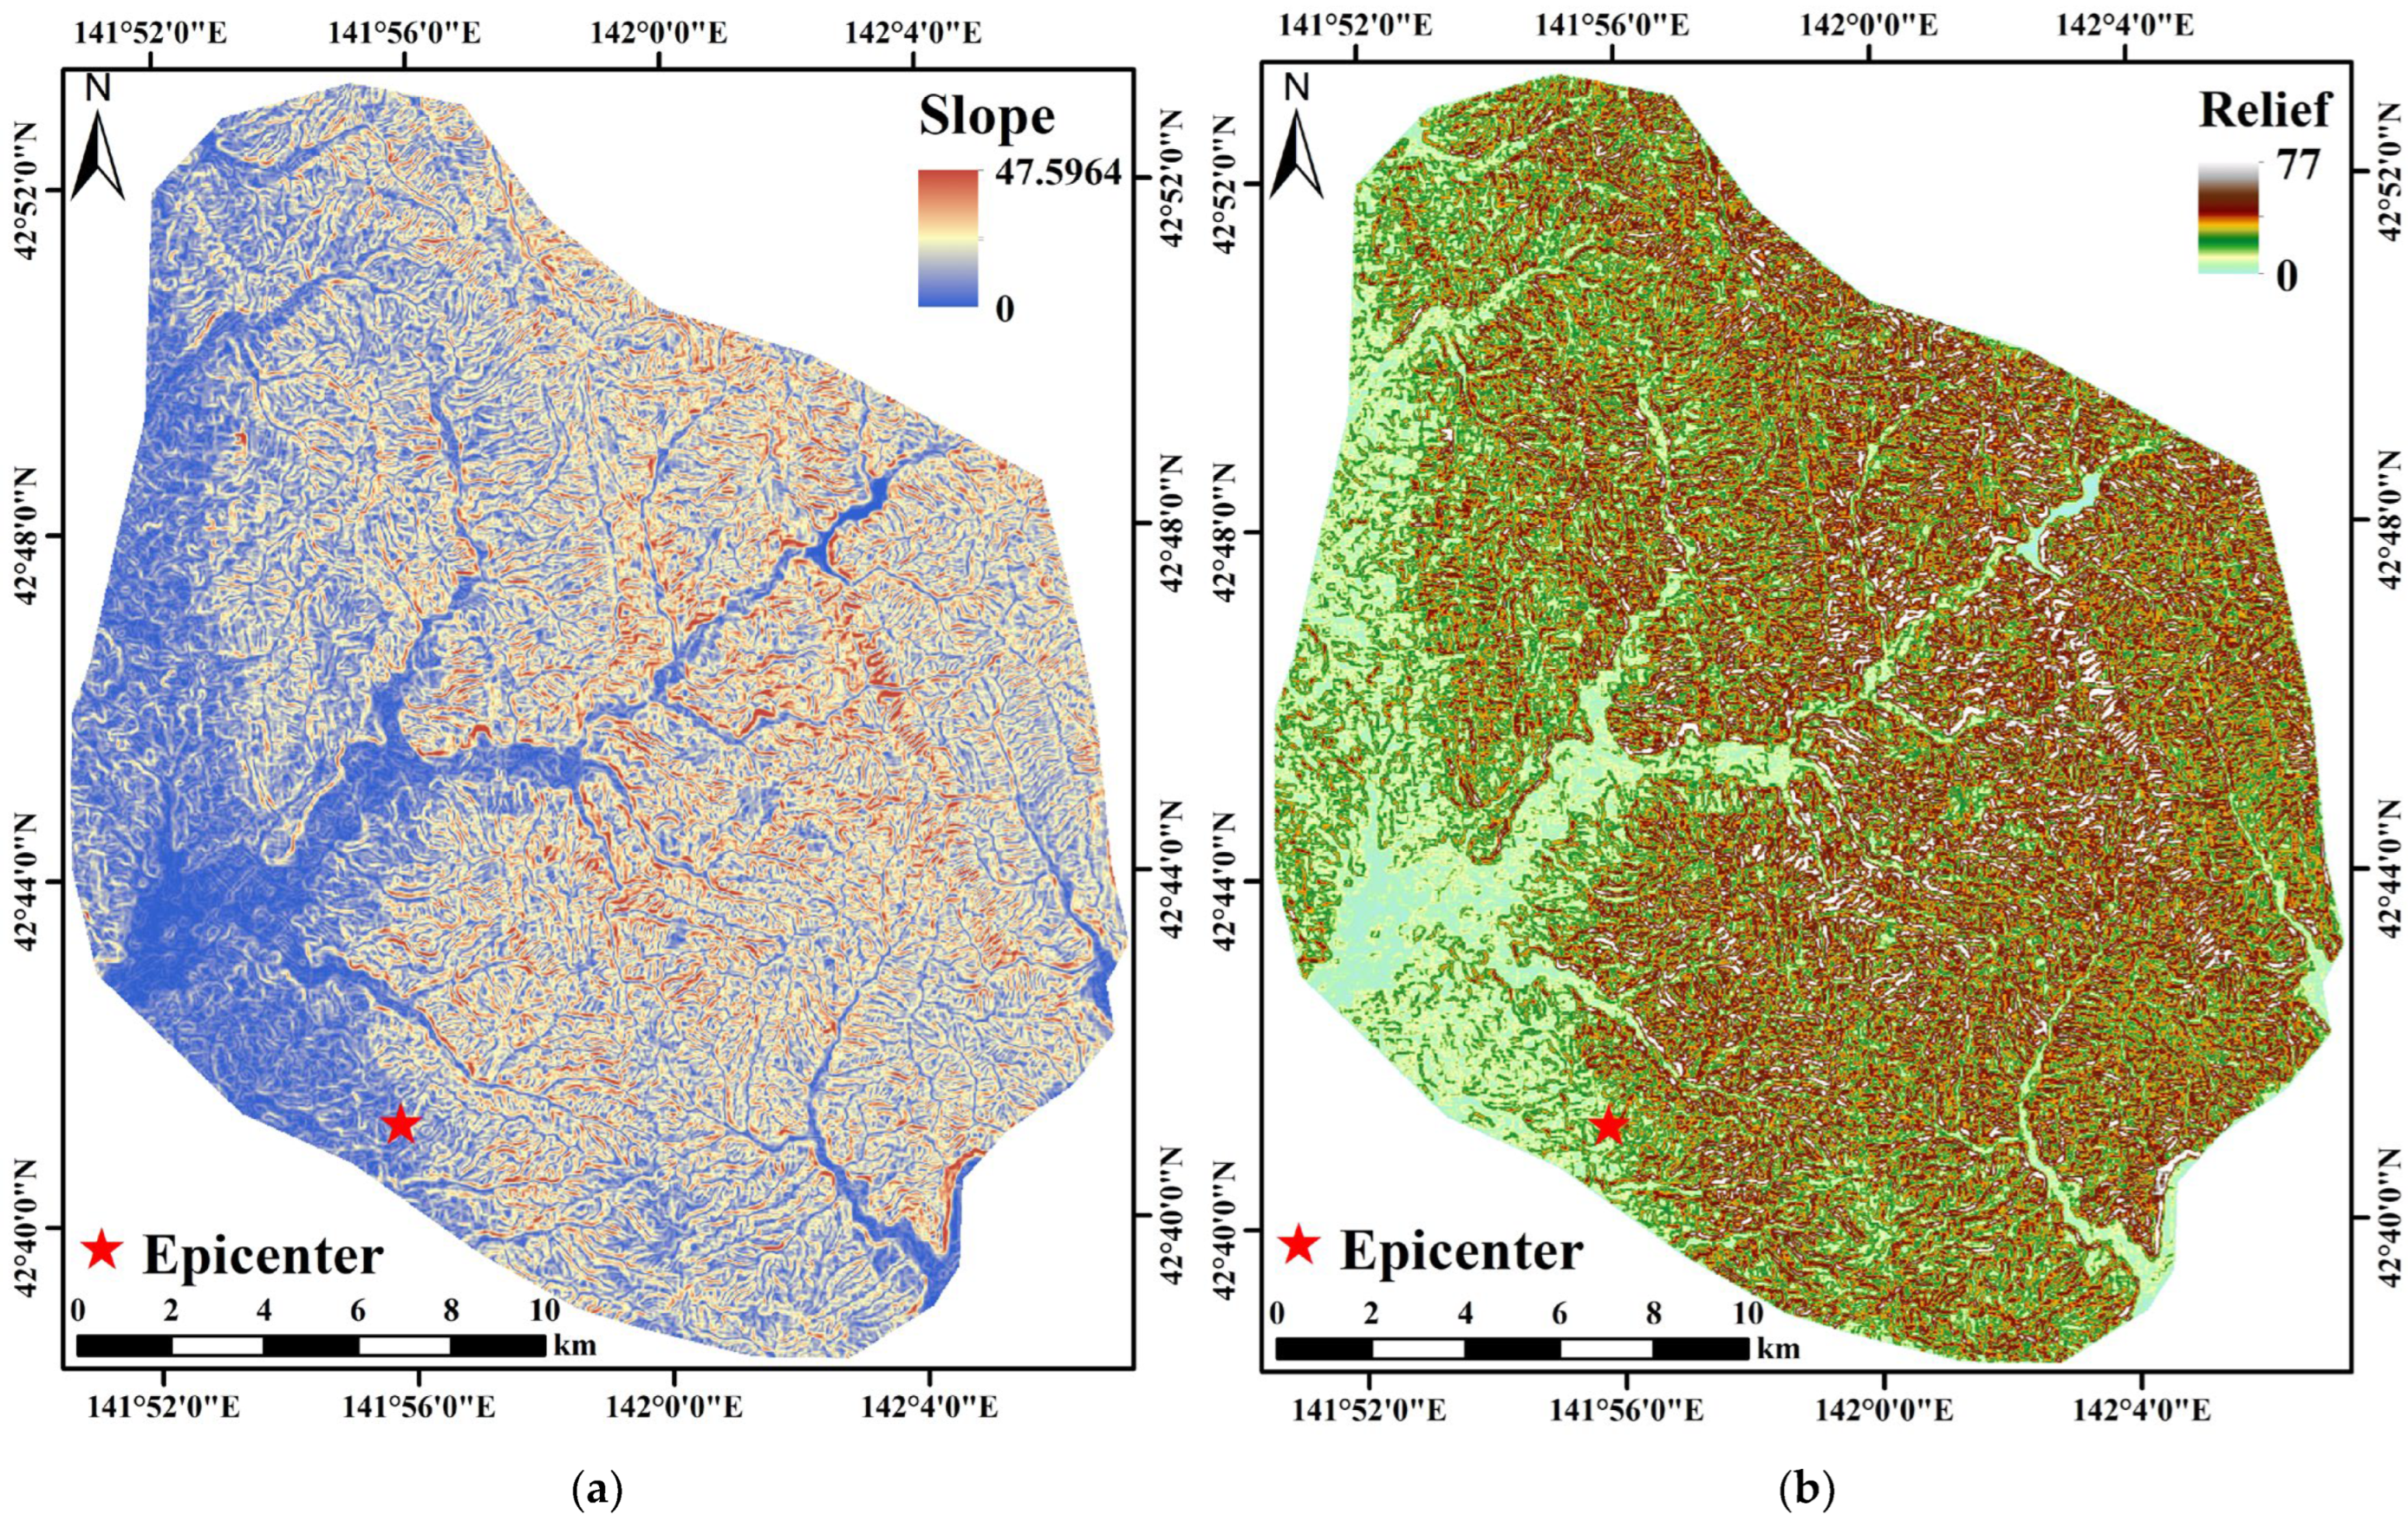
In this paper, the study area was located in a low-lying hilly area. The maximum elevation was only 456 m (Figure 1), the maximum slope was approximately 47.6° (Figure 5a), and the average slope was approximately 12.76°. We calculated the local relief in the region (Figure 5b), and the maximum relief in the region was calculated to be only 77 m. This value is much smaller than in other study regions, like the study area of the 2014 Ludian earthquake in China [23]. There were many non-slope low-relief areas in the study area, and there was no mass movement in these areas.
The distribution of landslides is closely related to the lithology. The development scales of the coseismic landslides in the strata and lithologies with different ages were different, and the strength of the rock and soil mass constituting the mountain directly affected the changes in the slope and elevation of the mountain, thus affecting the change in the excess topography. The lithology in the study area was divided into seven stratigraphic lithological units (Figure 2). After removing the influence of the low-relief areas, we calculated the average slope angle for each lithological unit separately (Table 1). The average slope of the lithology was used as the threshold slope of the corresponding formation to calculate the excess topography of the different lithological units.

5. Results

5.1. The Distribution of Excess Topography

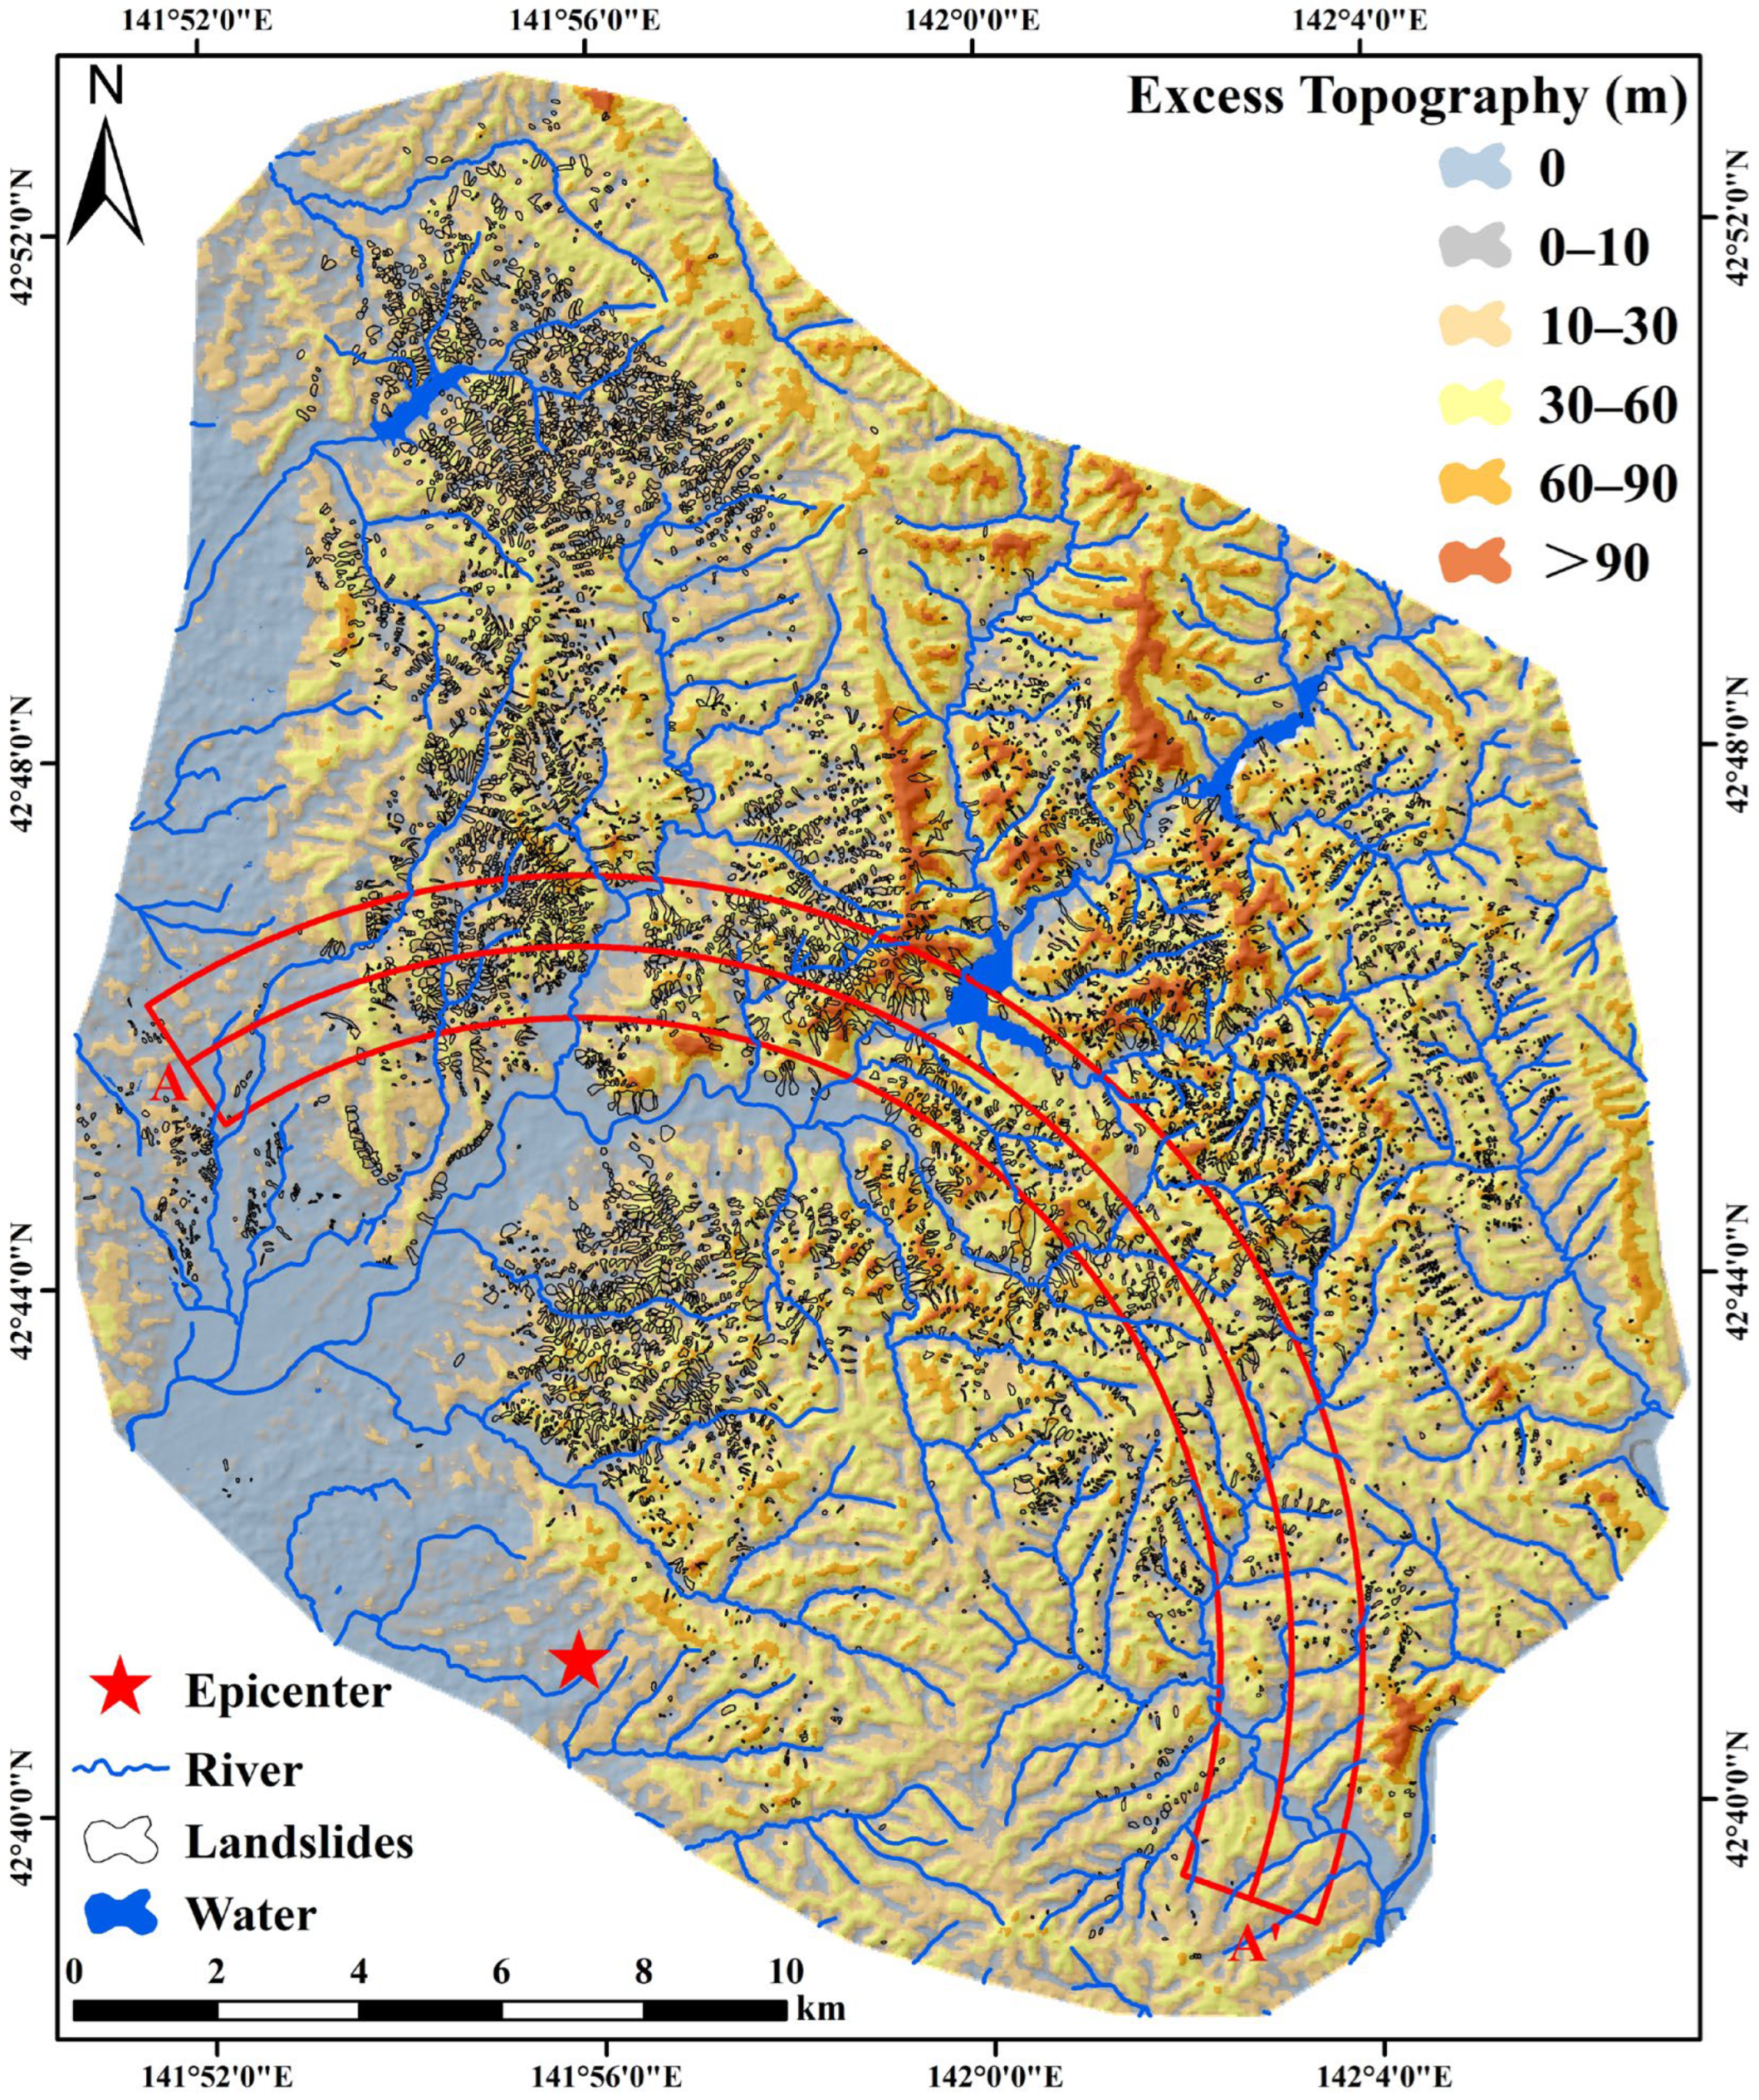
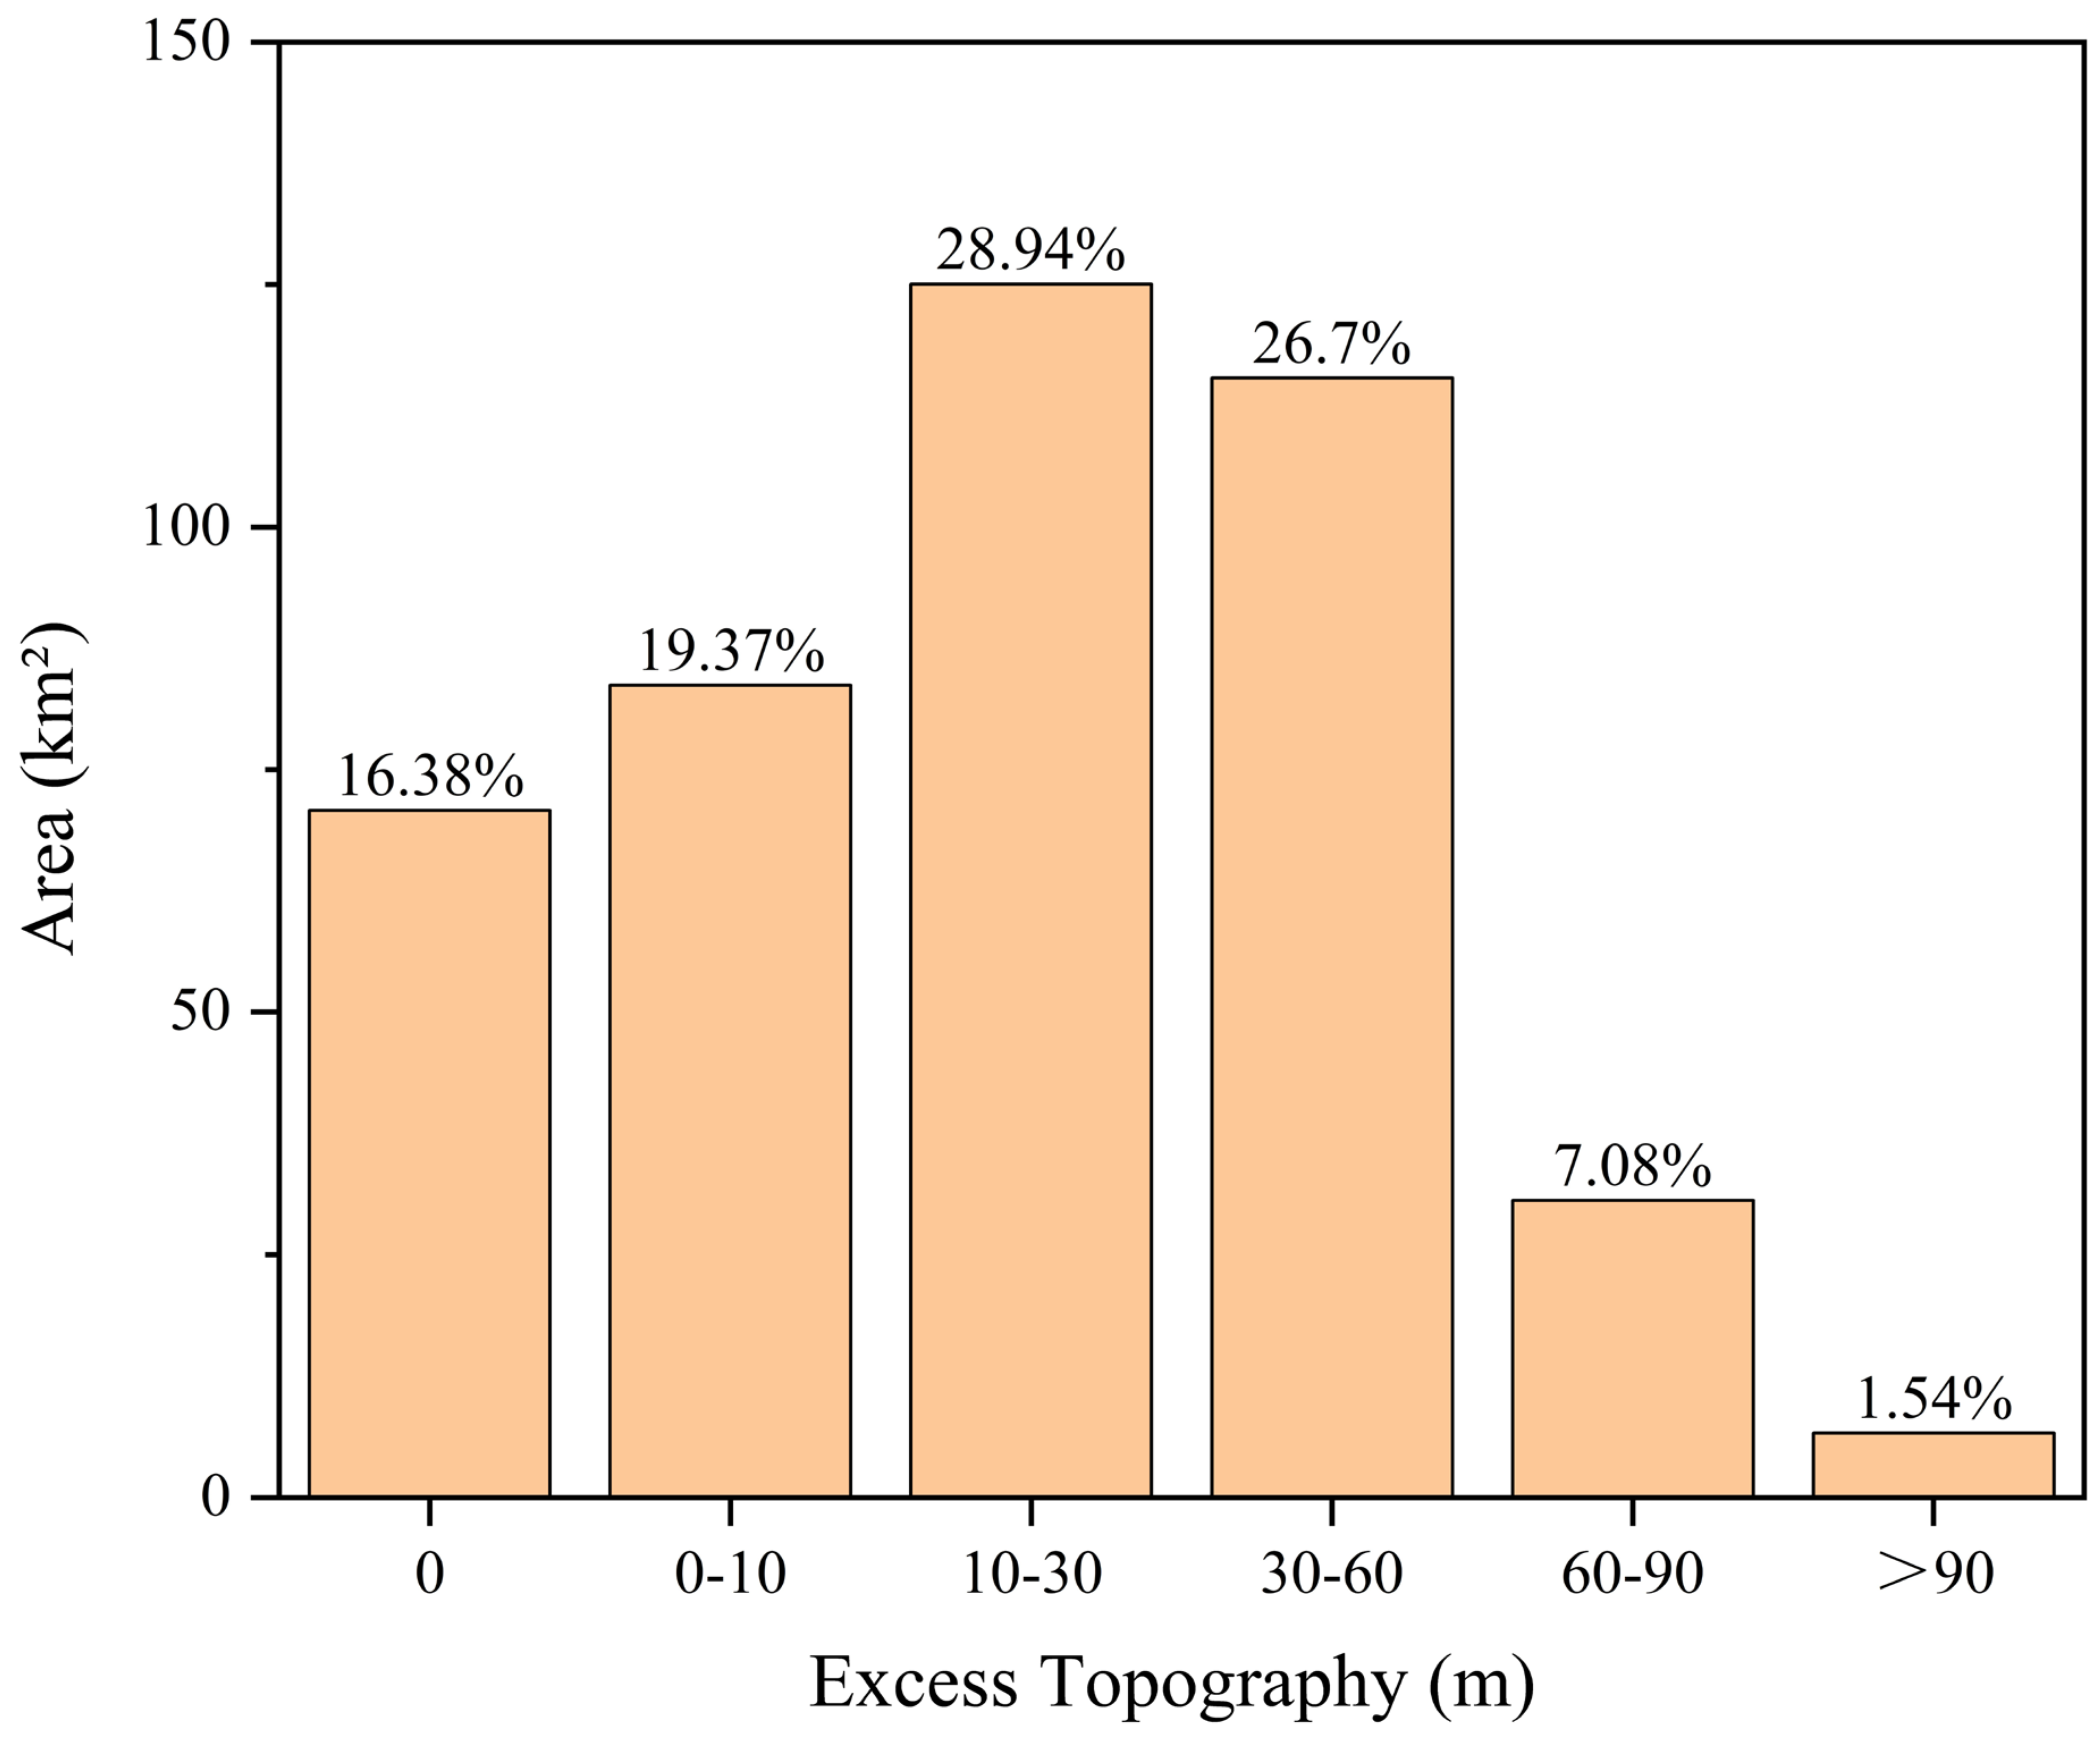
The spatial distribution of the excess topography in the study area is shown in Figure 6. The statistics show that the areas with excess topography in the study area exceeded 83% (Figure 7). The excess topography was mainly distributed in the valleys on both sides of the river, and the height of the excess topography was relatively large near the ridgeline. However, in the flatter plains and fluvial sedimentary areas, there was little or no excess topography. The maximum value of the excess topography was 185 m. In order to analyze the impact of the excess topography on the coseismic landslides, we divided the excess topography in the study area into five categories: 0–10 m, 10–30 m, 30–60 m, 60–90 m, and >90 m. In this classification scheme, 0 m means that there was no excess topography in the area. The range of the excess topography was mainly concentrated within 10–60 m.

5.2. Three Geomorphologic Factors Influencing the Distribution of the Coseismic Landslides and Excess Topography

There is no widely accepted standard for the selection of the influencing factors in earthquake landslide risk assessment [40]. Based on experience and the literature [35], we selected the elevation, slope, and distance to a river to analyze the recalculated excess topography and spatial distribution of the landslides.
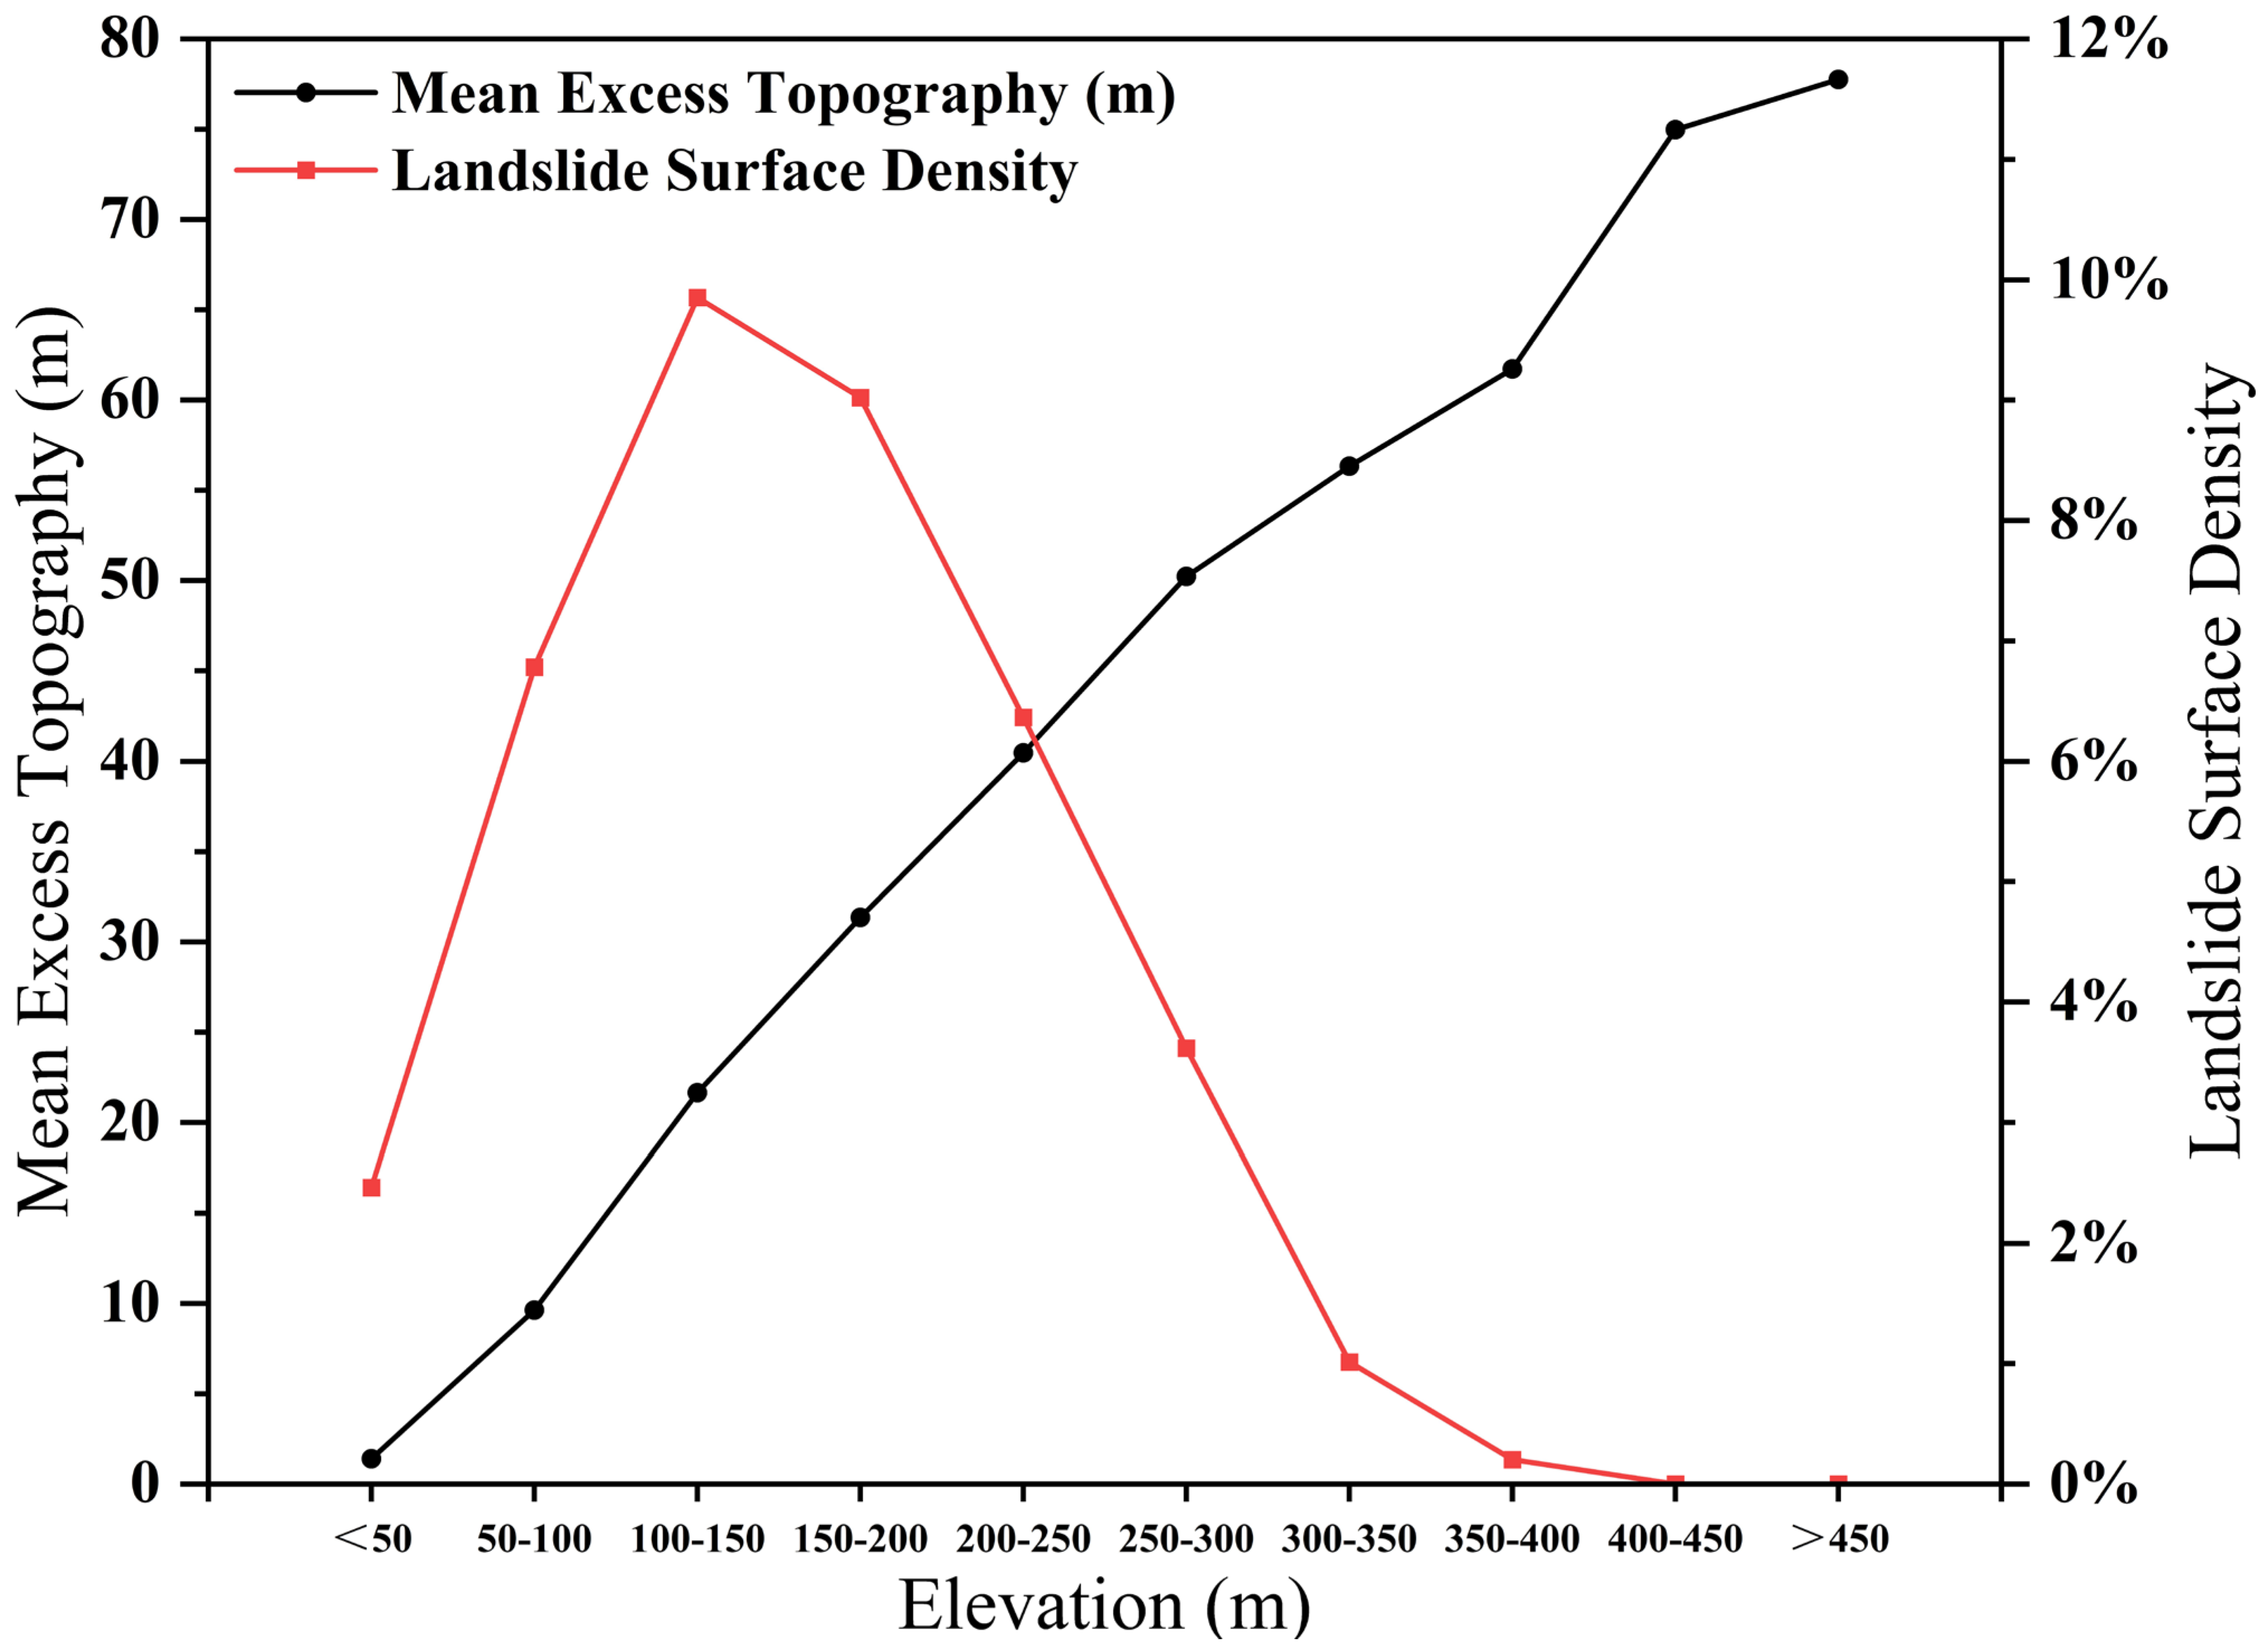
The results show that within the study area, the average excess topography increased with increasing elevation (Figure 8). The surface density of the coseismic landslides climbed up and then declined with the increase in elevation. The value reached its maximum within the elevation of 100–150 m. The results presented in Figure 8 show that the coseismic landslides in this area mostly occurred in the valley areas with lower altitudes, while the seismic landslides in the areas with high excess topography and relatively high altitudes were less developed.
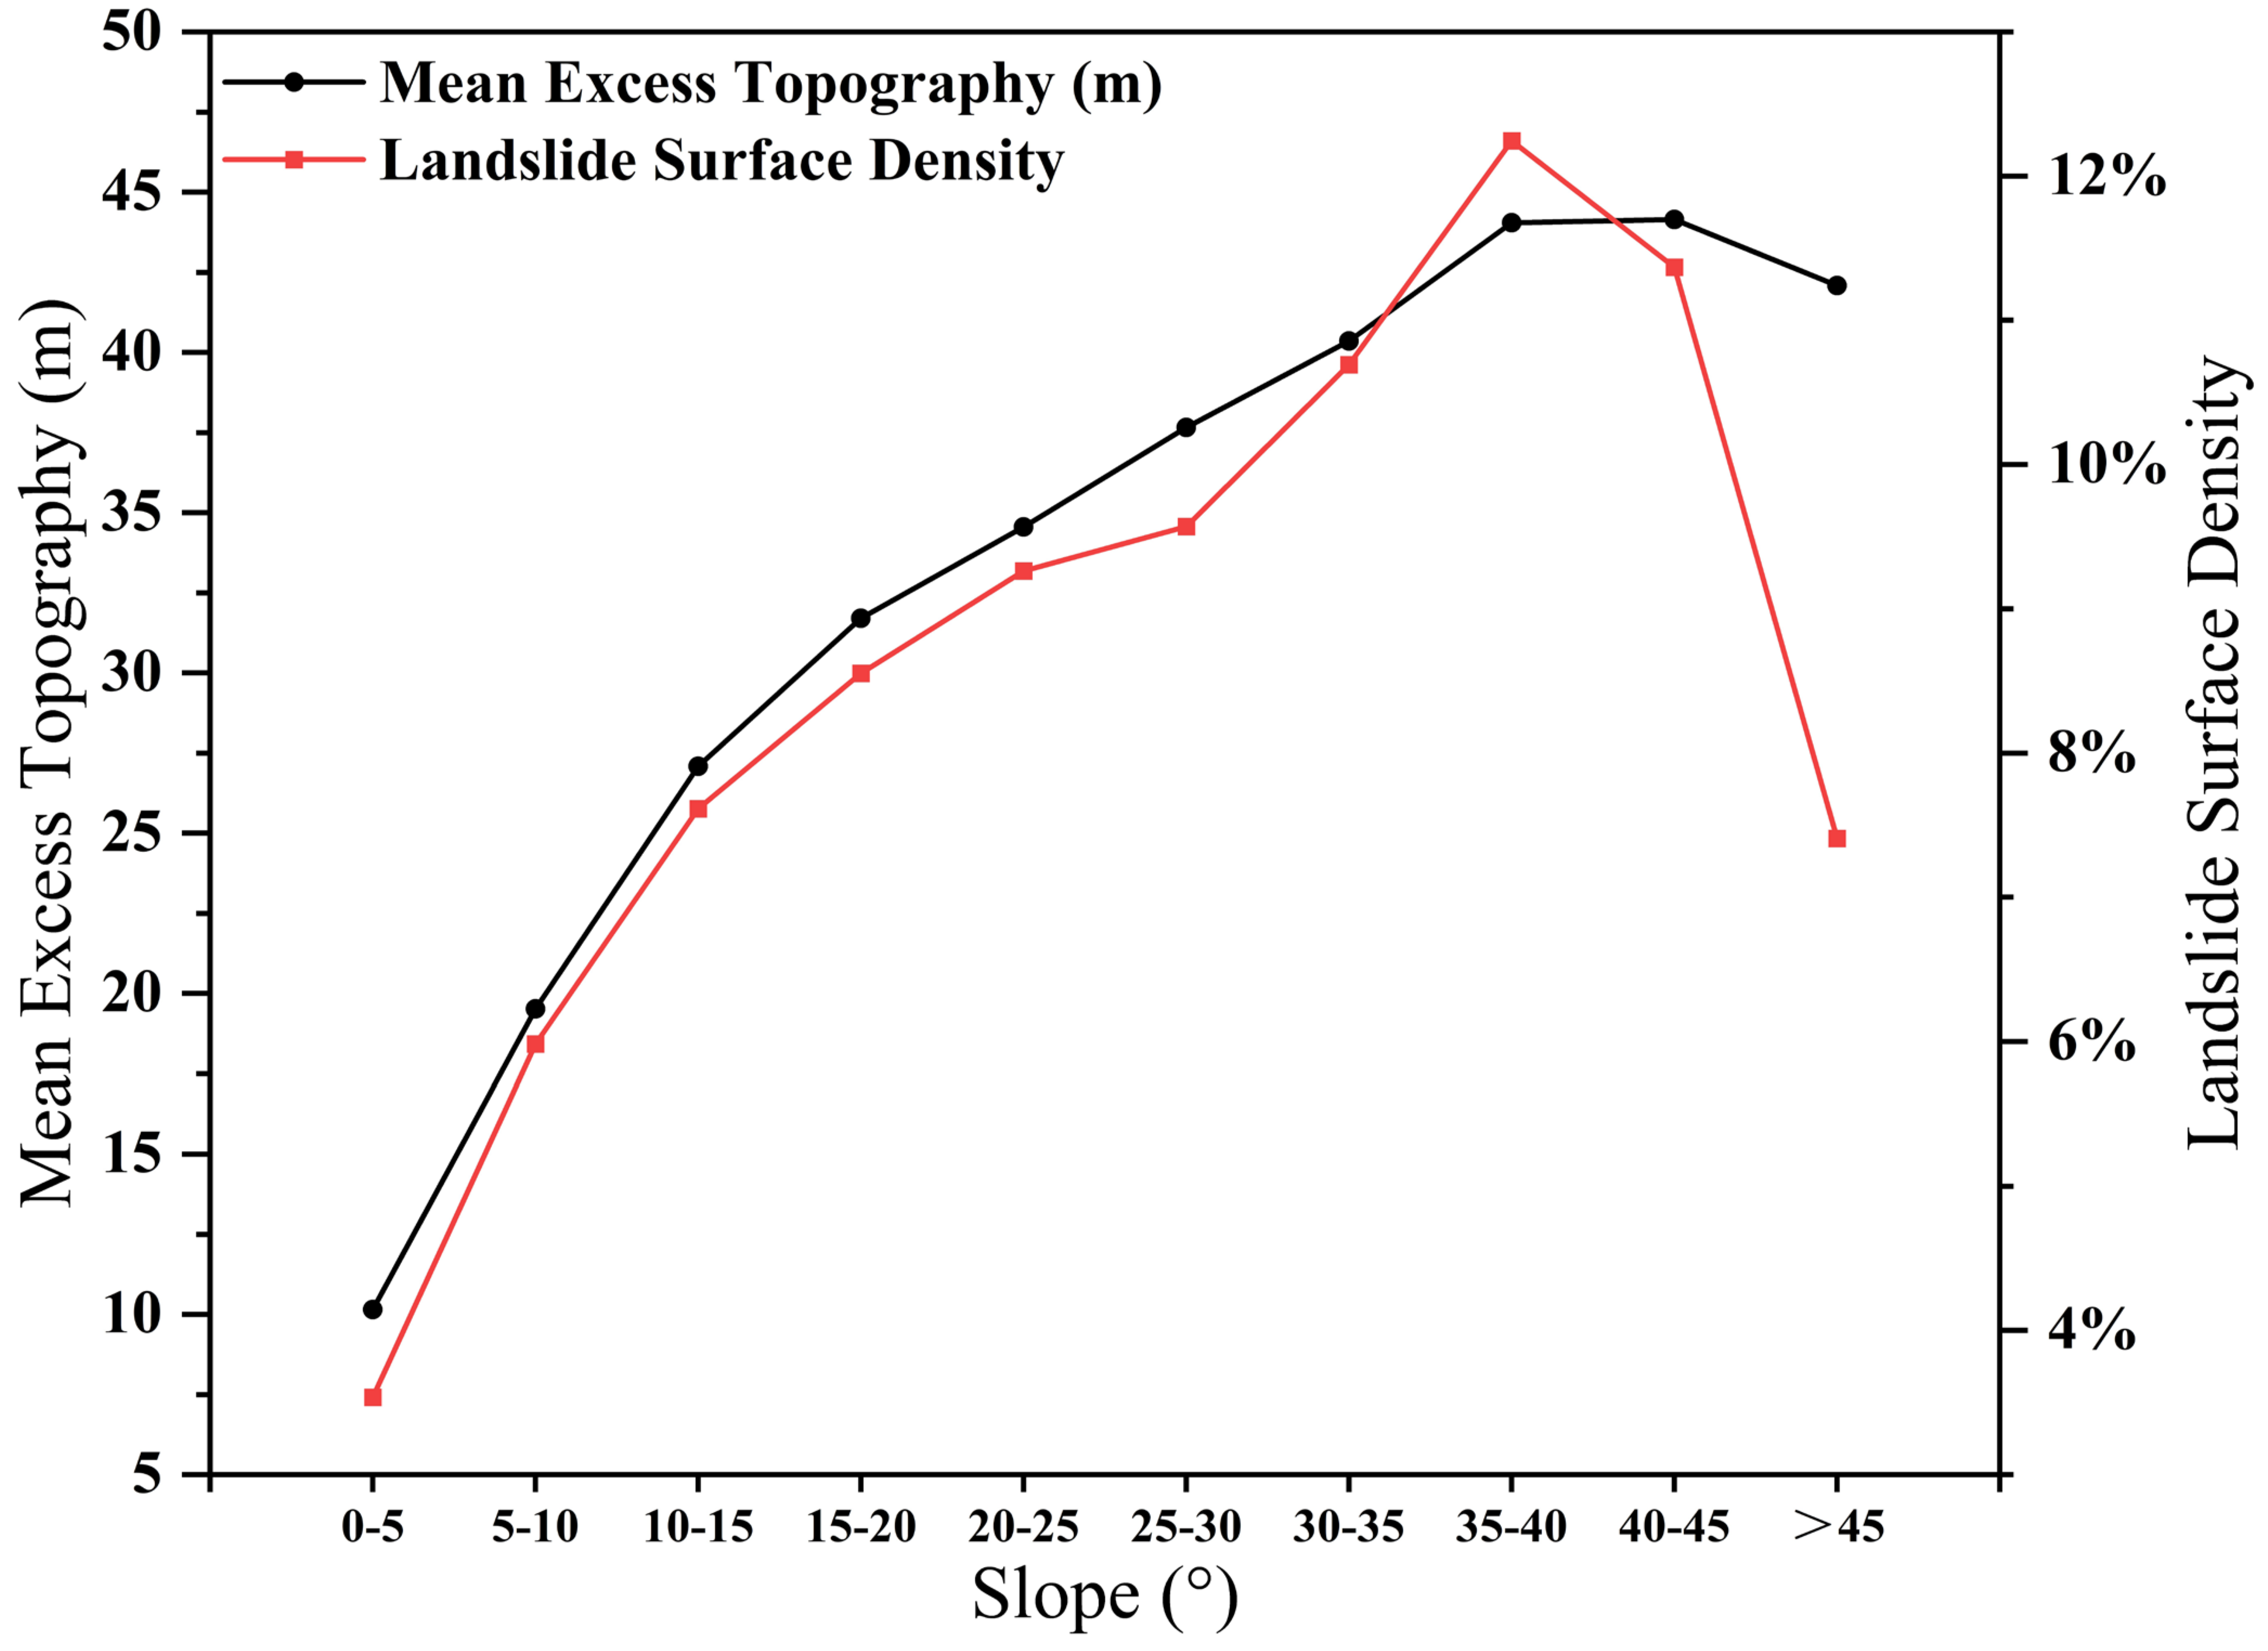
As the slope increased, the average excess topography in the study area also increased, and when the slope reached a certain level, the excess topography tended to decrease (Figure 9). The surface density of the coseismic landslides climbed up and then declined with the increase in slope. The values in the 35–40° slope interval were the largest. The results presented in Figure 9 show that in the study area, the surface density of the coseismic landslides was consistent with the distribution trend of the excess topography. This shows that the slope and excess topography had simultaneous controlling effects on the distribution of the coseismic landslides.
The average excess topography was greatest within 200–400 m of the river (Figure 10). In the areas closer to the river, the average excess topography increased rapidly with increasing distance from the river. The surface density of the coseismic landslides climbed up and then declined with the increase in the distance from the river. The value reached its maximum within the distance of 600–700 m. This shows that many small-scale landslides developed in the high-excess-topography area near the river in the study area. In the low-excess-topography area farther away from the river, a small number of large-scale landslides developed.

5.3. Quantitative Analysis of Excess Topography for Coseismic Landslides

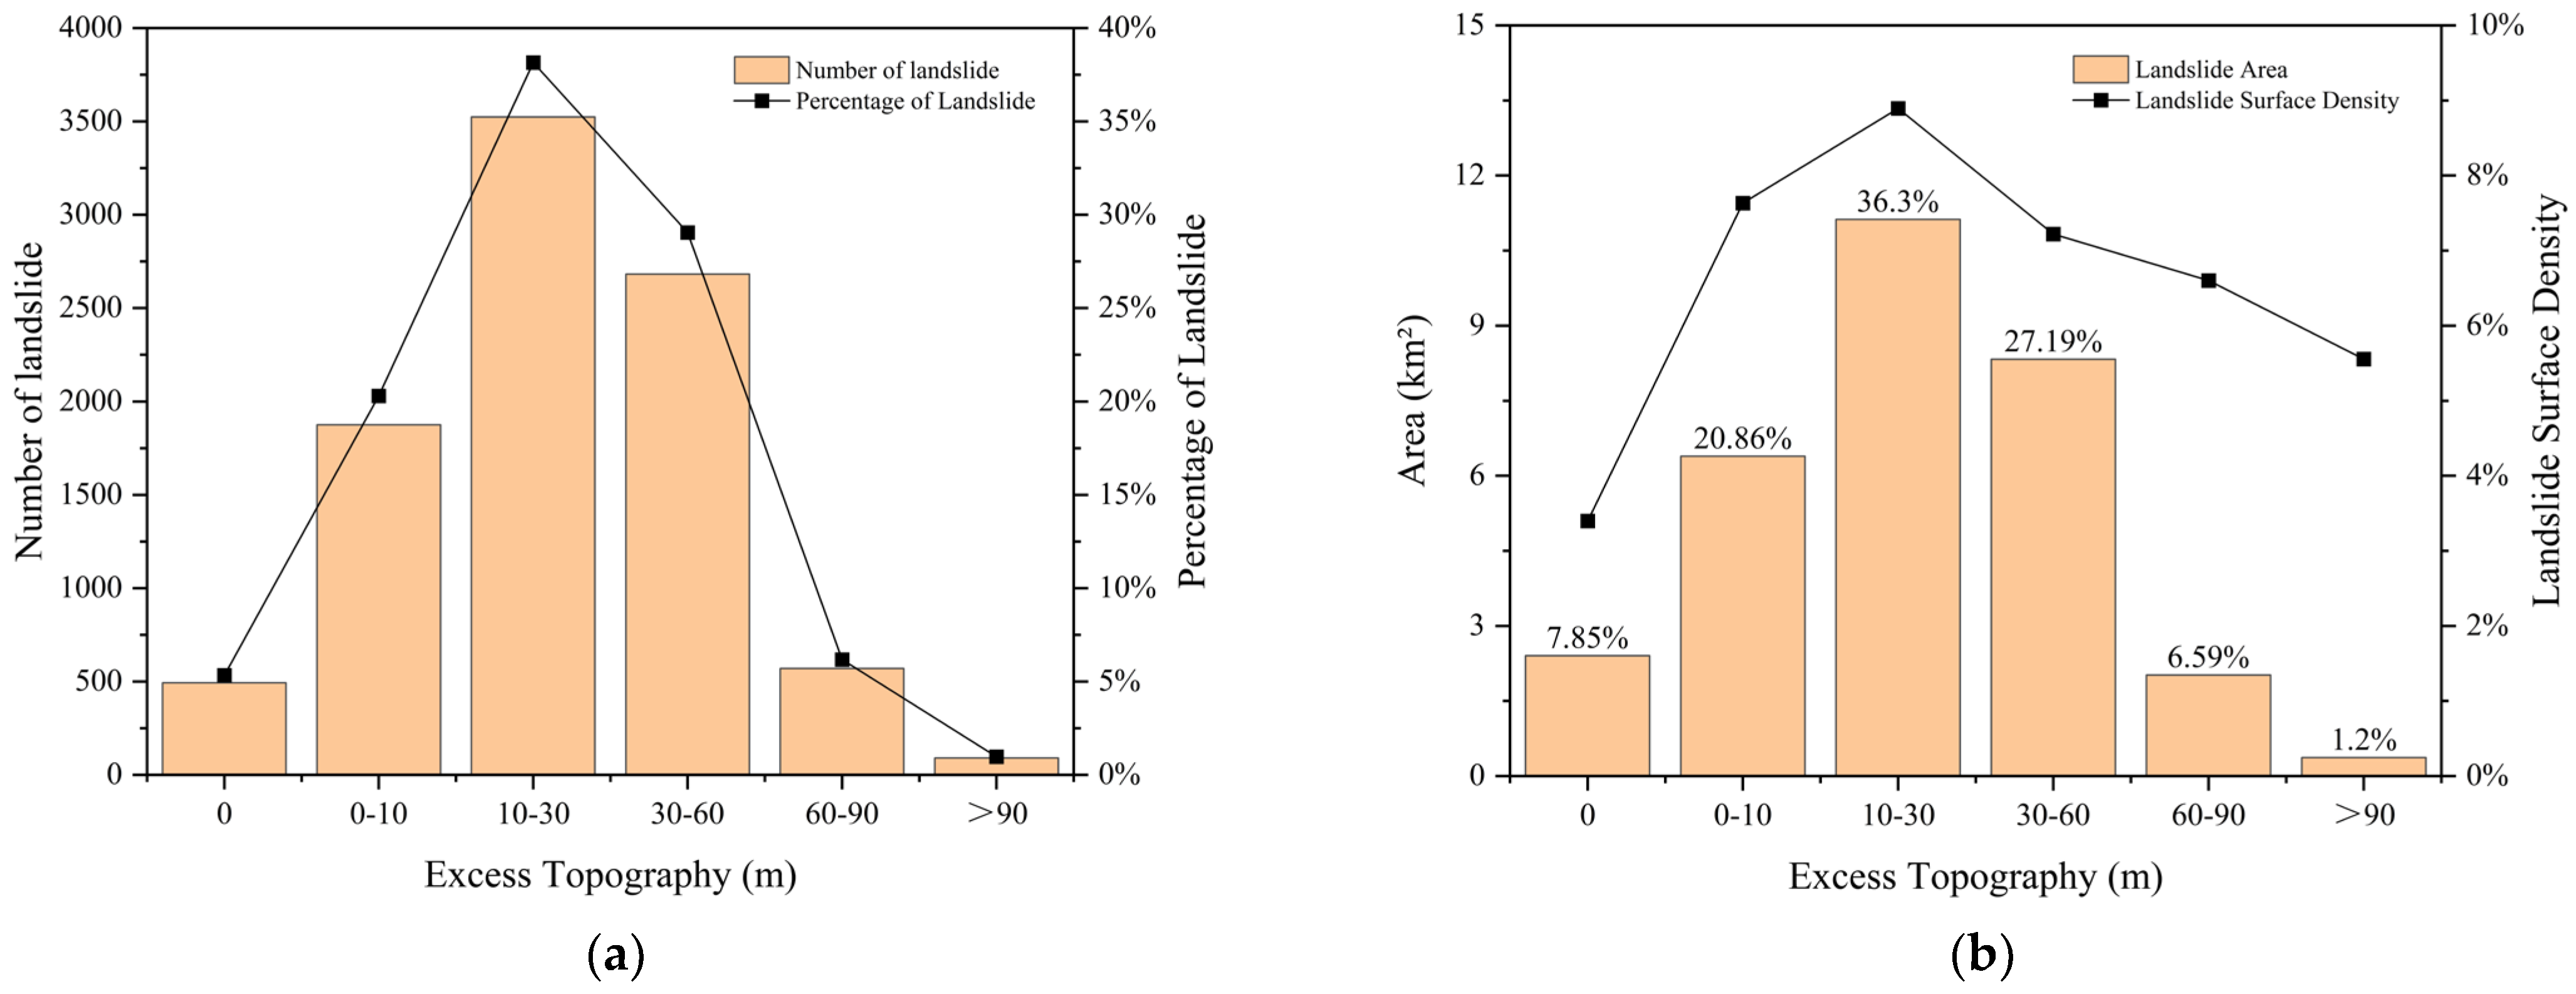
According to the statistics, the landslides caused by the Iburi earthquake exhibited a certain correlation with the distribution of the excess topography. A total of 8742 coseismic landslides developed in the excess topography area, accounting for approximately 94.66% of the total number of landslides in the study area (Figure 11a). The area of the coseismic landslides in the excess topography area was approximately 28.23 km2, accounting for 92.15% of the total landslides area (Figure 11b). The landslides mainly occurred in areas with the most developed excess topography (10–60 m). The number, area, and scale of coseismic landslides were the largest in the 10–30 m interval.
Shao et al. believed that most coseismic landslides are concentrated in areas with peak ground acceleration from 0.5 g to 0.7 g [35]. Strong ground motion is an immediate trigger of seismic landslides. In order to analyze the excess topography influences on the coseismic landslides, the incident ratio was applied [41]. The incident ratio ( R i ) is defined as
R i = D A i D A A i A
where A is the total area of the study area, A i is the exposed area of the different types or data segments i of a certain factor (here, it is the different excess topography intervals) in the study area, DA is the total area of the coseismic landslides developed in the study area, and D A i is the area of the coseismic landslides exposed in the study area in the ith category or data segment of this factor.
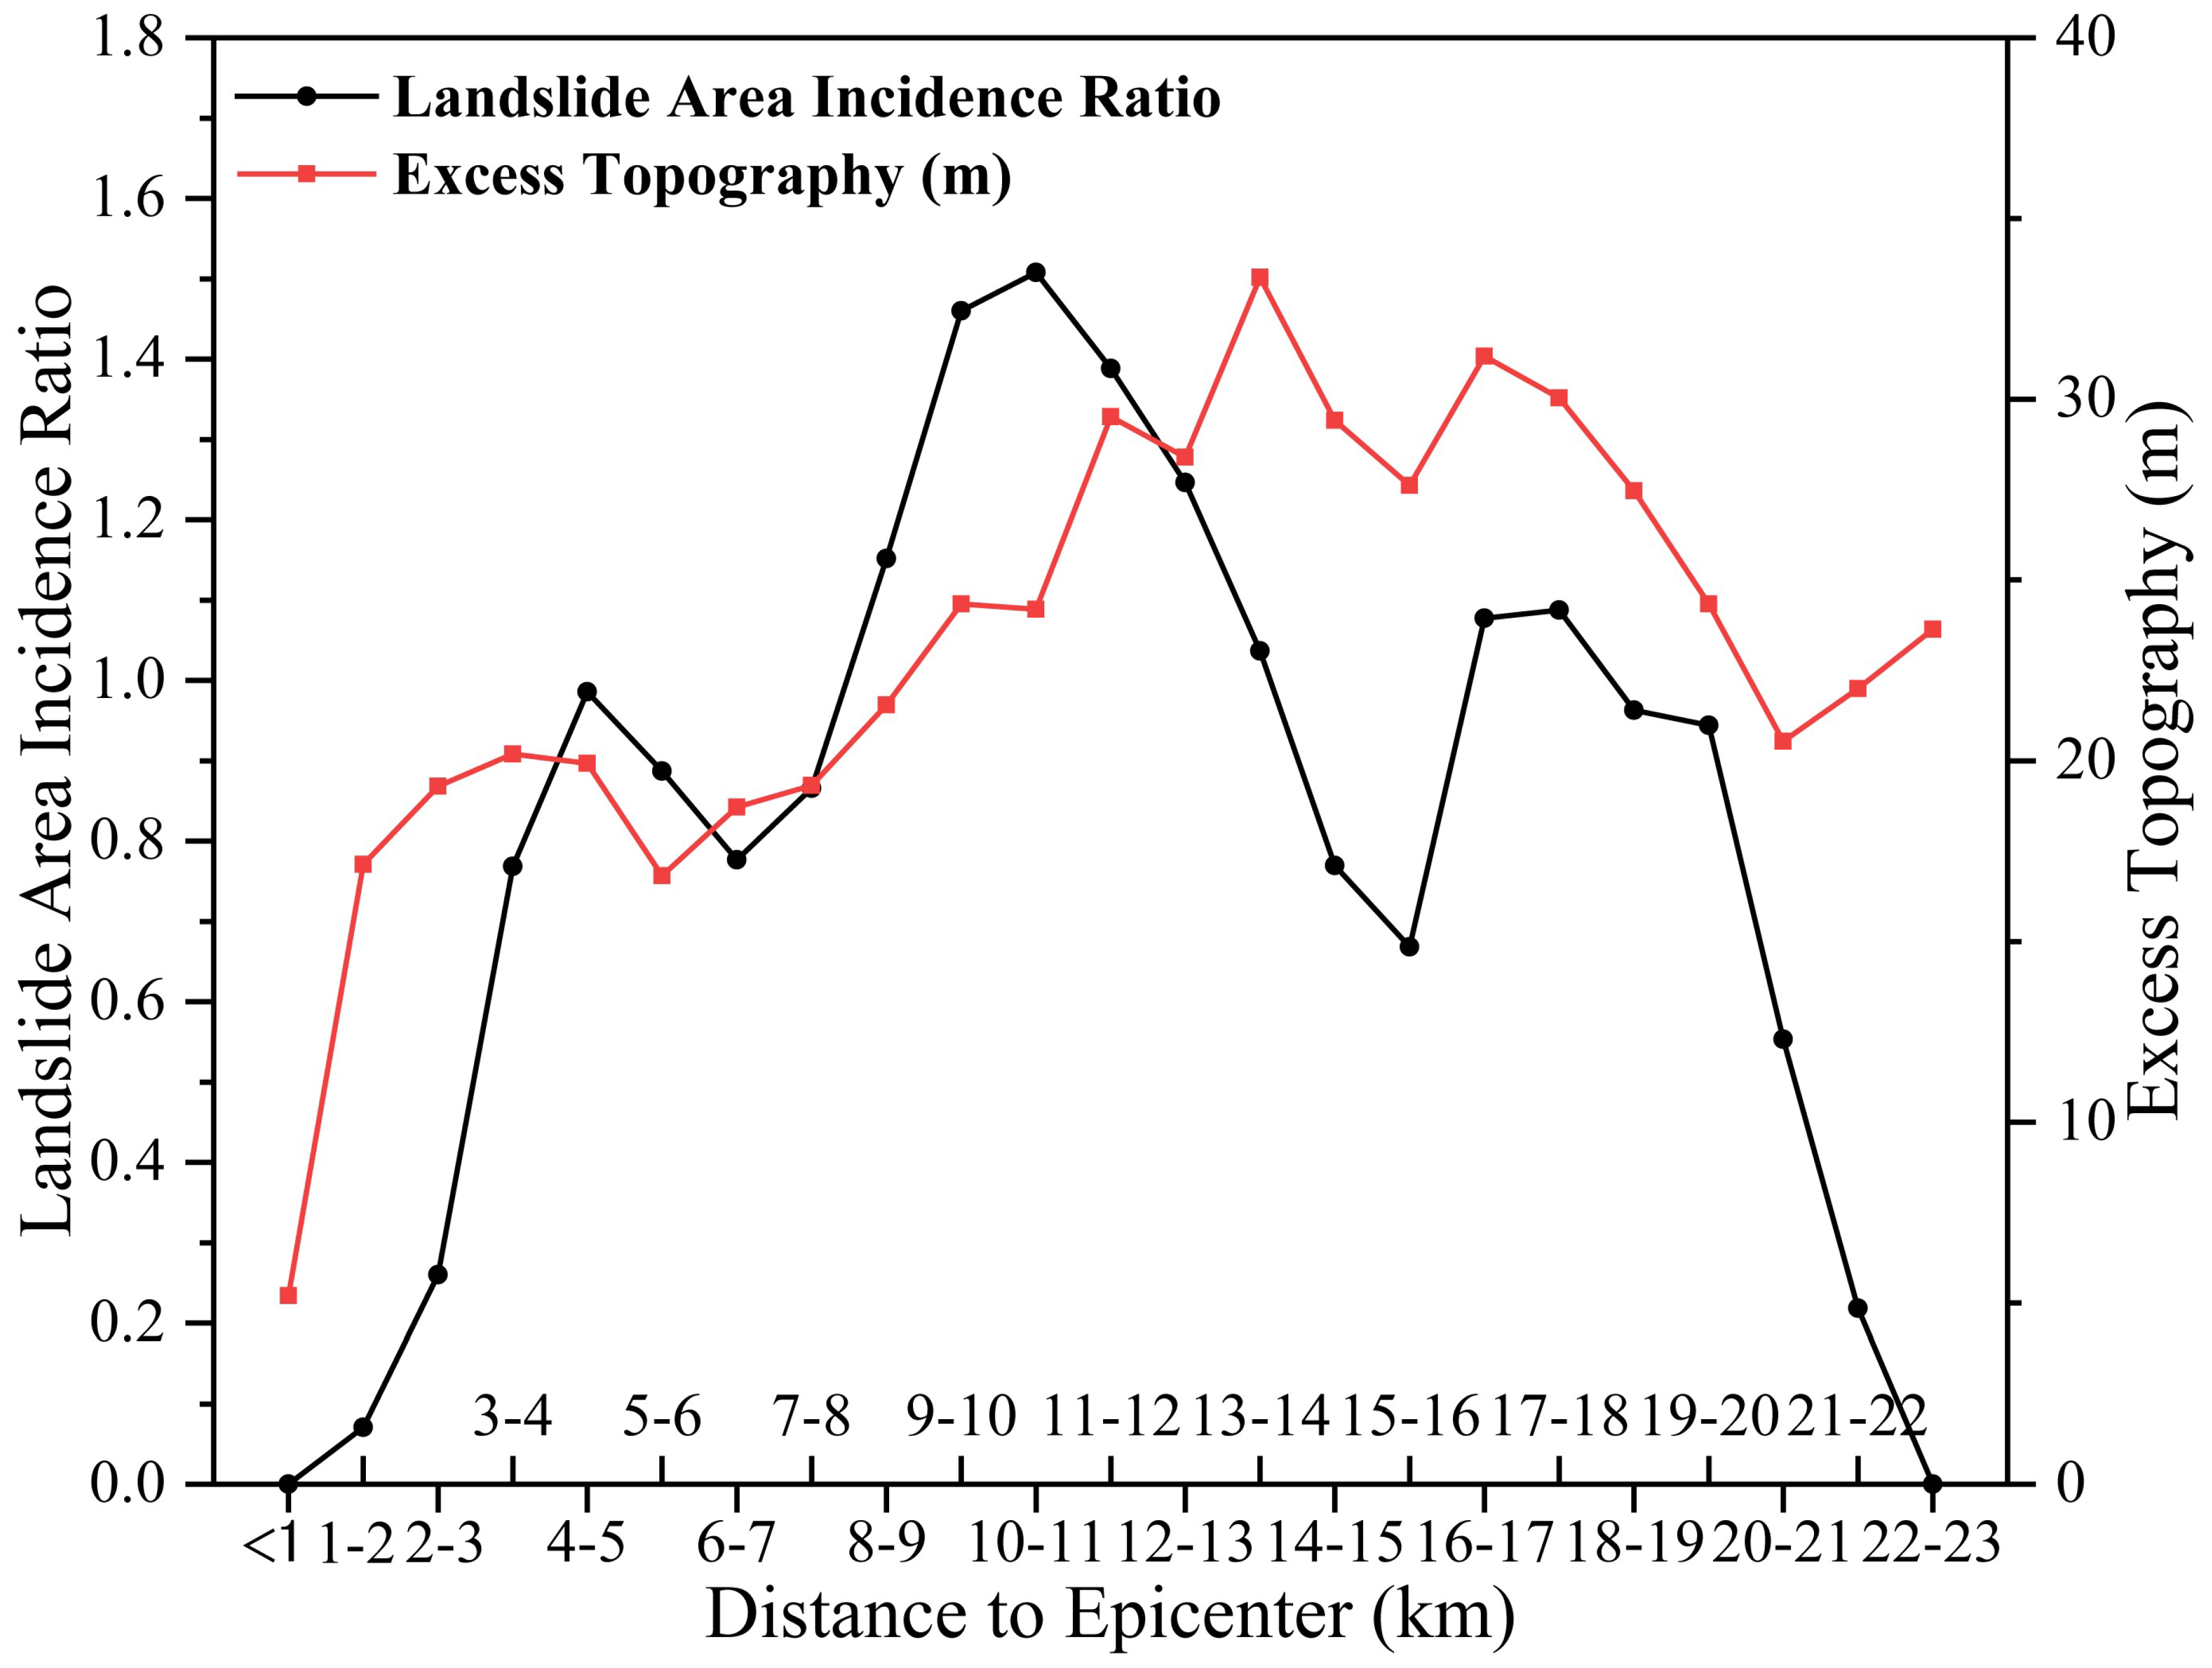
As the distance from the epicenter increased, the incidence ratio of the coseismic landslides in the study area exhibited an overall trend that initially increased and then decreased (Figure 12). The value reached its maximum within the range of 10–11 km from the epicenter, and then began to decline. It can be seen from Figure 12 that the distribution of the excess topography in the study area was consistent with the development scale of the coseismic landslides. In the study area, the impact of the earthquake on the development of landslides within 0–10 km of the epicenter was relatively strong. Even if the area with a high excess topography was small, the area of the coseismic landslides was larger. On the contrary, the impact of the earthquake on the development of the landslides in the area >10 km from the epicenter was relatively weak. Even if a large-scale high-excess-topography area developed in an area, the incidence ratio of the coseismic landslides would not increase. In the range of 22–23 km, the region of the study area farthest from the epicenter, the number and scale of the coseismic landslides still decreased despite the presence of higher excess topography, which is consistent with the objective fact of earthquake motion propagation. In the range of 0–1 km from the epicenter, the number and scale of the landslide development were the lowest because this area had the least excess topography.
The closer to the epicenter an area was, the greater the impact of the excess topography on earthquake-induced landslides. The larger the excess topography in the vicinity of the epicenter, the larger the scale of landslides that occurred. In areas far from the epicenter, the number and scale of coseismic landslides were relatively small, and even if there was much excess topography, landslides did not occur. This indicates that the excess topography is the material basis for landslide occurrence, while the external force factor of an earthquake is the dynamic condition that leads to landslide occurrence. This is in line with objective facts. Similarly, analyzing the size of the excess topography is of great significance for the prediction and risk analysis of earthquake landslides.
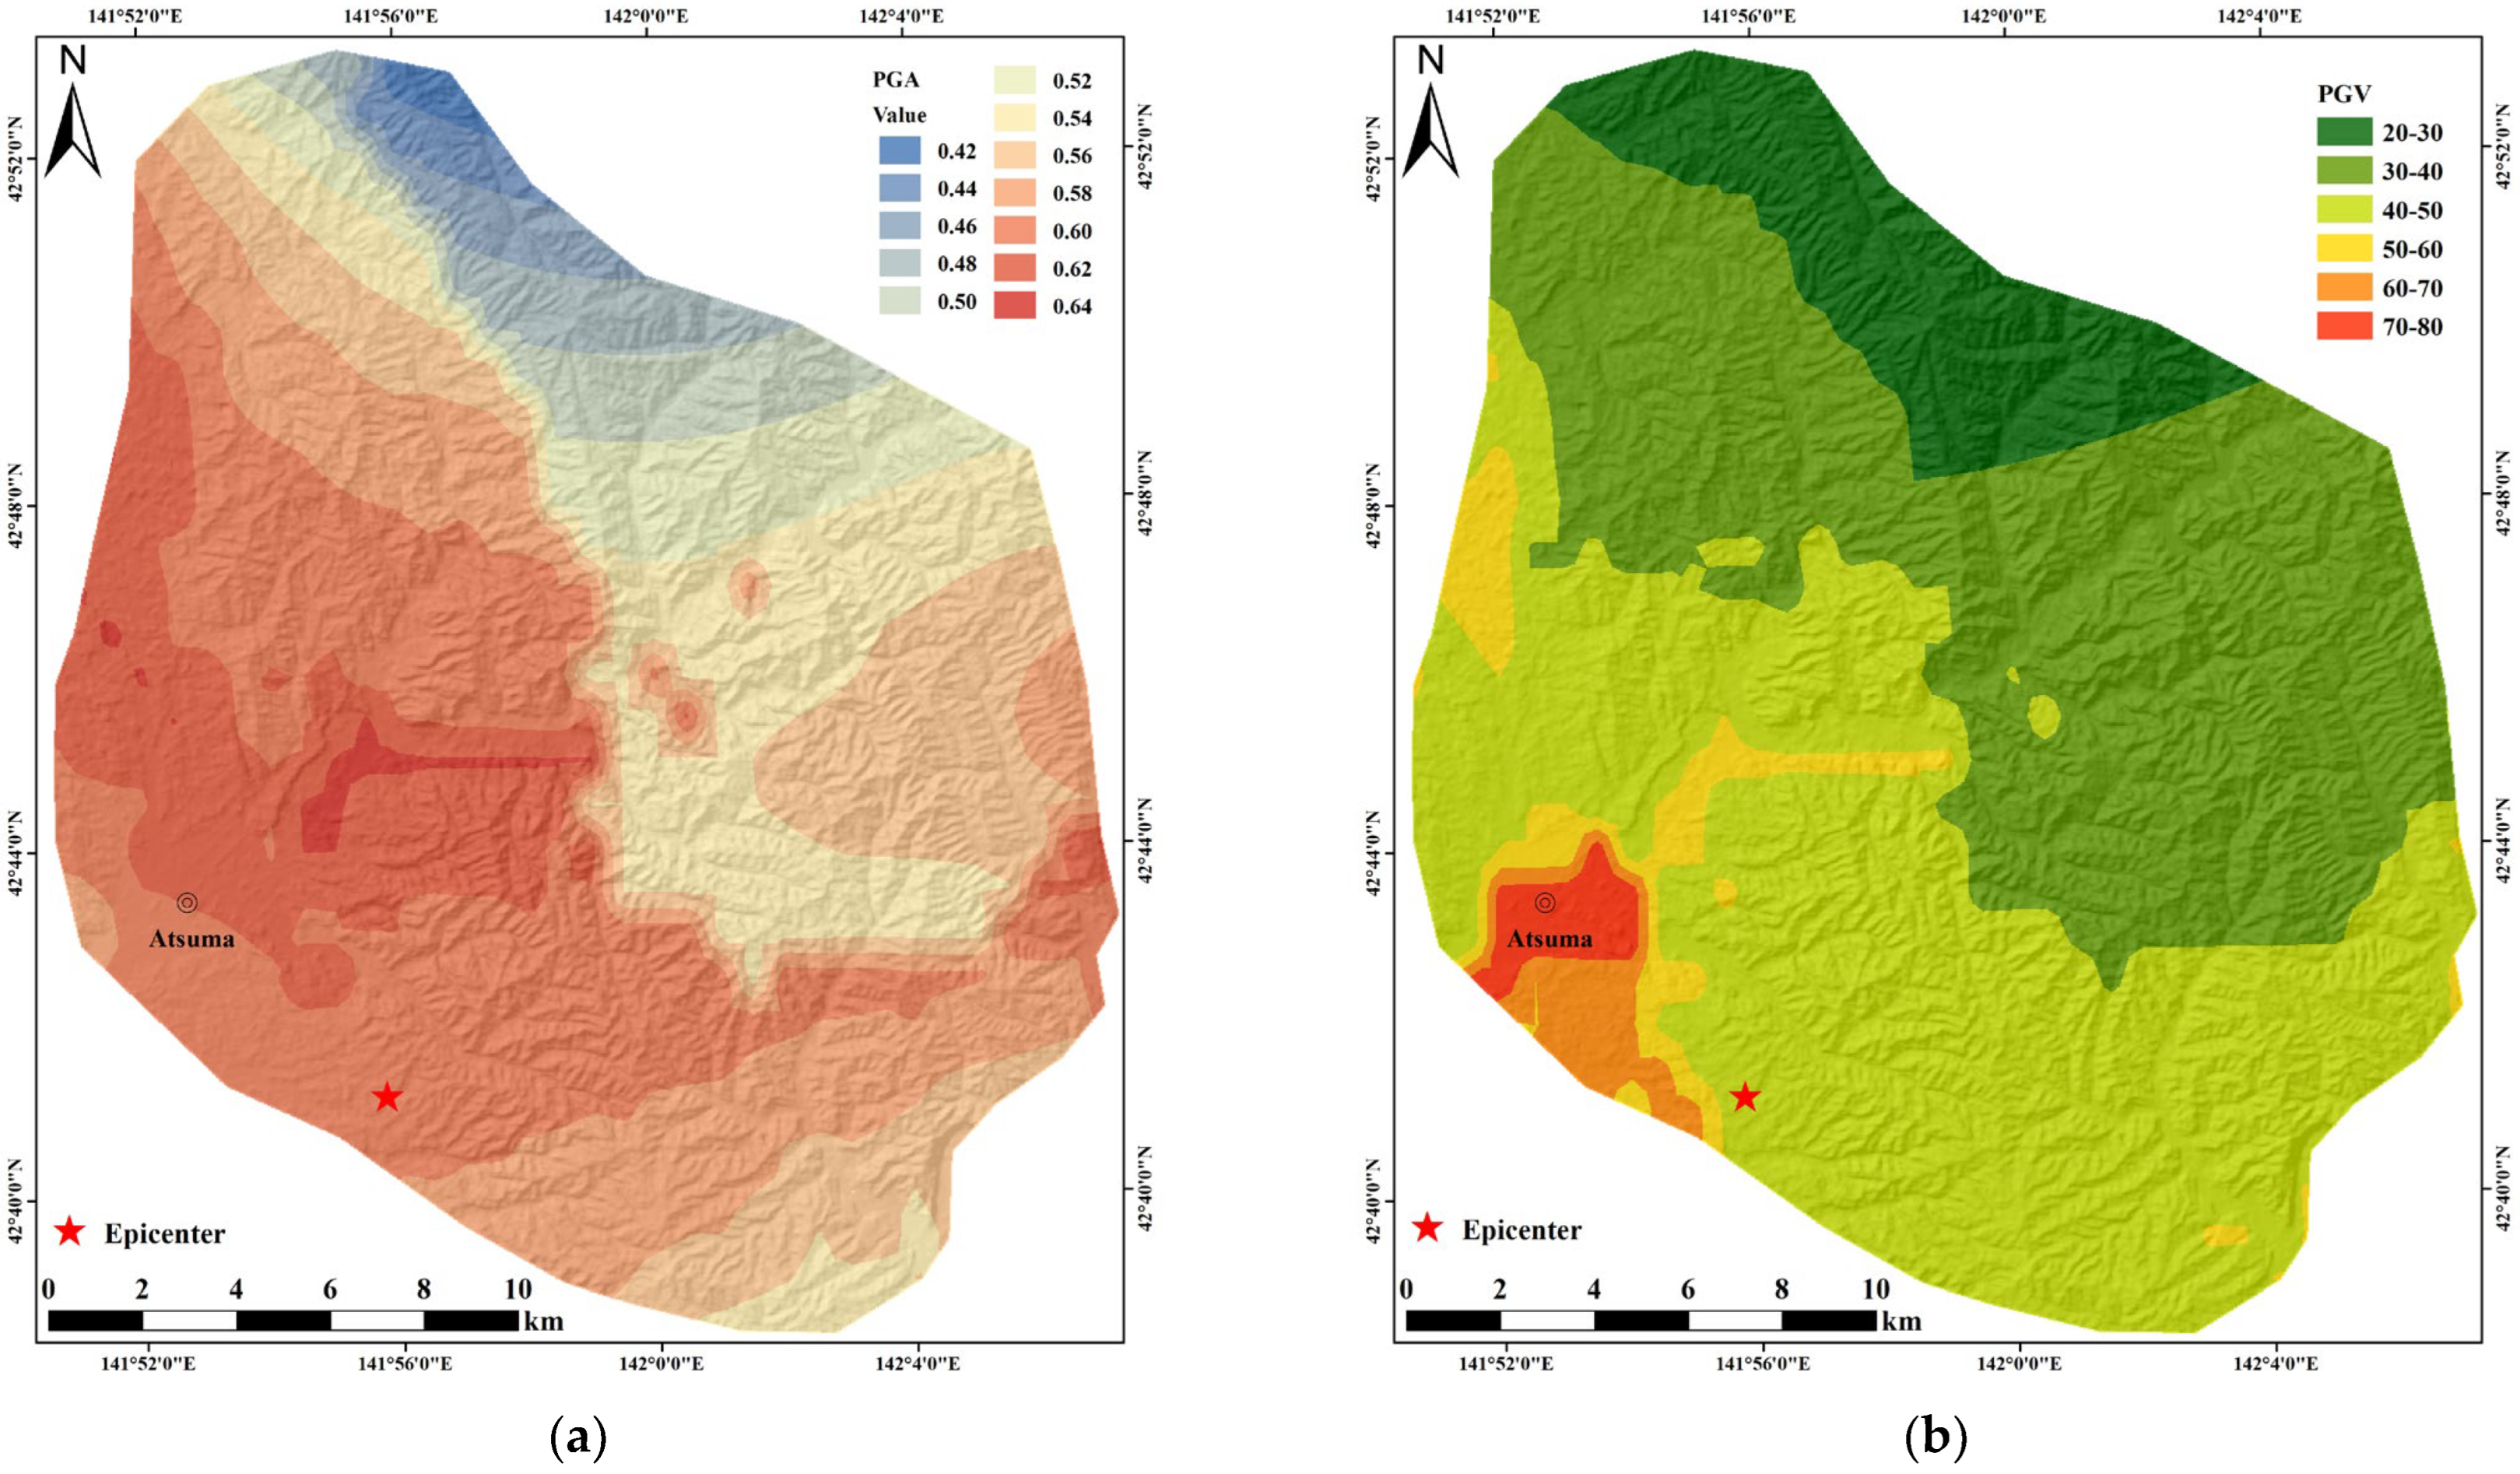
Strong ground motion is an immediate trigger of coseismic landslides. Because the seismic intensity interval is larger compared to the PGA, or the same intensity, the upper and lower limits of the PGA can be several times different due to the different magnitudes. Therefore, we selected PGA and PGV as an index to represent ground shaking (Figure 13). The PGA and PGV data used in this work were from the USGS (https://earthquake.usgs.gov, accessed on 8 October 2023).
Table 2 shows that under the same PGA conditions, the density of coseismic landslide surfaces in areas with excess topography is generally higher than that in areas with no excess topography. In the study area, when the excess topography was within the range of 30–60 m and the PGA was 0.62 g, the maximum density of the landslide surface was 0.1957. When PGA < 0.5 g, coseismic landslides mainly developed within the range of 0–30 m in excess topography. When PGA > 0.5 g, coseismic landslides mainly developed in areas with high excess topography. Table 3 shows that under the same PGV conditions, the density of coseismic landslide surfaces in areas with excess topography was generally higher than that in areas with no excess topography. In the study area, when the excess topography was within the range of 10–30 m and the PGV was within the range of 30–40 cm/s, the maximum density of the landslide surface was 0.1208. When the PGV was within the range of 20–30 cm/s, coseismic landslides mainly developed within the range of 0–30 m in excess topography. When the PGV was within the range of 30–60 cm/s, coseismic landslides developed in the excess topography area. When PGV > 60 cm/s, there was less development of coseismic landslides in the area. The Table 2 and Table 3 indicate that when the PGA was large, the excess topography had a greater impact on inducing coseismic landslides. In the study area, when the PGV was between 30–60 cm/s, the excess topography had a significant impact on earthquake-induced landslides.

6. Discussion

6.1. Analysis of the Incident Ratio of the Coseismic Landslides in the Different Excess Topography Intervals

If R i is 1, the contribution of the ith category or data segment of a certain factor to the area of the coseismic landslide development in this area is commensurate with the exposed area in this area, and it represents the average level of landslide development probability in this area [41]. If R i is greater than 1, the contribution of the ith category or data segment of this factor to the area of the coseismic landslide development in this area is higher than its exposed area in this area. This indicates that the probability of landslides in this category or data segment is higher than the average level of the whole area, making it a factor category prone to landslides in this area. In contrast, if R i is less than 1, the ith category or data segment of this factor makes only a small contribution to the area of coseismic landslide development in this area. This shows that the probability of landslides in this category or data segment is low, making it a factor category that is not prone to landslides in this area.
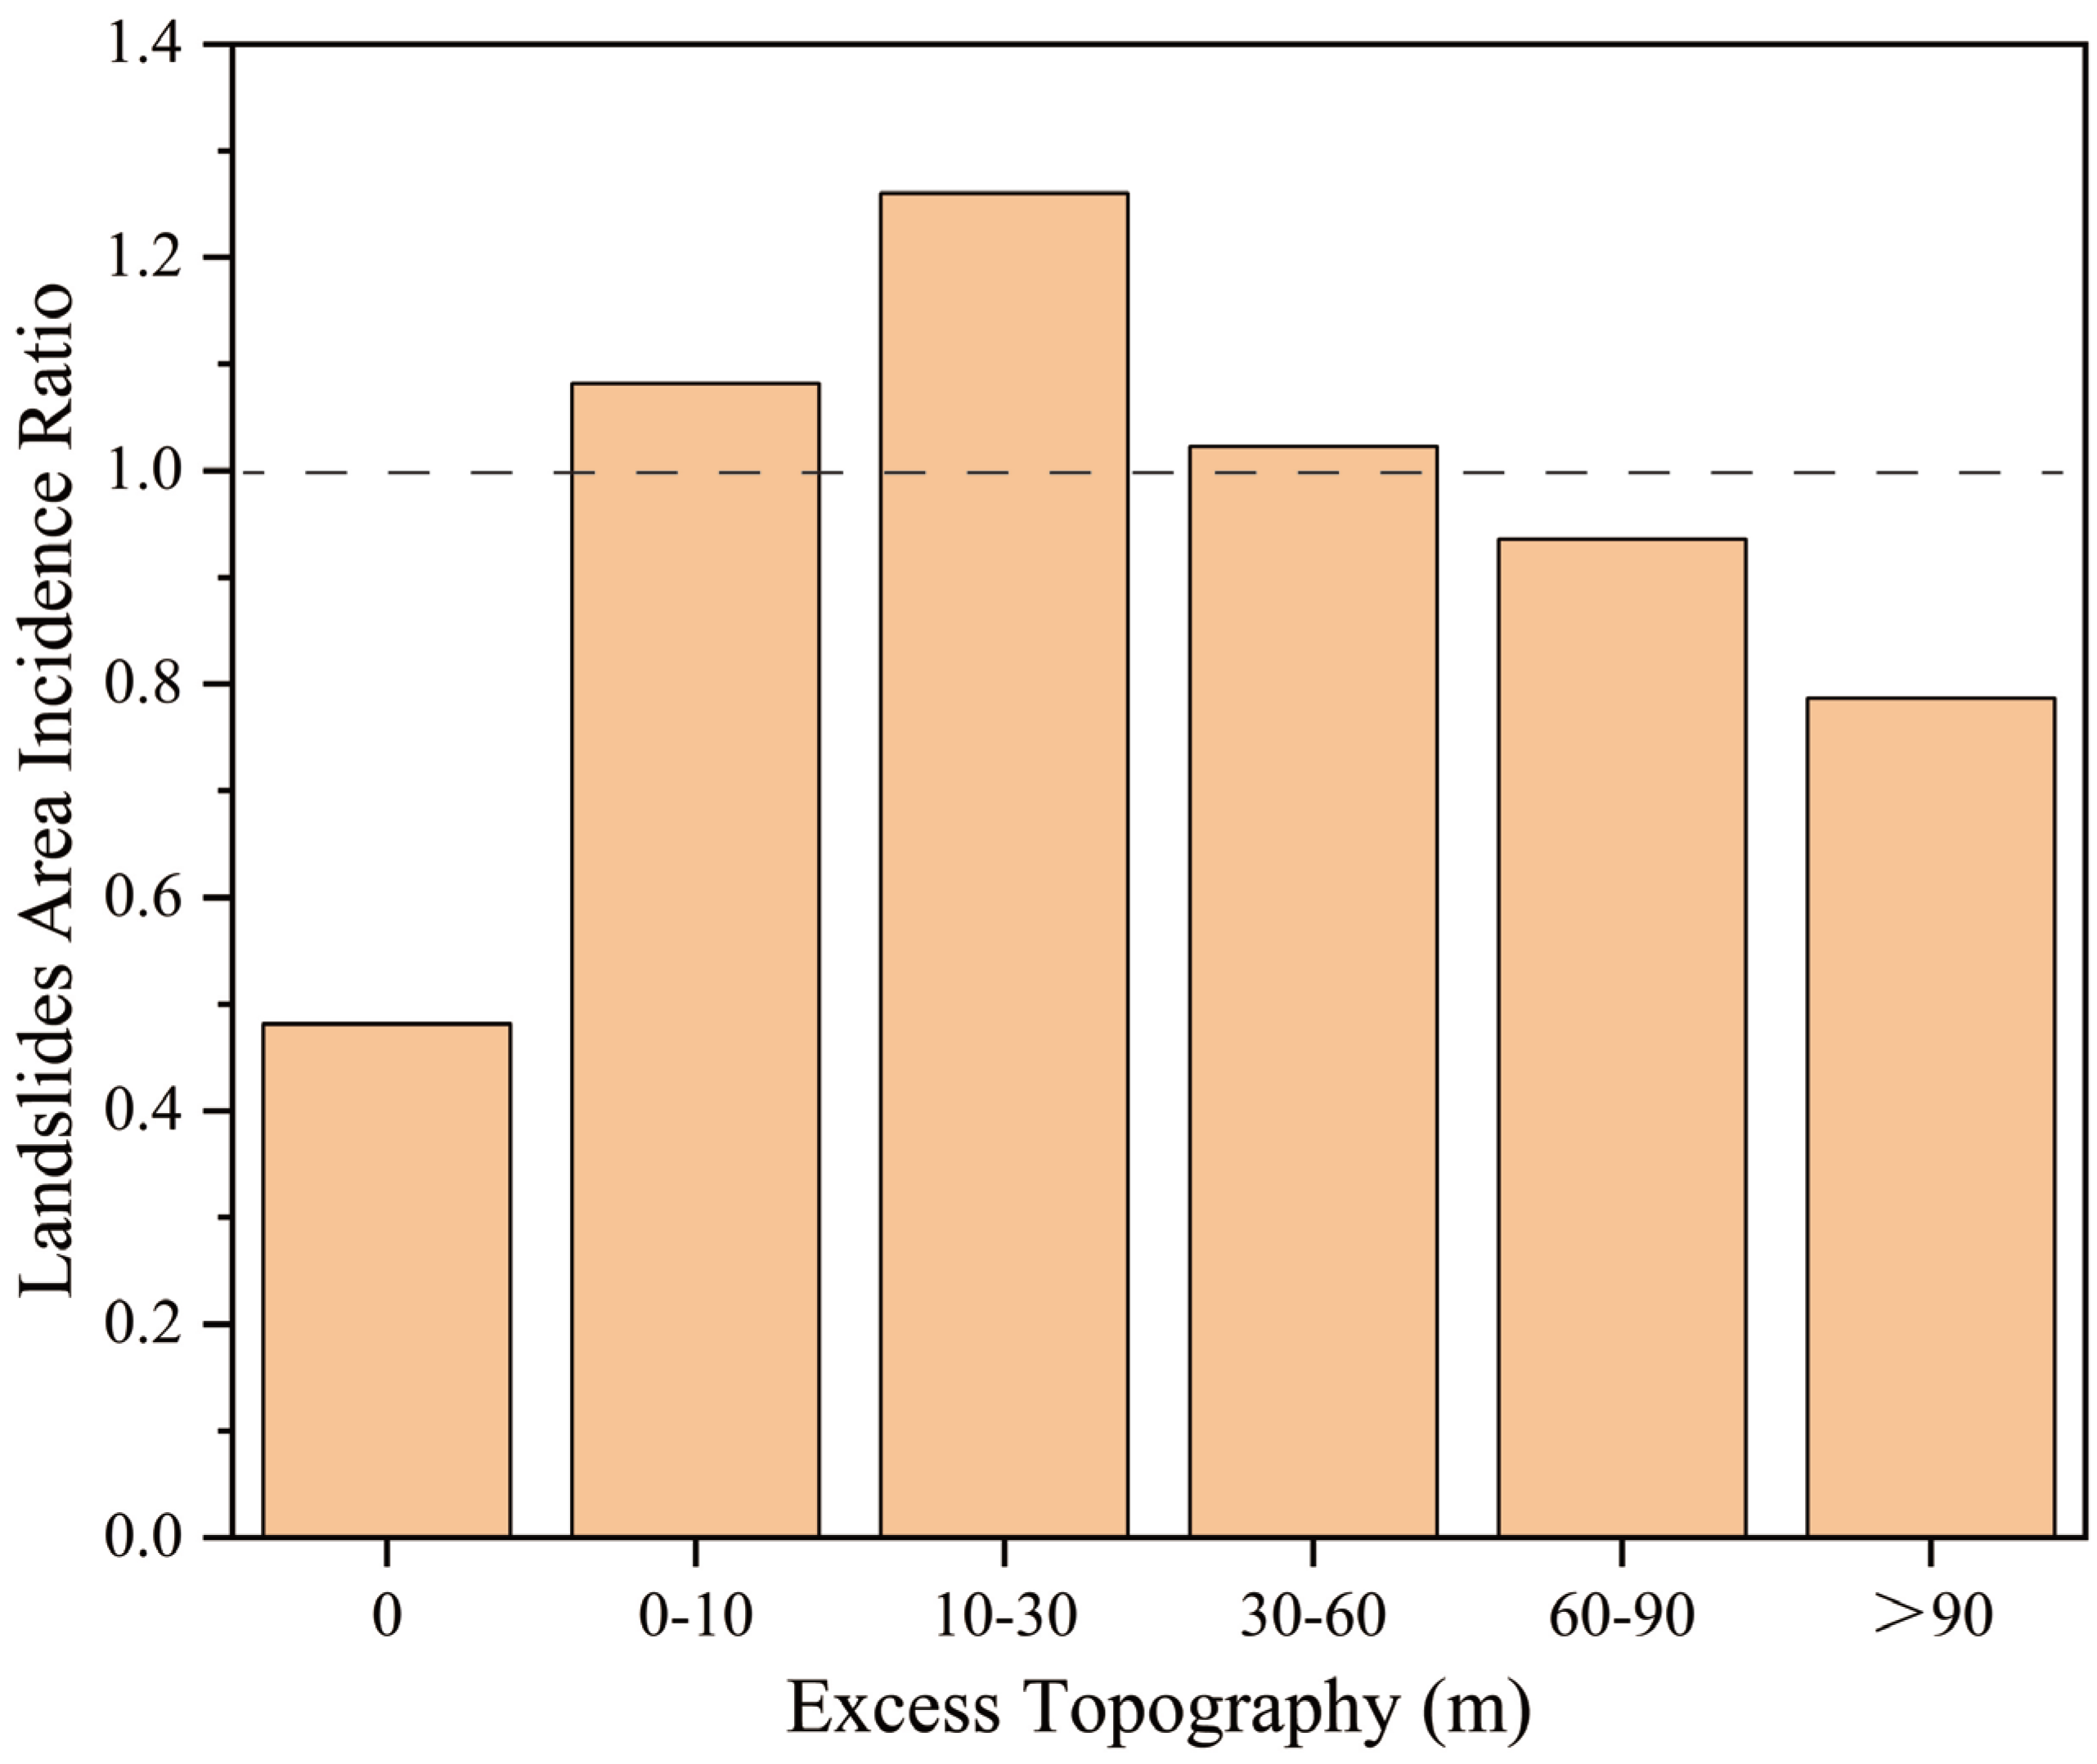
The incident ratio of the coseismic landslides in different excess topography intervals in the study area was calculated (Figure 14). The results show that the incidence ratio of the coseismic landslides with an excess topography of 0–60 m in the area was greater than 1, making this a landslide-prone excess topography interval in this area. Among them, the coseismic landslides were most likely to develop in the 10–30 m interval. However, the incidence ratio of the coseismic landslides in the 30–60 m interval was close to 1, indicating that this section had an average level of coseismic landslide area development in this area. Although the incidence ratio of the coseismic landslides in the >60 m interval was less than 1, the value was relatively high, so it also contributed to the coseismic landslides development area in this area. The incidence ratio of the coseismic landslides in the non-excessive-topography areas was the lowest, with a value of <0.5. This shows that the contribution of the non-excess-topography areas to the coseismic landslides was relatively low in this area. The results indicate that excess topography made a very large contribution to the coseismic landslide development area.

6.2. Influence of the Earthquake and Excess Topography on Coseismic Landslides

It can be seen from Figure 14 that the coseismic landslides were most developed within approximately 10 km of the epicenter. Therefore, we selected a 25 km long section line at a distance of 10 km from the epicenter in the study area, and extended the analysis to 1 km on both sides of the section line to form a section strip (Figure 6). We extracted the real topography and threshold slope surface along the profile line (Figure 15) and calculated the average excess topography and the average incidence ratio of the coseismic landslides for the profile strips at intervals of 1 km (Figure 14). The trend in the incidence ratio of the landslides coincided with the trend of the mean excess topography. The profile shows that on both sides of the river, on a high and steep ridge or at the lower foot of a slope, there was more redundant topography. However, in the flatter plains and fluvial sedimentary areas, there was little or no excess topography. In the high and steep areas on both sides of the river, the scale of the coseismic landslides was relatively large in the areas with more excess topography. In the gray dotted line box in Figure 15, in the high and steep area on the side of the main river, the area with a high development rate of coseismic landslides also had a large amount of excess topography. This shows that the excess topography was the main provenance area for coseismic landslides. There was a lot of excess topography within the range of 12–25 km in the section strip, but the scale of the coseismic landslides was relatively small. This may be because the selected threshold slope value was too small due to the differences in the lithology or other properties in this section, resulting in a larger amount of excess topography.

6.3. Influence of Coseismic Landslides on Mass Adjusting in the Future

In a sense, landslides are a result of the balance between rock uplift and erosion, which is reflected by the topography [2,3,4,5,6,7,8,9]. Although the proximity to faults and experience of ground shaking influence the distribution of coseismic landslides during earthquakes [24,42,43], landscape impacts are also obvious as shown by the occurrence of coseismic landslides in areas characterized by excess topography in the Mw 6.6 Iburi earthquake.
In contrast to long-term slow erosion processes, earthquake-induced landslides are sudden events which can mobilize large masses of material over a wide region, and their occurrences are a kind of simultaneous adjustments of the excess geomorphic material of hill slopes to a steady state. In this case, the strata in the study area are relatively new (Figure 2) and are mainly composed of Quaternary and Neogene strata, resulting in coseismic landslides being mostly shallow soil landslides (Figure 3), and rock landslides are rarely developed. The thickness of the landslide body was much smaller than the excess topography height in the landslide-affected areas. This may imply that the excess topography was not completely removed by the coseismic landslides, and that the areas where the earthquake landslides occurred still have the possibility of producing landslides in the future.

6.4. Limitations of Analyzing the Distribution of Coseismic Landslides by Using Excess Topography

Although this study illustrates that the excess topography fits the distribution of the Iburi earthquake landslides well, there are certain limitations in the method of calculating the excess topography utilized including the objective error of the calculation program and the subjective error of selecting the threshold slope.
Both natural and experimental slopes exhibit discrete slope failures that are highly variable in both space and time [44]. The fact that landslides can occur on different slopes shows the uncertainty of threshold angles; therefore, it is still a challenge to apply the geomorphic concept of threshold in predicting landslide areas. The threshold slopes of the different lithological formations were not the same, so the formation lithology had a great influence on the excess topography. According to the results, it is more reasonable to use the average value of the different lithology slopes as the threshold slope. However, it remains to be verified whether it is reasonable to choose the average value as the threshold slope for other regions. When calculating the excess topography, for a specific threshold slope, the smaller the value selected is, the larger the excess topography obtained will be. The threshold slope value for an area is not consistent. If the selected threshold slope value is smaller than the real threshold slope value, the excess topography in the study area will be exaggerated, which will increase the correlation between the landslides and excess topography. Future research should more thoroughly explore how to select the optimal threshold slope scheme to obtain the excess topography. And, on the basis of reasonably determining the threshold slope, we can identify the potential landslide occurrence areas by calculating the excess topography.
The excess topography spatially controls the possible location of coseismic landslides, and different geomorphic factors also have impacts on this controlling effect. However, whether a landslide occurs during an earthquake depends on the magnitude of the peak ground acceleration. Through statistics, we found that within a certain distance range from the epicenter, coseismic landslides developed on a larger scale in the areas with large excess topography. Beyond this range, the controlling effect of the excess topography on the development of the coseismic landslides was weaker.
In the future, the comprehensive controlling effect of the different geomorphic factors and excess topography on earthquake landslides can be quantitatively studied. Correlations of seismic events in other regions with excess topography can similarly be studied. In this paper, the readily available ASTER DEM data with a resolution of 30 m were used to calculate the excess topography and to extract the geomorphic factors. The resolution of the DEM may have an impact on the obtained results. Subsequent work can explore the impact of the resolution of the DEM on the excess topography and the distribution of earthquake landslides. Future research should study the relationship between the properties of the geotechnical mass and excess topography.

7. Conclusions

In this paper, the excess topography in the Iburi seismic area was calculated based on ASTER DEM data with a 30 m resolution. Quantitative analysis of the correlation with the 9249 coseismic landslides triggered by the 2018 Mw 6.6 Iburi earthquake was performed. The following main conclusions were obtained.
(1)
The excess topography had a strong control effect on the spatial distribution of the coseismic landslides in the study area. More than 94% of the landslides (approximately 28.23 km2) occurred in the areas with excess topography. Excess topography can be used for predicting coseismic landslides and conducting hazard analysis.
(2)
The excess topography spatially controls the possible locations of coseismic landslides, and whether a coseismic landslide occurs depends on the magnitude of the peak ground acceleration. In the study area, within 0–10 km of the epicenter, the development scale of the coseismic landslides increased with increasing excess topography. Beyond this range, the controlling effect of the excess topography on coseismic landslides was weaker.
(3)
The earthquake mainly induced shallow landslides with a relatively small thickness, which was generally smaller than the height of the excess topography in the main landslide development locations. This means that the earthquake-induced landslides did not completely remove the excess topography. Within a certain range, there is still the possibility of landslides in the future.

Author Contributions

Conceptualization, P.Z. and H.Q.; methodology, P.Z., X.C. and Q.Z.; validation, P.Z.; formal analysis, P.Z., H.Q. and X.C.; investigation, P.Z.; resources, P.Z. and C.X.; data curation, P.Z. and C.X.; writing—original draft preparation, P.Z.; writing—review and editing, P.Z., X.C. and Q.Z.; visualization, P.Z.; supervision, P.Z., X.C. and Q.Z.; project administration, X.C.; funding acquisition, X.C. All authors have read and agreed to the published version of the manuscript.

Funding

This research was funded by the National Nonprofit Fundamental Research Grant of China, Institute of Geology, China Earthquake Administration (grant no. IGCEA2202).

Data Availability Statement

Data associated with this research are available and can be obtained by contacting the corresponding author.

Acknowledgments

We appreciate the editors and reviewers for their valuable comments that greatly improved the paper.

Conflicts of Interest

The authors declare no conflict of interest.

References

  1. Zhang, P.; Xu, C.; Ma, S.; Shao, X.; Tian, Y.; Wen, B. Automatic extraction of seismic landslides in large areas with complex environments based on deep learning: An example of the 2018 iburi earthquake, Japan. Remote Sens. 2020, 12, 3992. [Google Scholar] [CrossRef]
  2. Densmore, A.L.; Ellis, M.A.; Anderson, R.S. Landsliding and the evolution of normal-fault-bounded mountains. J. Geophys. Res. Solid Earth 1998, 103, 15203–15219. [Google Scholar] [CrossRef]
  3. Montgomery, D.R. Slope distributions, threshold hillslopes, and steady-state topography. Am. J. Sci. 2001, 301, 432–454. [Google Scholar] [CrossRef]
  4. Burbank, D. Rates of erosion and their implications for exhumation. Mineral. Mag. 2002, 66, 25–52. [Google Scholar] [CrossRef]
  5. Montgomery, D.R.; Brandon, M.T. Topographic controls on erosion rates in tectonically active mountain ranges. Earth Planet. Sci. Lett. 2002, 201, 481–489. [Google Scholar] [CrossRef]
  6. Roering, J.J.; Perron, J.T.; Kirchner, J.W. Functional relationships between denudation and hillslope form and relief. Earth Planet. Sci. Lett. 2007, 264, 245–258. [Google Scholar] [CrossRef]
  7. Korup, O.; Densmore, A.L.; Schlunegger, F. The role of landslides in mountain range evolution. Geomorphology 2010, 120, 77–90. [Google Scholar] [CrossRef]
  8. Larsen, I.J.; Montgomery, D.R.; Korup, O. Landslide erosion controlled by hillslope material. Nat. Geosci. 2010, 3, 247–251. [Google Scholar] [CrossRef]
  9. Larsen, I.J.; Montgomery, D.R. Landslide erosion coupled to tectonics and river incision. Nat. Geosci. 2012, 5, 468–473. [Google Scholar] [CrossRef]
  10. Su, L.; Hu, K.; Zhang, W.; Wang, J.; Lei, Y.; Zhang, C.; Cui, P.; Pasuto, A.; Zheng, Q. Characteristics and triggering mechanism of Xinmo landslide on 24 June 2017 in Sichuan, China. J. Mt. Sci. 2017, 14, 1689–1700. [Google Scholar] [CrossRef]
  11. Wang, Y.; Zhao, B.; Li, J. Mechanism of the catastrophic June 2017 landslide at Xinmo village, Songping river, Sichuan province, China. Landslides 2018, 15, 333–345. [Google Scholar] [CrossRef]
  12. Hu, K.; Wu, C.; Tang, J.; Pasuto, A.; Li, Y.; Yan, S. New understandings of the June 24th 2017 Xinmo landslide, Maoxian, Sichuan, china. Landslides 2018, 15, 2465–2474. [Google Scholar] [CrossRef]
  13. Chen, X.; Wang, M.; Chuan, Y.; Wei, Y.; Zhang, P. Topographic Controls on the Distribution of Coseismic Landslides: A Case Study Using the Coefficient of Variation of the 2014 Ludian, Yunnan, China, Ms6.5 Earthquake. Lithosphere 2022, 2021, 6678652. [Google Scholar] [CrossRef]
  14. Burbank, D.W.; Leland, J.; Fielding, E.; Anderson, R.S.; Brozovic, N.; Reid, M.R.; Duncan, C. Bedrock incision, rock uplift and threshold hillslopes in the northwestern Himalayas. Nature 1996, 379, 505–510. [Google Scholar] [CrossRef]
  15. Blöthe, J.H.; Korup, O.; Schwanghart, W. Large landslides lie low: Excess topography in the Himalaya-Karakoram ranges. Geology 2015, 43, 523–526. [Google Scholar] [CrossRef]
  16. Perron, J.T. Numerical methods for nonlinear hillslope transport laws. J. Geophys. Res. Earth Surf. 2011, 116. [Google Scholar] [CrossRef]
  17. Wang, W.N.; Wu, H.L.; Nakamura, H.; Wu, S.C.; Ouyang, S.; Yu, M.F. Mass movements caused by recent tectonic activity: The 1999 Chi-chi earthquake in central Taiwan. Isl. Arc 2003, 12, 325–334. [Google Scholar] [CrossRef]
  18. Khazai, B.; Sitar, N. Evaluation of factors controlling earthquake-induced landslides caused by Chi-Chi earthquake and comparison with the Northridge and Loma Prieta events. Eng. Geol. 2004, 71, 79–95. [Google Scholar] [CrossRef]
  19. Sato, H.P.; Hasegawa, H.; Fujiwara, S.; Tobita, M.; Koarai, M.; Une, H.; Iwahashi, J. Interpretation of landslide distribution triggered by the 2005 Northern Pakistan earthquake using SPOT 5 imagery. Landslides 2007, 4, 113–122. [Google Scholar] [CrossRef]
  20. Wang, H.; Sassa, K.; Xu, W. Analysis of a spatial distribution of landslides triggered by the 2004 Chuetsu earthquakes of Niigata Prefecture, Japan. Nat. Hazards 2007, 41, 43–60. [Google Scholar] [CrossRef]
  21. Gorum, T.; Fan, X.; van Westen, C.J.; Huang, R.Q.; Xu, Q.; Tang, C.; Wang, G. Distribution pattern of earthquake-induced landslides triggered by the 12 May 2008 Wenchuan earthquake. Geomorphology 2011, 133, 152–167. [Google Scholar] [CrossRef]
  22. Qi, S.; Xu, Q.; Zhang, B.; Zhou, Y.; Lan, H.; Li, L. Source characteristics of long runout rock avalanches triggered by the 2008 Wenchuan earthquake, China. J. Asian Earth Sci. 2011, 40, 896–906. [Google Scholar] [CrossRef]
  23. Chen, X.; Zhou, Q.; Liu, C. Distribution pattern of coseismic landslides triggered by the 2014 Ludian, Yunnan, China Mw6. 1 earthquake: Special controlling conditions of local topography. Landslides 2015, 12, 1159–1168. [Google Scholar]
  24. Zhou, S.; Chen, G.; Fang, L. Distribution pattern of landslides triggered by the 2014 Ludian earthquake of China: Implications for regional threshold topography and the seismogenic fault identification. ISPRS Int. J. Geo-Inf. 2016, 5, 46. [Google Scholar] [CrossRef]
  25. Gallo, F.; Lavé, J. Evolution of a large landslide in the High Himalaya of central Nepal during the last half-century. Geomorphology 2014, 223, 20–32. [Google Scholar] [CrossRef]
  26. Amante, C.; Eakins, B.W. ETOPO1 Arc-Minute Global Relief Model: Procedures, Data Sources and Analysis. 2009. Available online: https://repository.library.noaa.gov/view/noaa/1163 (accessed on 9 June 2023).
  27. Moreno, T.; Wallis, S.R.; Kojima, T.; Gibbons, W. The Geology of Japan; Geological Society of London: London, UK, 2016. [Google Scholar]
  28. Gou, T.; Huang, Z.; Zhao, D.; Wang, L. Structural heterogeneity and anisotropy in the source zone of the 2018 Eastern Iburi earthquake in Hokkaido, Japan. J. Geophys. Res. Solid Earth 2019, 124, 7052–7066. [Google Scholar] [CrossRef]
  29. Kobayashi, H.; Koketsu, K.; Miyake, H. Rupture process of the 2018 Hokkaido Eastern Iburi earthquake derived from strong motion and geodetic data. Earth Planets Space 2019, 71, 63. [Google Scholar] [CrossRef]
  30. Okada, A.; Ikeda, Y. Active faults and neotectonics in Japan. Quat. Res. (Daiyonki-Kenkyu) 1991, 30, 161–174. [Google Scholar] [CrossRef]
  31. Iwahashi, J. 1: 25,000-Scale Active Fault Map in Urban Areas Published by GSI. Bull. Geospat. Inf. Auth. Jpn. 2010, 58, 29–37. [Google Scholar]
  32. Ministry of Land, Infrastructure, Transport and Tourism, Hokkaido Development Bureau. Response to Disasters on the 2018 Hokkaido Eastern Iburi Earthquake; Ministry of Land, Infrastructure, Transport and Tourism, Hokkaido Development Bureau: Sapporo, Japan, 2018. (In Japanese)
  33. Kasai, M.; Yamada, T. Topographic effects on frequency-size distribution of landslides triggered by the Hokkaido Eastern Iburi Earthquake in 2018. Earth Planets Space 2019, 71, 89. [Google Scholar] [CrossRef]
  34. Yamagishi, H.; Yamazaki, F. Landslides by the 2018 hokkaido iburi-tobu earthquake on september 6. Landslides 2018, 15, 2521–2524. [Google Scholar] [CrossRef]
  35. Shao, X.; Ma, S.; Xu, C.; Zhang, P.; Wen, B.; Tian, Y.; Zhou, Q.; Cui, Y. Planet image-based inventorying and machine learning-based susceptibility mapping for the landslides triggered by the 2018 Mw6. 6 Tomakomai, Japan Earthquake. Remote Sens. 2019, 11, 978. [Google Scholar] [CrossRef]
  36. Schwanghart, W.; Kuhn, N.J. TopoToolbox: A set of Matlab functions for topographic analysis. Environ. Model. Softw. 2010, 25, 770–781. [Google Scholar] [CrossRef]
  37. Anderson, M.; Richards, K.; Kneale, P. The role of stability analysis in the interpretation of the evolution of threshold slopes. Trans. Inst. Br. Geogr. 1980, 5, 100–112. [Google Scholar] [CrossRef]
  38. Schmidt, K.M.; Montgomery, D.R. Rock mass strength assessment for bedrock landsliding. Environ. Eng. Geosci. 1996, 2, 325–338. [Google Scholar] [CrossRef]
  39. Bennett, G.L.; Miller, S.R.; Roering, J.J.; Schmidt, D.A. Landslides, threshold slopes, and the survival of relict terrain in the wake of the Mendocino Triple Junction. Geology 2016, 44, 363–366. [Google Scholar] [CrossRef]
  40. Yalcin, A. GIS-based landslide susceptibility mapping using analytical hierarchy process and bivariate statistics in Ardesen (Turkey): Comparisons of results and confirmations. Catena 2008, 72, 1–12. [Google Scholar] [CrossRef]
  41. Qi, S.; Xu, Q.; Liu, C.; Zhang, B.; Liang, N.; Tong, L. Slope Instabilities in the Severest Disaster Areas of 5.12 Wenchuan Earthquake. J. Eng. Geol. 2009, 17, 39–49. [Google Scholar]
  42. Chen, X.L.; Liu, C.G.; Wang, M.M.; Zhou, Q. Causes of unusual distribution of coseismic landslides triggered by the Mw 6.1 2014 Ludian, Yunnan, China earthquake. J. Asian Earth Sci. 2018, 159, 17–23. [Google Scholar] [CrossRef]
  43. Hakan, T.; Luigi, L. Completeness index for earthquake-induced landslide inventories. Eng. Geol. 2020, 264, 105331. [Google Scholar] [CrossRef]
  44. Roering, J. Landslides limit mountain relief. Nat. Geosci. 2012, 5, 446–447. [Google Scholar] [CrossRef]
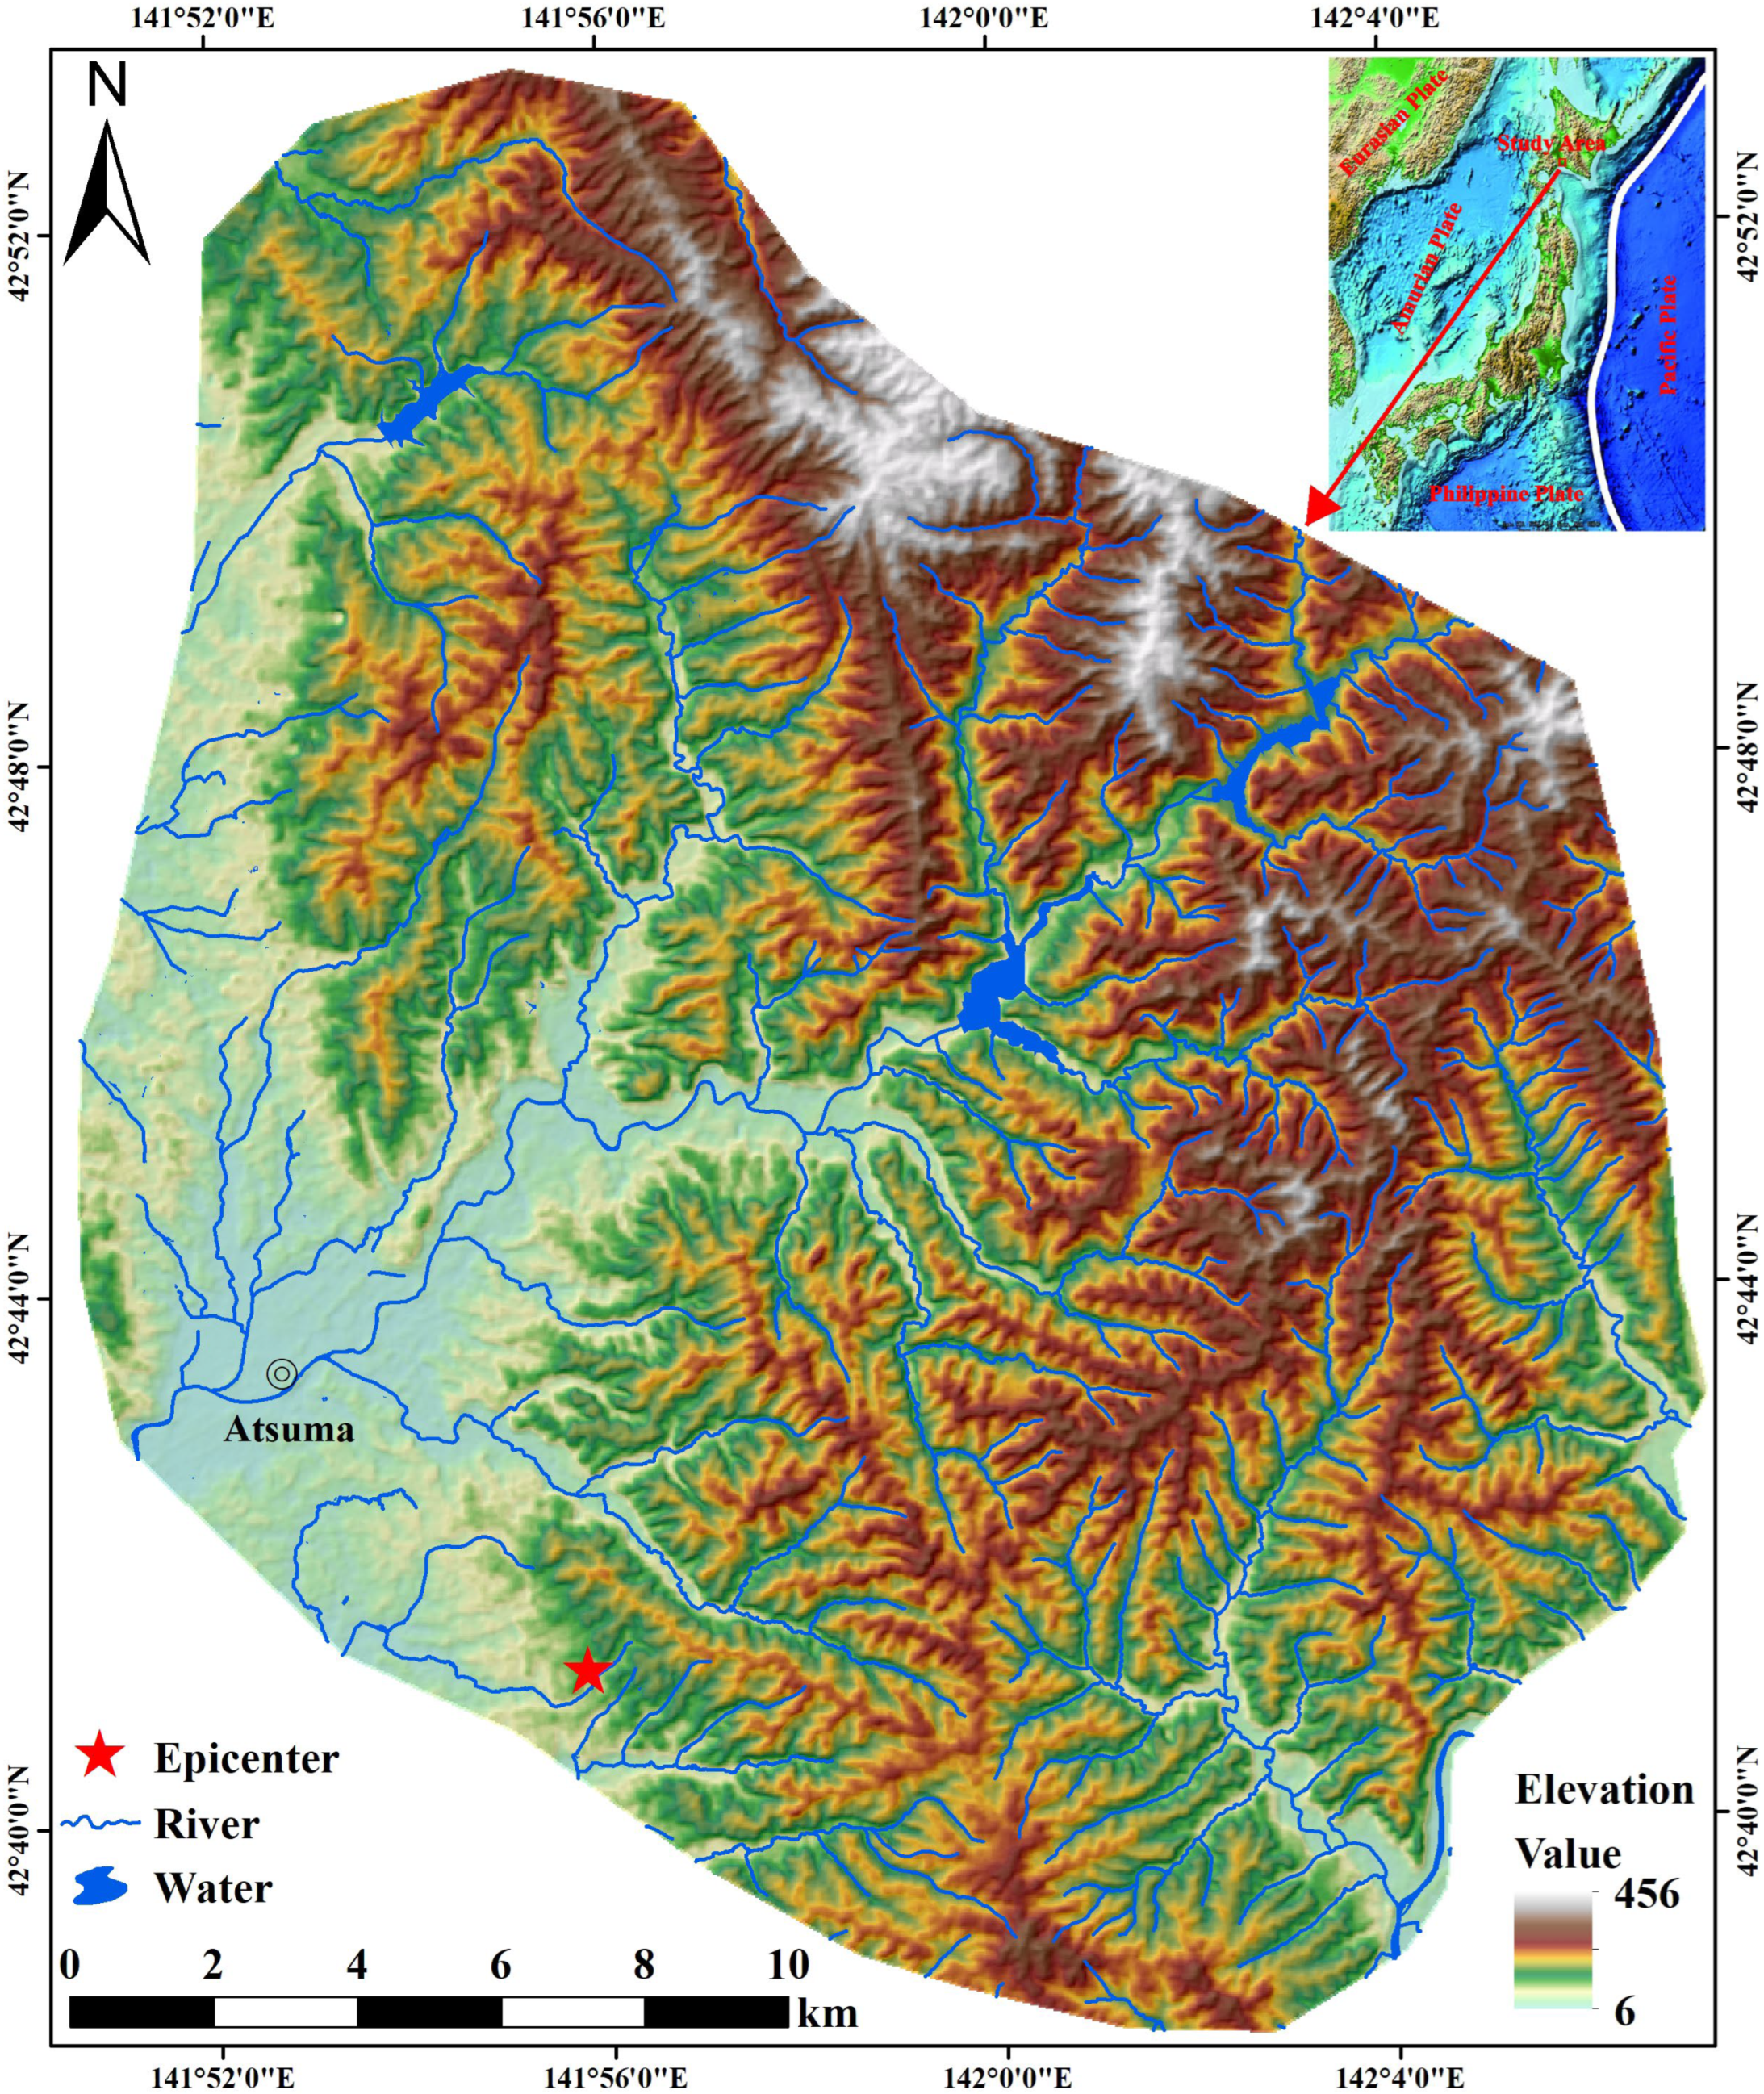
Figure 1. Map showing the study area. The base map is the advanced spaceborne thermal emission and reflection radiometer (ASTER) digital elevation model (DEM) with a resolution of 30 m (https://www.earthdata.nasa.gov/, accessed on 9 June 2023). The topographic background is from the National Geophysical Data Center, National Oceanic and Atmospheric Administration (NOAA) [26].
Remotesensing 15 05035 g001
Figure 2. Map showing the topography of the study area. The topographic background is from the National Geophysical Data Center, NOAA [26]. The active faults were modified from Okada and the 1:25,000 scale Active Fault Map in Urban Areas published by the Geospatial Information Authority of Japan [30,31].
Remotesensing 15 05035 g002
Figure 3. Aerial photos of coseismic landslides in the area affected by the 2018 Iburi earthquake. The photos were taken by the Asia Air Survey and Aero Asahi Corporation [34]. ((A) is showing the shallow coseismic landslides, (B) is showing damaged houses and buried roads, (C) is showing the mudslides by seismic, (D) is showing the destroyed farmlands and houses by mudslides, (E) is showing the buried roads, damaged houses and destroyed farmlands by coseismic landslides, (F) is showing the buried roads and damaged houses by coseismic landslides).
Remotesensing 15 05035 g003
Figure 4. Schematic diagram of the process of calculating the excess topography (image modified from Blöthe et al. [15]). ((A) is original topography, (B) is threshold slope surface).
Remotesensing 15 05035 g004
Figure 5. Maps showing the distributions of (a) slope and (b) relief in the study area.
Remotesensing 15 05035 g005
Figure 6. Map showing excess topography of the study area (0 m indicates that there was no excess topography, A–A’ is the profile discussed in Section 6.2, 0–10 is defined as 0 < value ≤ 10, and the definitions of other regions are the same).
Remotesensing 15 05035 g006
Figure 7. Plot showing proportions of the excess topography in each class in the study area (0 m indicates the areas where there was no excess topography).
Remotesensing 15 05035 g007
Figure 8. Plots showing the impacts of the elevation on the distribution of the seismic landslides in the study area.
Remotesensing 15 05035 g008
Figure 9. Plots showing the impacts of the slope on the distribution of the seismic landslides in the study area.
Remotesensing 15 05035 g009
Figure 10. Plots showing the impacts of the distance from a river on the distribution of the seismic landslides in the study area.
Remotesensing 15 05035 g010
Figure 11. Plots illustrating the quantitative analysis of the excess topography for the seismic landslides in the study area: (a) distribution of landslide quantity, and (b) distribution of landslide area.
Remotesensing 15 05035 g011
Figure 12. Plots showing the impacts of the distance from the epicenter on the distribution of the seismic landslides in the study area.
Remotesensing 15 05035 g012
Figure 13. Map showing (a) PGA and (b) PGV in the study area (https://earthquake.usgs.gov, accessed on 8 October 2023).
Remotesensing 15 05035 g013
Figure 14. Plot showing the incidence ratio of coseismic landslides in different excess topography intervals in the study area (an Ri of 1.0 represents the average level of landslide development probability in this area).
Remotesensing 15 05035 g014
Figure 15. Plot showing the excess topography profile and landslide distribution (section A–A’ is shown in Figure 6). The red line denotes the landslide area incidence ratio, and the green line denotes the mean excess topography.
Remotesensing 15 05035 g015
Table 1. Table showing the average slopes of the seven types of lithologies.
Formation LithologyMean Slope (°)
Hsr5.77
Q3tl15.89
Q2th14.53
Q2sr10.83
N3sn5.87
N2sn5.97
N1sr9.17
Table 2. Table showing the analysis of landslide surface density affected by excess topography and PGA.
Landslide Surface DensityExcess Topography (m)
00–1010–3030–6060–90>90
PGA (%g)0.420000.00020.02620.0013
0.440.02610.04610.02890.02210.00890
0.460.04020.02900.01510.00320.00130
0.480.03200.06670.05980.01180.00210
0.500.03740.05330.05440.01840.00240
0.520.08110.09680.08740.05130.05310.0293
0.540.12600.13260.12640.09830.09310.0776
0.560.05130.07560.10020.08450.08800.0537
0.580.03630.04350.04260.04110.04570.1374
0.600.02660.07720.09430.08820.09510.1537
0.620.01770.07500.14760.19570.11760.0217
0.640.01080.04430.03300.00880.07300
0 indicates the presence of excess topography but no coseismic landslides.
Table 3. Table showing the analysis of landslide surface density affected by excess topography and PGV.
Landslide Surface DensityExcess Topography (m)
00–1010–3030–6060–90>90
PGV (cm/s)20–300.03540.05470.05300.01750.00620.0038
30–400.09030.11350.12080.09450.08960.0646
40–500.03250.06410.06950.06930.06640.0840
50–600.00510.02450.03900.08260.10880
60–700.00060.00050
70–800.00080.00300
0 indicates the presence of excess topography but no coseismic landslides, empty indicates no excess terrain or coseismic landslides.
Disclaimer/Publisher’s Note: The statements, opinions and data contained in all publications are solely those of the individual author(s) and contributor(s) and not of MDPI and/or the editor(s). MDPI and/or the editor(s) disclaim responsibility for any injury to people or property resulting from any ideas, methods, instructions or products referred to in the content.