Abstract
This article aims to present the possibility of using the low-cost iPhone 13 Pro LiDAR scanning device for inspections in the process of mineshaft sinking. The main goal of the research was to assess the accuracy and usefulness of the 3D models generated by the scanner. Measurements were performed at seven different concrete lining intervals before the final lining was completed. The measurements were made at the GG-1 ventilation shaft in Kwielice, Poland, at depths from 1320 to 1350 m below ground level. For better understanding of the true potential of using simple spatial models in the shaft sinking process, part of the shaft sinking cycle, in accordance with PeBeKa working technology, is first presented. Validation using professional TLS demonstrates the usefulness of the iPhone 13 Pro LiDAR scanner for the purpose of inspections that do not require a high level of accuracy. Additionally, a quick and reliable method of volume calculation using open-source software is shown and evaluated.
1. Introduction
The shaft sinking process is a long, complex and extremely expensive feat of mine engineering. It consists of various tasks such as drilling and blasting, mucking of blasted ore, placement of concrete or tube lining, drilling of protection holes, and installation of infrastructure such as drainage, compressed air and ventilation pipes. Most of these tasks require various kinds of inspection and measurement. Inspections are performed with the unaided eye by specialized and certified staff, while measurements are mostly made using mechanical verticals and tape measures. Although such methods are reliable and have been tested over the years, there is still room for improvement. One technology that offers the prospect of such improvement is LiDAR scanning for the measurement of deformations in shaft geometry [1,2]. Photogrammetric measurement during mining shaft inspection is another [3]. Although the law requires certified auditors to carry out daily inspections in person [4], there is no legal impediment to digital augmentation, and laser scanning has already shown its usefulness as it gains in popularity in underground mining [5,6,7].
On the other hand, however precise terrestrial laser scanners may be, they are also expensive, and, in many cases, the advantages of using them are outweighed by their cost. But what if the accuracy required for daily use does not need to be that high? It may be that less accurate but considerably cheaper equipment such as the iPhone 12 Pro, iPad Pro or more recent models are suitable for this purpose. Pro iPhones and iPads are equipped with LiDAR (light detection and ranging) technology and have been successfully employed in rail transportation [8], forestry [9,10] and forensics [11]. As far as the mining industry is concerned, however, the iPhone 12 Pro has not been tested other than in the geosciences [12]. Moreover, smartphone photogrammetry was successfully implemented in geology [13] and coastal morphodynamics [14].
In this paper, therefore, application of iPhone 13 Pro LiDAR scanning will be investigated as a means of improving measurements and inspections during the shaft sinking process. To help the reader better understand the potential gains in this approach, we begin by presenting the method of shaft sinking developed by PeBeKa, the shaft sinking contractor for the KGHM group.
2. Materials and Methods
2.1. Shaft Sinking Methods
Nowadays, shafts sunk in hard rock mines are mostly limited to two types: the standard three-compartment timber shaft and the circular concrete shaft [15]. The most common shape for deep shafts is circular, and, depending on the character of the rock mass, various types of lining can be used. For hard and dry rock mass, concrete lining is most common; in extremely stable conditions, rock bolts alone may be sufficient. In the case of highly watered rock mass, special methods such as caisson and freezing must be used to prevent water from penetrating the inside of the shaft, and cast iron tubing is generally used. When it comes to rock breaking, methods vary from mechanical breaking to drilling and blasting, the choice depending largely on geology and the general cost of the investment. Some contractors such as PeBeKa use both methods: mechanical breaking for softer rock mass, drilling and blasting for harder. Shaft sinking is, as stated above, a complex process, and many detailed publications can be found in this area [16,17,18,19]. For the purposes of this paper, the main focus will be the GG-1 ventilation shaft in Kwielice, Poland, built by general contractor PeBeKa for KGHM Polish Copper.
2.2. Shaft Sinking Technology of the GG-1 Ventilation Shaft above 1226.90 m
The upper part of the KGHM Polish Copper GG-1 ventilation shaft is more than 1000 m in depth, and its development necessitated the use of more than fifty different technologies by the general contractor, PeBeKa. Freezing methods were employed due to the thick Cenozoic aquiferous layer in the in Fore-Sudetic Monocline. Along the freezing zone, tube lining was used as the best water sealant, although below a certain level, tube lining was replaced with concrete. Both the tube and concrete linings are circular, with a diameter of 7.5 m. Rock breaking technology varied according to need: initially mechanical, i.e., using a VSM (vertical shaft machine), but below a certain point, the rock mass was too hard for mechanical equipment; therefore, drilling and blasting started. Unplanned situations aside, the drilling interval mostly varied from 1 m to 4.5 m. Approximately, the last 200 m of the freezing zone was sunk with the drilling and blasting method using tube lining. Below that point, for over 300 m, the drilling and blasting method continued at fixed intervals of 4.5 m, but, due to a highly watered dolomite layer, the lining had to be redesigned, and a second tubing column was added to prevent water from breaking in. Following this, at the rock salt interval, drilling and blasting continued but with an extended diameter of 12 m. A total of 400 blastholes were used in a single blast. Once the entire rock salt interval had been sunk, a double tubing ring was built, with an outer ring diameter of 9.3 m, an inner ring diameter of standard 7.5 m, and fibro-concrete both between the rings and outside the outer ring. Below the rock salt interval, the method did not differ much from standard drilling and blasting with concrete lining as described below. A depth of 1226.90 m was chosen as a point of interest and so it was at the point in the shaft that measurements with the iPhone 13 Pro were carried out.
2.3. Shaft Sinking Technology below 1226.90 m
Below 1226.9 m, the technology of drilling and blasting method at fixed intervals with concrete lining was used.
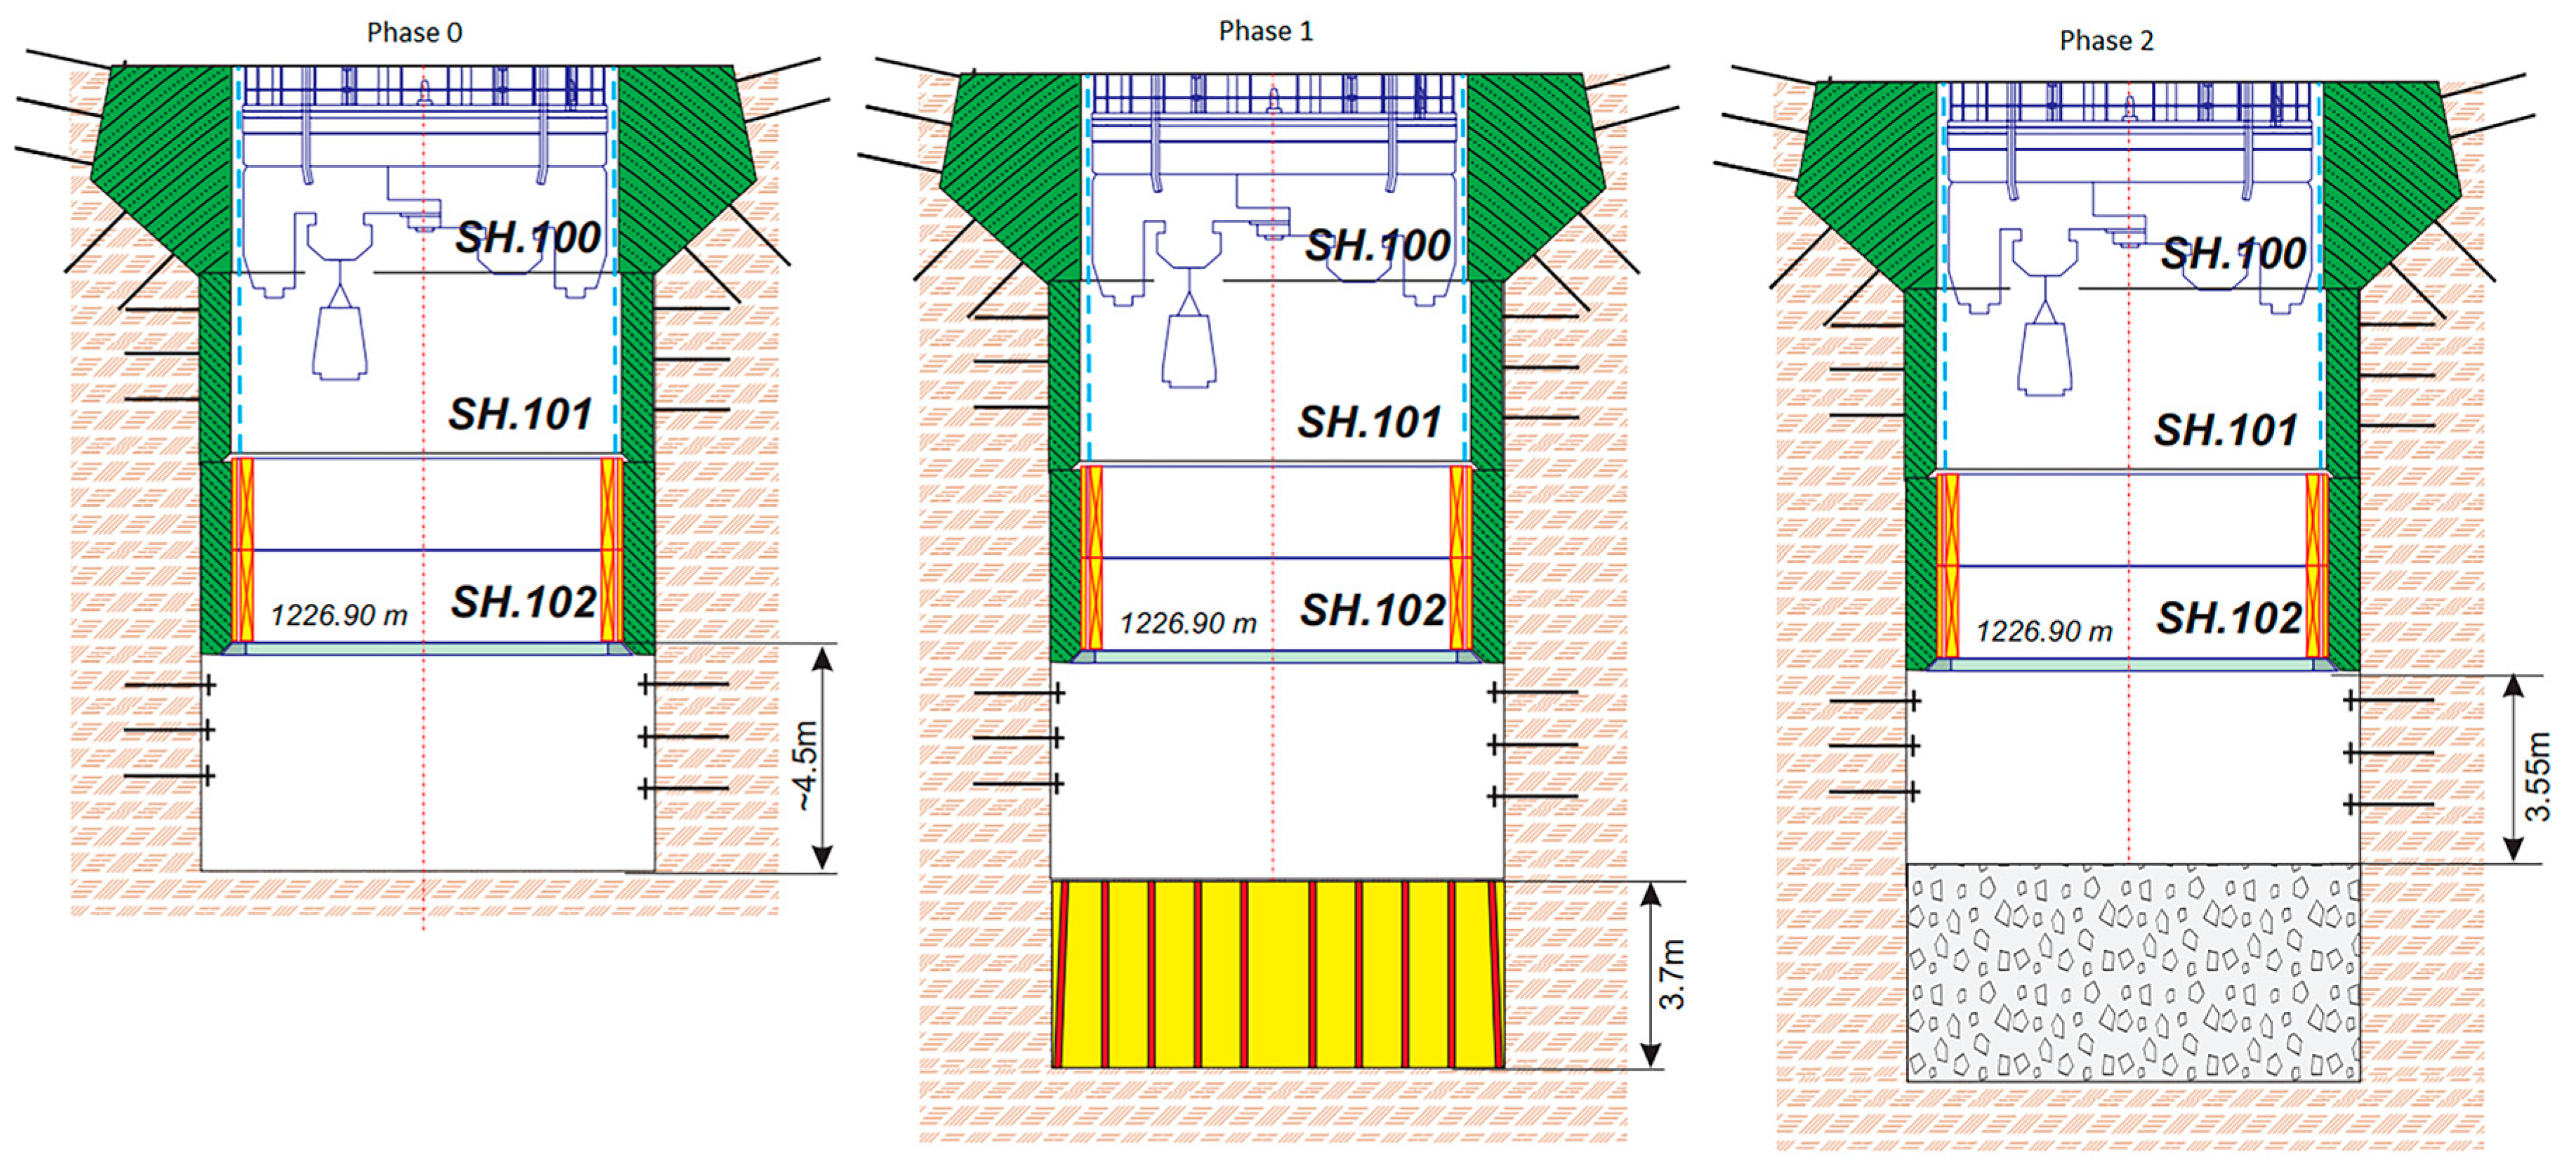
As shown in Figure 1, each cycle in the process began 4.50 m below the previous concrete lining. Phase 1 was the drilling of blastholes, which, according to Polish law, must be arranged in concentric circles. Manual pneumatic drills were used for this purpose—a seemingly slightly outdated solution—but it proved most practical for the breaking of hard rock. In such a case, the quality of drilling, of course, requires highly skilled miners, and, even then, the blasted rock volume may differ significantly from the projected value. After shooting, the blasted ore was mucked to a level of 3.55 m from the last concrete lining. Mining face measurements were then performed, the foreman using mechanical vertical measures to gauge the distance from concrete lining to mining face at 32 points (at 4 levels in 8 directions). Having measured those values, the required volume of concrete for the next lining could then be estimated.
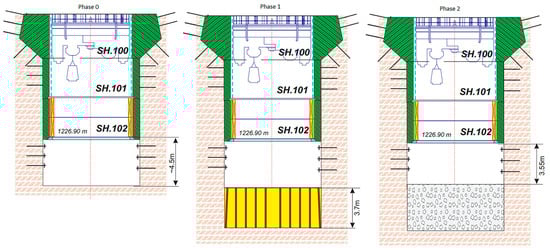
Figure 1.
Phases 0 to 2 of shaft sinking technology below 1226.9 m.
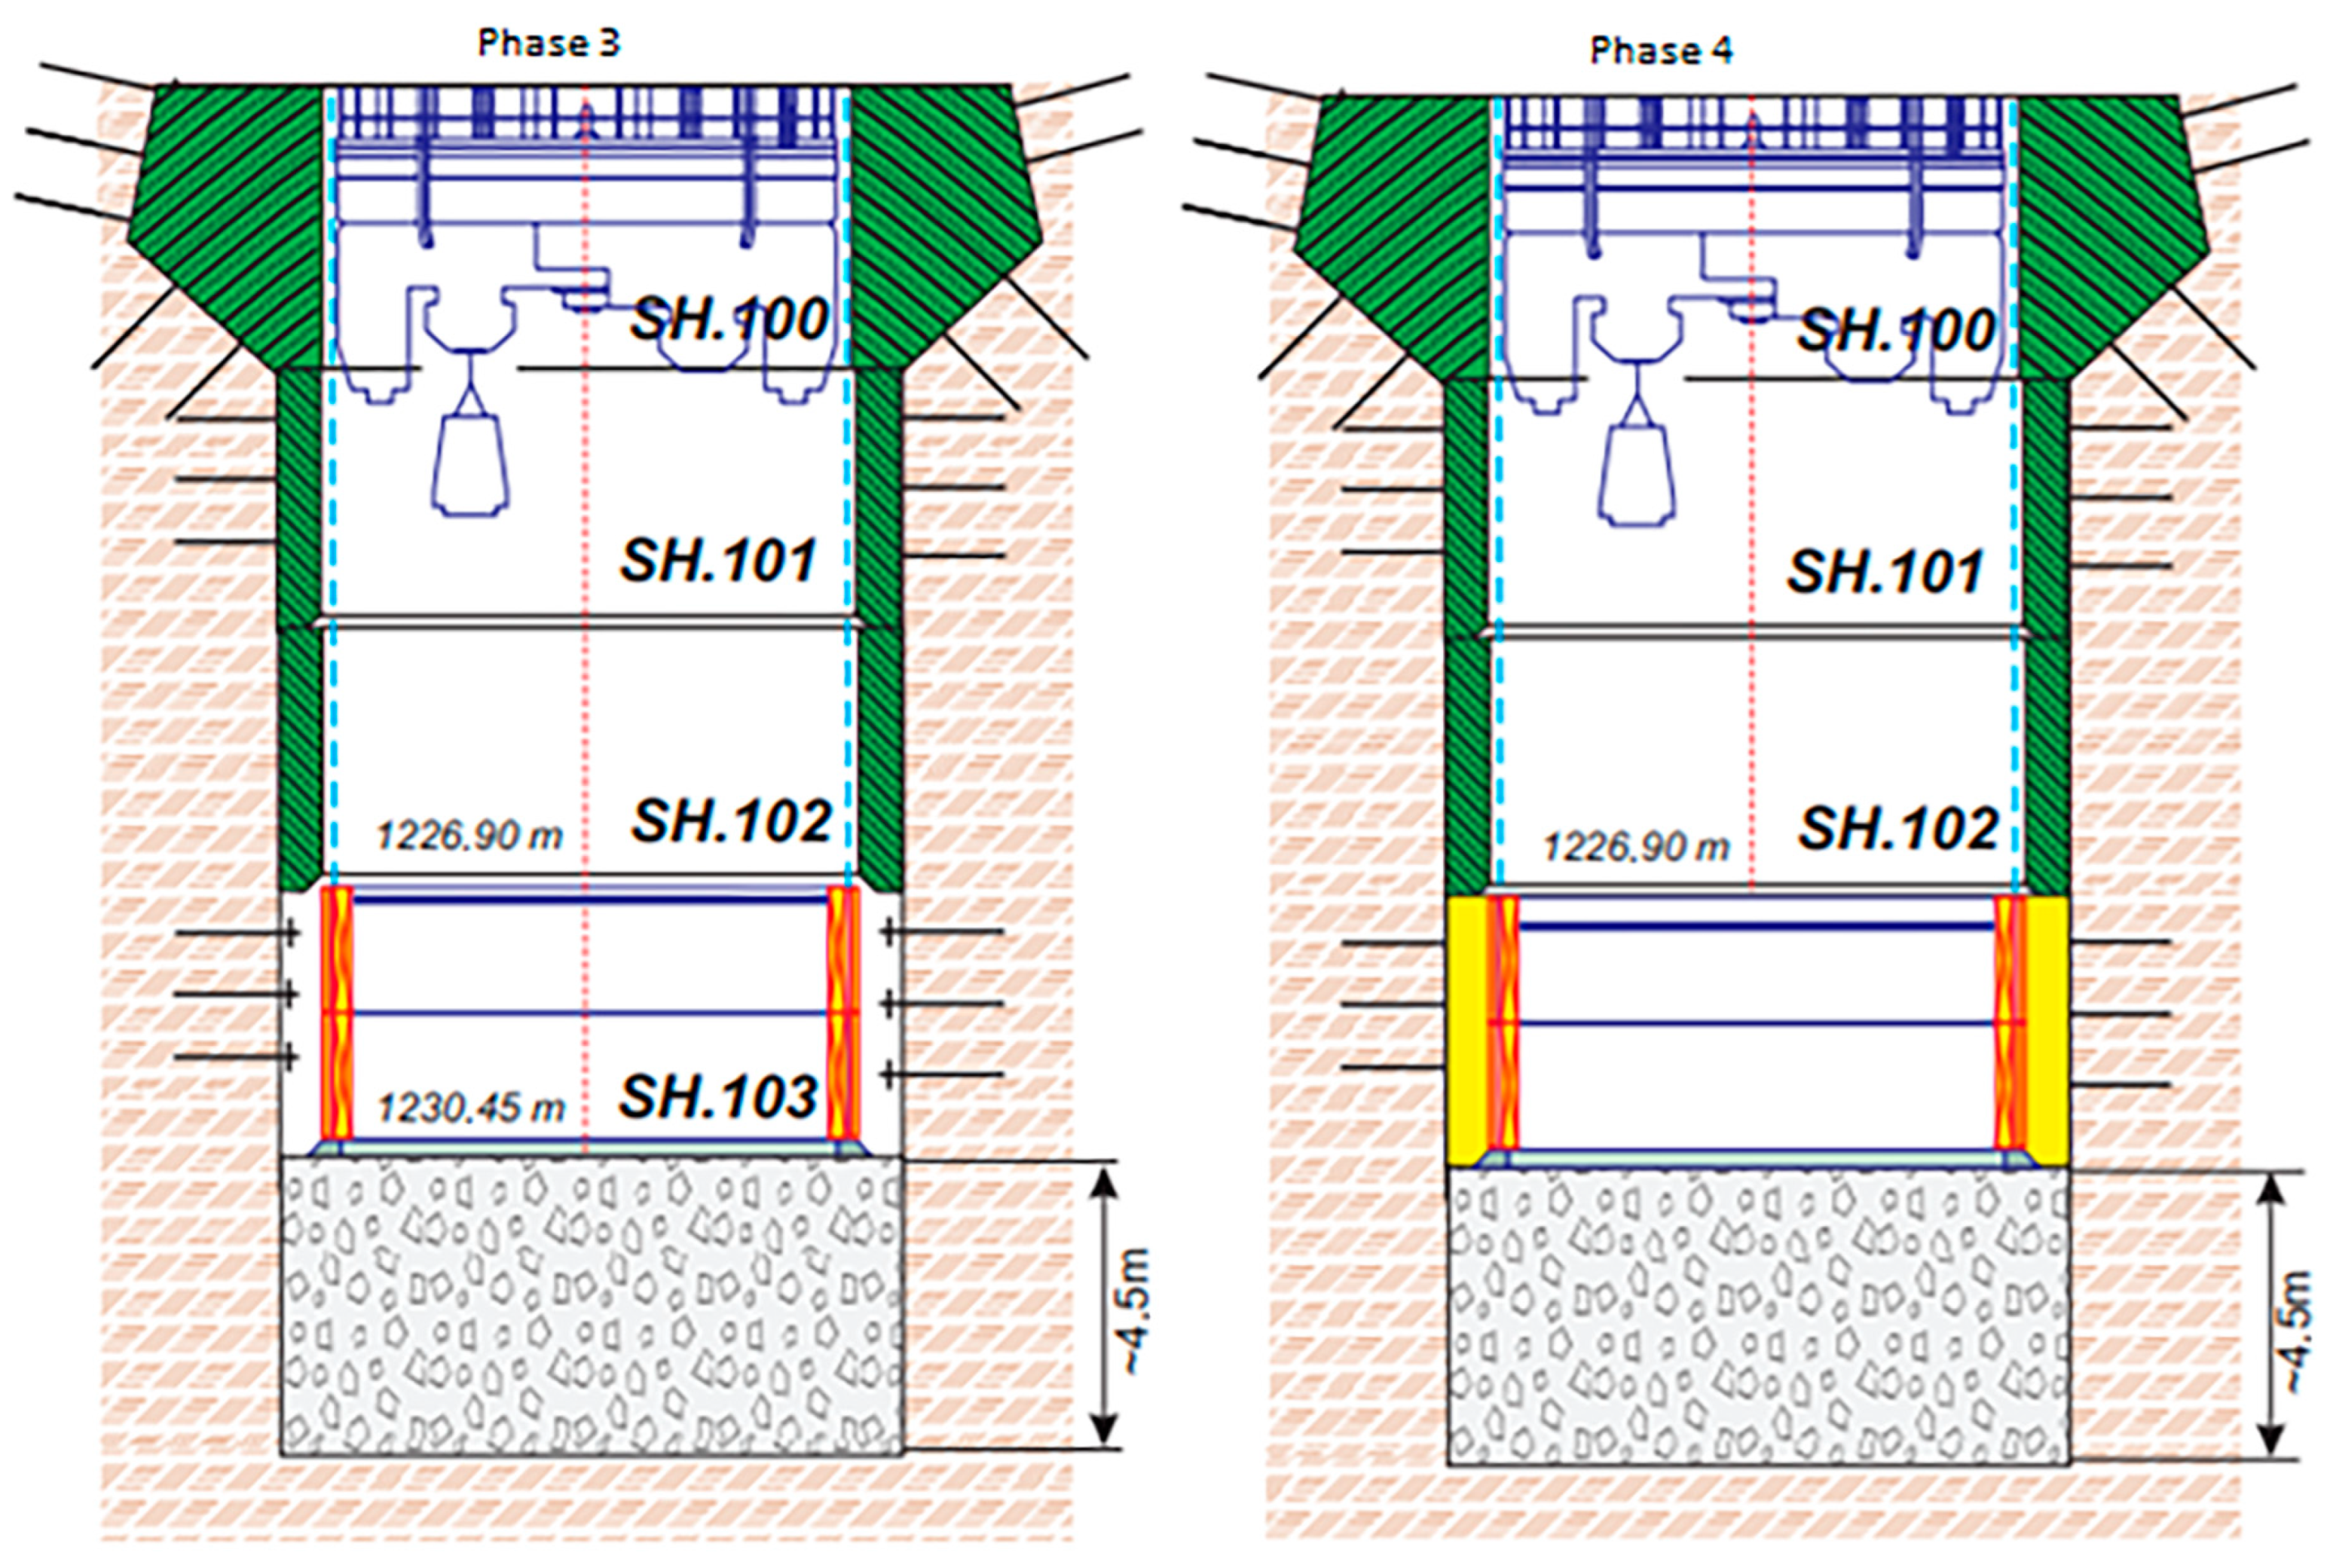
In phase 3, shown in Figure 2, a hydraulic framework slides down onto a previously prepared, evenly blasted rock and wooden support. After measurement of centring and levelling shafts, the bottom is ready for the next injection of concrete in phase 4.
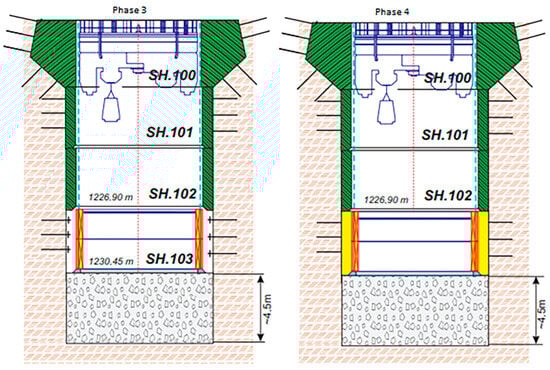
Figure 2.
Phases 3 to 4 of shaft sinking technology below 1226.9 m.
It should be noted that the above description has been generalized as much as possible in order to highlight the main points of the sinking cycle. Many details have been omitted as they are irrelevant to the concerns of this paper.
2.4. Currently Used Methods for Supervision and Measurement
The main method of working inspection is constant supervision by the foreman on each work shift. Due to restrictions on the amount of time that workers can spend underground, handover of shifts from one foreman to the next usually happens verbally at the outset or in the office, rarely underground—a situation that can lead to misunderstandings and, therefore, to mistakes and wasting of time.
Simple measurements, for example, of breakout controls or required concrete volumes, are conducted by foremen and workers using mechanical verticals and measuring tapes. Typically, measurements of required concrete volumes are carried out at 3 points and in 8 directions, making a total of 32 measurement points. The highest point should be located 1 m below the previous concrete lining, the middle point 2 m below, and the lowest point 3 m below. This type of measurement is highly dependent on the skills of the worker performing it. The resulting data are averaged, resulting in the radius of a cylinder for which the volume is then estimated. This method, basic as it is, has worked well in recent years, but the authors believe that it can be improved with the use of the low-cost LiDAR scanner featured in the iPhone 13 Pro.
2.5. iPhone 13 Pro Lidar Scanning Device Surficial Measurements and Supervision
The scanning process with the iPhone 13 Pro and PolyCam application version 3.1.10 is intuitive and generally simple. Before underground trials, the iPhone 13 Pro LiDAR scanner (Apple Inc., Cupertino, CA, USA) was tested on the surface. A steel cube with dimensions 1 × 1 × 1 m was scanned for geometric error check. The scan was performed a distance from the object varying from 0.5 m to 1 m. Measured dimensions differed no more than 2 cm from real dimensions. The scanned cube was finely registered with a primitive cube (with real dimensions). The error of that registration was 0.012 m and was computed on 5000 points. The results of this scan and comparison to the primitive cube are presented in Figure 3 and Chart 1 below. However, it is worth acknowledging that a steel cube is a far simpler and smaller object compared to the mining rock face or sidewall. Nevertheless, surficial tests were promising enough to step into underground tests. Deeper analysis of the iPhone 13 Pro LiDAR scanner evaluation can be found in an article by Janina Zaczek-Peplińska [20].
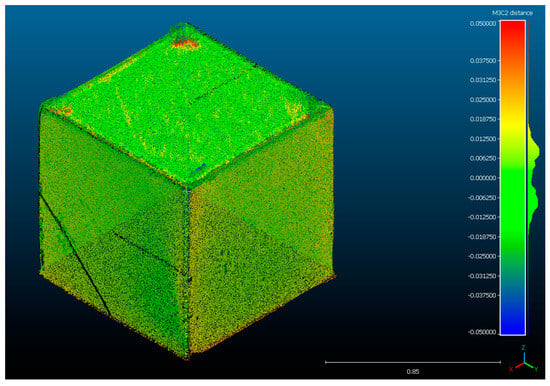
Figure 3.
Steel cube scanned with iPhone 13 Pro and aligned with primitive cube.
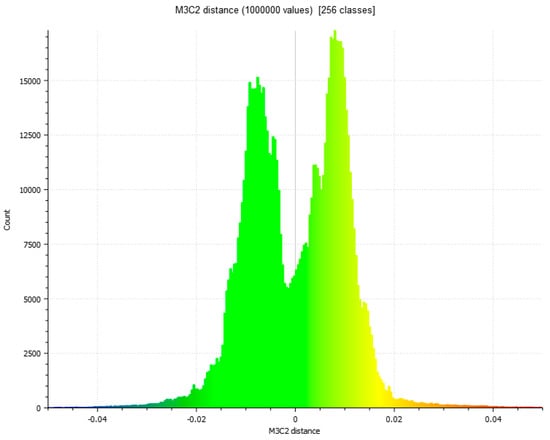
Chart 1.
Differences in distance (in meters) between primitive cube and scanned steel cube.
2.6. iPhone 13 Pro Lidar Scanning Device Underground Measurements and Supervision
Underground measurements were performed a distance between 0.5 and 2 m from the rock face. The surveyor moved from the starting point along the sidewall in a full circle and then repeated the scan on the other side. Additional light was needed, so the surveyor used three 1900 lumens battery-powered led lamps placed in the centre of the shaft, shown in Figure 4; considering iPhone’s f/1.5 aperture, this light setting was sufficient for proper matching. No additional georeferencing was used or needed because every scan is a single entity, and, for the purposes of this study, no greater model was created. As for the coordination system, the PolyCam application creates its own local coordination system based on iPhone’s 13 Pro IMU (inertial measurement unit) records. The software manages to generate 2,776,325 points for the described scan, while the points count of other scans is shown in Table 1 below. It can be noted that longer, more accurate scans contain more points compared to quicker scans. Throughout the series of measurements, the authors came to the conclusion that certain factors have to be set during scanning with the iPhone 13 Pro in the mineshaft. Firstly, additional light is required, such as described above; secondly, the surveyor should keep a stable distance from sidewall—the best results were acquired for a distance between 0.5 and 2 m; thirdly, the starting and ending point should be the same, and, eventually, for the matter of results and safety, the best moment for measurements was before concreting due to an even footwall.
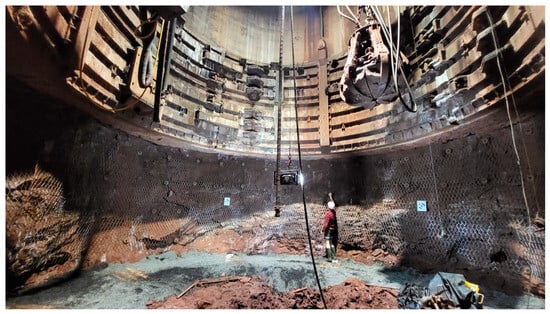
Figure 4.
iPhone 13 pro scanning process with additional lights hanging in the centre of the shaft.

Table 1.
Points in point cloud generated with iPhone 13 Pro during underground trials in various parts of mineshaft sinking cycle.
Due to iPhone durability, there was no need for additional protection from rain, dust, humidity or high temperature. The only smartphone protection used was a case protecting it from uneven terrain. While in copper mining explosion-proof regulations are less strict compared to hard coal mining, a smartphone could be used without compromising safety. In the case of hard coal mining, such equipment should be additionally preserved from causing an explosion.
3. Results
3.1. Use of iPhone 13 Pro LiDAR Scanner on a Daily Basis
Thanks to PolyCam® software (version 3.1.10) and its feature that allows users to store data such as scanned mining faces or current situations in mineshafts, the iPhone 13 Pro LiDAR scanner has the potential to act as a powerful tool in the supervision of ongoing mine workings. A quick scan itself takes no more than five minutes, and, even in the absence of an Internet connection underground, collected data can be uploaded for management to view in less than an hour. In the mining industry, such an improved connection might prevent making poor decisions. A quick scan performed in the GG-1 shaft at the end of a shift is presented in Figure 5 below. Despite the rather low quality (blurred and missing parts irrelevant for this purpose mostly), the scan shows everything that is necessary for a successful shift handover.
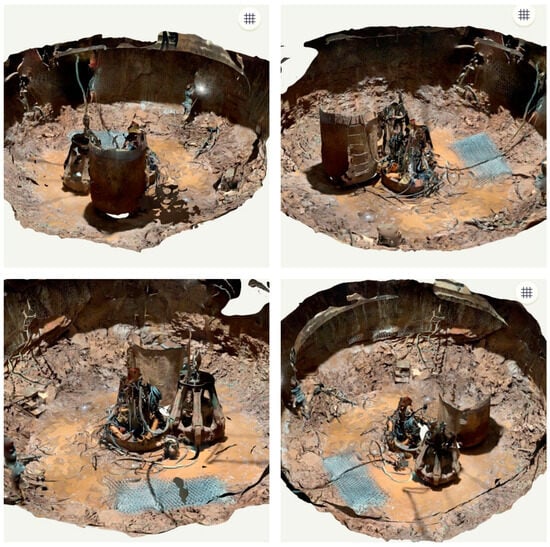
Figure 5.
Four captures of scan at the end of shift.
3.2. Use of iPhone 13 Pro LiDAR Scanner for Bolting Pattern Pre-Inspections and Safety Reasons
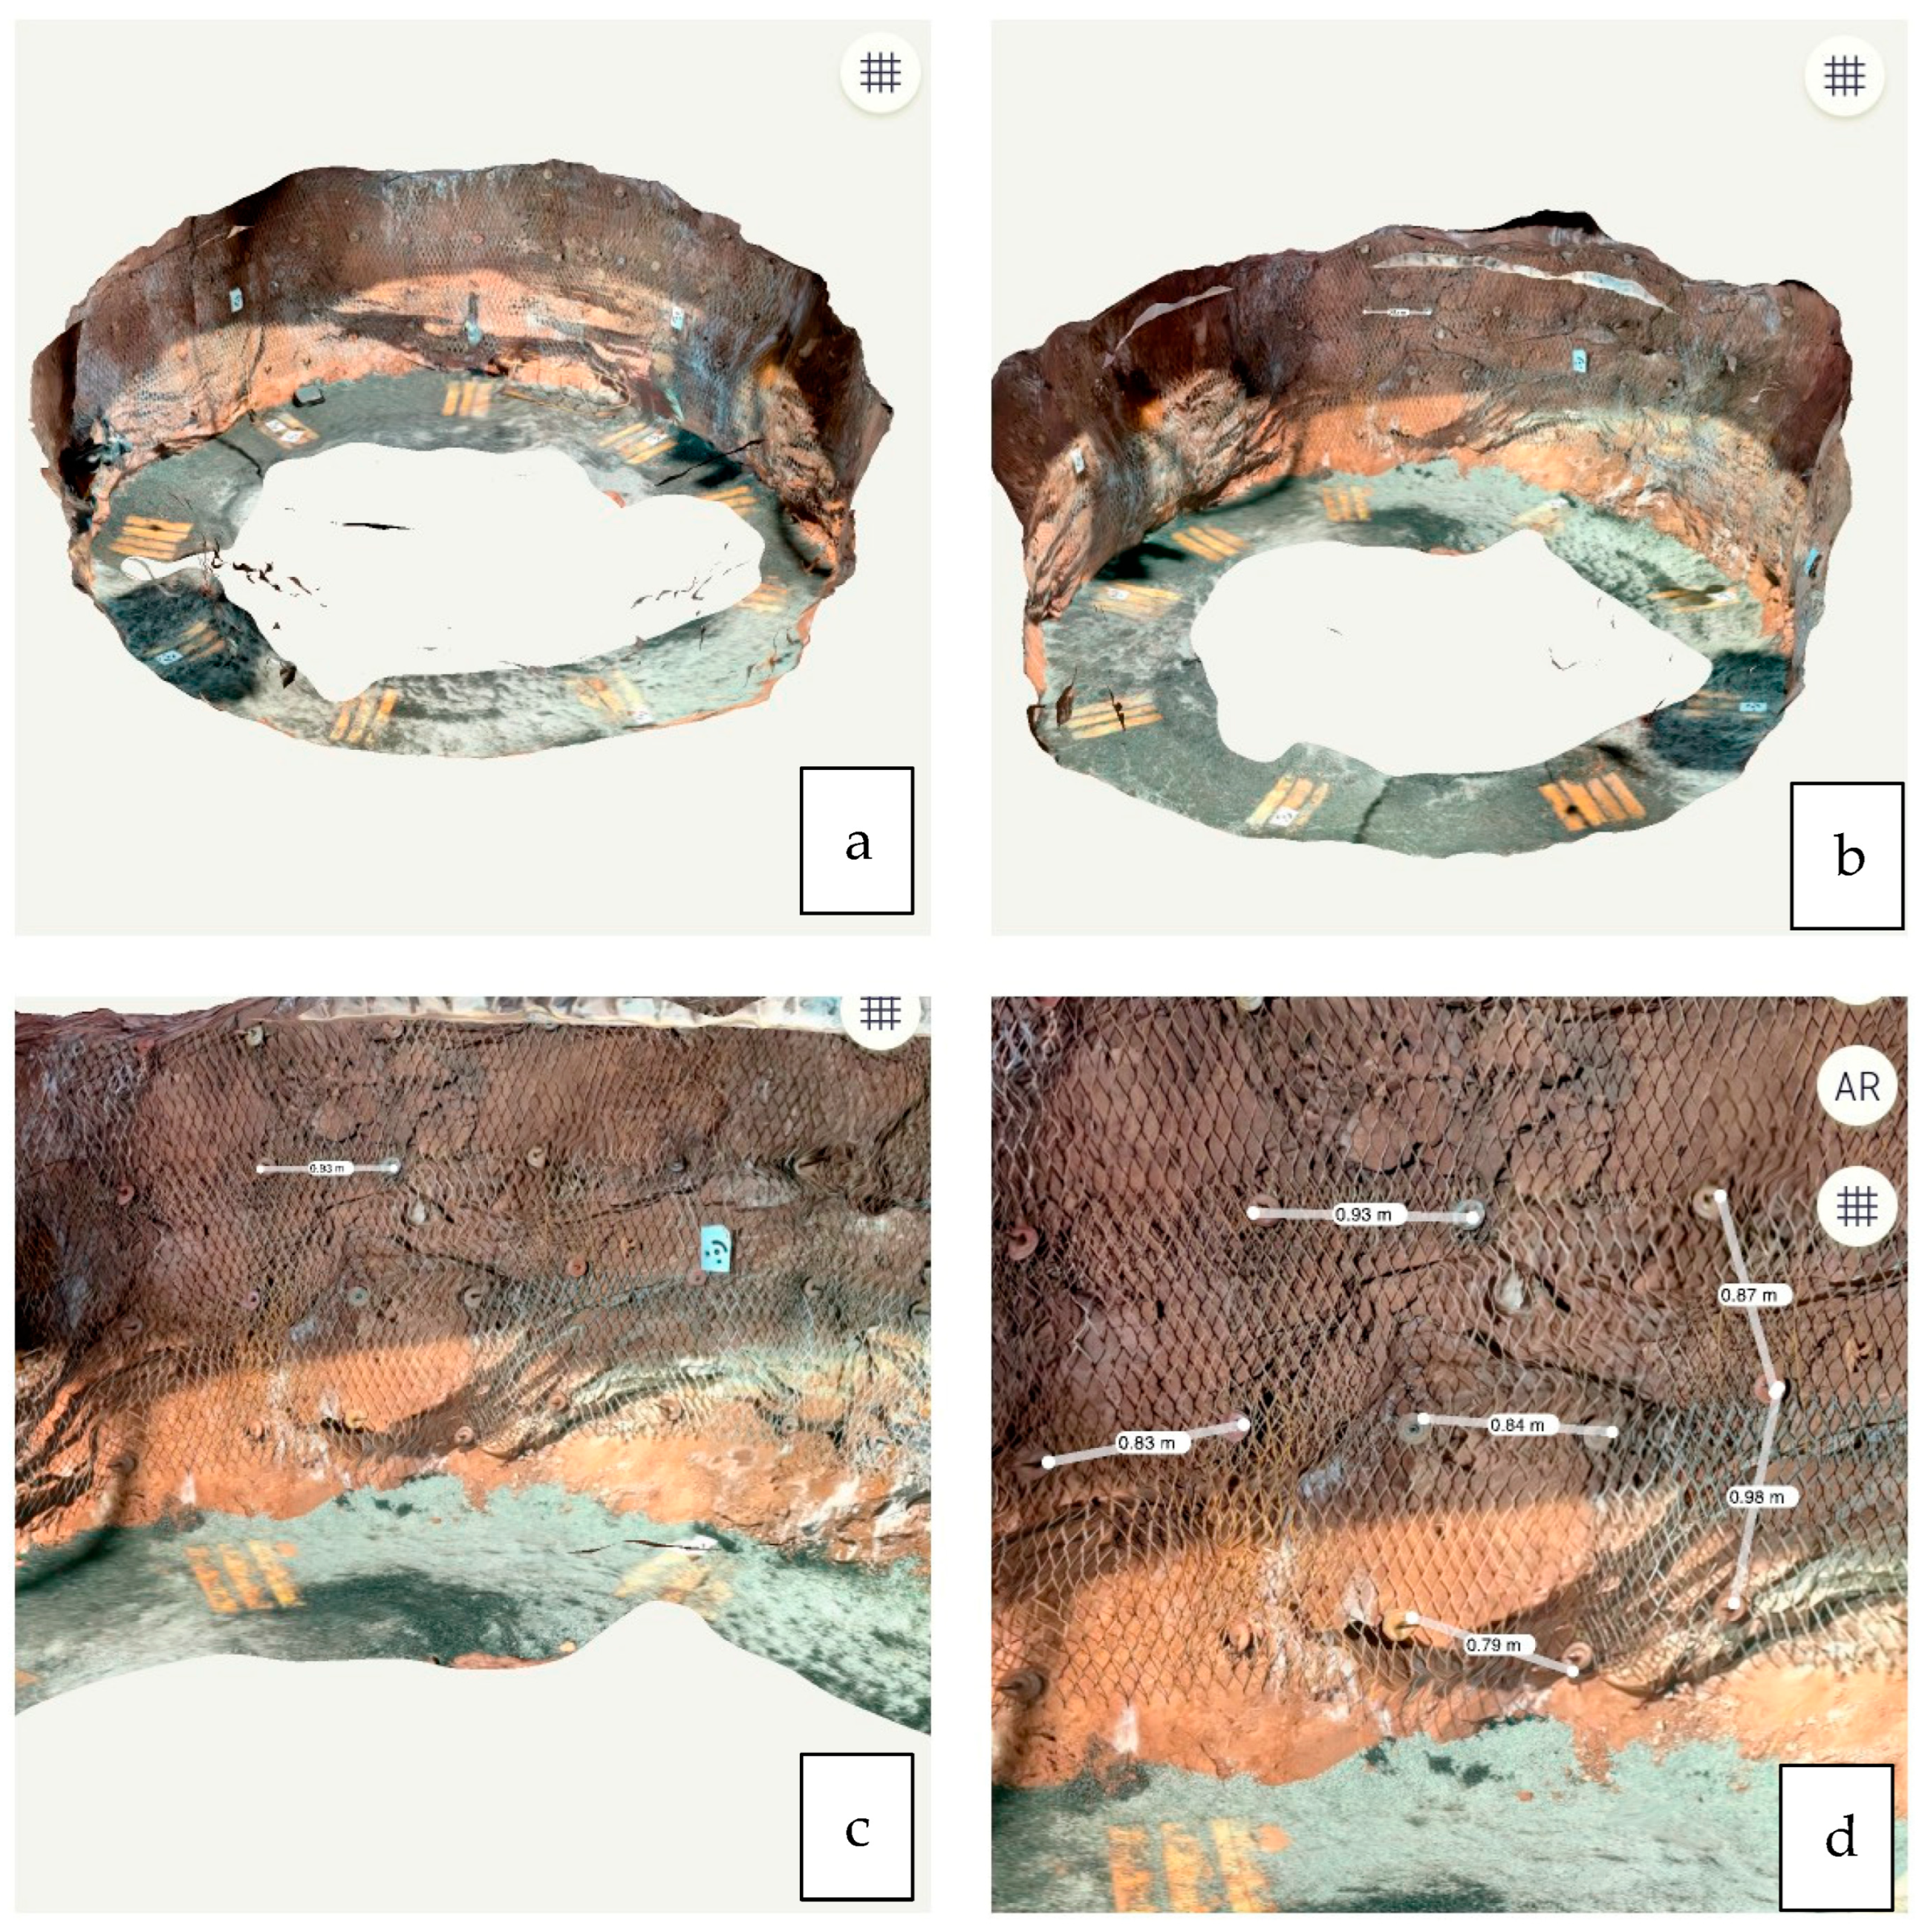
With slightly more time spent on scanning, much better quality can be achieved; this time scan covered the mining face twice (starting and ending point was the same) with the distance varying from 0.5 to 2 m, and with use of another tool offered by PolyCam software, management staff can pre-inspect bolting patterns, as shown in Figure 6. According to the internal rules of KGHM Polish Copper, distances between rock bolts may vary by up to 10% from the initial distances of the planned pattern. As demonstrated in “Evaluation of the Apple iPhone 12 Pro LiDAR for an Application in Geosciences” [12], the iPhone 12 Pro is accurate up to 10 cm for vast objects such as interiors of mining shafts. Such accuracy may not be sufficient for solid inspection but is fine enough for management to assess shift results in general. Even longer scans, where multiple rounds along sidewalls are needed, last no more than 15 min with up to 5 min needed to generate a 3D model in the PolyCam® application. Comparing it to mechanical measurements described above, the time is similar, but collected data are less biased. Considering those above, the authors believe this type of measurement can be successfully implemented for long-term usage. Moreover, in the mineshaft sinking cycle, the sidewall’s rock bolts are a temporary support lasting only between concreting, so their requirements are lower than in horizontal drifts.

Figure 6.
Four captures of higher-quality scan for bolting pattern pre-inspection, (a) front view of scanned shaft sidewall, (b) back view of scanned shaft sidewall, (c) closer look on scanned sidewall, (d) closer look on sidewall with distances between rock bolts measured with PolyCam application.
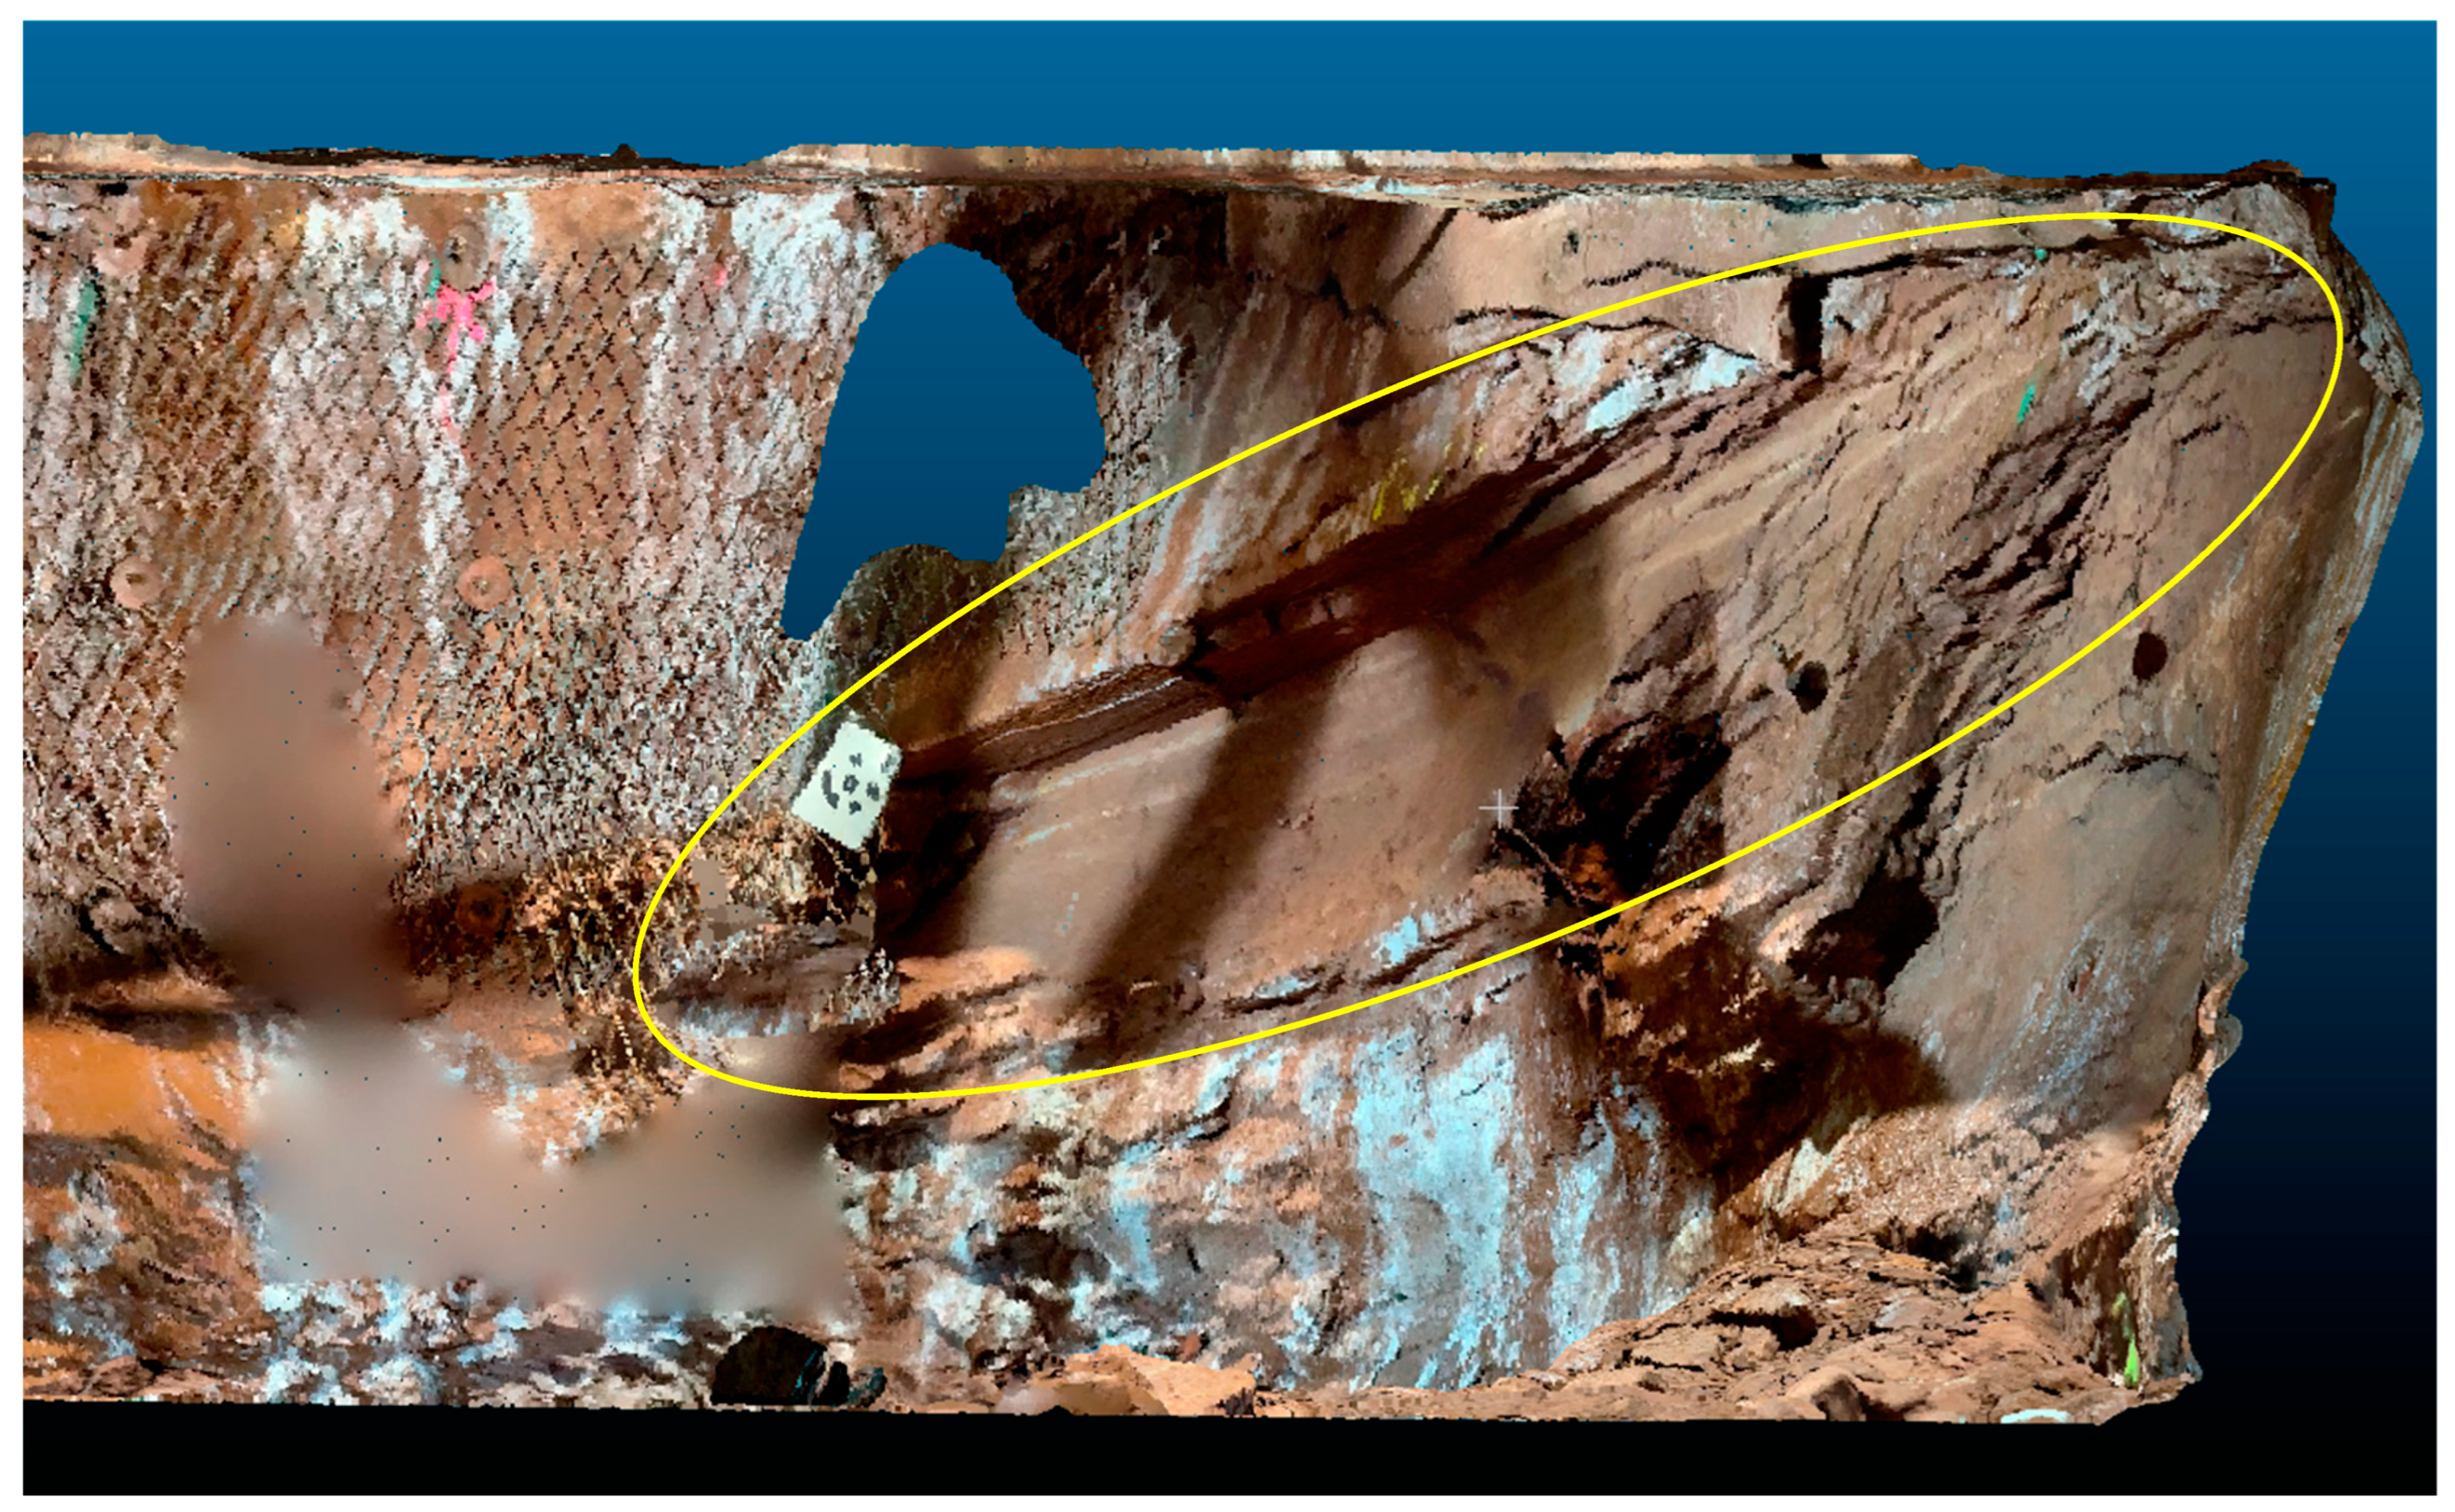
Such quick scans might prove useful for safety reasons. There are countless dangerous situations where a 3D model, which is even less accurate, can improve visualization of loose rocks in the sidewall. Such an example is shown in Figure 7 where the scanned place was about to be covered with a steel net when a boulder collapsed from the sidewall (highlighted by a yellow ellipse in the figure below). This area was treated with extra care and additional rock bolts before another attempt at covering it with the net. Such situational scans, taken quickly without special preparations, can be beneficial for safety in an entire mineshaft sinking process, especially like in this case when the sidewall is a weak sandstone.
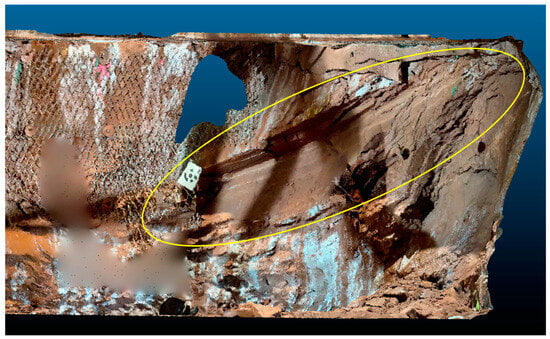
Figure 7.
Example of using iPhone quick scan as safety improvement.
3.3. Use of iPhone 13 Pro LiDAR Scanner for Quick Geometry Control
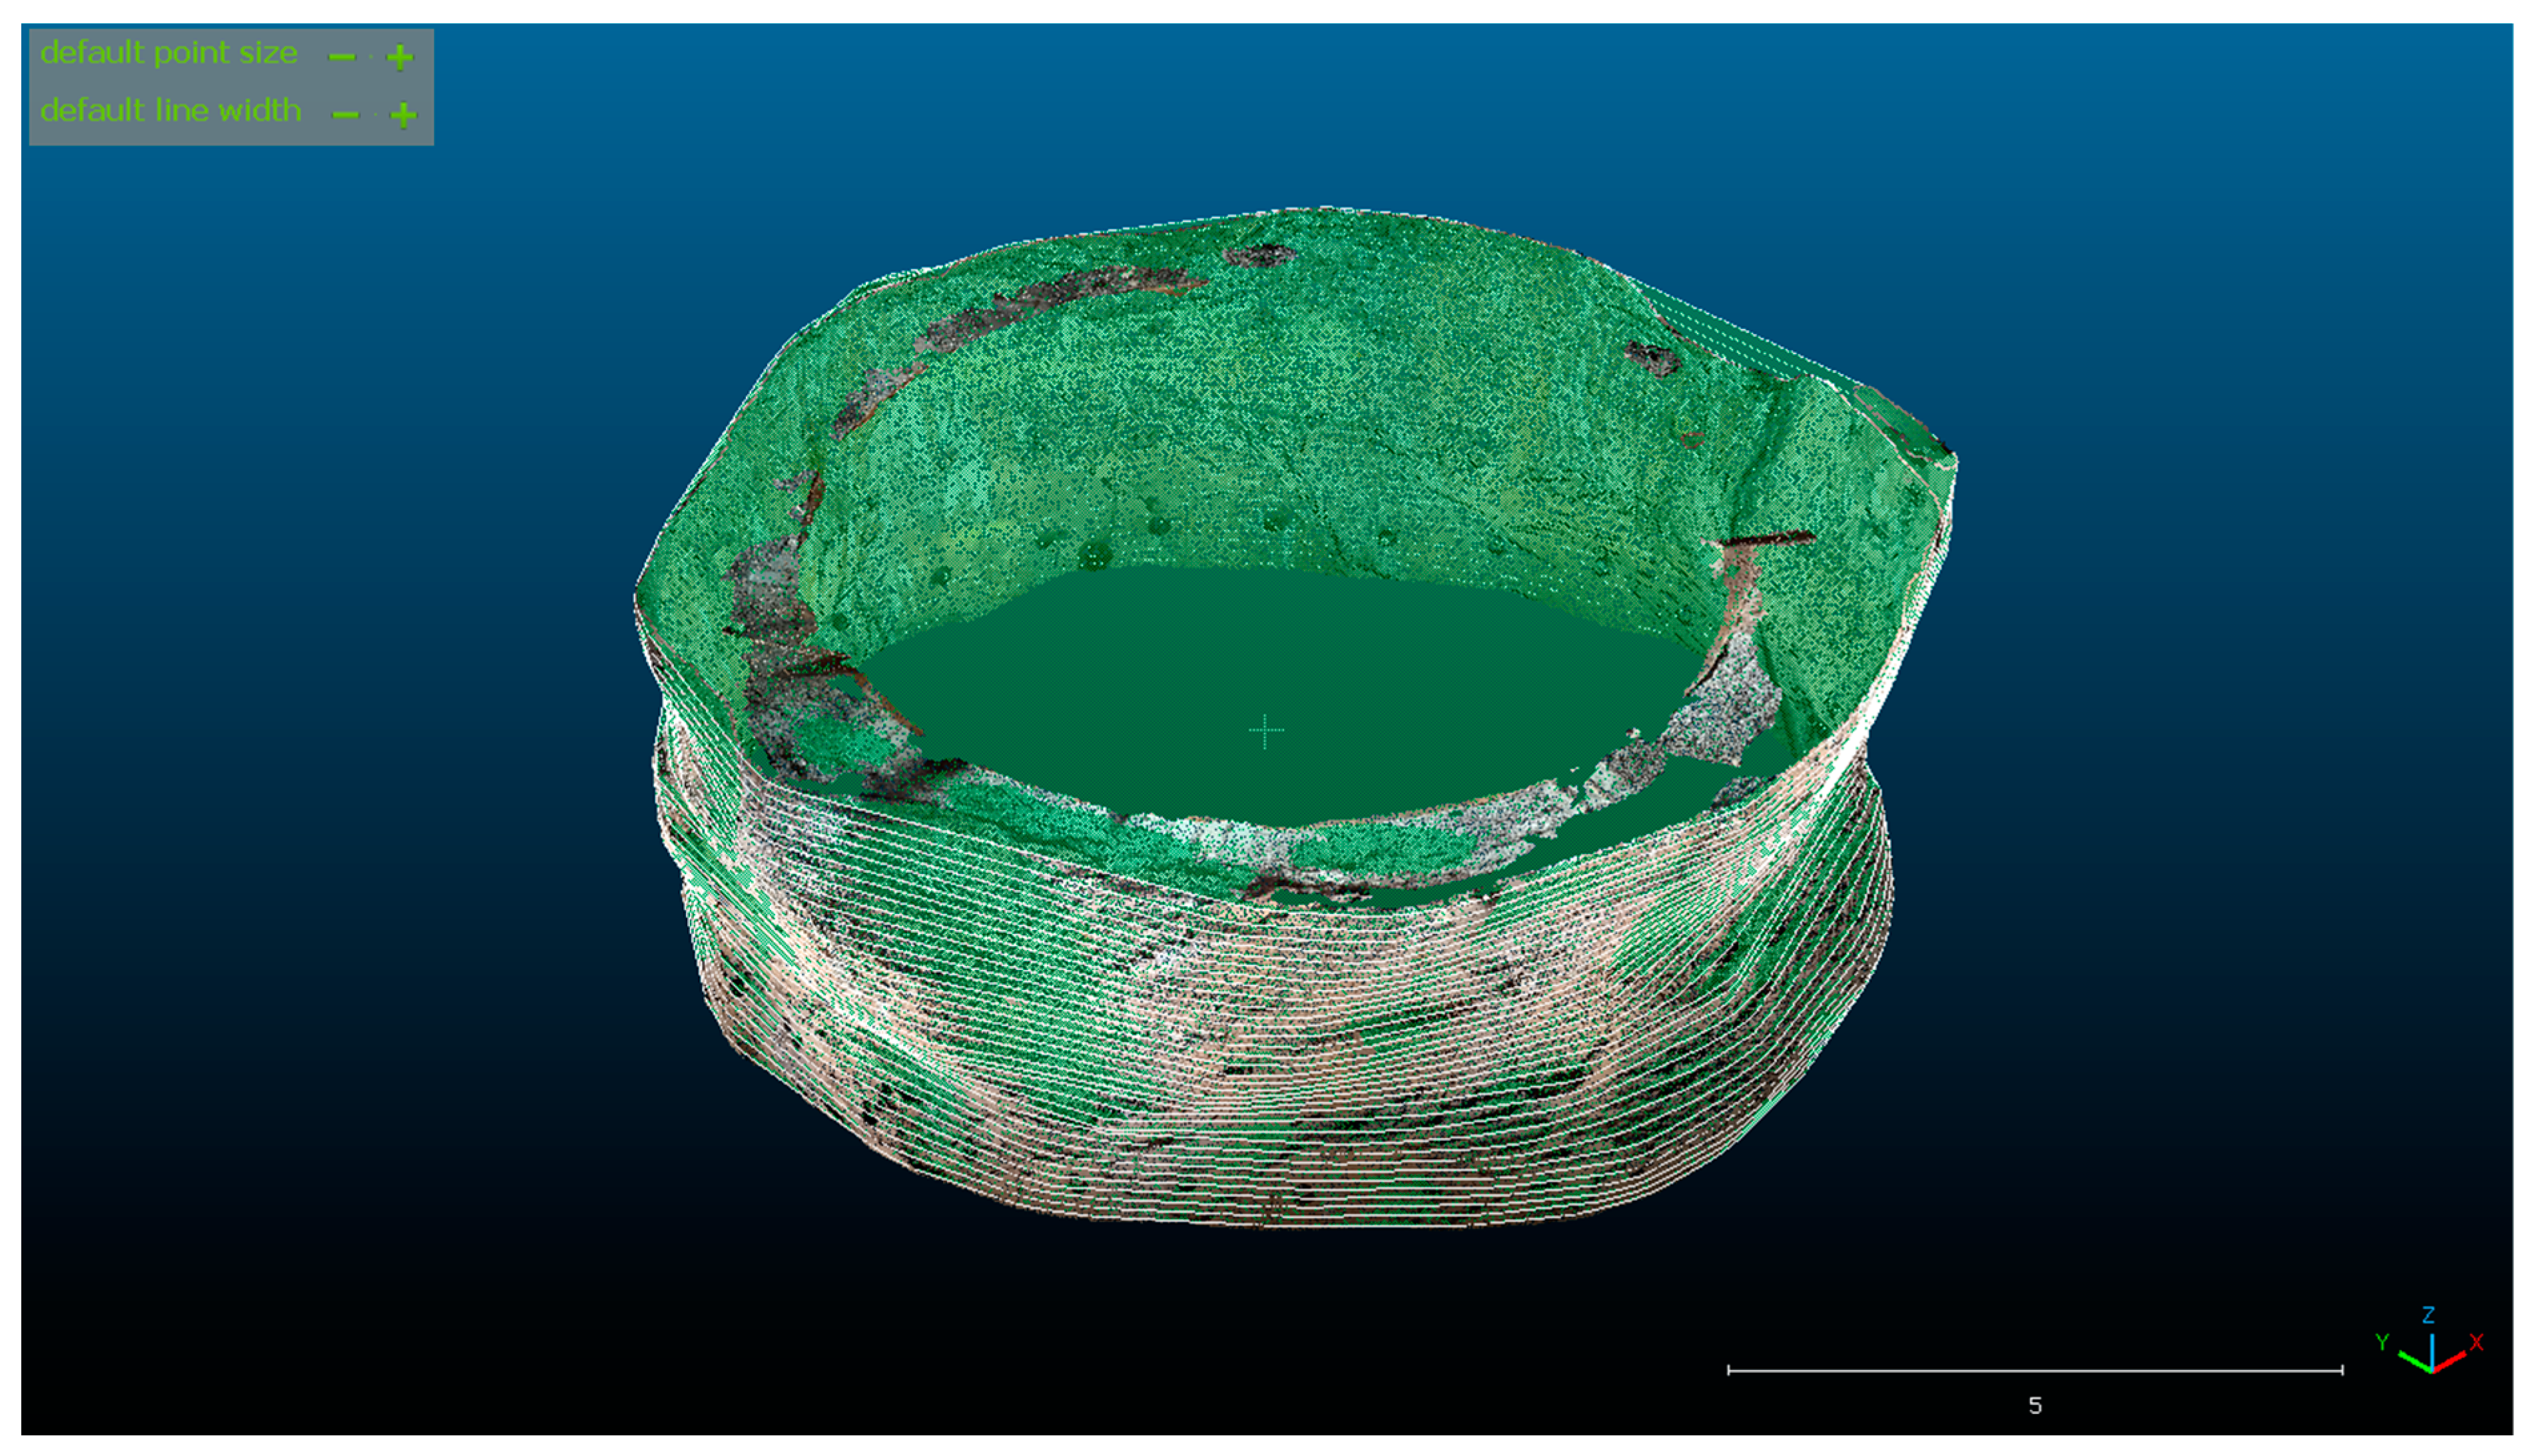
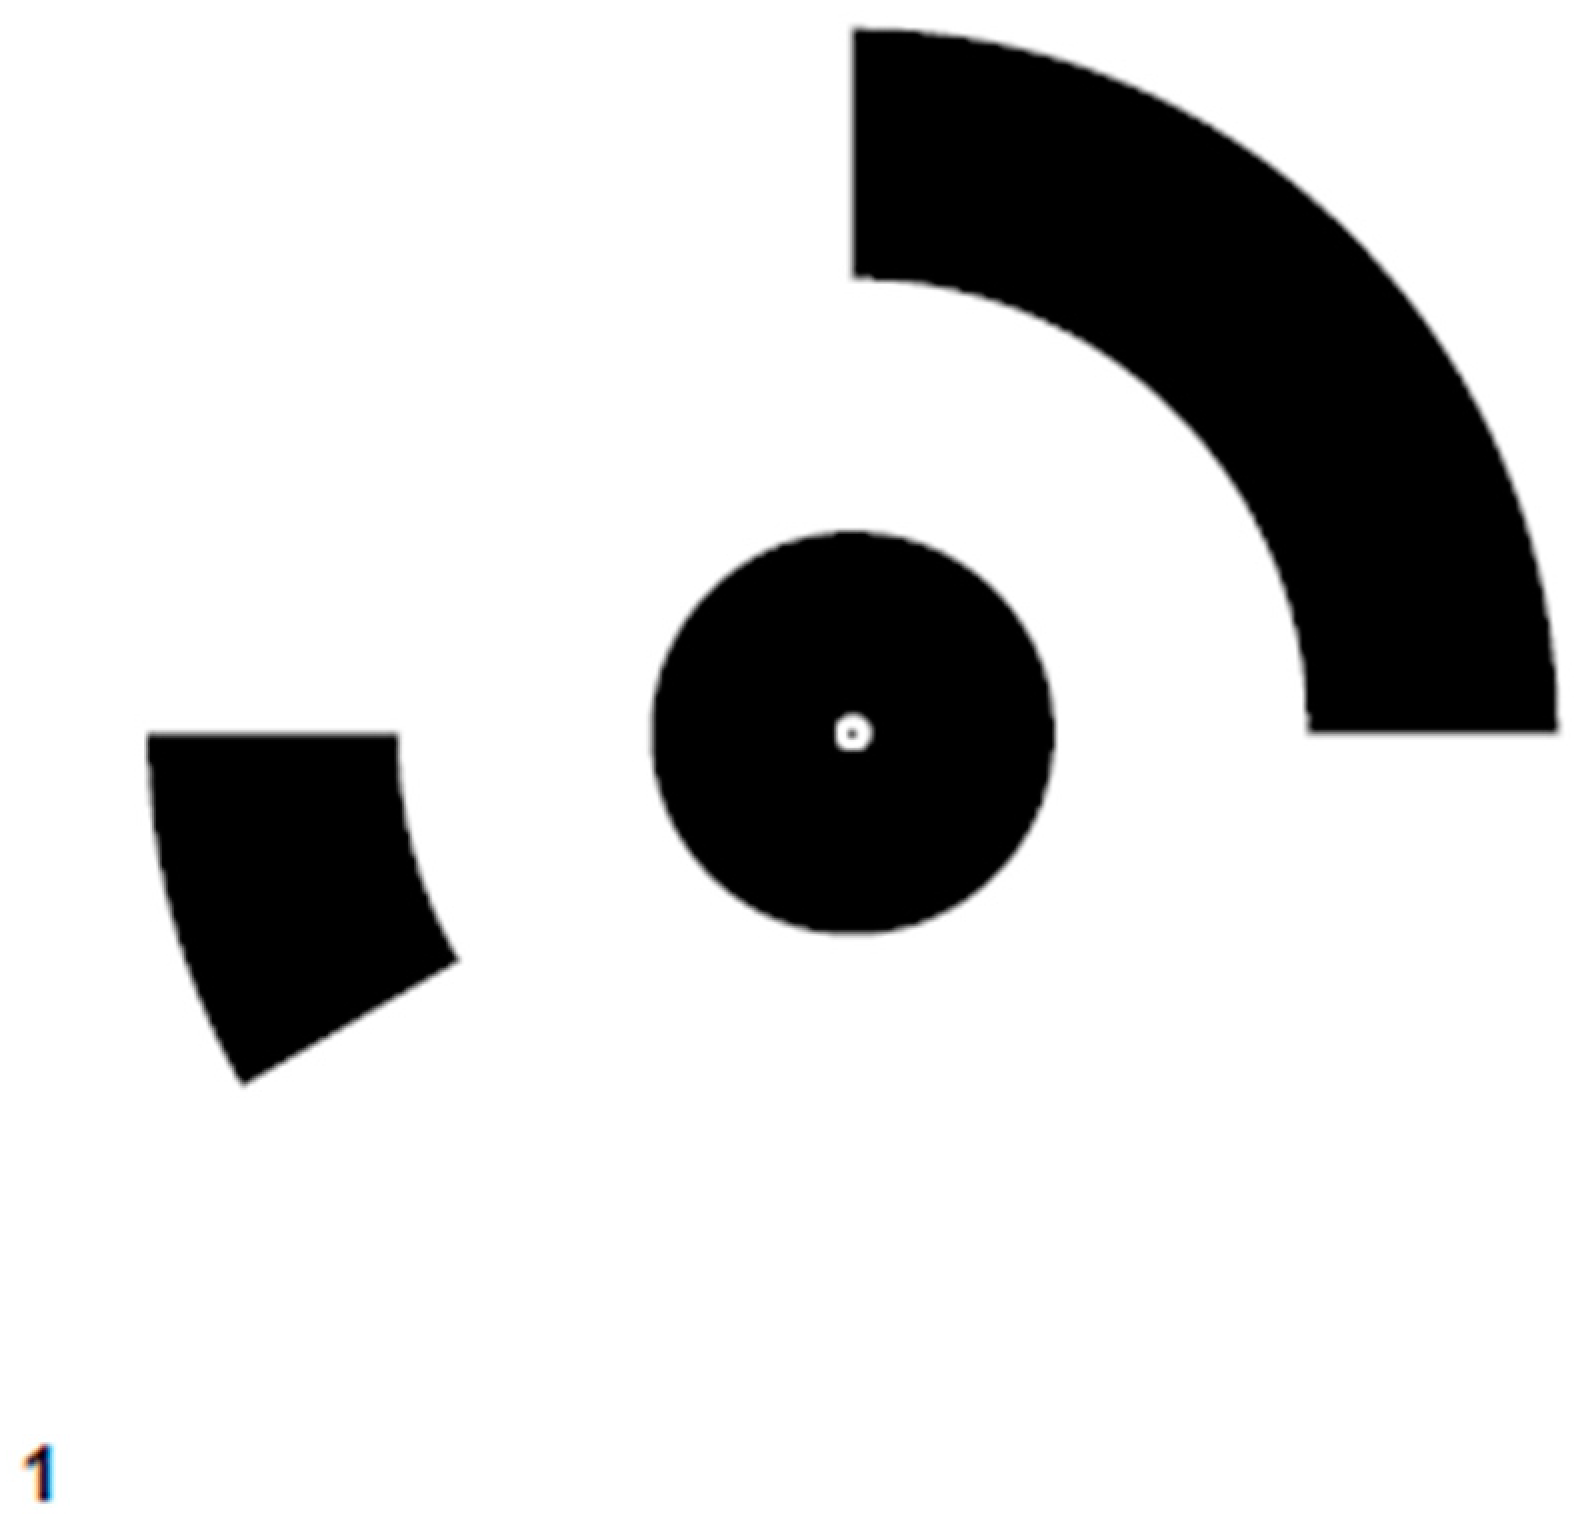
Quick scans and simple geometry analysis can also be used for steel formwork geometry assessment. The scan itself, as mentioned above, is a quick process, while simple geometry analysis can be performed even faster for a few cross sections. Such use is shown below in Figure 8 and Chart 2. The presented data were collected in surficial conditions in the steel formwork presented in Figure 9, but, with no greater effort, this method can be used underground. This technique will not replace mechanical measurements of steel formwork centring with the iPhone’s accuracy, which, as shown below, varies from −15 cm to +15 cm for an object with similar dimensions, but can be used as an alert before poor assembly of another steel formwork ring. Accuracy control for the iPhone 13 Pro scan of exactly the same steel formwork was conducted in a previous article from this series [21].
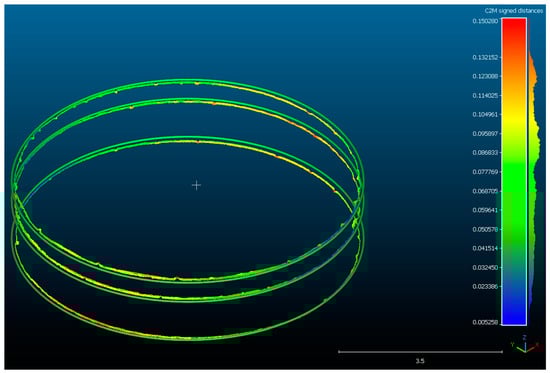
Figure 8.
Three cross sections of steel formwork with distance calculation from primitive torus.

Chart 2.
Differences in distance (in meters) between primitive torus and steel formwork cross section.
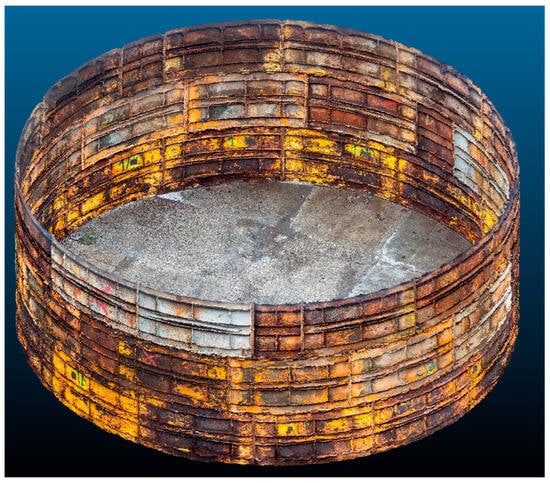
Figure 9.
Steel formwork used by PeBeKa KGHM group for concrete lining in special conditions.
3.4. Use of iPhone 13 Pro LiDAR Scanner of Concrete Volume Calculation
Another measurement that can be improved using quick LiDAR scanning is calculation of concrete volume. The scan itself takes approximately the same amount of time as a traditional mechanical measurement. Moreover, with the use of free software such as CLOUDCOMPARE™ (version 2.12.3), point cloud processing is highly automatable and, with a proper script, can be carried out almost user-free. Step-by-step volume calculation starts with uploading of data to CLOUDCOMPARE™. After purging the point cloud of irrelevant data, the model is divided into strips, for instance, 1 mm thick. The process of division into strips is presented in Figure 10 and Figure 11 below.
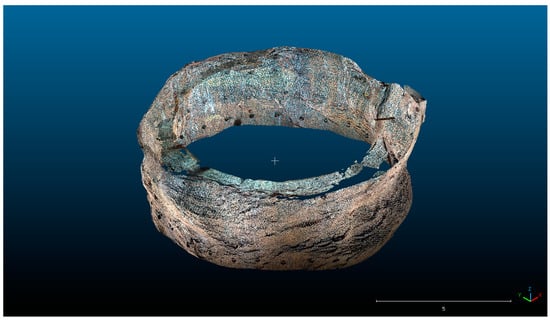
Figure 10.
D point cloud of mining face captured with iPhone 13 Pro LiDAR scanner.
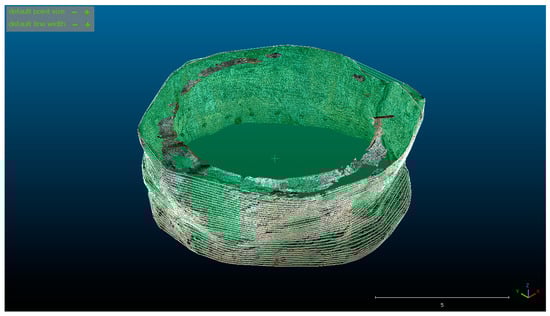
Figure 11.
The same model divided into 1 cm (value chosen for better visualization) strips for clarity of illustration.
As shown above, the clean model was divided into strips with thicknesses from 1 cm to 1 mm. Although it may at first seem excessively fine, division into 1 mm strips was found to result in the most accurate calculation compared with thicker intervals. Differences in volume calculation are presented in Table 2 below.
Table 2.
Differences between calculated volumes in relation to cutting thicknesses.
The real volume of concrete used in this interval of lining was in fact about 108 m3 (it was not possible to measure the amount more precisely as a certain amount of cement waste was poured over the hydraulic framework). In the course of seven different scanning measurements, no concrete volume calculation was found to vary by more than 2 m3 from the actual amount used. Concrete volume calculations in relation to real used values are presented in Table 3 below.
Table 3.
Comparison of real used concrete volumes and those calculated using iPhone 13 Pro LiDAR scanner and CLOUDCOMPARE™.
4. Discussion
4.1. Accuracy Comparison between iPhone 13 Pro and FARO FOCUS 130
For the purpose of validation, the same rock face interval, at the same time, was scanned using both the iPhone 13 Pro LiDAR scanner and FARO FOCUS 130 scanner (FARO technologies, Lake Mary, FL, USA). The FARO scanning process consisted of a single capture in the centre of the shaft, which generated 7,360,129 points in this point cloud. To improve distinguishability, reference points (exemplary reference point is shown in Figure 12 below) were added on the rock face and at the bottom and were registered by both scanners for alignment (by picking four points pairs) and fine registration using the ICP (iterative closest point) algorithm. Differences, both numerical and visual, are presented in the tables and figures below, but fine registration RMS error was calculated for 0.101 m computed on 5000 points, picked by the ICP algorithm. For each reference point, differences in coordinates were calculated, and, moreover, for each point, cloud-to-cloud distances were induced. As shown in Table 4, differences were not found to exceed 15 cm. In Table 4, distances between reference points are calculated, and, again, coordinate differences are found to be less than 15 cm. Although such accuracy is nothing special considering professional TLS, it is sufficient, taking into account the current needs of monitoring the progress of drilling works, the price of the smartphone, and work in unfavourable conditions in an underground mineshaft. In Table 5 difference in distances between reference points are presented.
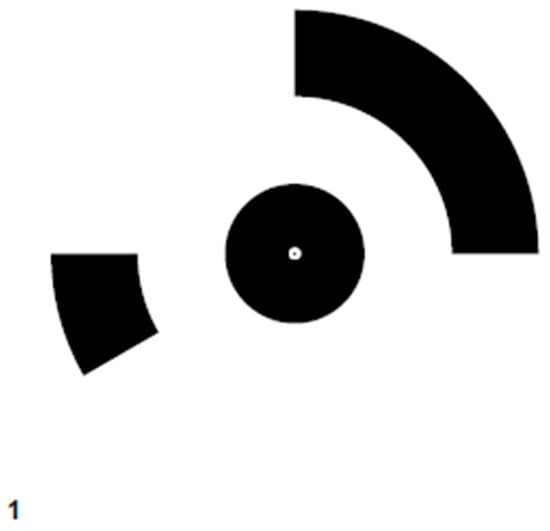
Figure 12.
Visualization of exemplary reference point. The set of such points was used for the alignment of point clouds.
Table 4.
Point coordinate comparison (fine registration accuracy) between iPhone 13 Pro LiDAR scanner and FARO FOCUS 130 scanner.
Table 5.
Distances between points in point cloud comparison.
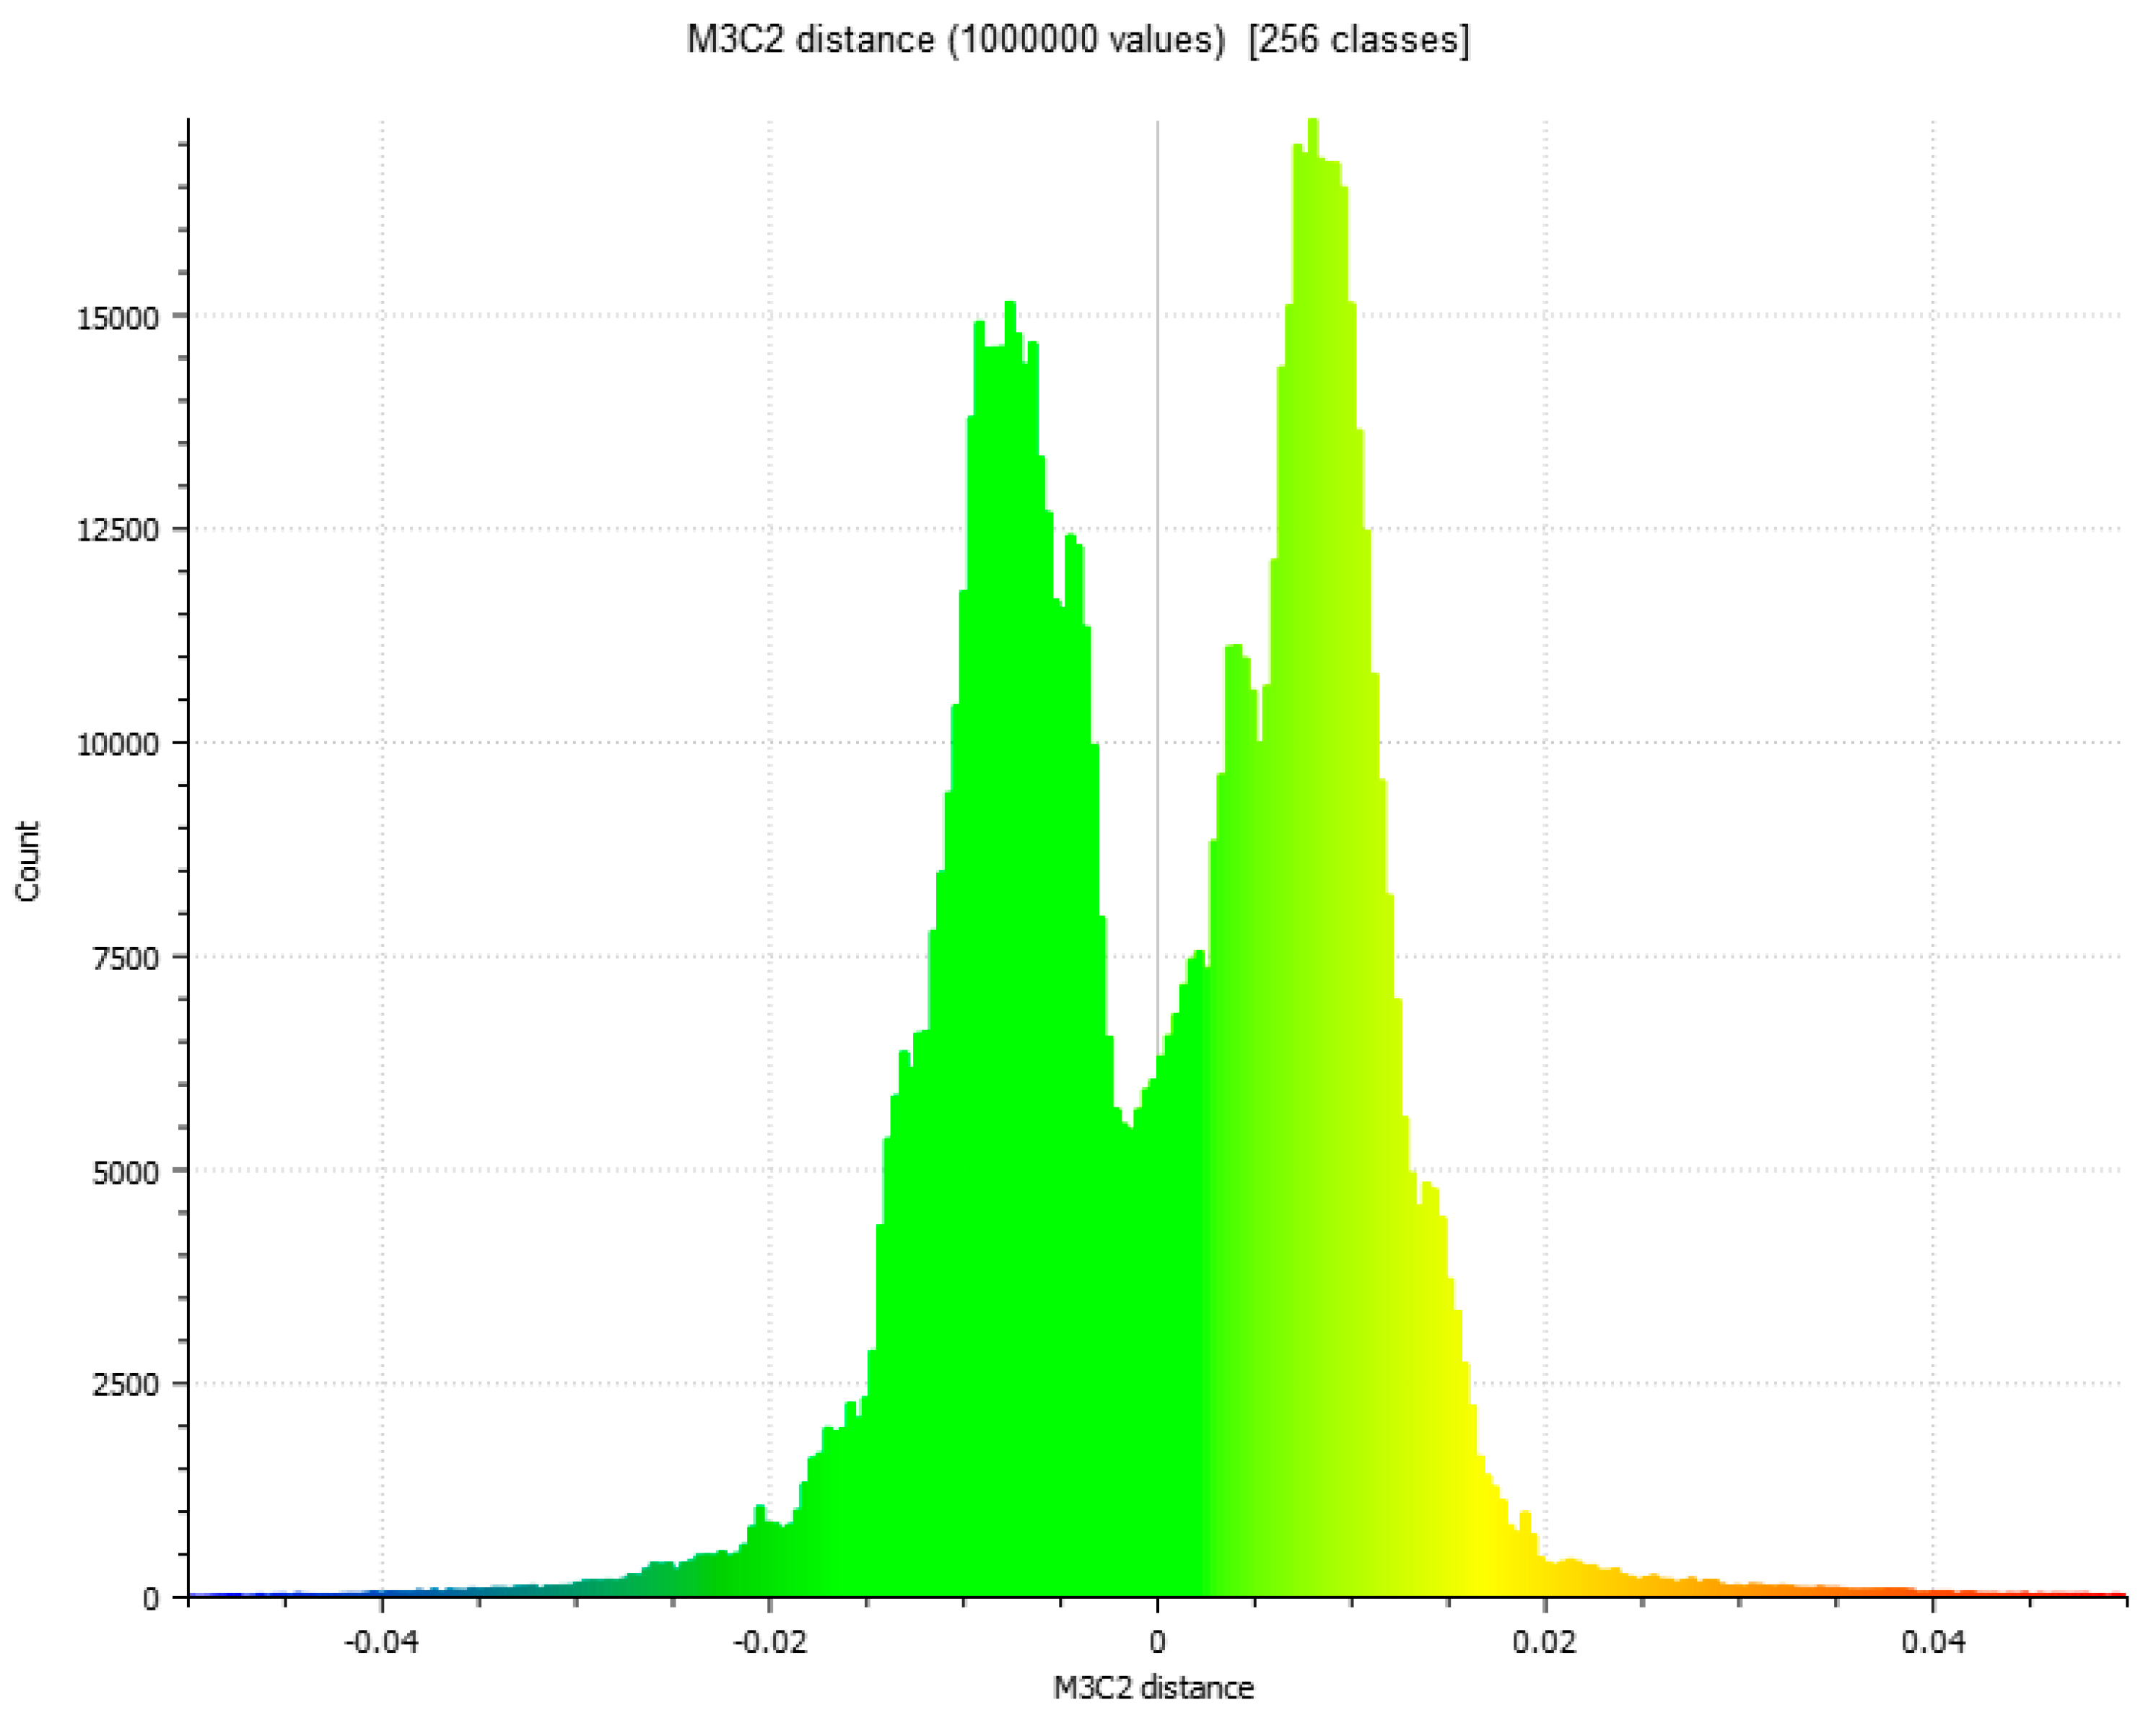
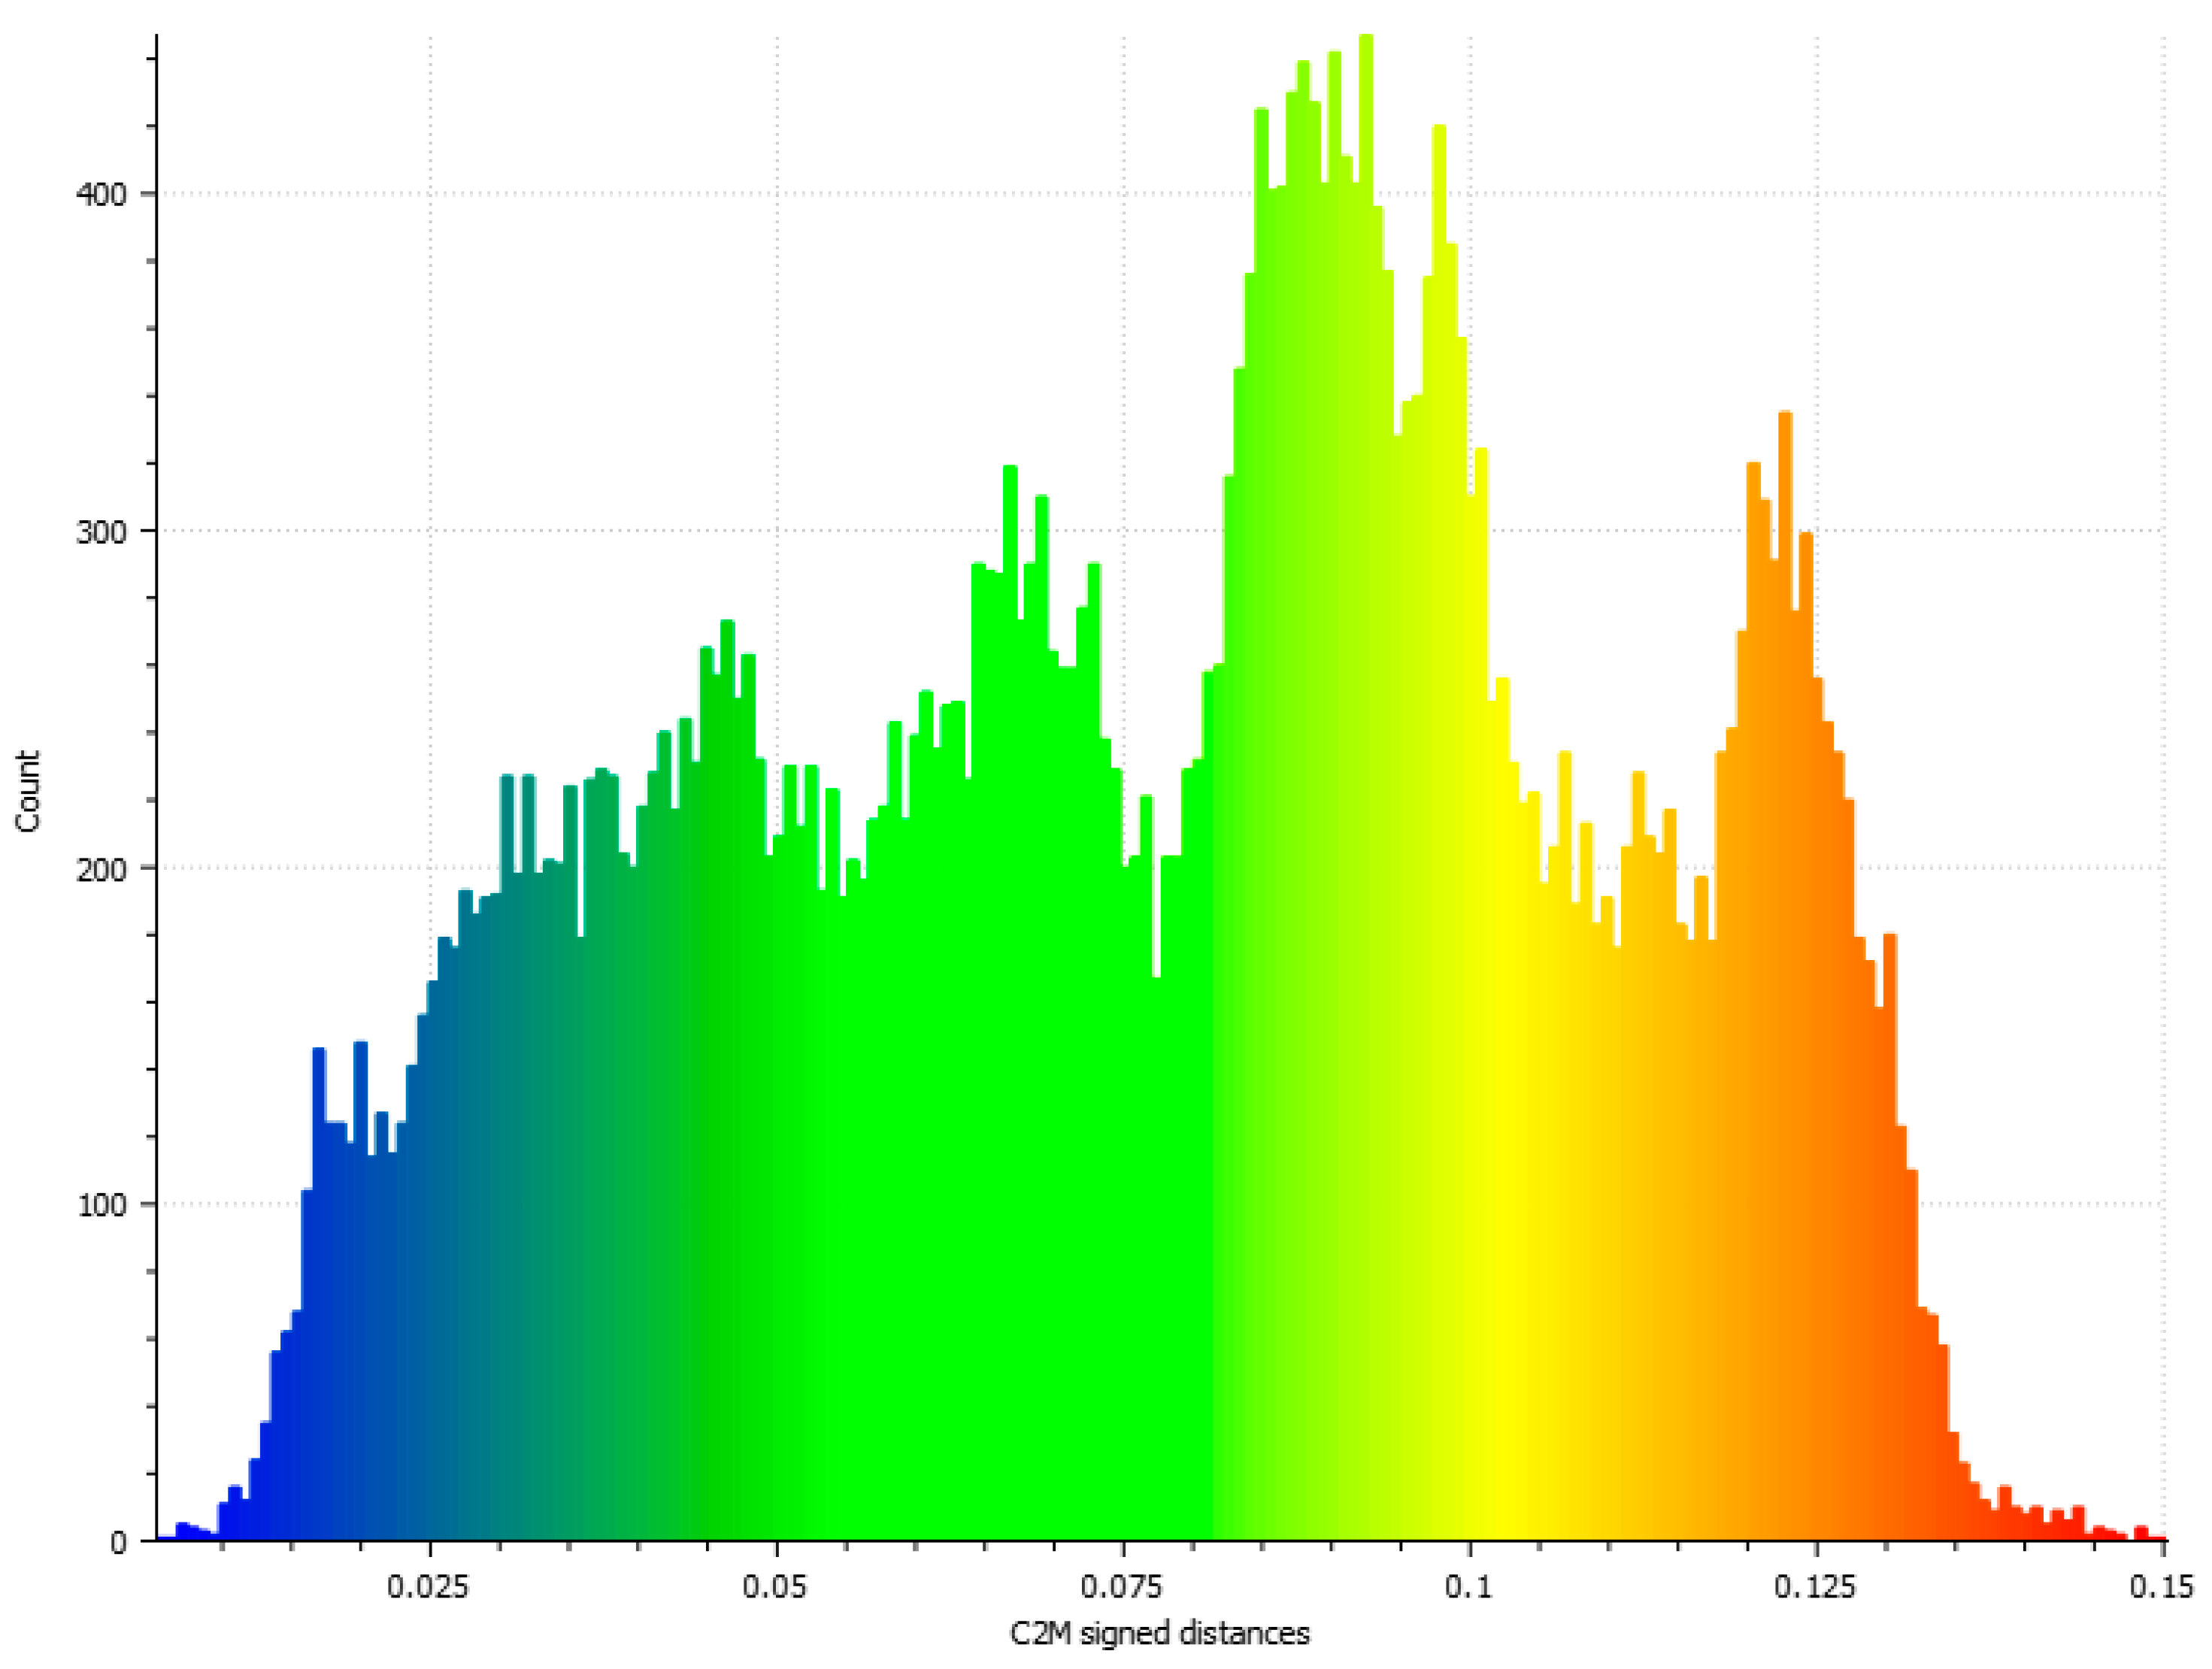
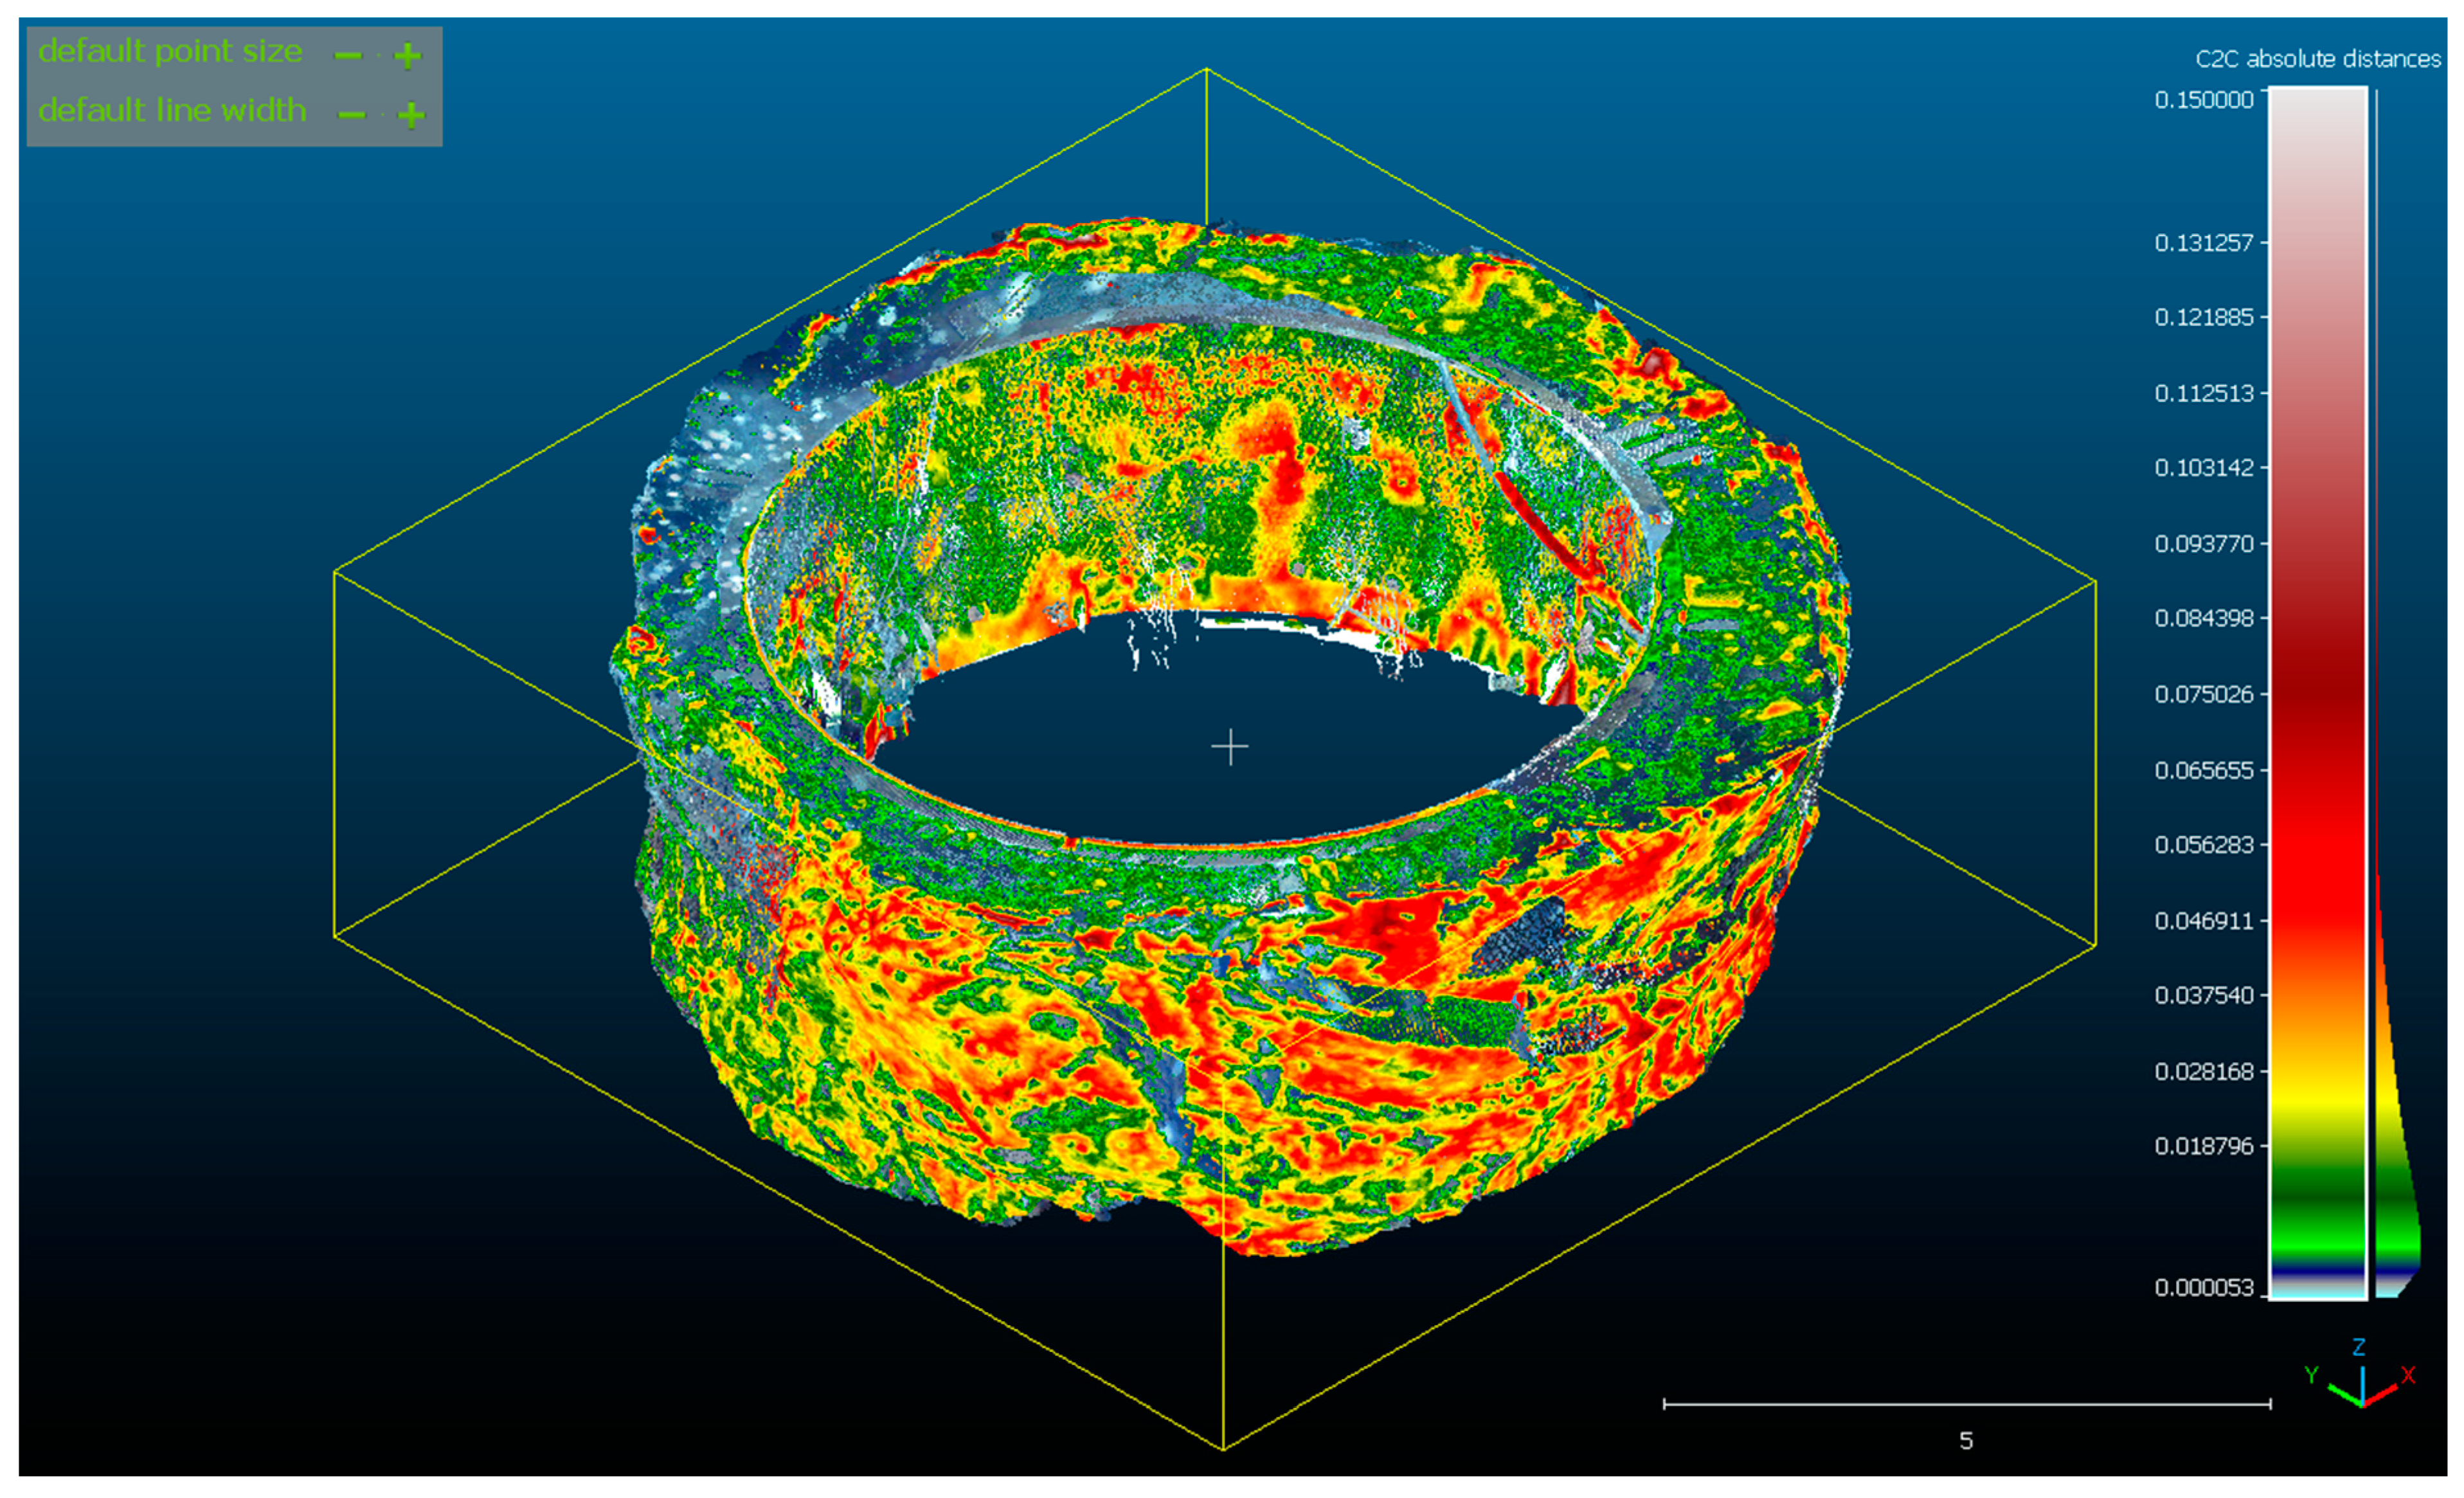
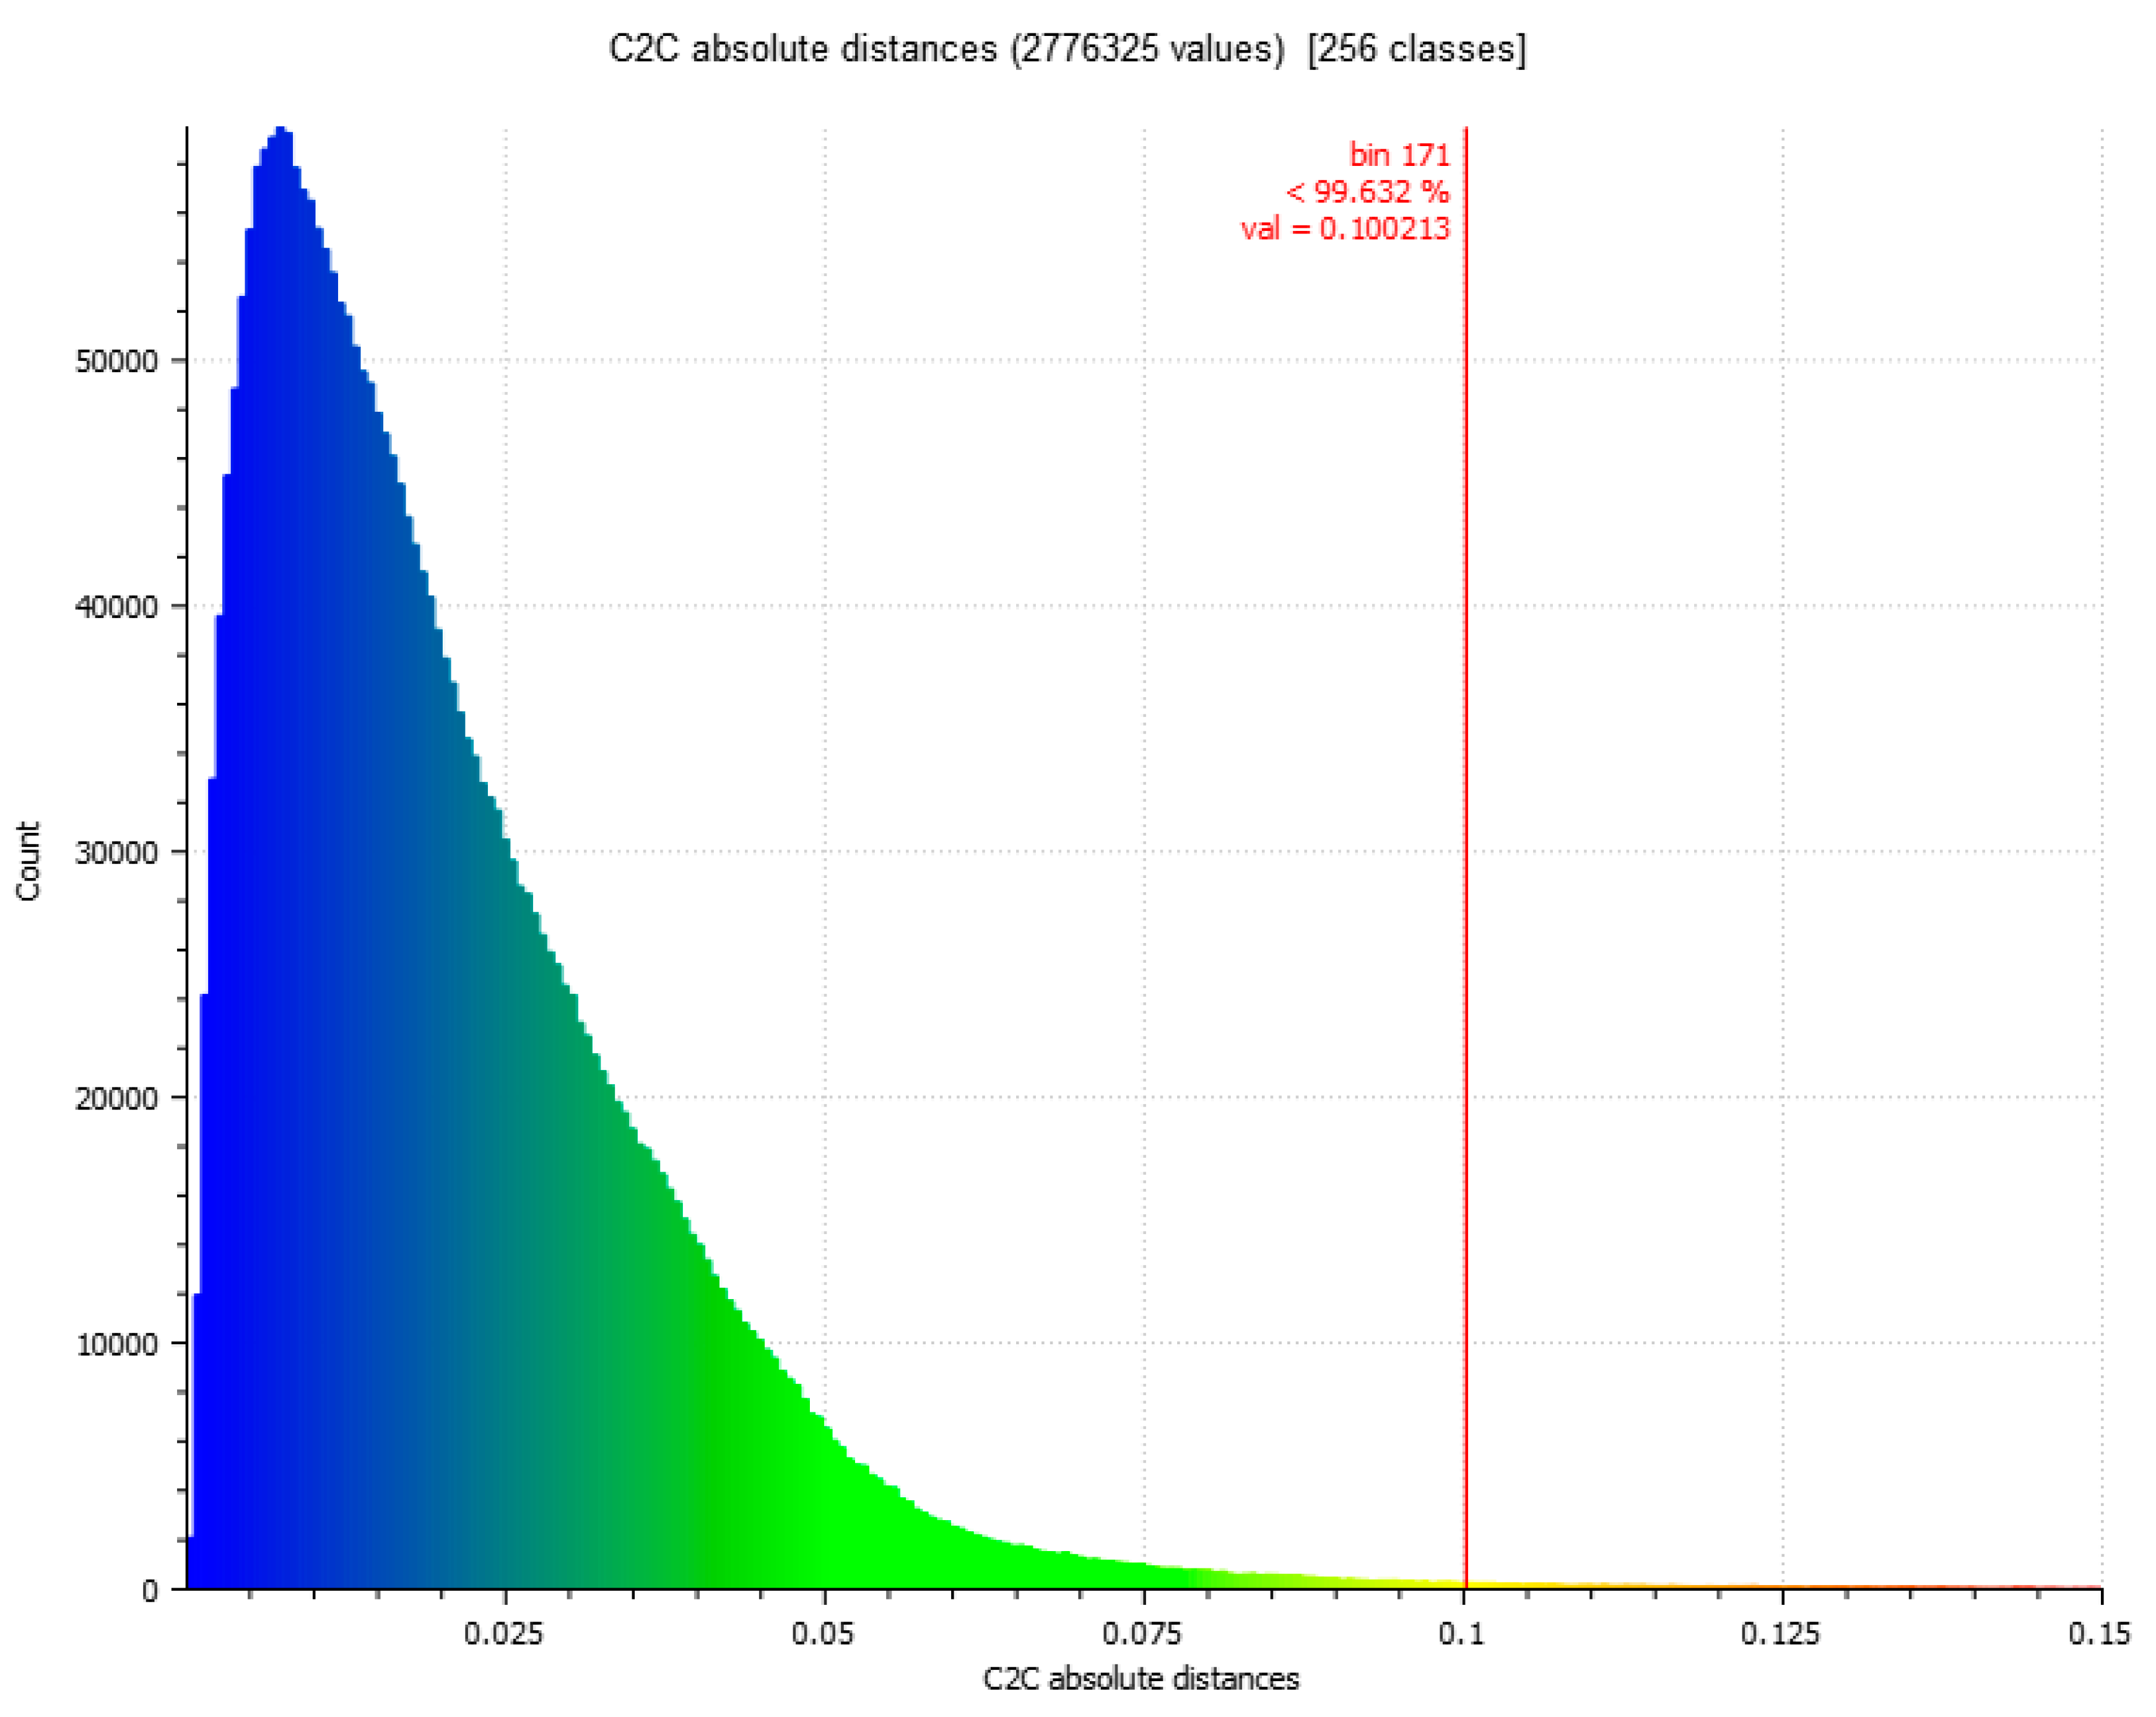
Using CLOUDCOMPARE™, the two point clouds were aligned, and distances between points were calculated. These cloud-to-cloud distances, computed using Hausdorff distance algorithm [22], are presented in Figure 13 and Figure 14 and on Chart 3 below. As visible on the scale, most distances vary from 0 to 6 cm, although some points with differences in distance exceeding 15 cm can also be observed. Nevertheless, the iPhone 13 Pro LiDAR scanner, in comparison with a professional high-cost scanner, proves to be sufficiently accurate for many applications in the shaft sinking process. iPhone 13 Pro was compared with professional TLS FARO FOCUS 130 in terms of price, accuracy time of measurement, exemplary point cloud density and IP in Table 6.
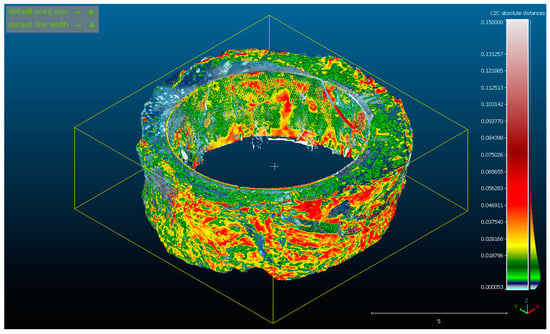
Figure 13.
Visual difference in distance in meters between point cloud generated with iPhone 13 Pro and FARO (front view).
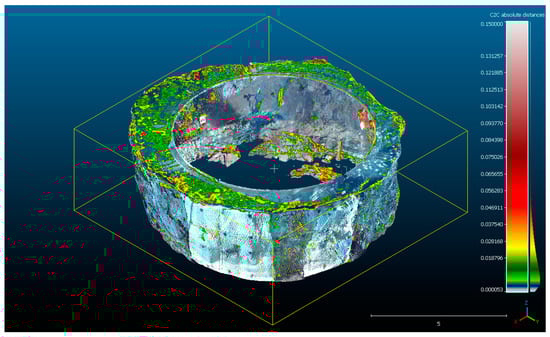
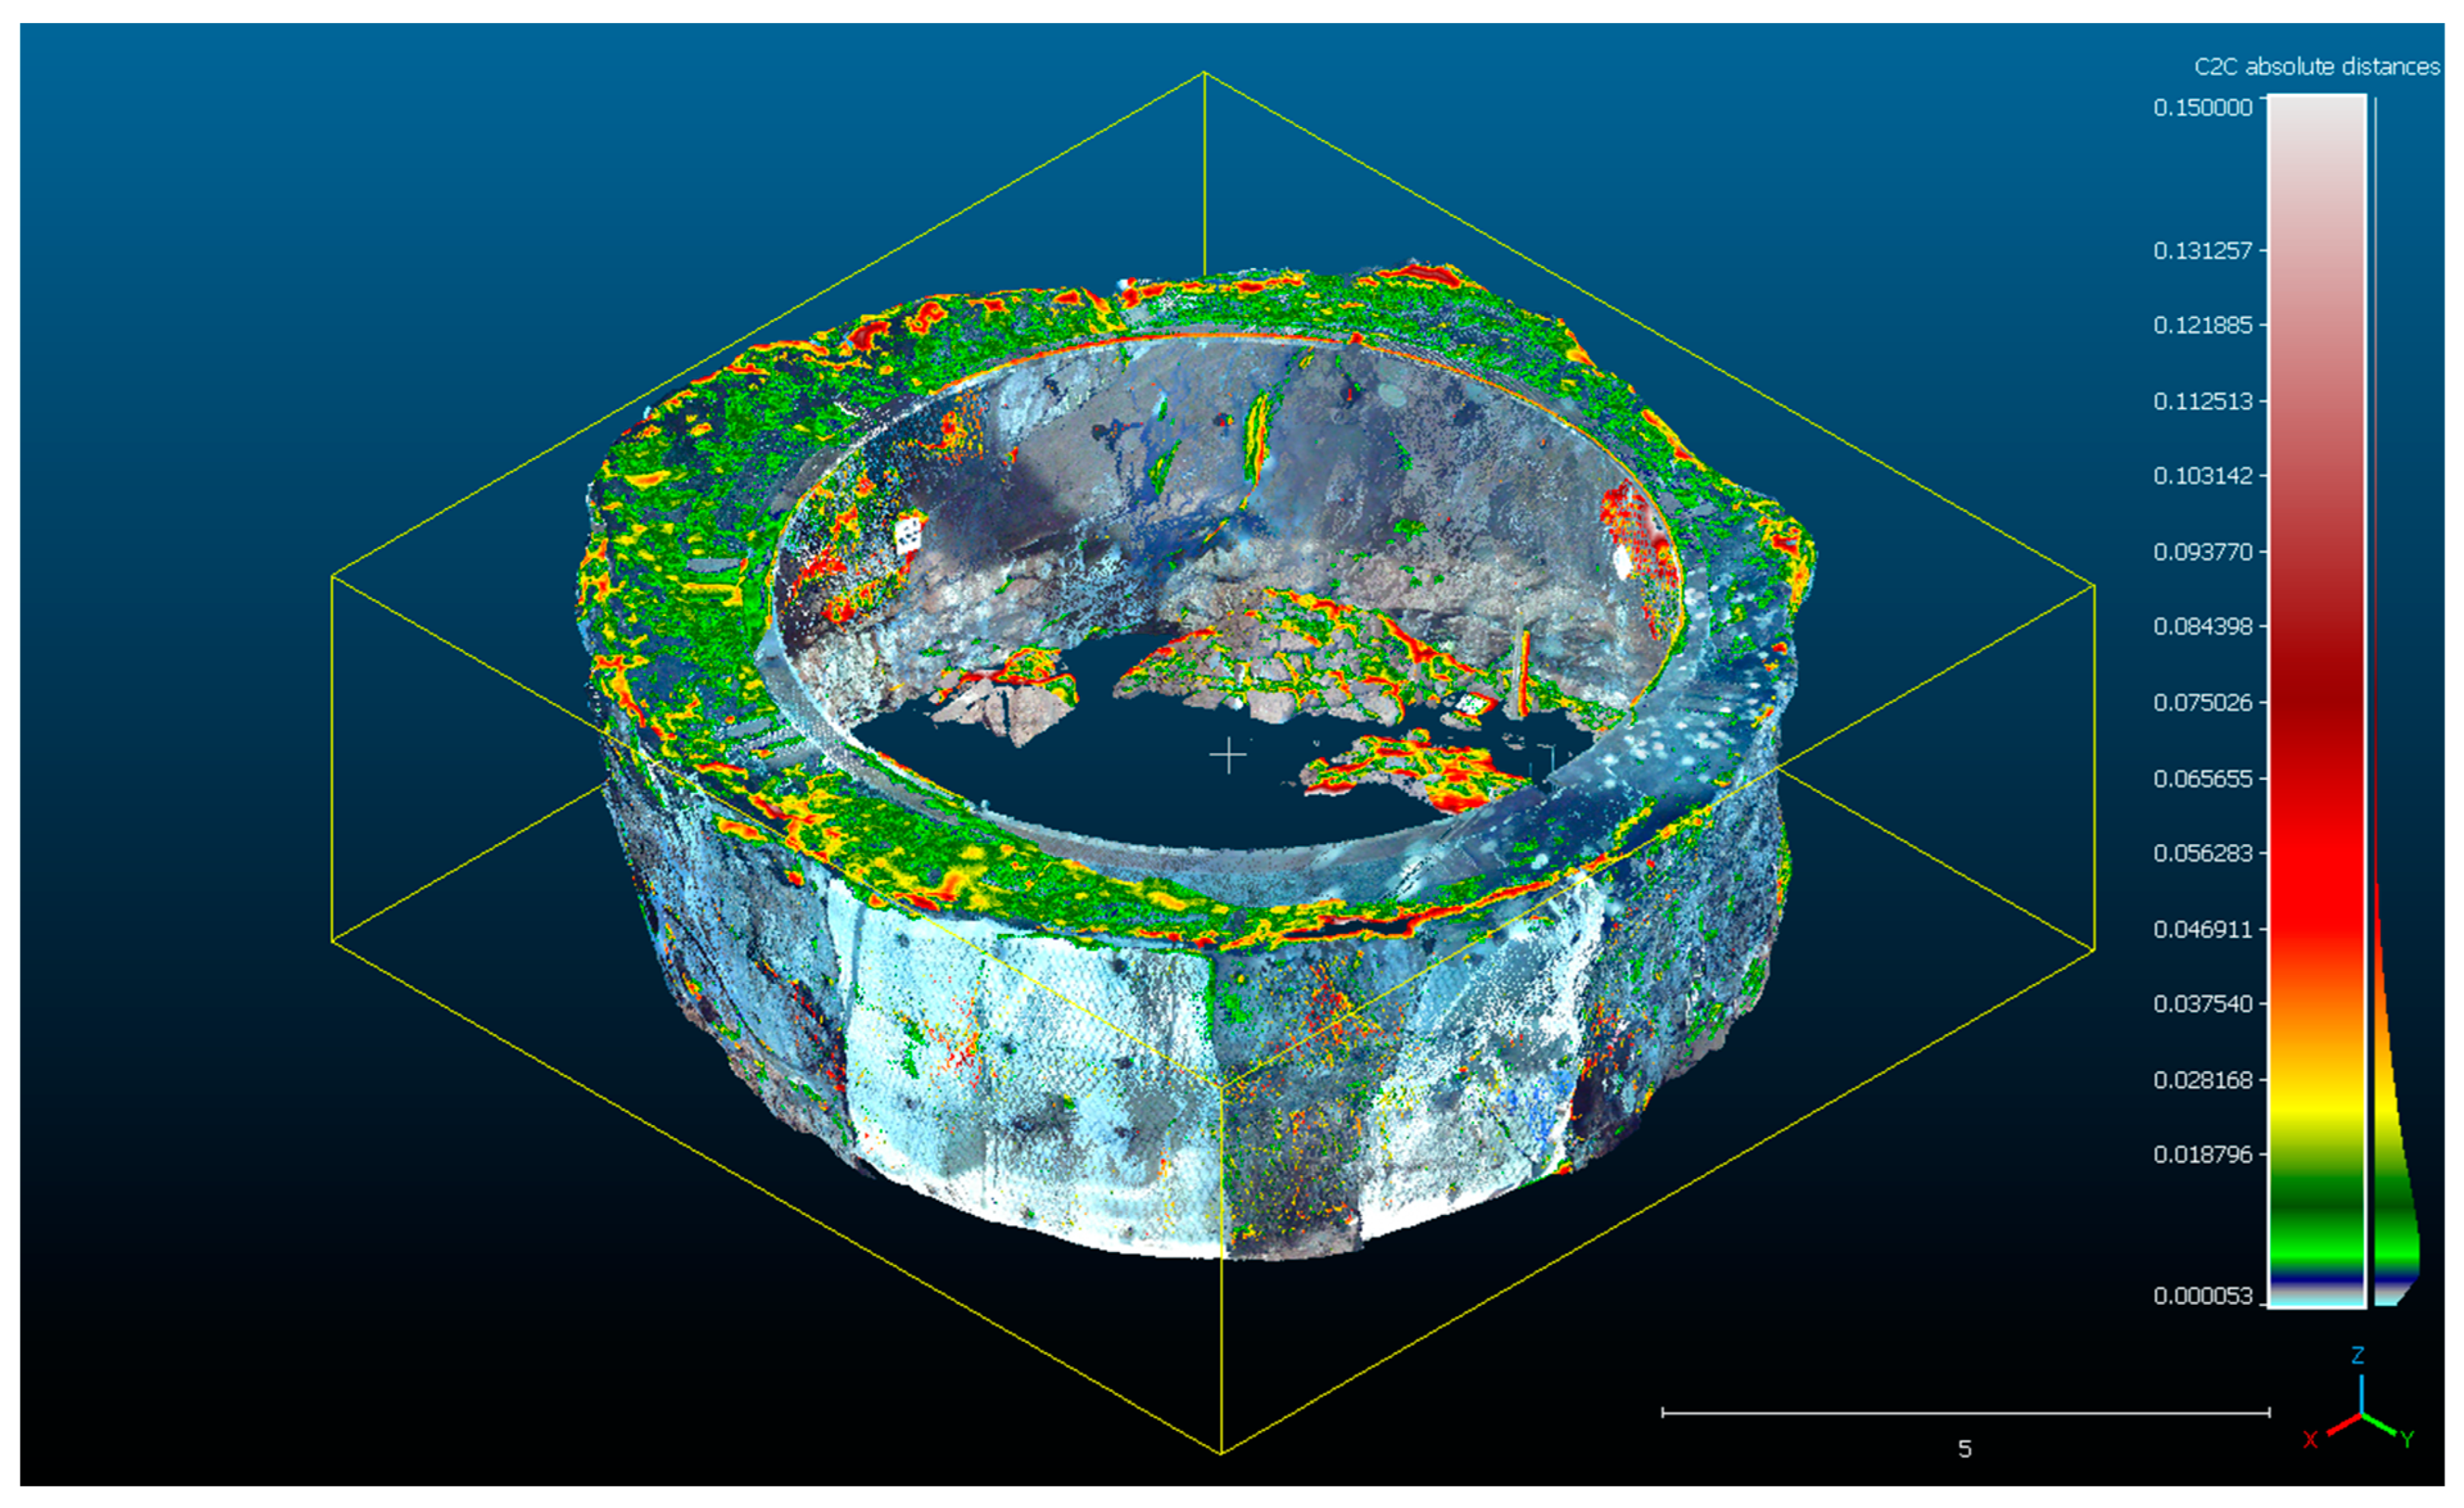
Figure 14.
Visual differences in distance in meters between point clouds generated with iPhone 13 Pro and FARO (back view).

Chart 3.
C2C distance (in metres) statistics.
Table 6.
Comparison of iPhone 13 pro with FARO FOCUS 130.
As presented above, the professional TLS is far more accurate but, at the same time, immensely more expensive and less durable considering unfavourable conditions in an underground mineshaft.
4.2. Volume Estimation Comparison
In addition to the validation of distances, the validation of cloud volume was also calculated using both the iPhone 13 Pro LiDAR and the FARO FOCUS 130 scanners. The results are presented in Table 7 below.
Table 7.
Difference in volumes calculated by iPhone 13 Pro LiDAR scanner and FARO FOCUS 130 scanner.
As shown above, the difference in volume was less than 2 m3 and the relative difference less than 1%. Such a level of accuracy is sufficient for the purpose of estimation of concrete volume but might not be adequate for checking the quantity of concrete waste, which, as mentioned above, is impossible to assess with current methods. Nevertheless, with the use of proper, certified scanners, such 3D models could well prove useful in concrete quality checks. Considering the price of materials and the volume of wasted concrete throughout the entire shaft sinking process, gains should exceed equipment cost greatly.
5. Conclusions
The iPhone 13 Pro with LiDAR scanner has already found applications in various industries. Compared to professional scanners, it is highly cost-effective, and its dedicated software is intuitively easy to use. Moreover, iPhones are much more robust than professional scanners—a crucial consideration in the mining industry, comparing water and dust resistance, according to manufacturers, for FARO FOCUS 130–IP64, FARO FREESTYLE 2–IP52, LEICA BLK360–IP54, while iPhone 13 Pro has IP68. Although the accuracy of the iPhone 13 Pro LiDAR scanner does not match that of terrestrial laser scanners such as FARO FOCUS 130, it is sufficiently accurate for certain tasks. The iPhone scanning time is equal to mechanical measurements—the entire process with data processing in situ takes up to 20 min—therefore, authors believe that this type of measurement might be used with success in the entire process of mineshaft sinking, whenever higher accuracy is not needed. As demonstrated in this paper, it can be used for estimation of required volumes of concrete, with errors below 2% compared to the professional TLS, pre-inspection of bolting patterns, shift handovers, simple geometry controls of objects such as steel formwork, and improved inspections of work in progress. In particular, the calculation of required concrete volumes may yield measurable financial benefits for mineshaft contractors: with errors of no more than 2 m3, estimates can be more precise, and ordering of surplus concrete avoided.
Quick laser scanning may also be of benefit in inspections of mine face dimensions during the shaft sinking process. During drilling and blasting, the dimensions of the mine face often differ considerably from those projected and turn out to be too thin. In the GG-1 shaft project, for example, the concrete lining was required to be at least 60 cm thick; lesser thicknesses might result in unacceptable weakening of the mechanical properties of the lining. However, this application would need a different approach to measurements and would require scanned reference points in the centre of the shaft.
Another interesting possible application of the iPhone 13 Pro LiDAR scanner in the mining industry in general is the generation of spatial models of scenes of accidents. The hazardous nature of the mining industry is well known, and the ability to save 3D models of areas where accidents, crashes or cave-ins have occurred may lead to better understanding of the causes of such incidents and, thereby, to improvements in measures for health and safety.
To sum up, the iPhone 13 Pro LiDAR scanner is surely of use, both in the shaft sinking process and in the underground mining industry in general, whenever agility will be a higher priority than accuracy. Also, the iPhone’s robustness in comparison with professional scanners is a great advantage. The authors believe that PeBeKa as a mineshaft sinking department in KGHM Polish Copper will use such low-cost scanners for shift basis in future mineshafts.
Author Contributions
Conceptualization, W.R.; Methodology W.R.; Validation, W.R. and T.L.; Formal analysis, T.L.; writing—original preparation, W.R.; writing—review and editing T.L.; Supervision, T.L. All authors have read and agreed to the published version of the manuscript.
Funding
This research was funded by Ministry of Education in Poland grant number DWD/5/0148/2021, APC was funded by Przedsiębiorstwo Budowy Kopalń PeBeKa Lubin S.A.
Data Availability Statement
Authors declare that data will not be available due to KGHM Polish Copper privacy policy.
Conflicts of Interest
The authors declare no conflict of interest.
References
- Lipecki, T.; Thi Thu Huong, K. The Development of Terrestrial Laser Scanning Technology And Its Applications in Mine Shafts in Poland. Inżynieria Miner. 2020, 1. [Google Scholar] [CrossRef]
- Benecke, N.; Hancock, P.; Weber, M. Latest Developments in the Practice of Shaft Inspection. In Proceedings of the XVI Congress of the International Society of Mine Surveying (ISM), Brisbane, Australia, 12–16 September 2016. [Google Scholar]
- Vala, D.; Slanina, Z.; Walendziuk, W. Mining Shaft Inspection by Laser Photogrammetry. Elektron. Ir Elektrotechnika 2016, 22, 40–43. [Google Scholar] [CrossRef]
- Regulation of the Minister of Energy of November 23, 2016 on Detailed Requirements for the Operation of Underground Mines. Available online: https://isap.sejm.gov.pl/isap.nsf/DocDetails.xsp?id=WDU20170001118 (accessed on 20 September 2023).
- Kumar Singh, S.; Pratap Banerjee, B.; Raval, S. A Review of Laser Scanning for Geological and Geotechnical Applications in Underground Mining. Int. J. Min. Sci. Technol. 2022, 33, 133–154. [Google Scholar] [CrossRef]
- Singh, S.K.; Raval, S.; Banerjee, B. A Robust Approach to Identify Roof Bolts in 3D Point Cloud Data Captured from a Mobile Laser Scanner. Int. J. Min. Sci. Technol. 2021, 31, 303–312. [Google Scholar] [CrossRef]
- Gallwey, J.; Eyre, M.; Coggan, J. A Machine Learning Approach for the Detection of Supporting Rock Bolts from Laser Scan Data in an Underground Mine. Tunn. Undergr. Space Technol. 2021, 107, 103656. [Google Scholar] [CrossRef]
- Ren, Y.; Dai, Z.; Lu, P.; Ai, C.; Huang, Y.; Tolliver, D. Rail Gage-Based Risk Detection Using IPhone 12 Pro. Proc. Inst. Mech. Eng. F J. Rail Rapid Transit. 2022, 237, 429–437. [Google Scholar] [CrossRef]
- Mikita, T.; Krausková, D.; Hrůza, P.; Cibulka, M.; Patočka, Z. Forest Road Wearing Course Damage Assessment Possibilities with Different Types of Laser Scanning Methods Including New IPhone LiDAR Scanning Apps. Forests 2022, 13, 1763. [Google Scholar] [CrossRef]
- Tatsumi, S.; Yamaguchi, K.; Furuya, N. ForestScanner: A Mobile Application for Measuring and Mapping Trees with LiDAR -equipped IPhone and IPad. Methods Ecol. Evol. 2022, 14, 1603–1609. [Google Scholar] [CrossRef]
- Kottner, S.; Thali, M.J.; Gascho, D. Using the IPhone’s LiDAR Technology to Capture 3D Forensic Data at Crime and Crash Scenes. Forensic Imaging 2023, 32, 200535. [Google Scholar] [CrossRef]
- Luetzenburg, G.; Kroon, A.; Bjørk, A.A. Evaluation of the Apple IPhone 12 Pro LiDAR for an Application in Geosciences. Sci. Rep. 2021, 11, 22221. [Google Scholar] [CrossRef] [PubMed]
- Fang, K.; Zhang, J.; Tang, H.; Hu, X.; Yuan, H.; Wang, X.; An, P.; Ding, B. A Quick and Low-Cost Smartphone Photogrammetry Method for Obtaining 3D Particle Size and Shape. Eng. Geol. 2023, 322, 107170. [Google Scholar] [CrossRef]
- Jaud, M.; Kervot, M.; Delacourt, C.; Bertin, S. Potential of Smartphone SfM Photogrammetry to Measure Coastal Morphodynamics. Remote Sens. 2019, 11, 2242. [Google Scholar] [CrossRef]
- De la Vergne, J. Hard Rock Miners Handbook; McIntosh Engineering: North Bay, ON, USA, 2003; ISBN 0968700616. [Google Scholar]
- Darling, P. SME Mining Engineering Handbook, 3rd ed.; Society for Mining Metallurgy & Exploration: Englewood, CO, USA, 2011. [Google Scholar]
- Rulka, K.; Szyndler, J.; Mateja, J. State of Shaft Sinking Technology in the Polish Mining Industry. Erzmetall 1988, 41, 650–654. [Google Scholar]
- Farazi, A.H. Selection of Shaft Sinking Method for Underground Mining in Khalashpir Coal Field, Khalashpir, Rangpur, Bangladesh. IOSR J. Mech. Civ. Eng. 2012, 3, 15–20. [Google Scholar] [CrossRef]
- Igolka, D.A.; Otten, F. Rapid Mechanized Shaft Sinking. Min. Ind. (Gorn. Promishlennost) 2020, 22–29. [Google Scholar] [CrossRef]
- Zaczek-Peplinska, J. Pomiary Inwetaryzacyjne z Wykorzystaniem Apple IPhone 13 Pro i Zintegrowanej Technologii LiDAR. Przegląd Geod. 2023, 1, 16–19. [Google Scholar] [CrossRef]
- Rutkowski, W. Possible Application of Low-Cost Laser Scanners and Photogrammetric Measurements for Inspections in Shaft Sinking Process. J. Konbin 2023, 53, 147–156. [Google Scholar] [CrossRef]
- Hausdorff Distance. Available online: https://en.wikipedia.org/wiki/hausdorff_distance (accessed on 20 September 2023).


Disclaimer/Publisher’s Note: The statements, opinions and data contained in all publications are solely those of the individual author(s) and contributor(s) and not of MDPI and/or the editor(s). MDPI and/or the editor(s) disclaim responsibility for any injury to people or property resulting from any ideas, methods, instructions or products referred to in the content. |
© 2023 by the authors. Licensee MDPI, Basel, Switzerland. This article is an open access article distributed under the terms and conditions of the Creative Commons Attribution (CC BY) license (https://creativecommons.org/licenses/by/4.0/).