Abstract
Observations acquired by the SPOT-VEGETATION and PROBA-V missions offer a unique opportunity to improve our understanding of the climate, providing global and continuous data over the land surface over 20 years. The possibility of generating a long-term climate data record from the entire archive, stored on the Mission Exploitation Platform (MEP), is here explored. For this purpose, in the framework of the ESA-funded SPAR@MEP project, the Combined Inversion of Surface and Aerosols (CISAR) algorithm has been applied to the SPOT-VGT and PROBA-V archive, following the harmonization of the observations according to the Fidelity and Uncertainty in Climate data records from Earth Observations (FIDUCEO) principles. CISAR has been applied to the full 20-year harmonized archive over key areas, as well as to one year of global acquisition from PROBA-V, processed at 5 km resolution, to derive aerosol single-scattering properties and surface reflectance. The retrieval is evaluated in terms of consistency among the three sensors and against reference datasets, including ground-based observations, models, and other sensor products. This activity has revealed the importance of characterizing the radiometric uncertainty for every processed pixel.
1. Introduction
Understanding the climate and its changes is one of the current challenges in remote sensing from satellites. Several initiatives have been focusing on retrieving long-term data records, which can enhance our understanding of the climate and better predict its changes [1]. In this regard, the observations acquired by SPOT4-VGT1, SPOT5-VGT2, and PROBA-V satellites, resulting in 20 years of continuous, global observations over land represent a unique opportunity. PROBA-V was developed as both a follow-up to the 15-year SPOT-VEGETATION mission, as well as a preparation for the recently launched ESA Sentinel-3 land and ocean observation satellite mission [2]. The SPOT-VEGETATION mission provided essential information on crop yields, droughts, and deforestation to a broad user community. To optimally serve the vegetation and land surface community, PROBA-V’s spectral channels are similar to those of the SPOT-VGT instrument, thereby preserving a maximum observational spectral consistency with the SPOT-VGT era. The data are entirely stored and available on the Mission Exploitation Platform (MEP) developed by Vlaamse Instelling voor Technologisch Onderzoek (VITO) as an ESA pathfinder project [3]. The MEP provides access to the full data archive from PROBA-V and SPOT-VEGETATION and derived products by researchers, service providers, and thematic users. The platform consists of a private cloud environment, a Hadoop-based processing environment, and a data manager, allowing users to visualize and analyze large time series of data and pre-defined on-demand processing services that deliver user-tailored products.
SPOT-VGT and PROBA-V are both used in the framework of the Copernicus Climate Change Service (C3S [4]) to derive a long-term data record of surface albedo, which plays a fundamental role in the surface energy budget and is a sensitive indicator of environmental changes including land degradation. The algorithm for the derivation of the surface albedo used within C3S takes as input the top of canopy (TOC) reflectance, delivered with the operational Level-2 PROBA-V product available in the MEP [5]. The Level-2 product is obtained by performing the atmospheric correction with the Simplified Model for Atmospheric Corrections (SMAC) algorithm [6]. The advanced land, aerosol, and coastal product (PV-LAC) ESA project showed, however, the added value of a more advanced algorithm for atmospheric correction, such as the Combined Inversion of Surface and Aerosols (CISAR) algorithm ([7,8]). Therefore, the CISAR algorithm (v2.2.0) is here used to reprocess the SPOT-VGT and PROBA-V archive on the MEP. CISAR, based on an optimal estimation (OE) approach, also implements a strict mathematical framework for uncertainty propagation.
A rigorous treatment of uncertainties is essential to enhance the credibility of climate data and to support rigorous science, decision making, and climate services [9]. Within the Fidelity and Uncertainty in Climate data records from Earth Observations (FIDUCEO) Horizon2020 project, researchers have developed practical guidelines for organizing and traceably documenting uncertainty analysis [10]. In addition to uncertainty analysis, the FIDUCEO project also defined harmonization as the best practice method to achieve consistency among data obtained from different sensors. Giering et al. [11] define harmonization as a process that obtains new calibration coefficients for revised sensor calibration models; this is achieved by comparing observations acquired by different sensors to a common reference measurement, ideally SI traceable. The harmonization method is here applied to the SPOT-VGT and PROBA-V archives following the FIDUCEO guidelines.
The objective of this paper is to demonstrate the possibility of generating climate data records from the MEP archive with the CISAR algorithm following FIDUCEO recommendations. To achieve this objective, the manuscript has been organized into three major sections: Section 2.1 describes the harmonization method and results; the CISAR algorithm is described in Section 2.2, and finally, results from the SPAR@MEP project are presented in Section 3.
2. Materials and Methods
2.1. Data Archive
2.1.1. Description of the MEP Archive
The MEP archive contains more than 20 years of observations starting in 1998, acquired in four spectral bands (blue, red, NIR, and SWIR) by three satellites: SPOT-VGT 1 (April 1998–April 2012) and 2 (January 2003–June 2014) and PROBA-V (April 2013–2021). Though based on a similar four-spectral band design, the characteristics of each radiometer slightly differ. Figure 1 shows the different spectral responses of the four spectral bands, namely blue, red, NIR, and SWIR. Although PROBA-V has been designed as a continuation of SPOT-VGT, some differences in the shape of the spectral response function (SRF) can be observed. For instance, differences in the shape of the SRF can be found in the blue, red, and NIR bands: in the latter (centered around 0.8 μm), the peak of PROBA-V SRF is shifted towards lower wavelengths compared to the SPOT-VGT response. Also, in the SWIR, the central wavelength is slightly different among the three sensors, being 1.65 μm, 1.63 μm, and 1.60 μm for SPOT4-VGT1, SPOT5-VGT2, and PROBA-V, respectively. However, as no uncertainties are assigned to these SRFs, it is difficult to assess whether these differences are within the associated uncertainties. The VEGETATION and PROBA-V instrument’s cameras (1 for VGT1 and VGT2, 3 for PROBA-V) are based on a pushbroom imaging design. All instruments are onboard sun-synchronous satellites, but in contrast to the SPOT platforms, PROBA-V does not have the capability to maintain its orbit. The current study relies on the top-of-atmosphere (TOA) bidirectional reflectance factor (BRF) derived from these satellites as delivered on the MEP ([12,13]). The radiometric calibration of these data relies on different vicarious methods according to the mission ([12,14]).
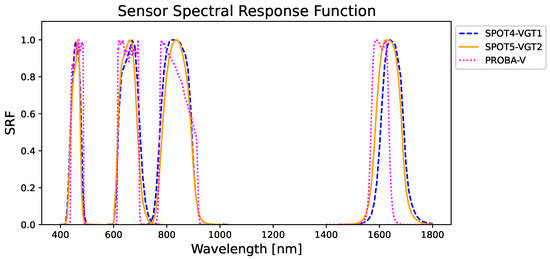
Figure 1.
Spectral response functions of SPOT4-VGT1 (blue), SPOT5-VGT2 (orange), and PROBA-V (magenta).
2.1.2. Harmonization Method
As the three radiometers composing the MEP archive have slightly different characteristics and radiometric calibration, as explained in Section 2.1.1, it is firstly necessary to verify the temporal consistency of the TOA BRF. Various approaches have been proposed to harmonize or homogenize data sets [15]. A harmonized satellite time series is one where all the sensor radiometric calibration relies on the same reference, which can be traced back to known reference sources. Each radiometer is calibrated to the reference in a way that maintains its unique characteristics, which means that the PROBA-V or VEGETATION sensors may see different signals when looking at the same location at the same time due to known differences in their spectral response functions. In contrast, homogenization involves forcing all satellites to appear the same, theoretically giving the same signal when looking at the same location at the same time. However, in reality, the signals from different sensors would still be different, and homogenization involves adding corrective terms to each satellite to make them appear similar. Likely, these corrective terms will not be 100% effective, and the process of homogenization may introduce scene-dependent errors to the uncertainty budget that could be difficult to assess.
The current study relies on harmonization using a common vicarious radiometric calibration reference, consisting of simulated reflectance over a bright desert pseudo-invariant calibration target (PICS). Libya-4 centered on (23.39°E, 28.55°N) in the Great Sand Sea has been chosen for that purpose. It is a location composed of spatially organized sand dunes. Govaerts [16] has analyzed the impact of the site size as a function of the surface reflectance standard deviation, showing that a size of 50 km exhibits the lowest value. To perform this harmonization, clear-sky TOA BRF observations from VEGETATION-1, -2, and PROBA-V acquired over this PICS have been extracted in a 50 km × 50 km area applying successive filtering, explained in Figure 2. Each of these steps is performed to obtain time series free of any cloud contamination, poor radiometric performances, or characterized by extreme aerosol events (e.g., thick dust storms).
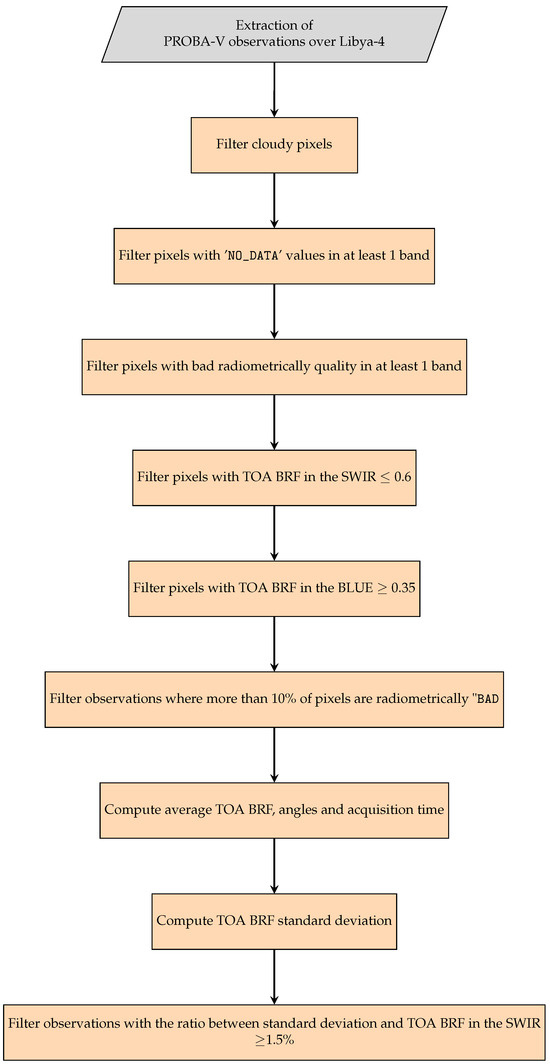
Figure 2.
Flowchart of CISAR inversion of one accumulation period.
Next, each observation has been compared with the calibration reference, which has been simulated using four different radiative transfer models. Surface and atmospheric properties have been taken from Govaerts et al., 2013 [17]. The aerosol optical thickness is taken from the Copernicus Atmosphere Monitoring Service (CAMS) reanalysis data [18]. The mean accuracy of this reference has been estimated to be about 2% to 3% when several tenths of clear-sky observation are used. Details about the use of these models can be found in Govaerts et al. [19]. This paper provides a detailed analysis of the calibration reference values obtained with each model. The relative bias between the observations and the harmonization reference simulated with each model. The harmonization coefficients are calculated as the weighted mean biases obtained with each model where the weight is equal to the inverse of the standard deviation between the observations and the harmonization reference. For the PROBA-V data, this harmonization coefficient is determined for each camera.
2.1.3. Harmonization Results
An example of the mean relative bias estimated with each radiative transfer model is shown in Figure 3. The difference obtained with each model is explained in Govaerts et al. [19]. The mean relative bias obtained with the Libradtran model [20] for VGT1, VGT2, and PROBA-V (all cameras) is shown in Figure 4. The overall harmonization results are shown in Table 1. The value of these coefficients is usually lower than the accuracy of our calibration reference, demonstrating that most of the bands are very well calibrated. The relevant aspect of these results is the harmonization of the time series against a common calibration reference, not the exact accuracy value of the calibration reference. There are, however, few exceptions in the blue bands where the harmonization coefficients exceed 3%. These coefficients are applied to the TOA BRF values that are extracted from the MEP archive before being ingested by the CISAR algorithm.
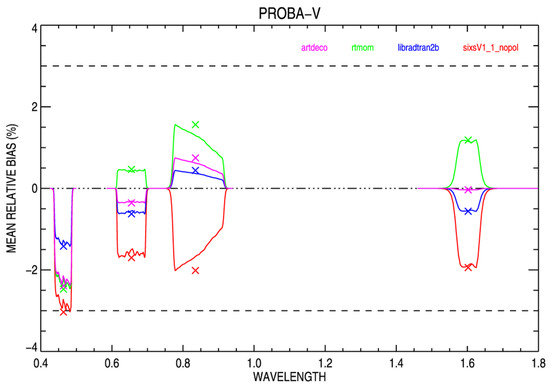
Figure 3.
TOA BRF mean relative bias between the PROBA-V observations and the harmonization reference over Libya-4, estimated with four different radiative transfer models. The spectral range of each simulated band is represented by the shape of its SRF and the magnitude of the bias by the × symbol. The maximum of the SRF shape is scaled to this value. Wavelengths are expressed in μm.
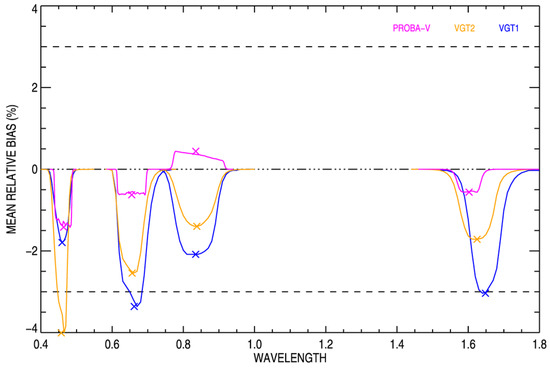
Figure 4.
TOA BRF mean relative bias between the VGT1, VGT2, and PROBA-V observations and the harmonization reference estimated with Libradtran over Libya-4. The spectral range of each simulated band is represented by the shape of its SRF and the magnitude of the bias by the × symbol. The maximum of the SRF shape is scaled to this value. Wavelength is expressed in μm.

Table 1.
TOA BRF harmonization factors for the MEP archive.
2.2. Method: The CISAR Algorithm
The CISAR algorithm has been developed for the joint inversion of aerosol single-scattering properties and surface reflectance, and it has been recently extended to the processing of cloud single-scattering properties, allowing for a continuous product between aerosols and clouds [21]. The unique capability of CISAR to retrieve both aerosol and cloud properties largely increases the spatial coverage of the aerosol product. CISAR also implements a strict mathematical framework for the inversion within the OE approach, allowing for uncertainty propagation from the observation space towards the solution at the pixel level. Within this study, CISAR is applied to SPOT4-VGT1, SPOT5-VGT2, and PROBA-V observations, to assess the consistency of the retrieval from the harmonized observations of the three different sensors and to analyze the possibility of retrieving a long-term data record (LTDR) from this dataset. In addition, one year of PROBA-V images was processed globally at 5 km resolution in 2019.
2.2.1. Algorithm Features
The core of the CISAR algorithm is the online inversion of a fast radiative model called FASTRE. Consequently, CISAR does not rely on pre-computed LUTs, with the exception of molecular absorption. FASTRE represents the observed scene as a three-layer system: surface (land or water), first atmospheric layer (accounting for both scattering and molecular absorption), and second atmospheric layer (only accounting for molecular absorption). The surface reflectance over land is represented with the Rahman–Pinty–Verstraete (RPV [22]) model. The atmospheric solution space is defined by a 2-dimensional space bounded by aerosol and cloud vertices, defined by their single-scattering albedo () and asymmetry factor (g), within which the solution can vary continuously [21]. Over land, the state variable vector is composed of the four parameters of the RPV model and the optical thickness (OT) associated with each aerosol or cloud vertex. Over water, the state variable is composed exclusively of the aerosol and cloud optical thickness (AOT/COT) associated with each aerosol or cloud vertex, as the surface reflectance is computed with the Cox–Munk model [23], taking as input the wind speed from the ERA5 reanalysis data prepared by the European Centre for Mid-Range Weather Forecasts (ECMWF) within C3S [24]. With the exception of the surface reflectance model, the inversion algorithm remains invariant between land and water. The aerosol and cloud single-scattering properties are then computed as an average among the aerosol and cloud vertices, respectively, weighted by the corresponding retrieved OT [8]. The definition of the solution space allows the CISAR algorithm to retrieve the aerosol fine mode fraction over both land and water.
Although constraints on the state variables are applied, exploiting temporal, spectral and spatial resolution of the processed satellite acquisition, CISAR is a flexible algorithm that can be applied to multiple sensors, as it does not rely on specific orbits nor specific spectral bands, in contrast with other inversion algorithms ([25,26,27]). In [8] it is described how the CISAR algorithm can be applied to both geostationary and polar-orbiting satellites. However, CISAR requires good characterization of the instrument radiometric performances, as the associated uncertainty has a large impact on the inversion process, based on an OE approach, which seeks the best balance between observation and prior information, accounting for the respective uncertainty. The lack of a well-characterized radiometric uncertainty will impact the retrieval performances, as it will be observed in Section 3.2.4.
Satellite observations, both over land and over water, are accumulated in time during the so-called accumulation period, during which the surface reflectance properties are considered temporally invariant. The length of the accumulation period varies according to the temporal resolution of the processed sensor; in the case of VGT and PROBA-V, the length is fixed to 15 days, and a new retrieval is performed every 10 days (leading to an overlap of 5 days between consecutive accumulation periods). Each retrieval is associated with a quality indicator (QI) based on the uncertainty reduction from the prior to the solution space, the physical validity of the solution, and the information content of the observation, quantified through the Jacobians, i.e., the partial derivative of the model with the respect to the state variable.
Although the CISAR algorithm could be operated without the use of an external cloud mask [21], within the framework of this project the VGT and PROBA-V cloud masks are used to build the prior information for the aerosol and cloud optical thickness.
2.2.2. Product Definition
The retrieval of the surface reflectance and aerosol/cloud single-scattering properties is delivered through project-specific products, normally consisting of NetCDF files. Within the SPAR@MEP project, two products are delivered: daily atmospheric products and 10-day surface products. The former contains the AOT/COT in all VGT and PROBA-V bands and at 0.55 μm, the fine mode fraction, and the ice particle fraction. The latter provides the retrieved RPV parameters and the white-sky albedo (WSA) or isotropic bi-hemispherical reflectance (BHR) computed from the retrieved RPV parameters in all PROBA-V bands. All quantities are delivered with their associated uncertainty, and both products provide the QI described in [8]. Within the 5-day overlap between two accumulation periods, the retrieval with the highest QI is provided in the atmospheric products. Cloud properties are considered here to be a by-product: the goal remains to improve aerosol retrieval. In fact, as CISAR only operates in the visible and near-infrared part of the spectrum, it is not expected to retrieve cloud properties with the same accuracy as algorithms including infrared and thermal measurements.
2.2.3. Algorithm Performances Evaluation
CISAR performances are evaluated against reference measurements such as ground observations, models, and cross-satellite products in terms of magnitude, temporal evolution, and spatial consistency. The accuracy, precision, and uncertainty (APU [28]) statistics are computed to quantitatively assess the retrieval performances against a reference measurement:
- Accuracy (A):
- Precision (P):
- Uncertainty (U)where n is the number of points, and is the difference between the retrieved and the reference values. The uncertainty defined in Equation (3) corresponds to the root mean square error (RMSE). Additionally, the correlation coefficient is calculated. The choice of the APU statistics to evaluate the algorithm performances is made to assure consistency with the PV-LAC ESA project [7]. When comparing against ground-based measurements obtained from the aerosol robotic network (AERONET [29]), satellite observations are collocated within a ±30-min temporal window. As the AOT is not delivered at 550 nm in the AERONET dataset, the AOT is extrapolated at the wavelength of interest using the Angstrom exponent obtained from AERONET measurements in the 440 and 670 nm. Similar validation exercises of CISAR applied to satellite observations can be found in [8,21].
3. Results
3.1. Analysis of 20-Year Time Series over Key Areas
Following the harmonization of SPOT-VGT1, SPOT-VGT2, and PROBA-V, presented in Section 2.1, the CISAR algorithm has been applied to 20 years of data over four key areas of 5 × 5 km surrounding AERONET stations, listed in Table 2. The key areas are selected with the objective of representing a variety of land cover and aerosol types. In the case of Alta Floresta, the term mixed refers to the mixture of urban, forest, cropland and small water bodies that are present in the 5 km pixel surrounding the AERONET station.
Table 2.
Selected key areas surrounding AERONET stations.
The setup of the CISAR algorithm is identical across the sensors: only the observation-related quantities differ, such as the SRF and the radiometric uncertainty. However, the satellite observations are harmonized as explained in Section 2.1. The purpose of this exercise is to verify the consistency of the retrieved state variables among the three sensors through the time series retrieved by CISAR. The consistency across the three datasets is evaluated by comparing the retrieval performances against ground-based measurements, in this case, AERONET V3 L2 [29], in terms of APU statistics (Section 2.2.3). Satellite observations and ground-based measurements are temporally collocated within ±30 min. Time series of the AOT at 0.55 μm are also analyzed to observe any possible bias between the retrievals from the different sensors.
Table 3 shows the number of points, correlation, and APU statistics against the AERONET dataset over the four key areas listed in Table 2. Figure 5 shows the time series of the AOT retrieved by CISAR from VGT1, VGT2, and PROBA-V observations and the same quantity provided by the AERONET dataset over the four selected areas. For visual clarity purposes, the geometric monthly mean is shown. It should be noted here that PROBA-V Collection 1 data have been used in this exercise, which was the only release available during the execution of this project. However, one year of Collection 2 data, delivered preliminary by VITO, has been processed with the CISAR algorithm to assess the impact of this new collection. By comparing the performances against AERONET for both the retrieval from Collection 1 and Collection 2, it is found that the APU statistics associated with the CISAR retrieval improve by 34% on average. These improvements result, among others, from the improved cloud detection algorithm and radiometric characterization of the instrument, described in [30]. Collection 2 improved cloud masking algorithm reduces the cloud contamination, leading to high values of AOTs, such as the high value in Figure 5a. Similarly, the SPOT-VGT system is known to have a deficient cloud screening algorithm due to missing information in the thermal infrared part of the spectrum ([31,32]). The sub-optimal cloud masking in the satellite observation leads to large contamination in the retrieved AOT; large peaks can in fact be observed in Figure 5a far from the biomass burning events identified in the AERONET dataset. Residual overestimation of the aerosol load, probably due to cloud contamination, can be observed in all datasets retrieved with the CISAR algorithm. Despite the cloud masking limitations, related to the lack of a thermal infrared band, the retrieval from the three sensors with the CISAR algorithm is continuous over Alta Floresta and Venice. Over Banizoumbou and Beijing, the differences among the sensors become larger, especially at low AOTs (e.g., over Banizoumbou between 2004 and 2006). The latter is an arid area with dust aerosol particles and an extremely polluted urban area, respectively. In the former case, the contrast between surface and aerosols is reduced; in urban areas, the aerosol retrieval is complicated by the surface heterogeneity and the spatial distribution of the aerosols. As the information content associated with the AOT decreases, a non-accurate characterization of the radiometric uncertainty can lead to imbalances between the observation coming from the observation and the one coming from the prior information within the OE framework. This issue will affect mostly low AOTs, where the information content is reduced due to the limited contribution of the aerosols to the signal.
Table 3.
Number of points (n), correlation (R), and APU statistics obtained by comparison of CISAR retrieval with respect to AERONET over the selected key areas.
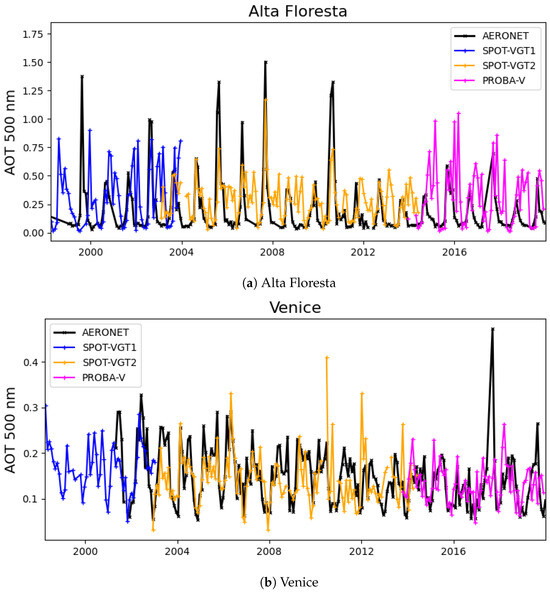
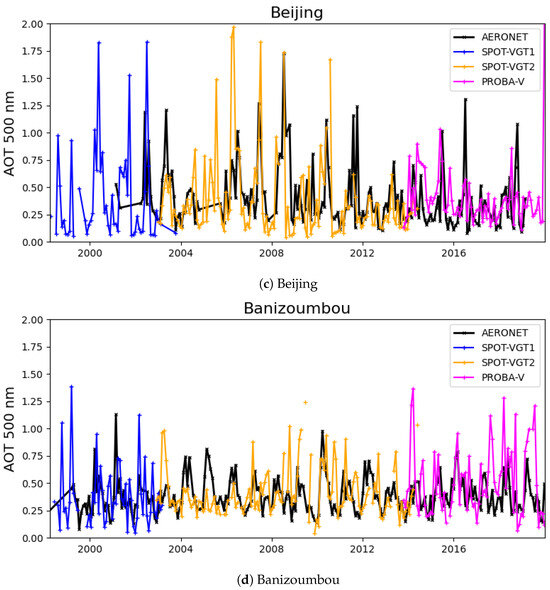
Figure 5.
Monthly AOT time-series over Alta Floresta, Venice, Beijing and Banizoumbou retrieved by CISAR and obtained from the AERONET dataset. The blue, orange, and magenta lines represent the CISAR retrieval from SPOT-VGT1, SPOT-VGT2, and PROBA-V observations, respectively. The black line represents the AERONET dataset.
Figure 6 represents the histogram of the distribution of the difference between CISAR and AERONET over all key areas. Despite the issues discussed above, no systematic bias is observed in Figure 6, and the accuracy is lower than 0.08 for all sensors. The different performances among the three datasets obtained with the CISAR algorithm could originate from slightly different acquisition geometry and overpass time [33], as well as different characterizations of the radiometric uncertainty; better characterization of this quantity would likely improve the continuity and consistency among the three datasets.
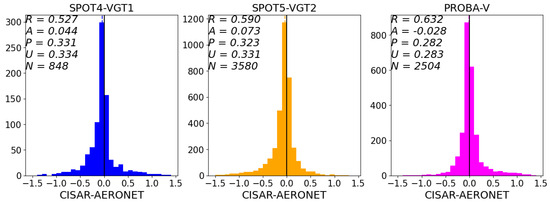
Figure 6.
Histogram of the bias distribution (CISAR-AERONET) over all stations in Table 2. The APU statistics, the correlation coefficient and the number of points are reported in the plots.
3.2. Global Processing at 5 km Resolution
One year of PROBA-V global acquisitions (Collection 2) was processed with the CISAR algorithm in 2019 at 5 km spatial resolution. As the PROBA-V mission has been designed to map land cover and vegetation growth, open oceans are excluded from this processing. However, coastal pixels and inland water are processed with the CISAR algorithm. The pixel aggregation at 5 km is performed as follows:
- If the 80% of sub-pixels are cloud-free only cloud-free observations are aggregated and the cloud mask is set to 0.
- If the 80% of sub-pixels are cloudy only cloudy observations are aggregated and the cloud mask is set to 1.
- Otherwise, all pixels are aggregated and the cloud mask is a number between 0 and 1, indicating the percentage of cloudy pixels.
3.2.1. AOT: Evaluation against Ground Observation
The time series of AOT over selected AERONET stations (according to data availability) have been extracted from the CISAR product and validated against AERONET measurements, temporally collocated within ±30 min. AERONET stations for validation purposes have been selected following criteria of data availability and surface homogeneity; CISAR is in fact intrinsically unable to correctly represent heterogeneous surfaces where 3D effects cannot be neglected, as it relies on a 1-dimensional radiative transfer model RTM where the surface is represented with the RPV surface reflectance model. Also, the presence of water bodies within a 5 km pixel could lead to overestimation of the AOT if sun glint conditions were met, as these observations would not be filtered out being the pixel classified as land. Finally, it should be taken into account that the heterogeneity of the surface increases at coarser spatial resolutions. A total of 125 AERONET stations have been selected around the globe, representing water, arid, urban, and vegetation land cover types. CISAR performances have then been evaluated in terms of APU statistics (Section 2.2.3), correlation against AERONET, and temporal evolution of the AOT using time series over selected targets. The APU statistics vary according to the land cover type, as shown in Table 4. Precision and uncertainty worsen, moving from darker to brighter surfaces, as the contrast between surface and atmosphere decreases. However, it should be noted that the available number of collocated observations between AERONET and CISAR retrieval varies largely among the different land cover types and that a small sample size can affect the reliability of any statistical analysis [34].
Table 4.
APU statistics and number of points according to the land cover type.
The overall evaluation of all available AERONET stations is shown in the scatterplot in Figure 7. Some overestimation at low AOT can be observed; the latter could originate from residual cloud contamination or could be explained by highly local aerosol events where the coarser spatial resolution from satellite observations could lead to a higher observed AOT compared to a ground-based measurement such as AERONET. Compared to the previous application of the CISAR algorithm to PROBA-V observations, performances are largely improved: the correlation is increased by a factor of 1.6, and the systematic underestimation at high values of AOT is reduced [8]. In fact, Figure 7 shows CISAR’s capabilities of retrieving high values of AOT (larger than 2.0). This feature can be observed, for instance, over highly polluted targets (Chiang Mai, Thailand) or during biomass burning events (Misamfu, Zambia). Figure 8 and Figure 9 show the high AOT values due to the high pollution over Chiang Mai as well as the larger number of fires in March [35] and the beginning of the biomass burning season over Misamfu in July/August. The seasonal occurrence of biomass burning in this region and the CISAR capability of detecting this phenomenon will also be analyzed in Section 3.2.2. Over Chiang Mai, the availability of AERONET observations strongly decreased after June 2019 (Figure 8). This might suggest the presence of clouds, as AERONET is only available in clear-sky conditions. Similarly, the CISAR algorithm shows fewer data points, meaning that either no aerosol retrieval was performed due to the presence of thick clouds, or the QI associated with CISAR retrieval is lower than 0.2 (and therefore filtered from this analysis). In particular, CISAR and AERONET measurements are not always collocated between June and September (e.g., early July and early August). Finally, in the hypothesis of cloud presence, it should also be kept in mind that CISAR retrieval is performed at 5 km spatial resolutions, and therefore effects such as the AOT enhancement due to aerosol swelling in the vicinity of clouds might impact the measurement, compared to a columnar ground-based measurement such as AERONET. Despite the differences observed over Chiang Mai after June, the ability of CISAR to correctly retrieve the temporal evolution of aerosols extends to low values of AOT as well, as it can be observed in Figure 9 during May and June, where CISAR shows a very good temporal agreement with the AERONET database, despite the small magnitude of the measured AOT (lower than 0.2).
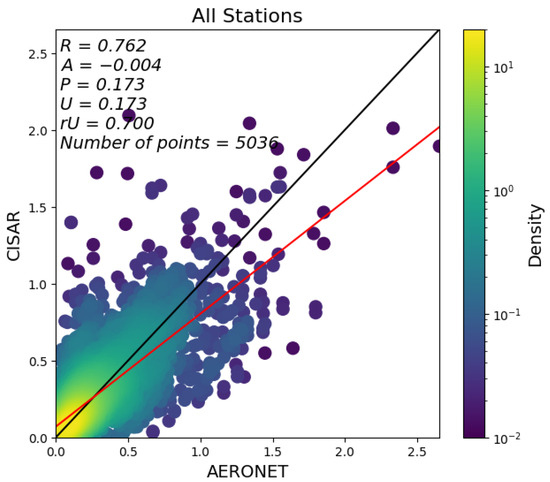
Figure 7.
Evaluation of CISAR AOT at 0.55 μm (y axis) against AERONET V3 L2.0 (x axis) over all selected stations. The solid red line represents the regression line.
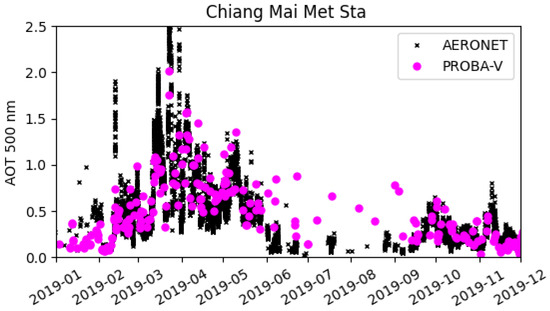
Figure 8.
Time series of the AOT retrieved by CISAR and delivered by AERONET dataset over Chiang Mai, Thailand.
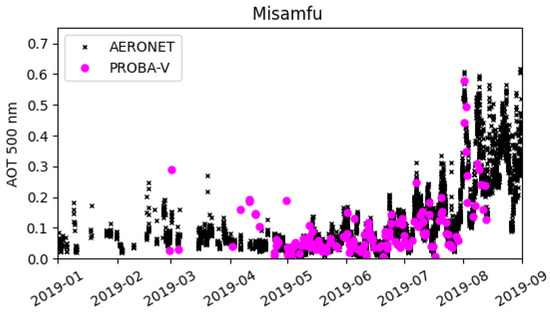
Figure 9.
Same as Figure 8 but over Misamfu, Zambia.
3.2.2. AOT: Monthly Mean Evaluation
Monthly aggregated Level-3 products are obtained from Level-2 products by averaging the retrieval in a 1-month time window. The average is weighted by the QI to maximize the quality of the retrieval. Level-3 products offer an additional tool to assess CISAR’s capability to detect seasonal trends. CISAR’s performances in retrieving correctly the AOT magnitude, temporal evolution, and spatial consistency are here evaluated against the CAMS reanalysis data [18]. Figure 10 shows the AOT at 550 nm monthly averages obtained from CISAR retrieval (left column), the CAMS dataset (mid-column), and the difference between the two products (right column).
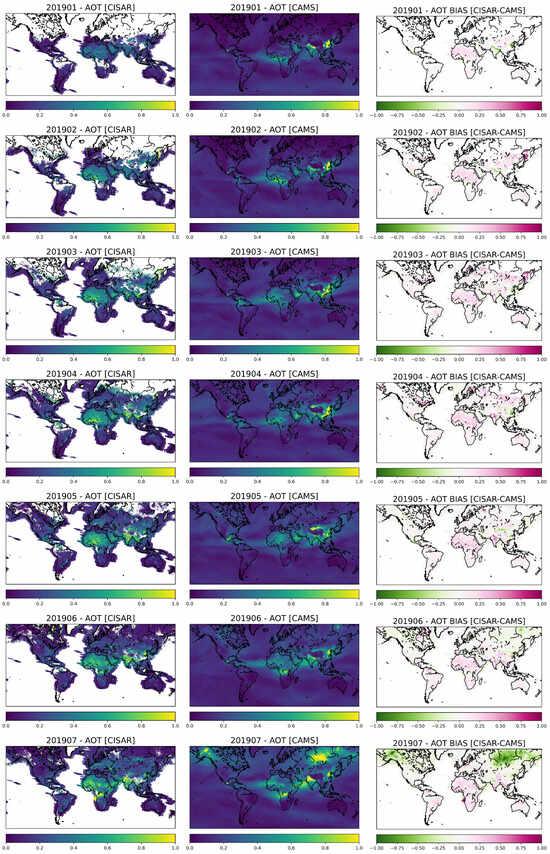
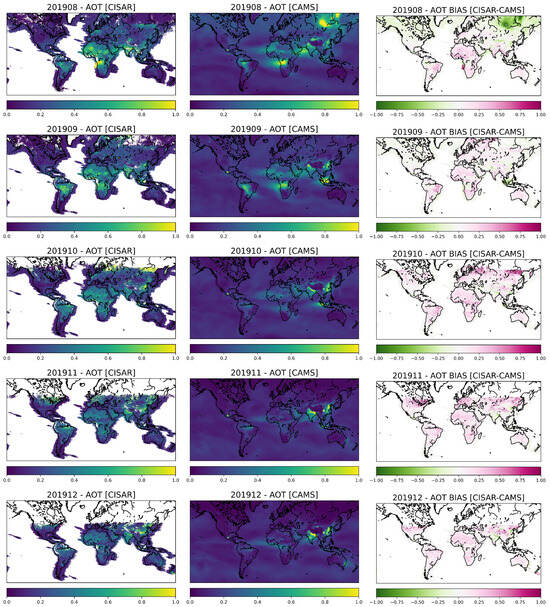
Figure 10.
AOT Monthly mean obtained from the CISAR retrieval applied to PROBA-V (left column) and from the CAMS reanalysis dataset (mid-column). The right column shows the difference between the two datasets.
Despite some differences in the magnitude of the AOT, CISAR identifies seasonal trends such as the increased dust AOT over North Africa and Arabia between March and June, the biomass burning in Central Africa with its maximum activity during August, the fire season in South America during August and September and the bushfires in Australia starting from November. The ability of CISAR to retrieve the biomass burning season over Africa has also been observed in Section 3.2.1, where the AOT time series over Misamfu, Zambia, shows increased aerosol load in August, in good agreement with the AERONET database. At latitudes larger than CISAR shows a larger absolute bias with respect to CAMS compared to the rest of the globe. This issue originates from the prior information on the surface reflectance used by the algorithm. This information is in fact taken from a climatology obtained from MODIS MCD19A3 albedo product [36], averaging seasonal data over 10 years (2010 to 2020). This climatology is loaded at the beginning of the processing, i.e., January 2019, thus selecting the corresponding winter data, where data at high latitudes are missing because of low illumination conditions. Therefore, when the CISAR algorithm starts processing high latitudes, the prior on the surface reflectance is corrupted, and a few accumulation periods are needed for CISAR to be able to retrieve a reliable surface reflectance. This issue has been addressed in newer versions of the algorithm. Unfortunately, however, given contractual constraints, it has not been possible to reprocess the PROBA-V data on the MEP. Finally, CISAR seems to constantly underestimate the aerosol load over China and to overestimate the AOT over North Africa with respect to CAMS. From Figure 10, it can be seen that the region around China remains unprocessed for most of the time series, as these pixels are flagged as clouds by the PROBA-V cloud mask. This could originate from high aerosol loads being classified as clouds; in this case, the prior on the OT will be set to a value according to the method described in Luffarelli et al. [21], with a prior on the COT larger than 0. The CISAR algorithm would then likely associate the high OT with a cloud and thus not be able to retrieve the high values of AOT, resulting in the underestimation of the Level-3 product. The overestimation over bright surfaces is a common issue in aerosol retrieval algorithms from satellite observations due to the decreased contrast between atmosphere and surface and the resulting decrease in the information content associated with the sensor observation. Also, CAMS tends to underestimate the maximum value of the dust AOT [37]. Despite some regional differences in the two datasets, such as over China, where CISAR seems to underestimate the aerosol load, and North Africa, where a constant positive bias can be observed due to decreased contrast between atmosphere and surface, CISAR does not show any systematic bias when compared to CAMS.
3.2.3. Case Study 1: Australian Fires
During the 2019–2020 bushfire season in Australia, also called the Black Summer, more than 60 million acres were burned. From September 2019 to March 2020, fires heavily impacted various regions of the state of New South Wales. These bushfires have been observed by several remote sensing instruments, including PROBA-V. The CISAR algorithm applied to PROBA-V correctly identifies the high AOT values originating on the land and propagating towards the sea. Figure 11 shows the AOT retrieval obtained from CISAR applied to PROBA-V (left column), MAIAC applied to MODIS (mid-column), and the CAMS datasets (right column). The MAIAC algorithm shares some similarities with the CISAR algorithm, as it relies on the assumption of slow temporal variation of the surface reflectance to retrieve the surface bidirectional reflectance distribution function (BRDF) and discriminate the contribution of the atmosphere. It should be noted that CISAR retrieval is performed at a spatial resolution of 5 km, while MAIAC is applied to 1 km resolution data, and CAMS is provided at 40 km. Both the retrieval obtained from CISAR applied to PROBA-V and from MAIAC applied to MODIS detect the high aerosol load between 2 December and 4 December 2019; however, MODIS retrieves a larger AOT. Nevertheless, the CAMS dataset over the same area does not show values larger than 1.5. Without ground observations close to the fire location, the true AOT cannot be established, and satellite-based measurements can only be qualitatively cross-validated. Despite the difference in retrieving the magnitude of the aerosol load associated with the bushfires, CISAR and MAIAC show very good spatial agreement over the observed region. It is worth noticing that MAIAC often does not retrieve the smoke over water, probably due to the latter being misclassified as a cloud, while CISAR shows a very nice continuity between land and water, showing the smoke’s spatial distribution over water.
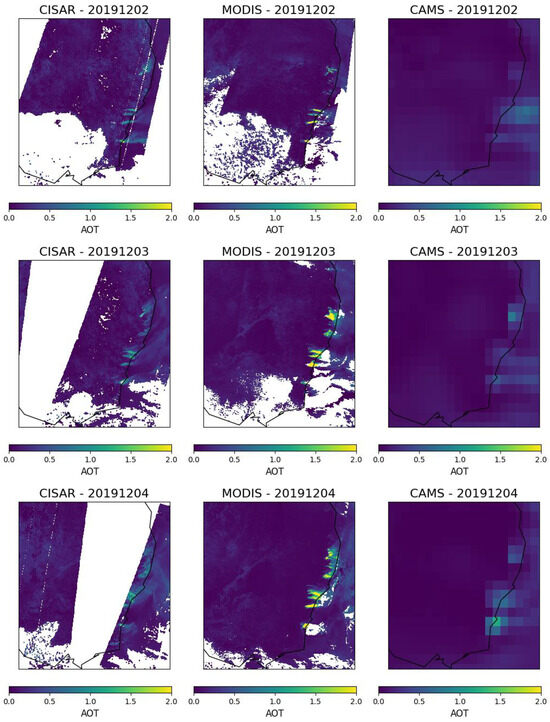
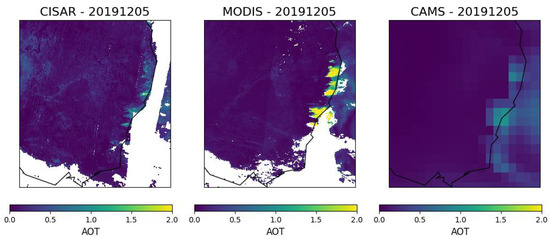
Figure 11.
AOT at 550 nm during the Australian bushfires in December 2019 observed by PROBA-V/CISAR (left column), MODIS/MAIAC (mid-column), and CAMS (right column).
3.2.4. Case Study 2: Surface Albedo over North Africa
An interesting case study is represented by the surface albedo retrieval over North Africa in the four PROBA-V bands. Figure 12 shows an example of the CISAR retrieval during the accumulation period starting on May 5th, 2019. The evolution of the isotropic BHR (also called white-sky albedo) throughout the year is available in the supplements (Video S1). The images in Figure 12 show that the CISAR BHR retrieval is spatially smooth and consistent with surface features such as desert areas and the Nile Delta. However, the surface albedo in the SWIR band shows larger noise than in the other bands. The reason for this difference is to be found in the characterization of the radiometric uncertainty; in the SWIR, the relative gain among the detectors shows larger residuals compared to the other bands, which causes the visible stripes in PROBA-V SWIR images. Unfortunately, this effect varies with the brightness of the targets: due to this non-linearity, characterizing and correcting this effect is not straightforward [38]. As anticipated in Section 2.2.1, it can be noted once again how the lack of an accurate characterization of the radiometric uncertainty affects the retrieval performances.
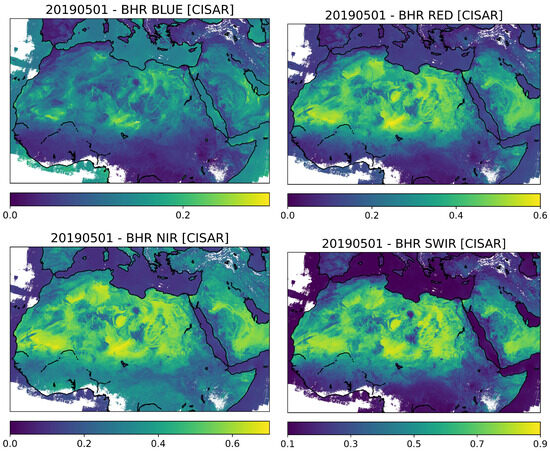
Figure 12.
CISAR retrieved BHR over North Africa in the four PROBA-V bands during the 15-day accumulation period starting on 1 May 2019.
The surface reflectance over the Sahel region undergoes seasonal changes following the rainy season and the consequent growth in vegetation, as it can be seen in the Video S1, showing the white-sky albedo retrieved by CISAR over the region of interest. Being independent from the observation and illumination geometries, the temporal evolution of the white-sky albedo, or isotropic BHR, is a suitable quantity to observe exclusively the changes in the surface reflectance properties, free from any illumination or viewing conditions. To observe this through time series, the BHR retrieved by CISAR/PROBA-V has been extracted over one pixel, chosen randomly in that region. Figure 13 shows that the albedo in the RED band decreases following the start of the rainy season in May, while the one in the NIR region starts to increase, as it is to be expected for growing vegetation. Changes in the surface reflectance in the Sahel region are expected to follow the total precipitation, shown in the shaded black lines in Figure 13; this is observed in the CISAR products, which is very stable in the first part of the year, before the rainy season starts in May 2023, and shows smooth and consistent variations during the wet season. It is also interesting to observe how the uncertainty associated with the CISAR product quickly decreases after the first accumulation periods as the prior information on the surface improves. The regression and the expansion of the vegetation in the Sahel region can be observed in the videos of the BHR retrieved by CISAR from PROBA-V observations available in supplements to this manuscript (Video S1).
Figure 13.
BHR retrieved by the CISAR algorithm from PROBA-V observations over one pixel, chosen randomly in the Sahel region. The shaded black lines represent the total precipitation obtained from the ERA5 reanalysis data at an hourly resolution (in mm) [24]. The colored solid lines represent CISAR retrieval, while the shaded area represents the associated uncertainty.
4. Discussion
This manuscript describes the activities performed in the framework of the ESA-funded SPAR@MEP project relative to the SPOT-VGT and PROBA-V archive stored on the MEP, developed by VITO. This activity aims to assess the possibility of retrieving a LTDR based on the 20-year SPOT-VGT and PROBA-V archive, using the CISAR algorithm to retrieve surface reflectance, aerosol, and cloud single-scattering properties. Prior to deriving a Level-2 product from the archive, it is necessary to perform a harmonization of the Level-1 products, according to the FIDUCEO guidelines. The harmonization method and the associated results are presented in Section 2.1. The proposed method relies on the use of a common calibration reference based on simulated radiances over a bright desert pseudo-invariant calibration site. The accuracy of this reference target has been estimated to be about 2.5% [19]. Despite the reliability of the common calibration reference, this harmonization would benefit from a better characterization of the three instruments’ radiometric uncertainty, particularly concerning the SRF characterization. The CISAR algorithm has been consequently applied to the harmonized 20-year dataset over four key areas surrounding the AERONET stations of Alta Floresta, Venice, Banizoumbou, and Beijing. The consistency among the Level-2 products obtained from the three sensors is subject to the radiometric characterization of the sensors. Especially in complicated cases such as the bright surface over Banizoumbou and the extremely high pollution over Beijing, where the information content is reduced, an accurate radiometric characterization is necessary to adequately balance the information coming from the observation and the prior information.
To assess CISAR suitability in retrieving a climate data record (CDR) from the MEP archive, one year of PROBA-V C2 observations has been processed at 5 km resolution. CISAR AOT Level-2 and Level-3 products have been evaluated against ground-based measurements from the AERONET network and model simulations from CAMS respectively, showing encouraging results. The surface retrieval over the Sahara and Sahel region reveals CISAR’s capability of monitoring seasonal changes over land surfaces from satellite observations, as the surface reflectance is retrieved completely free from any atmospheric effect. Both the surface product over the Sahara and Sahel region and the LTDR over the key areas show the impact of the lack of an accurate radiometric characterization. The dataset harmonization, based on the FIDUCEO guidelines, and, consequently, the consistency among the sensors would benefit from a full characterization of the radiometric, geometric, and spectral differences, as well from the quantification and correction of inter-sensor biases and sensor-induced spurious temporal drifts. Moreover, the FIDUCEO project discusses the need for a systematic uncertainty propagation accounting for the different nature of the uncertainty (random, structured, systematic) and proposes a method to develop the full uncertainty diagram starting from the measurement equation [10]. The advantages of the proposed method have been successfully demonstrated in independent studies, such as [39].
5. Conclusions
The results obtained in the framework of the SPAR@MEP project are very encouraging and advocate for continuing the exploitation of this archive to support climate monitoring, subject to some additional work, notably a better characterization of the instruments’ radiometric uncertainty. It is thus desirable to generate a Fundamental Data Record (FDR) from the SPOT-VGT and PROBA-V Level-1 datasets. The CISAR algorithm, implementing a strict mathematical framework for uncertainty propagation, would then open the possibility of generating a long-term CDR from the harmonized dataset and quantifying the added value of the new FDR. These activities will be performed within the upcoming FDR4VGT ESA project, which aims at ensuring long-term data preservation and valorization of the MEP archive, improving consistency, enhancing harmonization and temporal stability, providing uncertainty estimates at pixel level and generating a temporally stable and harmonized data record of reflectances at TOA and BOA level to be used as input for climate studies.
Supplementary Materials
The following supporting information can be downloaded at: https://www.mdpi.com/article/10.3390/rs15215109/s1, Video S1: CISAR retrieved BHR over North Africa in the four PROBA-V bands.
Author Contributions
Conceptualization, M.L. and Y.G.; Section 2.1, Y.G.; Results, M.L.; writing—original draft, M.L. and Y.G.; writing—review and editing, M.L. and Y.G.; software, M.L. and L.F.; data processing L.F.; scientific advisor F.N. and E.D.G. All authors have read and agreed to the published version of the manuscript.
Funding
This research was funded by ESA Project SPAR@MEP under the contract 4000128001/19/I-NS.
Data Availability Statement
The Global Product at 5 km described in Section 3.2 is available on the Zenodo repository, together with the Product User Guide. Aerosol Cloud products are available at https://doi.org/10.5281/zenodo.7462676. Surface products are available at https://doi.org/10.5281/zenodo.7457917.
Conflicts of Interest
The authors declare no conflict of interest.
References
- Merchant, C.J.; Embury, O.; Rayner, N.A.; Berry, D.I.; Corlett, G.K.; Lean, K.; Veal, K.L.; Kent, E.C.; Llewellyn-Jones, D.T.; Remedios, J.J.; et al. A 20 Year Independent Record of Sea Surface Temperature for Climate from Along-Track Scanning Radiometers. J. Geophys. Res. Ocean. 2012, 117. Available online: https://onlinelibrary.wiley.com/doi/pdf/10.1029/2012JC008400 (accessed on 22 October 2023). [CrossRef]
- Dierckx, W.; Sterckx, S.; Benhadj, I.; Livens, S.; Duhoux, G.; Van Achteren, T.; Francois, M.; Mellab, K.; Saint, G. PROBA-V mission for global vegetation monitoring: Standard products and image quality. Int. J. Remote Sens. 2014, 35, 2589–2614. [Google Scholar] [CrossRef]
- Goor, E.; Dries, J.; Daems, D.; Paepen, M.; Niro, F.; Goryl, P.; Mougnaud, P.; Della Vecchia, A. PROBA-V Mission Exploitation Platform. Remote Sens. 2016, 8, 564. [Google Scholar] [CrossRef]
- Copernicus Climate Change Service (C3S). Available online: https://climate.copernicus.eu/ (accessed on 4 April 2023).
- Carrer, D.; Smets, B.; Ceamanos, X.; Roujean, J. Copernicus Global Land Operations: Vegetation and Energy. Algorithm Theoretical Basis Document. Surface Albedo 1 km. 2018. Available online: https://land.copernicus.eu/global/sites/cgls.vito.be/files/products/CGLOPS1_ATBD_SA1km-V1_I2.11.pdf (accessed on 22 October 2023).
- Ramon, D.; Jolivet, D.; Elias, T.; Compiègne, M. Algorithm Theoretical Basis Document: Atmospheric Correction. 2021. Available online: https://proba-v.vgt.vito.be/sites/probavvgt/files/downloads/PROBA-V_C2_Atmospheric_Correction_ATBD.pdf (accessed on 22 October 2023).
- Wolters, E.; Luffarelli, M.; Govaerts, Y.; Swinnen, E. PV-LAC: D6-A2, Aerosol Optical Thickness and Surface Reflectance Validation Report V2. 2018. Available online: https://earth.esa.int/eogateway/documents/20142/37627/PV-LAC-ATMO-validation-report-v2.pdf (accessed on 22 October 2023).
- Luffarelli, M.; Govaerts, Y. Joint retrieval of surface reflectance and aerosol properties with continuous variation of the state variables in the solution space—Part 2: Application to geostationary and polar-orbiting satellite observations. Atmos. Meas. Tech. 2019, 12, 791–809. [Google Scholar] [CrossRef]
- Dierickx, F. Chapter 6 Climate Change Uncertainties|Copernicus Climate Change Programme: User Learning Service Content. 2019. Available online: https://bookdown.org/floriandierickx/bookdown-demo/climate-change-uncertainties.html (accessed on 22 October 2023).
- Mittaz, J.; Merchant, C.J.; Woolliams, E.R. Applying principles of metrology to historical Earth observations from satellites. Metrologia 2019, 56, 032002. [Google Scholar] [CrossRef]
- Giering, R.; Quast, R.; Mittaz, J.P.D.; Hunt, S.E.; Harris, P.M.; Woolliams, E.R.; Merchant, C.J. A Novel Framework to Harmonise Satellite Data Series for Climate Applications. Remote Sens. 2019, 11, 1002. [Google Scholar] [CrossRef]
- Wolters, E.; Swinnen, E.; Toté, C.; Sterckx, S. SPOT-VGT Collection 3 Products User Manual 2016. Available online: https://publications.vito.be/2016-1034-spotvgt-collection-3-products-user-manual-v10.pdf (accessed on 22 October 2023).
- Wolters, E.; Dierckx, W.; Iordache, M.D.; Swinnen, E. PROBA-V Collection 1 User Manual 2023. Available online: https://proba-v.vgt.vito.be/sites/probavvgt/files/Products_User_Manual.pdf (accessed on 22 October 2023).
- Sterckx, S.; Adriaensen, S.; Dierckx, W.; Bouvet, M. In-Orbit Radiometric Calibration and Stability Monitoring of the PROBA-V Instrument. Remote Sens. 2016, 8, 546. [Google Scholar] [CrossRef]
- Merchant, C.J.; Paul, F.; Popp, T.; Ablain, M.; Bontemps, S.; Defourny, P.; Hollmann, R.; Lavergne, T.; Laeng, A.; de Leeuw, G.; et al. Uncertainty information in climate data records from Earth observation. Earth Syst. Sci. Data 2017, 9, 511–527. [Google Scholar] [CrossRef]
- Govaerts, Y.M. Sand Dune Ridge Alignment Effects on Surface BRF over the Libya-4 CEOS Calibration Site. Sensors 2015, 15, 3453–3470. [Google Scholar] [CrossRef]
- Govaerts, Y.; Sterckx, S.; Adriaensen, S. Use of simulated reflectances over bright desert target as an absolute calibration reference. Remote Sens. Lett. 2013, 4, 523–531. [Google Scholar] [CrossRef]
- Inness, A.; Ades, M.; Agustí-Panareda, A.; Barré, J.; Benedictow, A.; Blechschmidt, A.M.; Dominguez, J.J.; Engelen, R.; Eskes, H.; Flemming, J.; et al. The CAMS reanalysis of atmospheric composition. Atmos. Chem. Phys. 2019, 19, 3515–3556. [Google Scholar] [CrossRef]
- Govaerts, Y.; Nollet, Y.; Leroy, V. Radiative Transfer Model Comparison with Satellite Observations over CEOS Calibration Site Libya-4. Atmosphere 2022, 13, 1759. [Google Scholar] [CrossRef]
- Emde, C.; Buras-Schnell, R.; Kylling, A.; Mayer, B.; Gasteiger, J.; Hamann, U.; Kylling, J.; Richter, B.; Pause, C.; Dowling, T.; et al. The libRadtran software package for radiative transfer calculations (version 2.0.1). Geosci. Model Dev. 2016, 9, 1647–1672. [Google Scholar] [CrossRef]
- Luffarelli, M.; Govaerts, Y.; Franceschini, L. Aerosol Optical Thickness Retrieval in Presence of Cloud: Application to S3A/SLSTR Observations. Atmosphere 2022, 13, 691. [Google Scholar] [CrossRef]
- Rahman, H.; Pinty, B.; Verstraete, M.M. Coupled surface-atmosphere reflectance (CSAR) model. 2. Semiempirical surface model usable with NOAA Advanced Very High Resolution Radiometer Data. J. Geophys. Res. 1993, 98, 20791–20801. [Google Scholar] [CrossRef]
- Cox, C.; Munk, W. Measurement of the Roughness of the Sea Surface from Photographs of the Sun’s Glitter. J. Opt. Soc. Am. 1954, 44, 838–850. [Google Scholar] [CrossRef]
- Hersbach, H.; Bell, B.; Berrisford, P.; Hirahara, S.; Horányi, A.; Muñoz-Sabater, J.; Nicolas, J.; Peubey, C.; Radu, R.; Schepers, D.; et al. The ERA5 global reanalysis. Q. J. R. Meteorol. Soc. 2020, 146, 1999–2049. [Google Scholar] [CrossRef]
- Levy, R.C.; Mattoo, S.; Munchak, L.A.; Remer, L.A.; Sayer, A.M.; Patadia, F.; Hsu, N.C. The Collection 6 MODIS aerosol products over land and ocean. Atmos. Meas. Tech. 2013, 6, 2989–3034. [Google Scholar] [CrossRef]
- Lyapustin, A.; Wang, Y.; Korkin, S.; Huang, D. MODIS Collection 6 MAIAC Algorithm. Atmos. Meas. Tech. 2018, 11, 5741–5765. [Google Scholar] [CrossRef]
- Bevan, S.; North, P.; Los, S.; Grey, W. A global dataset of atmospheric aerosol optical depth and surface reflectance from AATSR. Remote Sens. Environ. 2012, 116, 199–210. [Google Scholar] [CrossRef]
- Claverie, M.; Vermote, E.F.; Franch, B.; Masek, J.G. Evaluation of the Landsat-5 TM and Landsat-7 ETM+ surface reflectance products. Remote Sens. Environ. 2015, 169, 390–403. [Google Scholar] [CrossRef]
- Giles, D.M.; Holben, B.N.; Eck, T.F.; Smirnov, A.; Sinyuk, A.; Schafer, J.; Sorokin, M.G.; Slutsker, I. Aerosol Robotic Network (AERONET) Version 3 Aerosol Optical Depth and Inversion Products. In Proceedings of the AGU Fall Meeting Abstracts, New Orleans, Louisiana, 11–15 December 2017; Volume 2017, p. A11O-01. [Google Scholar]
- Swinnen, E. PROBA-V Collection 2 Algorithm Change Document 2023. Available online: https://proba-v.vgt.vito.be/sites/probavvgt/files/downloads/PROBA-V_C2_Algorithm_Change_Document.pdf (accessed on 22 October 2023).
- Fensholt, R.; Nielsen, T.T.; Stigsen, S. Evaluation of AVHRR PAL and GIMMS 10-day composite NDVI time series products using SPOT-4 vegetation data for the African continent. Int. J. Remote Sens. 2006, 27, 2719–2733. [Google Scholar] [CrossRef]
- Swinnen, E.; Veroustraete, F. Extending the SPOT-VEGETATION NDVI Time Series (1998–2006) Back in Time with NOAA-AVHRR Data (1985–1998) for Southern Africa. IEEE Trans. Geosci. Remote Sens. 2008, 46, 558–572. [Google Scholar] [CrossRef]
- Swinnen, E.; Toté, C. Copernicus Global Land Operations “Vegetation and Energy”. 2020. Available online: https://land.copernicus.eu/global/sites/cgls.vito.be/files/products/CGLOPS1_QAR_NDVI1km-V3_I1.10.pdf (accessed on 22 October 2023).
- Buffo, A.; Alopaeus, V. Experimental determination of size distributions: Analyzing proper sample sizes. Meas. Sci. Technol. 2016, 27, 045301. [Google Scholar] [CrossRef]
- Janjai, S.; Núñez, M.; Masiri, I.; Wattan, R.; Buntoung, S.; Jantarach, T.; Promsen, W. Aerosol Optical Properties at Four Sites in Thailand. Atmos. Clim. Sci. 2012, 2, 441. [Google Scholar] [CrossRef]
- Lyapustin, A.Y.W. Mcd19a3 Modis/Terra+Aqua Brdf Model Parameters 8-Day l3 Global 1 km Sin Grid V006; Technical Report; NASA EOSDIS Land Processes Distributed Active Archive Center: Sioux Falls, SD, USA, 2018.
- Errera, Q.; Bennouna, Y.; Schulz, M.; Eskes, H.; Basart, S.; Benedictow, A.; Blechschmidt, A.M.; Chabrillat, S.; Clark, H.; Cuevas, E.; et al. Validation Report of the CAMS Global Reanalysis of Aerosols and Reactive Gases, Years 2003–2020; Copernicus Atmosphere Monitoring Service: Reading, UK, 2021. [Google Scholar] [CrossRef]
- Mackin, S.; Settle, J.; Warner, J.; Ramsay, A. Statistically Based Approach for Estimation of Sensor Performance Indicators. 2020. Available online: https://earth.esa.int/eogateway/documents/20142/1484253/Statistically-based-approach-for-estimation-of-sensor-performance-indicators-status-and-way-forward.pdf (accessed on 22 October 2023).
- Popp, T.; Mittaz, J. Systematic Propagation of AVHRR AOD Uncertainties—A Case Study to Demonstrate the FIDUCEO Approach. Remote Sens. 2022, 14, 875. [Google Scholar] [CrossRef]


Disclaimer/Publisher’s Note: The statements, opinions and data contained in all publications are solely those of the individual author(s) and contributor(s) and not of MDPI and/or the editor(s). MDPI and/or the editor(s) disclaim responsibility for any injury to people or property resulting from any ideas, methods, instructions or products referred to in the content. |
© 2023 by the authors. Licensee MDPI, Basel, Switzerland. This article is an open access article distributed under the terms and conditions of the Creative Commons Attribution (CC BY) license (https://creativecommons.org/licenses/by/4.0/).