Article

Using Multi-Spectral Remote Sensing for Flood Mapping: A Case Study in Lake Vembanad, India

1
Earth Observation Science and Applications, Plymouth Marine Laboratory, Plymouth PL1 3DH, UK
2
National Centre for Earth Observation, Plymouth Marine Laboratory, Plymouth PL1 3DH, UK
3
Central Marine Fisheries Research Institute, Kochi 682018, India
4
Nansen Environmental Research Centre (India), Kochi 682506, India
5
EUMETSAT, 64295 Darmstadt, Germany
6
National Institute of Oceanography, Kochi 682018, India
*
Author to whom correspondence should be addressed.
Remote Sens. 2023, 15(21), 5139; https://doi.org/10.3390/rs15215139
Submission received: 11 September 2023 / Revised: 18 October 2023 / Accepted: 24 October 2023 / Published: 27 October 2023
(This article belongs to the Section Remote Sensing in Geology, Geomorphology and Hydrology)

Abstract

:
Water is an essential natural resource, but increasingly water also forms a threat to the human population, with floods being the most common natural disaster worldwide. Earth Observation has the potential for developing cost-effective methods to monitor risk, with free and open data available at the global scale. In this study, we present the application of remote sensing observations to map flooded areas, using the Vembanad-Kol-Wetland system in the southwest of India as a case study. In August 2018, this region experienced an extremely heavy monsoon season, which caused once-in-a-century floods that led to nearly 500 deaths and the displacement of over a million people. We review the use of existing algorithms to map flooded areas in the Lake Vembanad region using the spectral reflectances of the green, red and near-infrared bands from the MSI sensor on board Sentinel-2. Although the MSI sensor has no cloud-penetrating capability, we show that the Modified Normalised Difference Water Index and the Automated Water Extraction Index can be used to generate flood maps from multi-spectral visible remote sensing observations to complement commonly used SAR-based techniques to enhance temporal coverage (from 12 to 5 days). We also show that local knowledge of paddy cultivation practices can be used to map the manoeuvring of water levels and exclude inundated paddy fields to improve the accuracy of flood maps in the study region. The flood mapping addressed here has the potential to become part of a solution package based on multi-spectral visible remote sensing with capabilities to simultaneously monitor water quality and risk of human pathogens in the environment, providing additional important services during natural disasters.

1. Introduction

Floods are the most common natural disaster worldwide, with over 3200 events reported in the last 20 years [1]. The Asian continent is most severely affected by natural disasters, with flood occurrences in India being among the highest-impact events [2]. Floods have the potential to destroy lives, displace populations, break down infrastructure, destroy sanitation facilities and impede access to food, clean water and medicine. Furthermore, flooding often leads to outbreaks of waterborne diseases such as cholera [3]. The United Nations Sustainable Development Goal (SDG) to “ensure healthy lives and promote well-being for all at all ages” (SDG-3) has the laudable target to end the epidemics of communicable diseases by 2030 (SDG Target 3.3) while strengthening the capacity of all countries, in particular developing countries, for early warning, risk reduction and management of national and global health risks (SDG indicator 3.d) [4]. In the context of natural disasters, strategies for attaining these targets must include improved responses to flooding, and a first step in the response must be to identify flooded areas.
In this study, we present the application of remote sensing to map flooded areas using the Vembanad-Kol-Wetland system in the southwest of India as a case study (Figure 1). The Vembanad-Kol-Wetland is the second-largest wetland system in India and is protected by both national and international treaties [5,6]. Despite its protected status, the region has experienced extensive development. Since the 1800s, large areas of wetland towards the south and east of Lake Vembanad have been reclaimed for rice production, and these paddy fields now form an integral part of the Vembanad-Kol-Wetland system [6,7]. The development of wetland agriculture has led to substantial changes in the hydrology of Lake Vembanad with consequences for both water quality and wetland functions, such as the ability to regulate floods [5,6,8]. Additional pressures from domestic waste and sewage, industrial pollution, eutrophication, and aquatic weed infestation [5,6] have degraded the ecosystem in Lake Vembanad, and the region is now considered one of the most polluted estuaries in India with high levels of suspended and dissolved matter, and prevalence of pathogenic bacteria [9,10,11,12].
In August 2018, Southwest India experienced an extremely heavy monsoon season (Figure 2), which caused major flooding in the Lake Vembanad region. Although flooding during the monsoon season is not uncommon in the region, the floods of August 2018 were described as a once-in-a-lifetime event with over 500 deaths and over 14 million people displaced in the state of Kerala [13,14]. Under such circumstances, accurate flood mapping is an essential service to support local authorities in selecting the most vulnerable areas for targeted rescue missions and for prioritising health care to avoid outbreaks of diseases [15]. Synthetic-aperture radar (SAR) on board Sentinel-1 is a satellite sensor that can provide such a service [16,17]. A variety of SAR-based techniques have been used to map the floods in August 2018 in Kerala, including supervised classification, image change detection and thresholding algorithms [18,19,20,21]. While SAR operates in both night and daytimes, and is impervious to weather conditions, the temporal coverage of Sentinel-1 in the Lake Vembanad region is relatively low, with a revisit time of 12 days. For rapid and effective mapping of floods, it is therefore important to consider the use of other satellite sensors to fill the gaps between consecutive Sentinel-1 overpasses.
Both ocean-colour and multi-spectral satellite sensors, including the Moderate Resolution Imaging Spectroradiometer (MODIS), Landsat 5, 7 and 8, and Sentinel-2, have been used to map surface water and floods [22,23,24,25]. The approach is based on the use of water index algorithms that utilise the difference between the weak reflectance of water in visible light and the strong absorption of water at infrared wavelengths to distinguish water from land, soil, vegetation and buildings [26]. Commonly used water index algorithms include the Normalised Difference Water Index, the modified version of this index and the Automated Water Extraction Index [27,28,29]. Similar to SAR-based approaches, a variety of methods can be used to map floods using multi-spectral visible radiometry, from simple thresholding techniques to machine learning methods [17,22,24,25]. The performance and accuracy of the different water index algorithms often depend on the specific satellite sensor to which the algorithm is applied to, as well as the geographical region and the environmental conditions in that region [22,24,25]. For example, the modified version of the Normalised Difference Water Index performs better in urban areas and for waters with high sedimentation [26,28]. It is therefore important that the method for water retrieval based on multi-spectral remote sensing observations is tuned to a specific region and/or environment [22,24]. We note that there are several limitations in the use of multi-spectral visible radiometry in the mapping of floods, of which the obstruction by cloud cover is the most important [22].
Here, we review the use of four existing algorithms to map water and land using the spectral reflectances of the green, red and infrared bands from the multi-spectral imager (MSI) sensor on board Sentinel-2 to map the flooded areas near Lake Vembanad, with August 2018 as our sample period. This method based on spectral water indices has previously been considered user-friendly and low in computational cost while offering efficient and reliable extraction of water bodies [26]. We test the accuracy of the Normalised Difference Water Index (NDWI), the Modified Normalised Difference Water Index (MNDWI), the Water Ratio Index (WRI) and the Automated Water Extraction Index (AWEI) to delineate flooded areas in the Kol-Vembanad-Wetland system in comparison with SAR-based techniques. In addition, we use local knowledge of paddy cultivation to identify regions that are water-logged on a seasonal basis. Although the MSI sensor cannot see through clouds, we show that remote sensing by multi-spectral visible radiometry can be used to generate flood maps to complement SAR-based techniques to enhance temporal coverage (~5 days). In addition, we highlight the possibilities of multi-spectral visible remote sensing in the application of water quality monitoring as well as risk mapping of environmental Vibrio cholerae incidence, which can provide additional, important services during natural disasters.

2. Materials and Methods
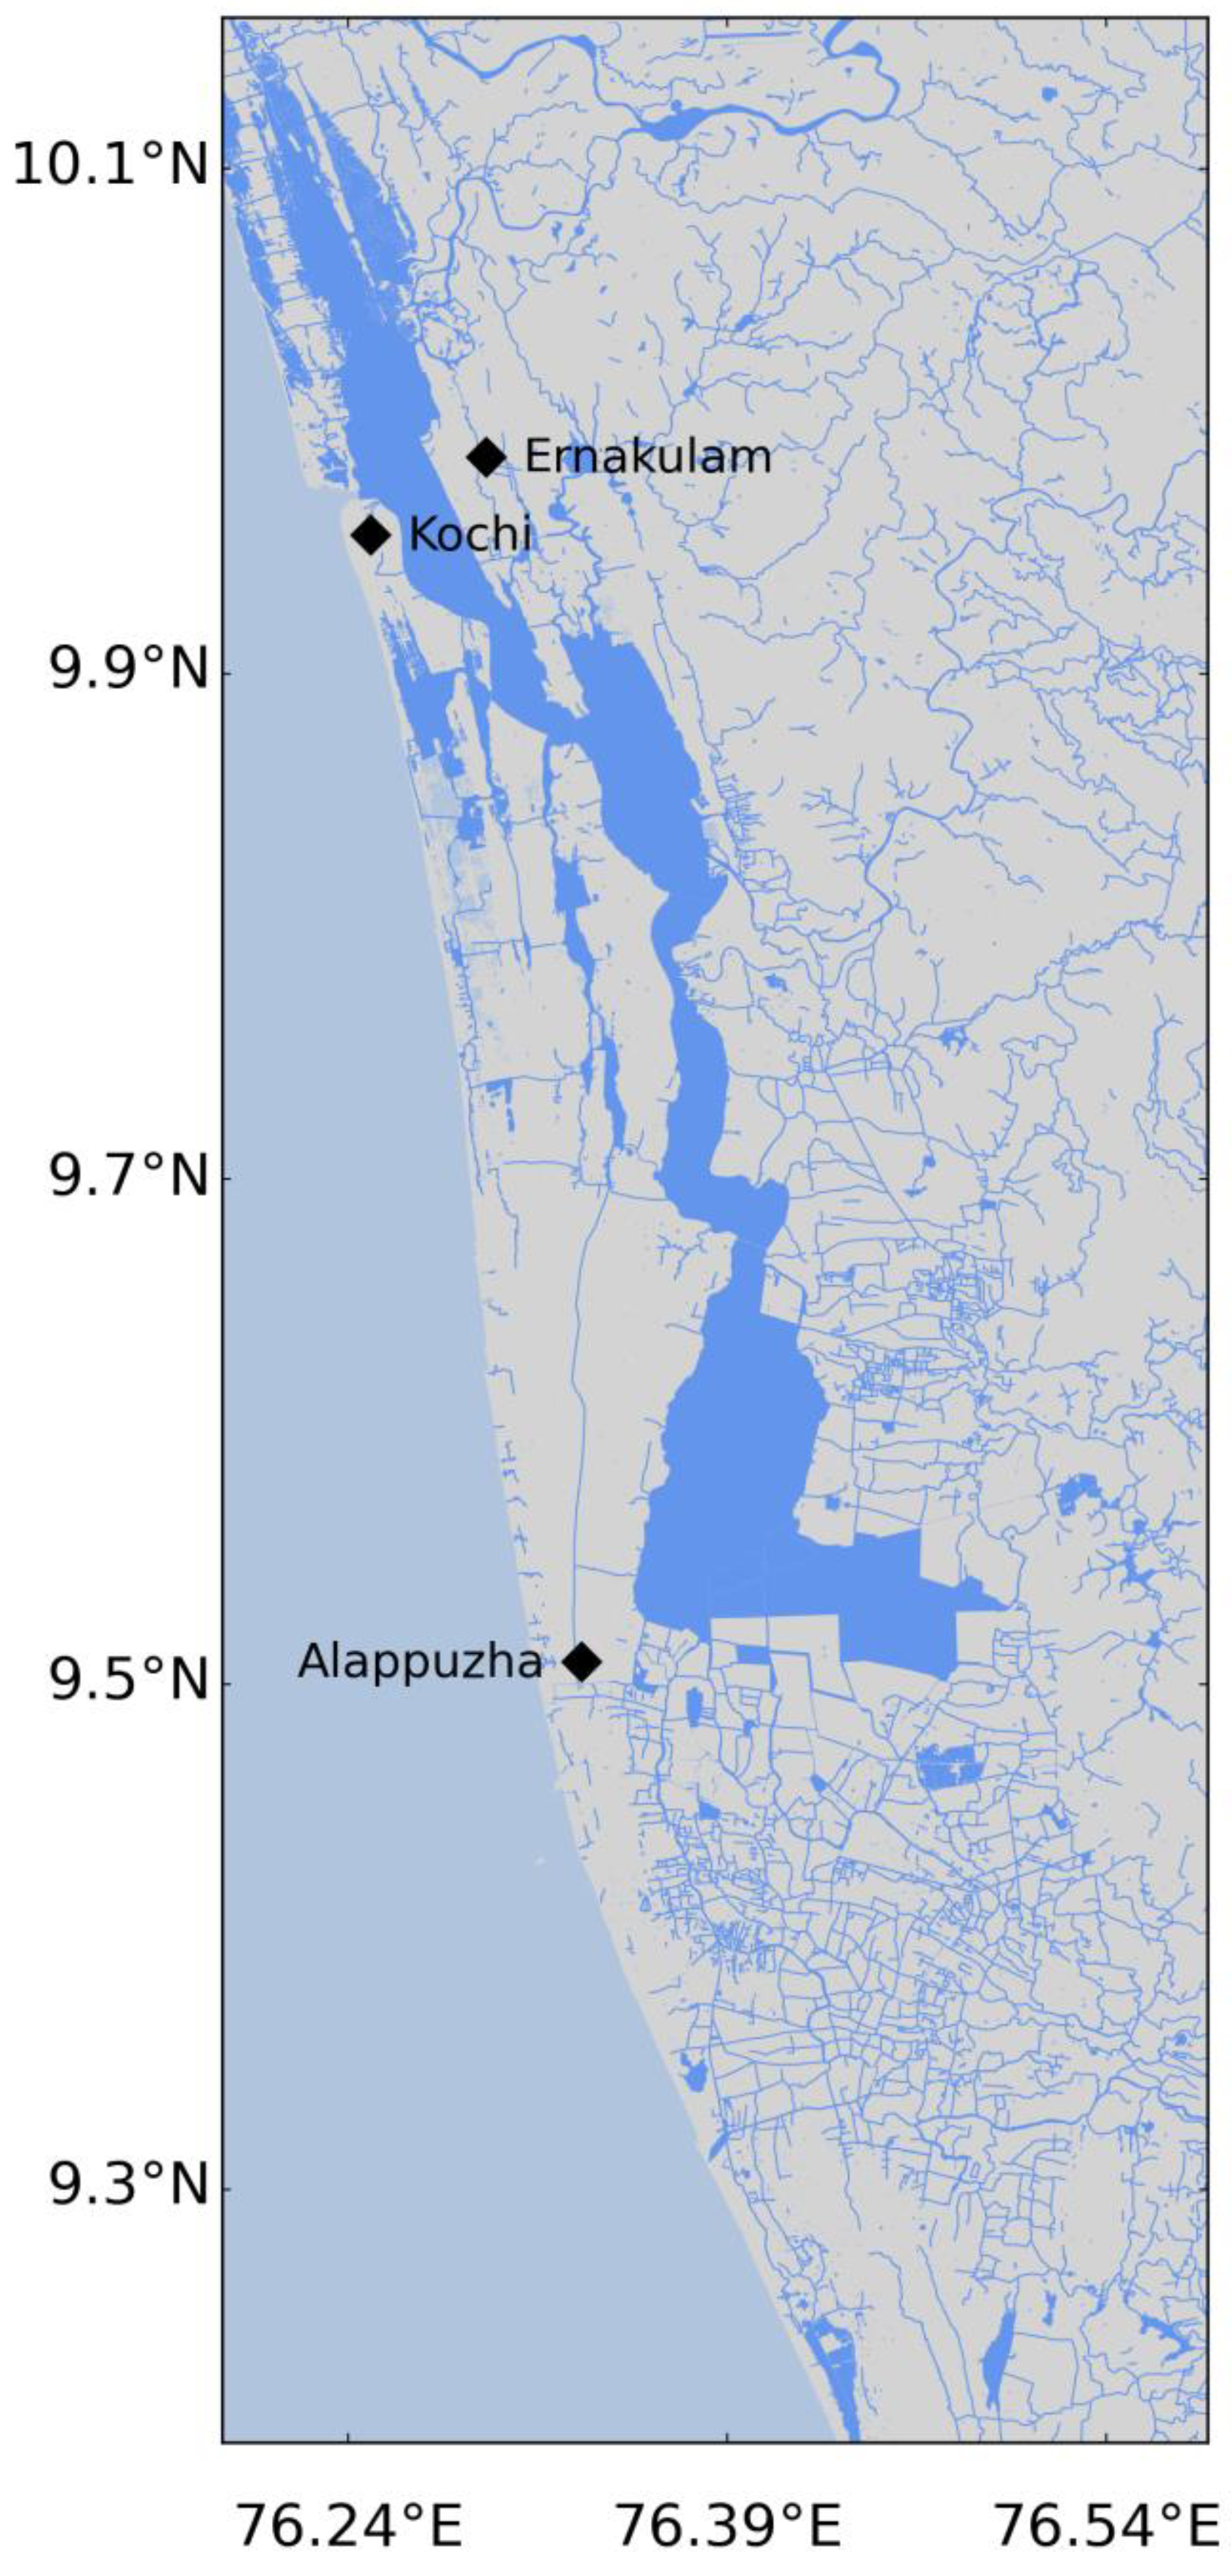
2.1. Study Area

The Vembanad-Kol-Wetland system is situated in the state of Kerala along the southwest coast of India. Lake Vembanad (09°20′–10°25′N, 76°00′–76°35′E) is the second-largest lake in India, stretching approximately 100 km and covering over 241 km2. The lake is semi-enclosed with connections to the Arabian Sea at Kochi (Figure 1) and further north at Ahzeekode, and is partitioned into northern and southern regions by a man-made barrier (Thanneermukkom Bund; Figure 1). Lake Vembanad is characterised by brackish waters in the north and fresh waters in the south, except during the south-west monsoon (June–September) when the entire lake becomes a freshwater basin [30]. The depth of the lake ranges from 1.5 to 6 m at most locations and the main shipping channels near Kochi are maintained at depths of 15 to 16 m via dredging [5]. Six rivers drain into Lake Vembanad with a total drainage area of ~12,000 km2 and the annual surface runoff (21,900 mm3) is ~30% of the total surface water resource of Kerala [8]. The annual seasonal cycle in Lake Vembanad is characterised by a dry season in winter (December–February), a spring inter-monsoon (March–May), and two wet seasons during the south-west monsoon (June–September) and the north-east monsoon (October–November).
Large-scale land reclamation for the construction of buildings and polder rice cultivation have impacted the water balance of the Vembanad-Kol-Wetland system, making it susceptible to extensive flooding due to high river discharges during the south-west monsoon [31]. Kuttanad, a low-lying region to the south of the Thanneermukkom Bund (Figure 1; extending over 874 km2), is especially vulnerable. This region is mostly below sea level and is subjected to severe flooding each year during the two wet seasons. The Thottapilly spillway system was commissioned in 1955 to reduce flooding, but the spillway cannot discharge more than one-third (i.e., ~550 m3 s−1) of its designed capacity [32]. Various factors, such as climate, topography, land use, human interventions and the low level of existing flood protection, are attributed to the increased flood risk in the Vembanad-Kol-Wetland system, but flood events have also become more severe in recent decades [33]. Flooding has serious negative impacts on rice production in the Lake Vembanad region, and the limited flood protection measures, such as the protective embankments of polders, are often breached during heavy rains [34]. Here, we focus on large-scale flooding during the monsoon season in August 2018, when unprecedented high levels of daily rainfall were recorded in the Lake Vembanad region (Figure 2).

2.2. Multi-Spectral Remote Sensing Observations

Sentinel-2A and -2B Multi-spectral imager (MSI) images for Lake Vembanad were obtained from the Copernicus Open Access Hub (https://scihub.copernicus.eu; accessed from 6 January 2021 onwards; level-1C, relative orbit number R019, tile numbers T43-PFM and -PFL; 2017–2021). Level-1C products were processed at 10 m spatial resolution using ACOLITE with the dark spectrum fitting approach to perform the atmospheric correction [35,36,37] and remote sensing reflectances were obtained for further analysis. Following standard procedures in ACOLITE, pixels with negative reflectances were masked. No other masks for land cover, cirrus clouds or cloud shadow were applied in ACOLITE. This choice was dictated by the available cloud masks being too severe, overly restricting the pixels available for flood mapping, even when visual inspection of the images revealed useful information on water extent. Instead, masks for cirrus and opaque clouds provided in the Level-1C data files were used to mask cloud cover for analysis of the flood maps. In total, 173 images for Sentinel-2A and -2B were processed between 2107–2019. Data coverage was typically lower from May to September due to dense and extensive cloud cover associated with the south-west monsoon season.

2.3. Water Index Algorithms

Processed Sentinel-2 data were used to determine the water cover in Lake Vembanad using existing water index algorithms. These algorithms are based on the weak reflectance of water at wavelengths in the visible light and the strong absorption at infrared wavelengths, which can be used to distinguish water from land, soil, vegetation and buildings [26]. In this study, four water index algorithms were used based on the green (560/559 nm for Sentinel-2A/-2B), red (665 nm), near-infrared (NIR; 833 nm), middle-infrared (MIR; 1614/1610 nm) and/or shortwave-infrared (SWIR; 2202/2186 nm) wavebands. The Normalised Difference Water Index (NDWI) was calculated according to McFeeters [27]:
NDWI = g r e e n NIR g r e e n + NIR ,
the Modified Normalised Difference Water Index (MNDWI) was calculated according to Xu [28]:
MNDWI = g r e e n MIR g r e e n + MIR ,
the Water Ratio Index (WRI) was calculated according to Shen and Li [38]:
WRI = g r e e n + r e d NIR + MIR ,
and the Automated Water Extraction Index (AWEI) was calculated according to Feyisa et al. [29]:
AWEI = 4 × ( g r e e n MIR ) ( 0.25 × NIR + 2.75 × SWIR ) .
NDWI and MNDWI provided values between −1 and +1, and AWEI provided values between −10 and +6, with positive values of these water indices typically classified as water [27,28,29]. The WRI provided positive values only, with values > 1 classified as water [38].

2.4. Sentinel-2 Flood Mapping

Although the water indices showed high accuracy (99.1–100%) for the mapping of surface waters [29,39], several studies have shown that accuracy may be improved by adjusting the threshold for water and non-water pixels [28,39]. In this study, the threshold for each water index was determined by analysis of the histograms of the multi-spectral remote sensing images that were used for the permanent water body map of Lake Vembanad (see below for dates; Figure S1). Corresponding to the inflection point in the histograms (e.g., the turning point in the histogram where concavity changes) for each water index, we used the following thresholds to distinguish between water and non-water pixels: −0.045 for NDWI, 0.14 for MNDWI, 1.55 for WRI and −0.064 for AWEI, with pixels where the water index was above the threshold being classified as water. Note that the thresholds used in this study for Lake Vembanad are more conservative than those reported in the literature [27,28,29,38,39]. We tested standard thresholds reported in the literature [27,28,29,38,39] and experimented with small deviations to our region-specific thresholds, but this did not result in higher accuracy of the flood maps. Using the threshold for each water index, a binary water index map was created with 1 representing water and 0 representing non-water pixels (Figure 3). A permanent water body map of Lake Vembanad under non-flood conditions was then created using clear-sky images from January to March, a period during the dry season when we expect a minimum water cover in Lake Vembanad with limited influence from rainfall and/or agricultural activities (i.e., intentional flooding of rice cultivation fields). Images from Sentinel-2A on 3 February 2017 and 25 March 2019 and from Sentinel-2B on 14 January 2018, 3 February 2018, 23 February 2018 and 9 January 2019 were used to create the permanent water body map. Pixels that were marked as water in all six clear-sky images for each of the binary water indices were assigned as water in the permanent water body map, and all other pixels were assigned as non-water (Figure 3). The permanent water body map of Lake Vembanad was compared with the binary water/non-water Sentinel-2 images to create flood maps, marking pixels that fall outside the baseline water extent in Lake Vembanad as flooded (Figure 3). For mapping the floods in August 2018, a Sentinel-2B image from 22 August 2018 was used.

2.5. Synthetic-Aperture Radar Observations

The flood mapping method based on multi-spectral remote sensing observations was compared to a commonly used method based on synthetic-aperture radar (SAR) observations. Sentinel-1A and -1B SAR images were retrieved from the Copernicus Open Access Hub (https://scihub.copernicus.eu; accessed on 25 June 2021; level-1C IW GRDH 1SDV data; 2018–2021). Level-1 Ground Range Detected (GRD) SAR products were processed at 10 m spatial resolution using the Sentinel Application Platform (SNAP) from the European Space Agency (ESA) following Kussul et al. [40] as recommended by the United Nations Space-based Information for Disaster Management and Emergency (SPIDER) portal (https://www.un-spider.org/advisory-support/recommended-practices/recommended-practice-radar-based-flood-mapping; accessed on 25 June 2021). In short, SAR images were calibrated using radiometric correction to obtain the radar backscatter coefficients, after which images were filtered to remove noise using a speckle filter (Lee, 7 × 7) in SNAP. Processed images were reprojected (WGS84) using a range-Doppler terrain correction algorithm and multiple tiles covering Lake Vembanad were combined and cropped using the mosaicking tool in SNAP.

2.6. Sentinel-1 Flood Mapping

The flood mapping based on SAR observations followed a similar approach to that described for the multi-spectral remote sensing observations, i.e., binary water indices of the radar backscatter coefficients were compared with a Sentinel-1 permanent water body map of Lake Vembanad (Figure 3). To separate water from non-water pixels in the processed Sentinel-1 images, a threshold of 0.04 was selected for the Lake Vembanad region based on the analysis of histograms of the radar backscatter coefficients (water pixels < 0.04 < non-water pixels) (Figure S1). A permanent water body map of Lake Vembanad with the minimum water cover was developed from five Sentinel-1 images (Sentinel-1A images from 6 March 2018, 7 December 2018, 31 December 2018, 19 March 2019 and 31 March 2019) following the approach detailed for the Sentinel-2 images. For flood mapping, the Sentinel-1 permanent water body map of Lake Vembanad was compared with the binary water/non-water radar backscatter images to create flood maps, marking pixels that fall outside the baseline water extent of Lake Vembanad as flooded area. For mapping the floods in August 2018, a Sentinel-1A image from 21 August 2018 was used, which was the closest image available to that obtained for Sentinel-2 (22 August 2018).

2.7. Accuracy Analysis

The accuracy of the flood mapping method based on multi-spectral remote sensing observations was assessed by comparing the Sentinel-1 and -2 images using the producer’s accuracy, the user’s accuracy, the overall accuracy, the critical success index and the kappa coefficient [21]. Calculations were based on a confusion matrix with flood and non-flood pixels (or water and non-water pixels for comparison of the permanent water body maps) in the Sentinel-1 and -2 data. To reduce the sensitivity of the accuracy analysis to the relatively large number of non-flood (or non-water) pixels, an equal number (10% of flood (or water) pixels, i.e., between 10,000–1,000,000 pixels) of flood (or water) and non-flood (or non-water) pixels were randomly selected to calculate the metrics. An initial comparison of the flood mapping methods was carried out for 29 January 2018, when both Sentinel-1 and -2 images were available. For the case study, the Sentinel-2 image from 21 August 2018 was compared with the closest Sentinel-1 image from 22 August 2022. For each image, the total area (amount of pixels) marked as water and/or flooded was also calculated.

2.8. Verification of Satellite-Based Flood Maps

The satellite-based flood maps were verified following flooding events in October 2021. Using information from local news outlets, areas of flooding and areas where no flooding was reported were identified on a Sentinel-1-based map from 16 October 2021. The areas where no flooding was reported were typically paddy cultivation fields that are waterlogged on a seasonal basis, especially in the Kuttanad region towards the south of Lake Vembanad. Following this observation, 17 different paddy fields to the south and east of Lake Vembanad were visited and a cultivation calendar was constructed using information from farmers and the local agricultural authorities. The identified paddy fields were mapped using Sentinel-2 observations and the total area of waterlogged paddy fields was estimated throughout the year using the cultivation calendar.

2.9. Ancillary Data

Daily rainfall data were obtained from the Climate Hazards Group Infrared Precipitation with Stations (CHIRPS) (https://data.chc.ucsb.edu/products/CHIRPS-2.0/; 2007–2018; accessed on 6 January 2021) at a 0.05° spatial resolution. CHIRPS provides near real-time quasi-global satellite- and field-observation-based precipitation estimates over land since 1981 [41]. The data were used to calculate a 7-day moving average of daily rainfall in the Lake Vembanad region for each year between 2007 and 2018.

3. Results

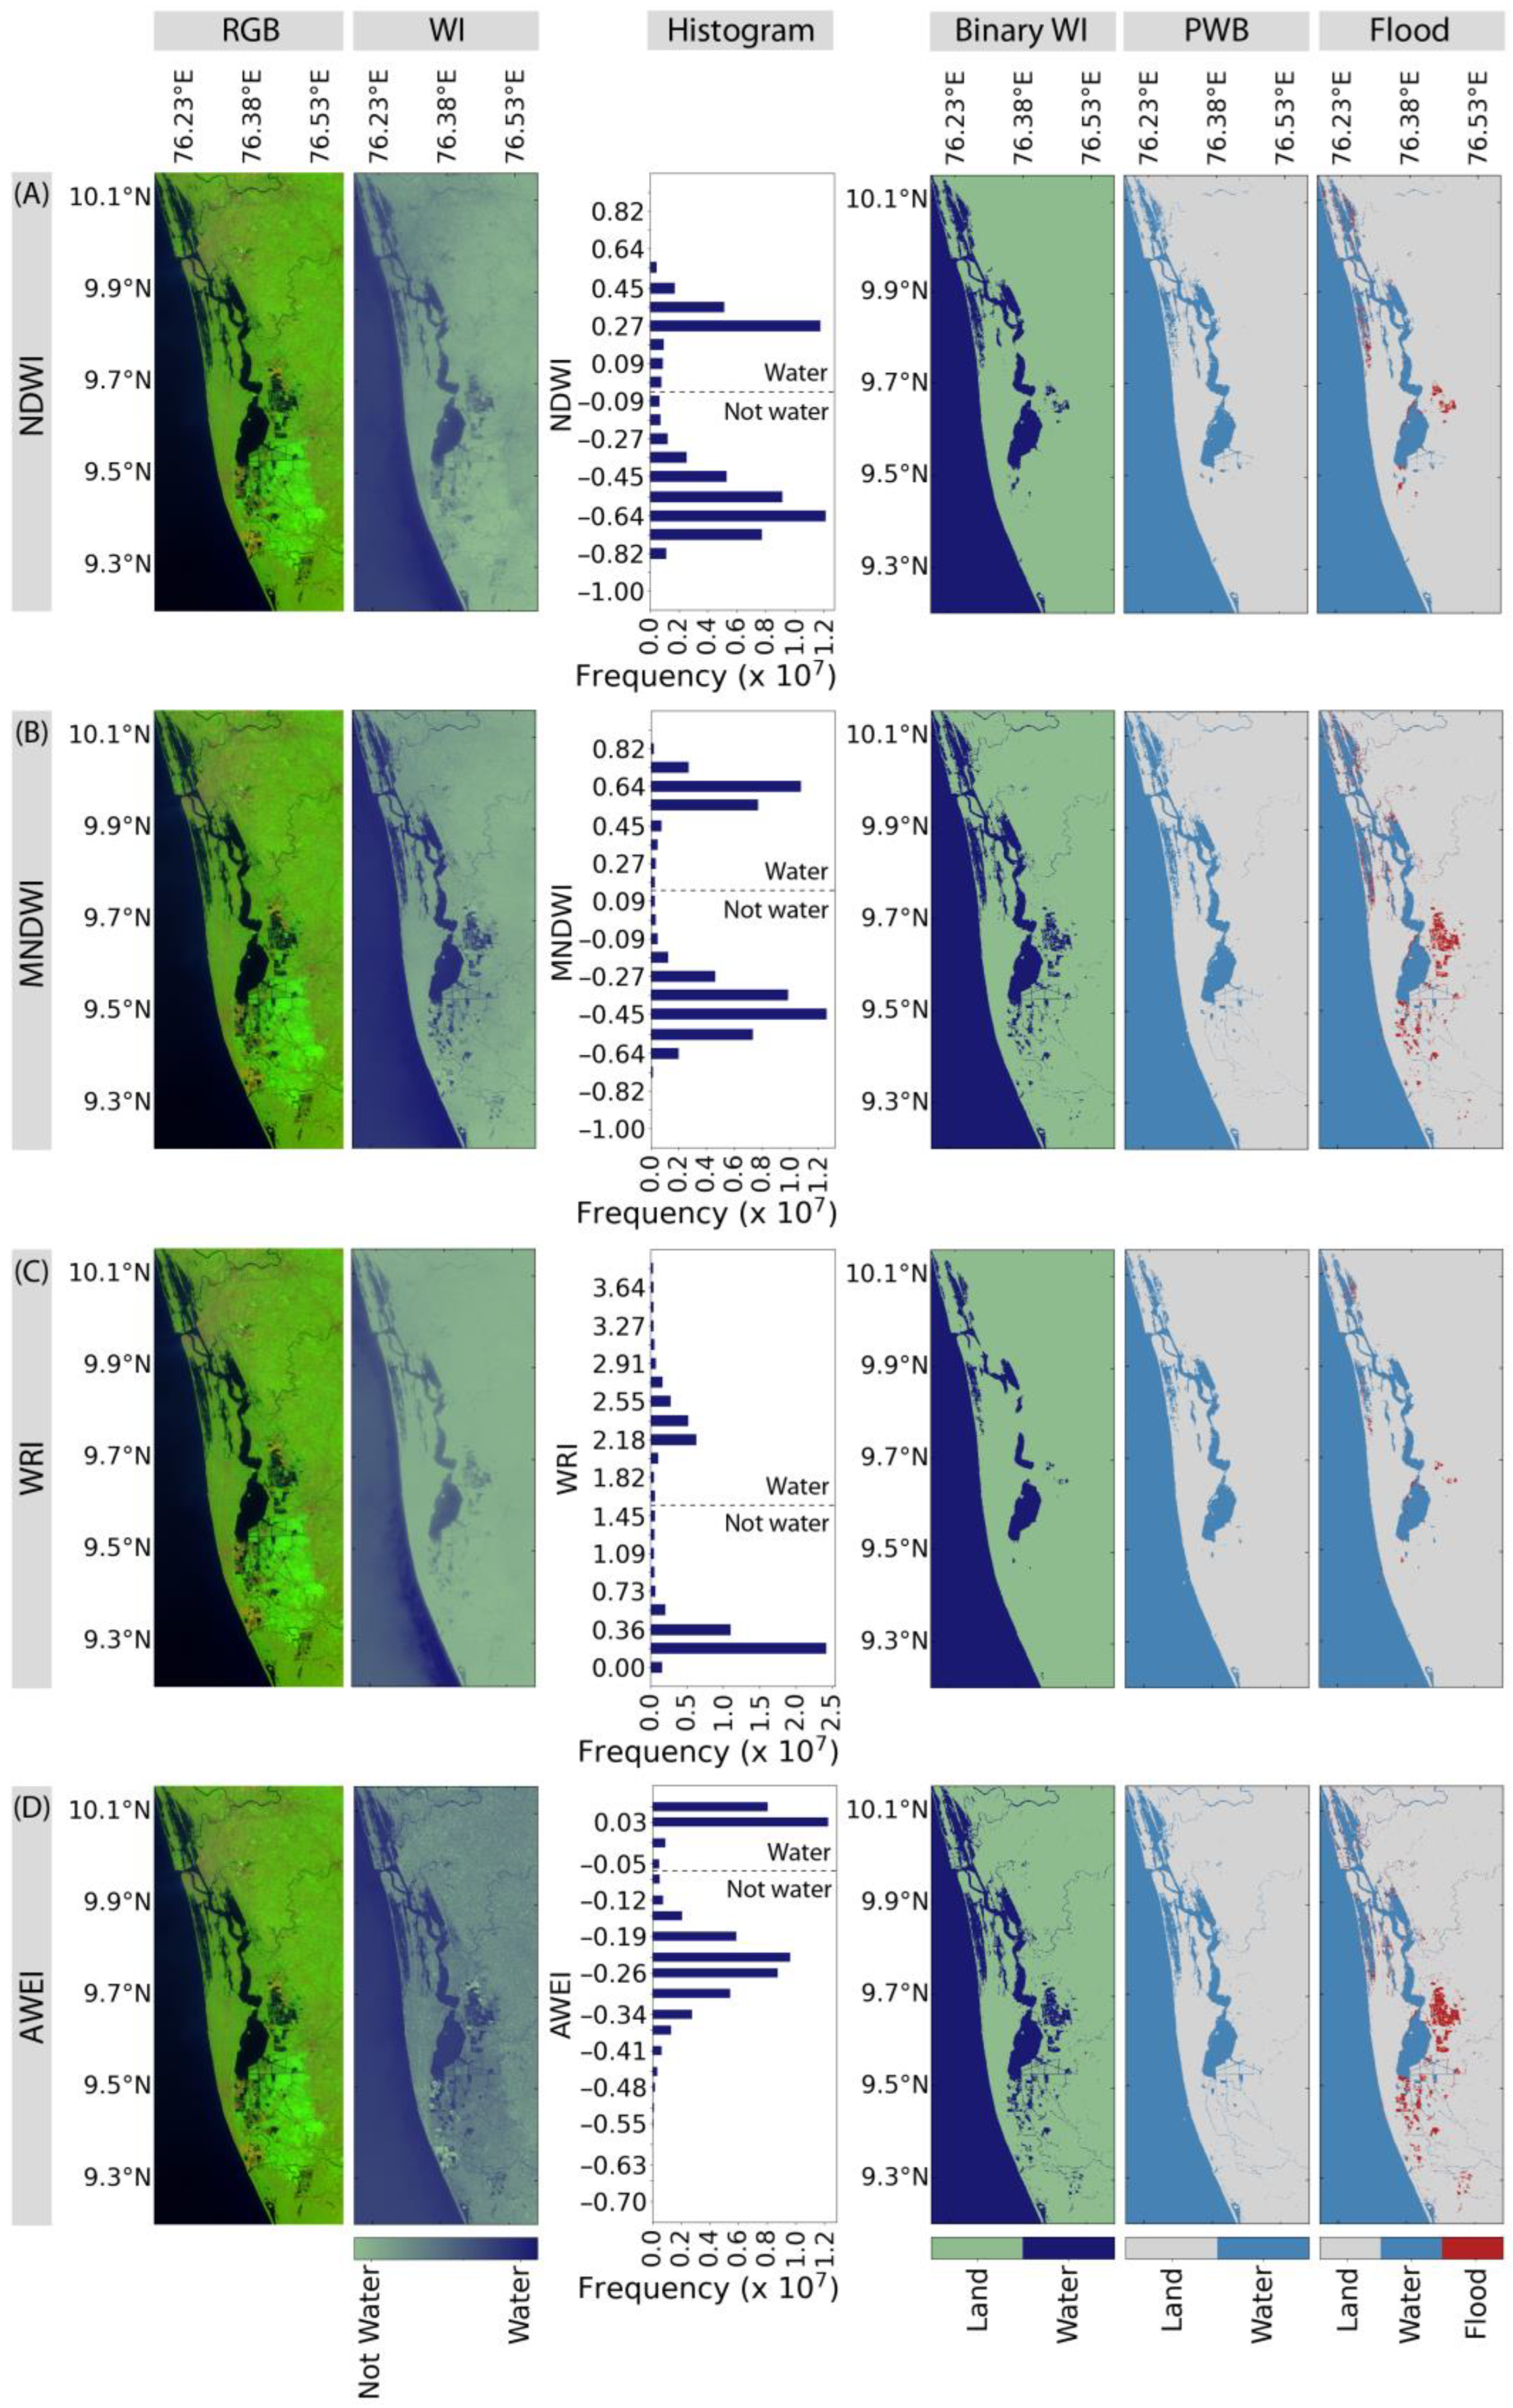
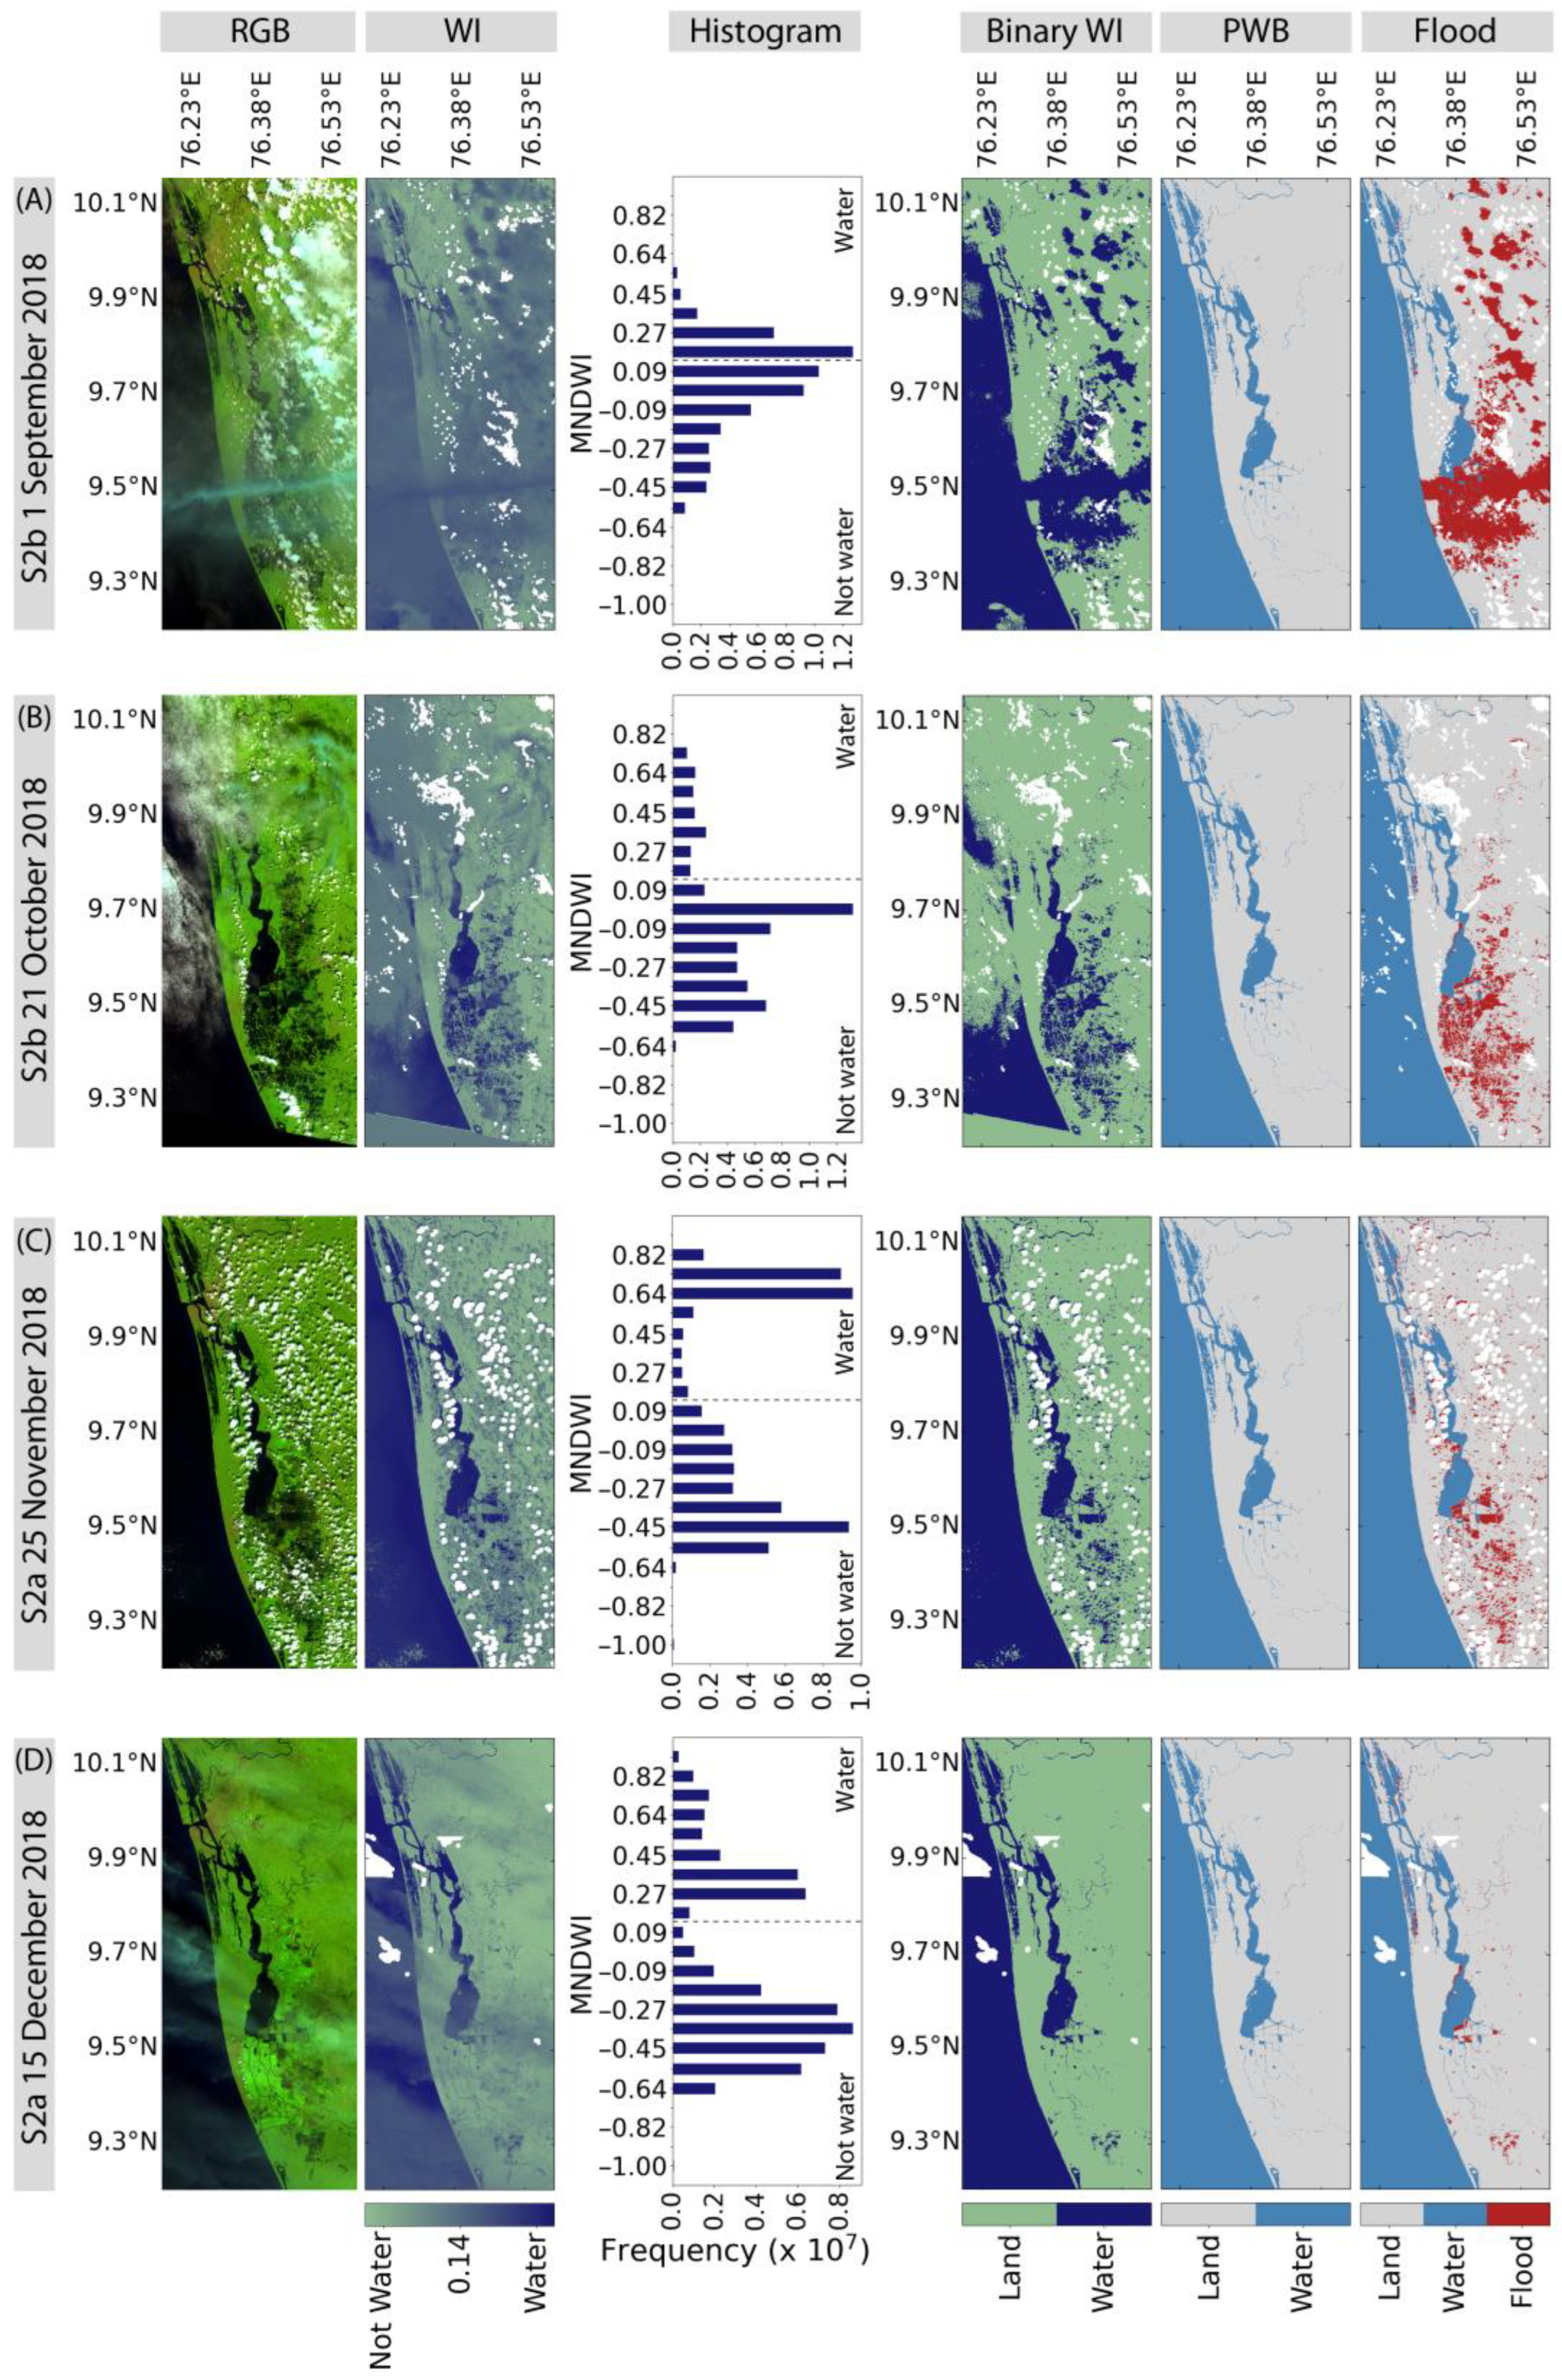
3.1. Application of Sentinel-2 Data for Flood Mapping

The application of Sentinel-2 multi-spectral remote sensing observations for flood mapping was explored using an image from 29 January 2018 (Figure 4), when cloud cover was low and both Sentinel-1 and -2 data were available, allowing comparison of multi-spectral remote sensing with the commonly used synthetic-aperture radar approach for flood mapping. Application of water index algorithms yielded detailed water-land maps for the Lake Vembanad region, with the highest contrast observed for the MNDWI, as evident in the water index maps and histograms (Figure 4). The analysis of the histograms showed that the thresholds used to distinguish water from non-water pixels on 29 January 2018 were appropriate for the NDWI, MNDWI and AWEI (Figure 4A,B,D), whereas the overall threshold used for the WRI was too conservative, leading to an underestimation of water pixels in the binary land-water map produced using this water index (Figure 4C). The permanent water body maps of NDWI, MNDWI and AWEI showed that the overall area of water cover in Lake Vembanad was between 267 and 353 km2, generally higher than that estimated from SAR observations (285 km2; Table 1). A comparison of the binary land-water maps from 29 January 2018 with the Lake Vembanad permanent water body map for NDWI, MNDWI and AWEI indicated between 38 and 132 km2 of flooding around the south and south-east of Lake Vembanad and near the coast to the south of Kochi (Figure 4A,B,D, Table 1). The limitations in the application of the overall threshold for WRI were also observed for the permanent water body map and flood map for this water index with a relatively low area of water cover and a limited number of pixels indicated as flooded on 29 January 2018 (Figure 4C, Table 1).

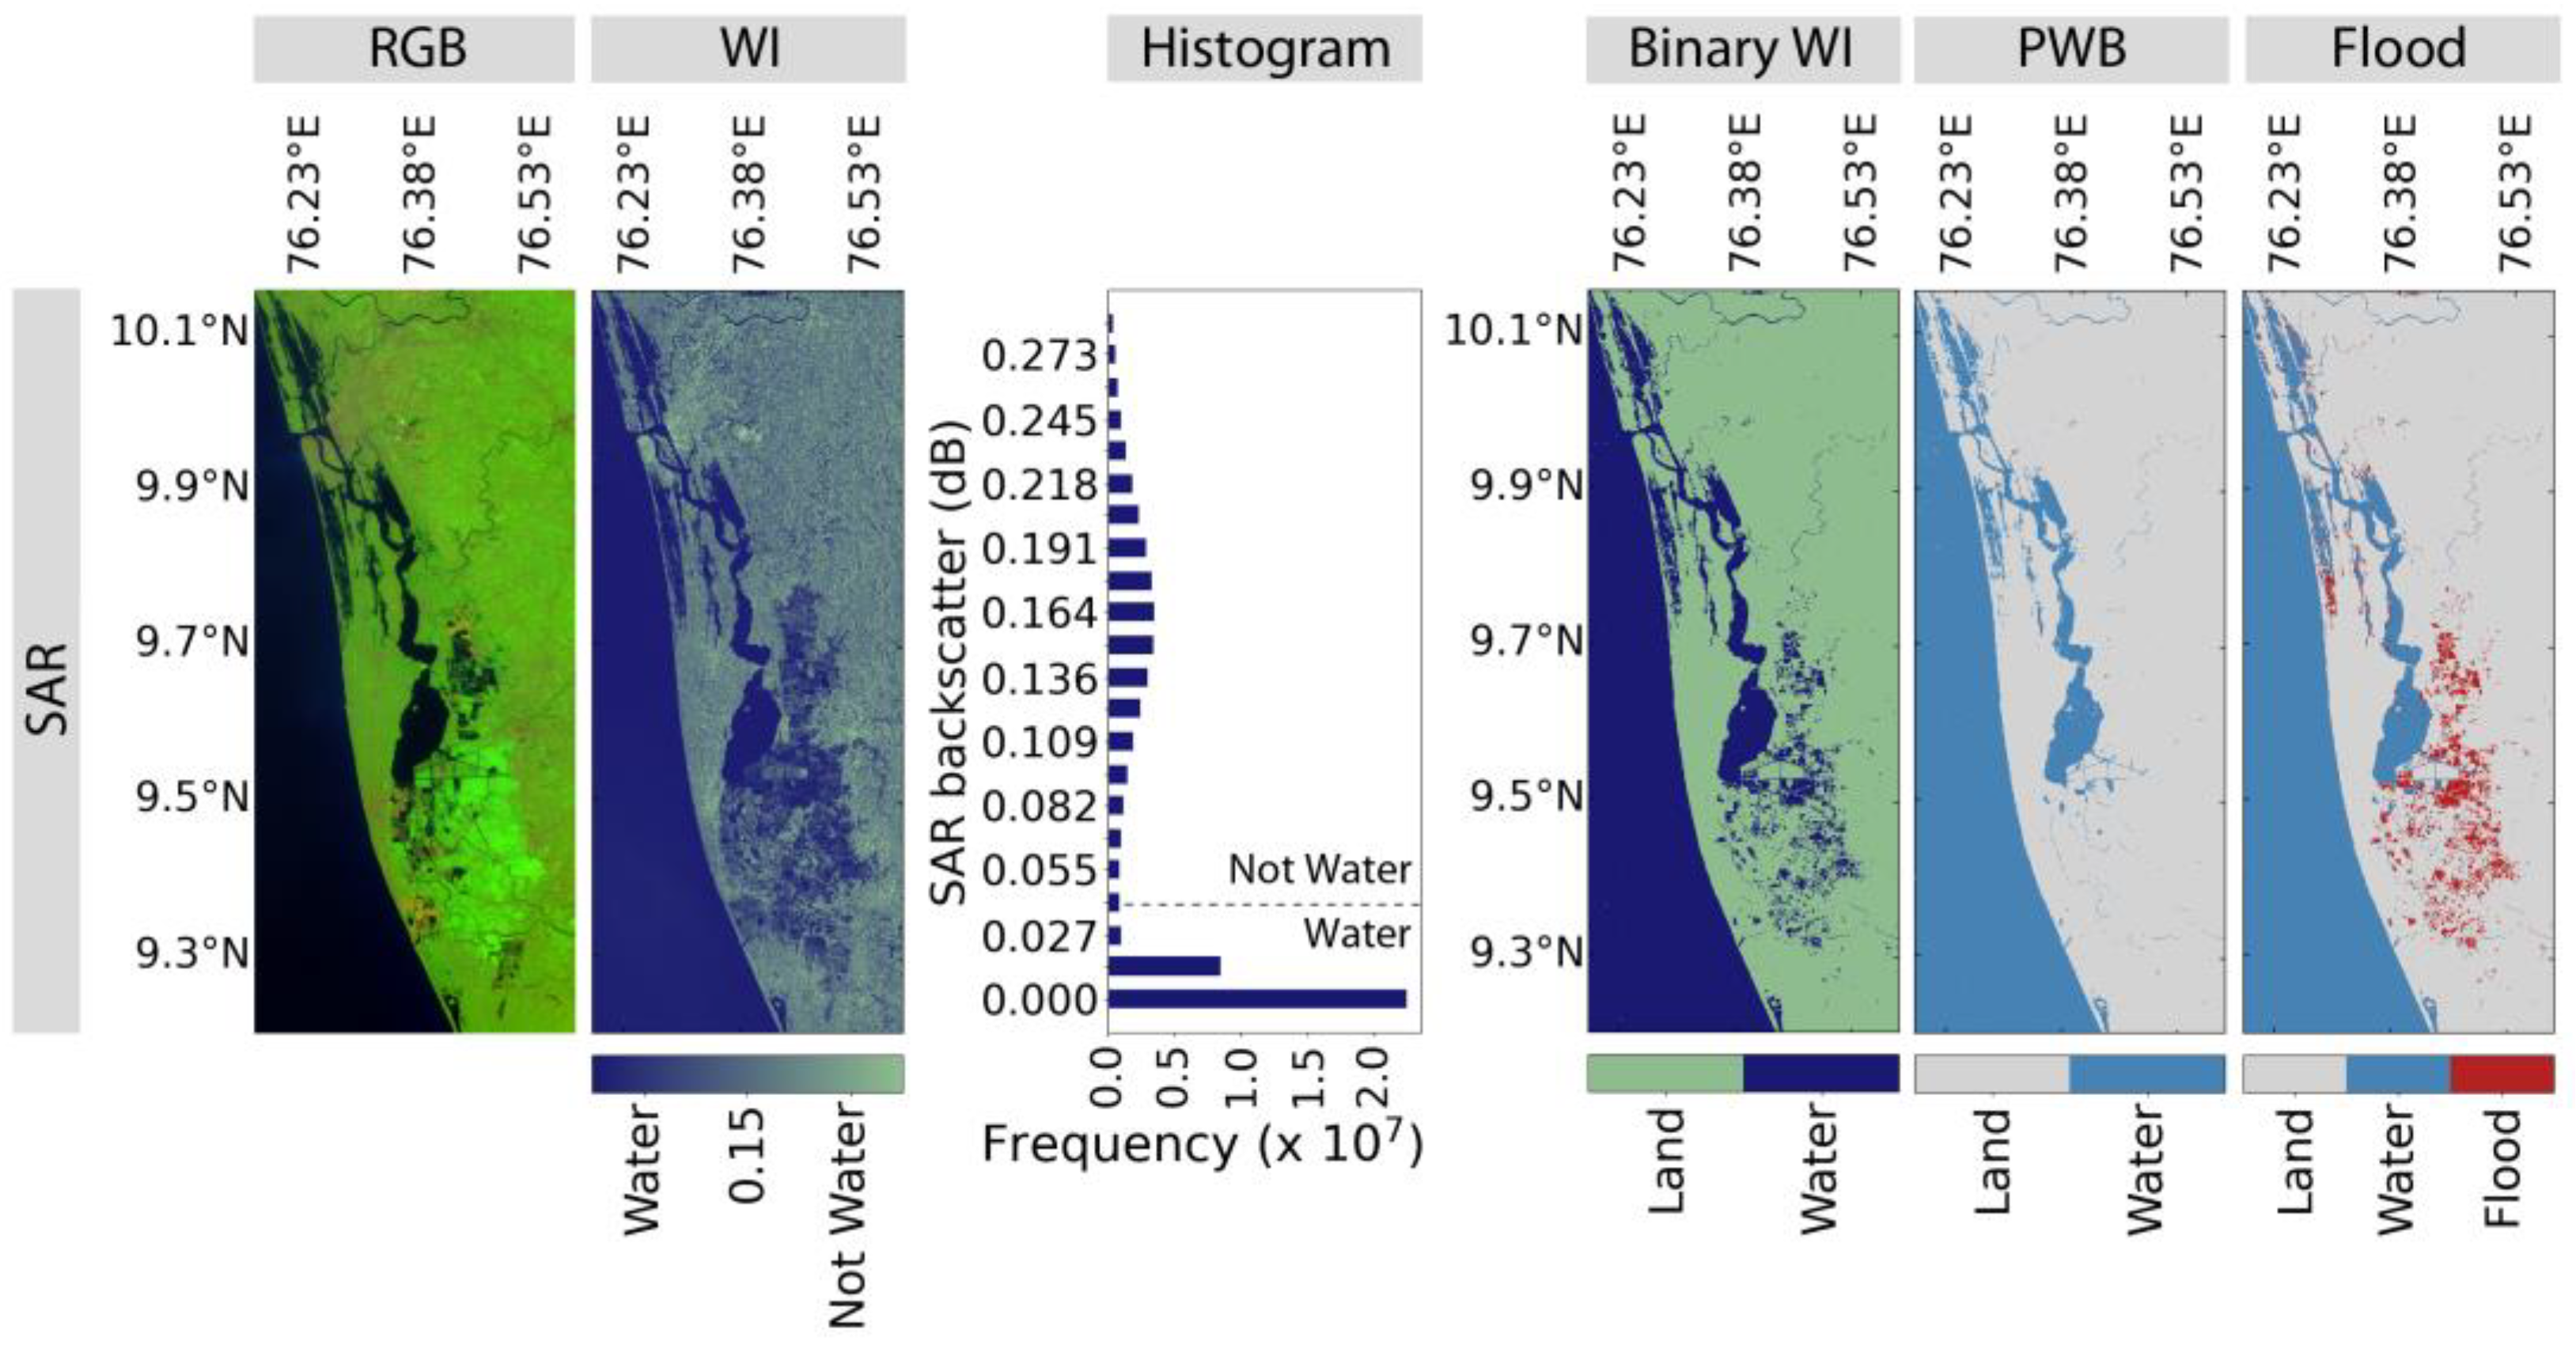
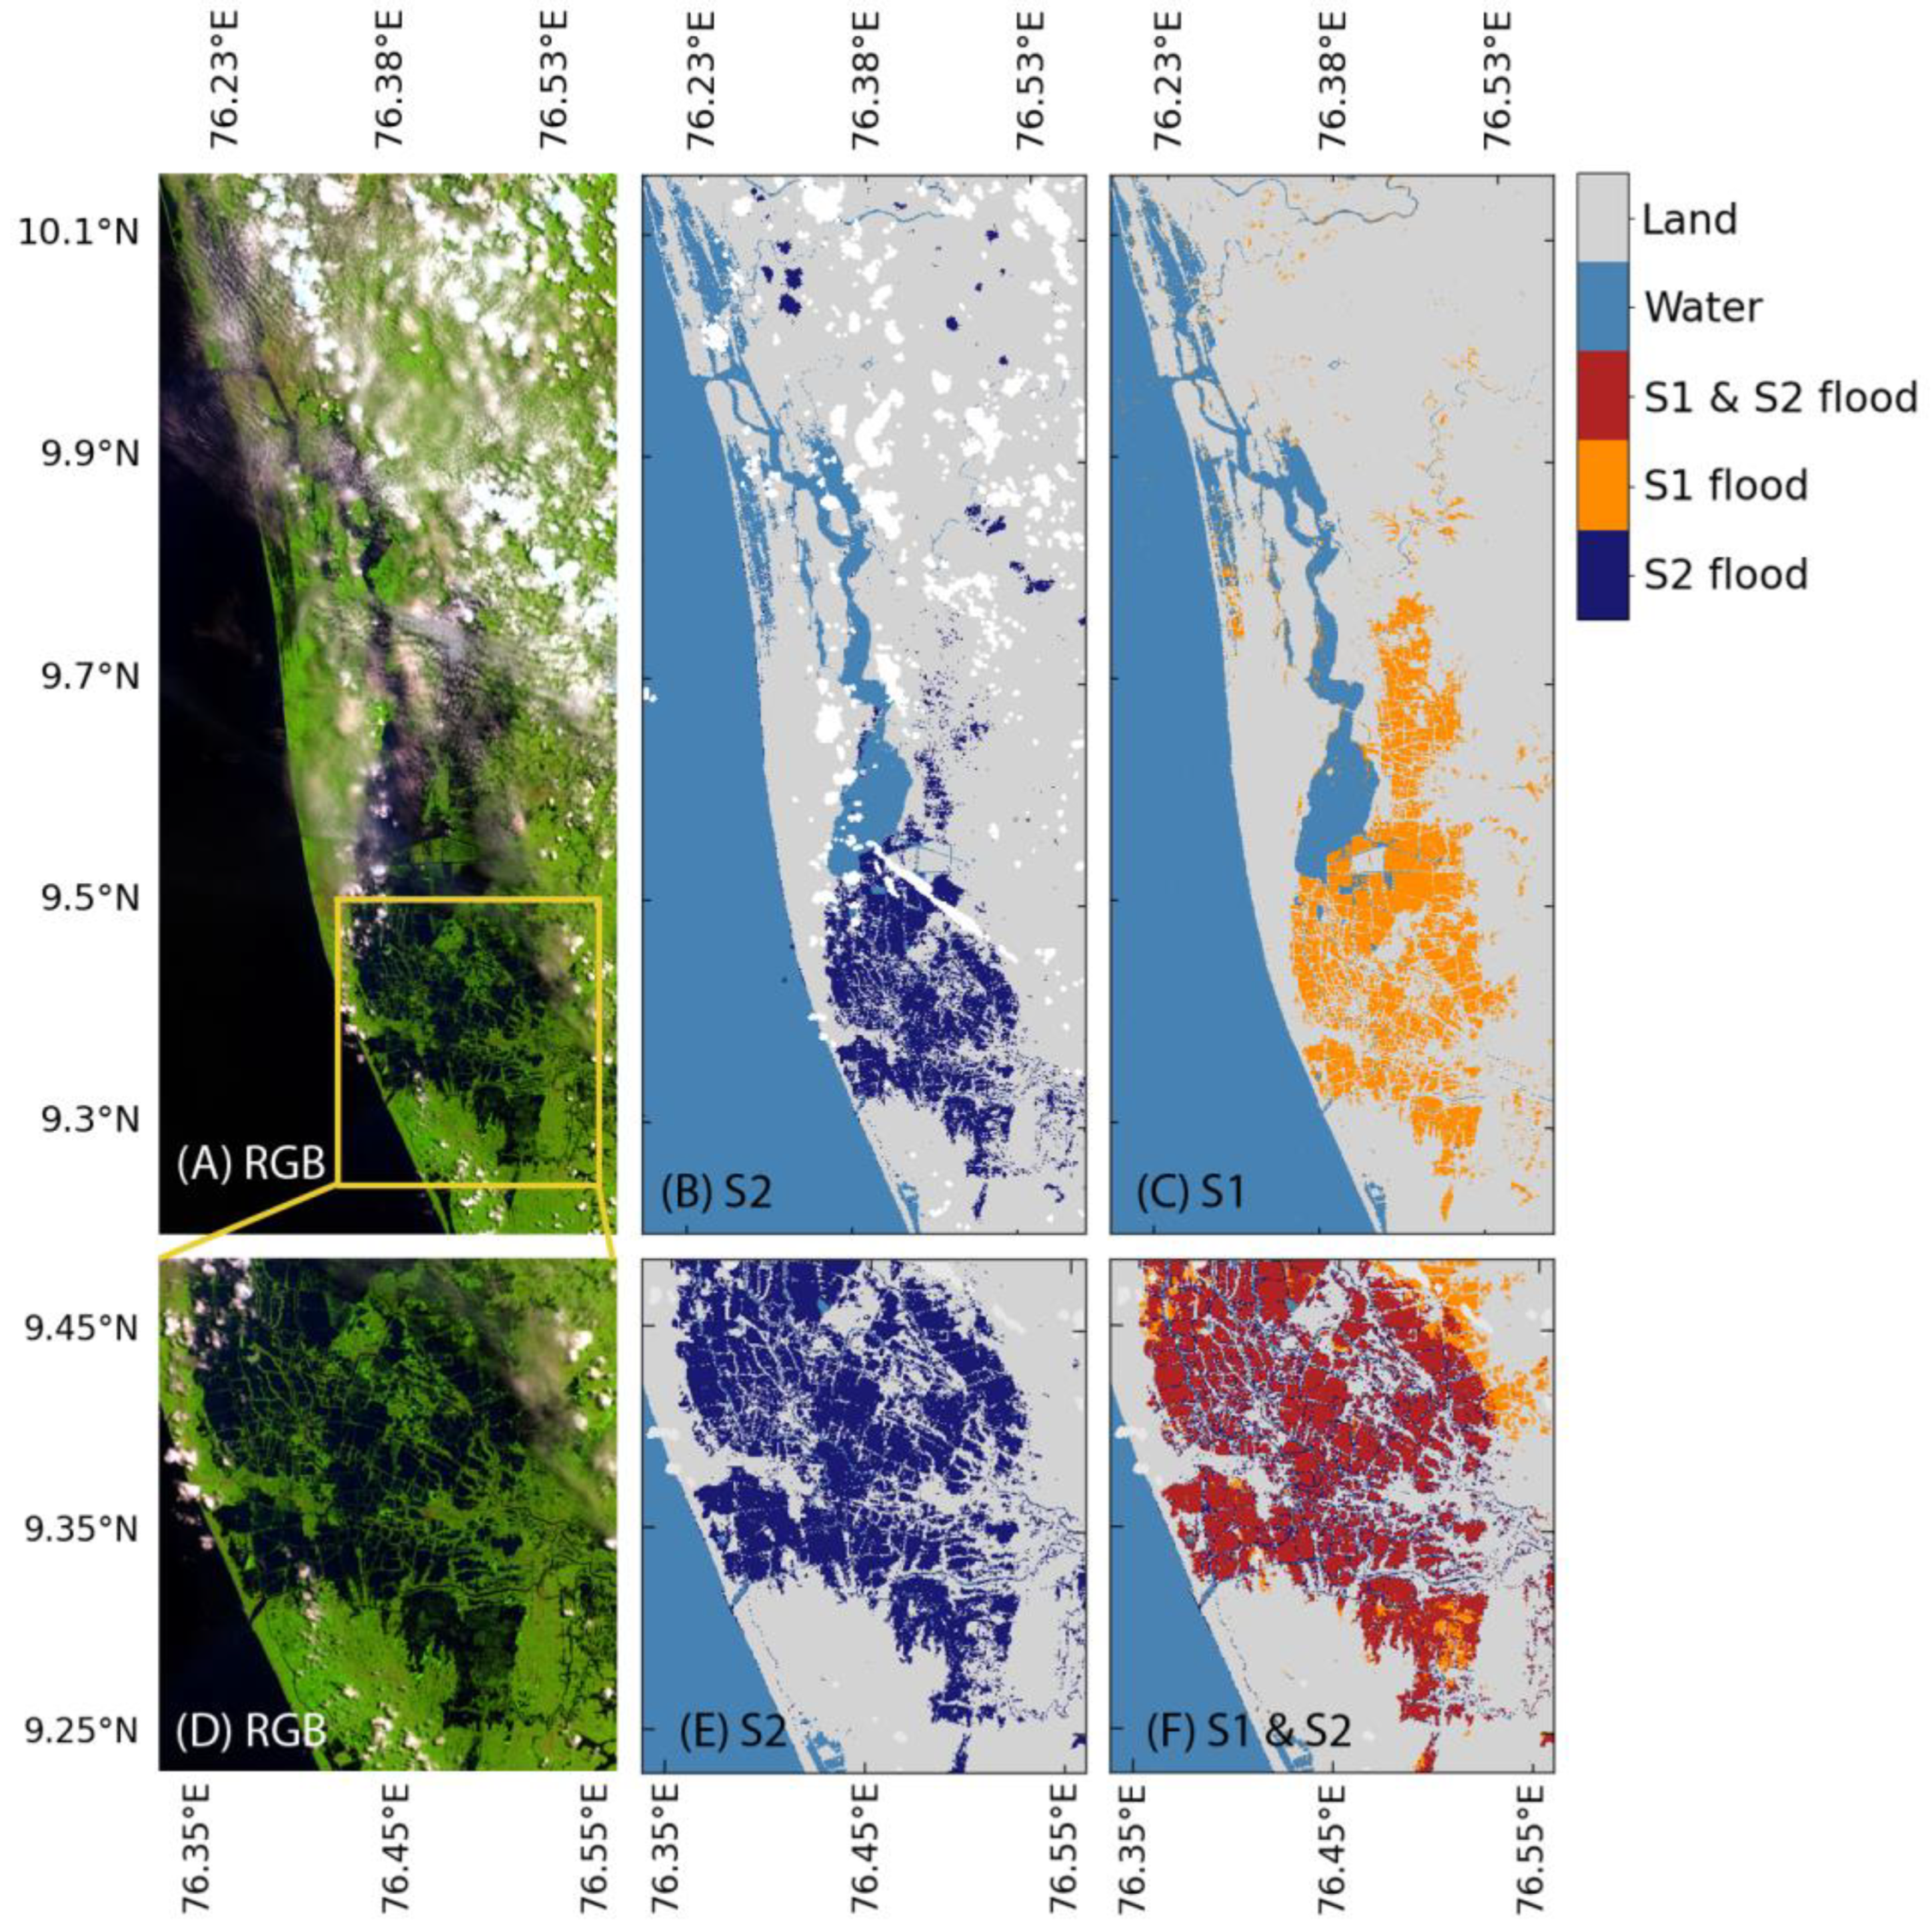
3.2. Comparison of Sentinel-1 and -2 Flood Mapping

The application of Sentinel-1 SAR observations for flood mapping showed a binary water-land map and permanent water body map with a high level of detail on 29 January 2018 (Figure 5), similar to the maps based on the MNDWI and AWEI (Figure 4B,D). In the Sentinel-1-based flood map, 168 km2 of flooding was indicated to the south and south-east of Lake Vembanad and near the coast to the south of Kochi (Figure 5, Table 1). Compared with the multi-spectral-based flood maps (Figure 4), more pixels were indicated as flooded to the south-east of Lake Vembanad in the SAR-based flood map (Figure 5). Analysis of the accuracy of the multi-spectral compared with the SAR remote sensing approach for flood mapping showed high overall accuracy of the permanent water body map for NDWI, MNDWI and AWEI (between 92.6–97.7%) and lower accuracy for WRI (Table 2). The highest overall accuracy of the Sentinel-2-based flood maps on 29 January 2018 was observed for MNDWI, followed by AWEI, NDWI and WRI, respectively (Table 2).

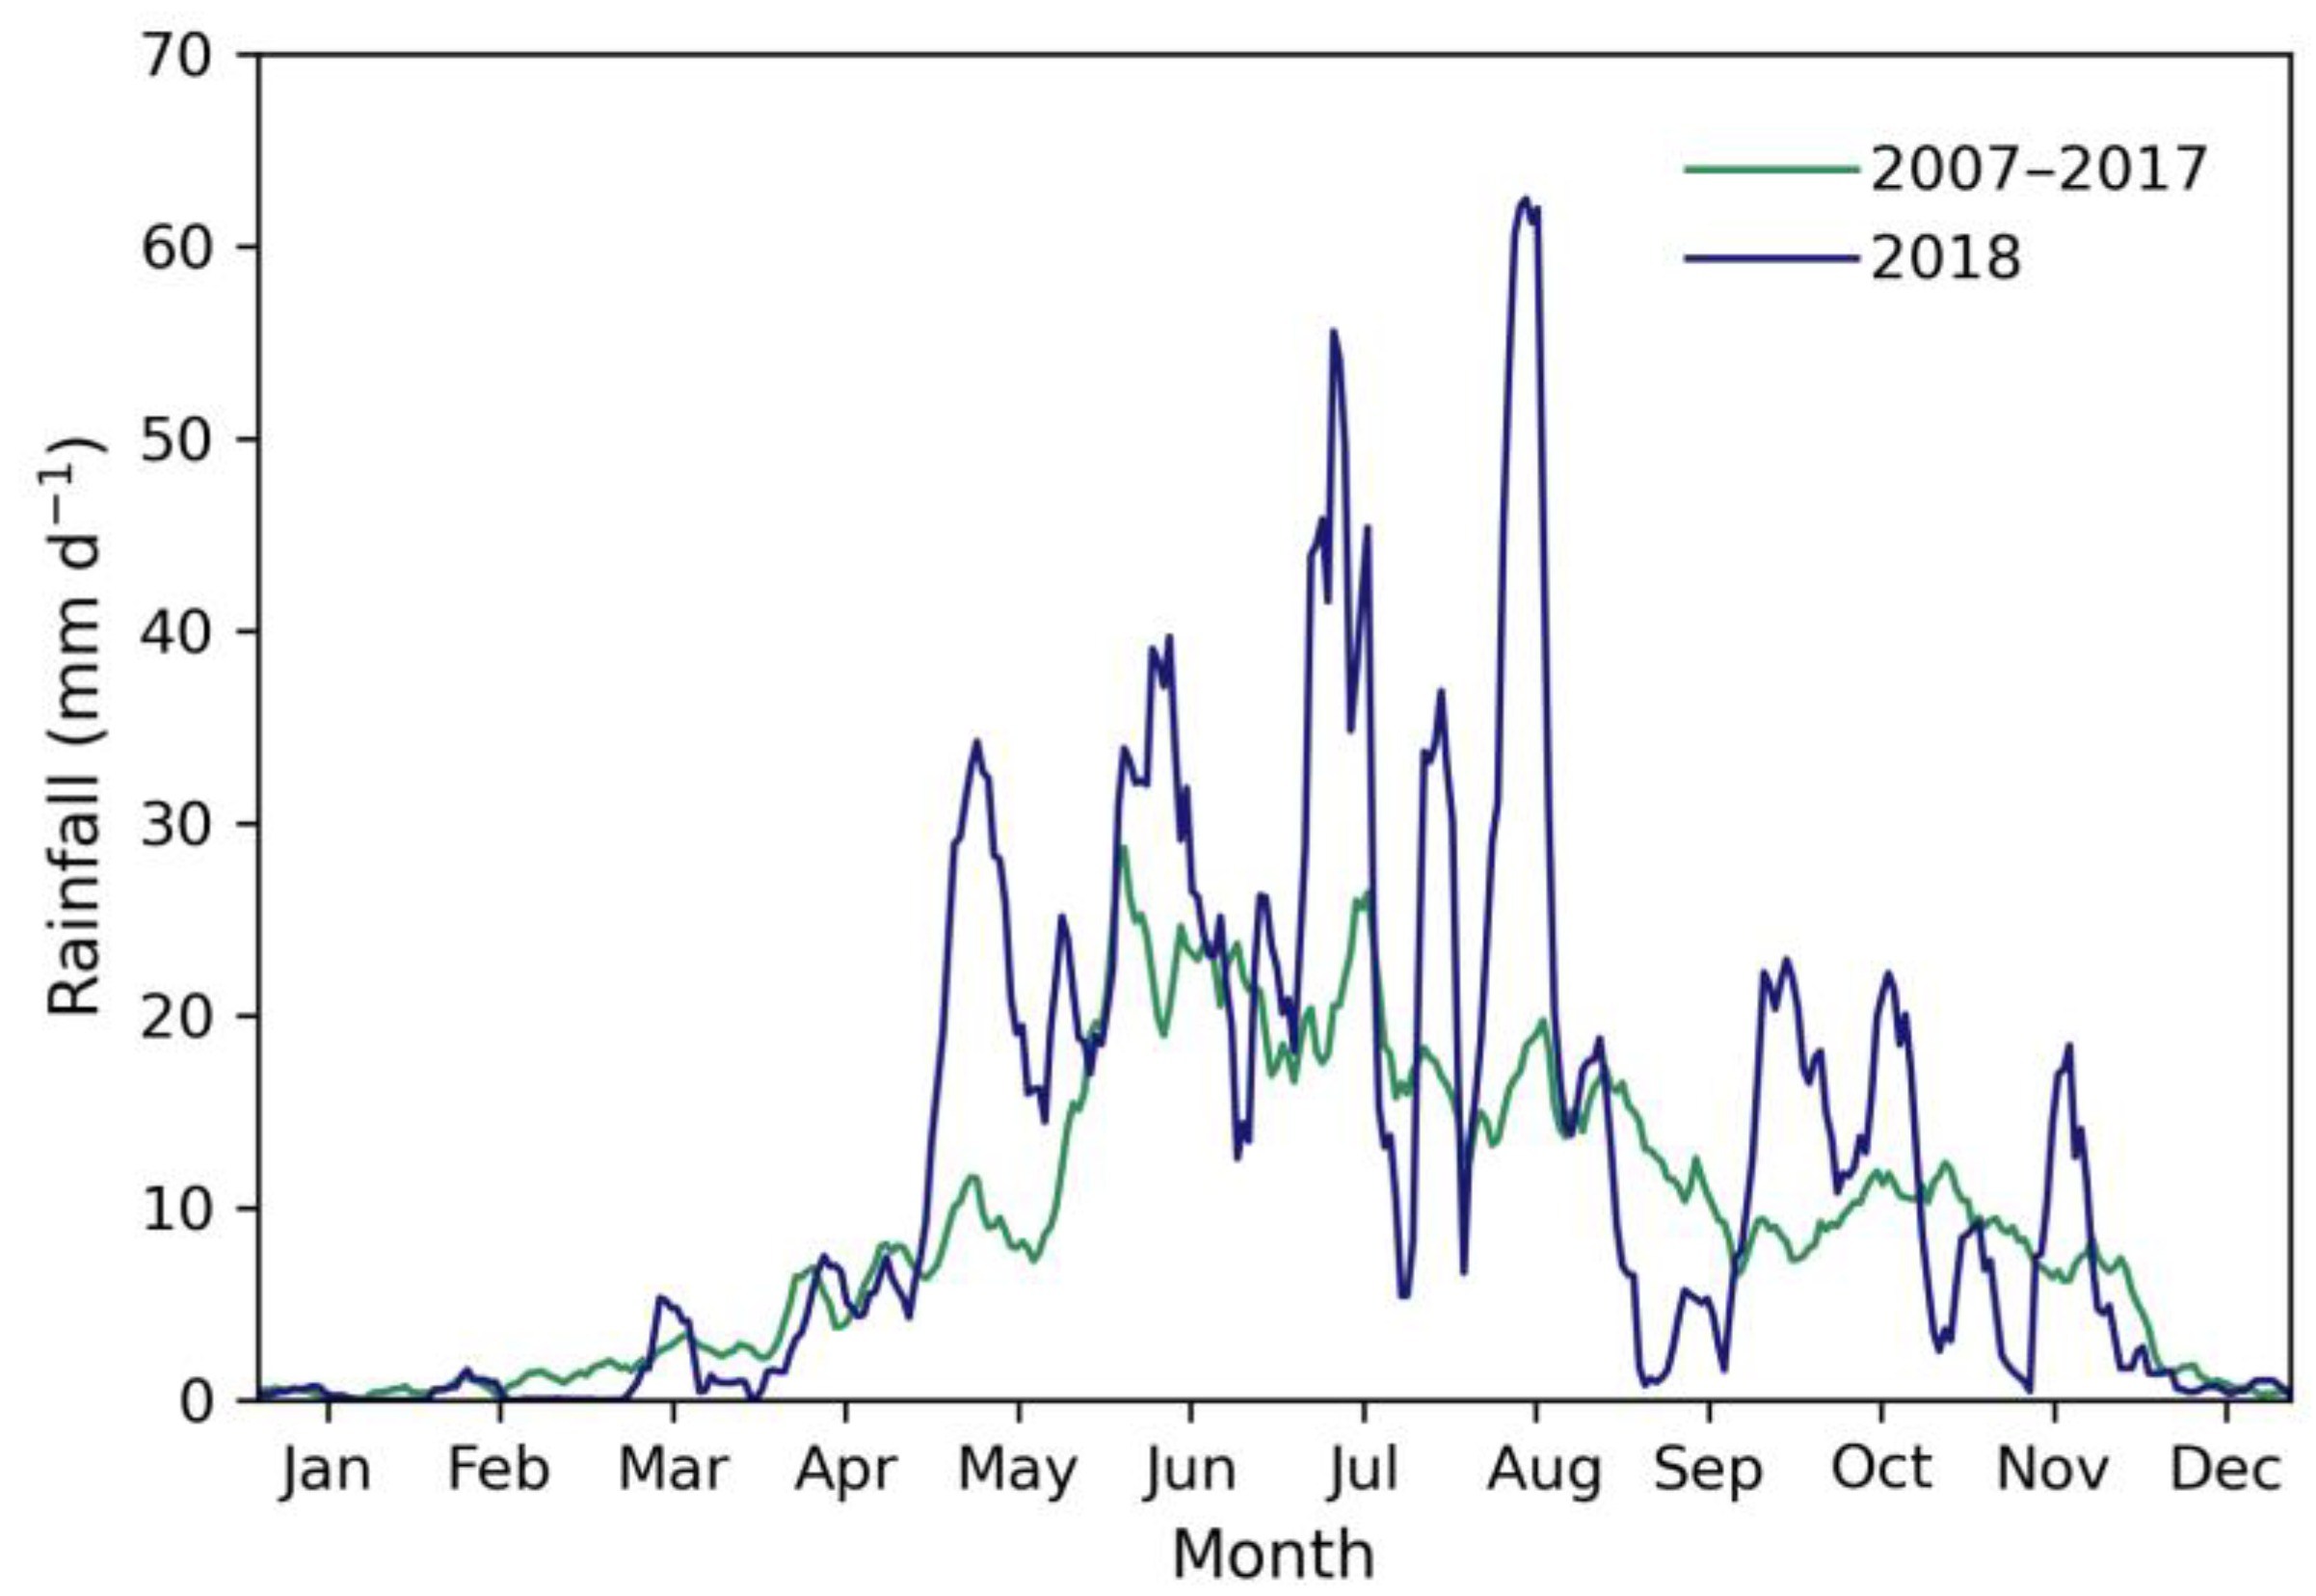
3.3. August 2018 Floods

Based on the results above, the multi-spectral remote sensing approach based on MNDWI was selected to map the once-in-a-century floods that occurred in the Lake Vembanad region in August 2018. The MNDWI-based flood map from 22 August 2018 showed that large areas (377 km2) towards the south of Lake Vembanad were flooded (Figure 6B, Table 1). Additional flooded areas towards the south-east of Lake Vembanad were observed in the SAR-based flood map (Figure 6C), which were not observed in the MNDWI-based flood map due to cloud cover in this region (Figure 6A). Based on the Sentinel-1 method, a total area of 448 km2 was flooded in August 2018. A comparison of the floods mapped in the most southern region showed that large areas were indicated as flooded using both the MSI- and SAR-based approaches (166 km2; Figure 6F). Differences between the two methods were partly related to cloud cover, where obstruction by cirrus clouds yielded no further classification of pixels in Sentinel-2 images, whereas this was possible for the SAR-based flood maps (which are not hampered by cloud cover; also see below). Some differences were also observed around the edges of the flooded areas, where the Sentinel-2-based maps indicated more pixels as flooded (Figure 6). Overall, the flood maps based on Sentinel-1 and Sentinel-2 images in this southern region were similar to each other for 85.5% of the pixels investigated (Table 3).

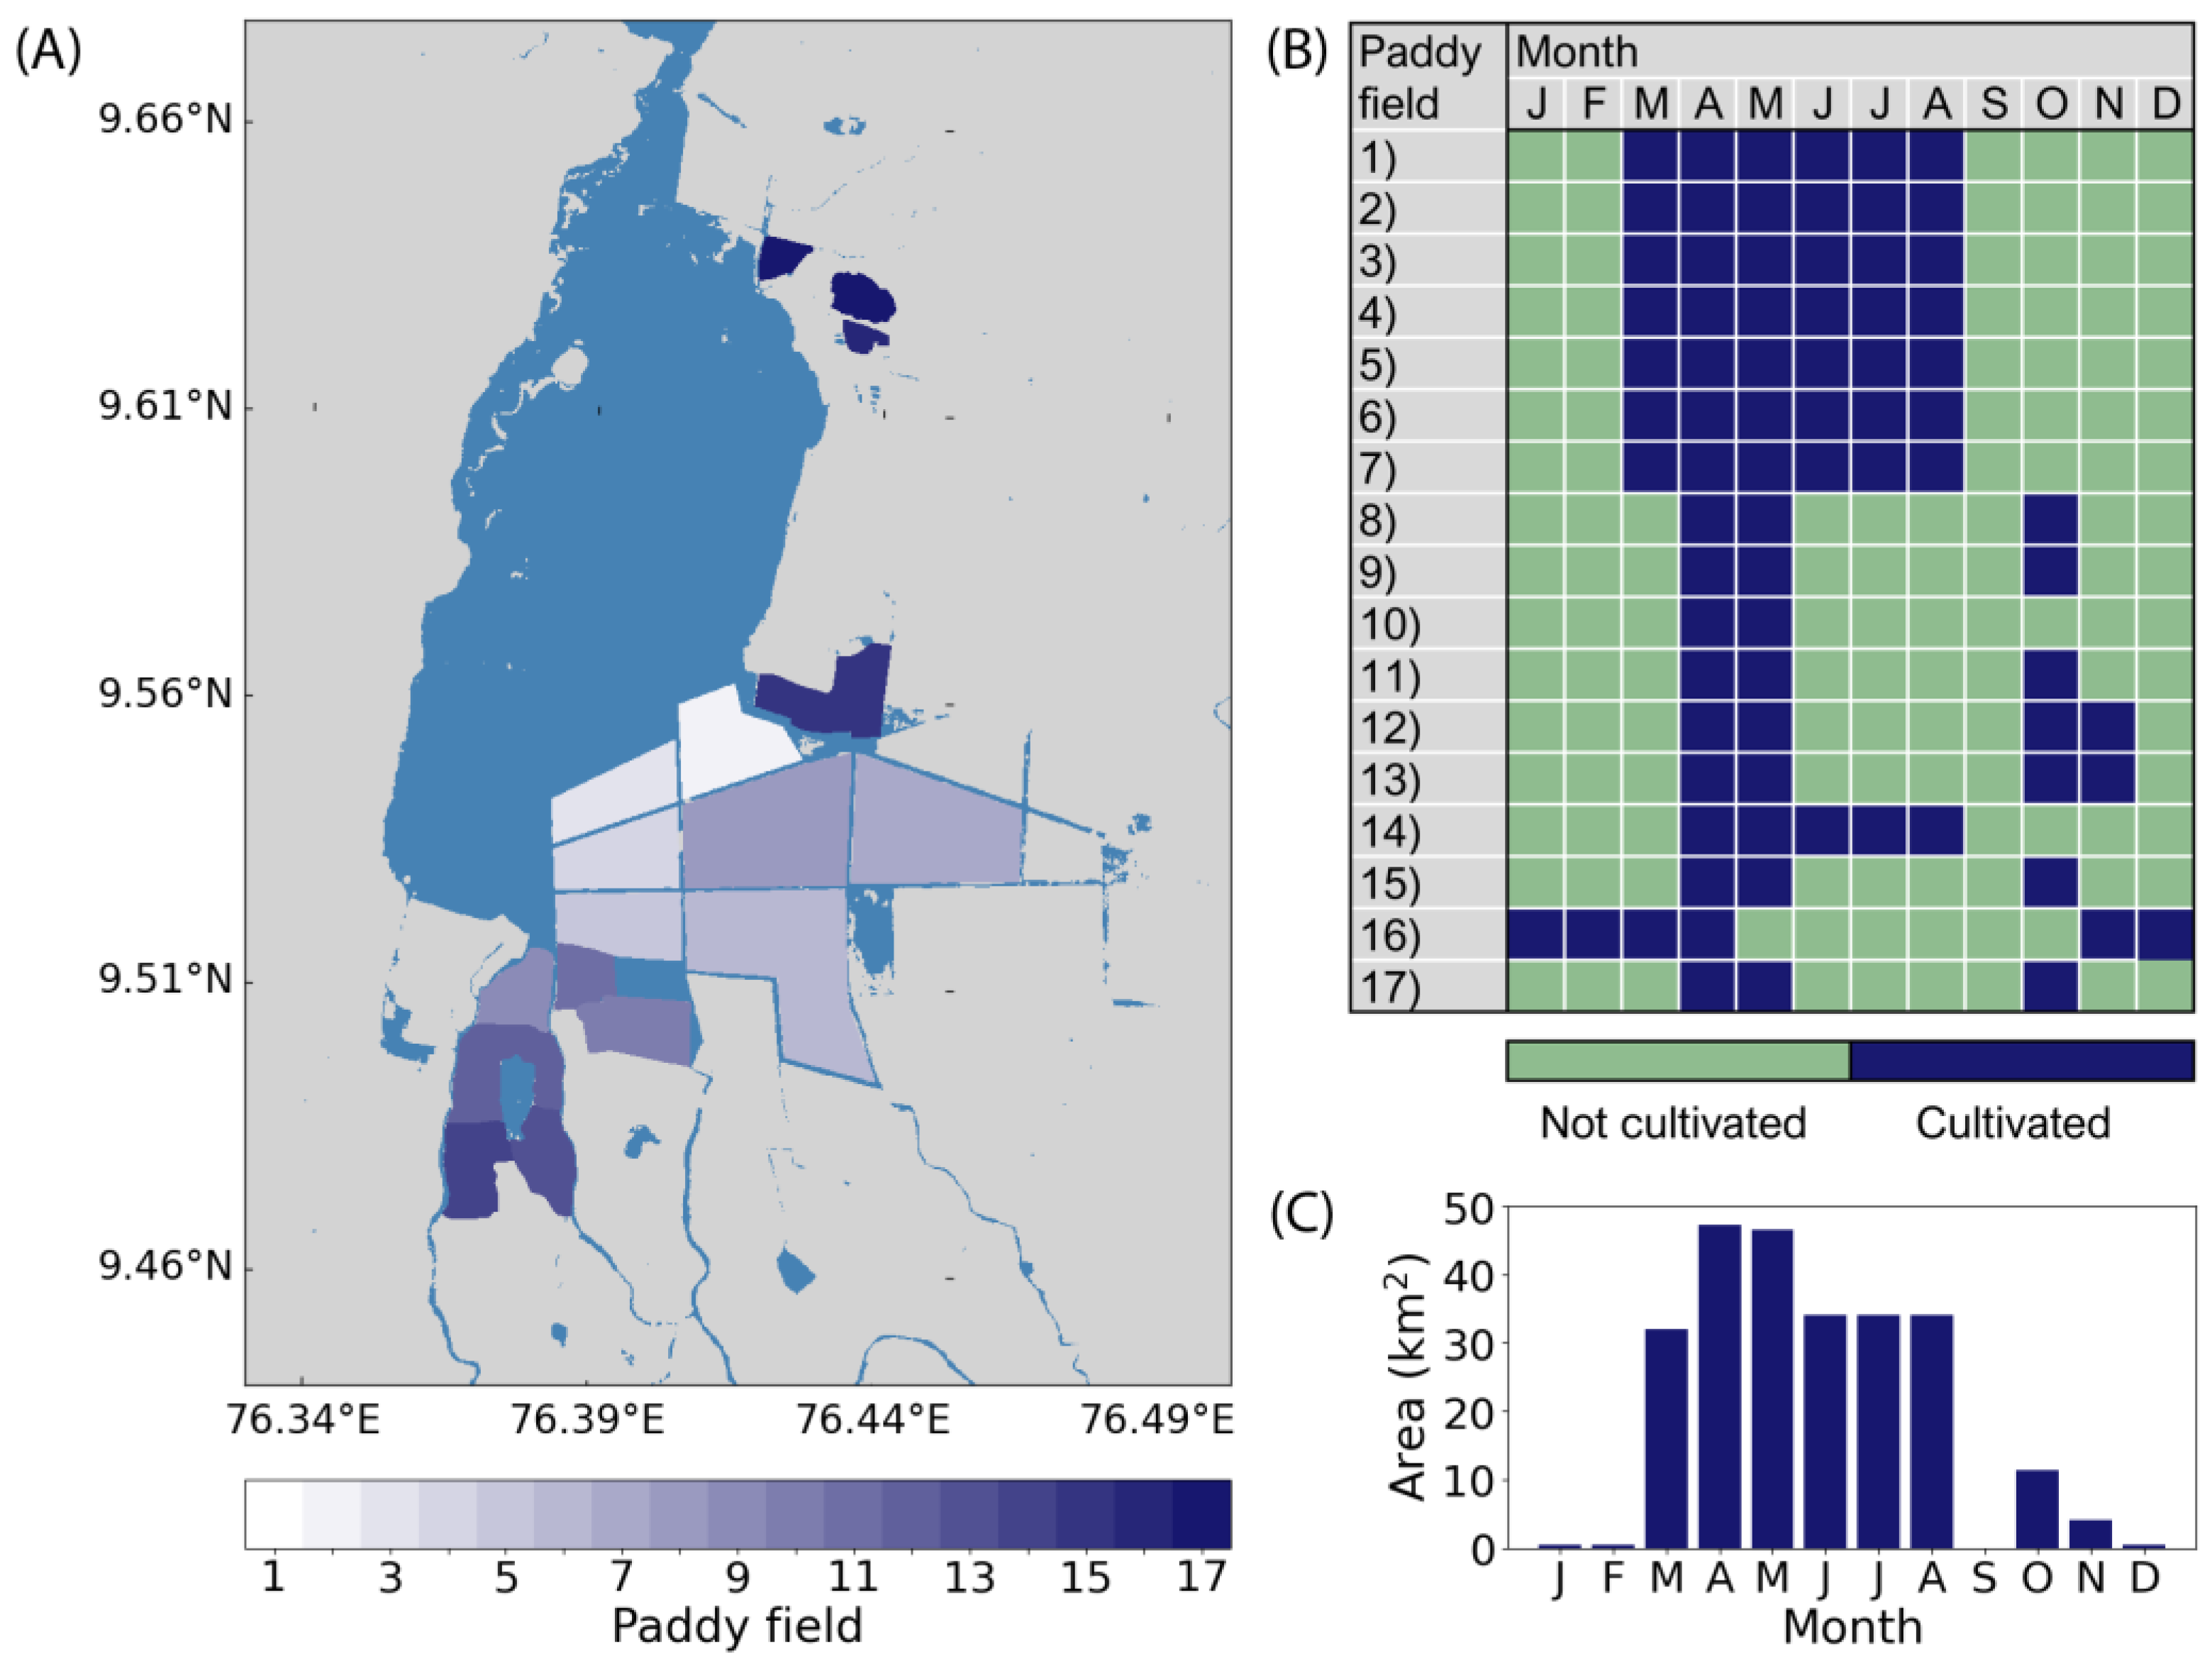
3.4. Effect of Waterlogged Paddy Fields on Flood Mapping

The area of accidental flooding estimated from the satellite-based maps may be overestimated where seasonal immersion of land under water is a normal occurrence, for example, in paddy fields that are deliberately inundated for rice cultivation. In consultation with local authorities, 17 paddy fields to the south and east of Lake Vembanad were identified, with surface areas ranging between 0.34 and 6.63 km2 (Table 4, Figure 7A). During the cultivation season, the water level in these paddy fields is controlled to be between 5–30 cm. The assembled cultivation calendar showed that the largest fields (numbers 1–7) are used for one long growing season between May and August each year for the Puncha (summer) crop, one field (number 16) is used between November and April for the Virippu (autumn) crop, while the other fields (numbers 8–15 and 17) are used for shorter periods of time for both the Puncha and Virippu crops (Table 4, Figure 7B). The combined area of these paddy fields showed that up to 47 km2 could be inundated for rice cultivation during parts of the year (Figure 7C). The cultivation cycle has to be taken into account in the application of both Sentinel-1 and -2 data for flood mapping to avoid seasonally water-logged areas being classified as flooded. Local information is essential to avoid such misclassification. These considerations also point to the need of a seasonally adjusted permanent water body map to be used when mapping flooded areas in the Lake Vembanad region.

3.5. Effect of Cloud Cover on Sentinel-2 Flood Mapping

To examine the effects of cloud cover on the mapping of floods using multi-spectral remote sensing observations in the visible domain, the MNDWI-based approach was applied to four different Sentinel-2 images with varying degrees and types of cloud cover (from 1 September 2018, 21 October 2019, 25 November 2018 and 15 December 2018; Figure 8). The analysis showed that low clouds such as stratocumulus and nimbostratus could lead to the misclassification of water pixels as land, leading to an overestimation of land pixels (Figure 8A,B), whereas high clouds such as cirrocumulus could lead to land being misclassified as water, leading to an overestimation of water pixels (Figure 8C). Yet, parts of the images not affected by cloud cover could still produce accurate flood maps (Figure 8B–D). Our analysis also showed that the cloud masks provided by the Copernicus Open Access Hub can be applied to retrieve partial flood maps (Figure 8C,D), but not all types of clouds are accurately masked (Figure 8A,B).

4. Discussion

Here, we studied the application of remote sensing to map flooded areas in the Vembanad-Kol-Wetland system using the multi-spectral imager sensor on board Sentinel-2. The region increasingly experiences heavy rain [42] and is vulnerable to flooding, storm surges and sea-level rise associated with climate change [43,44]. In response to this, and to facilitate mitigation measures and crisis response, it is critical that floods are mapped in a timely manner at high spatial and temporal resolutions. This study showed that remote sensing by multi-spectral visible radiometry can be used to generate flood maps using existing water index algorithms and a straightforward thresholding technique. Both the MNDWI and the AWEI showed high accuracy in the application of flood mapping in the Lake Vembanad region compared with standard techniques based on SAR observations. Previous studies have shown that AWEI performs best in complex imagery [45], while a combination of water indices [46] and/or segmentation of imagery generally improves performance [45]. While the NDWI showed relatively good results in this study and is commonly used for the delineation of water [17,22,40], it has been argued that the modified version of this index (i.e., MNDWI) is more stable and reliable. The MNDWI was originally developed for application in urban areas [26,28], and by including the MIR band this water index algorithm is less sensitive to high concentrations of sediments [47] and also provides positive values with a higher magnitude as water absorbs more MIR than NIR light [28]. This is also evident in Lake Vembanad, which experiences poor water quality with high concentrations of total suspended matter [10].
In the application of remote sensing for flood mapping, it is important to understand the benefits and drawbacks of the flood mapping methods based on multi-spectral imager and SAR remote sensing observations. There are various techniques to map floods from SAR observations, including visual interpretation and digitisation, thresholding algorithms, image change detection, supervised classification and machine learning [24,48], that could also be applied to multi-spectral remote sensing observations. Many of these methods include a thresholding technique that is either directly or indirectly included in the flood mapping model [48]. In this study, we have chosen a fixed thresholding method that is easy to use and computationally efficient [49]. However, there are limitations in the use of a fixed threshold, which was evident in our study for the WRI that underestimated the flooded area in the Lake Vembanad region. We used the inflection point of the histograms of cloud-free images to determine the threshold for each water index algorithm in our study region. Variations in this inflection point in images used for flood mapping might be caused by differences in cloud shadow and cover, and variations in the environment, for example high sediment loads and floating vegetation, which can lead to misclassification of water pixels [24]. This does not only apply to multi-spectral remote sensing observations, for SAR data thresholding techniques also have limitations, for example when water pixels form only a small fraction of the image and the backscatter histogram does not have the typical bimodal distribution [50]. The application of semi-automated or automated thresholding and machine learning techniques, both for Sentinel-1 and Sentinel-2-based methods, could improve the identification of water pixels in the Lake Vembanad region [38,39]. However, we note that these are more advanced methods that are less user-friendly for non-experts [49].
One of the major limitations in the application of multi-spectral visible radiometry data for flood mapping is cloud cover, which is generally high in the Lake Vembanad region during the monsoon season. Cloud cover can lead to the misclassification of water pixels or obstruct the identification of floods from multi-spectral images entirely. It has previously been demonstrated that almost two-thirds of flood events are observable by Sentinel-1, while only one-third of flood events are observable by Sentinel-2 due to the obstruction by cloud cover [46]. However, when temporal coverage is considered, Sentinel-2 has the potential to map more flood events than Sentinel-1, given the higher revisit time over any given area [46] (e.g., every 5 days for Sentinel-2 versus 12 days for Sentinel-1 in the Lake Vembanad region). Emergency response would benefit even from partial updates of flooded areas using multi-spectral remote sensing observations. While thick cloud cover limits the use of multi-spectral images, indices such as the Normalised Difference Vegetation Index (NDVI), which is negative under cloud shadow, could be used to mask the effects of cloud shadow caused by altocumulus and other types of clouds [22]. The cloud masks provided with Sentinel-2 data, as demonstrated in this study, could be an additional tool to identify areas of cloud cover and help to produce more accurate, partial flood maps to aid the response to natural disasters. Our examination of the effect of different types of cloud cover indicated that there is room for the development of tailor-made cloud masks for flood mapping in the Lake Vembanad region, to maximise the extraction of useful information in the presence of light clouds of various types. Given the state of the art, we see degradation in the quality of the flood classification in the presence of clouds. Further work is required to develop algorithms that work better under these adverse conditions and to develop uncertainty estimates for operational applications. However, and in spite of the shortcomings of, and the difficulties with, the use of multi-spectral remote sensing observations for flood mapping, the results presented here highlight the value of this tool as a devise for updating the SAR products in between revisit times, at least in those areas where visible spectral radiometry provides reliable information.
In this study, flood maps obtained from SAR remote sensing observations were treated as a reference, against which the performance of the flood mapping method based on multi-spectral images was assessed. The SAR data are most commonly used for flood detection, because of the ease in detection of smooth water surfaces with low specular backscattering and the near all-weather capabilities of active sensors [16,50]. However, it is acknowledged that there might be instances when SAR-based products are in error. For example, radar shadow or smooth surfaces other than water (e.g., tarmac surfaces such as motorways, parking lots and flat roofs) may have a similar backscatter signal to that of inundated areas [48,51]. In the Lake Vembanad region, these smooth surfaces include dry-laying paddy fields, and in some instances these are misclassified as water using SAR observations. In addition, the presence of wind, heavy rainfall and waves may lead to roughening of surface waters, which results in a higher backscatter signal that makes it more difficult to identify inundated areas [23,52]. An increase in radar backscatter is also observed in urban areas where the radar signal is reflected off buildings and vegetation, making it challenging to identify floods in such areas [53]. For Sentinel-1, the presence of clouds and raindrops that are thicker than the penetration capability, and speckle noise due to interference from multiple scatterers within a pixel, can also limit the interpretation of the data and lead to misclassification of pixels [19,51]. In instances where SAR data may be in error, and when multi-spectral remote sensing observations would be unlikely to mistake land for water or water for land, a dual-sensor approach could improve the overall accuracy of satellite-based flood maps. Such an approach would also increase the spatial and temporal resolution of flood mapping [38]. We note that in the past, there were limitations in the application of SAR observations for flood mapping due to the availability of data, but with new dedicated missions such as Sentinel-1 the global coverage has increased considerably [23].
In our study region, the mapping of floods—either based on multi-spectral imager or SAR remote sensing observations—is further complicated by the presence of paddy cultivation fields that are inundated on a seasonal basis. The paddy cultivation cycle in the Kuttanad region is considered unique because of the traditional methods employed to cultivate rice in fields that are below sea level. The method requires that the kayal nilangal (i.e., polders) be “de-watered” during certain phases of cultivation by pumping water out of the polders and allowing the fields to dry out, whereas at other times bunds (i.e., barriers to natural bodies of water) are broken to let water in [6]. With knowledge of the rice cultivation calendar, we can map this manoeuvring of water levels and exclude inundated paddy fields to improve the accuracy of flood maps in the Lake Vembanad region (this study). In addition, it allows for the assessment of damages to the paddy field in the case of natural disasters. For the success of cultivation, there has to be a high level of synchrony between the phases of paddy cultivation and the periods of water logging in the kayal nilangal. For example, germinated paddy seeds are sowed when there is standing water in the fields, but the depth of the water in the field is also important as the growing shoots need to rise above the water level as they grow [6]. Given the importance of inundating the paddy fields at the right time of the season and for a prescribed period of time for a successful harvest, the impact of unplanned-for and/or accidental flooding on local agriculture will depend on when the flooding occurs, as well as on how long it lasts. In fact, the damage to the paddy crops of Kerala was extensive due to the floods in 2018, with 26,186 ha lost since the floods occurred during a period when many of the kayal nilangal were almost ready to harvest [54]. The duration of flooding and the height of water in the fields could not be controlled to be in phase with the paddy growing cycle. Perhaps the next step in satellite-based solutions for dealing with floods in the Lake Vembanad region should investigate methods to map not only the extent and location of the flooded areas, but also the height of the flood waters. Interestingly, the Kuttanad area experienced a bumper crop in 2020, which was attributed to the supply of additional nutrients associated with the floods in 2018 and 2019 [54].

5. Conclusions

The Vembanad-Kol-Wetland system is embedded in the highly populated administrative districts of Ernakulam (which includes the port city of Kochi), Kottayam and Alappuzha, with an estimated population of 3.4 million people relying on lake waters for their livelihood [6]. Therefore, measures to control floods and to mitigate against their negative effects when they do occur, are of paramount importance. In this study, we demonstrated that multi-spectral remote sensing observations can provide information on inundated areas in addition to SAR observations. While there are limitations in the applicability of multi-spectral visible radiometry under cloudy conditions, the use of Sentinel-2 and other MSI sensors can increase the temporal coverage of flood maps considerably, even if only partial maps are available. Additional benefits lie in the application of multi-spectral observations for water quality monitoring [10,11,12,55]. Recent work has indicated that heavy rains and floods are tied to the dynamics of microbial pollutants in the water, including pathogenic bacteria such as Vibrio cholerae and Escherichia coli [11,12]. Therefore, it becomes important that mitigation measures include steps to prevent outbreaks of waterborne diseases. The flood mapping addressed here has the potential to become part of a solution package, enabling frequent updates of flooded areas in the event of a catastrophe, and allowing the authorities to focus response where it is most needed. Furthermore, the satellite data used in this study are available free of cost under the Copernicus Programme of the European Union, and similar data are available from other agencies. Although this is a regional study, the flood mapping methods presented here have the potential to be applied to any number of locations with similar problems, with minor adjustments to local conditions where necessary. After all, one of the lessons learned from this study is that local information is invaluable for the interpretation of satellite data and for improving the usefulness of the products.

Supplementary Materials

The following supporting information can be downloaded at: https://www.mdpi.com/article/10.3390/rs15215139/s1, Figure S1: Histograms of the permanent water body maps of Lake Vembanad.

Author Contributions

Conceptualisation, G.K., S.S, T.P. and H.E.-K.; methodology, G.K. and H.E.-K.; software, G.K.; validation, G.K., G.G., A.K.S., N.M. and A.A.; formal analysis, G.K.; investigation, G.K.; resources, S.S., T.P., G.G., N.M. and A.A.; data curation, G.K. and A.K.S.; writing—original draft preparation, G.K. and S.S.; writing—review and editing, G.K., S.S., G.G., N.M. and A.A.; visualisation, G.K.; supervision, S.S. and T.P.; project administration, G.K. and S.S.; funding acquisition, S.S., T.P., G.G., N.M. and A.A. All authors have read and agreed to the published version of the manuscript.

Funding

This work was funded by the Natural Environmental Research Council, UK, and the Department of Science and Technology, India, under the India–UK water quality research programme project ‘REhabilitation of Vibrio Infested waters of VembanAd Lake: pollution and solution’ (REVIVAL; grant numbers NE/R003521/1 and DST/TM/INDO-UK/2K17/64 C & G) and by the European Space Agency project ‘Waterborne Infectious Diseases and Global Earth Observation in the Nearshore’ (WIDGEON). This work is a contribution to the activities of the National Centre of Earth Observation of the UK.

Data Availability Statement

All satellite data used in this study is freely available through the Copernicus Open Access Hub (https://scihub.copernicus.eu/; accessed from 6 January 2021 onwards for this study).

Conflicts of Interest

The authors declare no conflict of interest.

References

  1. CRED Disaster Year in Review 2019. CRED Crunch 2020, 1–2. Available online: https://cred.be/sites/default/files/CC58.pdf (accessed on 22 May 2022).
  2. CRED 2021 Disasters in Numbers; Brussels. 2021. Available online: https://cred.be/sites/default/files/2021_EMDAT_report.pdf (accessed on 22 May 2022).
  3. Lee, J.; Perera, D.; Glickman, T.; Taing, L. Water-Related Disasters and Their Health Impacts: A Global Review. Prog. Disaster Sci. 2020, 8, 100123. [Google Scholar] [CrossRef]
  4. UN Sustainable Development Goals. Available online: https://sdgs.un.org/ (accessed on 12 August 2022).
  5. Menon, N.N.; Balchand, A.N.; Menon, N.R. Hydrobiology of the Cochin Backwater System—A Review. Hydrobiologia 2000, 430, 149–183. [Google Scholar] [CrossRef]
  6. WISA Conservation and Wise Use of Vemabanad-Kol: An Integrated Management Planning Framework; New Delhi, India. 2013. Available online: https://www.mangrovesforthefuture.org/assets/Repository/Documents/Wetlands-International-SGP-Final-report.pdf (accessed on 12 November 2020).
  7. Gopalan, U.K.; Vengayil, D.T.; Udayavarma, P.; Krishnankutty, M. The Shrinking Backwaters of Kerala. J. Mar. Biol. Ass. India 1983, 25, 131–141. [Google Scholar]
  8. Balachandran, K.K.; Nair, K.K.C.; Achuthankutty, C.T.; Nair, S.; Wafar, M.V.W.; Ramesh; Saramma, U.P.; Rosamma, S.; Haridas, P.; Jayalakshmy, K.V.; et al. Ecosystem Modelling of Cochin Backwaters 2002–2007; Ministry of Earth Sciences, Government of India: New Delhi, India, 2007. [Google Scholar]
  9. Vincy, M.V.; Rajan, B.; Pradeep, P.K.A. Water Quality Assessment of a Tropical Wetland Ecosystem with Special Reference to Backwater Tourism, Kerala, South India. Int. Res. J. Environ. Sci. 2012, 1, 62–68. [Google Scholar]
  10. Kulk, G.; George, G.; Abdulaziz, A.; Menon, N.; Theenathayalan, V.; Jayaram, C.; Brewin, R.J.W.; Sathyendranath, S. Effect of Reduced Anthropogenic Activities on Water Quality in Lake Vembanad, India. Remote Sens. 2021, 13, 1631. [Google Scholar] [CrossRef]
  11. Abdulaziz, A.; Krishna, K.; Syamkumar, V.; George, G.; Menon, N.; Kulk, G.; Jasmin, C.; Ciambelli, A.; Hridya, K.V.; Tharakan, B.; et al. Dyanmics of Vibrio Cholera in a Typical Tropical Lake and Estuarine System: Potential of Remote Sensing for Risk Mapping. Remote Sens. 2021, 13, 1034. [Google Scholar] [CrossRef]
  12. Abdulaziz, A.; Sathyendranath, S.; Vijayakumar, S.K.; Menon, N.; George, G.; Kulk, G.; Raj, D.; Krishna, K.; Rajamohananpillai, R.; Tharakan, B.; et al. The Distribution of Fecal Contamination in an Urbanized Tropical Lake and Incidence of Acute Diarrheal Disease. ACS EST Water 2023, 3, 1561–1573. [Google Scholar] [CrossRef]
  13. CRED Natural Disasters 2018; Brussels. 2018. Available online: https://emdat.be/sites/default/files/adsr_2018.pdf (accessed on 22 May 2022).
  14. Act!onaid Emergency Response to Kerala Floods 2018; New Delhi. 2018. Available online: https://www.actionaidindia.org/wp-content/uploads/2019/07/Kerala-Floods-Emergency-2018-Report-Jul1519-l-Web.pdf (accessed on 16 August 2022).
  15. Oddo, P.C.; Bolten, J.D. The Value of Near Real-Time Earth Observations for Improved Flood Disaster Response. Front. Environ. Sci. 2019, 7, 1–11. [Google Scholar] [CrossRef]
  16. Schumann, G.; Moller, D. Microwave Remote Sensing of Flood Inundation. Phys. Chem. Earth 2015, 83–84, 84–95. [Google Scholar] [CrossRef]
  17. Fischell, L.; Lüdtke, D.; Duguru, M. Capabilities of SAR and Optical Data for Rapid Mapping of Flooding Events. United Nations Platform for Space-based information for Disaster Management and Emergency Response. Bonn. 2018. Available online: https://geomundus.org/2018/docs/papers/Lisa.pdf (accessed on 3 August 2022).
  18. Vishnu, C.L.; Sajinkumar, K.S.; Oommen, T.; Coffman, R.A.; Thrivikramji, K.P.; Rani, V.R.; Keerthy, S. Satellite-Based Assessment of the August 2018 Flood in Parts of Kerala, India. Geomat. Nat. Hazards Risk 2019, 10, 758–767. [Google Scholar] [CrossRef]
  19. Tiwari, V.; Kumar, V.; Matin, M.A.; Thapa, A.; Ellenburg, W.L.; Gupta, N.; Thapa, S. Flood Inundation Mapping-Kerala 2018; Harnessing the Power of SAR, Automatic Threshold Detection Method and Google Earth Engine. PLoS ONE 2020, 15, e0237324. [Google Scholar] [CrossRef] [PubMed]
  20. Vanama, V.S.K.; Rao, Y.S.; Bhatt, C.M. Change Detection Based Flood Mapping Using Multi-Temporal Earth Observation Satellite Images: 2018 Flood Event of Kerala, India. Eur. J. Remote Sens. 2021, 54, 42–58. [Google Scholar] [CrossRef]
  21. Vanama, V.S.K.; Musthafa, M.; Khati, U.; Gowtham, R.; Singh, G.; Rao, Y.S. Inundation Mapping of Kerala Flood Event in 2018 Using ALOS-2 and Temporal Sentinel-1 SAR Images. Curr. Sci. 2021, 120, 915–925. [Google Scholar] [CrossRef]
  22. Huang, C.; Chen, Y.; Zhang, S.; Wu, J. Detecting, Extracting, and Monitoring Surface Water From Space Using Optical Sensors: A Review. Rev. Geophys. 2018, 56, 333–360. [Google Scholar] [CrossRef]
  23. Notti, D.; Giordan, D.; Caló, F.; Pepe, A.; Zucca, F.; Galve, J.P. Potential and Limitations of Open Satellite Data for Flood Mapping. Remote Sens. 2018, 10, 1673. [Google Scholar] [CrossRef]
  24. Mateo-Garcia, G.; Veitch-Michaelis, J.; Smith, L.; Oprea, S.V.; Schumann, G.; Gal, Y.; Baydin, A.G.; Backes, D. Towards Global Flood Mapping Onboard Low Cost Satellites with Machine Learning. Sci. Rep. 2021, 11, 7429. [Google Scholar] [CrossRef]
  25. Albertini, C.; Gioia, A.; Ioacobellis, V.; Manfreda, S. Detection of Surface Water and Floods with Multispectral Satellites. Remote Sens. 2022, 14, 6005. [Google Scholar] [CrossRef]
  26. Yang, H.; Wang, Z.; Zhao, H.; Guo, Y. Water Body Extraction Methods Study Based on RS and GIS. Procedia Environ. Sci. 2011, 10, 2619–2624. [Google Scholar] [CrossRef]
  27. McFeeters, S.K. The Use of the Normalized Difference Water Index (NDWI) in the Delineation of Open Water Features. Int. J. Remote Sens. 1996, 17, 1425–1432. [Google Scholar] [CrossRef]
  28. Xu, H. Modification of Normalised Difference Water Index (NDWI) to Enhance Open Water Features in Remotely Sensed Imagery. Int. J. Remote Sens. 2006, 27, 3025–3033. [Google Scholar] [CrossRef]
  29. Feyisa, G.L.; Meilby, H.; Fensholt, R.; Proud, S.R. Automated Water Extraction Index: A New Technique for Surface Water Mapping Using Landsat Imagery. Remote Sens. Environ. 2014, 140, 23–35. [Google Scholar] [CrossRef]
  30. Lakshmanan, P.T.; Shynamma, C.S.; Balchand, A.N.; Kurup, P.G.; Nambisan, P.N.K. Distribution and Seasonal Variation of Temperature and Salinity in Cochin Backwaters. Indian J. Mar. Sci. 1982, 11, 170–172. [Google Scholar]
  31. Gopakumar, R. Characteristics of Floods in the Vembanad Wetlands and Possible Measures for Flood Management in the Region. In Advances in Geosciences; Lin, G.-F., Ed.; Hydrological Science; World Scientific Publishers: Singapore, 2011; Volume 23, pp. 9–22. [Google Scholar] [CrossRef]
  32. Kannan, K.P. Ecological and socio-economic consequences of water-control projects in the Kuttanad region of Kerala. Proc. Indian Acad. Sci. 1979, 2, 417–433. [Google Scholar] [CrossRef]
  33. Shiyam Sundar, P.K.; Kundapura, S. Spatial Mapping of Flood Susceptibility Using Decision Tree–Based Machine Learning Models for the Vembanad Lake System in Kerala, India. J. Water Resour. Plan. Manag. 2023, 149, 10. [Google Scholar] [CrossRef]
  34. Remani, K.N.; Jayakumar, P.; Jalaja, T.K. Environmental problems and management aspects of Vembanad Kol wetlands in south west coast of India. Nat. Environ. Pollut. Technol. 2010, 9, 247–254. [Google Scholar]
  35. Vanhellemont, Q.; Ruddick, K. ACOLITE For Sentinel-2: Aquatic Applications of MSI Imagery. In Proceedings of the 2016 ESA Living Planet Symposium, Prague, Czech Republic, 9–12 May 2016; ESA Special Publication: Prague, Czech Republic, 2016; p. SP-740. [Google Scholar]
  36. Vanhellemont, Q.; Ruddick, K. Atmospheric Correction of Metre-Scale Optical Satellite Data for Inland and Coastal Water Applications. Remote Sens. Environ. 2018, 216, 586–597. [Google Scholar] [CrossRef]
  37. Vanhellemont, Q.; Ruddick, K. Adaptation of the Dark Spectrum Fitting Atmospheric Correction for Aquatic Applications of the Landsat and Sentinel-2 Archives. Remote Sens. Environ. 2019, 225, 175–192. [Google Scholar] [CrossRef]
  38. Shen, L.; Li, C. Water Body Extraction from Landsat ETM+ Imagery Using Adaboost Algorithm. In Proceedings of the 18th International Conference on Geoinformatics, Beijing, China, 18–20 June 2010; pp. 1–4. [Google Scholar]
  39. Asmadin; Siregar, V.P.; Sofian, I.; Jaya, I.; Wijanarto, A.B. Feature Extraction of Coastal Surface Inundation via Water Index Algorithms Using Multispectral Satellite on North Jakarta. IOP Conf. Ser. Earth Environ. Sci. 2018, 176. [Google Scholar] [CrossRef]
  40. Kussul, N.; Shelestov, A.; Skakun, S. Flood Monitoring from SAR Data. NATO Sci. Peace Secur. Ser. C Environ. Secur. 2011, 97, 19–29. [Google Scholar] [CrossRef]
  41. Funk, C.; Peterson, P.; Landsfeld, M.; Pedreros, D.; Verdin, J.; Shukla, S.; Husak, G.; Rowland, J.; Harrison, L.; Hoell, A.; et al. The Climate Hazards Infrared Precipitation with Stations—A New Environmental Record for Monitoring Extremes. Sci. Data 2015, 2, 150066. [Google Scholar] [CrossRef]
  42. Lal, P.; Prakash, A.; Kumar, A.; Srivastava, P.K.; Saikia, P.; Pandey, A.C.; Srivastava, P.; Khan, M.L. Evaluating the 2018 Extreme Flood Hazard Events in Kerala, India. Remote Sens. Lett. 2020, 11, 436–445. [Google Scholar] [CrossRef]
  43. Murali, R.; Kumar, P. Implications of Sea Level Rise Scenarios on Land Use/Land Cover Classes of the Coastal Zones of Cochin, India. J. Environ. Manag. 2015, 148, 124–133. [Google Scholar] [CrossRef] [PubMed]
  44. Ramakrishnan, R.; Remya, P.G.; Mandal, A.; Mohanty, P.; Arayakandy, P.; Mahendra, R.S.; Nair, T.M.B. Wave Induced Coastal Flooding along the Southwest Coast of India during Tropical Cyclone Tauktae. Sci. Rep. 2022, 12, 19966. [Google Scholar] [CrossRef] [PubMed]
  45. Acharya, T.D.; Subedi, A.; Lee, D.H. Evaluation of Water Indices for Surface Water Extraction in a Landsat 8 Scene of Nepal. Sensors 2018, 18, 2580. [Google Scholar] [CrossRef] [PubMed]
  46. Konapala, G.; Kumar, S.V.; Khalique Ahmad, S. Exploring Sentinel-1 and Sentinel-2 Diversity for Flood Inundation Mapping Using Deep Learning. ISPRS J. Photogramm. Remote Sens. 2021, 180, 163–173. [Google Scholar] [CrossRef]
  47. Huang, L.Y.; Wang, Y.C.; Wu, C.C.; Chen, Y.C.; Huang, Y.L. Risk of Flood-Related Diseases of Eyes, Skin and Gastrointestinal Tract in Taiwan: A Retrospective Cohort Study. PLoS ONE 2016, 11, e0155166. [Google Scholar] [CrossRef] [PubMed]
  48. Manavalan, R. SAR Image Analysis Techniques for Flood Area Mapping—Literature Survey. Earth Sci. Inform. 2017, 10, 1–14. [Google Scholar] [CrossRef]
  49. Ryu, J.H.; Won, J.S.; Min, K.D. Waterline Extraction from Landsat TM Data in a Tidal Flat a Case Study in Gomso Bay, Korea. Remote Sens. Environ. 2002, 83, 442–456. [Google Scholar] [CrossRef]
  50. Cao, H.; Zhang, H.; Wang, C.; Zhang, B. Operational Flood Detection Using Sentinel-1 SAR Data over Large Areas. Water 2019, 11, 786. [Google Scholar] [CrossRef]
  51. Sherpa, S.F.; Shirzaei, M.; Ojha, C.; Werth, S.; Hostache, R. Probabilistic Mapping of August 2018 Flood of Kerala, India, Using Space-Borne Synthetic Aperture Radar. IEEE J. Sel. Top. Appl. Earth Obs. Remote Sens. 2020, 13, 896–913. [Google Scholar] [CrossRef]
  52. Alsdorf, D.; Rodriguez, E.; Lettenmaier, D. Measuring Surface Water from Space. Rev. Geophys. 2007, 45, 123. [Google Scholar] [CrossRef]
  53. Mason, D.C.; Giustarini, L.; Garcia-Pintado, J.; Cloke, H.L. Detection of Flooded Urban Areas in High Resolution Synthetic Aperture Radar Images Using Double Scattering. Int. J. Appl. Earth Obs. Geoinf. 2014, 28, 150–159. [Google Scholar] [CrossRef]
  54. Nair, L.; Balan, S. Recent Floods in Kerala and Its Impact on Rice Yield in Kuttanad—A Retrospective Analysis. Mausam 2022, 73, 689–694. [Google Scholar] [CrossRef]
  55. Theenathayalan, V.; Sathyendranath, S.; Kulk, G.; Menon, N.; George, G.; Abdulaziz, A.; Selmes, N.; Brewin, R.J.W.; Rajendran, A.; Xavier, S.; et al. Regional Satellite Algorithms to Estimate Chlorophyll-a and Total Suspended Matter Concentrations in Vembanad Lake. Remote Sens. 2022, 14, 6404. [Google Scholar] [CrossRef]
Figure 1. Map of the Vembanad-Kol-Wetland System situated on the southwest coast of India. Lake Vembanad is the largest water body in the region, with connections to the Arabian Sea at Kochi and further north at Ahzeekode (not shown). Locations of major cities near Lake Vembanad are also given. Colours: light blue is ocean, bright blue is inland water and light grey is land.
Remotesensing 15 05139 g001
Figure 2. Daily rainfall (given as a 7-day moving average) in the Lake Vembanad region averaged for 2018 and the previous decade, 2007–2017 (data from CHIRPS).
Remotesensing 15 05139 g002
Figure 3. Flowchart of data processing for flood mapping in Lake Vembanad. An atmospheric correction is applied to Sentinel-2 data and surface reflectances are obtained to calculate several water indices (1). Sentinel-1 data are radiometric corrected, speckle filtered and reprojected to obtain the backscatter. A threshold (2) was used to calculate binary values of the backscatter and water indices (3). The binary backscatter and water index are then used to create a permanent water body map of Lake Vembanad from clear-sky images to map the minimum water cover in the lake (4). Flood maps (5), i.e., areas of water that fall out of the minimum water cover of Lake Vembanad, are created by comparing binary backscatter (3) and water index maps with their respective permanent water body map (4). Images provide an example of processing of the Modified Normalised Difference Water Index (MNDWI) from 9 January 2018. See Section 2.2, Section 2.3, Section 2.4, Section 2.5 and Section 2.6 for full details.
Remotesensing 15 05139 g003
Figure 4. Application of multi-spectral remote sensing observations for flood mapping using a Sentinel-2 image from 29 January 2018. A false-colour RGB map of the Sentinel-2 image is provided together with a map, histogram, binary map, permanent water body map and flood map for the Normalised Difference Water Index (NDWI) (A), the Modified Normalised Difference Water Index (MNDWI) (B), the Water Ratio Index (WRI) (C), and the Automated Water Extraction Index (AWEI) (D). The dashed line in the histograms shows the threshold used to generate the binary, water and flood maps.
Remotesensing 15 05139 g004
Figure 5. Application of synthetic-aperture radar (SAR) remote sensing observations for flood mapping using a Sentinel-1 image from 29 January 2018. A false-colour RGB map of the Sentinel-2 image is provided together with a map, histogram, binary map, permanent water body map and flood map for the SAR backscatter. The dashed line in the histograms shows the threshold used to generate the binary, water and flood maps.
Remotesensing 15 05139 g005
Figure 6. Maps of the floods in August 2018. A false-colour RGB map of the Sentinel-2 (S2) image on 22 August 2018 (A) is provided together with the S2 flood map based on the Modified Normalised Difference Water Index (MNDWI) (B) and the Sentinel-1 (S1) flood map (C) for the entire study region. Detailed images of the south of Lake Vembanad are provided for the false-colour RGB map (D), the MNDWI-based flood map (E), and the difference between the S1- and S2-based flood maps (F).
Remotesensing 15 05139 g006
Figure 7. Paddy cultivation calendar in the south of Lake Vembanad with the locations of the 17 different paddy fields (A), the annual cultivation calendar for each paddy field (B) and the total area of flooded paddy cultivation fields throughout the year (C).
Remotesensing 15 05139 g007
Figure 8. Application of multi-spectral remote sensing observations for flood mapping using Sentinel-2 images with different types of cloud cover. A false-colour RGB map of the Sentinel-2 image is provided together with a map, histogram, binary map, permanent water body map and flood map based on the Modified Normalised Difference Water Index (MNDWI) for 1 September 2018 (A), 21 October 2018 (B), 25 November 2018 (C) and 15 December 2018 (D). The dashed line in the histograms shows the threshold used to generate the binary, water and flood maps.
Remotesensing 15 05139 g008
Table 1. Total area (in km2) of the permanent water body (PWB) and of floods in the maps of 29 January 2018 and 21–22 August 2018 based on Sentinel-2 multi-spectral observations using the Normalised Difference Water Index (NDWI), Modified Normalised Difference Water Index (MNDWI), Water Ratio Index (WRI) and Automated Water Extraction Index (AWEI) and based on the Sentinel-1 (S1) synthetic-aperture radar observations for the entire Lake Vembanad region and for the south of Lake Vembanad.
Lake VembanadSouthern Region
PWB MapFlood Map January 2018Flood Map August 2018PWB MapFlood Map August 2018
NDWI267384843.00214
MNDWI3061113778.76225
WRI224162362.07183
AWEI35313241714.5261
S12851684487.80197
Table 2. Accuracy of the multi-spectral remote sensing approach of flood mapping. The Sentinel-2 permanent water body (PWB) maps of Lake Vembanad and flood maps for 29 January 2018 using the Normalised Difference Water Index (NDWI), Modified Normalised Difference Water Index (MNDWI), Water Ratio Index (WRI) and Automated Water Extraction Index (AWEI) were compared with Sentinel-1 maps using various accuracy metrics. The highest accuracy per metric is indicated in bold.
PWB MapFlood Map January 2018
NDWIMNDWIWRIAWEINDWIMNDWIWRIAWEI
Producer’s accuracyWater99.298.999.698.097.396.995.794.7
Non-water87.594.780.497.352.858.450.957.5
User’s accuracyWater85.894.575.797.310.829.43.627.1
Non-water99.399.099.798.099.799.199.898.5
Overall accuracy 92.696.787.797.755.264.251.762.8
Critical Success Index 85.393.575.595.410.729.13.626.7
Kappa Coefficient 85.293.575.495.310.545.13.425.9
Table 3. Accuracy of the multi-spectral remote sensing approach of flood mapping for the August 2018 floods. The Sentinel-2 permanent water body (PWB) maps of Lake Vembanad and flood maps for 22 August 2018 using the Modified Normalised Difference Water Index (MNDWI) were compared with Sentinel-1 maps for the south of Lake Vembanad (area shown in Figure 6) using various accuracy metrics. Note that a Sentinel-1 image from 21 August 2018 was used to compare the flood maps.
PWB MapFlood Map August 2018
Producer’s accuracyWater99.586.6
Non-water82.285.0
User’s accuracyWater78.484.7
Non-water99.686.9
Overall accuracy 89.085.8
Critical Success Index 78.174.9
Kappa Coefficient 78.171.6
Table 4. Overview of the paddy fields to the south and east of Lake Vembanad that were identified for the construction of the cultivation calendar (Figure 7). The cultivation season is identified as Puncha in summer and Virippu in autumn. The area of each paddy field (in km2) was estimated using Sentinel-2 multi-spectral remote sensing observations and verified using information from farmers and local agriculture authorities.
Paddy FieldSeasonLatitudeLongitudeArea (km2)
(1) ChithiraPuncha9.5576.423.07
(2) RaniPuncha9.5476.392.42
(3) MarthandamPuncha9.5376.392.78
(4) C-BlockPuncha9.5276.412.75
(5) D-BlockPuncha9.5176.427.52
(6) H-BlockPuncha9.5476.456.24
(7) R-BlockPuncha9.5476.426.63
(8) KuppapuramPuncha, Virippu9.5176.381.59
(9) AarupankPuncha, Virippu9.5076.402.25
(10) CherukalikayalPuncha, Virippu9.5176.391.17
(11) Kanakassery, Meenappally, ValiyeriPuncha, Virippu9.4976.372.74
(12) RomanaPuncha, Virippu9.4876.381.68
(13) PuthanthuramPuncha, Virippu9.4876.371.92
(14) PallikayalPuncha (Virippu)9.5676.422.67
(15) Vaddake pallipadamPuncha, Virippu9.6376.430.34
(16) Malikayal chiraVirippu9.6476.420.55
(17) Vattakayal thattepadamPuncha, Virippu9.6376.430.84
Disclaimer/Publisher’s Note: The statements, opinions and data contained in all publications are solely those of the individual author(s) and contributor(s) and not of MDPI and/or the editor(s). MDPI and/or the editor(s) disclaim responsibility for any injury to people or property resulting from any ideas, methods, instructions or products referred to in the content.

