

Individual Tree Species Identification and Crown Parameters Extraction Based on Mask R-CNN: Assessing the Applicability of Unmanned Aerial Vehicle Optical Images
 and
and
Abstract
:1. Introduction
2. Materials and Methods
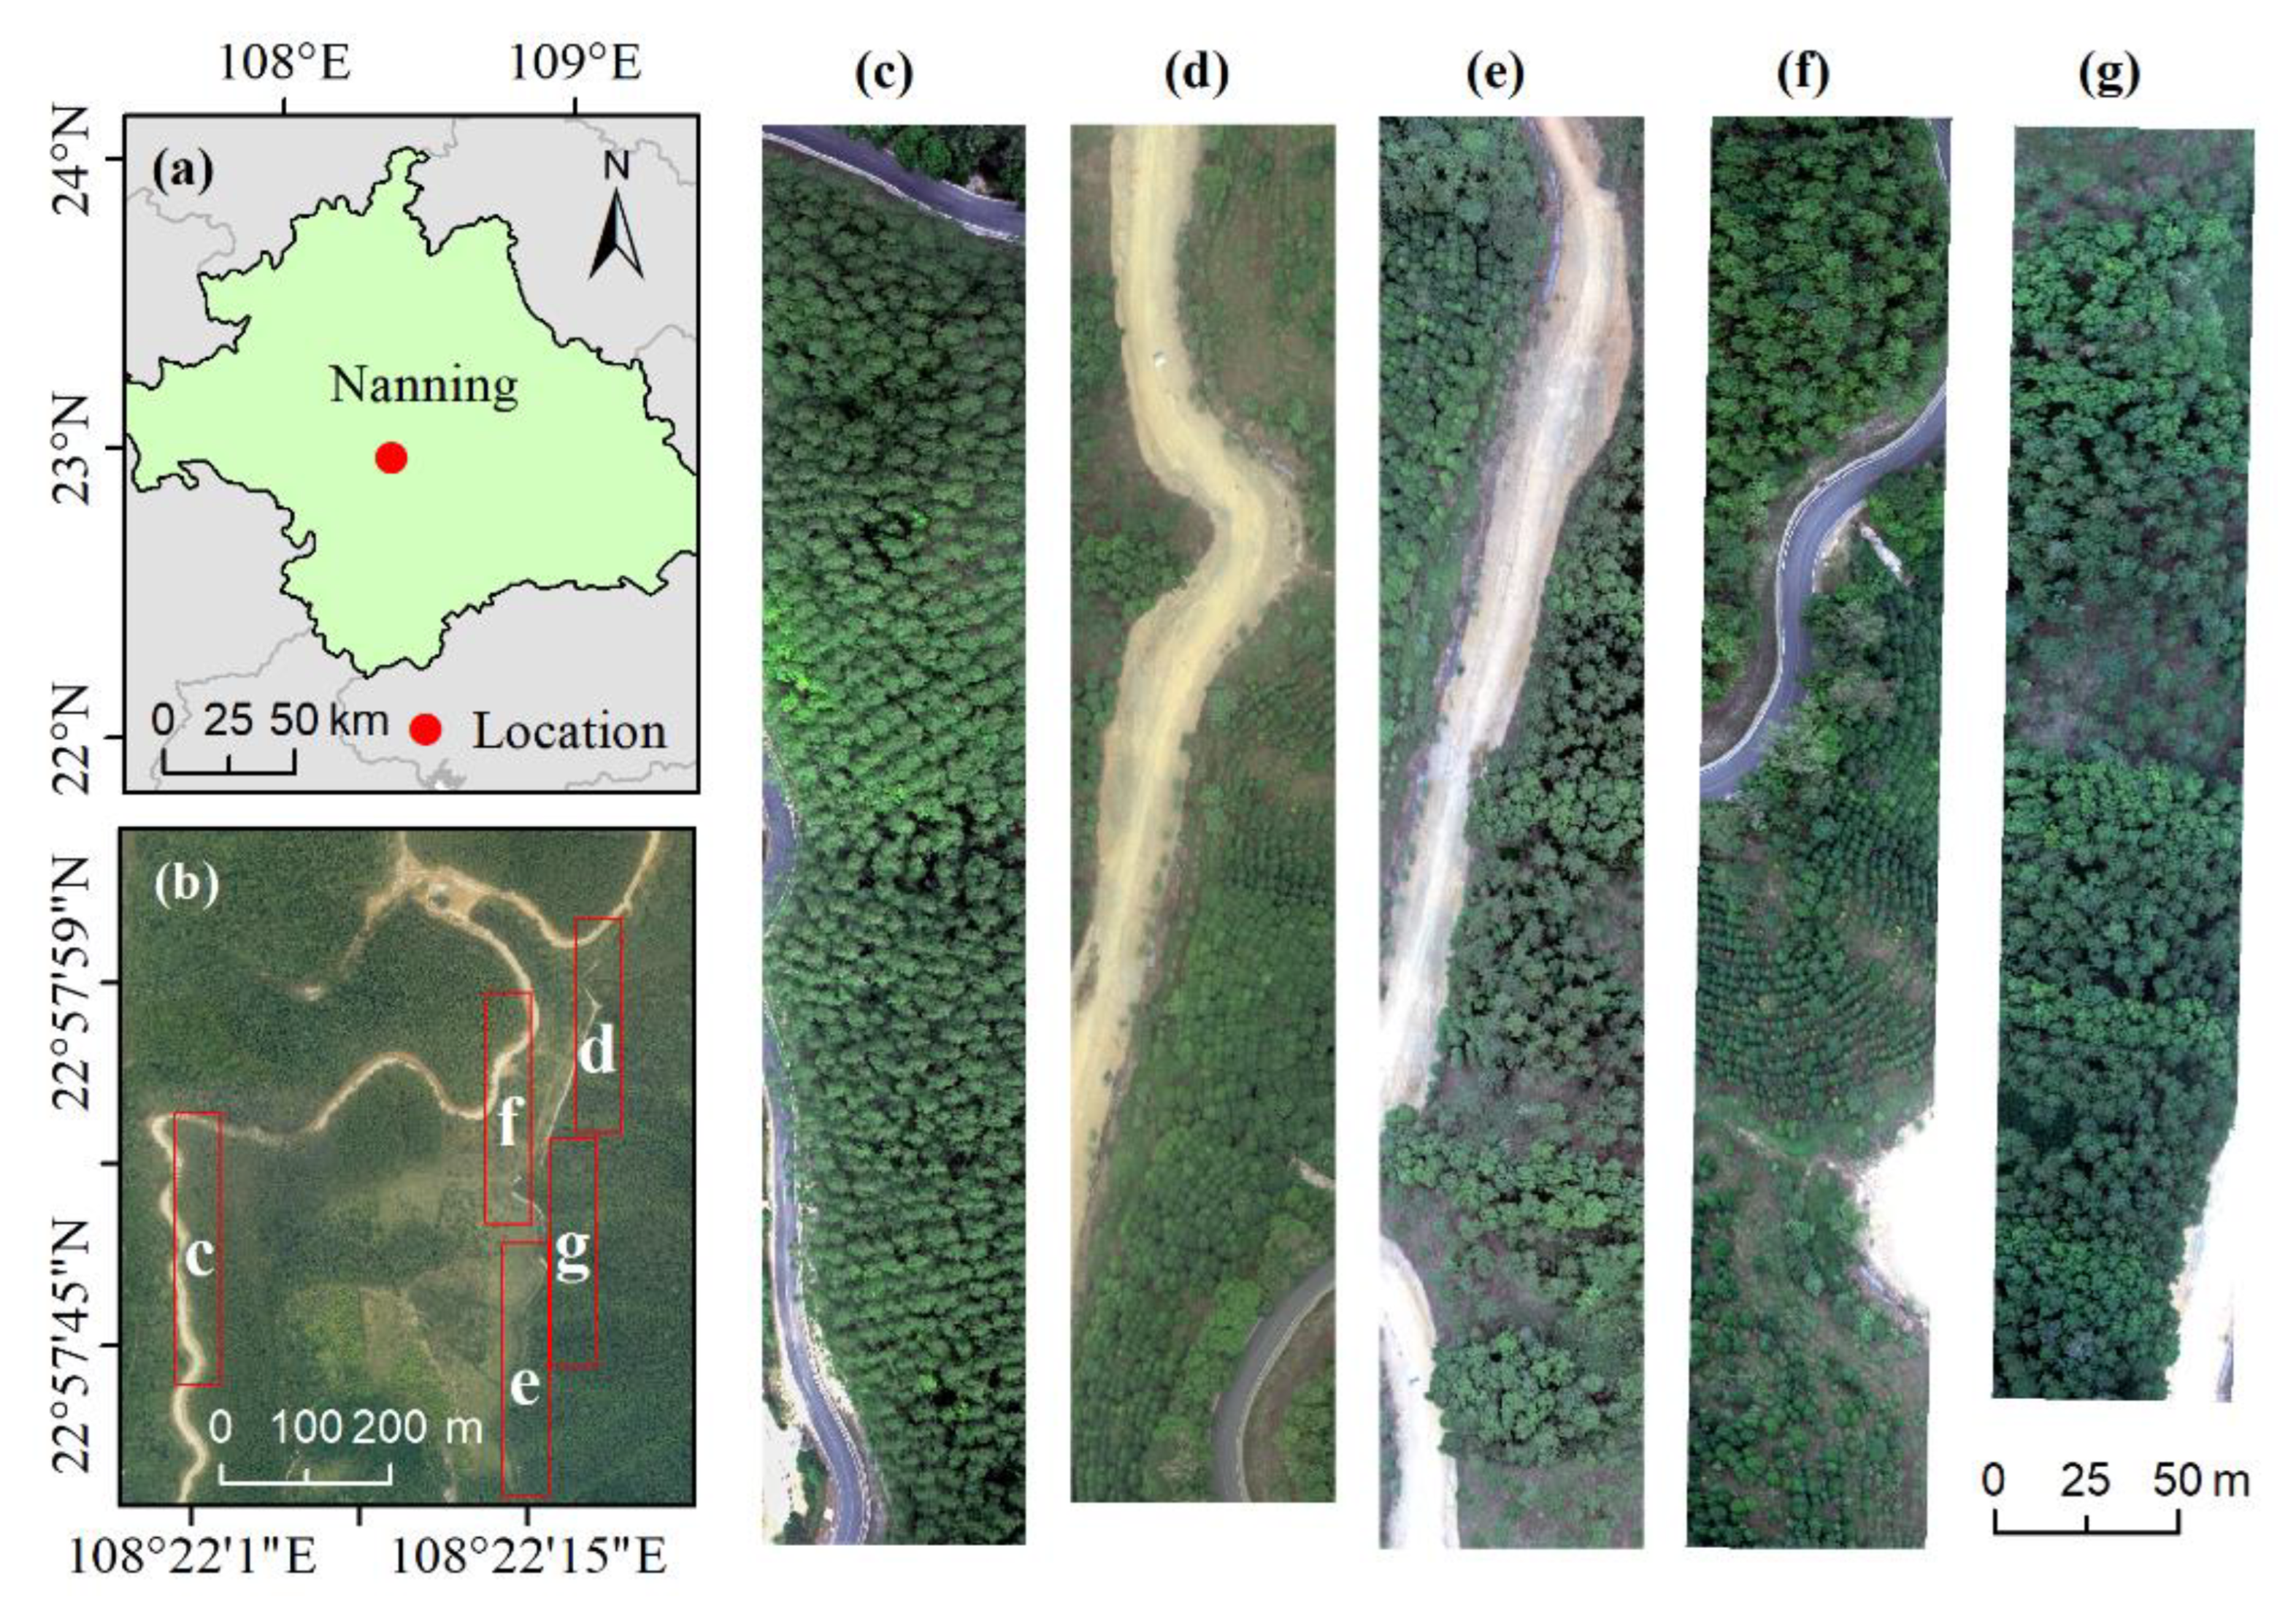
2.1. Study Area
2.2. Data Acquisition and Preprocessing
2.3. Individual Tree Species Sample Set
2.4. Methods
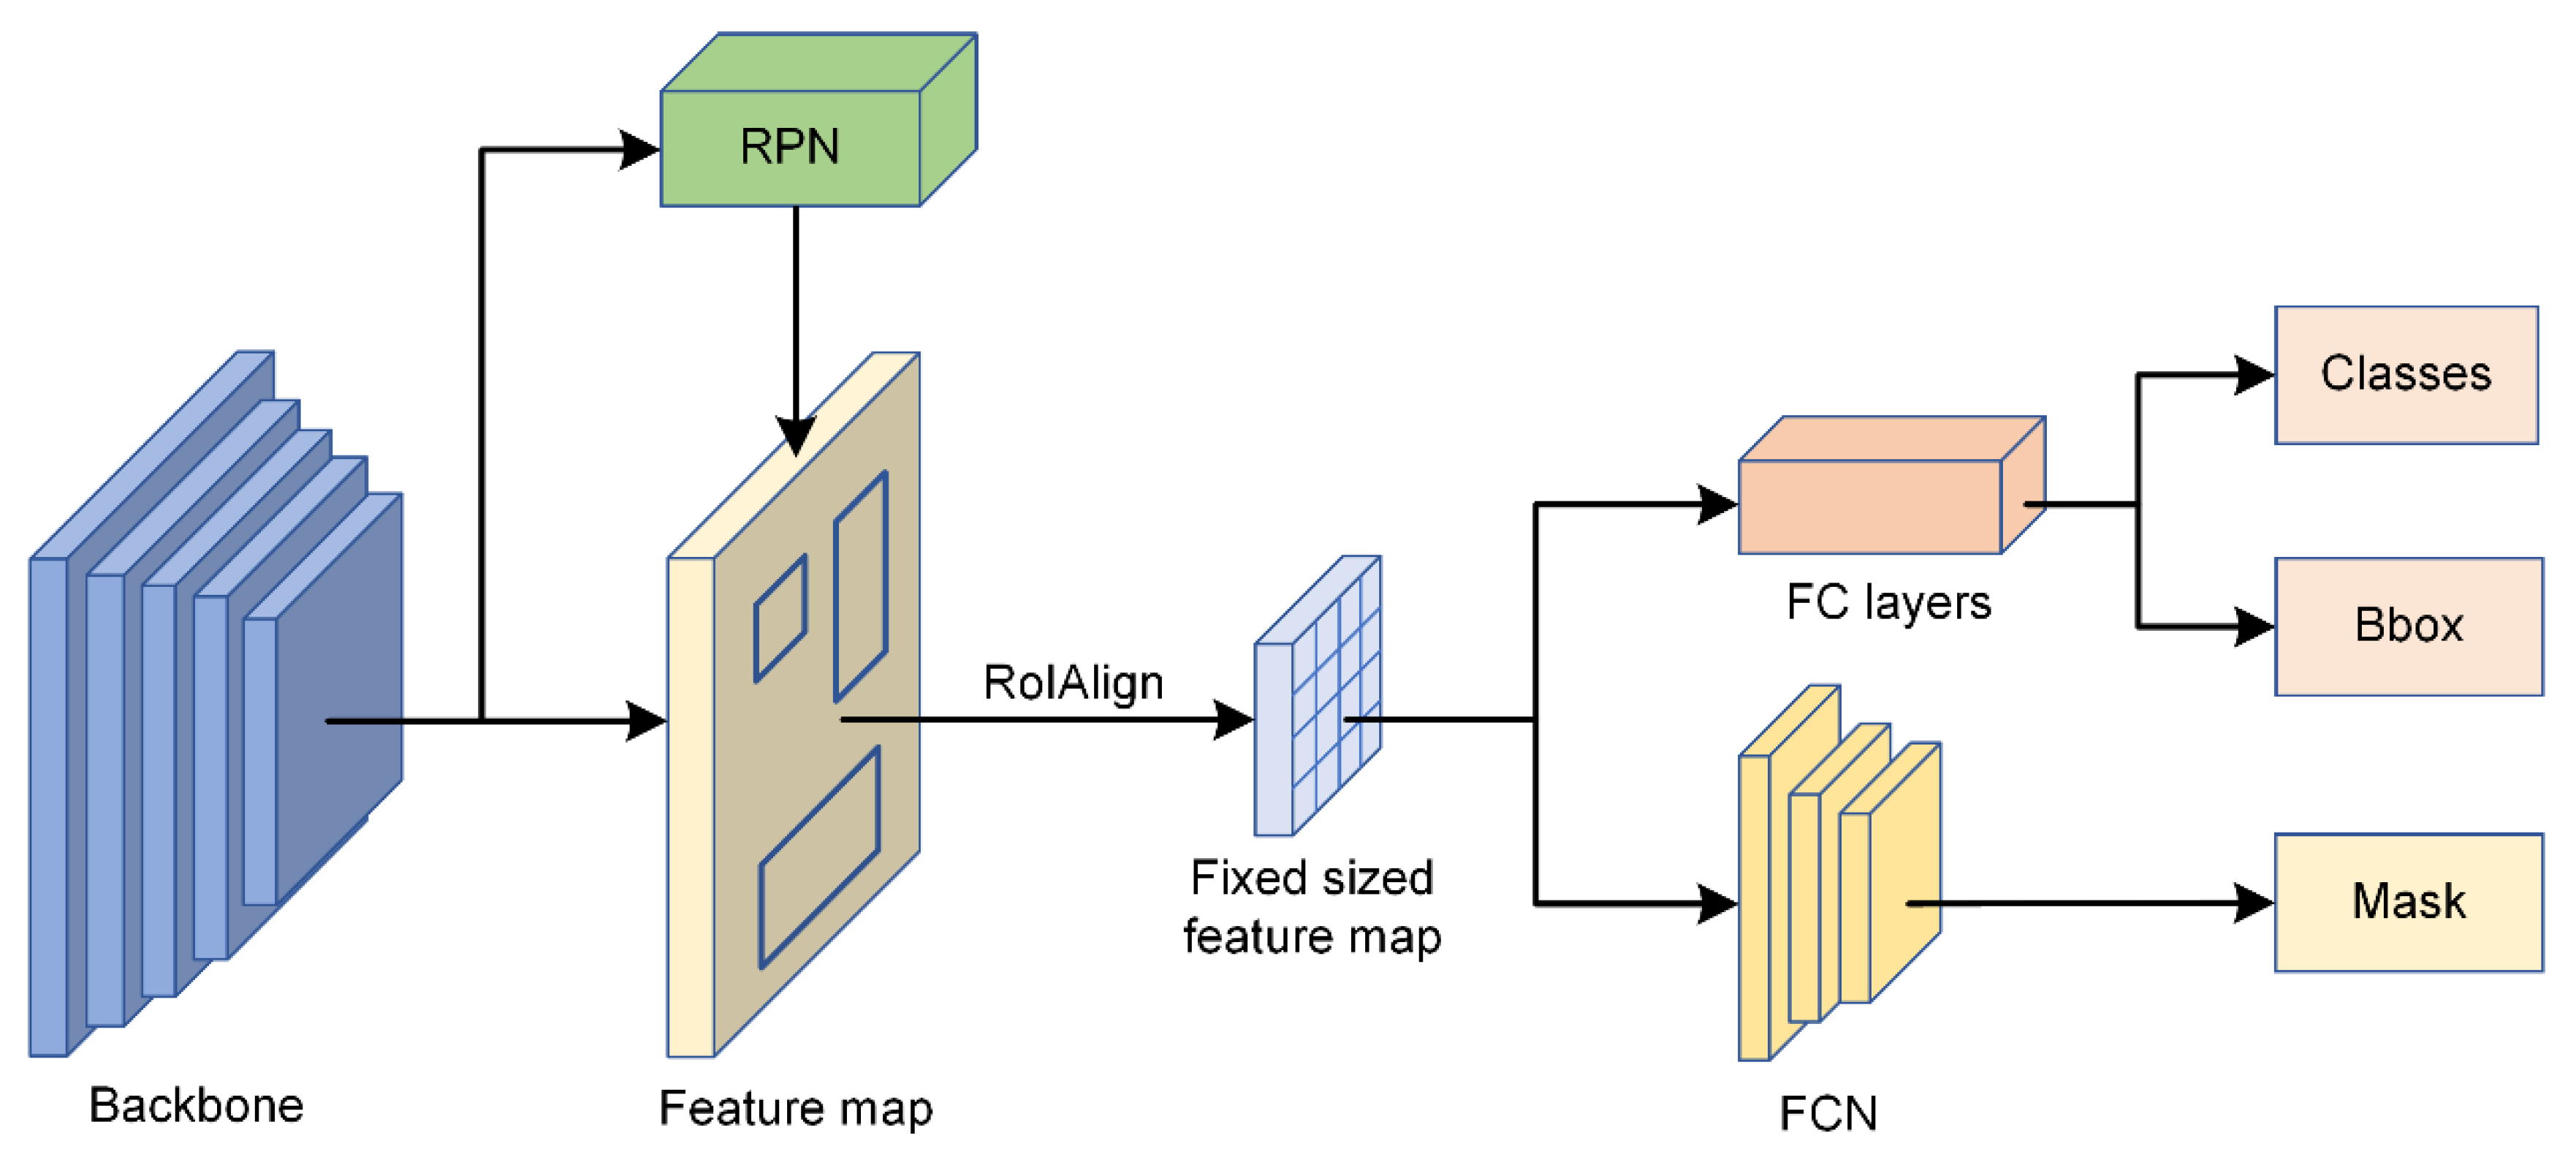
2.4.1. Individual Tree Species Identification Model
2.4.2. Experimental Design
2.4.3. Crown Parameters Extraction
2.4.4. Accuracy Evaluation
3. Results
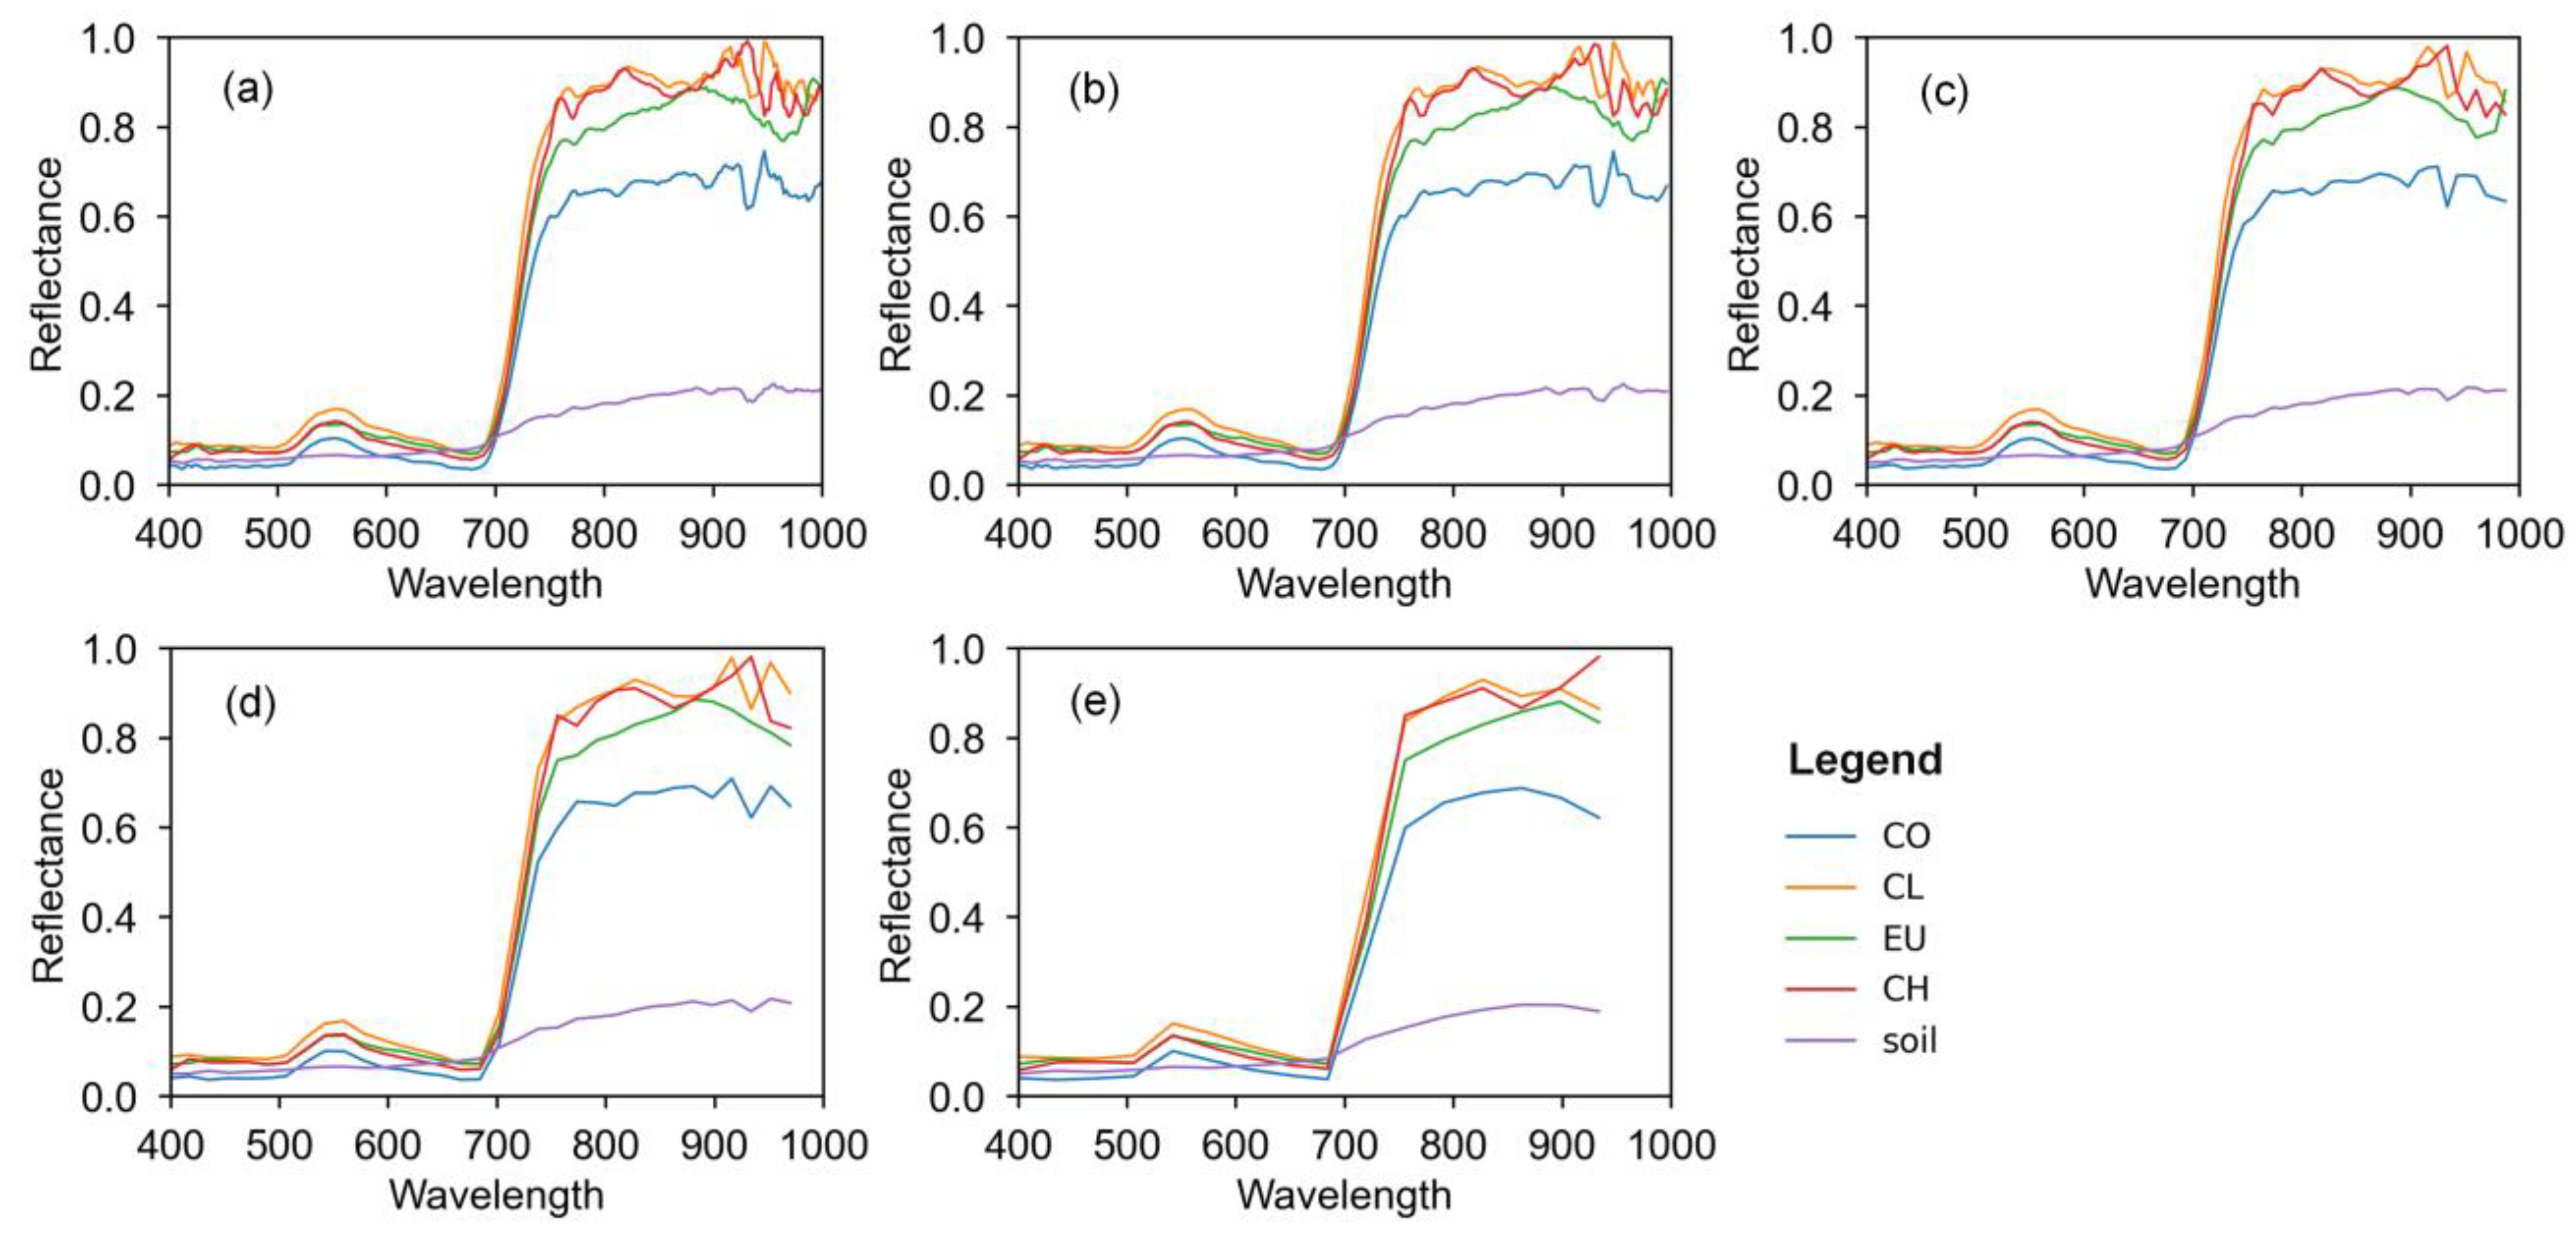
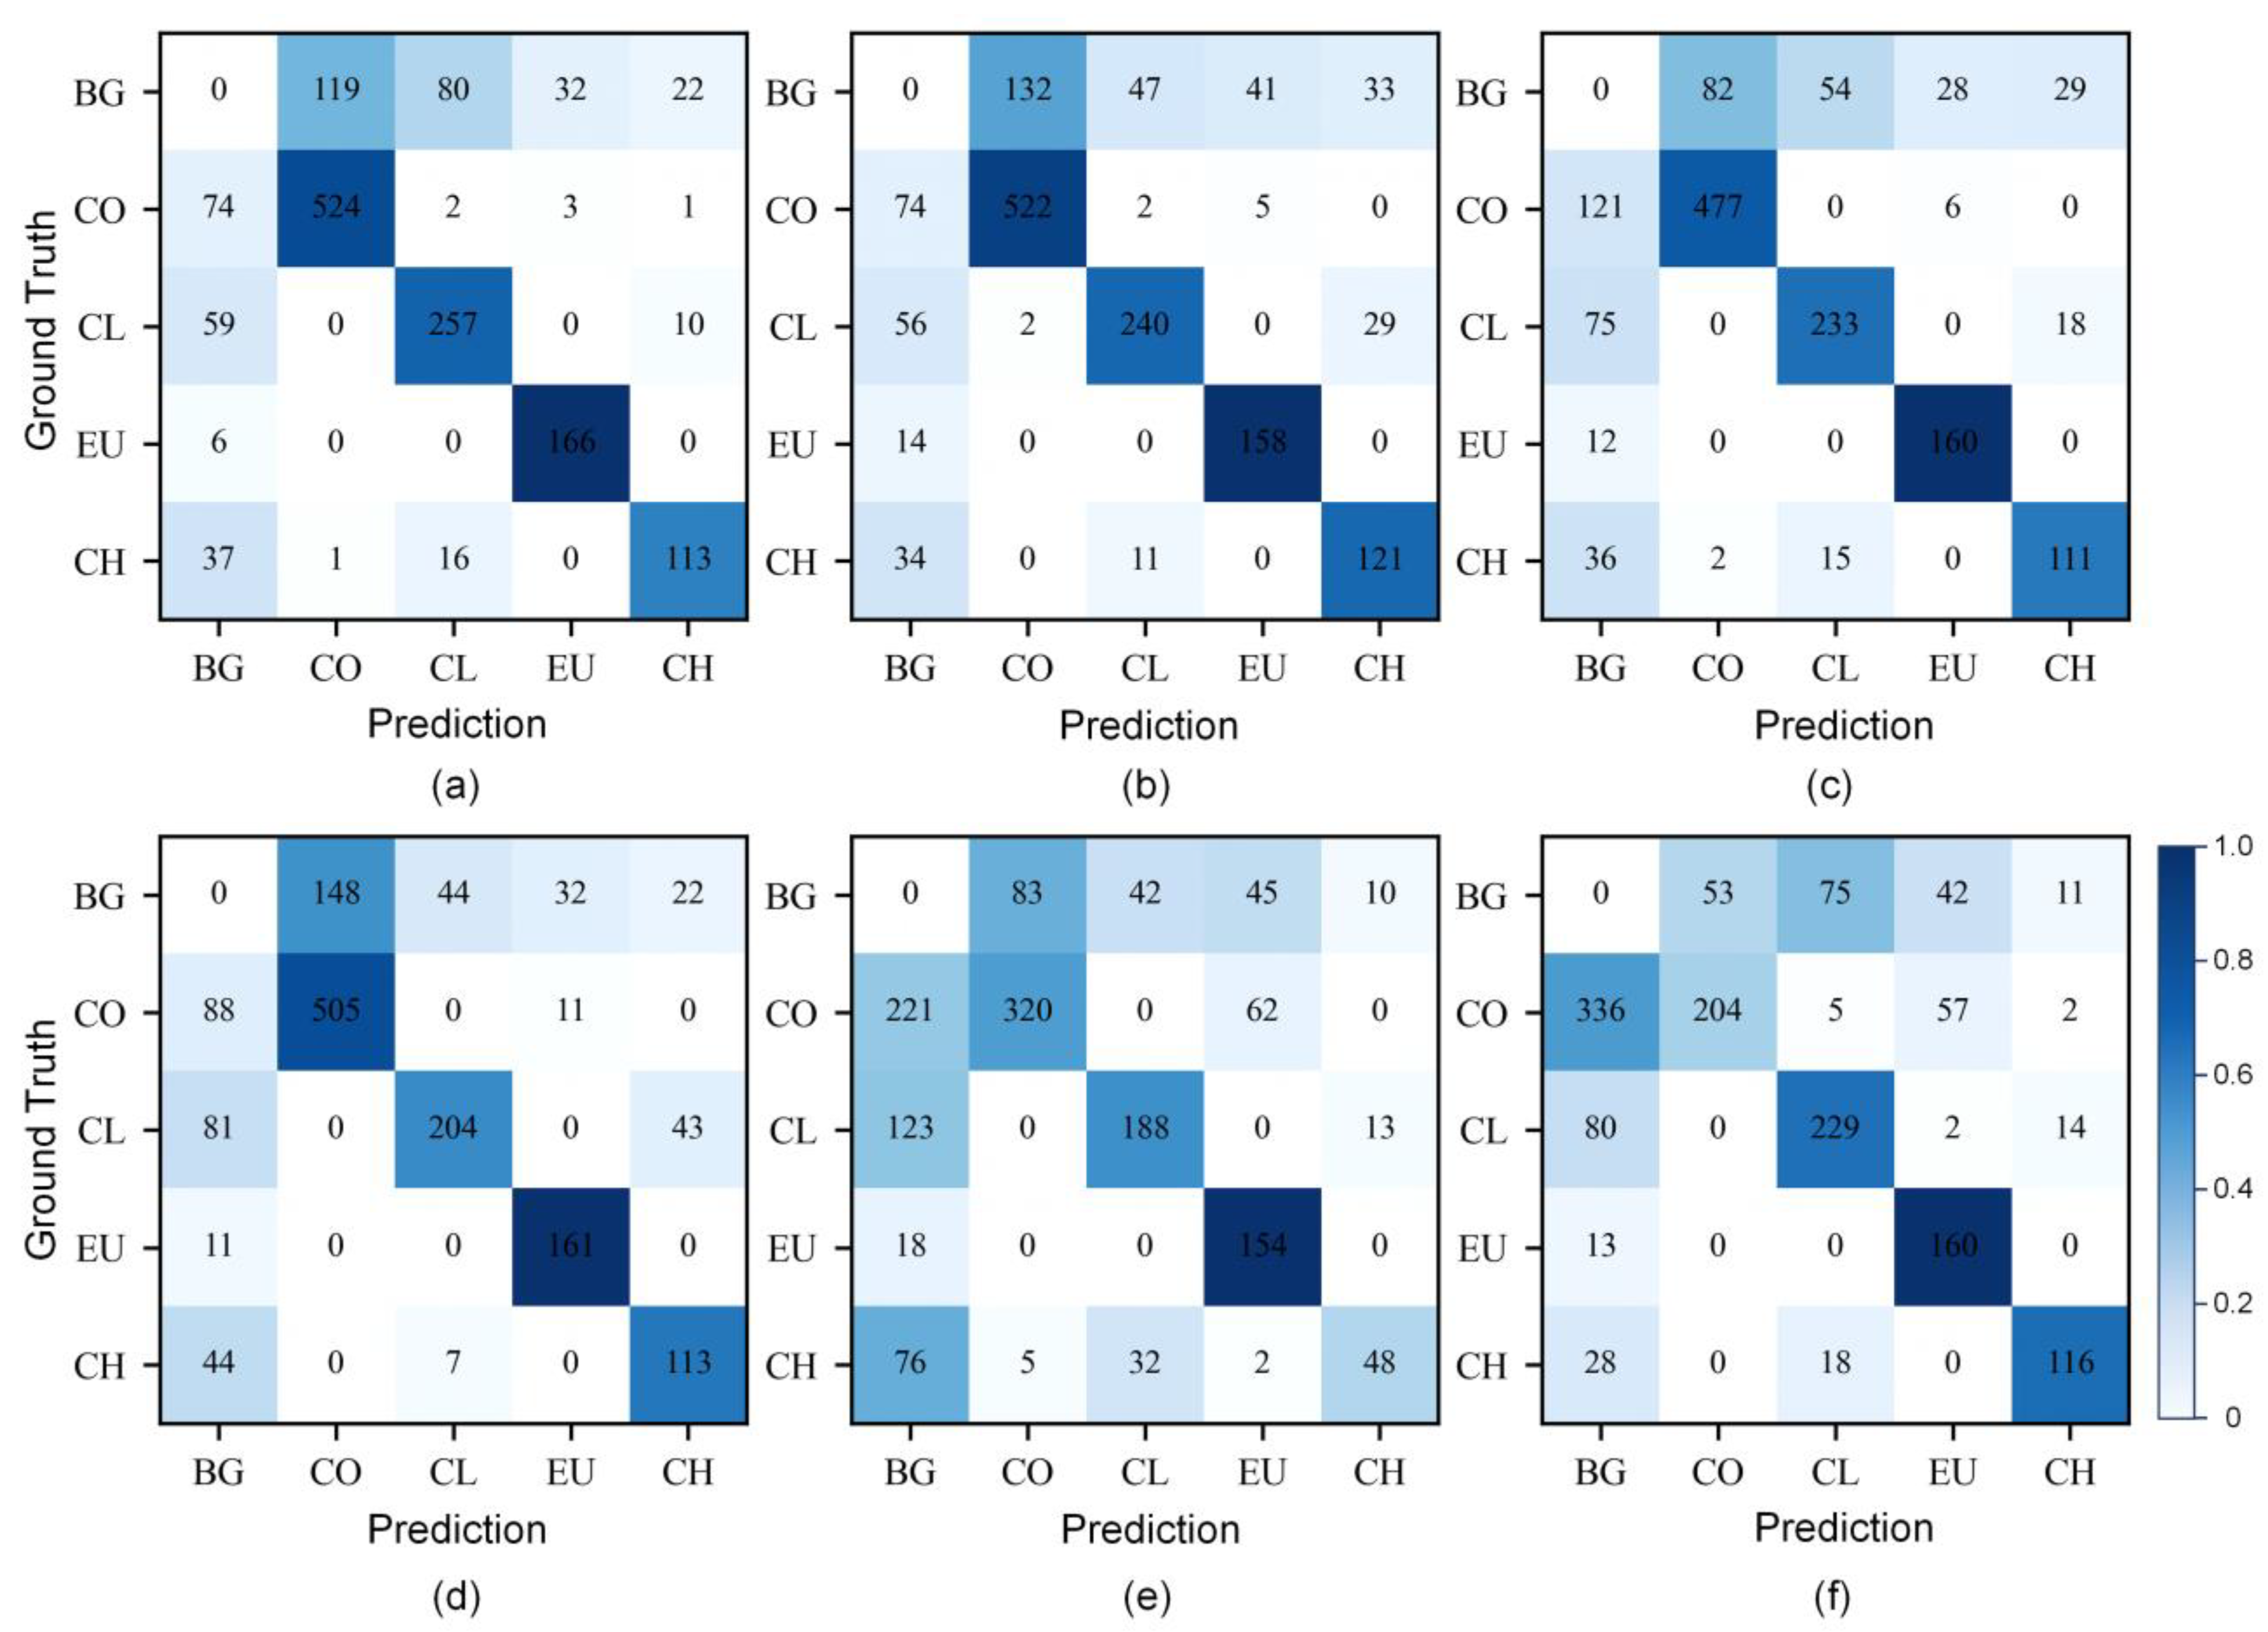
3.1. Performance of Different Spectral Thinning Data
3.2. Performance of PCA Dimensionality Reduction Data
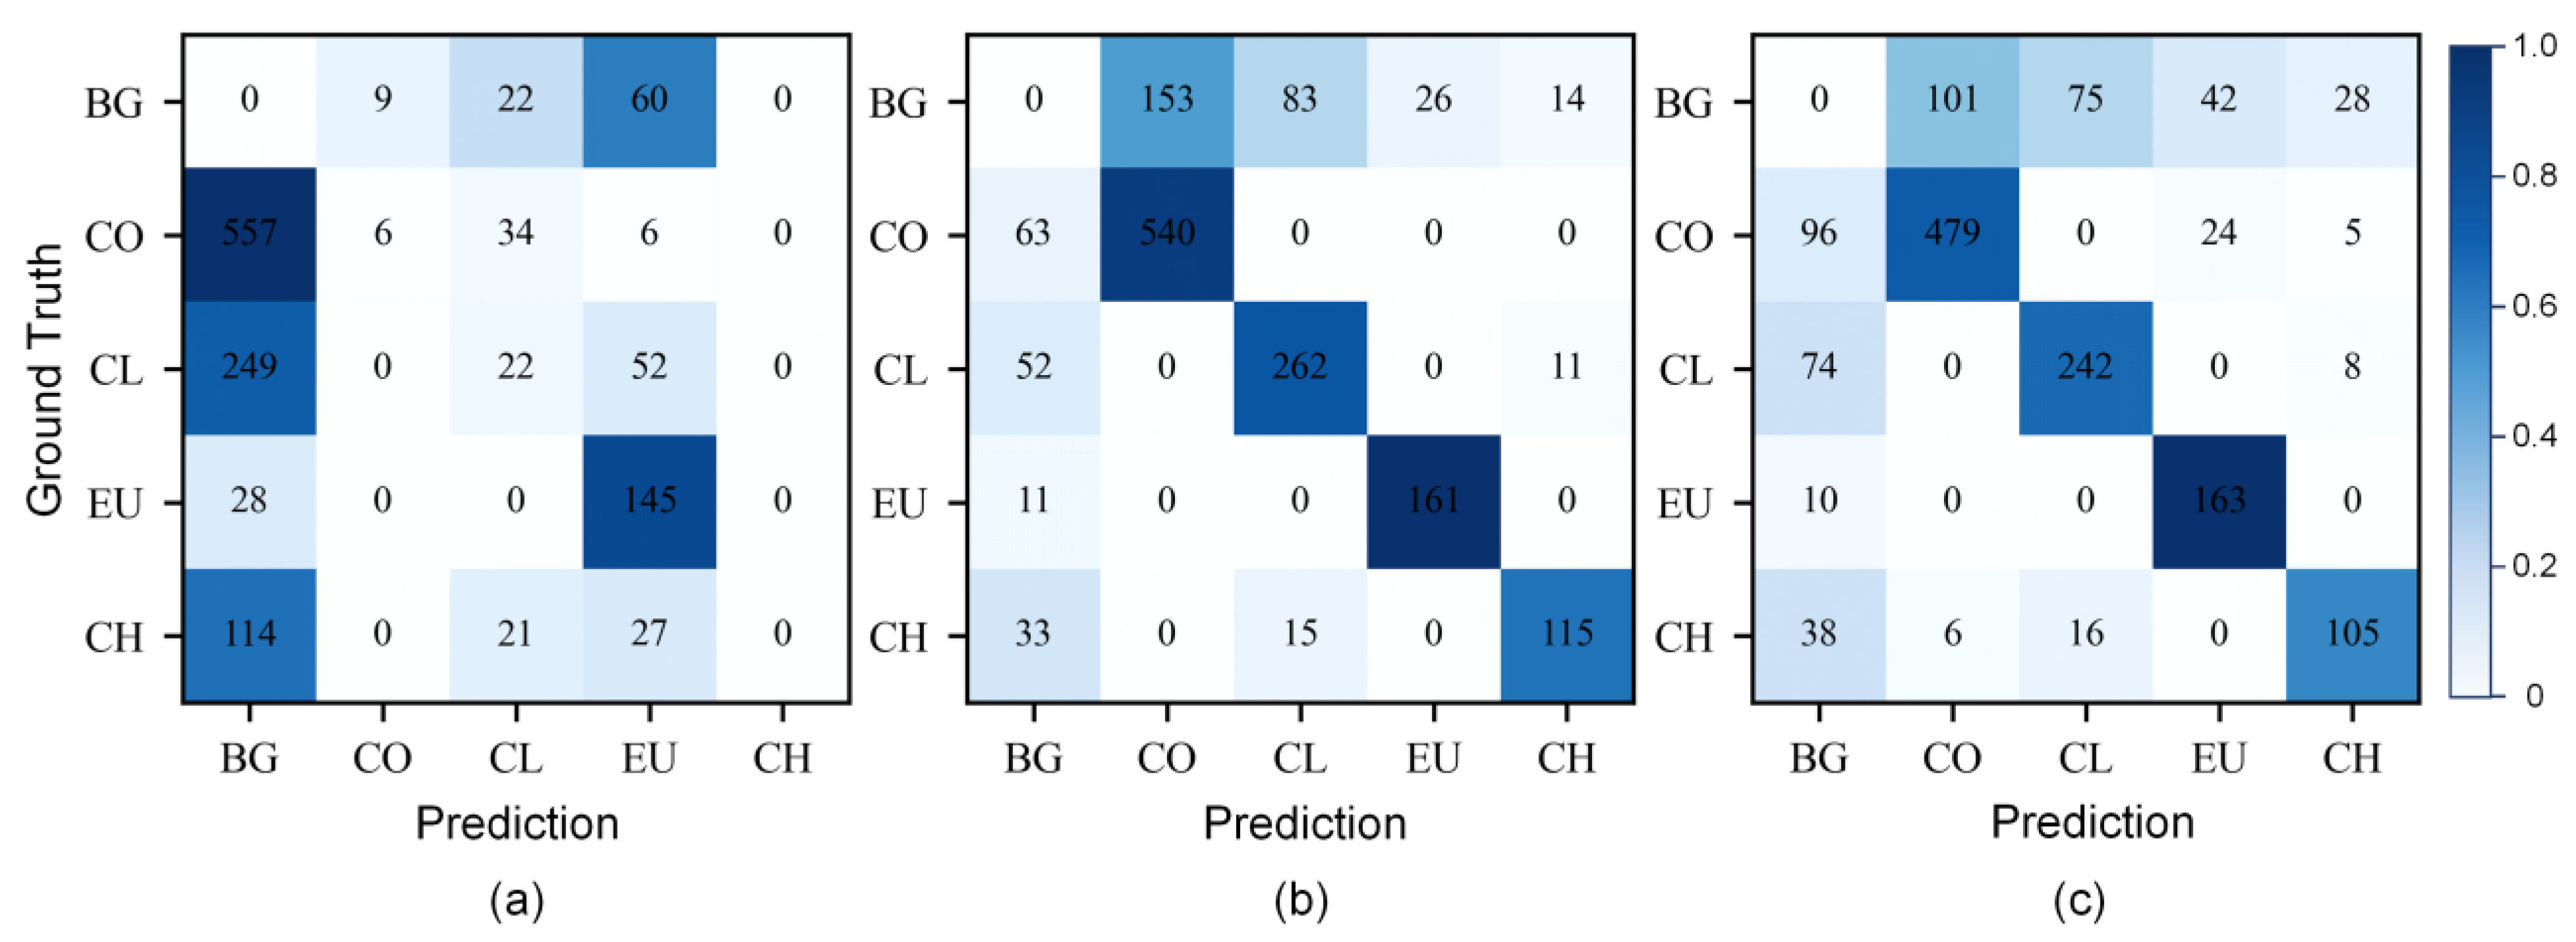
3.3. Performance of Simulated Multispectral Data
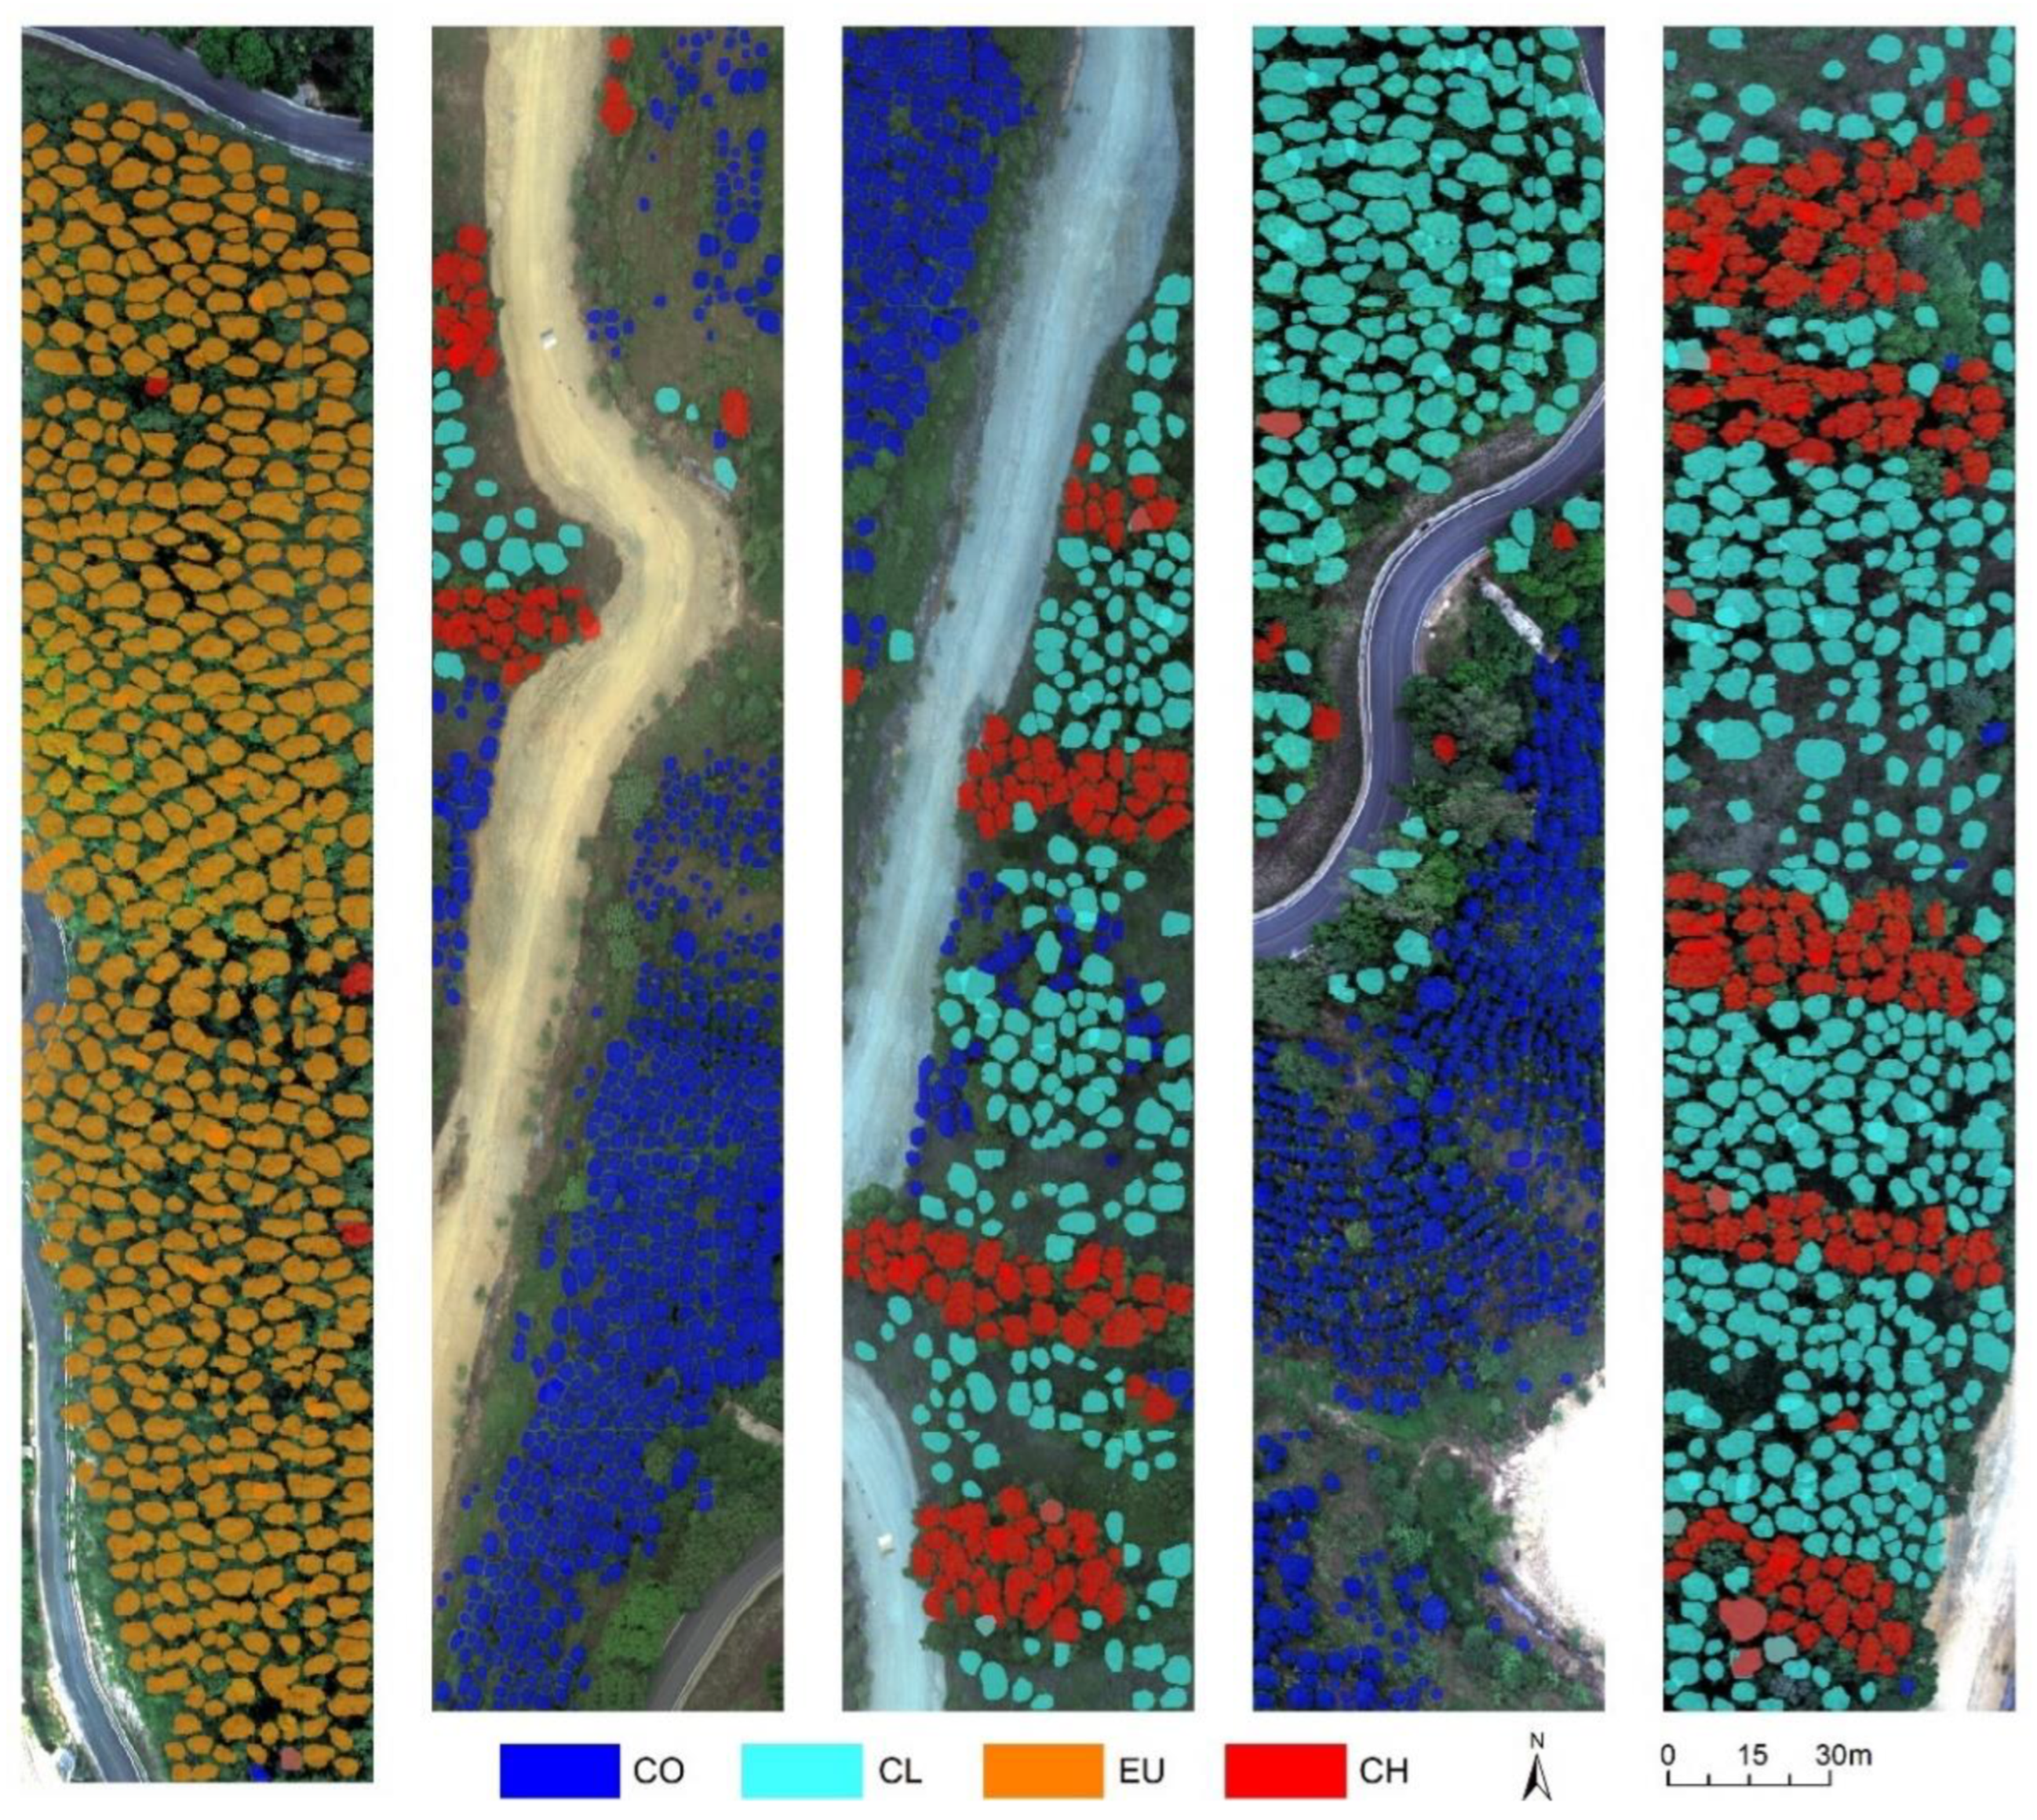
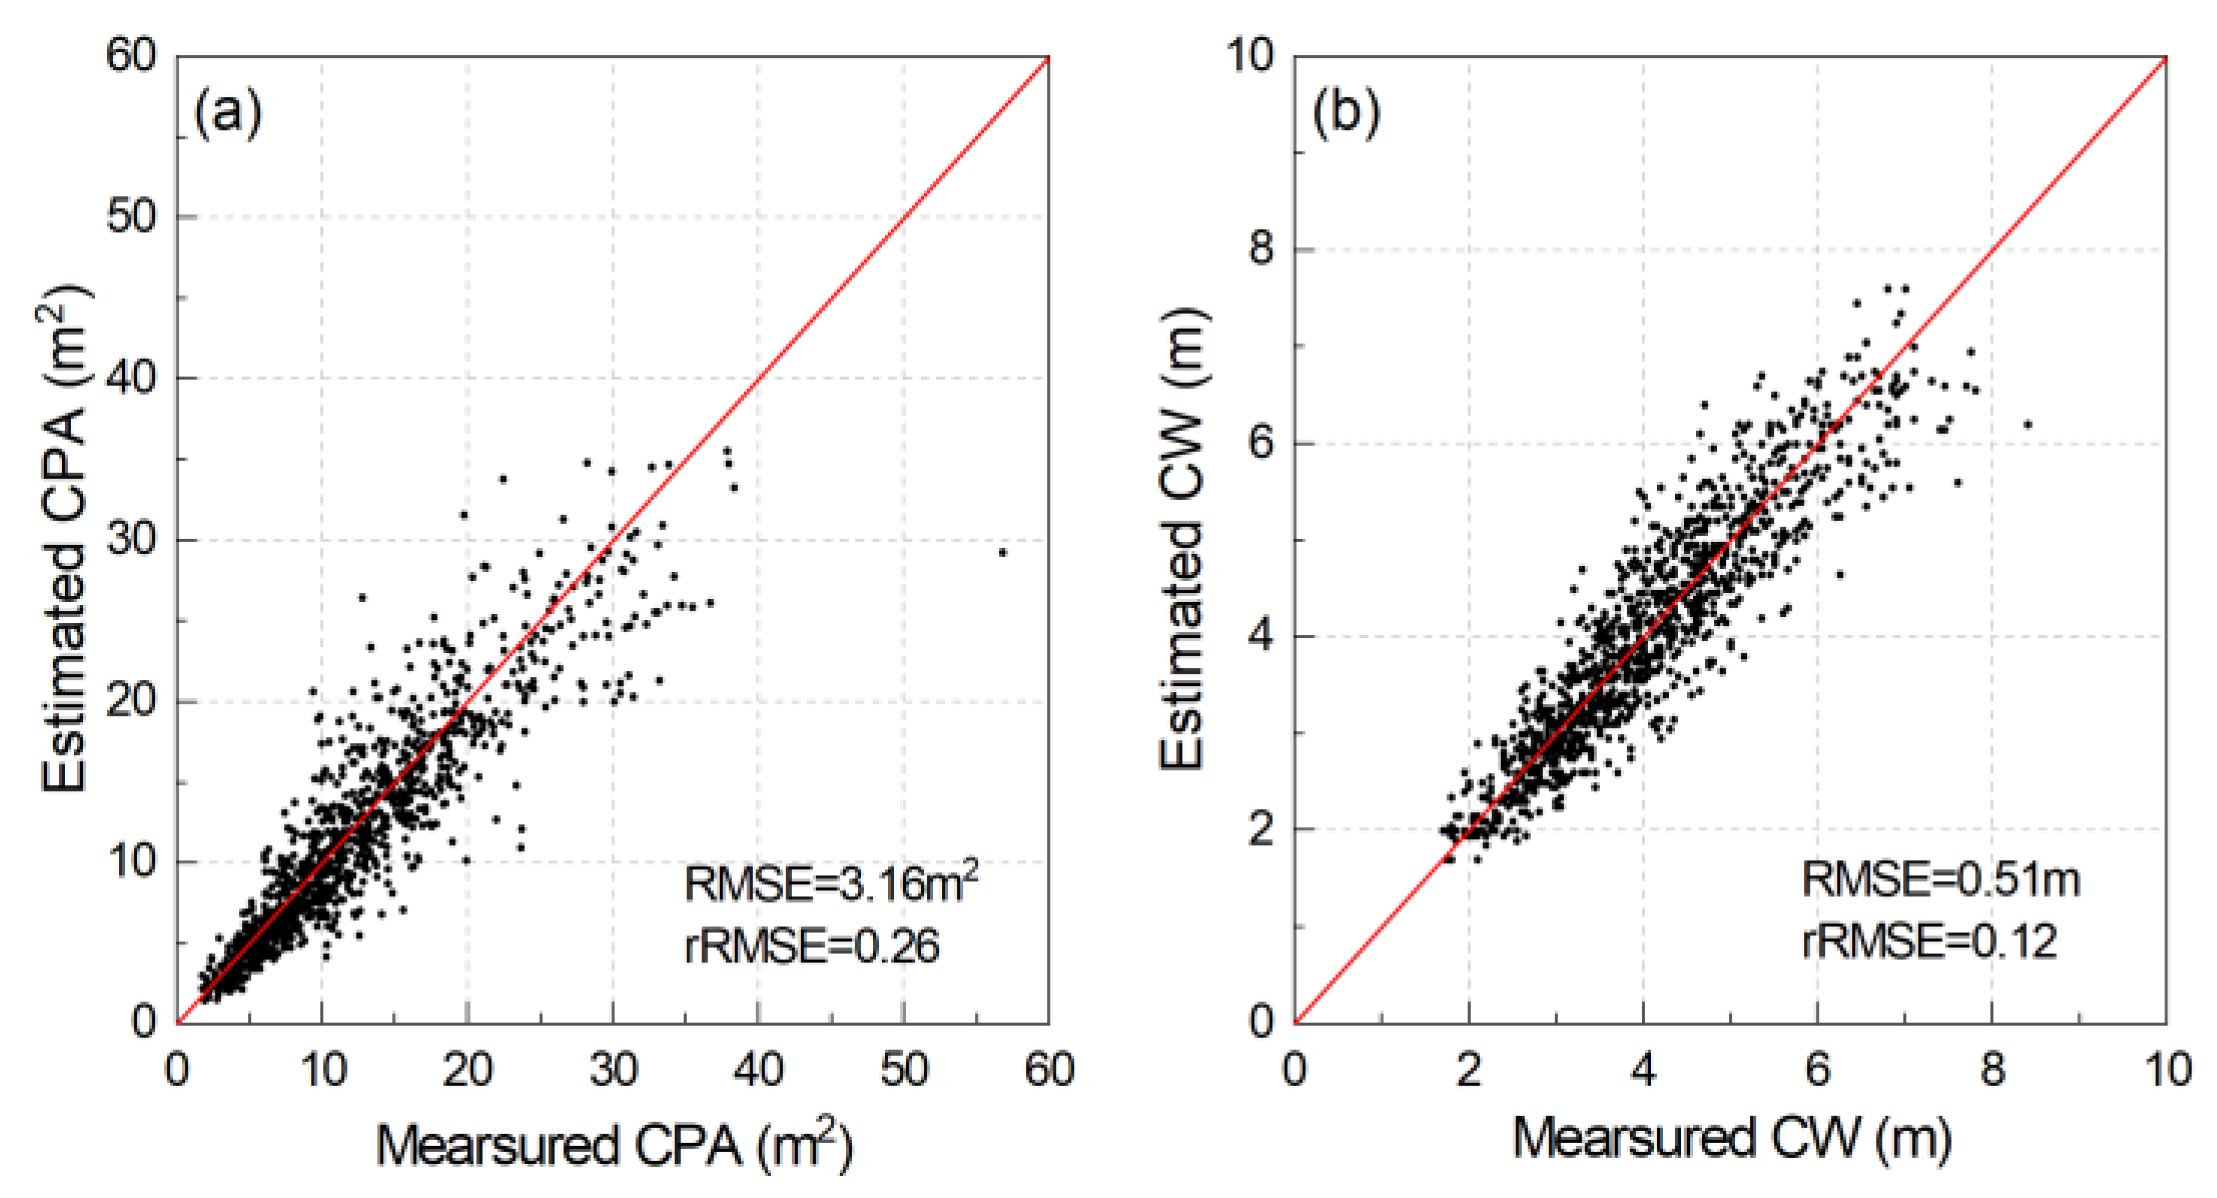
3.4. Individual Tree Crown Parameters Extraction
4. Discussion
4.1. Applicability of Hyperspectral Data
4.2. Practicability of Multispectral and RGB Data
4.3. Influence of Stand Conditions and Tree Species Characteristics
4.4. Limitations of this Study
5. Conclusions
Author Contributions
Funding
Data Availability Statement
Acknowledgments
Conflicts of Interest
References
- Modzelewska, A.; Fassnacht, F.E.; Stereńczak, K. Tree species identification within an extensive forest area with diverse management regimes using airborne hyperspectral data. Int. J. Appl. Earth Obs. Geoinf. 2020, 84, 101960. [Google Scholar] [CrossRef]
- Banskota, A.; Wynne, R.H.; Kayastha, N. Improving within-genus tree species discrimination using the discrete wavelet transform applied to airborne hyperspectral data. Int. J. Remote Sens. 2011, 32, 3551–3563. [Google Scholar] [CrossRef]
- Li, X.; Wang, H.; Luan, J.; Chang, S.X.; Gao, B.; Wang, Y.; Liu, S. Functional diversity dominates positive species mixture effects on ecosystem multifunctionality in subtropical plantations. For. Ecosyst. 2022, 9, 100039. [Google Scholar] [CrossRef]
- Carlson, K.M.; Asner, G.P.; Hughes, R.F.; Ostertag, R.; Martin, R.E. Hyperspectral Remote Sensing of Canopy Biodiversity in Hawaiian Lowland Rainforests. Ecosystems 2007, 10, 536–549. [Google Scholar] [CrossRef]
- Sun, Y.; Xin, Q.; Huang, J.; Huang, B.; Zhang, H. Characterizing Tree Species of a Tropical Wetland in Southern China at the Individual Tree Level Based on Convolutional Neural Network. IEEE J. Sel. Top. Appl. Earth Obs. Remote Sens. 2019, 12, 4415–4425. [Google Scholar] [CrossRef]
- Carvalho, M.d.A.; Marcato, J.; Martins, J.A.C.; Zamboni, P.; Costa, C.S.; Siqueira, H.L.; Araújo, M.S.; Gonçalves, D.N.; Furuya, D.E.G.; Osco, L.P.; et al. A deep learning-based mobile application for tree species mapping in RGB images. Int. J. Appl. Earth Obs. Geoinf. 2022, 114, 103045. [Google Scholar] [CrossRef]
- Zhang, Z.; Zhu, L. A Review on Unmanned Aerial Vehicle Remote Sensing: Platforms, Sensors, Data Processing Methods, and Applications. Drones 2023, 7, 398. [Google Scholar] [CrossRef]
- Masek, J.G.; Hayes, D.J.; Joseph Hughes, M.; Healey, S.P.; Turner, D.P. The role of remote sensing in process-scaling studies of managed forest ecosystems. For. Ecol. Manag. 2015, 355, 109–123. [Google Scholar] [CrossRef]
- Schiefer, F.; Kattenborn, T.; Frick, A.; Frey, J.; Schall, P.; Koch, B.; Schmidtlein, S. Mapping forest tree species in high resolution UAV-based RGB-imagery by means of convolutional neural networks. ISPRS J. Photogramm. Remote Sens. 2020, 170, 205–215. [Google Scholar] [CrossRef]
- Lei, L.; Yin, T.; Chai, G.; Li, Y.; Wang, Y.; Jia, X.; Zhang, X. A novel algorithm of individual tree crowns segmentation considering three-dimensional canopy attributes using UAV oblique photos. Int. J. Appl. Earth Obs. Geoinf. 2022, 112, 102893. [Google Scholar] [CrossRef]
- Zhang, C.; Zhou, J.; Wang, H.; Tan, T.; Cui, M.; Huang, Z.; Wang, P.; Zhang, L. Multi-Species Individual Tree Segmentation and Identification Based on Improved Mask R-CNN and UAV Imagery in Mixed Forests. Remote Sens. 2022, 14, 874. [Google Scholar] [CrossRef]
- Liu, H.; Wu, C. Crown-level tree species classification from AISA hyperspectral imagery using an innovative pixel-weighting approach. Int. J. Appl. Earth Obs. Geoinf. 2018, 68, 298–307. [Google Scholar] [CrossRef]
- Dalponte, M.; Ene, L.T.; Marconcini, M.; Gobakken, T.; Næsset, E. Semi-supervised SVM for individual tree crown species classification. ISPRS J. Photogramm. Remote Sens. 2015, 110, 77–87. [Google Scholar] [CrossRef]
- Dalponte, M.; Ørka, H.O.; Ene, L.T.; Gobakken, T.; Næsset, E. Tree crown delineation and tree species classification in boreal forests using hyperspectral and ALS data. Remote Sens. Environ. 2014, 140, 306–317. [Google Scholar] [CrossRef]
- Qin, H.; Zhou, W.; Yao, Y.; Wang, W. Individual tree segmentation and tree species classification in subtropical broadleaf forests using UAV-based LiDAR, hyperspectral, and ultrahigh-resolution RGB data. Remote Sens. Environ. 2022, 280, 113143. [Google Scholar] [CrossRef]
- Engler, R.; Waser, L.T.; Zimmermann, N.E.; Schaub, M.; Berdos, S.; Ginzler, C.; Psomas, A. Combining ensemble modeling and remote sensing for mapping individual tree species at high spatial resolution. For. Ecol. Manag. 2013, 310, 64–73. [Google Scholar] [CrossRef]
- He, K.; Gkioxari, G.; Dollár, P.; Girshick, R. Mask R-CNN. In Proceedings of the 2017 IEEE International Conference on Computer Vision (ICCV), Venice, Italy, 22–29 October 2017; pp. 2980–2988. [Google Scholar]
- Li, Y.; Chai, G.; Wang, Y.; Lei, L.; Zhang, X. ACE R-CNN: An Attention Complementary and Edge Detection-Based Instance Segmentation Algorithm for Individual Tree Species Identification Using UAV RGB Images and LiDAR Data. Remote Sens. 2022, 14, 3035. [Google Scholar] [CrossRef]
- Yang, M.; Mou, Y.; Liu, S.; Meng, Y.; Liu, Z.; Li, P.; Xiang, W.; Zhou, X.; Peng, C. Detecting and mapping tree crowns based on convolutional neural network and Google Earth images. Int. J. Appl. Earth Obs. Geoinf. 2022, 108, 102764. [Google Scholar] [CrossRef]
- Xi, X.; Xia, K.; Yang, Y.; Du, X.; Feng, H. Evaluation of dimensionality reduction methods for individual tree crown delineation using instance segmentation network and UAV multispectral imagery in urban forest. Comput. Electron. Agric. 2021, 191, 106506. [Google Scholar] [CrossRef]
- Shi, Y.; Skidmore, A.K.; Wang, T.; Holzwarth, S.; Heiden, U.; Pinnel, N.; Zhu, X.; Heurich, M. Tree species classification using plant functional traits from LiDAR and hyperspectral data. Int. J. Appl. Earth Obs. Geoinf. 2018, 73, 207–219. [Google Scholar] [CrossRef]
- Zhang, B.; Zhao, L.; Zhang, X. Three-dimensional convolutional neural network model for tree species classification using airborne hyperspectral images. Remote Sens. Environ. 2020, 247, 111938. [Google Scholar] [CrossRef]
- Chen, L.; Wei, Y.; Yao, Z.; Chen, E.; Zhang, X. Data Augmentation in Prototypical Networks for Forest Tree Species Classification Using Airborne Hyperspectral Images. IEEE Trans. Geosci. Remote Sens. 2022, 60, 1–16. [Google Scholar] [CrossRef]
- Fassnacht, F.E.; Latifi, H.; Stereńczak, K.; Modzelewska, A.; Lefsky, M.; Waser, L.T.; Straub, C.; Ghosh, A. Review of studies on tree species classification from remotely sensed data. Remote Sens. Environ. 2016, 186, 64–87. [Google Scholar] [CrossRef]
- Guo, X.; Li, H.; Jing, L.; Wang, P. Individual Tree Species Classification Based on Convolutional Neural Networks and Multitemporal High-Resolution Remote Sensing Images. Sensors 2022, 22, 3157. [Google Scholar] [CrossRef] [PubMed]
- Savitzky, A.; Golay, M.J.E. Smoothing and Differentiation of Data by Simplified Least Squares Procedures. Anal. Chem. 1964, 36, 1627–1639. [Google Scholar] [CrossRef]
- Zhang, H.; Zhang, S.; Dong, W.; Luo, W.; Huang, Y.; Zhan, B.; Liu, X. Detection of common defects on mandarins by using visible and near infrared hyperspectral imaging. Infrared Phys. Technol. 2020, 108, 103341. [Google Scholar] [CrossRef]
- Raczko, E.; Zagajewski, B. Comparison of support vector machine, random forest and neural network classifiers for tree species classification on airborne hyperspectral APEX images. Eur. J. Remote Sens. 2017, 50, 144–154. [Google Scholar] [CrossRef]
- Lee, J.; Cai, X.; Lellmann, J.; Dalponte, M.; Malhi, Y.; Butt, N.; Morecroft, M.; Schönlieb, C.B.; Coomes, D.A. Individual Tree Species Classification From Airborne Multisensor Imagery Using Robust PCA. IEEE J. Sel. Top. Appl. Earth Obs. Remote Sens. 2016, 9, 2554–2567. [Google Scholar] [CrossRef]
- Pandey, P.C.; Tate, N.J.; Balzter, H. Mapping Tree Species in Coastal Portugal Using Statistically Segmented Principal Component Analysis and Other Methods. IEEE Sens. J. 2014, 14, 4434–4441. [Google Scholar] [CrossRef]
- Fırat, H.; Asker, M.E.; Hanbay, D. Classification of hyperspectral remote sensing images using different dimension reduction methods with 3D/2D CNN. Remote Sens. Appl. Soc. Environ. 2022, 25, 100694. [Google Scholar] [CrossRef]
- Dadon, A.; Mandelmilch, M.; Ben-Dor, E.; Sheffer, E. Sequential PCA-based Classification of Mediterranean Forest Plants using Airborne Hyperspectral Remote Sensing. Remote Sens. 2019, 11, 2800. [Google Scholar] [CrossRef]
- Pedregosa, F.; Varoquaux, G.; Gramfort, A.; Michel, V.; Thirion, B.; Grisel, O.; Blondel, M.; Prettenhofer, P.; Weiss, R.; Dubourg, V.; et al. Scikit-learn: Machine Learning in Python. J. Mach. Learn. Res. 2011, 12, 2825–2830. [Google Scholar]
- Osco, L.P.; Marcato Junior, J.; Marques Ramos, A.P.; de Castro Jorge, L.A.; Fatholahi, S.N.; de Andrade Silva, J.; Matsubara, E.T.; Pistori, H.; Gonçalves, W.N.; Li, J. A review on deep learning in UAV remote sensing. Int. J. Appl. Earth Obs. Geoinf. 2021, 102, 102456. [Google Scholar] [CrossRef]
- Del Pozo, S.; Lindenbergh, R.; Rodríguez-Gonzálvez, P.; Kees Blom, J.; González-Aguilera, D. Discrimination between Sedimentary Rocks from Close-Range Visible and Very-Near-Infrared Images. PLoS ONE 2015, 10, e0132471. [Google Scholar] [CrossRef] [PubMed]
- De Castro, A.I.; Ehsani, R.; Ploetz, R.; Crane, J.H.; Abdulridha, J. Optimum spectral and geometric parameters for early detection of laurel wilt disease in avocado. Remote Sens. Environ. 2015, 171, 33–44. [Google Scholar] [CrossRef]
- Wu, X.; Sahoo, D.; Hoi, S.C.H. Recent advances in deep learning for object detection. Neurocomputing 2020, 396, 39–64. [Google Scholar] [CrossRef]
- Hao, Z.; Lin, L.; Post, C.J.; Mikhailova, E.A.; Li, M.; Chen, Y.; Yu, K.; Liu, J. Automated tree-crown and height detection in a young forest plantation using mask region-based convolutional neural network (Mask R-CNN). ISPRS J. Photogramm. Remote Sens. 2021, 178, 112–123. [Google Scholar] [CrossRef]
- Zhong, H.; Lin, W.; Liu, H.; Ma, N.; Liu, K.; Cao, R.; Wang, T.; Ren, Z. Identification of tree species based on the fusion of UAV hyperspectral image and LiDAR data in a coniferous and broad-leaved mixed forest in Northeast China. Front. Plant Sci. 2022, 13, 964769. [Google Scholar] [CrossRef]
- Zabalza, J.; Ren, J.; Yang, M.; Zhang, Y.; Wang, J.; Marshall, S.; Han, J. Novel Folded-PCA for improved feature extraction and data reduction with hyperspectral imaging and SAR in remote sensing. ISPRS J. Photogramm. Remote Sens. 2014, 93, 112–122. [Google Scholar] [CrossRef]
- Jolliffe, I. Principal Component Analysis. In Encyclopedia of Statistics in Behavioral Science; John Wiley & Sons, Ltd.: Chichester, UK, 2005; pp. 1580–1584. [Google Scholar]
- Peerbhay, K.Y.; Mutanga, O.; Ismail, R. Investigating the Capability of Few Strategically Placed Worldview-2 Multispectral Bands to Discriminate Forest Species in KwaZulu-Natal, South Africa. IEEE J. Sel. Top. Appl. Earth Obs. Remote Sens. 2014, 7, 307–316. [Google Scholar] [CrossRef]
- Onishi, M.; Ise, T. Explainable identification and mapping of trees using UAV RGB image and deep learning. Sci. Rep. 2021, 11, 903. [Google Scholar] [CrossRef]
- Jiang, X.; Wu, Z.; Han, S.; Yan, H.; Zhou, B.; Li, J. A multi-scale approach to detecting standing dead trees in UAV RGB images based on improved faster R-CNN. PLoS ONE 2023, 18, e0281084. [Google Scholar] [CrossRef]
- Sun, Y.; Li, Z.; He, H.; Guo, L.; Zhang, X.; Xin, Q. Counting trees in a subtropical mega city using the instance segmentation method. Int. J. Appl. Earth Obs. Geoinf. 2022, 106, 102662. [Google Scholar] [CrossRef]
- Fang, F.; Im, J.; Lee, J.; Kim, K. An improved tree crown delineation method based on live crown ratios from airborne LiDAR data. GIScience Remote Sens. 2016, 53, 402–419. [Google Scholar] [CrossRef]
- Yun, T.; Jiang, K.; Li, G.; Eichhorn, M.P.; Fan, J.; Liu, F.; Chen, B.; An, F.; Cao, L. Individual tree crown segmentation from airborne LiDAR data using a novel Gaussian filter and energy function minimization-based approach. Remote Sens. Environ. 2021, 256, 112307. [Google Scholar] [CrossRef]


| Parameters | Values | Parameters | Values |
|---|---|---|---|
| Flight altitude | 100 m | Flight speed | 4 m/s |
| Wavelength range | 400–1000 nm | Spectral number | 271 |
| Spectral resolution | 2.2 nm | Spatial resolution | 0.1 m |
| Lens focal length | 8 mm | Field of view | 33° |
| Bit depth | 12 bits | CMOS pixel size | 7.4 μm |
| Tree Species | Training Set | Test Set |
|---|---|---|
| CO | 1352 | 328 |
| CL | 984 | 251 |
| EU | 546 | 130 |
| CH | 573 | 141 |
| Experiments | Data Processing Methods | Data Description | Number of Bands |
|---|---|---|---|
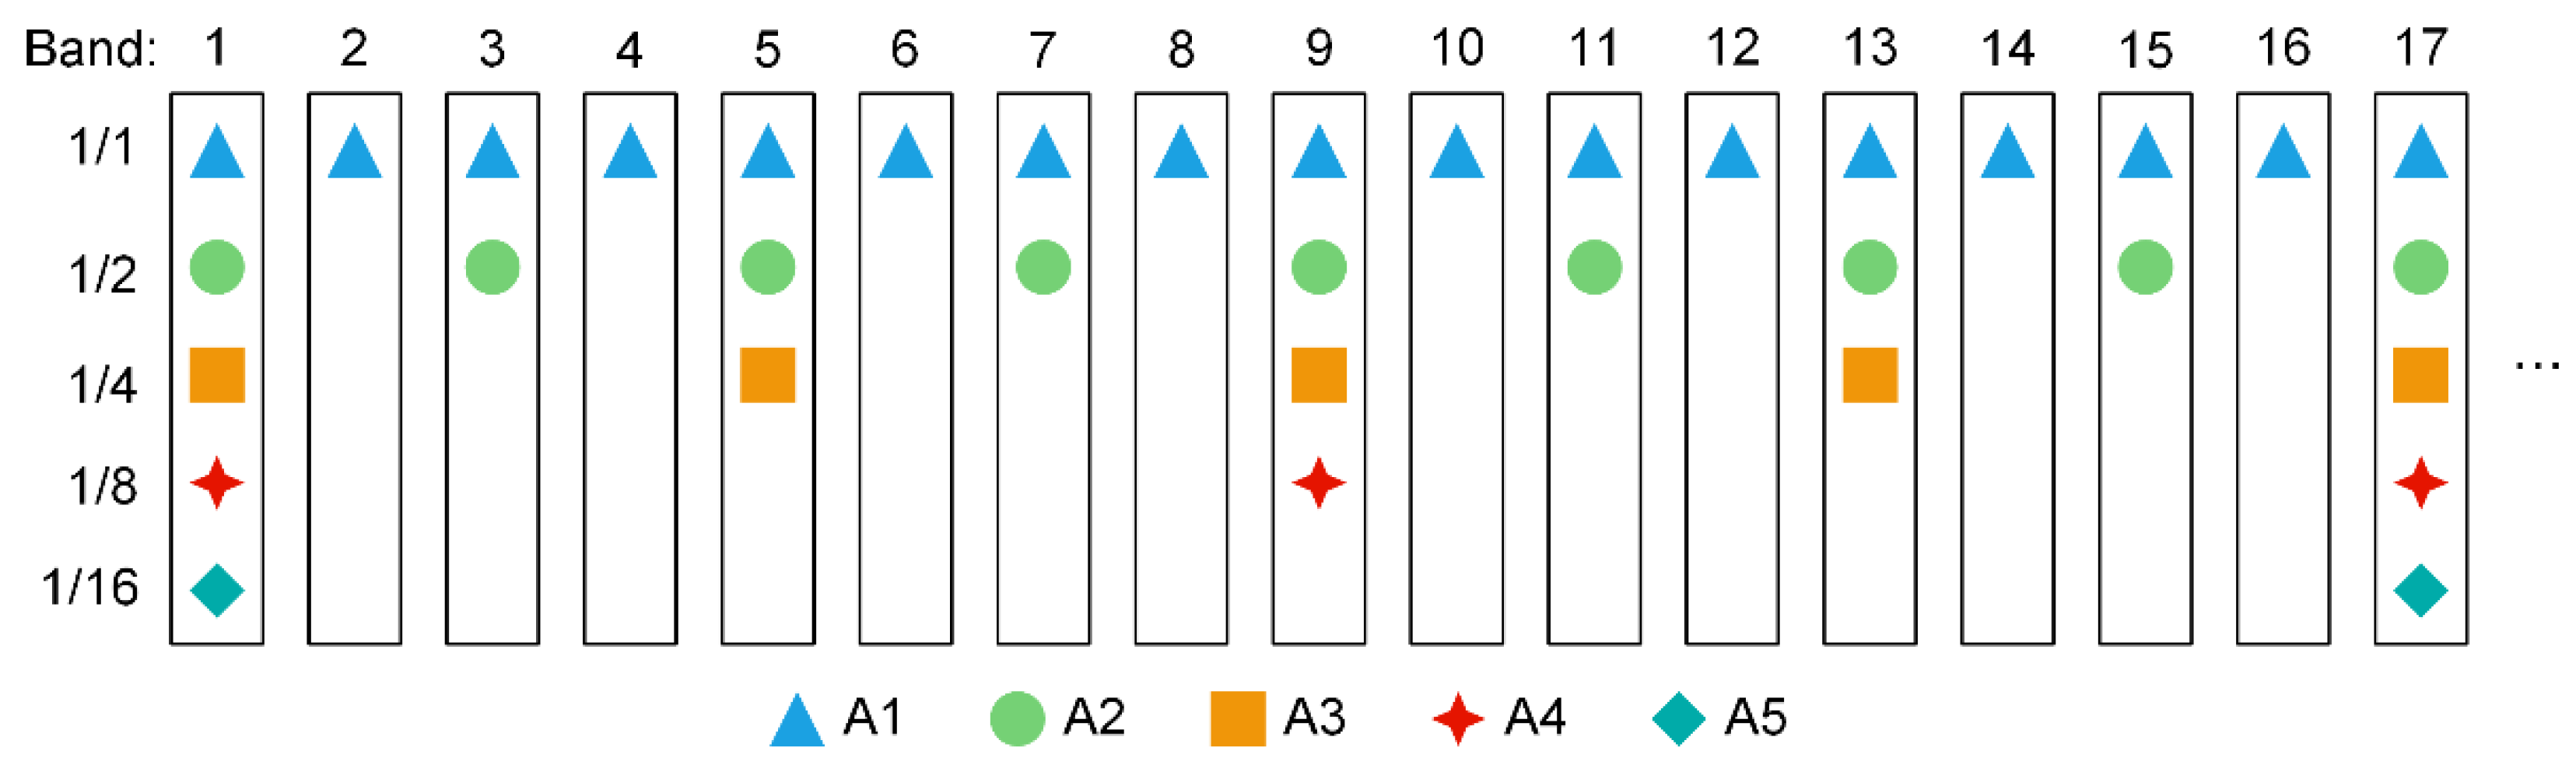
| A | Spectral thinning | A1: 1/1 bands | 271 |
| A2: 1/2 bands | 135 | ||
| A3: 1/4 bands | 67 | ||
| A4: 1/8 bands | 33 | ||
| A5: 1/16 bands | 16 | ||
| B | Spectral dimensionality reduction | PCA dimensionality reduction data | 3 |
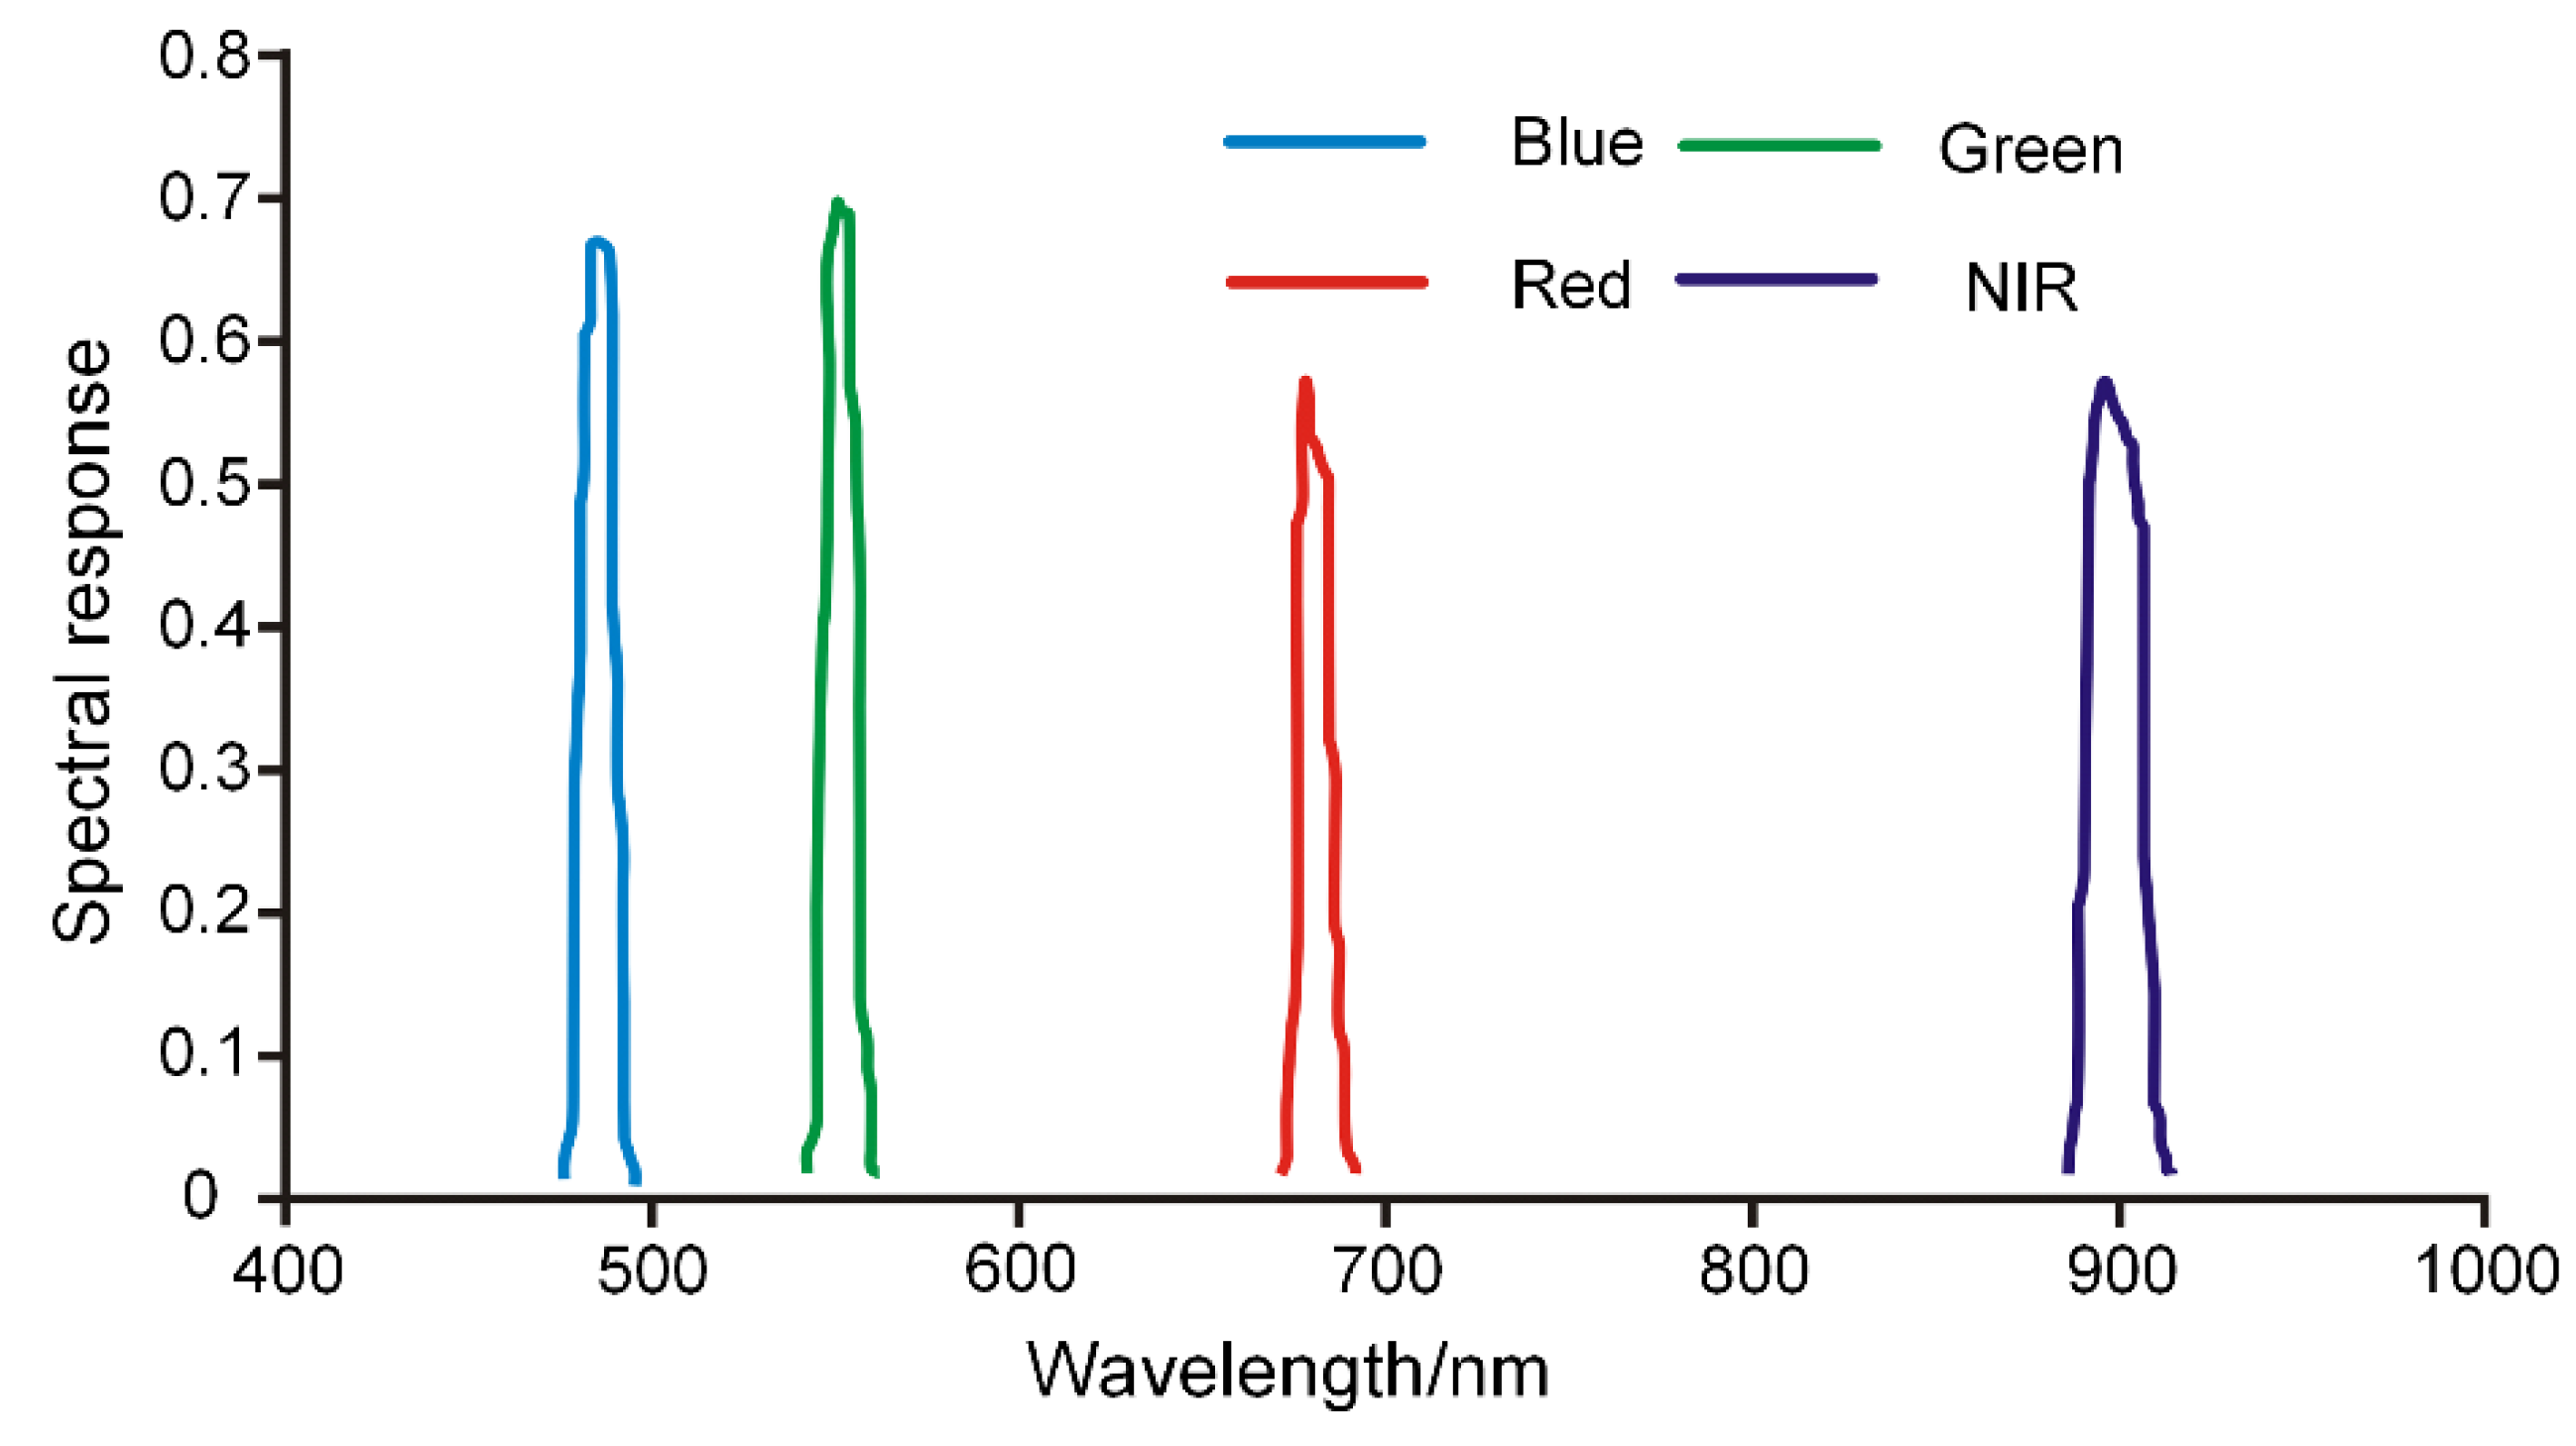
| C | Spectral simulation | C1: Blue–Green–Red | 3 |
| C2: Green–Red–NIR | 3 | ||
| C3: Blue–Green–Red–NIR | 4 |
| Experiments | Species | P | R | F1-Score |
|---|---|---|---|---|
| A1 | CO | 0.814 | 0.868 | 0.840 |
| CL | 0.724 | 0.788 | 0.755 | |
| EU | 0.826 | 0.965 | 0.890 | |
| CH | 0.774 | 0.677 | 0.722 | |
| Overall | 0.785 | 0.825 | 0.802 | |
| A2 | CO | 0.796 | 0.866 | 0.829 |
| CL | 0.800 | 0.734 | 0.766 | |
| EU | 0.775 | 0.919 | 0.840 | |
| CH | 0.661 | 0.729 | 0.693 | |
| Overall | 0.763 | 0.815 | 0.786 | |
| A3 | CO | 0.850 | 0.790 | 0.819 |
| CL | 0.772 | 0.715 | 0.742 | |
| EU | 0.825 | 0.930 | 0.874 | |
| CH | 0.703 | 0.677 | 0.689 | |
| Overall | 0.788 | 0.778 | 0.781 | |
| A4 | CO | 0.773 | 0.836 | 0.803 |
| CL | 0.800 | 0.622 | 0.700 | |
| EU | 0.789 | 0.936 | 0.856 | |
| CH | 0.635 | 0.689 | 0.661 | |
| Overall | 0.750 | 0.771 | 0.755 | |
| A5 | CO | 0.784 | 0.531 | 0.633 |
| CL | 0.718 | 0.58 | 0.642 | |
| EU | 0.586 | 0.895 | 0.708 | |
| CH | 0.676 | 0.294 | 0.410 | |
| Overall | 0.691 | 0.575 | 0.598 | |
| B | CO | 0.794 | 0.338 | 0.474 |
| CL | 0.700 | 0.705 | 0.702 | |
| EU | 0.613 | 0.925 | 0.737 | |
| CH | 0.811 | 0.716 | 0.761 | |
| Overall | 0.730 | 0.671 | 0.669 |
| Experiment | Species | P | R | F1-Score |
|---|---|---|---|---|
| C1 | CO | 0.400 | 0.010 | 0.019 |
| CL | 0.222 | 0.068 | 0.104 | |
| EU | 0.500 | 0.838 | 0.626 | |
| CH | 0 | 0 | 0 | |
| Overall | 0.281 | 0.229 | 0.187 | |
| C2 | CO | 0.779 | 0.896 | 0.833 |
| CL | 0.728 | 0.806 | 0.765 | |
| EU | 0.861 | 0.936 | 0.897 | |
| CH | 0.821 | 0.706 | 0.759 | |
| Overall | 0.797 | 0.836 | 0.814 | |
| C3 | CO | 0.817 | 0.793 | 0.805 |
| CL | 0.727 | 0.747 | 0.737 | |
| EU | 0.712 | 0.942 | 0.811 | |
| CH | 0.719 | 0.636 | 0.675 | |
| Overall | 0.744 | 0.780 | 0.757 |
Disclaimer/Publisher’s Note: The statements, opinions and data contained in all publications are solely those of the individual author(s) and contributor(s) and not of MDPI and/or the editor(s). MDPI and/or the editor(s) disclaim responsibility for any injury to people or property resulting from any ideas, methods, instructions or products referred to in the content. |
© 2023 by the authors. Licensee MDPI, Basel, Switzerland. This article is an open access article distributed under the terms and conditions of the Creative Commons Attribution (CC BY) license (https://creativecommons.org/licenses/by/4.0/).
Share and Cite
Yao, Z.; Chai, G.; Lei, L.; Jia, X.; Zhang, X. Individual Tree Species Identification and Crown Parameters Extraction Based on Mask R-CNN: Assessing the Applicability of Unmanned Aerial Vehicle Optical Images. Remote Sens. 2023, 15, 5164. https://doi.org/10.3390/rs15215164
Yao Z, Chai G, Lei L, Jia X, Zhang X. Individual Tree Species Identification and Crown Parameters Extraction Based on Mask R-CNN: Assessing the Applicability of Unmanned Aerial Vehicle Optical Images. Remote Sensing. 2023; 15(21):5164. https://doi.org/10.3390/rs15215164
Chicago/Turabian StyleYao, Zongqi, Guoqi Chai, Lingting Lei, Xiang Jia, and Xiaoli Zhang. 2023. "Individual Tree Species Identification and Crown Parameters Extraction Based on Mask R-CNN: Assessing the Applicability of Unmanned Aerial Vehicle Optical Images" Remote Sensing 15, no. 21: 5164. https://doi.org/10.3390/rs15215164