Article

Individual Tree Species Identification and Crown Parameters Extraction Based on Mask R-CNN: Assessing the Applicability of Unmanned Aerial Vehicle Optical Images

1
State Key Laboratory of Efficient Production of Forest Resources, Beijing Forestry University, Beijing 100083, China
2
Beijing Key Laboratory of Precision Forestry, College of Forestry, Beijing Forestry University, Beijing 100083, China
3
Key Laboratory of Forest Cultivation and Protection, Ministry of Education, Beijing Forestry University, Beijing 100083, China
*
Author to whom correspondence should be addressed.
These authors contributed equally to this work.
Remote Sens. 2023, 15(21), 5164; https://doi.org/10.3390/rs15215164
Submission received: 18 September 2023 / Revised: 19 October 2023 / Accepted: 27 October 2023 / Published: 29 October 2023

Abstract

:
Automatic, efficient, and accurate individual tree species identification and crown parameters extraction is of great significance for biodiversity conservation and ecosystem function assessment. UAV multispectral data have the advantage of low cost and easy access, and hyperspectral data can finely characterize spatial and spectral features. As such, they have attracted extensive attention in the field of forest resource investigation, but their applicability for end-to-end individual tree species identification is unclear. Based on the Mask R-CNN instance segmentation model, this study utilized UAV hyperspectral images to generate spectral thinning data, spectral dimensionality reduction data, and simulated multispectral data, thereby evaluating the importance of high-resolution spectral information, the effectiveness of PCA dimensionality reduction processing of hyperspectral data, and the feasibility of multispectral data for individual tree identification. The results showed that the individual tree species identification accuracy of spectral thinning data was positively correlated with the number of bands, and full-band hyperspectral data were better than other hyperspectral thinning data and PCA dimensionality reduction data, with Precision, Recall, and F1-score of 0.785, 0.825, and 0.802, respectively. The simulated multispectral data are also effective in identifying individual tree species, among which the best result is realized through the combination of Green, Red, and NIR bands, with Precision, Recall, and F1-score of 0.797, 0.836, and 0.814, respectively. Furthermore, by using Green–Red–NIR data as input, the tree crown area and width are predicted with an RMSE of 3.16m2 and 0.51m, respectively, along with an rRMSE of 0.26 and 0.12. This study indicates that the Mask R-CNN model with UAV optical images is a novel solution for identifying individual tree species and extracting crown parameters, which can provide practical technical support for sustainable forest management and ecological diversity monitoring.

1. Introduction

Tree species identification is a critical task in forest resource investigation [1], and obtaining precise tree species information is significant for forest resource management [2], ecosystems conservation [3], and species diversity assessment [4]. The traditional method of tree species investigation mainly relies on field surveys, which has the advantages of reliability and accuracy and could provide sample data for remote sensing model training and validation [5]. However, it is time consuming, labor intensive, information limited [6], and difficult to realize continuous spatial mapping [1]. As a lightweight and flexible remote sensing platform, the unmanned aerial vehicle (UAV) can carry various types of sensors, including RGB, multispectral, and hyperspectral cameras to acquire high-resolution remote sensing data [7]. Therefore, it has the ability to capture forest information comprehensively and quickly [8], which has great potential for application in forest tree species surveys and individual tree parameters measurement [9,10].
Compared with the stand-scale tree species classification, individual tree species identification aims to acquire more refined information about the forest, such as tree species, spatial location, and the attached parameter of individual trees [11], which is useful for precise and scientific forest resource management [12]. However, it places higher demands on the spatial–spectral information content of the remote sensing image and the interpretation method [13]. Previous studies on individual tree species identification have mostly adopted a combination of segmentation and classification methods, i.e., crowns segmentation and species classification are performed firstly, and then the two results are combined to obtain individual tree species identification results [12,14,15]. Although this method is simple and straightforward, it needs to combine the results of the two stages, it cannot realize end-to-end model training, and it is difficult to meet the requirements for the automatic identification of individual tree species [16].
Mask R-CNN [17] is a versatile and efficient instance segmentation algorithm that performs semantic segmentation based on high-precision target detection, enabling simultaneous acquisition of target class information and pixel-level segmentation to satisfy the needs of end-to-end individual tree species identification tasks [11,18]. The input data of the model are usually RGB images [19] or multispectral data after dimensionality reduction [20]. UAV-based RGB and multispectral images usually have high spatial resolution and contain fine canopy texture information. Both data have advantages in terms of low cost and easy access, but they contain limited spectral information, which may affect the effectiveness of tree classification [21]. Hyperspectral data, which usually have ten to hundreds of bands and high spectral resolution, contain extremely rich and fine spectral information of the tree canopy [22], and they have been used with excellent performance in tree species identification [23,24]. However, the effectiveness of directly using hyperspectral data for end-to-end individual tree species identification remains uncertain. This raises a question: are hyperspectral data with richer spectral information more efficient or accurate for individual tree species identification? In addition, the costs associated with acquiring and processing UAV RGB images, multispectral data, and hyperspectral data are quite different in forest resource investigation, and it is undoubtedly wise to adopt a more economical data acquisition solution under the premise of meeting the accuracy requirements. This leads to another question: what are the differences in the instance segmentation model for individual tree species identification when using different optical data, i.e., hyperspectral spectral data, multispectral data, or RGB images?
The main objective of this study is to evaluate the feasibility and practicality of different UAV hyperspectral and multispectral data for individual tree species identification based on the Mask R-CNN instance segmentation model. The main aspects include the following: (1) exploring the response of hyperspectral data thinning in different proportions (1/1, 1/2, 1/4, 1/8, and 1/16) and PCA dimensionality reduction data to individual tree species identification; (2) verifying the feasibility and practicality of UAV multispectral data for individual tree species identification using commonly used multispectral bands (Blue, Green, Red, NIR) simulated from hyperspectral data; and (3) evaluating the accuracy of the Mask R-CNN model to extract crown parameters based on individual tree species identification. This study could provide a theoretical foundation for end-to-end individual tree species identification and crown parameters extraction using various optical images. It has practical application potential for automated and intelligent individual tree species surveys in the current era of smart forestry [25], and it could support precise forest management and service value assessment of the forest ecosystem [15].

2. Materials and Methods

2.1. Study Area

The study area is located in Gaofeng Forest Farm (22°57′~22°58′N, 108°21′~108°23′E) in Nanning, Guangxi Province, China (Figure 1a,b). The area has a subtropical monsoon climate with an average annual temperature of about 22 °C, an average annual precipitation of about 1300 mm, and an average relative humidity of about 79%. It is a hilly landscape with undulating topography and an elevation between 150 and 260 m. The soil layer is thick and mainly lateritic red soil, which is suitable for the growth of tropical and subtropical tree species. The forest farm is rich in forest resources and it has a complex composition of tree species, mainly including Cunninghamia lanceolata (CL), Eucalyptus spp. (EU), Castanopsis hystrix Miq. (CH), and Camellia oleifera Abel. (CO). The area is dominated by plantation forests with high homogeneity and relatively continuous distribution of the same tree species. However, there is a high canopy density due to dense planting and a diversity of stand age and crown size due to rotational management, which poses a great challenge to individual tree species identification and crown parameter extraction.

2.2. Data Acquisition and Preprocessing

Hyperspectral data were collected from January 8 to January 12, 2020 using a DJI M600 Pro UAV (DJI, Shenzhen, China) with a Nano-Hyperspec VNIR hyperspectral imager (Headwall Photonics Inc., Bolton, MA, USA), and five plots of UAV hyperspectral images were acquired in total. The UAV flew at an altitude of 100 m and a speed of 4 m/s. During the acquisition of hyperspectral data, a standard calibration panel (11%, 30%, and 56% reflectance level) accompanying the imager was deployed on the ground for the radiometric correction. In addition, the GNSS/IMU equipment recorded both the geographic location and attitude information (pitch, roll, and yaw) frame by frame of the imager for subsequent pre-processing. The wavelength of the collected hyperspectral data ranges from 400 to 1000 nm and contains 271 bands; the spectral resolution is 2.2 nm. The specific parameters of the UAV flight and image are shown in Table 1.
The pre-processing of the hyperspectral data mainly includes radiometric calibration, orthorectification, and denoising, with specific information as described below. First, the raw digital number images acquired by the hyperspectral imager were converted to radiance data using the calibration file provided by the manufacturer (Radiance = Gain × DN + Bias). Then, the radiance data were converted to surface reflectance data through empirical linear modeling based on the reflectance data of the calibration panel. After radiometric calibration, the orthorectification was realized by calculating the real ground coordinates of pixels using a collinear equation based on the geographic position and attitude information of hyperspectral imager and DEM data (spatial resolution of 1 m) generated from airborne LiDAR data [22]. All of the above operations were performed in the SpectralView software (Version 3.3.0.1, Headwall Photonics Inc., Bolton, MA, USA). Finally, the hyperspectral images were smoothed using the Savitzky–Golay filter [26] in ENVI software (Version 5.3, Exelis Visual Information Solutions Inc., Boulder, CO, USA) to reduce the noise of the data.

2.3. Individual Tree Species Sample Set

Sub-compartment data obtained from forest resource investigation, ground survey, and previous tree species classification results of our team [22] were used as auxiliary data to construct the sample set for individual tree species identification, which was used to determine the distribution information of tree species in the study area. Considering the actual situation in the study area, four tree species (namely, Camellia oleifera Abel. (CO), Cunninghamia lanceolata (CL), Eucalyptus spp. (EU), and Castanopsis hystrix Miq. (CH)) were included in the individual tree species identification system, while a very small number of other tree species, shrubs, grasses, and roads were considered as the background.
The hyperspectral images were cropped into image blocks of 512 × 512 pixel size to meet the input data requirements of the Mask R-CNN model. With reference to the auxiliary data, we utilized the Labelme tool (Version 4.5.6, Computer Science and Artificial Intelligence Lab, Massachusetts Institute of Technology, Cambridge, MA, USA) to manually delineate the crown boundary of each tree in the images and label their species information. The shape and location of the crown contours were expressed as two-dimensional coordinates of the boundary polygons vertex by vertex. In total, 80% of the data set was randomly selected as the training set, and the remaining 20% was the test set; the specific information of the sample set is shown in Table 2. Because the Mask R-CNN instance segmentation model has many parameters, a small number of training sets may cause model overfitting, so rotating (90°, 180°, 270°) and flipping (horizontal and vertical flipping) were conducted to augment the number of training sets.

2.4. Methods

2.4.1. Individual Tree Species Identification Model

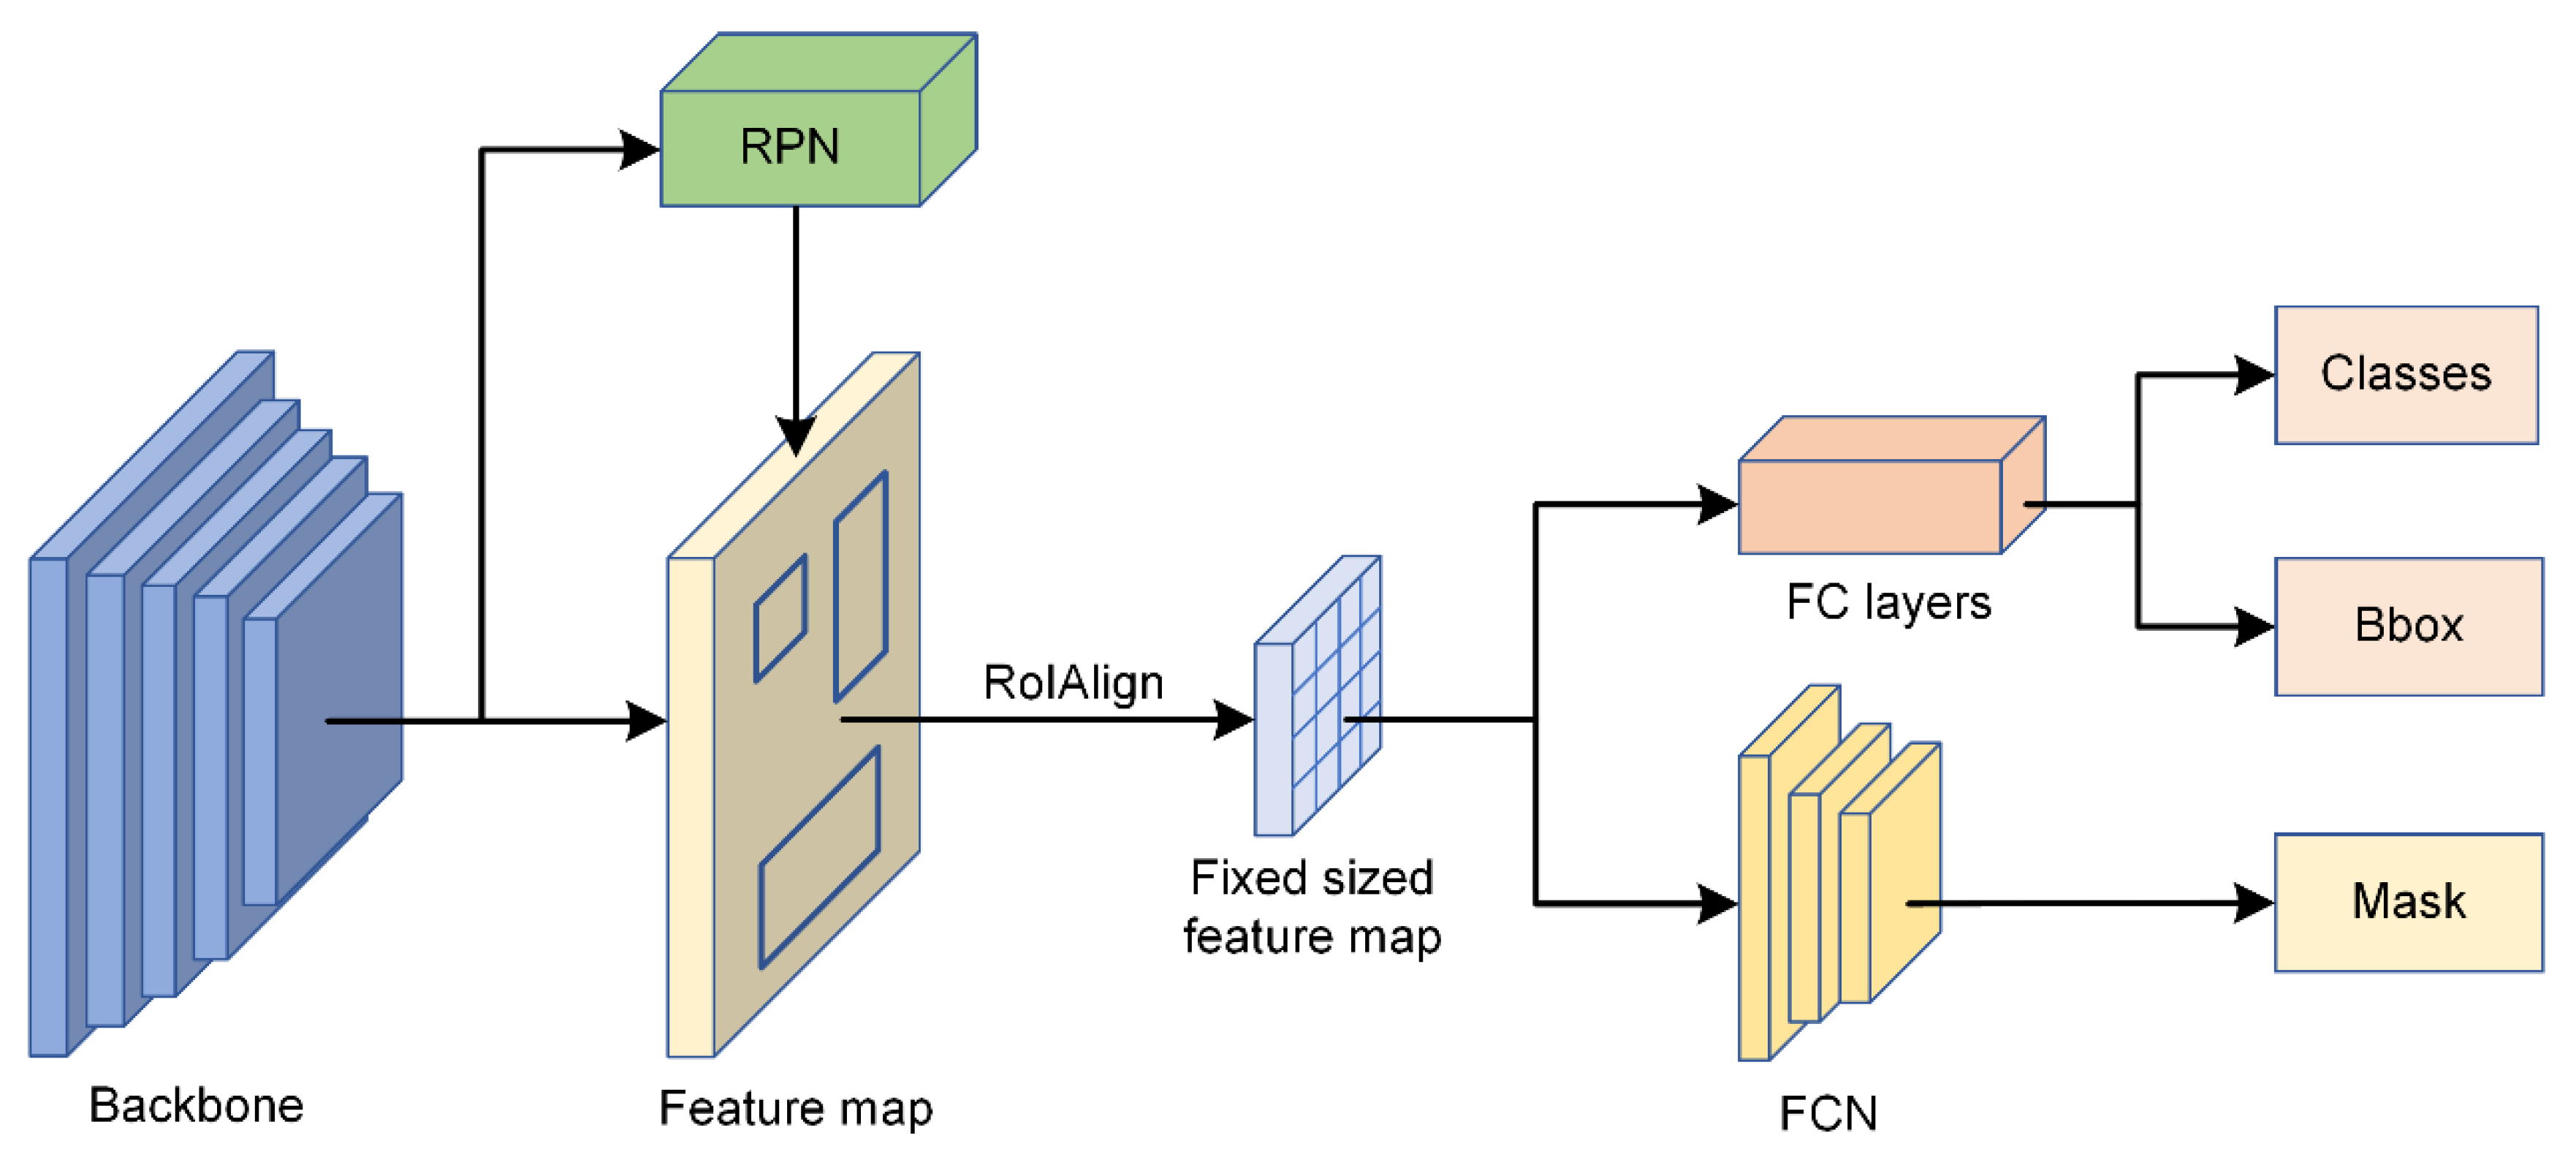
Mask R-CNN is a commonly used instance segmentation model that integrates image target detection and semantic segmentation tasks. It can automatically acquire target bounding boxes and pixel-level masks of multiple tree crowns in images so as to obtain individual tree location, tree species, and crown structure information simultaneously to achieve end-to-end individual tree species identification [18]. As shown in Figure 2, it mainly includes a backbone network (Backbone) layer, region proposal network (RPN) layer, RoIAlign layer, bounding box regression, classification, and mask branch. Considering the computational efficiency and accuracy, we chose the residual network (ResNet50) combined with the feature pyramid network (FPN) as the backbone network for extracting the deep features of the input image. Then, a series of RoIs was generated by the RPN layer, and the RoIAlign layer was used to convert RoIs of different sizes into feature maps of the same size. Finally, the output of the RoIAlign layer was connected to a fully connected layer and a fully convolutional network, where the fully connected layer outputs the classification class and predicted bounding box of each RoI, and the fully convolutional network generates a binary mask to achieve pixel-level segmentation.
The loss function in the Mask R-CNN model training process is calculated as follow:
L = L c l s + L b o x + L m a s k
where L denotes the total model loss, Lcls denotes the classification error loss, Lbox denotes the bounding box regression error loss, and Lmask denotes the mask segmentation error loss. For each RoI, the mask branch produces Km2 dimensional output, i.e., K binary masks with m × m resolution, corresponding to K output categories, using a sigmoid function on each image element. Lmask is defined as the mean binary cross-entropy loss, where each RoI is associated with the ground truth category kth, and Lmask is associated only with the kth mask and the other mask outputs do not affect the loss.
Because the original Mask R-CNN network can only input images with three channels, hyperspectral data or multispectral data cannot be directly used as input data. Considering that screening three bands from the hyperspectral data or reducing dimension of data into three channels may result in the loss of hyperspectral information [27], in this study, we adjusted the channel dimension of the filters in the first convolutional layer of the backbone network to match the number of channels of the input data ( n [ 3 , 271 ] ) so as to realize the direct input of hyperspectral data.

2.4.2. Experimental Design

Hyperspectral data contain a large number of narrow spectral bands with rich and fine spectral information, which can be used to classify tree species with high species diversity [28]. However, the effectiveness of hyperspectral data as input data for the Mask R-CNN model for individual tree species identification is unclear, and it remains to be investigated whether the rich spectral information in hyperspectral data is more advantageous compared to RGB and multispectral images. Therefore, three experiments were designed in this study to evaluate the applicability of RGB images and multispectral and hyperspectral data applied to the Mask R-CNN model for individual tree species identification (Table 3).
The number of bands in hyperspectral data is usually ten to hundreds, and the different spectral information content and fineness of data with different numbers of bands may also affect the effectiveness of the classification task. In order to evaluate the effect of spectral information fineness on the individual tree species identification, experiment A uses data with a different number of bands as the model input, where the 271 hyperspectral bands are thinned according to different ratios (1/1, 1/2, 1/4, 1/8, and 1/16), and five different spectral thinning data sets are obtained (Table 3). Among them, the 1/1 band data (A1) use all 271 bands of hyperspectral data (full band data), the 1/2 thinning data (A2) are extracted from the full band data at an interval of 1 band, and a total of 135 bands are obtained as model input data; the 1/4 thinning data (A3) are extracted from the 1/2 thinning data at an interval of 1 band, and a total of 67 bands are obtained. The 1/8 thinning data (A4) are extracted from 1/4 thinning data with an interval of 1 band, and a total of 33 bands are obtained; the 1/16 thinning data (A5) are extracted from the 1/8 thinning data with an interval of 1 band, and a total of 16 bands are obtained as model input data. The thinning processing is shown in Figure 3.
Experiment B evaluates the effect of hyperspectral dimensionality reduction data on individual tree species identification. Principal Component Analysis (PCA) is an unsupervised learning method that does not require category labeling information, and it performs well in tree species classification tasks of hyperspectral images [29,30]. In view of this, we selected PCA as the dimensionality reduction method for hyperspectral data. This method uses mathematical transformation to map hyperspectral data from high-dimensional space to low-dimensional space using a transformation matrix to achieve hyperspectral data dimensionality reduction [31]. After PCA dimensionality reduction processing, there is an orthogonal relationship between each principal component, which can eliminate the correlation between the original hyperspectral bands and reduce data redundancy [32]. We performed PCA processing using the python language and the sklearn library [33]. After PCA processing, the first three principal components used in this study retained more than 99.8% of the hyperspectral data information according to the feature variance percentage.
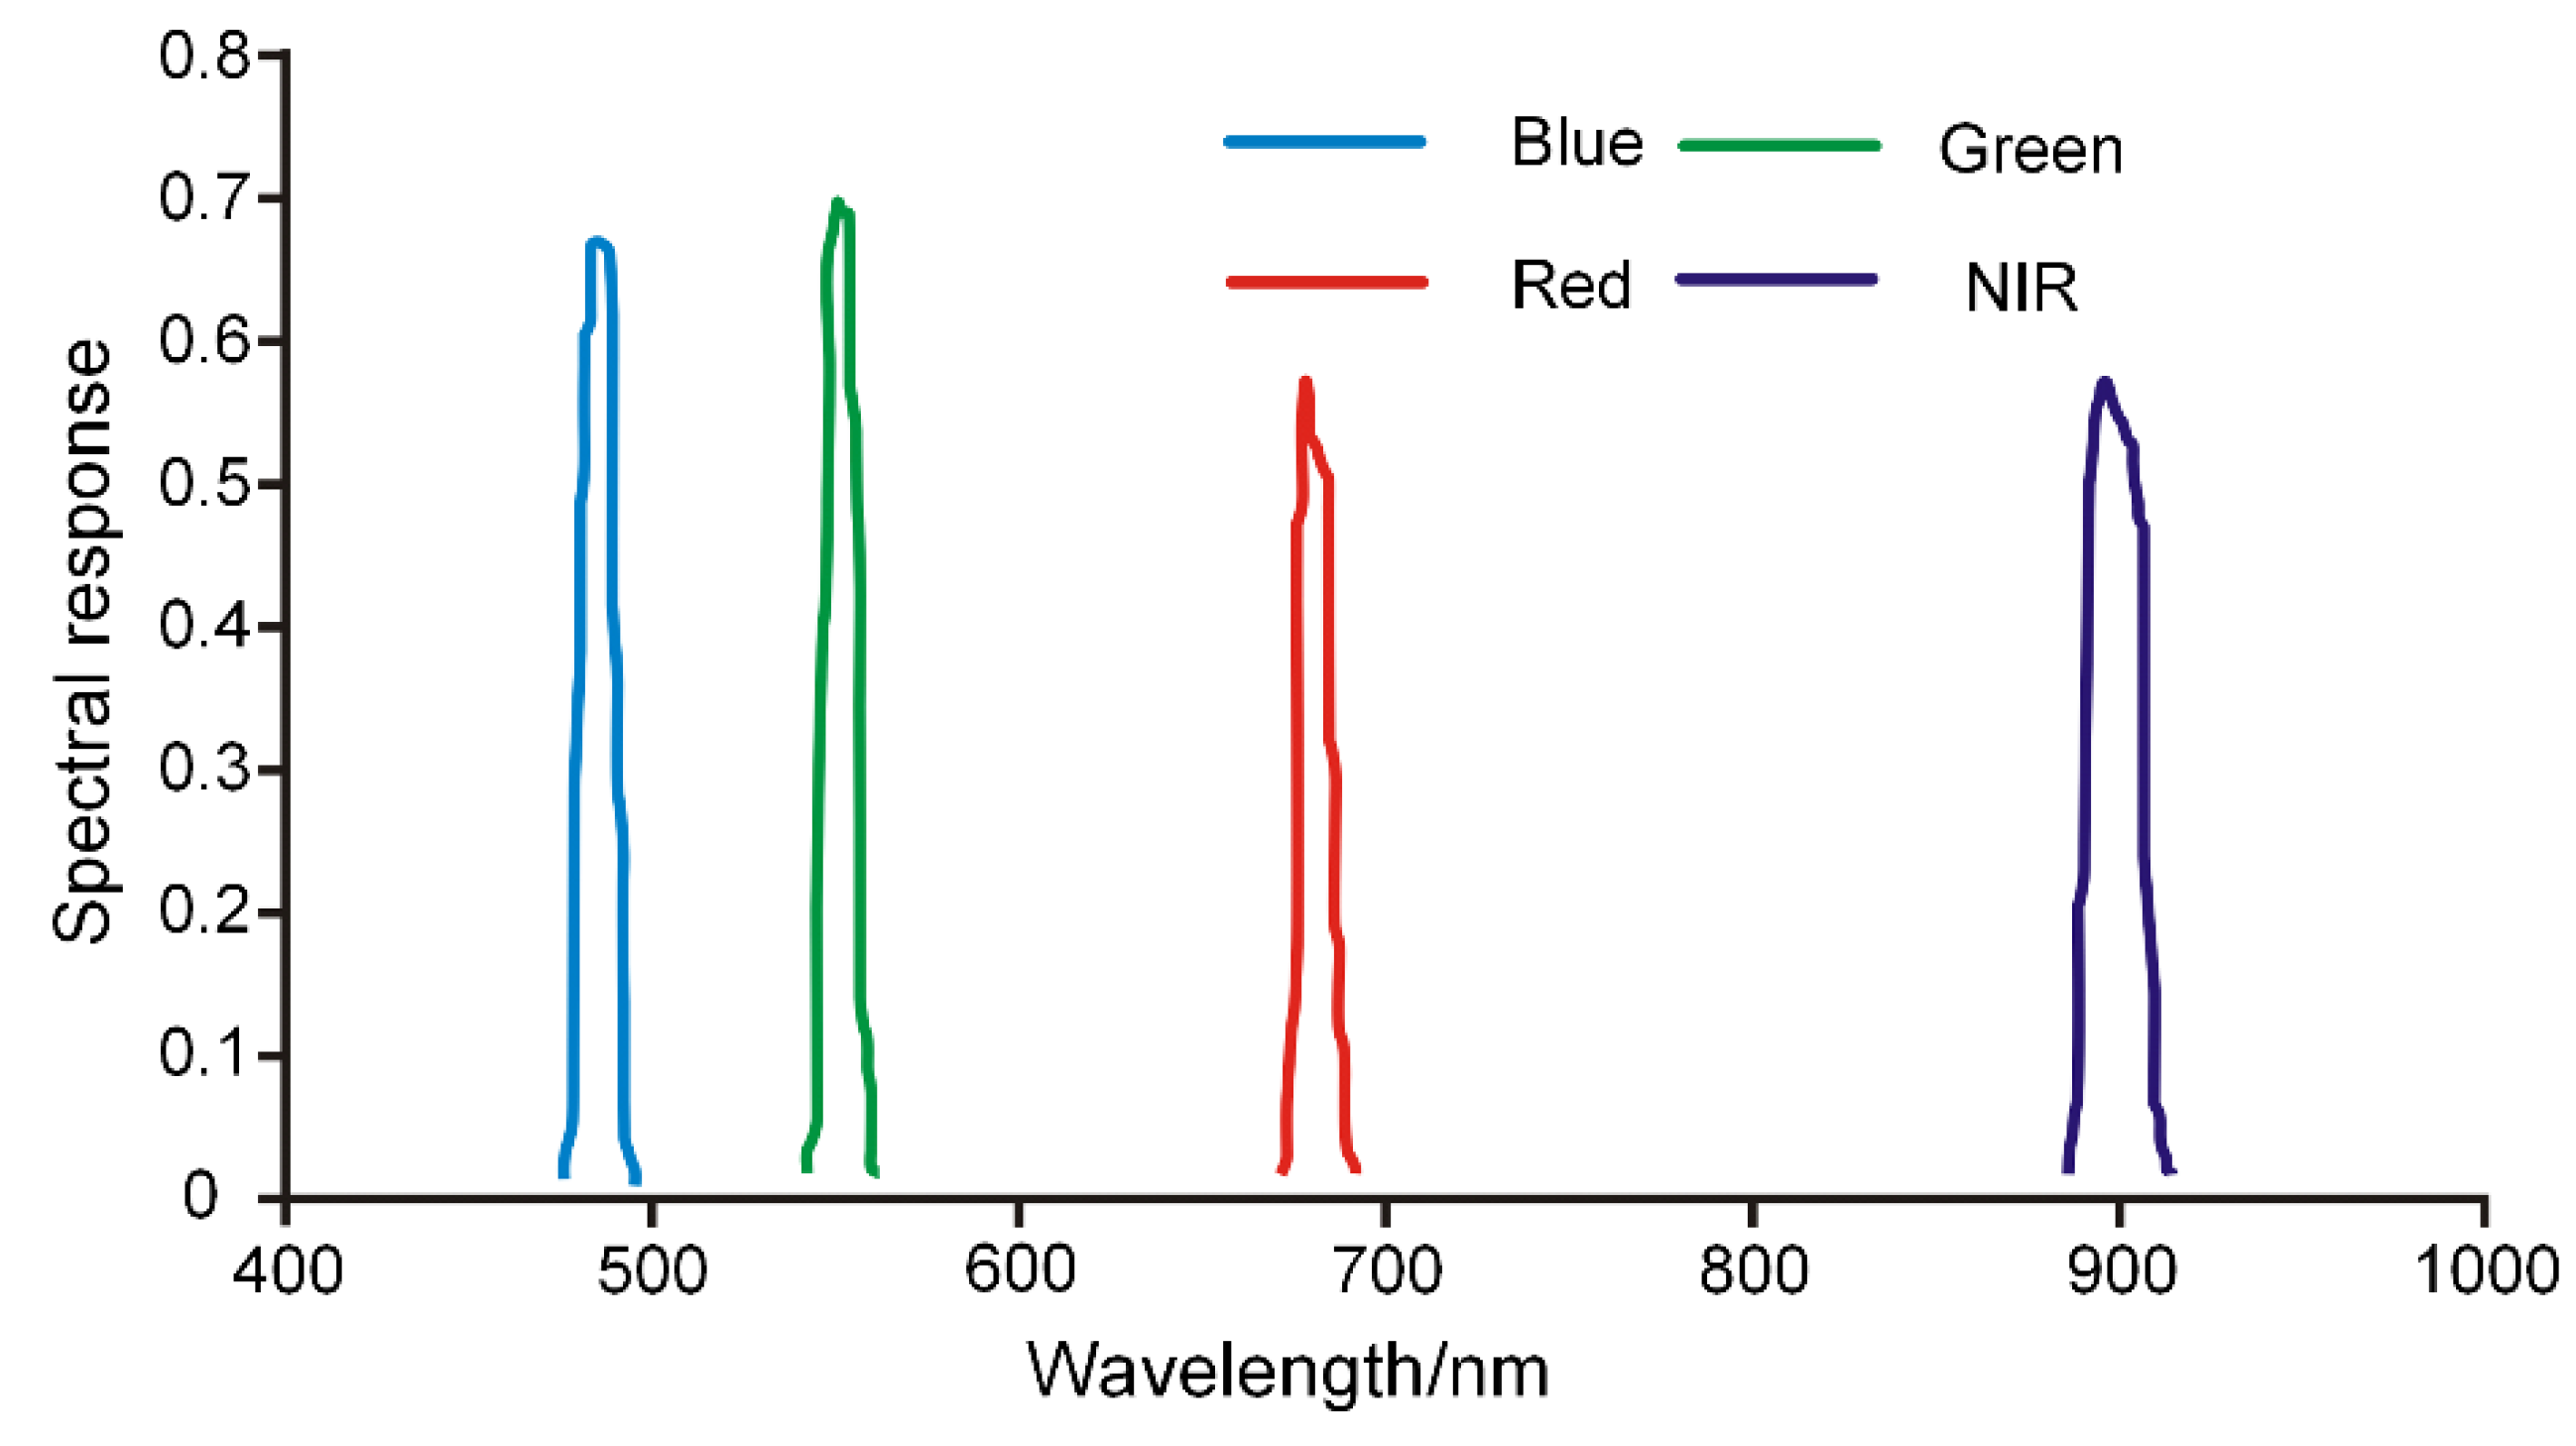
Experiment C has two objectives: (1) to evaluate the performance differences of hyperspectral data relative to multispectral data for individual tree species identification, and (2) to seek a practical data collection scheme applicable to individual tree species identification. The blue, green, and red (RGB) bands and the near-infrared (NIR) bands are the most commonly used range of multispectral data in UAV remote sensing [34]. The MCA sensor (Tetracam Inc., Chatsworth, CA, USA) is a widely used multispectral camera that can be equipped with UAV [35,36]. We simulated its multispectral data using the Spectral Library Resampling tool in ENVI software (Version 5.3) based on UAV hyperspectral data and the MCA spectral response function (Figure 4). The simulated multispectral data have four bands, which are blue (490 nm), green (550 nm), red (680 nm), and near-infrared (900 nm), each with a bandwidth of about 25 nm. Then, the simulated data were combined into three data sets: Blue–Green–Red, Green–Red–NIR, and Blue–Green–Red–NIR.
The training parameters of the Mask R-CNN model are as follows: the batch size is 1, the epoch is 350 times, and we set to train 100 times each epoch. The optimizer is Stochastic Gradient Descent (SGD), and the learning rate, momentum, and weight decay are 0.0001, 0.9, and 0.0001, respectively.
All experiments were performed on Windows 10 operating system using TensorFlow 1.8.0 with the Keras 2.1.6 deep learning framework; the programming language is Python 3.6. The hardware platform is a Dell Precision T7910 (AWT7910) graphics workstation with IntelR Xeon(R) E5-2620 v4 @2.10GHZ CPU, NVIDIA GTX 1080ti GPU, 128GB RAM, and 2TB SSD.

2.4.3. Crown Parameters Extraction

Beside tree species identification, we also obtained crown structure parameters simultaneously. The east–west and north–south projection lengths of the masks were calculated to obtain the east–west crown width and the north–south crown width, and the average of the east–west and north–south crown widths was obtained as the crown width (CW). The crown projection area (CPA) was obtained by counting the number of pixels in each mask, and the relationship between the number of pixels and the crown projection area was calculated as follows.
CPA = P m a s k × S 2
where CPA indicates the crown projection area, Pmask indicates the number of pixels contained in the tree crown mask, and S is the spatial resolution of the remote sensing image.

2.4.4. Accuracy Evaluation

The IoU (Intersection over Union) was used to determine whether the detected crown was correct or not [37]. The IoU value was calculated using the ground truth samples and the prediction results (Equation (3)), and the crown was considered to be correctly predicted if the IoU value was ≥0.5 in this study.
I o U = A r e a ( C t r u e C p r e d i c t e d ) A r e a ( C t r u e C p r e d i c t e d )
where Ctrue denotes the true area of the crown and Cpredicted denotes the predicted area of the crown.
The accuracy of the Mask R-CNN individual tree species identification model was evaluated using Precision (P), Recall (R), and F1-score (Equations (4)–(6)), which can be calculated from the confusion matrix [38]. P is the ratio of the number of correctly identified individual trees to the number of identified individual trees, and R is the ratio of the number of correctly identified individual trees to the number of individual trees in the actual sample. F1-score is defined as the harmonic average of P and R, which is used to combine the effects of P and R. The range of these metrics is 0~1, and the higher value indicates the better performance of the model in identifying individual trees.
P = T P T P + F P
R = T P T P + F N
F 1 - s c o r e = 2 ( P × R ) P + R
where TP (True Positive) represents the number of individual trees correctly identified by the model, FP (False Positive) represents the number of individual trees incorrectly identified, and FN (False Negative) represents the number of individual trees not correctly identified.
To test the accuracy of the crown parameters extraction, the measured values of the crown parameters were compared with the estimates extracted by the model, and the RMSE (root mean square error) and rRMSE (relative RMSE) were used to evaluate the effect of the crown parameters extraction (Equations (7) and (8)) [10].
R M S E = 1 n i = 1 n ( y i x i ) 2
r R M S E = R M S E x i ¯
where n is the number of individual trees, yi is the predicted crown parameter, xi is the measured crown parameter, and x i ¯ is the mean of the measured crown parameters. Because the model cannot completely detect all trees, we used all correctly predicted individual trees to evaluate the accuracy of crown parameters extraction.

3. Results

3.1. Performance of Different Spectral Thinning Data

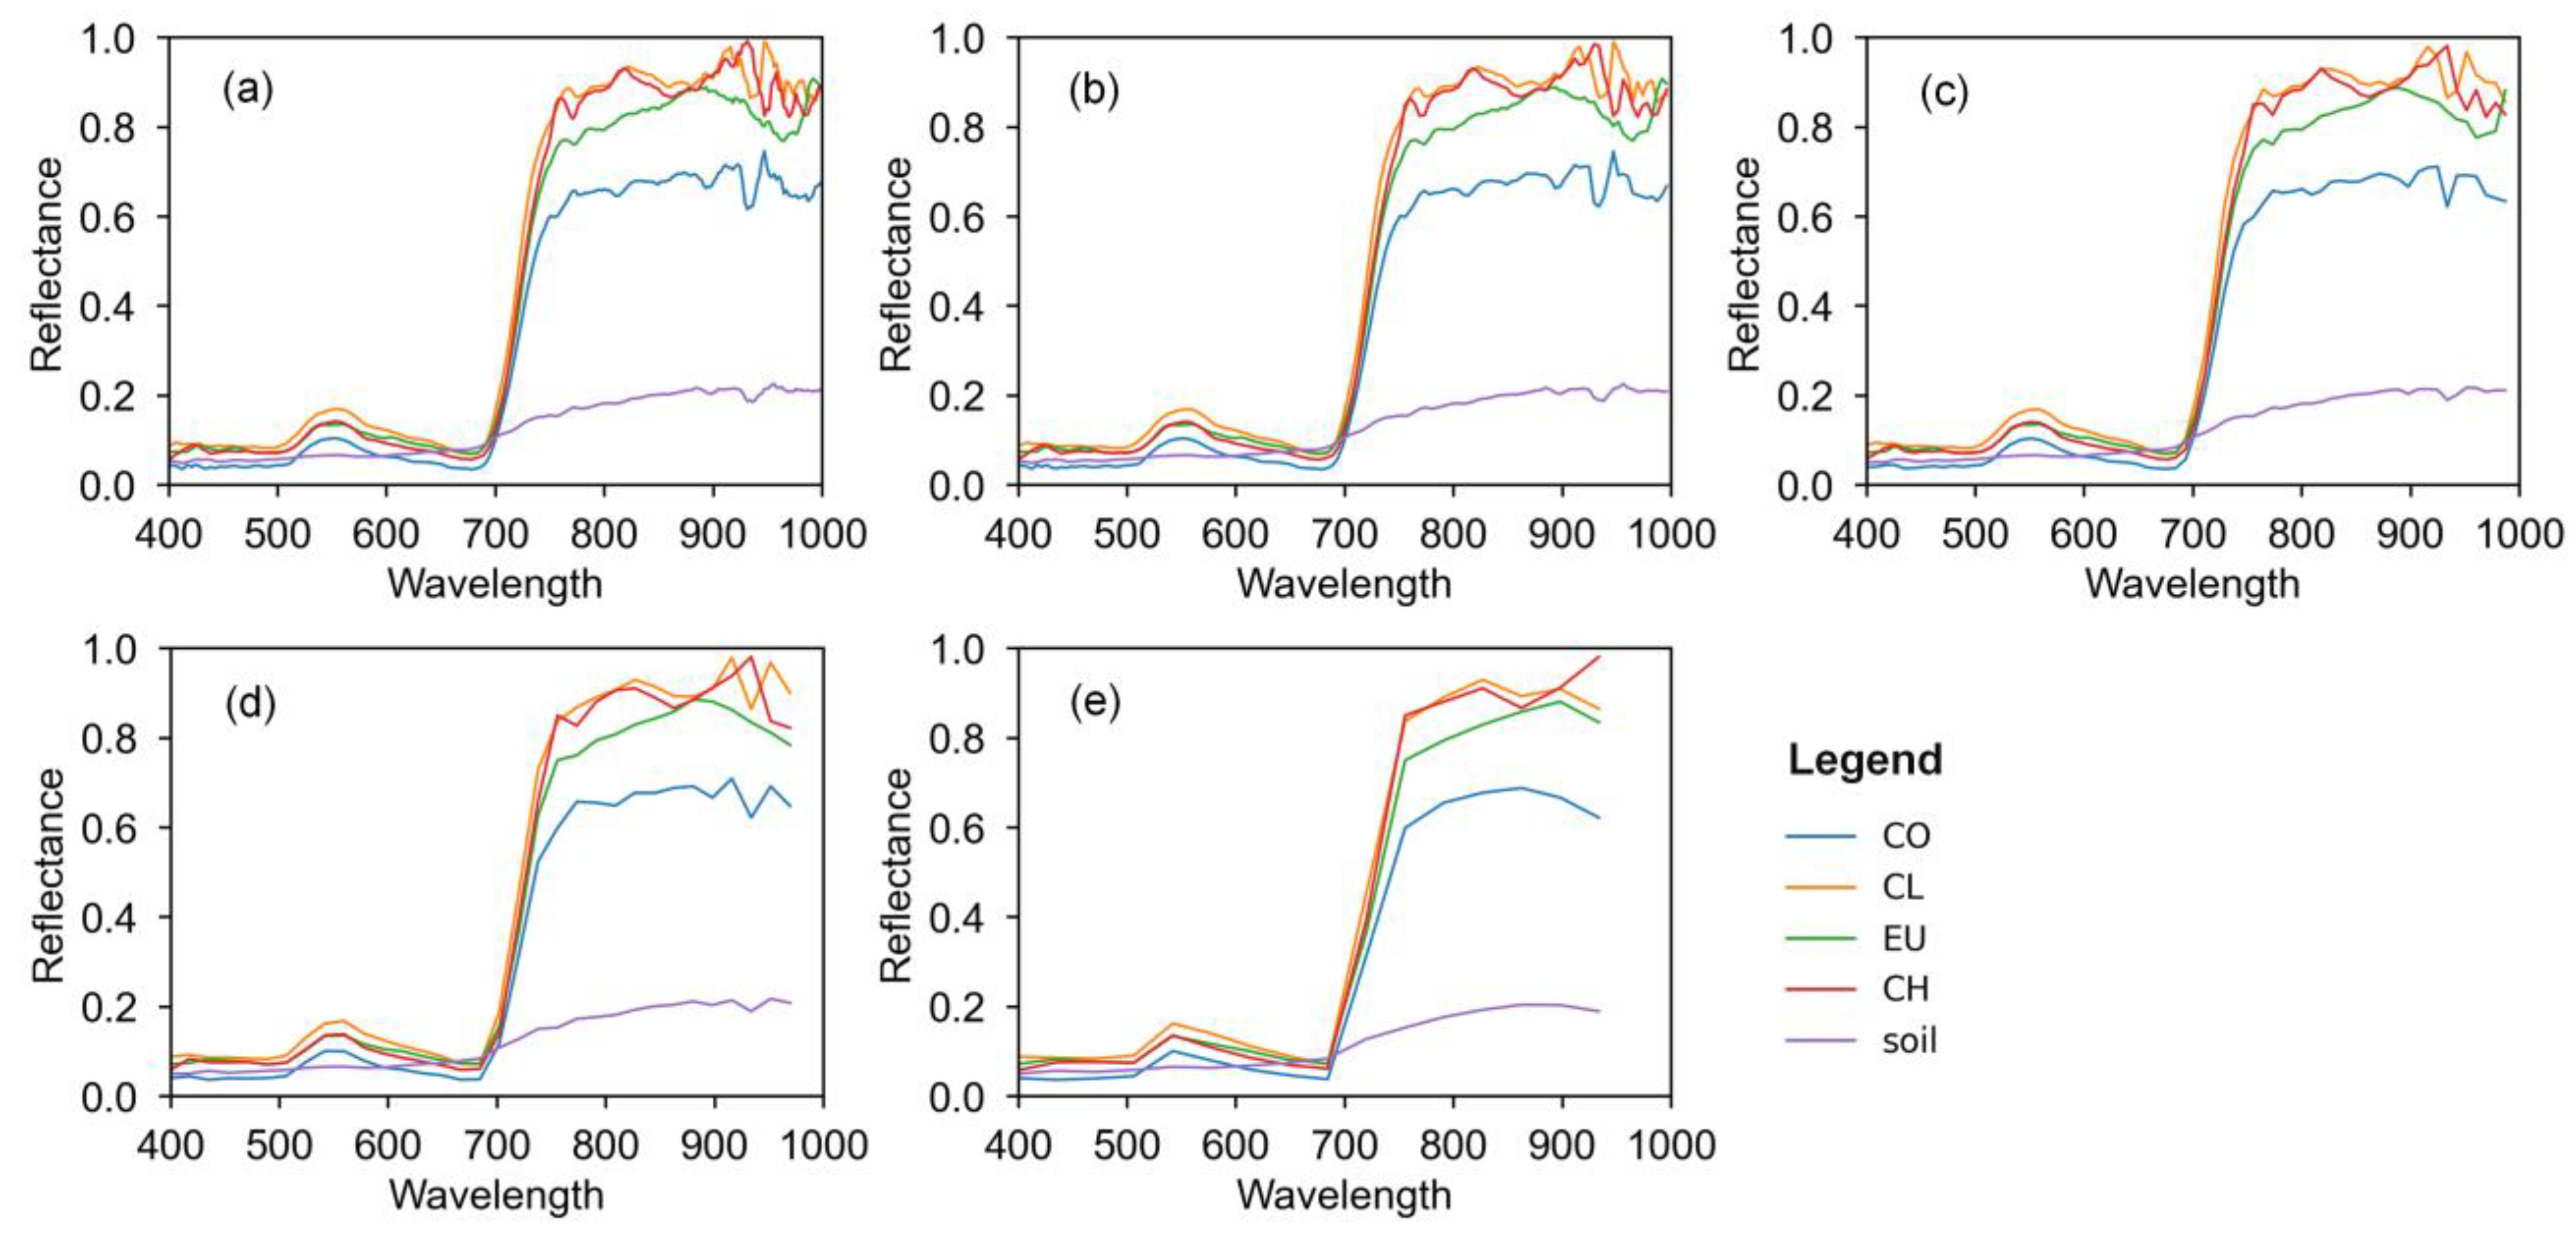
Figure 5 shows the spectral reflectance curves of four tree species and non-tree backgrounds (mainly shrubs and bare soil) with different hyperspectral thinning data (experiments A1~A5). The full-band data have more abundant spectral information and can reflect more subtle differences between different tree species and backgrounds than other data (Figure 5a). As the number of hyperspectral thinning data bands decreases, the spectral information is gradually coarsened. Among them, Eucalyptus spp. shows a high agreement with the spectral reflectance of Castanopsis hystrix Miq. in the visible range (400–760 nm), but it shows differences with other species in the near-infrared range (760 nm–1000 nm). The spectral reflectance of Cunninghamia lanceolata and Castanopsis hystrix Miq. has a high similarity between wavelengths 690 and 820 nm, and the difference in spectral reflectance of Cunninghamia lanceolata and Castanopsis hystrix Miq. gradually decreases as the number of bands decreases. The spectral reflectance characteristics of Cunninghamia lanceolata and Castanopsis hystrix Miq. are very similar when the thinning data have only 16 bands (Figure 5e). The spectral reflectance of Camellia oleifera Abel. is lower than the other three species in the wavelength range of 400–1000 nm, especially in the wavelength range of 740–1000 nm, where the spectral difference with other species is more obvious. The spectral reflectance of the background differs considerably from that of the trees, which can perhaps be distinguished more easily by spectral features.
The identification accuracy of Experiment A is shown in Table 4. On the whole, the overall accuracy of the Mask R-CNN model for individual tree species identification varies significantly for different spectral thinning data. Experiment A1 uses all spectral information and achieves the best individual tree species identification with an overall F1-score of 0.802. As the number of spectral bands of the input data decreases, the accuracy of individual tree species identification shows a gradual decreasing trend. For experiments A2, A3, and A4, compared with experiment A1, the accuracy of the overall F1-score decreases by 0.016 0.021 and 0.047, respectively. For experiment A5, only 16 bands are used, the performance of individual tree species identification is relatively poor, and the overall F1-score is only 0.598. In general, the rich spectral information of hyperspectral data has a positive effect on individual tree identification, but the accuracy gain decreases with the number of bands, i.e., there is a phenomenon of diminishing returns.
The identification effect of different tree species has significant differences, with P, R, and F1-score ranging from 0.586 to 0.850, 0.294 to 0.965, and 0.410 to 0.890, respectively (Table 4). Among them, Eucalyptus spp. has a better result than other species, with an F1-score ranging from 0.708 to 0.890. The average F1-score of Camellia oleifera Abel. and Cunninghamia lanceolata are slightly lower than those of Eucalyptus spp. by 0.033 and 0.097, respectively. Castanopsis hystrix Miq. has the worst performance, with an average F1-score of 0.635.
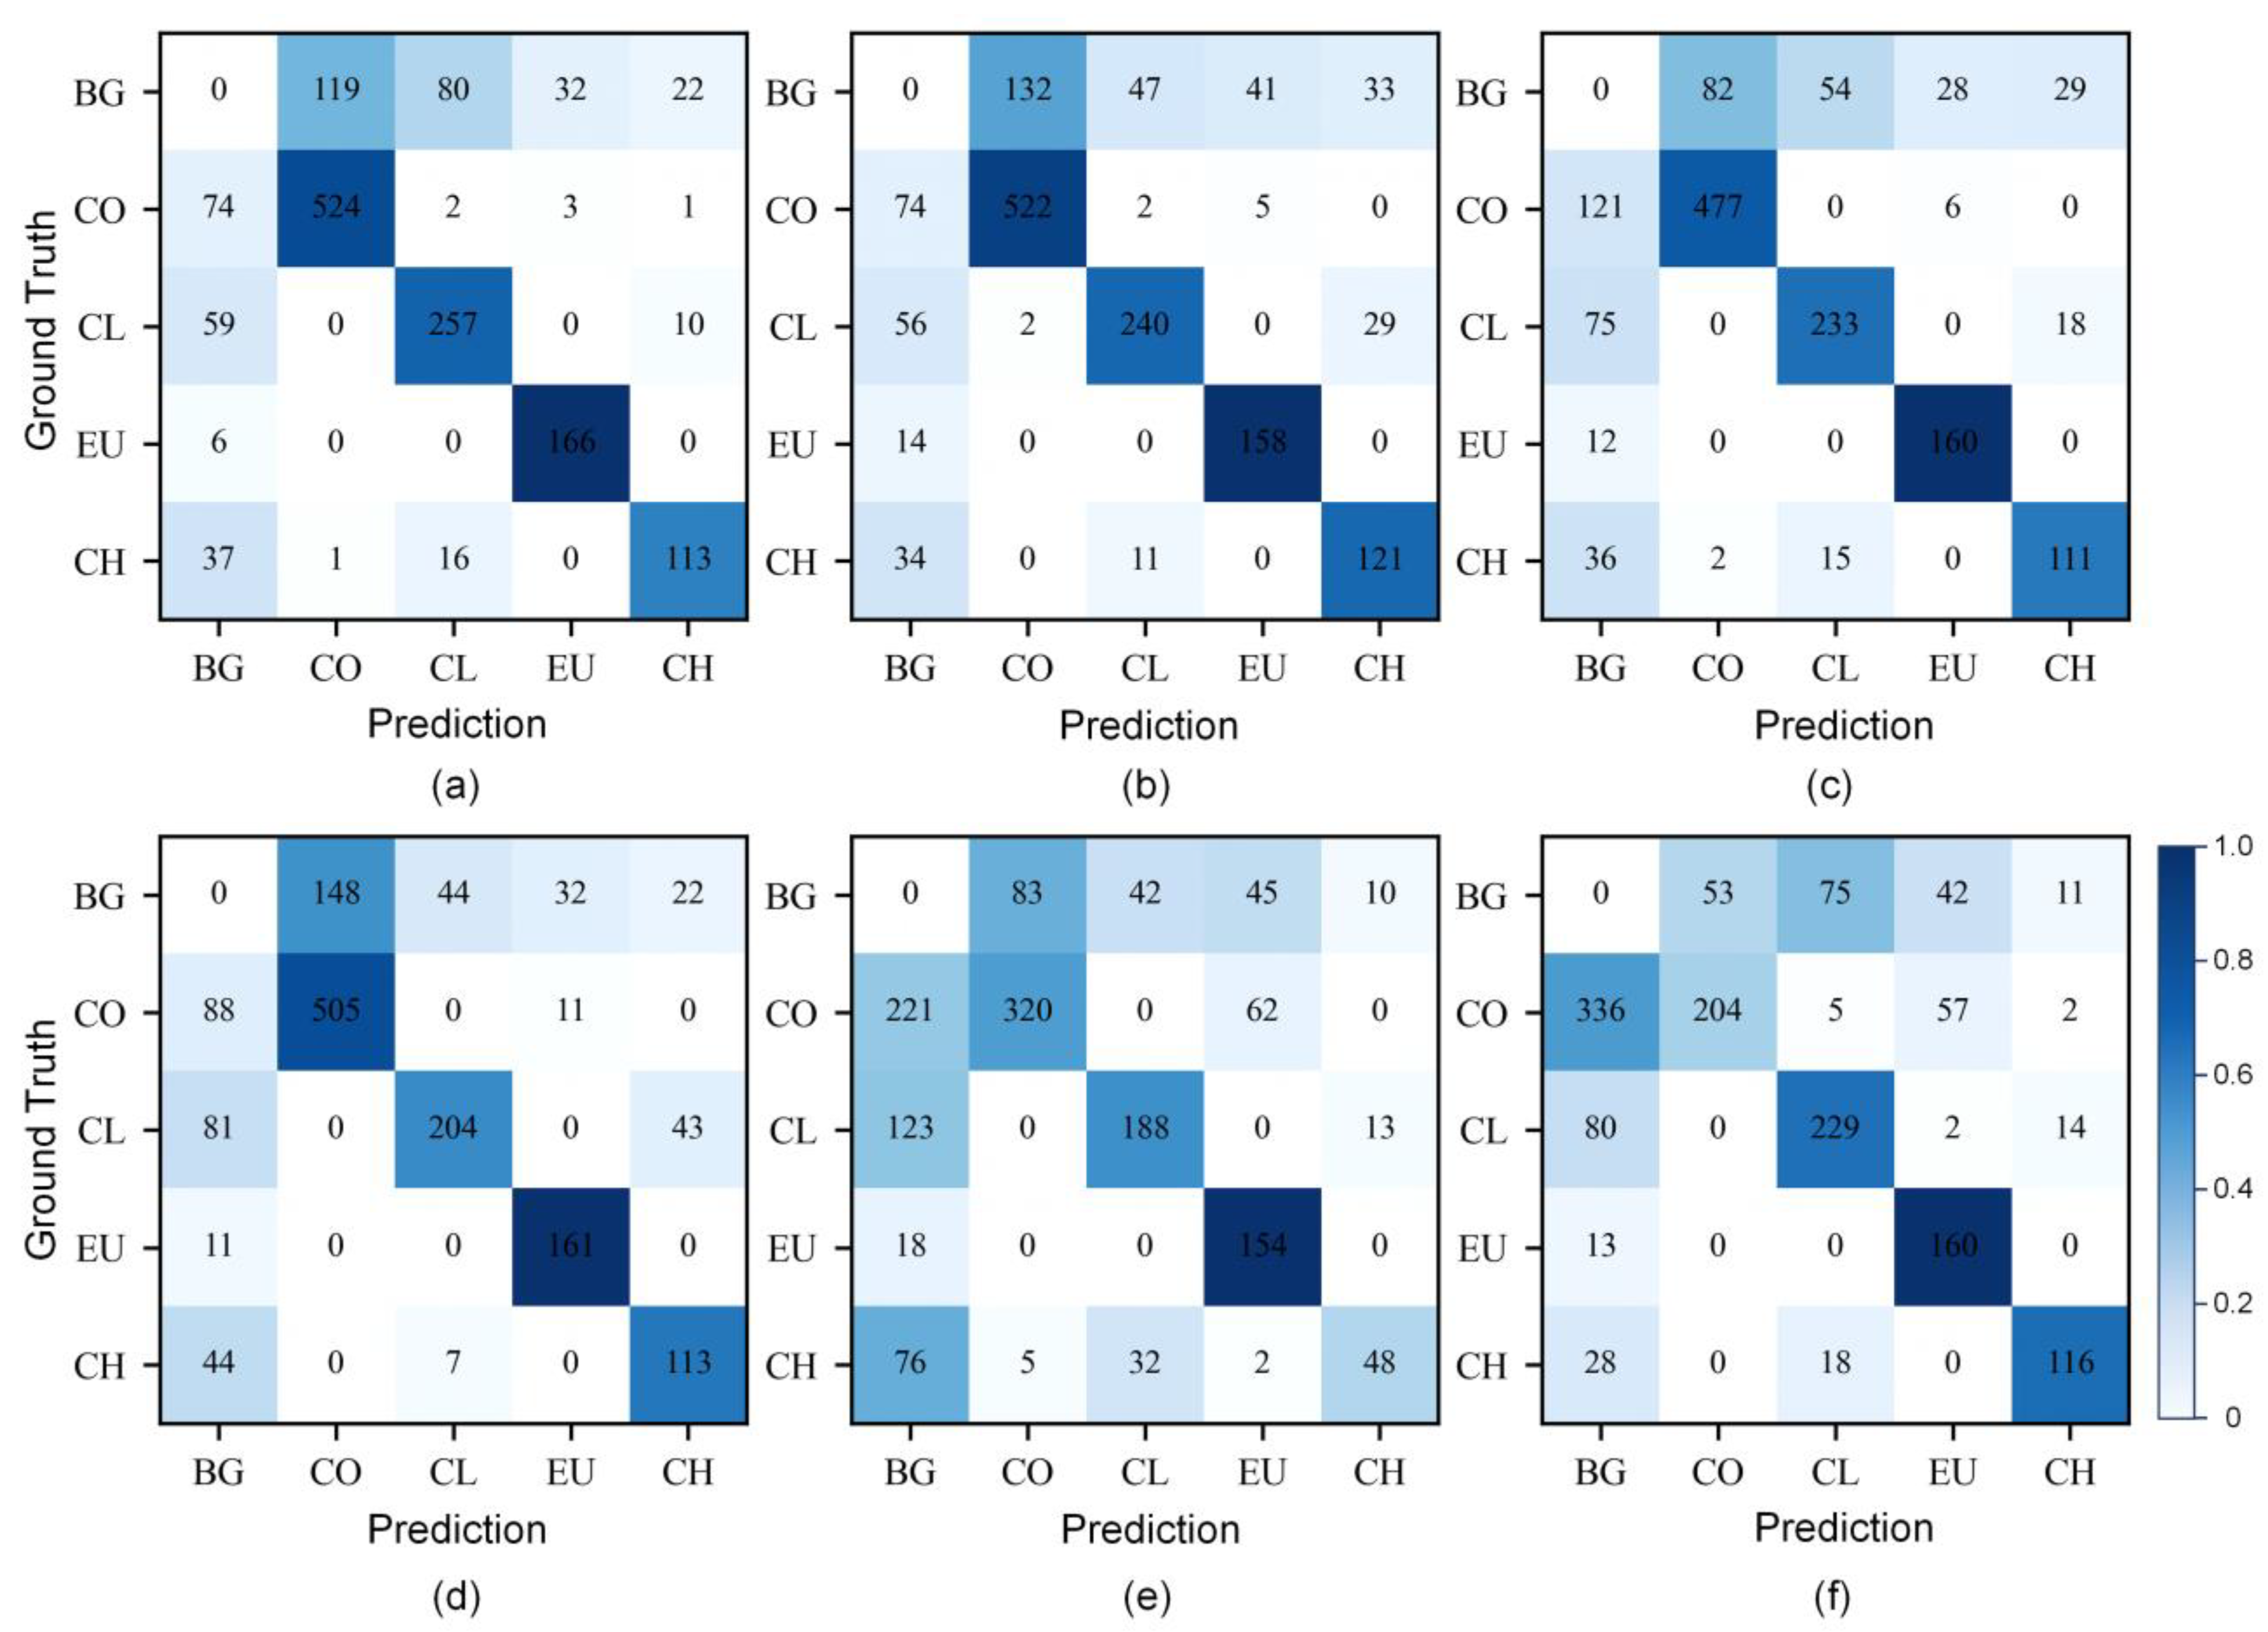
We also counted the prediction results of each category using the confusion matrix (Figure 6). In general, there are few identification errors (mixed classification) between tree species, but there are some misclassifications between trees and backgrounds; this is what is called false detection and misdetection. For experiments A1 to A4, the number of bands used is relatively high, and the false detections and misdetections are about the same; the phenomenon of species category mixing occurs mainly between Cunninghamia lanceolata and Castanopsis hystrix Miq., while the misclassification among other species is not obvious. In experiment A5, the 16 bands are relatively few in the data, which is not conducive to the identification of individual tree species, so the phenomenon of individual tree misidentification increases significantly; in addition, the phenomenon of species category misclassification increases significantly. Some Camellia oleifera Abel. trees are misclassified as Eucalyptus spp., and a few Castanopsis hystrix Miq. trees are misclassified as Cunninghamia lanceolata. There are also large differences in the misidentification and misclassification of different tree species. Few Eucalyptus spp. trees are identified as background by the model, with R ranging from 0.895 to 0.965, and the misclassification between Camellia oleifera Abel. and Cunninghamia lanceolata is higher than that of other tree species, with P ranging from 0.773 to 0.850 and 0.718 to 0.800, respectively.

3.2. Performance of PCA Dimensionality Reduction Data

The accuracy of individual tree species identification for Experiment B is shown in Table 4. It can be seen that the overall P, overall R, and overall F1-score of individual tree species identification with PCA dimensionality reduction data are 0.730, 0.671, and 0.669, respectively, which are reduced by 0.055, 0.154, and 0.133, respectively, compared with the full-band hyperspectral data. This indicates that although PCA processing can compress a large amount of information into fewer dimensions, to a certain extent, some key information in the original hyperspectral image that is effective for individual tree species identification may be lost, so the identification effect of experiment B is lower than that of experiment A1 (full-band hyperspectral data).
The confusion matrix of Experiment B is shown in Figure 6f. Compared with Experiment A1, there is a significant increase in the misidentification of forest trees as background caused by using PCA dimensionality reduction data, and the misidentification of Camellia oleifera Abel. is particularly significant, with an R value of only 0.338. However, the number of backgrounds it identified as individual trees was decreased compared to the full-band data.

3.3. Performance of Simulated Multispectral Data

Table 5 shows the individual tree identification effects of three simulated multispectral data as Mask R-CNN model data sources (Experiment C). The identification effects of different multispectral data were significantly different. When the Green–Red–NIR data are used as the model input, the individual tree species identification performs better than other combinations, and the overall F1-score reaches 0.814, which is slightly higher than that of Experiment A1 (full-band hyperspectral data). When the band combination is Blue–Green–Red, the individual tree species identification accuracy is the lowest, and the overall F1-score is only 0.187. The overall F1-score of Blue–Green–Red–NIR data is 0.757, which decreases by 0.057 and increases by 0.57, compared to Green–Red–NIR data and Blue–Green–Red data, respectively. The addition of the blue band reduces the effect of individual tree species identification, while the NIR band improves the effect of the individual tree species identification effect. This suggests that the blue band may be an interfering factor and the NIR band may be a band that contributes to individual tree species identification.
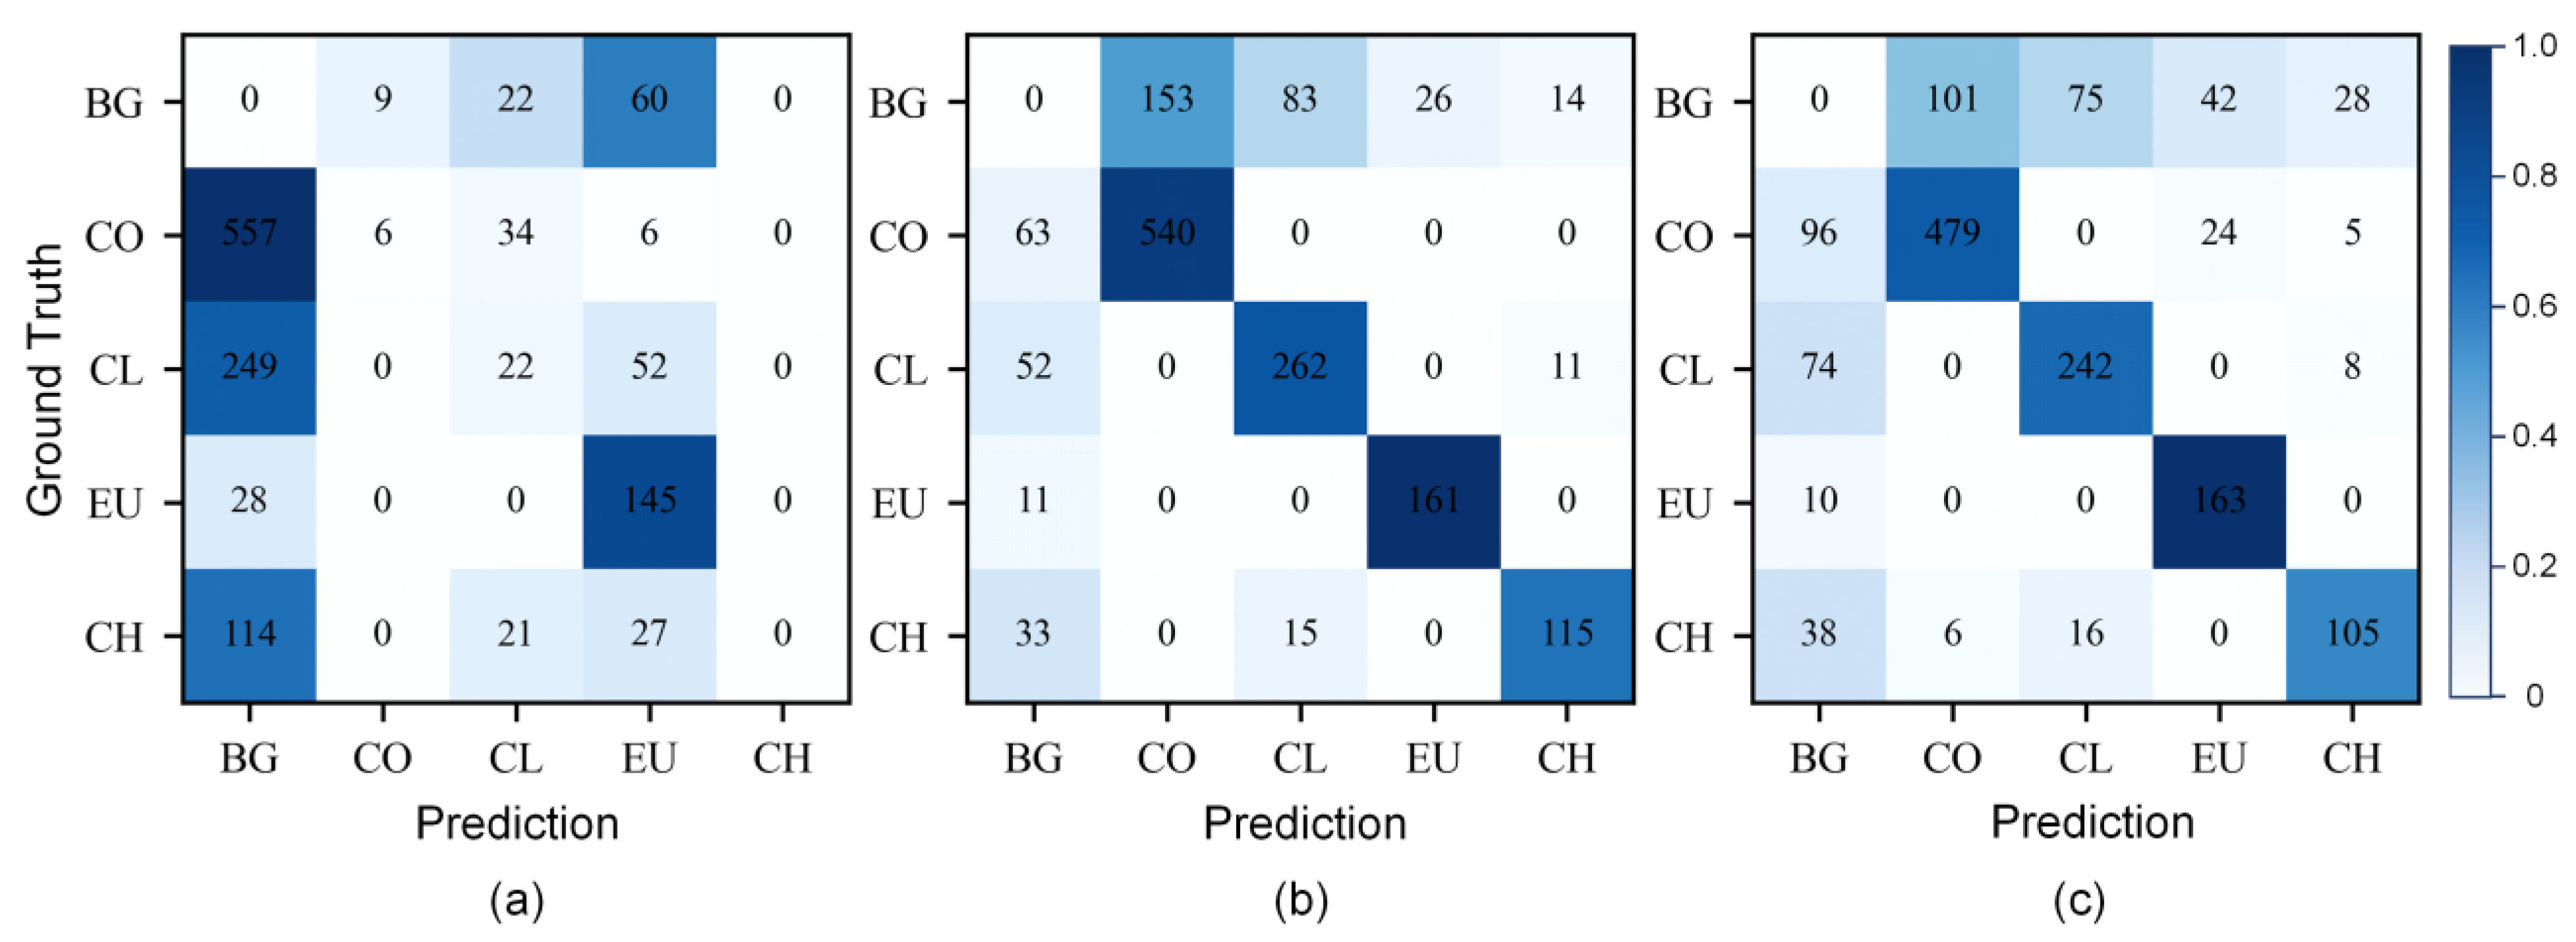
The confusion matrix of individual tree species identification for Experiment C is shown in Figure 7. All three data sets have the phenomenon of misdetection, false detection, and misclassification. Both the Green–Red–NIR and Blue–Green–Red–NIR data have a relatively low rate of tree misidentification. However, when the input data are Blue–Green–Red, the performance of individual tree species identification is poor, and the misdetection phenomenon is more prominent for three species (Camellia oleifera Abel., Cunninghamia lanceolata, and Castanopsis hystrix Miq.), all of which have an R close to 0. This indicates that the visible band has a limited ability to provide effective spectral information for distinguishing other tree species and backgrounds.
In general, the Green–Red–NIR data perform well as the input data of the model, and they have a good ability to identify individual tree species in different forest stand densities. Figure 8 shows the detailed results of individual tree species identification in different typical areas. It can be seen that all individual trees have been identified with a high success rate. Comparing Figure 8a1,b1, it can be seen that the crowns of Eucalyptus spp. are more obvious and the identification effect is better. Figure 8b2,b3 show the predicted results for the mixed region of Cunninghamia lanceolata and Castanopsis hystrix Miq. The crown boundary of the two tree species is not obvious, so there is a small part of misdetection. From Figure 8a4,b4, it can be seen that the crown of Camellia oleifera Abel. is small, densely distributed, and closely connected between the canopies; this may be a reason for the phenomenon of some misdetection. Due to the interference of other shrubs, Camellia oleifera Abel. also has a small number of false detections.
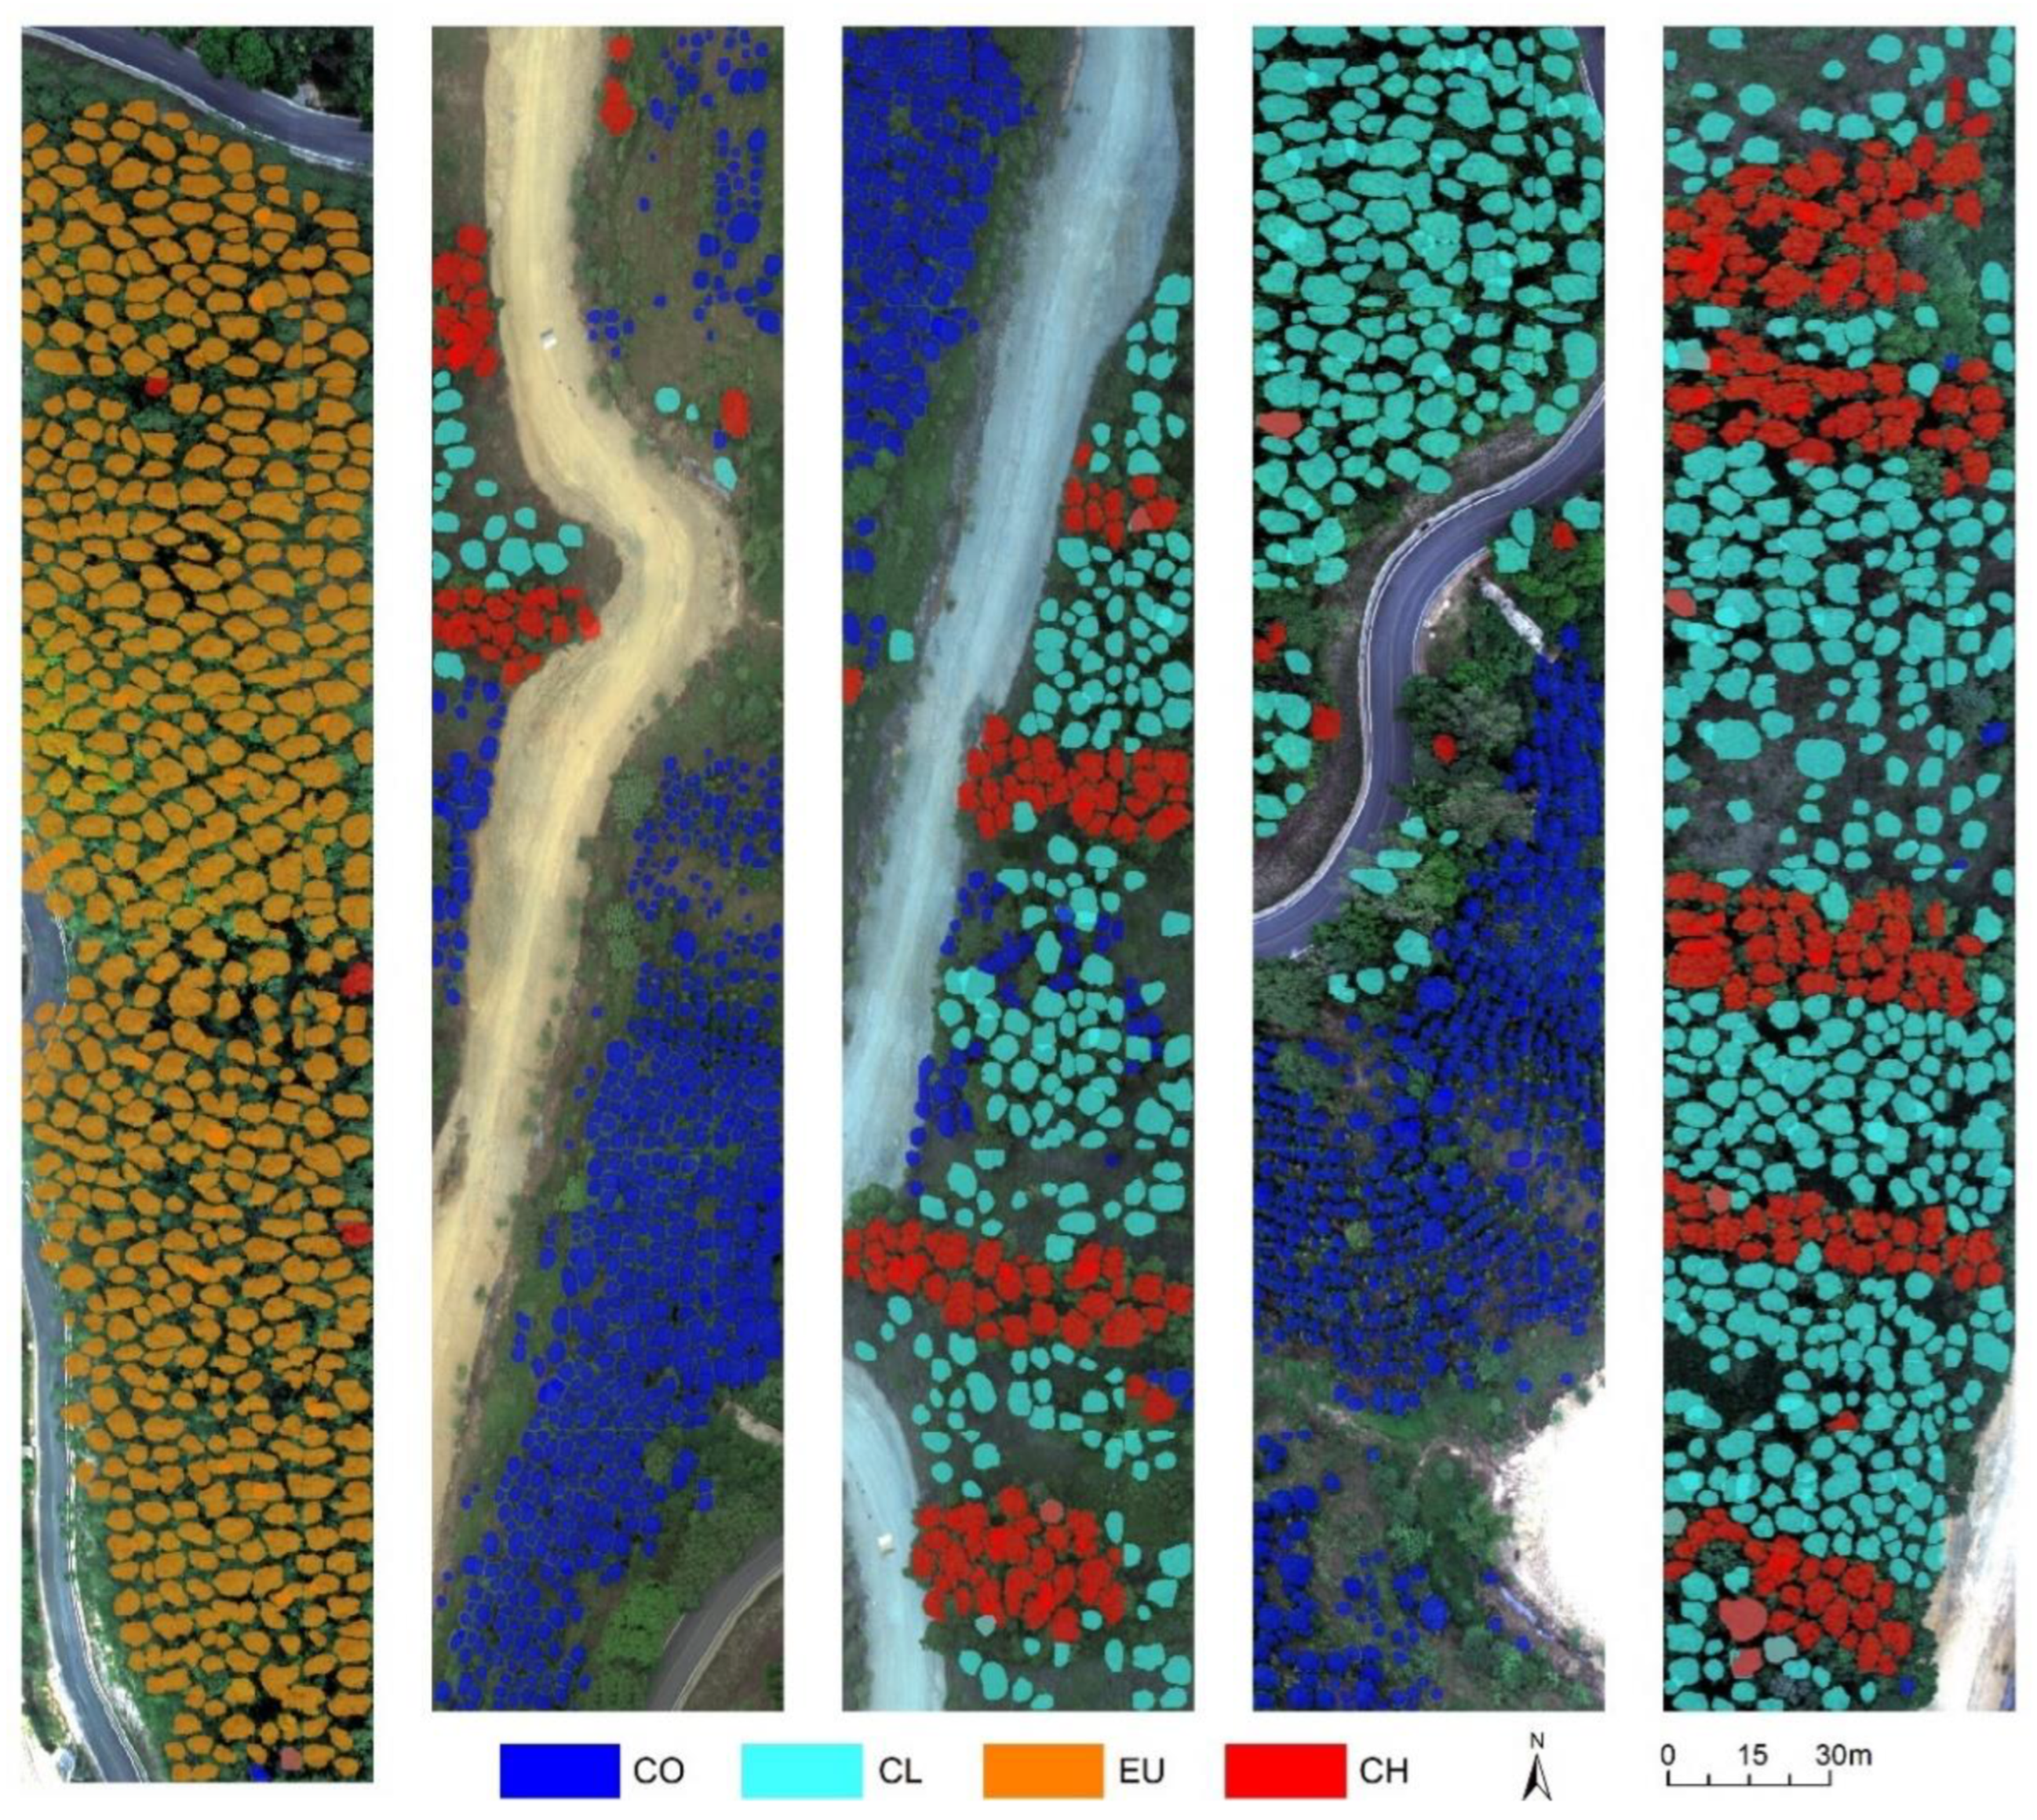
In addition, we predicted the individual tree species of all obtained images using Green–Red–NIR data (Figure 9). It can be seen that the study area has typical characteristics of southern complex plantation forests with mixed multi-species, diverse tree planting density, and some shading phenomenon of adjacent crowns. The predicted maps show that the crown segmentation results can reflect the true crown shape with little confusion in the classification of different tree species, and the trees are clearly distinguished from the backgrounds of roads and shrubs, indicating that the Mask R-CNN model and the UAV optical image have good practicability and accuracy for individual tree scale species surveys.

3.4. Individual Tree Crown Parameters Extraction

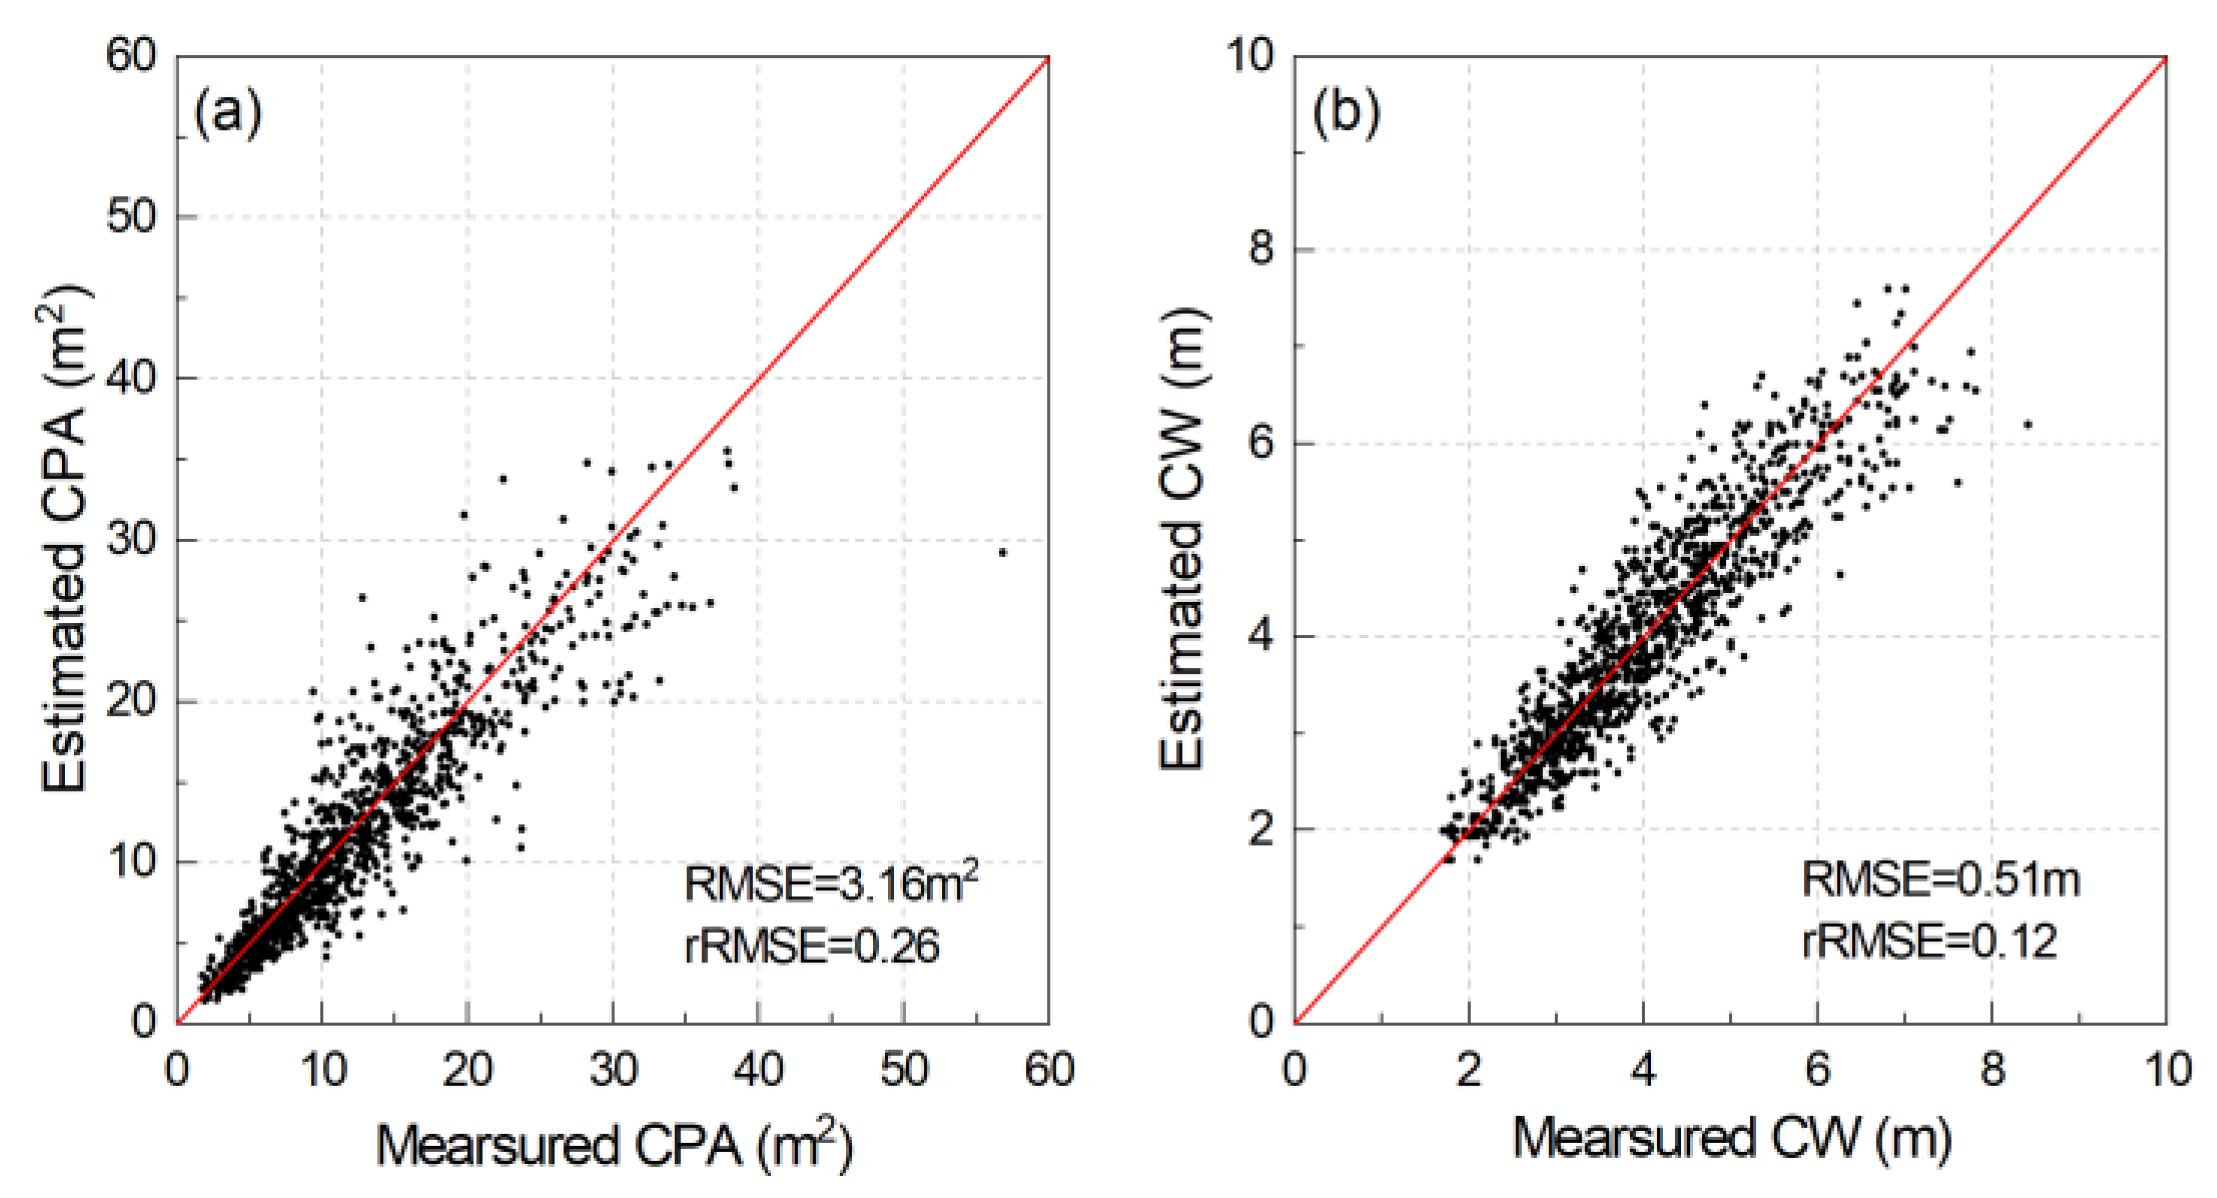
Using the Green–Red–NIR data as the model input (Experiment C2), we predicted crown parameters for all correctly predicted individual trees in the study area and compared them with the measured values. Figure 10 shows the scatter plots of the predicted and measured values of crown area and crown width. Overall, the model is capable of extracting parameters of individual tree crowns, with the RMSE and rRMSE of the crown area prediction being 3.16 m2 and 0.26, respectively; the RMSE and rRMSE of crown width prediction are 0.51 m and 0.12, respectively. The prediction errors of the two crucial individual tree crown parameters (crown area and crown width) are both low, indicating that the use of the Mask R-CNN model for individual tree crown parameters extraction is a feasible approach.

4. Discussion

In this study, we investigated the applicability of UAV hyperspectral and multispectral data applied to the Mask R-CNN instance segmentation model for individual tree species identification considering the cost of data acquisition and processing as well as the commonly used UAV optical remote sensing bands, and we compared the individual tree species identification effects of different spectral thinning data (Experiment A), PCA dimensionality reduction data (Experiment B), and different multispectral data (Experiment C). We found that there were significant differences in the individual tree species identification accuracy of different data (Table 4 and Table 5).

4.1. Applicability of Hyperspectral Data

In Experiment A, the accuracy of individual tree species identification shows a decreasing trend as the number of bands decreases (Table 4), which can be attributed to the fact that spectral information plays a crucial role in distinguishing trees from the background and identifying tree species (Figure 5). The spectral reflectance characteristics of the tree canopy and backgrounds, such as soil, differ greatly, but they are similar for different tree species, which leads to greater difficulty in identifying tree species. The rich and fine spectral information helps to reveal the subtle property differences between different tree species [22], while a small number of bands tend to cause classification confusion.
Although the PCA dimensionality reduction method shows a favorable capacity for tree species identification at the stand scale [39], it does not achieve perfect results in individual tree species identification. We compared the data before and after PCA processing to investigate the reasons (Figure 11). Compared with the original hyperspectral data, the tree crown profile of the PCA dimensionality reduction data becomes less obvious (Figure 11b). The PCA dimensionality reduction method can compress most of the information of hyperspectral data into the first few principal components in the spectral dimension with less information loss [31]. However, because the PCA method uses linear transformation to reduce the dimensionality, the obtained principal components are linear combinations of the original data variables [40], which may disrupt the original texture patterns, e.g., gray level differences between neighboring pixels become difficult to interpret after the transformation. In addition, the PCA dimensionality reduction method uses variance to measure the information content of principal components, which may have some limitations [41]. In the input data, only the first few principal components with high variance were retained; as such, maybe some valid key information was not retained (e.g., spatial information). Individual tree species identification also needs to emphasize the use of spatial information (e.g., crown boundary features), compared with pixel-by-pixel image classification; this may be a reason why PCA dimensionality reduction data are ineffective in individual tree species identification.

4.2. Practicability of Multispectral and RGB Data

This study also verified the practicality of multispectral data with visible and near-infrared bands for individual tree species identification. Although the Blue–Green–Red–NIR data contain an additional blue band compared to the Green–Red–NIR data, they have a relatively low accuracy, indicating that the blue band has a certain interference effect. According to Figure 5, the spectral reflectance of the four tree species and the background in the blue band (400–500 nm) are all in the range of 0.05–0.1, with similar spectral reflectance and low distinguishability, which has a certain interference effect on the tree species classification. Compared with the Blue–Green–Red data, the Blue–Green–Red–NIR data add one NIR band, and they have a better identification accuracy of individual tree species. This may be because there is a large difference between the spectral reflectance of the four species and background in the NIR range (760–1000 nm) (Figure 5), which is important for distinguishing tree species from other species and backgrounds [42]. In addition, this study also finds that although Green–Red–NIR data have only three bands, their performance for individual tree species identification is slightly better than full-band hyperspectral data. This indicates that the Green–Red–NIR combination is effective for individual tree species identification, while directly using hyperspectral data may not be the best choice due to band interference and insufficient utilization of image information. Therefore, for individual tree species identification, selecting specific spectral combination data or appropriate sensors may be more effective and useful than directly using all wavelength range data.
Visible and NIR are the most commonly used spectral bands for UAV optical remote sensing. UAV equipped with an RGB camera has been extensive applied in forestry investigation [43] and disaster monitoring [44] due to the advantage of low cost. However, this study shows that it has great limitations in individual tree species identification using RGB images. On the contrary, UAV equipped with a Green–Red–NIR three-band camera can obtain accuracy of individual tree species identification similar to that of the hyperspectral sensor. In addition, a multispectral image typically has better data quality than a hyperspectral image, e.g., the signal-to-noise ratio. The Green–Red–NIR solution could perhaps achieve better identification results than simulated data in practical applications. This can provide a reference for UAV payload selection and design in precision forest surveys.

4.3. Influence of Stand Conditions and Tree Species Characteristics

Eucalyptus spp. has a better identification result than other species, while the performance of other tree species is generally similar, which may be related to the characteristics of the different species and stand conditions. Eucalyptus spp. has a regular spatial distribution in the study area, with a certain distance between crowns and less overlap (Figure 8(a1)), so the proportion of Eucalyptus spp. correctly identified is higher. The mixed growth of Cunninghamia lanceolata and Castanopsis hystrix Miq. has a complex spatial distribution, diverse crown morphology, obvious overlap between adjacent crowns (Figure 8(a2,a3)), and similar spectral reflectance, resulting in misclassification of the two species. Although the spectral reflectance of Camellia oleifera Abel. differs from that of other tree species, they are planted densely, and their crowns are small with blurred boundaries in the image (Figure 8(a4)), which increases the difficulty of individual tree species identification and leads to partial misdetection of the crown. In order to address the low accuracy of individual tree species identification due to spectral confusion among trees, it may be helpful to use higher spatial resolution images to synergize spatial structure and spectral information [45].

4.4. Limitations of this Study

This study also has some limitations: (1) Optical orthophotos can only reflect the horizontal distribution information of tree crowns, but they lack vertical spatial structure features, which may cause the delineation of crown outlines to be influenced by shrubs and adjacent crowns [46]. LiDAR data can obtain three-dimensional spatial information of the forest, which has the advantage of effectively distinguishing trees from low vegetation and precisely segmenting crowns [47]. Therefore, a future study will consider synergizing hyperspectral image with LiDAR data to fully utilize stereo–spatial and spectral information for individual tree species identification. (2) There is mainly plantation forest in the study area; future research will conduct experiments in natural forests with a larger area and more complex tree species composition to further evaluate the advantages and applicability of different types of UAV remote sensing data for forest resource investigation.

5. Conclusions

In this study, we evaluated the performance of different hyperspectral data, PCA dimensionality reduction data, and commonly used multispectral data for Mask R-CNN individual tree species identification models. The main conclusions are as follows: (1) The accuracy of individual tree species identification using full-band hyperspectral data is optimal with an overall F1-score of 0.802, which is higher than that of other thinning data. (2) The PCA dimensionality reduction process might lose some useful information for individual tree species identification, resulting in a relatively poor identification effect compared with full-band hyperspectral data. (3) The Green–Red–NIR band combination is effective input data for the Mask R-CNN model, with an overall F1-score of 0.814, which exceeds that of full-band hyperspectral data. The Blue band is an interference band for individual tree species identification, while the NIR band has an improvement effect. This conclusion could provide a basis for UAV sensors payload design and selection in a precise forest survey. (4) The Green–Red–NIR data are effective for extracting individual tree crown parameters, with an RMSE of 3.16 m2 and 0.51 m for the crown area and crown width and an rRMSE of 0.26 and 0.12, respectively. This study satisfies the application demand of end-to-end individual tree species identification under complex forest environment with high canopy density, multiple species, and irregular crown shape. It can provide technical support for a tree species survey and forest structure parameters extraction, and it has practical value for efficient and precise forest management and ecosystem conservation.

Author Contributions

Z.Y. and G.C. designed the specific scheme, completed the experiments, and wrote the paper. L.L. and X.J. completed the result data analysis. X.Z. modified and directed the writing of the paper. All authors have read and agreed to the published version of the manuscript.

Funding

This research was funded by the National Natural Science Foundation of China (grant number: 32171779), National Key Research and Development Program of China (grant numbers: 2021YFE0117700 and 2017YFD0600900), and DRAGON 5 COOPERATION [ID: 59257].

Data Availability Statement

The datasets used in this study are available from the corresponding author on reasonable request.

Acknowledgments

We would like to thank the Gaofeng Forest Farm in Nanning City, Guangxi Province for their help during the field survey. We also thank the anonymous reviewers for their constructive comments.

Conflicts of Interest

The authors declare no conflict of interest.

References

  1. Modzelewska, A.; Fassnacht, F.E.; Stereńczak, K. Tree species identification within an extensive forest area with diverse management regimes using airborne hyperspectral data. Int. J. Appl. Earth Obs. Geoinf. 2020, 84, 101960. [Google Scholar] [CrossRef]
  2. Banskota, A.; Wynne, R.H.; Kayastha, N. Improving within-genus tree species discrimination using the discrete wavelet transform applied to airborne hyperspectral data. Int. J. Remote Sens. 2011, 32, 3551–3563. [Google Scholar] [CrossRef]
  3. Li, X.; Wang, H.; Luan, J.; Chang, S.X.; Gao, B.; Wang, Y.; Liu, S. Functional diversity dominates positive species mixture effects on ecosystem multifunctionality in subtropical plantations. For. Ecosyst. 2022, 9, 100039. [Google Scholar] [CrossRef]
  4. Carlson, K.M.; Asner, G.P.; Hughes, R.F.; Ostertag, R.; Martin, R.E. Hyperspectral Remote Sensing of Canopy Biodiversity in Hawaiian Lowland Rainforests. Ecosystems 2007, 10, 536–549. [Google Scholar] [CrossRef]
  5. Sun, Y.; Xin, Q.; Huang, J.; Huang, B.; Zhang, H. Characterizing Tree Species of a Tropical Wetland in Southern China at the Individual Tree Level Based on Convolutional Neural Network. IEEE J. Sel. Top. Appl. Earth Obs. Remote Sens. 2019, 12, 4415–4425. [Google Scholar] [CrossRef]
  6. Carvalho, M.d.A.; Marcato, J.; Martins, J.A.C.; Zamboni, P.; Costa, C.S.; Siqueira, H.L.; Araújo, M.S.; Gonçalves, D.N.; Furuya, D.E.G.; Osco, L.P.; et al. A deep learning-based mobile application for tree species mapping in RGB images. Int. J. Appl. Earth Obs. Geoinf. 2022, 114, 103045. [Google Scholar] [CrossRef]
  7. Zhang, Z.; Zhu, L. A Review on Unmanned Aerial Vehicle Remote Sensing: Platforms, Sensors, Data Processing Methods, and Applications. Drones 2023, 7, 398. [Google Scholar] [CrossRef]
  8. Masek, J.G.; Hayes, D.J.; Joseph Hughes, M.; Healey, S.P.; Turner, D.P. The role of remote sensing in process-scaling studies of managed forest ecosystems. For. Ecol. Manag. 2015, 355, 109–123. [Google Scholar] [CrossRef]
  9. Schiefer, F.; Kattenborn, T.; Frick, A.; Frey, J.; Schall, P.; Koch, B.; Schmidtlein, S. Mapping forest tree species in high resolution UAV-based RGB-imagery by means of convolutional neural networks. ISPRS J. Photogramm. Remote Sens. 2020, 170, 205–215. [Google Scholar] [CrossRef]
  10. Lei, L.; Yin, T.; Chai, G.; Li, Y.; Wang, Y.; Jia, X.; Zhang, X. A novel algorithm of individual tree crowns segmentation considering three-dimensional canopy attributes using UAV oblique photos. Int. J. Appl. Earth Obs. Geoinf. 2022, 112, 102893. [Google Scholar] [CrossRef]
  11. Zhang, C.; Zhou, J.; Wang, H.; Tan, T.; Cui, M.; Huang, Z.; Wang, P.; Zhang, L. Multi-Species Individual Tree Segmentation and Identification Based on Improved Mask R-CNN and UAV Imagery in Mixed Forests. Remote Sens. 2022, 14, 874. [Google Scholar] [CrossRef]
  12. Liu, H.; Wu, C. Crown-level tree species classification from AISA hyperspectral imagery using an innovative pixel-weighting approach. Int. J. Appl. Earth Obs. Geoinf. 2018, 68, 298–307. [Google Scholar] [CrossRef]
  13. Dalponte, M.; Ene, L.T.; Marconcini, M.; Gobakken, T.; Næsset, E. Semi-supervised SVM for individual tree crown species classification. ISPRS J. Photogramm. Remote Sens. 2015, 110, 77–87. [Google Scholar] [CrossRef]
  14. Dalponte, M.; Ørka, H.O.; Ene, L.T.; Gobakken, T.; Næsset, E. Tree crown delineation and tree species classification in boreal forests using hyperspectral and ALS data. Remote Sens. Environ. 2014, 140, 306–317. [Google Scholar] [CrossRef]
  15. Qin, H.; Zhou, W.; Yao, Y.; Wang, W. Individual tree segmentation and tree species classification in subtropical broadleaf forests using UAV-based LiDAR, hyperspectral, and ultrahigh-resolution RGB data. Remote Sens. Environ. 2022, 280, 113143. [Google Scholar] [CrossRef]
  16. Engler, R.; Waser, L.T.; Zimmermann, N.E.; Schaub, M.; Berdos, S.; Ginzler, C.; Psomas, A. Combining ensemble modeling and remote sensing for mapping individual tree species at high spatial resolution. For. Ecol. Manag. 2013, 310, 64–73. [Google Scholar] [CrossRef]
  17. He, K.; Gkioxari, G.; Dollár, P.; Girshick, R. Mask R-CNN. In Proceedings of the 2017 IEEE International Conference on Computer Vision (ICCV), Venice, Italy, 22–29 October 2017; pp. 2980–2988. [Google Scholar]
  18. Li, Y.; Chai, G.; Wang, Y.; Lei, L.; Zhang, X. ACE R-CNN: An Attention Complementary and Edge Detection-Based Instance Segmentation Algorithm for Individual Tree Species Identification Using UAV RGB Images and LiDAR Data. Remote Sens. 2022, 14, 3035. [Google Scholar] [CrossRef]
  19. Yang, M.; Mou, Y.; Liu, S.; Meng, Y.; Liu, Z.; Li, P.; Xiang, W.; Zhou, X.; Peng, C. Detecting and mapping tree crowns based on convolutional neural network and Google Earth images. Int. J. Appl. Earth Obs. Geoinf. 2022, 108, 102764. [Google Scholar] [CrossRef]
  20. Xi, X.; Xia, K.; Yang, Y.; Du, X.; Feng, H. Evaluation of dimensionality reduction methods for individual tree crown delineation using instance segmentation network and UAV multispectral imagery in urban forest. Comput. Electron. Agric. 2021, 191, 106506. [Google Scholar] [CrossRef]
  21. Shi, Y.; Skidmore, A.K.; Wang, T.; Holzwarth, S.; Heiden, U.; Pinnel, N.; Zhu, X.; Heurich, M. Tree species classification using plant functional traits from LiDAR and hyperspectral data. Int. J. Appl. Earth Obs. Geoinf. 2018, 73, 207–219. [Google Scholar] [CrossRef]
  22. Zhang, B.; Zhao, L.; Zhang, X. Three-dimensional convolutional neural network model for tree species classification using airborne hyperspectral images. Remote Sens. Environ. 2020, 247, 111938. [Google Scholar] [CrossRef]
  23. Chen, L.; Wei, Y.; Yao, Z.; Chen, E.; Zhang, X. Data Augmentation in Prototypical Networks for Forest Tree Species Classification Using Airborne Hyperspectral Images. IEEE Trans. Geosci. Remote Sens. 2022, 60, 1–16. [Google Scholar] [CrossRef]
  24. Fassnacht, F.E.; Latifi, H.; Stereńczak, K.; Modzelewska, A.; Lefsky, M.; Waser, L.T.; Straub, C.; Ghosh, A. Review of studies on tree species classification from remotely sensed data. Remote Sens. Environ. 2016, 186, 64–87. [Google Scholar] [CrossRef]
  25. Guo, X.; Li, H.; Jing, L.; Wang, P. Individual Tree Species Classification Based on Convolutional Neural Networks and Multitemporal High-Resolution Remote Sensing Images. Sensors 2022, 22, 3157. [Google Scholar] [CrossRef] [PubMed]
  26. Savitzky, A.; Golay, M.J.E. Smoothing and Differentiation of Data by Simplified Least Squares Procedures. Anal. Chem. 1964, 36, 1627–1639. [Google Scholar] [CrossRef]
  27. Zhang, H.; Zhang, S.; Dong, W.; Luo, W.; Huang, Y.; Zhan, B.; Liu, X. Detection of common defects on mandarins by using visible and near infrared hyperspectral imaging. Infrared Phys. Technol. 2020, 108, 103341. [Google Scholar] [CrossRef]
  28. Raczko, E.; Zagajewski, B. Comparison of support vector machine, random forest and neural network classifiers for tree species classification on airborne hyperspectral APEX images. Eur. J. Remote Sens. 2017, 50, 144–154. [Google Scholar] [CrossRef]
  29. Lee, J.; Cai, X.; Lellmann, J.; Dalponte, M.; Malhi, Y.; Butt, N.; Morecroft, M.; Schönlieb, C.B.; Coomes, D.A. Individual Tree Species Classification From Airborne Multisensor Imagery Using Robust PCA. IEEE J. Sel. Top. Appl. Earth Obs. Remote Sens. 2016, 9, 2554–2567. [Google Scholar] [CrossRef]
  30. Pandey, P.C.; Tate, N.J.; Balzter, H. Mapping Tree Species in Coastal Portugal Using Statistically Segmented Principal Component Analysis and Other Methods. IEEE Sens. J. 2014, 14, 4434–4441. [Google Scholar] [CrossRef]
  31. Fırat, H.; Asker, M.E.; Hanbay, D. Classification of hyperspectral remote sensing images using different dimension reduction methods with 3D/2D CNN. Remote Sens. Appl. Soc. Environ. 2022, 25, 100694. [Google Scholar] [CrossRef]
  32. Dadon, A.; Mandelmilch, M.; Ben-Dor, E.; Sheffer, E. Sequential PCA-based Classification of Mediterranean Forest Plants using Airborne Hyperspectral Remote Sensing. Remote Sens. 2019, 11, 2800. [Google Scholar] [CrossRef]
  33. Pedregosa, F.; Varoquaux, G.; Gramfort, A.; Michel, V.; Thirion, B.; Grisel, O.; Blondel, M.; Prettenhofer, P.; Weiss, R.; Dubourg, V.; et al. Scikit-learn: Machine Learning in Python. J. Mach. Learn. Res. 2011, 12, 2825–2830. [Google Scholar]
  34. Osco, L.P.; Marcato Junior, J.; Marques Ramos, A.P.; de Castro Jorge, L.A.; Fatholahi, S.N.; de Andrade Silva, J.; Matsubara, E.T.; Pistori, H.; Gonçalves, W.N.; Li, J. A review on deep learning in UAV remote sensing. Int. J. Appl. Earth Obs. Geoinf. 2021, 102, 102456. [Google Scholar] [CrossRef]
  35. Del Pozo, S.; Lindenbergh, R.; Rodríguez-Gonzálvez, P.; Kees Blom, J.; González-Aguilera, D. Discrimination between Sedimentary Rocks from Close-Range Visible and Very-Near-Infrared Images. PLoS ONE 2015, 10, e0132471. [Google Scholar] [CrossRef] [PubMed]
  36. De Castro, A.I.; Ehsani, R.; Ploetz, R.; Crane, J.H.; Abdulridha, J. Optimum spectral and geometric parameters for early detection of laurel wilt disease in avocado. Remote Sens. Environ. 2015, 171, 33–44. [Google Scholar] [CrossRef]
  37. Wu, X.; Sahoo, D.; Hoi, S.C.H. Recent advances in deep learning for object detection. Neurocomputing 2020, 396, 39–64. [Google Scholar] [CrossRef]
  38. Hao, Z.; Lin, L.; Post, C.J.; Mikhailova, E.A.; Li, M.; Chen, Y.; Yu, K.; Liu, J. Automated tree-crown and height detection in a young forest plantation using mask region-based convolutional neural network (Mask R-CNN). ISPRS J. Photogramm. Remote Sens. 2021, 178, 112–123. [Google Scholar] [CrossRef]
  39. Zhong, H.; Lin, W.; Liu, H.; Ma, N.; Liu, K.; Cao, R.; Wang, T.; Ren, Z. Identification of tree species based on the fusion of UAV hyperspectral image and LiDAR data in a coniferous and broad-leaved mixed forest in Northeast China. Front. Plant Sci. 2022, 13, 964769. [Google Scholar] [CrossRef]
  40. Zabalza, J.; Ren, J.; Yang, M.; Zhang, Y.; Wang, J.; Marshall, S.; Han, J. Novel Folded-PCA for improved feature extraction and data reduction with hyperspectral imaging and SAR in remote sensing. ISPRS J. Photogramm. Remote Sens. 2014, 93, 112–122. [Google Scholar] [CrossRef]
  41. Jolliffe, I. Principal Component Analysis. In Encyclopedia of Statistics in Behavioral Science; John Wiley & Sons, Ltd.: Chichester, UK, 2005; pp. 1580–1584. [Google Scholar]
  42. Peerbhay, K.Y.; Mutanga, O.; Ismail, R. Investigating the Capability of Few Strategically Placed Worldview-2 Multispectral Bands to Discriminate Forest Species in KwaZulu-Natal, South Africa. IEEE J. Sel. Top. Appl. Earth Obs. Remote Sens. 2014, 7, 307–316. [Google Scholar] [CrossRef]
  43. Onishi, M.; Ise, T. Explainable identification and mapping of trees using UAV RGB image and deep learning. Sci. Rep. 2021, 11, 903. [Google Scholar] [CrossRef]
  44. Jiang, X.; Wu, Z.; Han, S.; Yan, H.; Zhou, B.; Li, J. A multi-scale approach to detecting standing dead trees in UAV RGB images based on improved faster R-CNN. PLoS ONE 2023, 18, e0281084. [Google Scholar] [CrossRef]
  45. Sun, Y.; Li, Z.; He, H.; Guo, L.; Zhang, X.; Xin, Q. Counting trees in a subtropical mega city using the instance segmentation method. Int. J. Appl. Earth Obs. Geoinf. 2022, 106, 102662. [Google Scholar] [CrossRef]
  46. Fang, F.; Im, J.; Lee, J.; Kim, K. An improved tree crown delineation method based on live crown ratios from airborne LiDAR data. GIScience Remote Sens. 2016, 53, 402–419. [Google Scholar] [CrossRef]
  47. Yun, T.; Jiang, K.; Li, G.; Eichhorn, M.P.; Fan, J.; Liu, F.; Chen, B.; An, F.; Cao, L. Individual tree crown segmentation from airborne LiDAR data using a novel Gaussian filter and energy function minimization-based approach. Remote Sens. Environ. 2021, 256, 112307. [Google Scholar] [CrossRef]
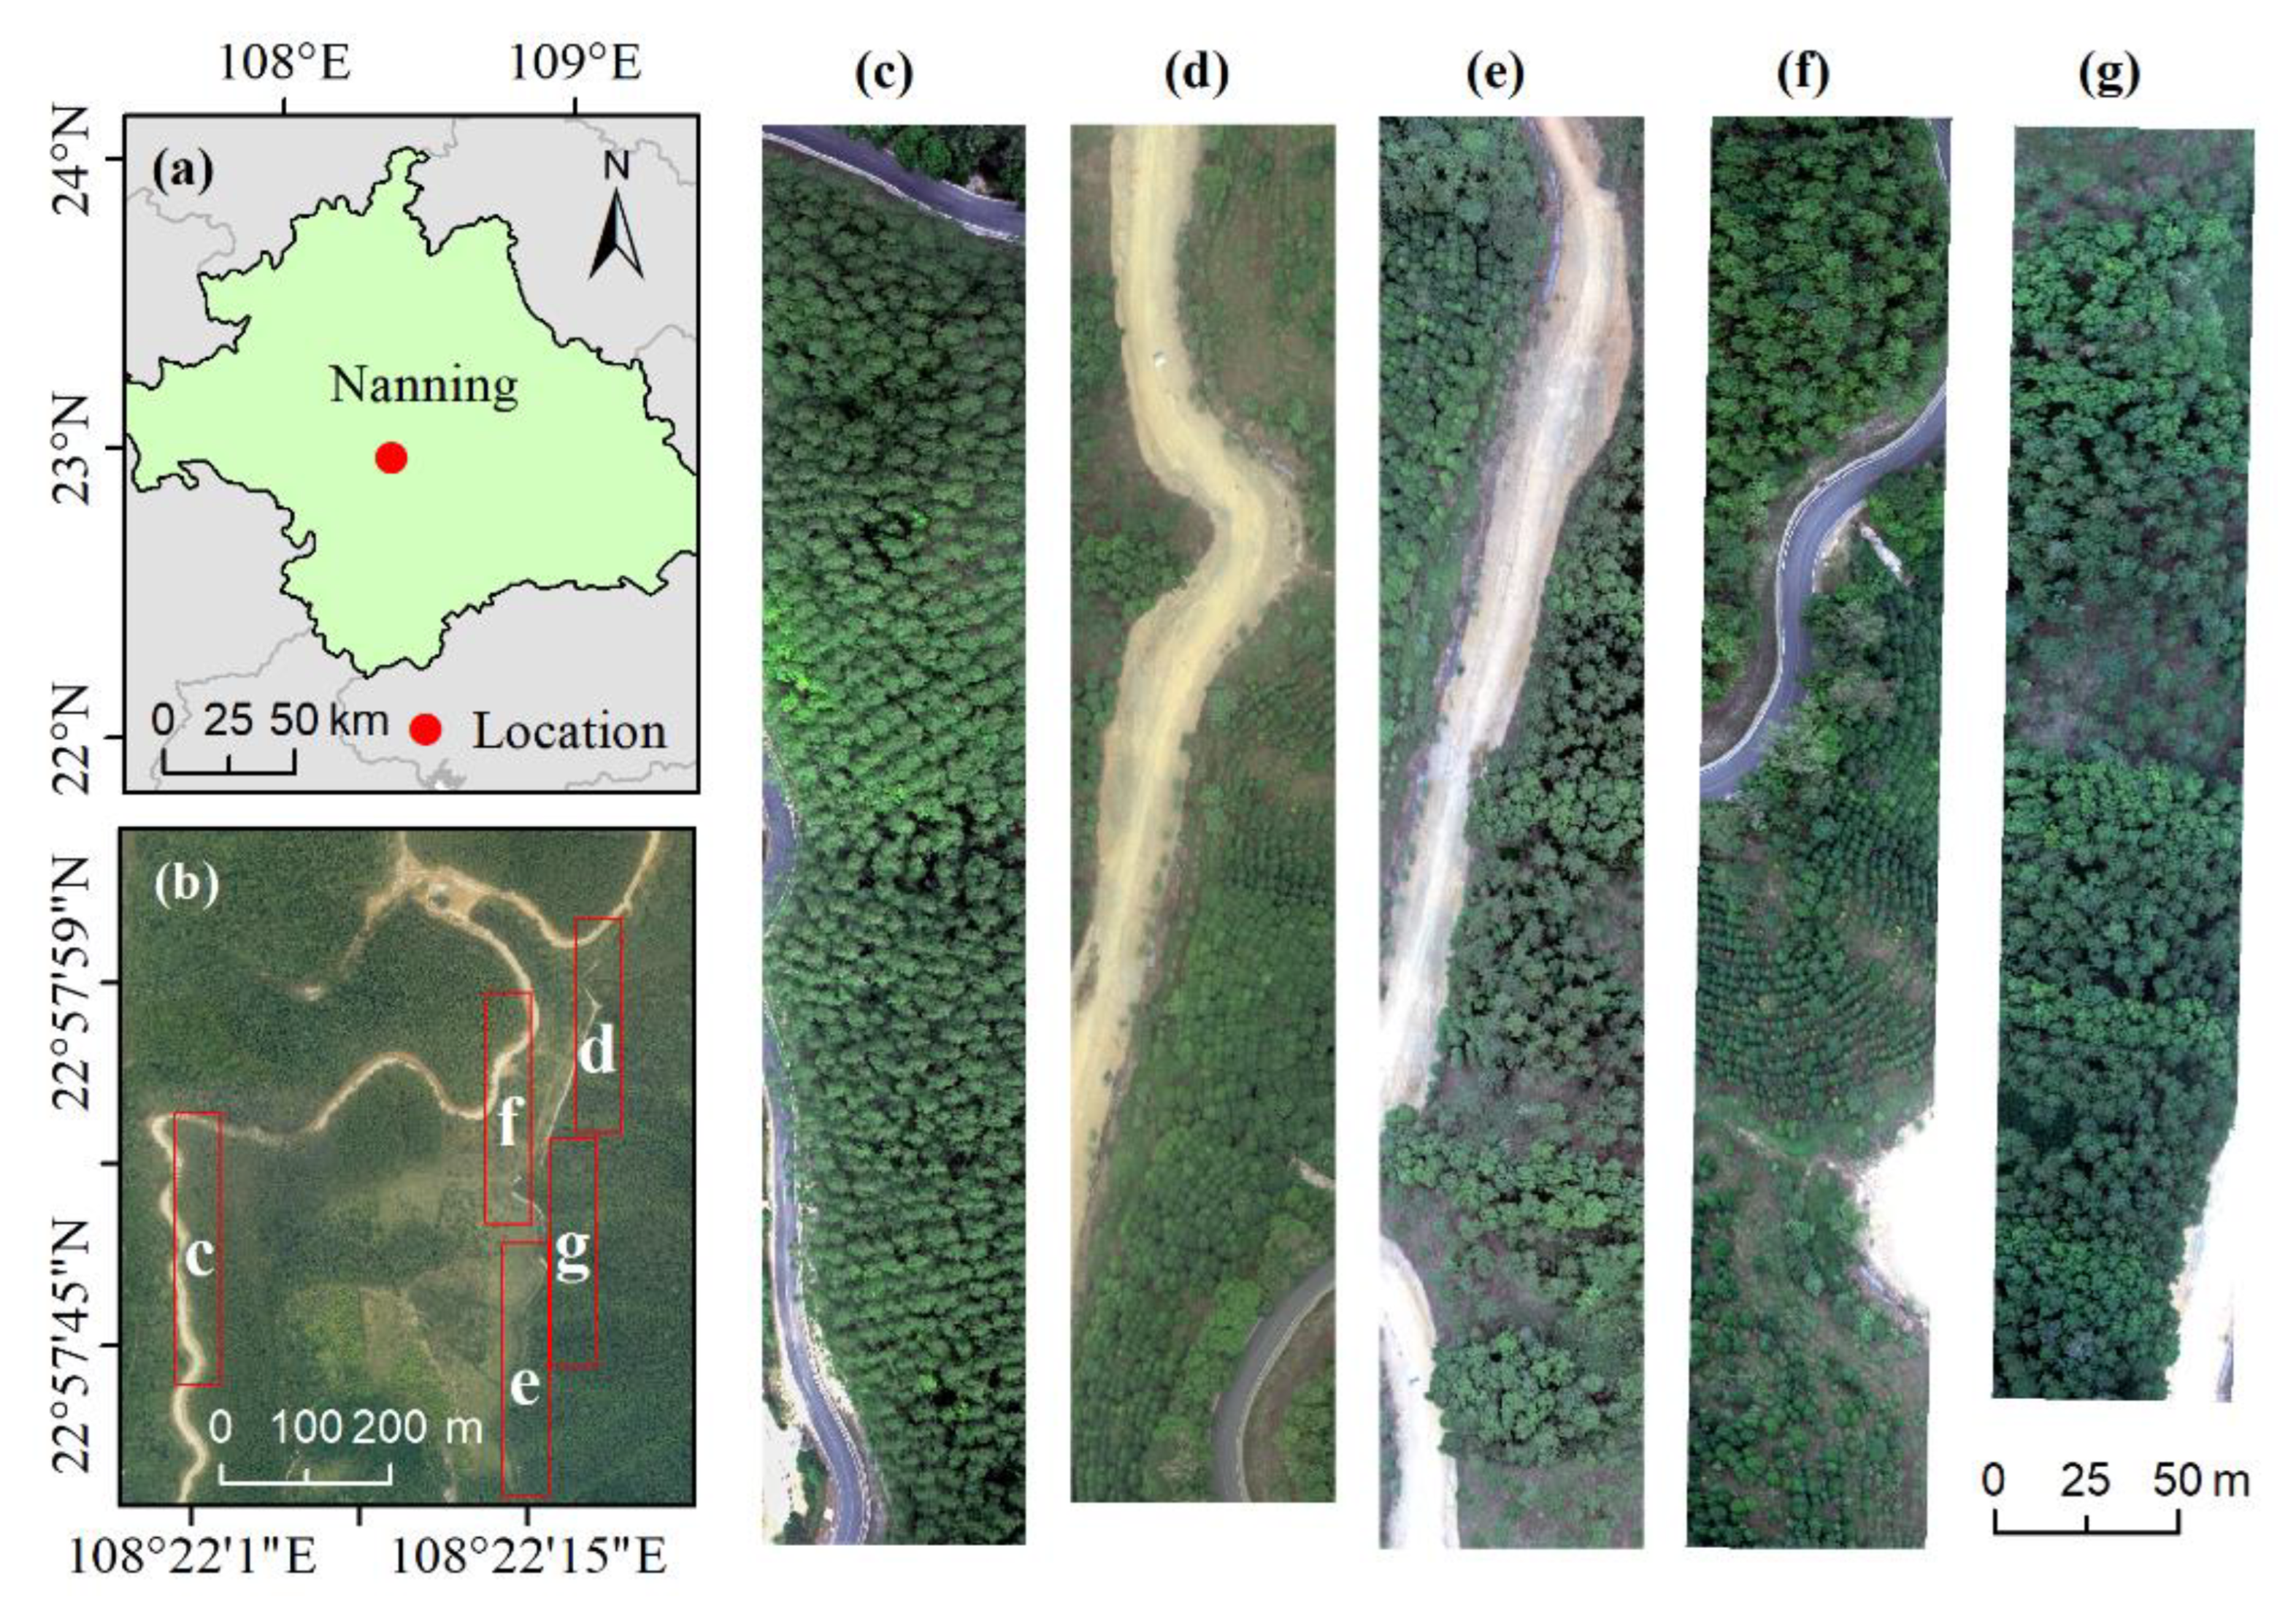
Figure 1. Overview of the study area. (a) Location of the study area; (b) Location of hyperspectral data distribution; (cg) True color display of hyperspectral data.
Remotesensing 15 05164 g001
Figure 2. The framework of Mask R-CNN model.
Remotesensing 15 05164 g002
Figure 3. Schematic diagram of spectral thinning processing.
Remotesensing 15 05164 g003
Figure 4. Spectral response curve of MCA sensor.
Remotesensing 15 05164 g004
Figure 5. Spectral reflectance curves of canopy with different spectral thinning data. (a) 1/1 bands; (b) 1/2 bands; (c) 1/4 bands; (d) 1/8 bands; (e) 1/16 bands.
Remotesensing 15 05164 g005
Figure 6. Confusion matrix for individual tree species identification with different hyperspectral processing data. The number in each cell indicates the number of trees. The color of the cell refers to its ratio to the number of all ground truth samples (the sum of the row). (ae) Experiment A1–A5; (f) Experiment B.
Remotesensing 15 05164 g006
Figure 7. Confusion matrix for individual tree species identification with three multispectral data sets. (ac) Experiment C1–C3.
Remotesensing 15 05164 g007
Figure 8. The results of individual tree species identification in different typical regions with Green–Red–NIR data. (a1a4) Ground truth; (b1b4) Prediction results.
Remotesensing 15 05164 g008
Figure 9. Prediction maps of individual tree species identification using Green–Red–NIR data.
Remotesensing 15 05164 g009
Figure 10. Scatter plot of predicted and measured tree crown parameters, where the red line indicates the 1:1 line. (a) Crown projection area; (b) Crown width.
Remotesensing 15 05164 g010
Figure 11. PCA dimensionality reduction results of hyperspectral data. (a) True color display of hyperspectral data; (b) False color image of PCA data; (ce) Grayscale maps of the first three principal components.
Remotesensing 15 05164 g011
Table 1. Parameters of UAV flight and hyperspectral sensor.
ParametersValuesParametersValues
Flight altitude100 mFlight speed4 m/s
Wavelength range400–1000 nmSpectral number271
Spectral resolution2.2 nmSpatial resolution0.1 m
Lens focal length8 mmField of view33°
Bit depth12 bitsCMOS pixel size7.4 μm
Table 2. Number of trees (plants) of all species in the sample set.
Tree SpeciesTraining SetTest Set
CO1352328
CL984251
EU546130
CH573141
Table 3. Experimental design for individual tree species identification.
ExperimentsData Processing MethodsData DescriptionNumber of Bands
ASpectral thinningA1: 1/1 bands271
A2: 1/2 bands135
A3: 1/4 bands67
A4: 1/8 bands33
A5: 1/16 bands16
BSpectral dimensionality reductionPCA dimensionality reduction data3
CSpectral simulationC1: Blue–Green–Red3
C2: Green–Red–NIR3
C3: Blue–Green–Red–NIR4
Table 4. Identification accuracy of different hyperspectral processing data.
ExperimentsSpeciesPRF1-Score
A1CO0.8140.8680.840
CL0.7240.7880.755
EU0.8260.9650.890
CH0.7740.6770.722
Overall0.7850.8250.802
A2CO0.7960.8660.829
CL0.8000.7340.766
EU0.7750.9190.840
CH0.6610.7290.693
Overall0.7630.8150.786
A3CO0.8500.7900.819
CL0.7720.7150.742
EU0.8250.9300.874
CH0.7030.6770.689
Overall0.7880.7780.781
A4CO0.7730.8360.803
CL0.8000.6220.700
EU0.7890.9360.856
CH0.6350.6890.661
Overall0.7500.7710.755
A5CO0.7840.5310.633
CL0.7180.580.642
EU0.5860.8950.708
CH0.6760.2940.410
Overall0.6910.5750.598
BCO0.7940.3380.474
CL0.7000.7050.702
EU0.6130.9250.737
CH0.8110.7160.761
Overall0.7300.6710.669
Table 5. Accuracy of individual tree species identification with different multispectral data.
ExperimentSpeciesPRF1-Score
C1CO0.4000.0100.019
CL0.2220.0680.104
EU0.5000.8380.626
CH000
Overall0.2810.2290.187
C2CO0.7790.8960.833
CL0.7280.8060.765
EU0.8610.9360.897
CH0.8210.7060.759
Overall0.7970.8360.814
C3CO0.8170.7930.805
CL0.7270.7470.737
EU0.7120.9420.811
CH0.7190.6360.675
Overall0.7440.7800.757
Disclaimer/Publisher’s Note: The statements, opinions and data contained in all publications are solely those of the individual author(s) and contributor(s) and not of MDPI and/or the editor(s). MDPI and/or the editor(s) disclaim responsibility for any injury to people or property resulting from any ideas, methods, instructions or products referred to in the content.