Abstract
To calibrate airborne gravity gradiometers currently in development in China, it is urgent to build an airborne gravity gradiometer test site. The site’s selection depends on the preknowledge of high-resolution gravity and gradient structures. The residual terrain modelling (RTM) technique is generally applied to recover the short-scale gravity field signals. However, due to limitations in the quality and resolution of density models, RTM terrain generally assumes a constant density. This assumption can introduce significant errors in areas with substantial density anomalies and of reggued terrain, such as volcano areas. In this study, we promote a method to determine a high-resolution gravity field by integrating long-wavelength signals generated by EGM2008 with short-wavelength signals from terrain relief and shallow density anomalies. These short wavelength signals are recovered using the RTM technique with both constant density and density anomalies obtained through the equivalent source layer (ESL) method, utilizing sparse terrestrial gravity measurements. Compared to the recovery rate of using the classical RTM method, the recovery rate increases to after involving density anomalies. With this method, we investigate the gravity field signals over the Wudalianchi Volcano Field (WVF) both on the Earth’s surface and at a flight height of 100 m above the terrain. The contribution of each part and their attenuation characters are studied. In particular, the 5 km × 5 km area surrounding Bijiashan (BJS) and Wohushan (WHS) volcanos shows a strong gravity signature, making it a good candidate for the test site location. This study gives the location of the airborne gravity gradiometer test site which is an essential step in the instruments’ development. Furthermore, the method presented in this study offers a foundational framework for future data processing within the test site.
1. Introduction
Gravity gradients are the second-order derivatives of gravity potential in various directions. They are capable of reflecting the variation of the Earth’s mass distributions and its generated gravity field more finely and comprehensively than gravity anomalies, therefore they are widely applied in resource exploration, submarine navigation, geological survey, and ultra-detailed gravity field determination [1,2,3].
Over the past decades, the development of gravity gradiometry has achieved hypergrowth in gradiometers, deployment scenarios, and the number of conducted gravity gradient surveys [4,5,6]. Torsion balance, developed in the 18th Century, is the first instrument to measure all gradient tensor elements. It is sensitive to the angle between forces on the two masses at either end of a horizontal beam. However, it generally takes a long time to measure a single point [7]. Since the 1960s, the moving-base (vehicles, ships, and airplanes) gradiometry systems have received a significant amount of attention for their great efficiency. The world’s first gravity gradiometer was developed by Lockheed Martin (former Bell Space) in the USA in the 1970s for use on submarines for defense purposes [1,8]. It was de-classified and applied to exploration in 1997. The two members of the Lockheed family of gradiometers including Lockheed Martin Air Full Tensor Gradiometer (FTG) by Bell Geospace [8] and FALCON Airborne Gravity Gradiometer (AGG) developed by the collaboration of BHP Billiton from Australia [9]. The Falcon system measures the components and depending on a gravity gradiometer instrument mounted in an inertial platform at a noise level of E [10], while the Air-FTG system measures the acceleration of gravity in all directions of the field depending on three gravity gradiometer instruments at a noise level of 4–6 E [11]. Each gravity gradiometer instrument consists of four accelerometers on a rotating disk. Gravity Field and Ocean Circulation Explorer (GOCE), conducted by ESA in 2009, aimed to measure the gradient tensors relying on an electrostatic suspended gravity gradiometer [12]. Many other projects relying on alternative technologies have come into sight, e.g., the Superconducting Gradiometer developed by U.Maryland and by ARKEX company [13], MEMS gravity gradiometer by University of Twente [14], cold-atomic interferometer gravity gradiometer by Stanford University [15], quantum gravity gradiometer by Yale University, Università Degli Studi di Firenze, Observatoire de Paris and Office National d’Etudes et de Researches Aerospatiales (ONERA) [16,17,18,19,20,21]. Additionally, there are projects underway in China for the development of a rotating accelerometer gravity gradiometer and atom interferometry gravity gradiometer, which are expected to be used in aircraft for efficient gravity field detection over mountain and coastal areas [22,23,24,25]. Both of these gradiometers could achieve a Hz sampling rate. It corresponds to a spatial wavelength of 220 m assuming the nominal fix-wing survey ground speed of 55 m/s and a spatial wavelength of 72 m with a helicopter velocity of 18 m/s.
The calibration and validation of the accuracy are essential steps in determining the credibility of various gravity gradiometers based on different principles. One key phase of testing is to build a test site, where dense and accurate terrestrial gravity measurements are collected [1,26]. The capabilities of the gravity gradiometer, including its precision, noise levels, and the impact of mass distributions on signal strength at various flying altitudes, are then examined. This examination is achieved through a comparison of the gradiometer measured signals with signals derived from terrestrial gravity measurements [1,27]. The most famous R.J. Smith airborne gravity and gradiometry test site, located 115 km from Perth’s Jandakot Airport in Western Australia, was established in 2009 [28]. This publicly accessible test site offers accurate and dense terrestrial gravity observations, serving as a benchmark for evaluating new and existing airborne gravity gradiometry (AGG) technology. Additionally, the Alexandria test area, located near Ottawa, Canada, was constructed in 2000 as part of the Airborne Gravity for Exploration and Mapping (AGEM) project, with the objective of calibrating various airborne gravimeters using terrestrial gravity measurements [29]. The Nevada test site played a crucial role in the Long-Range Program of geologic and geophysical investigations by the U.S. Geological Survey and is available for calibration of different airborne gravimeters [30]. Similar calibration tests have been implemented by comparing gravity surveys from various airborne gravity systems, such as Sander’s AIRGrav system, with terrestrial gravity surveys. Examples include the Tietê Airborne Gravity Test Site over the Turner Valley area near Calgary, Alberta, Canada, and the Timmins region in Ontario, Canada [31,32,33].
With the advancement in gravity gradiometry technologies in China, there is an increasing demand to establish a gravity gradiometer test area for the evaluation of both the capability and precision of gravity gradiometers currently in use and those under development. In selecting an appropriate test site, we consider several key criteria outlined in previous studies [1,31].
- The site should exhibit pronounced high-frequency and shallow gravity field features.
- It should be with moderate terrain.
- The site should be minimally impacted by human activities.
- There should be no restrictions on flight altitudes.
Additionally, considering that the various geodetic observations will be taken in the near future over the test site, one promising candidate is the Wudalianchi Volcano Geopark, which holds potential for applications in both geodesy and geophysics. Therefore, conducting a preliminary study of the topography, gravity field, and gradient features in the Wudalianchi area and determining the precise location for the test site, potentially in a 5 km × 5 km area akin to the Kauring test site, becomes of significant importance.
The gravity field is the composite contribution of the Earth’s mass distribution and the Earth’s rotation. Over the past decades, a variety of gravity measurement techniques have been developed enabling the understanding of the gravity field. These methods, including the least-square collocation [34,35,36], the radial base function [37,38,39] and least-squares modifications of Stokes [40], have proven effective in regional gravity field determination through combining the global gravity field model (GGM), gravity measurements and digital elevation models (DEM). Specifically, gravity gradients can be computed by combining terrestrial gravity measurements and GGMs, which have been achieved using various methods, such as least-square collocation [41,42,43], radial base function method [44], extended Stokes and Hotine formula [45], in spherical harmonics [46], and least squares spectral combination technique [47]. However, the gravity field solutions are limited by the spatial distribution of terrestrial gravity measurements. Additionally, the method of extending the existing GGMs through the residual terrain modelling (RTM) technique is widely applied in the gravity field synthesis for areas requiring precise knowledge of the Earth’s gravity field [48,49,50,51,52,53]. In this method, the high-frequency gravity field is generated by the residual masses between the Earth’s topography and a smooth reference topography. Limited by the knowledge of precise near-surface density distributions, density of the Earth’s topography is generally assumed to be a constant value of 2670 kg/m. This would involve great errors over complex geological areas [52]. Although in the Earth’s interior, the actual density distribution varies in three dimension, an equivalent layer density model derived from ground gravity anomalies [54,55] would be adapted in RTM process. In this study, we promote to calculate regional gravity field signals, including gravity anomalies and gradient tensors, through combing the long-wavelength gravity field generated by GGM, high-frequency gravity field signals derived from RTM with a constant density assumption of 2670 kg/m and residual signals from density anomalies. With this method, the detailed gravity and gradient features on the ground and at flight height over the Wudalianchi Volcano Field are evaluated. Based on these results, the precise location for the test area is recommended. Need to mention that, the promoted method in this study is validated through comparison with gravity measurements, which have affirmed its effectiveness in gravity determination over the Wudalianchi Volcano Field. When it comes to the determination of gradients, only the performance of Equivalent Source Layer (ESL) is validated through a numerical simulation test due to the unavailability of actual gradient measurements. Considering the fundamental theory of gravity field determination and the confirmed performance of ESL, this validates the method’s capability in determining the gravity field over study area and its validity in determining the test site.
This work is organized as follows. In Section 2.1, we introduce the fundamental concepts of the RTM technique Section 2.1 and equivalent source layer method (ESL) Section 2.2. Section 3 presents the study area, available datasets, data processing procedures, and numerical results related to gravity and gradient features over the Wudalianchi Volcano Field (WVF). In Section 4, we recommend the precise location for the test site, and discuss the contribution of GGM, the RTM with constant density and with density anomalies. Finally, the main conclusions are given in Section 5.
2. Methodology
In this section, we introduce the methods used in this study. This includes the main principles of the RTM technique for gravity field determination with RTM topographic masses, and the ESL method for density anomaly inversion.
2.1. The Principle of RTM Technique
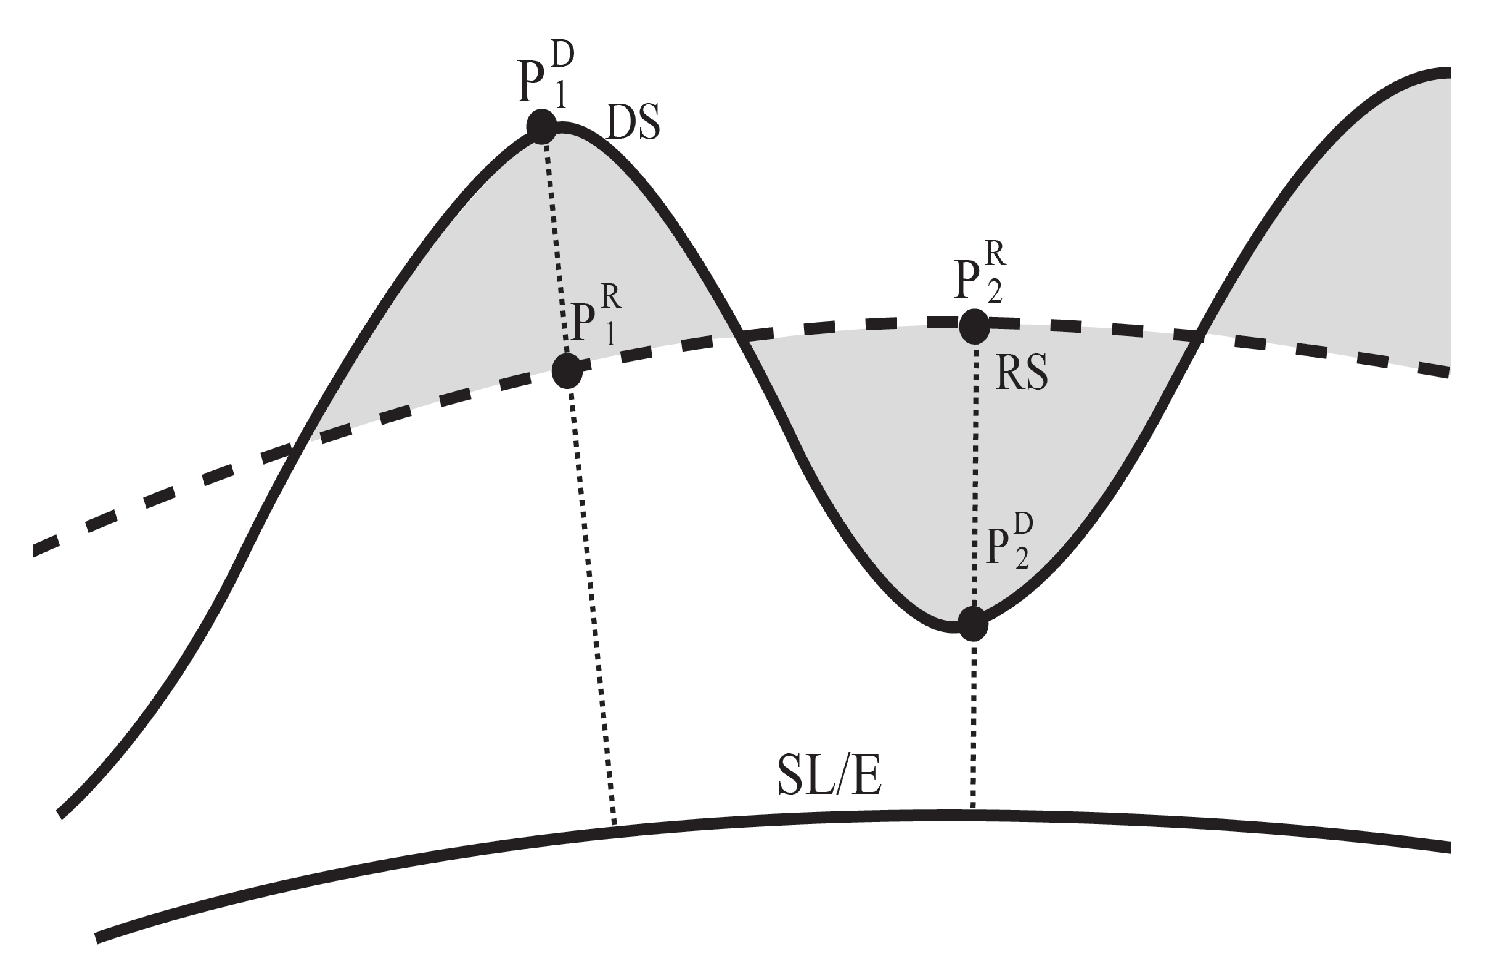
The primary objective of the RTM technique, as introduced by [35,48], is to calculate the high-frequency gravity field at scales beyond what GGMs can provide. The basic principle of RTM involves the filtering in geometry through subtracting a smooth reference surface from a detailed digital elevation model (DEM) H (Figure 1). Subsequently, the high-frequency portion of topographic masses between the Earth’s surface and the reference surface is obtained. In this study, the reference surface is expanded to degree 2159, which corresponds to the maximum degree of the global gravity field model EGM2008. With the assumption of equivalence between filtering in the geometric domain and in the physical domain, this expansion ensures that the long-wavelength gravity field signals generated by the reference topography, which are already included in EGM2008, are effectively removed within the RTM technique. Then, the high-frequency signals beyond the degree of 2159 in gravitational potential can be obtained using Newton’s integral [56].
where V indicates the gravitational potential at the computation point, variable G is the gravitational constant, is mass density, and l is the Euclidean distance between the computation point P and the running integration element Q. Due to the oscillating nature of the residual heights, the RTM gravitational effects generated by masses beyond a certain radius tend to fluctuate around 0. Consequently, these effects can be largely cancelled out. This cancellation leads to a significant improvement in computational efficiency.

Figure 1.
The basic principle of RTM technique (followed [57]). DS, RS and SL/E indicate the detailed DEM, reference surface and sea level/elliposid where DS and RS were referred to, respectively. , are computation points on the detailed DEM, while , are their respect points on the reference surface.
As shown in Figure 1, there are special cases, like computation point , locating below the reference surface. This means that the computation points are in the RTM masses, and the directly computed gravity field with Newton’s integration does not represent the Earth’s external gravity field. This is the non-harmonicity problem in the RTM technique and harmonic correction (HC) is required for such cases [48]. and in Equations (1) and (2) indicate the HC terms for the RTM gravitational potential and for the RTM gravity anomaly, respectively. Various studies have been implemented to derive the HC expressions for RTM [48,56,57,58,59]. The following gives the expressions of HC based on the classical condensation method [48,57]:
The gravity gradient components are generally defined in the local north-oriented coordinate system. In the local north-oriented coordinate system, the origin is the computation point P, and indicate the coordinates in the north, west and radial directions, respectively. The components of gradient tensor follow
and the components and can be obtained from by cyclic permutation, while and are obtained from by cyclic permutation. Here, the indicate the horizontal limits of integration masses, and the coordinates of integration elements in the local north-oriented coordinate system.
The solution to the above integrals can be obtained in the space domain by dividing the residual terrain masses into a series of elements. Each element is then approximated by a regular geometry, such as a prism, for which analytical or numerical solutions can be applied [60]:
The second derivatives are
here , , and . Similarly, the solutions of the components and can be obtained from , and and from by cyclic permutation.
2.2. Description of Equivalent Source Layer (ESL) Setting
As is discussed above, near-surface density variations also contribute to high-frequency gravity field signals, and it is essential to account for them. In this study, we assume a finite ESL consisting of uniformly sized prism grids, which represent compact mass anomalies in the shallow crust. These grids are aligned with DEM units, and their equivalent densities can be utilized in the RTM process. Regardless of the distribution of terrestrial gravity data, densities can be obtained through linear regularization given the defined ESL range and size [55,61].
According to such techniques, observed gravity data and unknown density vector can be formulated as a linear observation equation [61]:
where is the design matrix. And the model objective function [55] is
where is the observation weighting matrix, is the model correlation matrix, and is the regularization parameter. denotes the standard variation of error at each observation point. incorporates mathematical self-constraints aimed at enhancing solution accuracy, such as smoothness, roughness constraints, and depth weighting as discussed in [61]. For the single-layer inversion in this study, we omit the implementation of these constraints and instead, we adjust the results solely by . Under the condition of minimizing the objective function, the final density solution is expressed as [55]
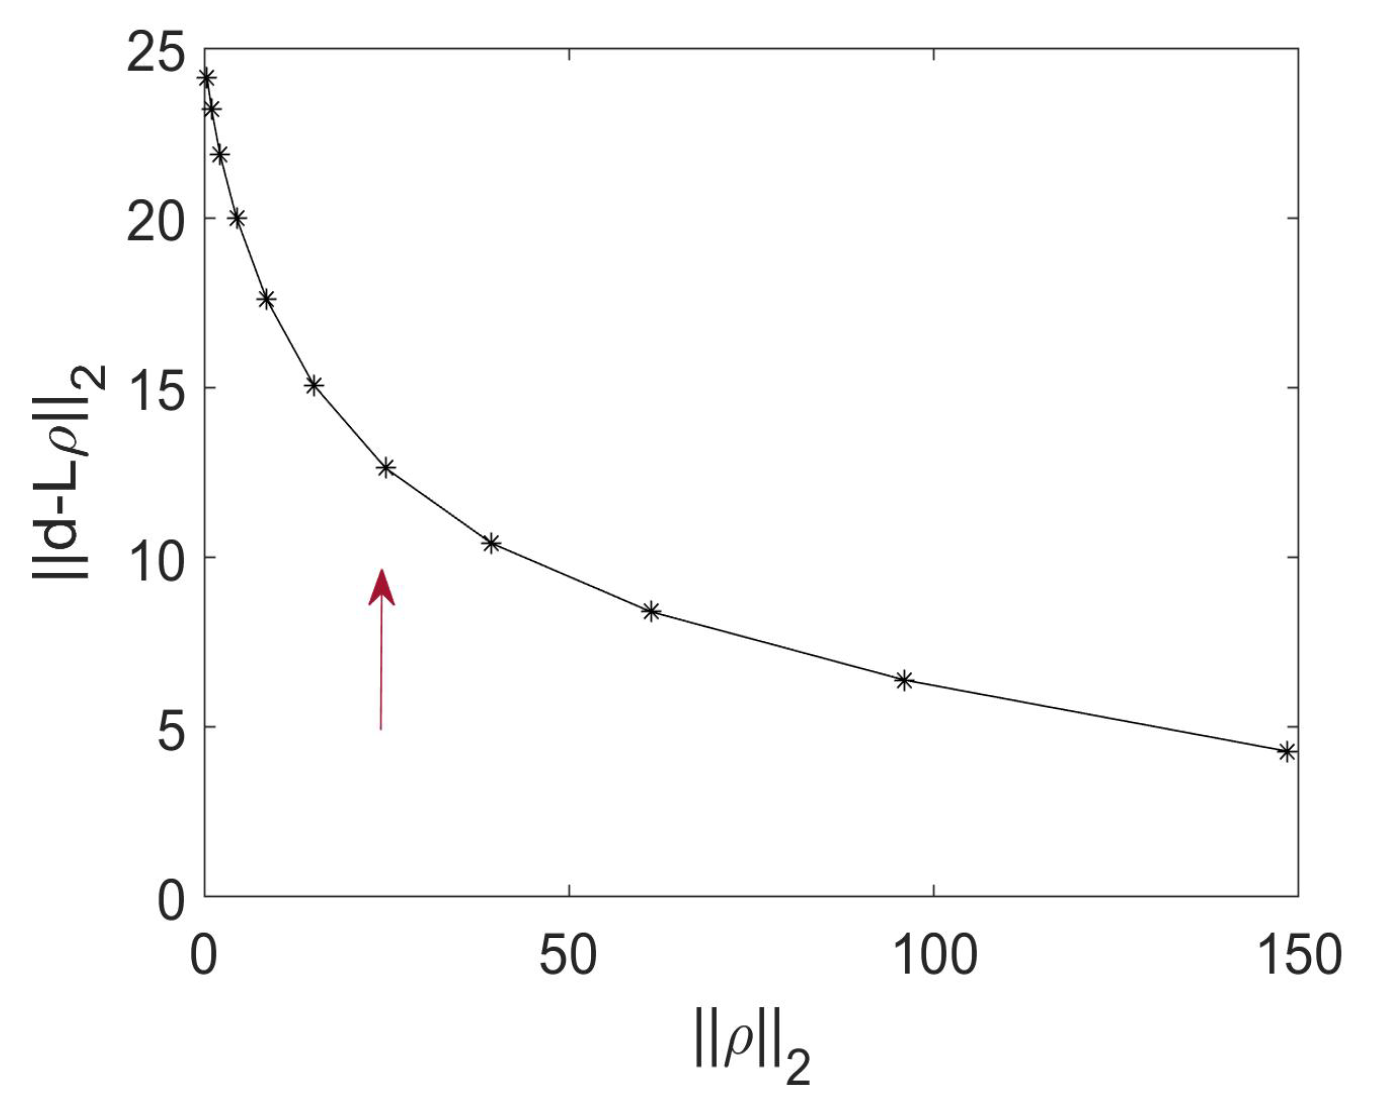
where is the identity matrix. The regularization parameter is determined by the L-curve method. This method was initially introduced by [62] and later advocated by [63] for addressing the linear inverse problem. This method leverages the characteristic behaviour of the Tikhonov curve, which involves a series of inversions to construct the complete Tikhonov curve. It identifies the point on the curve that corresponds to the maximum curvature. In this study, we determine the suitable regularization parameter by analysing the trade-off features between the regularized solution norm from the provided data as the regularization parameter varies, and is adopted following Figure 2 (pointed by red arrow).

Figure 2.
The L-curve between the regularized solution norm from the provided data with changing of the regularization parameter varies.
In a spectral perspective, GGM contains low-frequency gravity field signals of Earth’s interior and terrain relief, while RTM contains high-frequency terrain relief information. Without high-resolution terrestrial gravity data, the high-frequency shallow mass anisotropic distribution contribution could be lost. Thus, following the GGM+RTM approach in local gravity field recovery [49], it is necessary to add another term considering the laterally varying density of the topographic layer, which would be proved to have better performance in numerical studies (see in Section 3.2). In this study, residual gravity anomalies are firstly obtained through removing contributions from GGM and RTM with constant density (2670 kg/m) from terrestrial gravity data. These residual anomalies are then utilized in subsequent ESL stages to derive density anomalies with Equations (9)–(11).
3. Numerical Study
In this section, we will begin by providing an overview of the geographical and geological characteristics of the study area. Additionally, we will outline the methodology utilized for gravity field modelling. Following that, we will present the results of a closed-loop test conducted for external validation, which plays a crucial role in establishing the credibility of the method. Subsequently, we will delve into the calculation and examination of the gravity field, encompassing both gravity anomaly and gradient tensors, over the Wudalianchi Volcano Field (WVF). This analysis will provide valuable insights into determining the location of the airborne gravity gradiometer test site.
3.1. The Wudalianchi Volcano Field
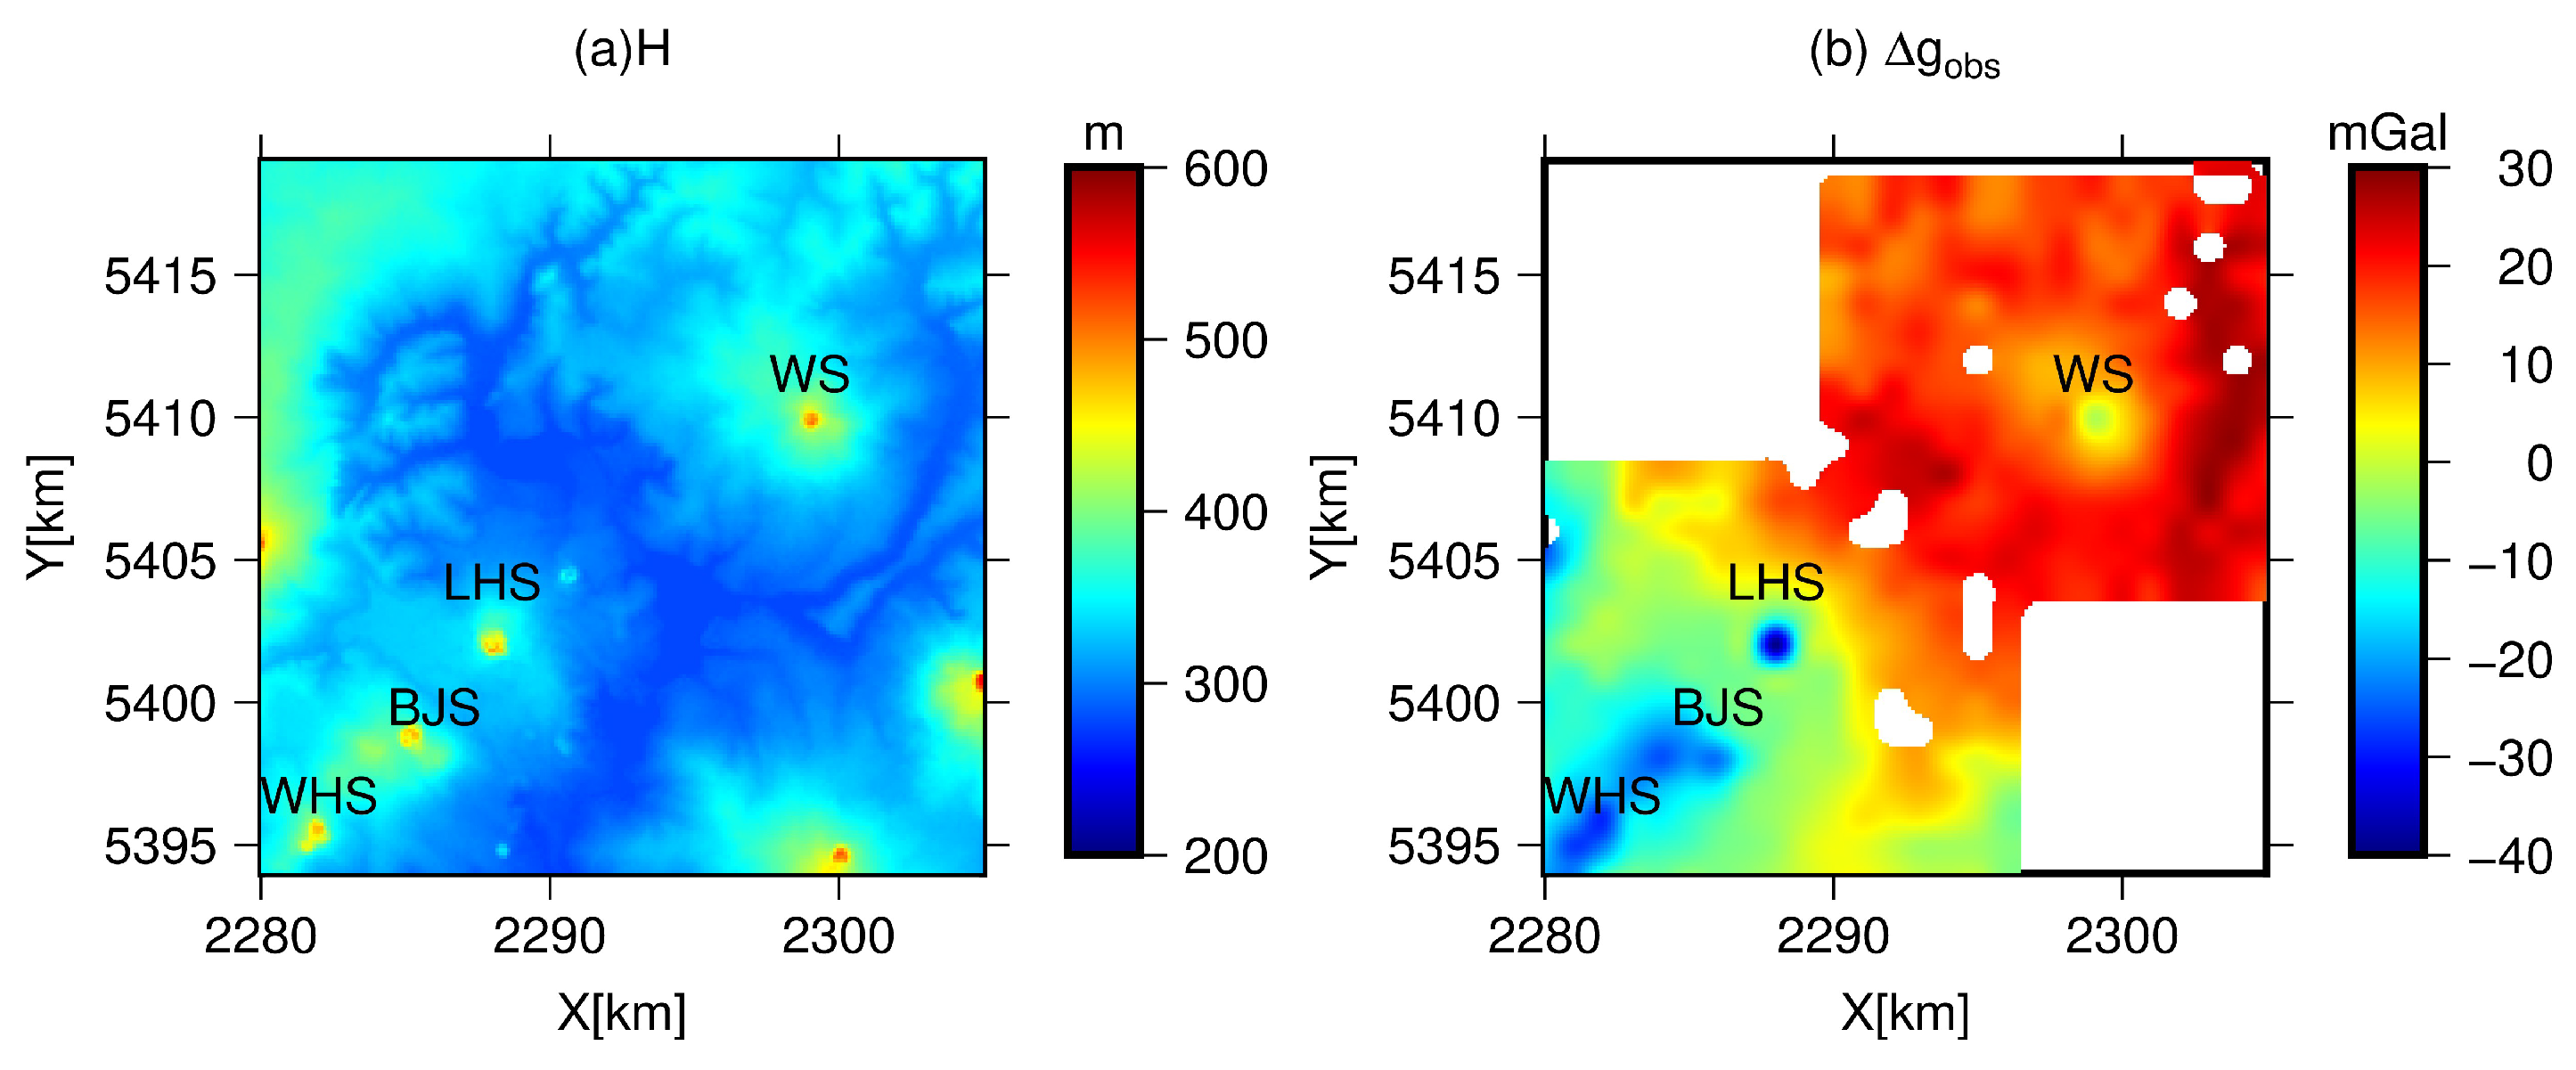
The WVF, a typical intraplate volcano, is located at the northern margin of Songliao Basin in northeast China. Given that the most recent eruption in the WVF occurred approximately 300 years ago, it is believed that the magmatic system in the area is in a state of partial melting. Therefore, numerous studies have been conducted to investigate the geological and geophysical characteristics of the region, as well as its temporal variations. Figure 3a shows the altitudes over a 25 km × 25 km area around volcanic cones, Laoheishan (LHS), Weishan (WS), Bijiashan (BJS) and Wohushan (WHS). The coordinates are defined in the Gauss–Kruger Projection coordinate system. The area shows a moderate terrain with height varying from ∼240 m to ∼580 m, with an average height of ∼ m. The rugged terrain is mainly concentrated around the volcanic cones. These rugged areas, coupled with the complex geological features near the volcanoes, are known to generate significant gravity variations. These are essential for calibrating airborne gravity gradiometers. The gravity features were originally presented in Figure 3 of [64], and have been reproduced in Figure 3b. It is important to mention that the gravity anomalies in [64] and in Figure 3b are not defined as general gravity anomalies in geodesy because absolute gravity values are not provided, instead, they are relative gravity measurements. This implies that a consistent bias would exist between measured and actual gravity anomalies.

Figure 3.
DEMs and gravity anomaly over WVF area. Panel (a) gives the topographic information over WVF and panel (b) the gravity disturbance over study area (followed [64]). Here, The abbreviations, WHS, BJS, LHS, WS, indicate Wohushan, Bijiashan, Laoheishan and Weishan, respectively.
Figure 3b illustrates that the gravity anomalies in the area range from ∼ mGal to ∼ mGal, with significant gravity changes observed around volcanic cones such as WHS, BJS, LHS, and WS. Compared to the northeast part of the area, the southwestern (SW) region bounded by , , and exhibits more pronounced gravity variations. This suggests that the southwest area is likely to produce more significant gradient signals compared to the northeastern area. Consequently, this study focuses on exploring the detailed structures of gravity and gradients in the southwest area. It is worth noting that there are 213 terrestrial gravity measurements available with an accuracy of mGal. These measurements are distributed over the west–south area at intervals of approximately 1000 m (Figure 4). It means that there is less than one gravity measurement over each volcanic cone. Consequently, it is challenging to conduct a detailed analysis of gravity and gradient features at both the Earth’s surface and at various flight altitudes using these datasets.

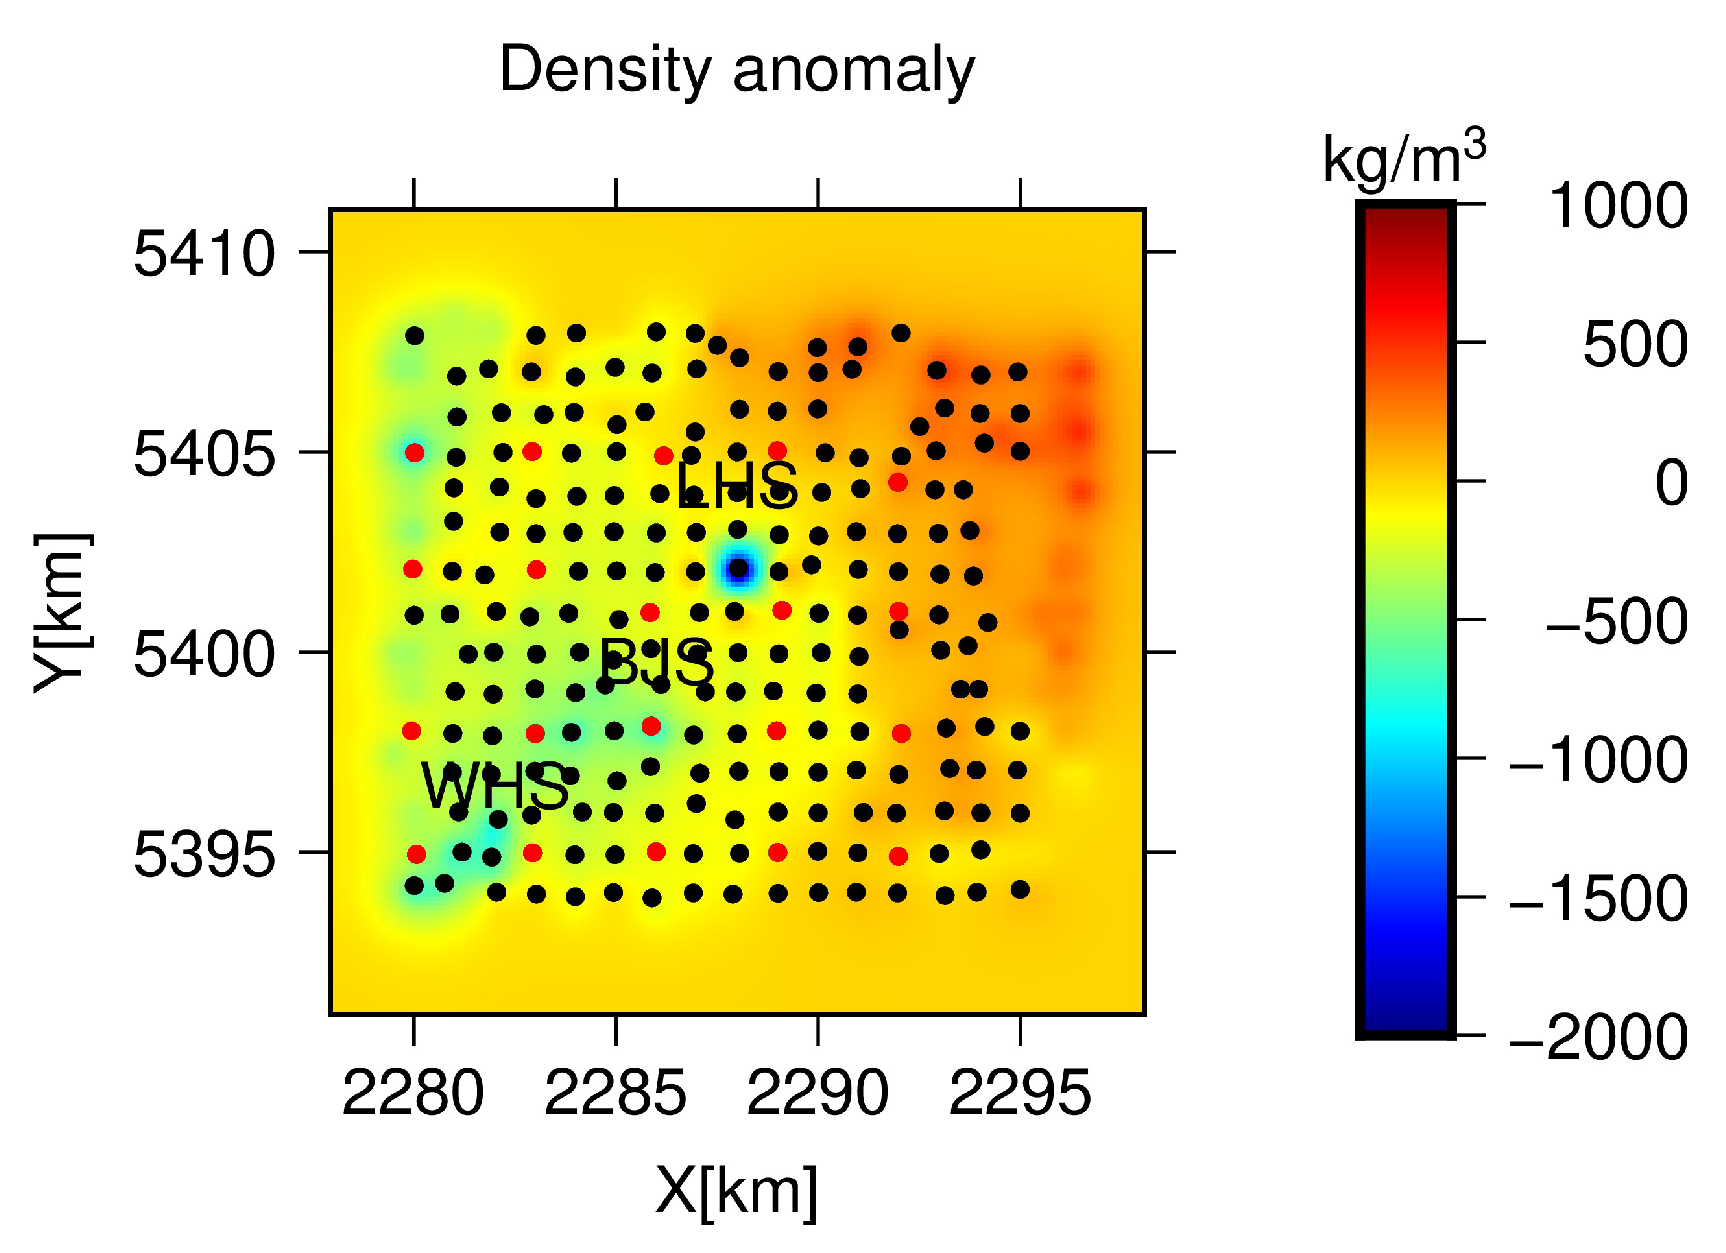
Figure 4.
Density anomaly derived from gravity inversion. The black dots indicate the points with gravity measurements for inversion and red dots with gravity measurements for validation.
3.2. The Calculation Method of Gravity Filed Features over WVF
To study the detailed features of the gravity field over WVF areas, the gravity and gradient signals are divided into three parts, the long-wavelength signals provided by GGM (), the high-frequency signals generated by residual terrain with constant density assumption of 2670 kg/m (), and the residual gravity field signals provided by subsurface density anomaly (), as
In the following computations, long-wavelength signals generated by GGM are computed with Graflab software with Equations (56) and (65)–(71) in [65] for gravity anomaly and gradients, respectively. In this study, the performance of EGM2008 and EIGEN-6C4 expanding to a degree and order of 2159 are validated through comparison with terrestrial gravity measurements. The differences between EGM2008 and terrestrial measurements have a mean value of mGal, a standard deviation (STD) of mGal and a root-mean-square (RMS) value of mGal with respect to the mean value of mGal, STD value of mGal and RMS value of mGal for the differences between EIGEN-6C4 and terrestrial measurements. This indicates that the EGM2008 provides a more accurate representation of the long-wavelength gravity field in this area compared to EIGEN-6C4. Therefore, EGM2008 expanding to the degree and order of 2159 is used to calculate the long-wavelength signals of gravity gradients.
The publicly available Multi-Error-Removed Improved-Terrain (MERIT) DEM [66] at resolution is used to represent the detailed Earth’s surface. This DEM is a result of combining the Shuttle Radar Topography Mission (SRTM) V2.1 DEM within in a latitude with the AW3D DEM model above N. It offers several advantages over other SRTM DEMs, as it effectively handles voids, outliers, radar errors, and tree canopy signals. The smoothed model MERIT2160 DEM was created by [56]. It was obtained based on the spherical harmonic analysis of MERIT DEM, the resulting spherical harmonic coefficients were truncated to a degree and order of 2159, and then was transformed into MERIT2160 DEM with spherical harmonic synthesis. The residual masses between MERIT2160 and MERIT DEM are assumed to have a constant density of 2670 kg/m, and the resulting gravitatioanl field is modelled using Equations (1)–(5).
In the calculation of , density anomalies are firstly obtained using terrestrial gravity measurements provided in [64], employing the ESL method. In this process, the residual gravity anomalies obtained after substracting from terrestrial measurements represent the gravity signals attributed to density anomaly. With shallow ESL assumption, the pre-determined parameters of ESL, like horizontal range, layer thickness, and buried depth, could influence the equivalent density results and RTM effects. The ESL should cover a larger area than the ground gravity data to cope with the boundary effects. Here, the output density anomalies cover 1 km larger areas in this study. The choice of depth interval and regularization parameter could have an effect on inversion results. We define a 1 km thick ESL between km depth by trial and test, and determine by the L-curve method.
In the following numerical experiments, the 213 gravity measurements are divided into two sets: one set consists of 193 gravity measurements used for density inversion (black dots in Figure 4), while the other set contains 20 gravity measurements for the validation of the gravity field modelling method (red dots in Figure 4). Specifically, the 193 gravity measurements are taken over areas bounded by the ranges km and km for the X and Y coordinates, respectively, while the density anomalies cover an area of km and km. As depicted in Figure 4, the values of density anomaly range from ∼ kg/m to ∼498 kg/m. As is discussed in Section 2.2, the results presented in Figure 4 represent the equivalent surface density distribution over this area. To validate the credibility of this equivalent surface density in gravity field modelling, a comparison is made between measured residual gravity anomalies and estimated residual gravity anomalies using the equivalent surface density at the 193 stations. The differences in these values range from ∼ mGal to ∼ mGal, with an RMS value of ∼ mGal. This internal validation provides insights into the quality of the gravity field estimated from derived equivalent surface densities. In addition, a similar validation test was conducted in [67], where gravity and gradient tensors generated by five known mass distributions were calculated analytically, serving as observations for inversion and reference values for validation. The simulated gravity and gradients were computed with densities inversed using the equivalent source method. The comparison between the simulated values and reference values revealed that the RMS value of differences between observed and simulated gravity is mGal, which is ∼ of the mean value of gravity. Similarly, the RMS value of the differences between observed and simulated gradient was E, which is ∼ of mean value of gradient. Both these experiments indicate the credibility of the performance of ELS in gravity field modelling.
Furthermore, for external validation, terrestrial gravity measurements over 20 validation points are collected that were not used in the density inversion. The distribution of these validation points is shown in Figure 4. In the validation experiment, comparisons are implemented between observed gravity signals and recovered gravity signals from three scenarios: (1) using only GGM, (2) using GGM and RTM under a constant density assumption, and (3) using GGM, RTM under a constant density assumption, and RTM with density anomalies. Smaller residuals indicate better performance. Table 1 provides statistical information of the residual gravity signals. It is obvious that using only GGM can recover about of the gravity signals, and using GGM and RTM with a constant density assumption can recover of signals. After including density anomaly signals, the recovery rate significantly improves to . The RMS of residual signals is ∼ mGal. These results demonstrate that the method presented in this study is capable of recovering the gravity field with mGal-level accuracy over this area.

Table 1.
The statistical information of residual gravity signals over validation points.
3.3. The Gravity Field Signals over the Southwestern Area
To study the gravity field features over the SW region, gravity field signals, i.e., gravity anomalies and gradient tensors, are computed separately for the Earth’s surface and at a flight height using the method described earlier. As indicated in studies on airborne gravimetry, e.g., [68], to maximize signal strength and data density, airborne gravity gradiometry should be conducted at low altitudes and slow speeds. During survey missions, aircraft typically fly at altitudes between 80 and 100 m. In this study, the flight height with a normal terrain clearance of 100 m is adopted to study gravity field signals under extreme conditions.
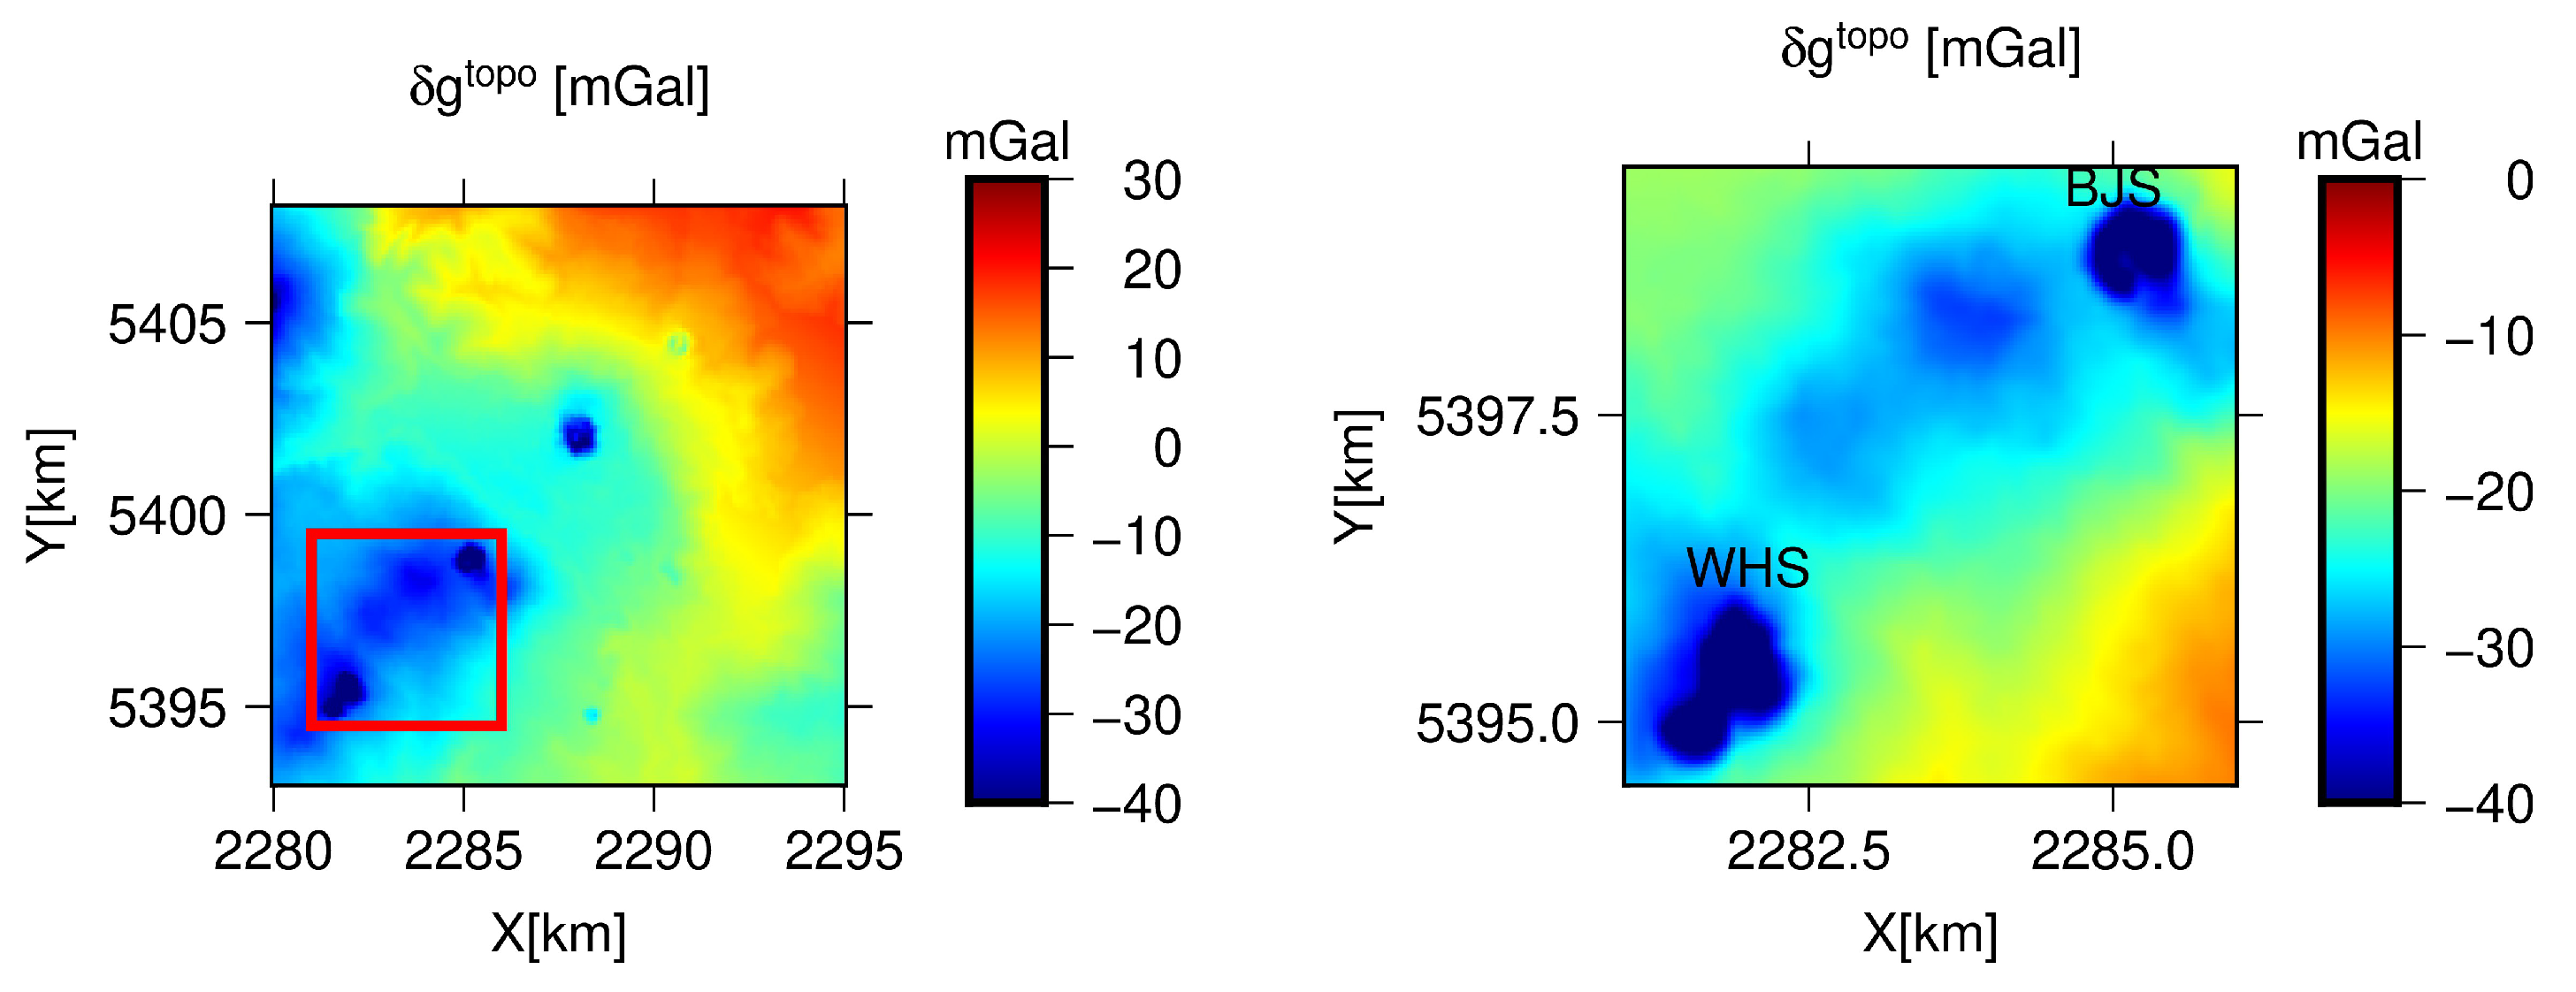
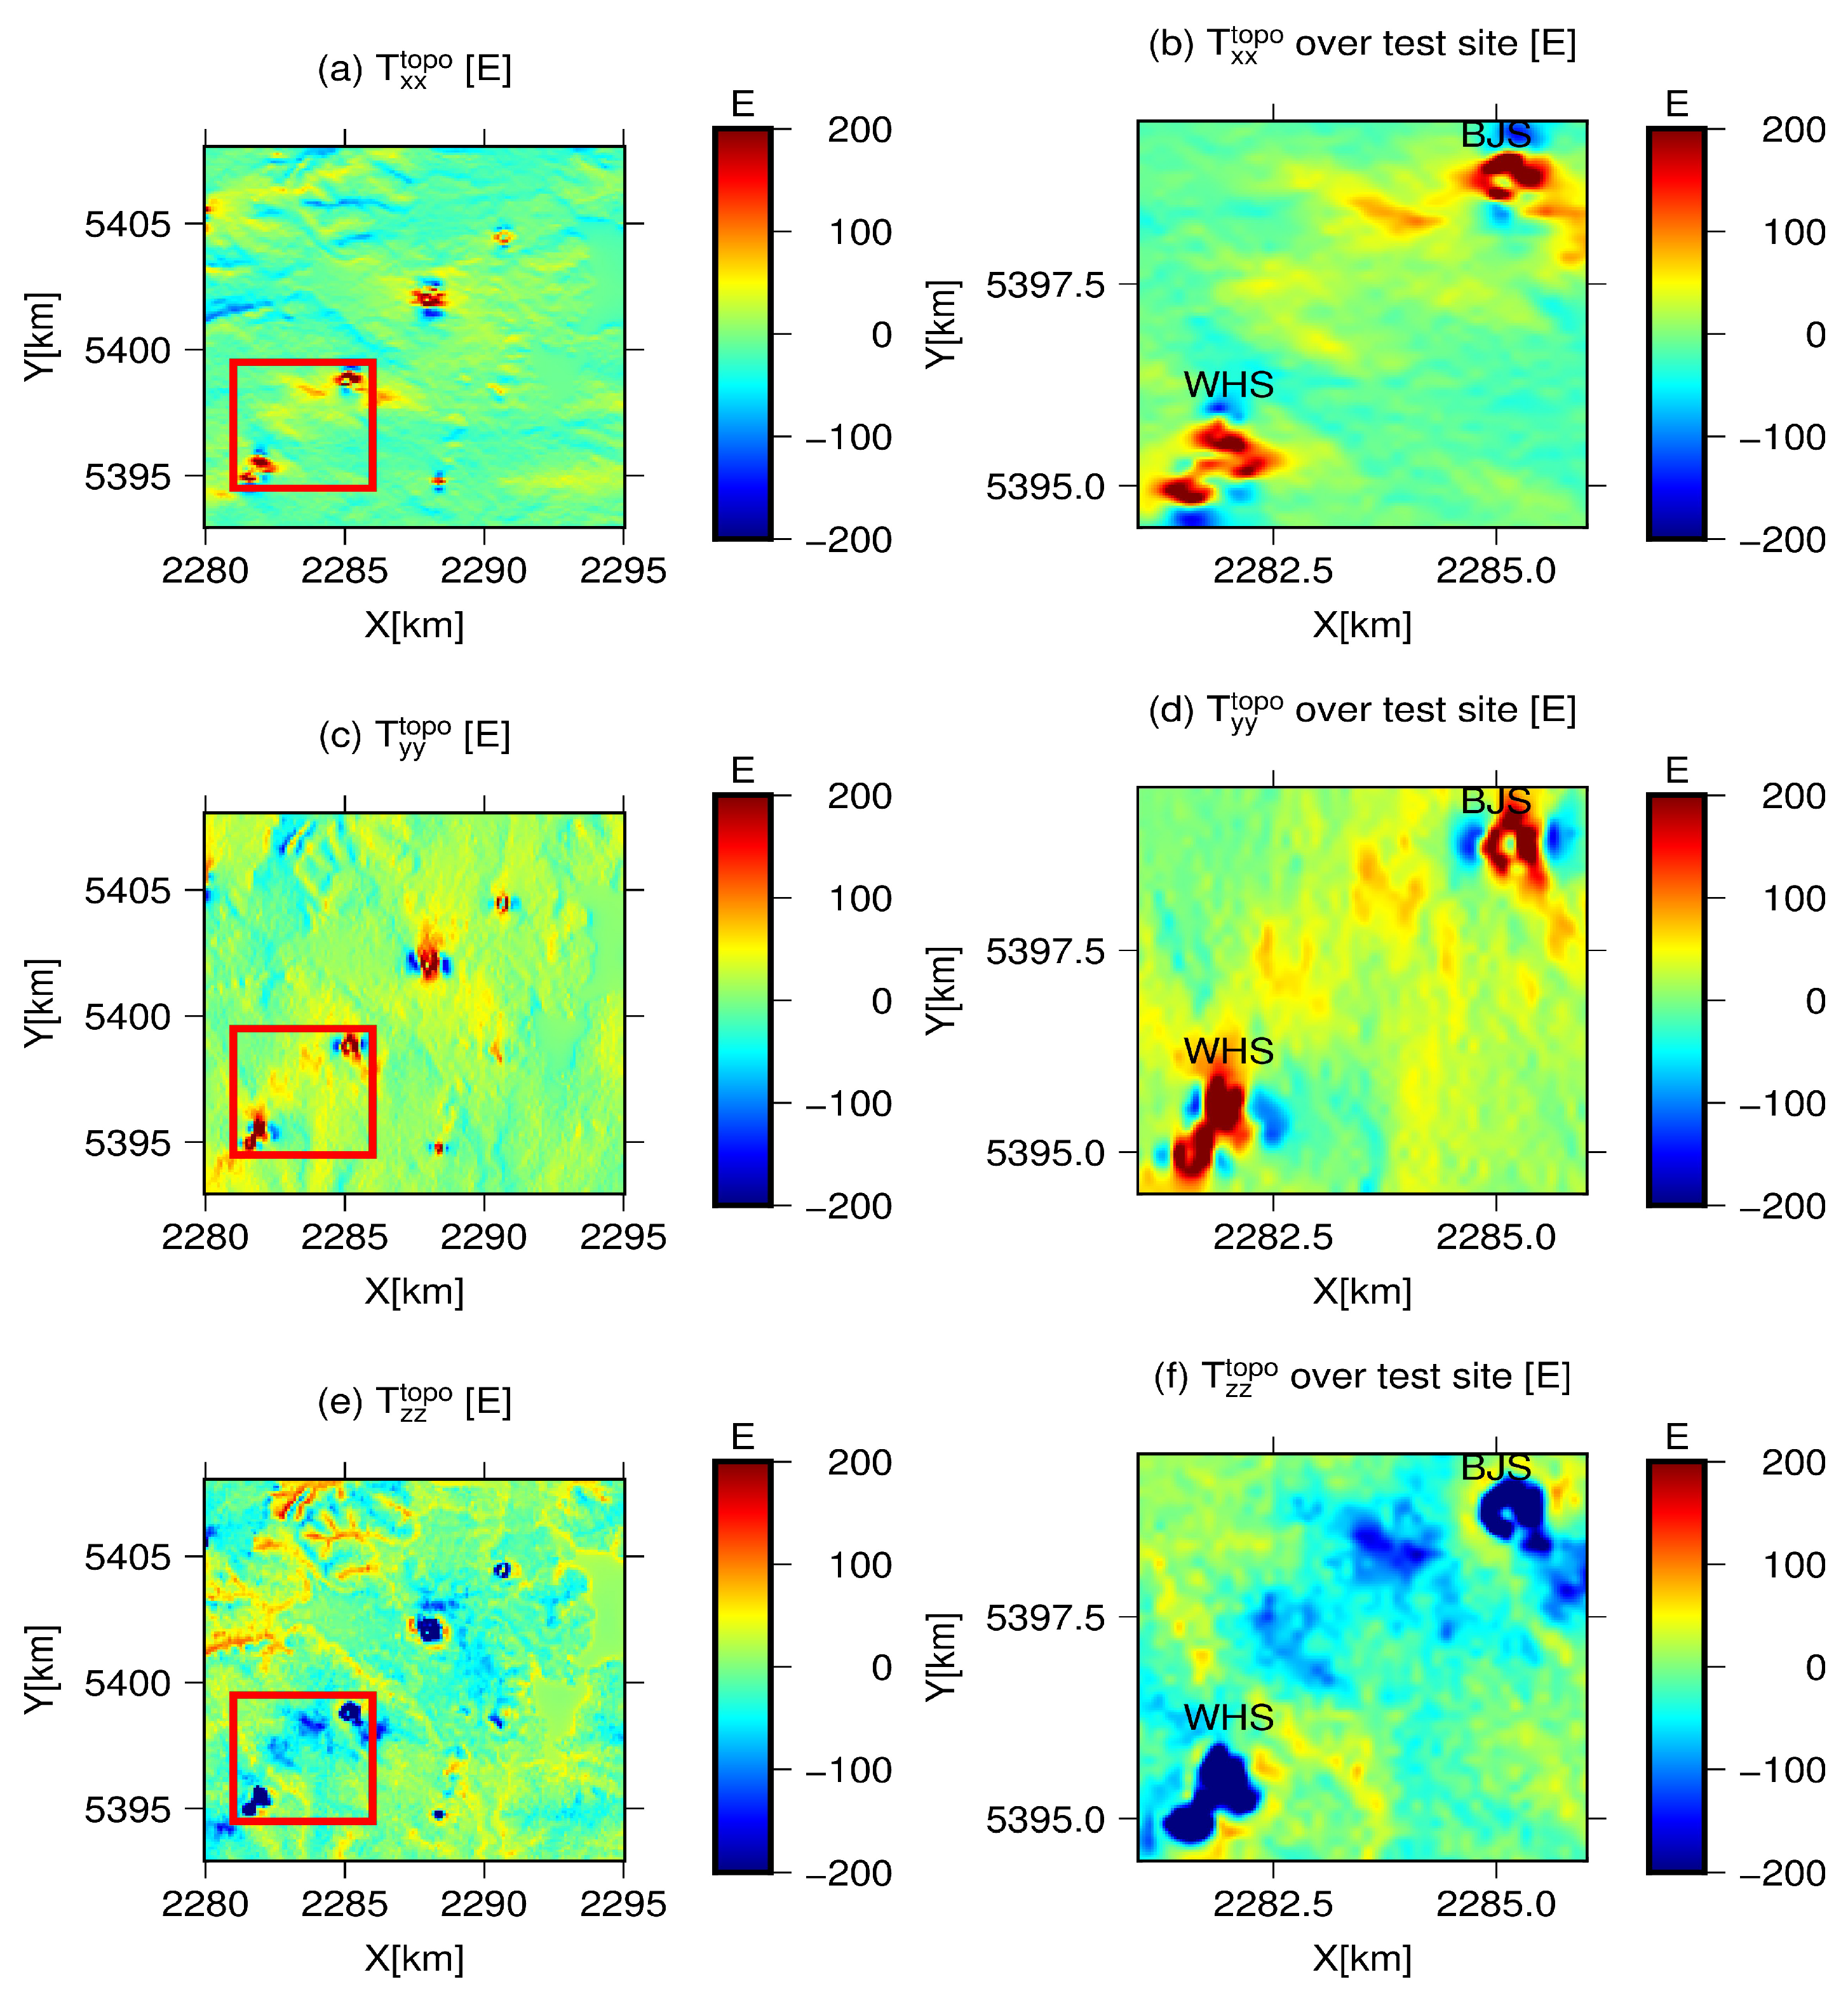
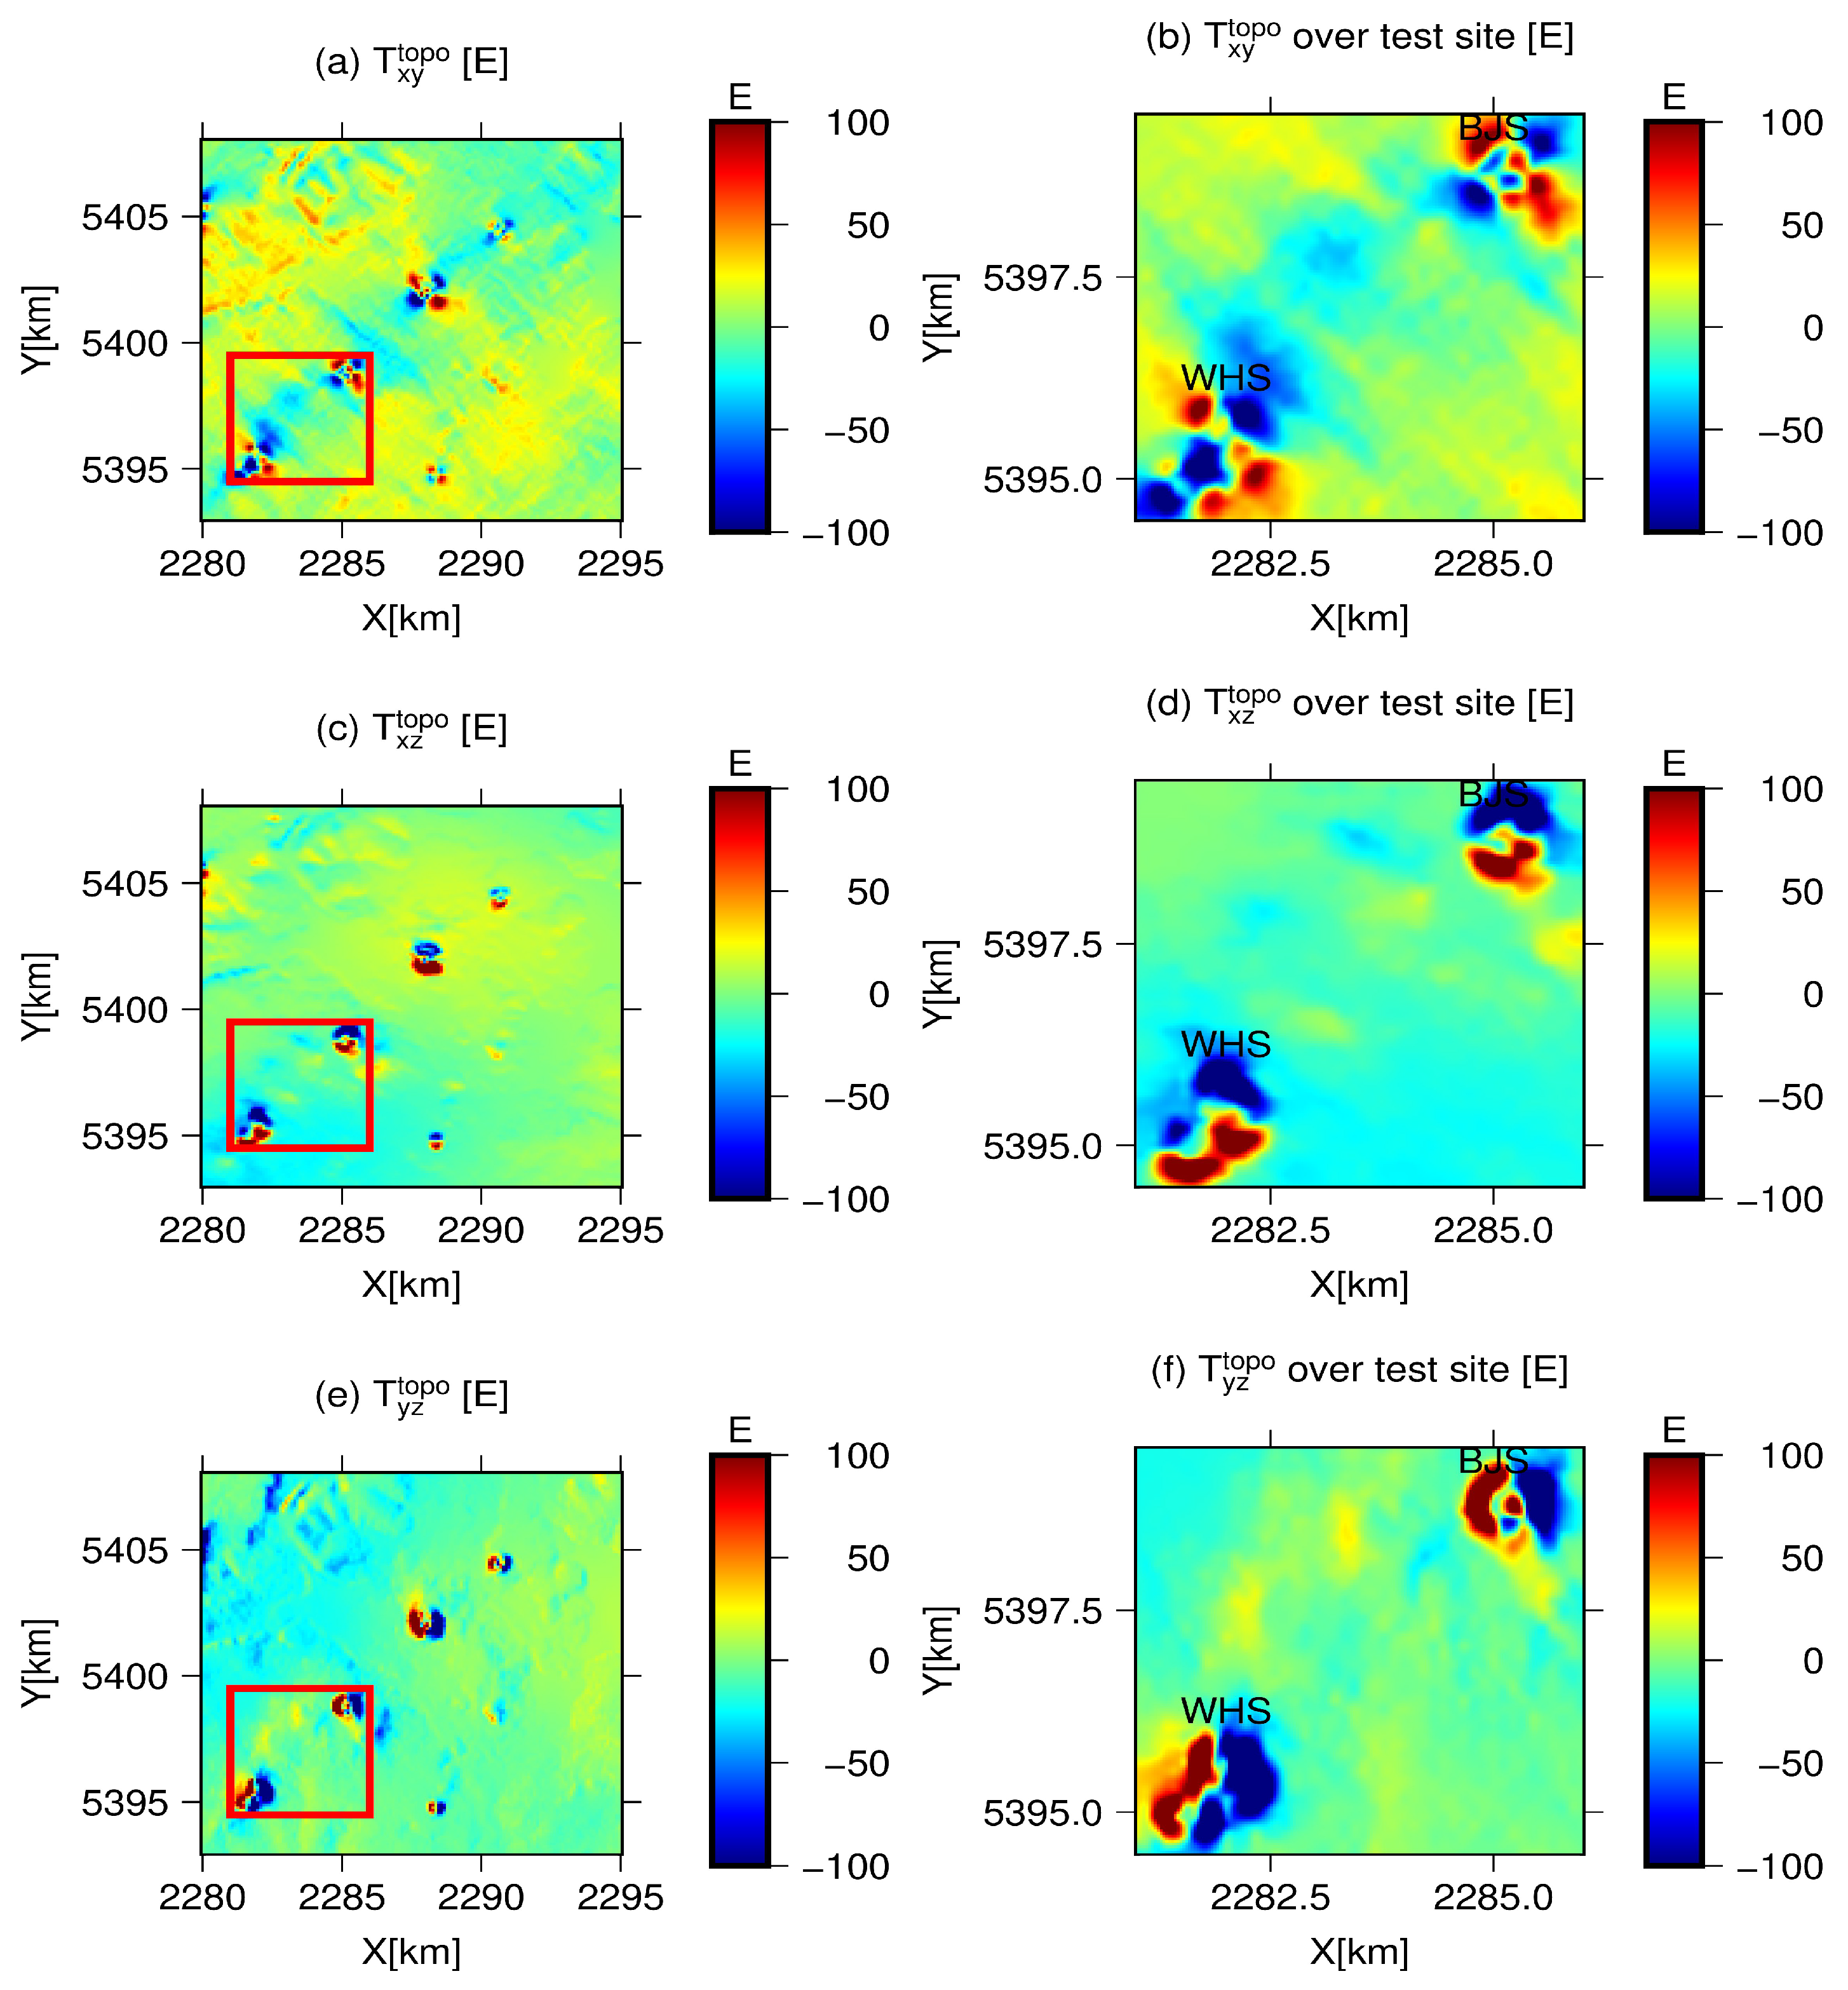
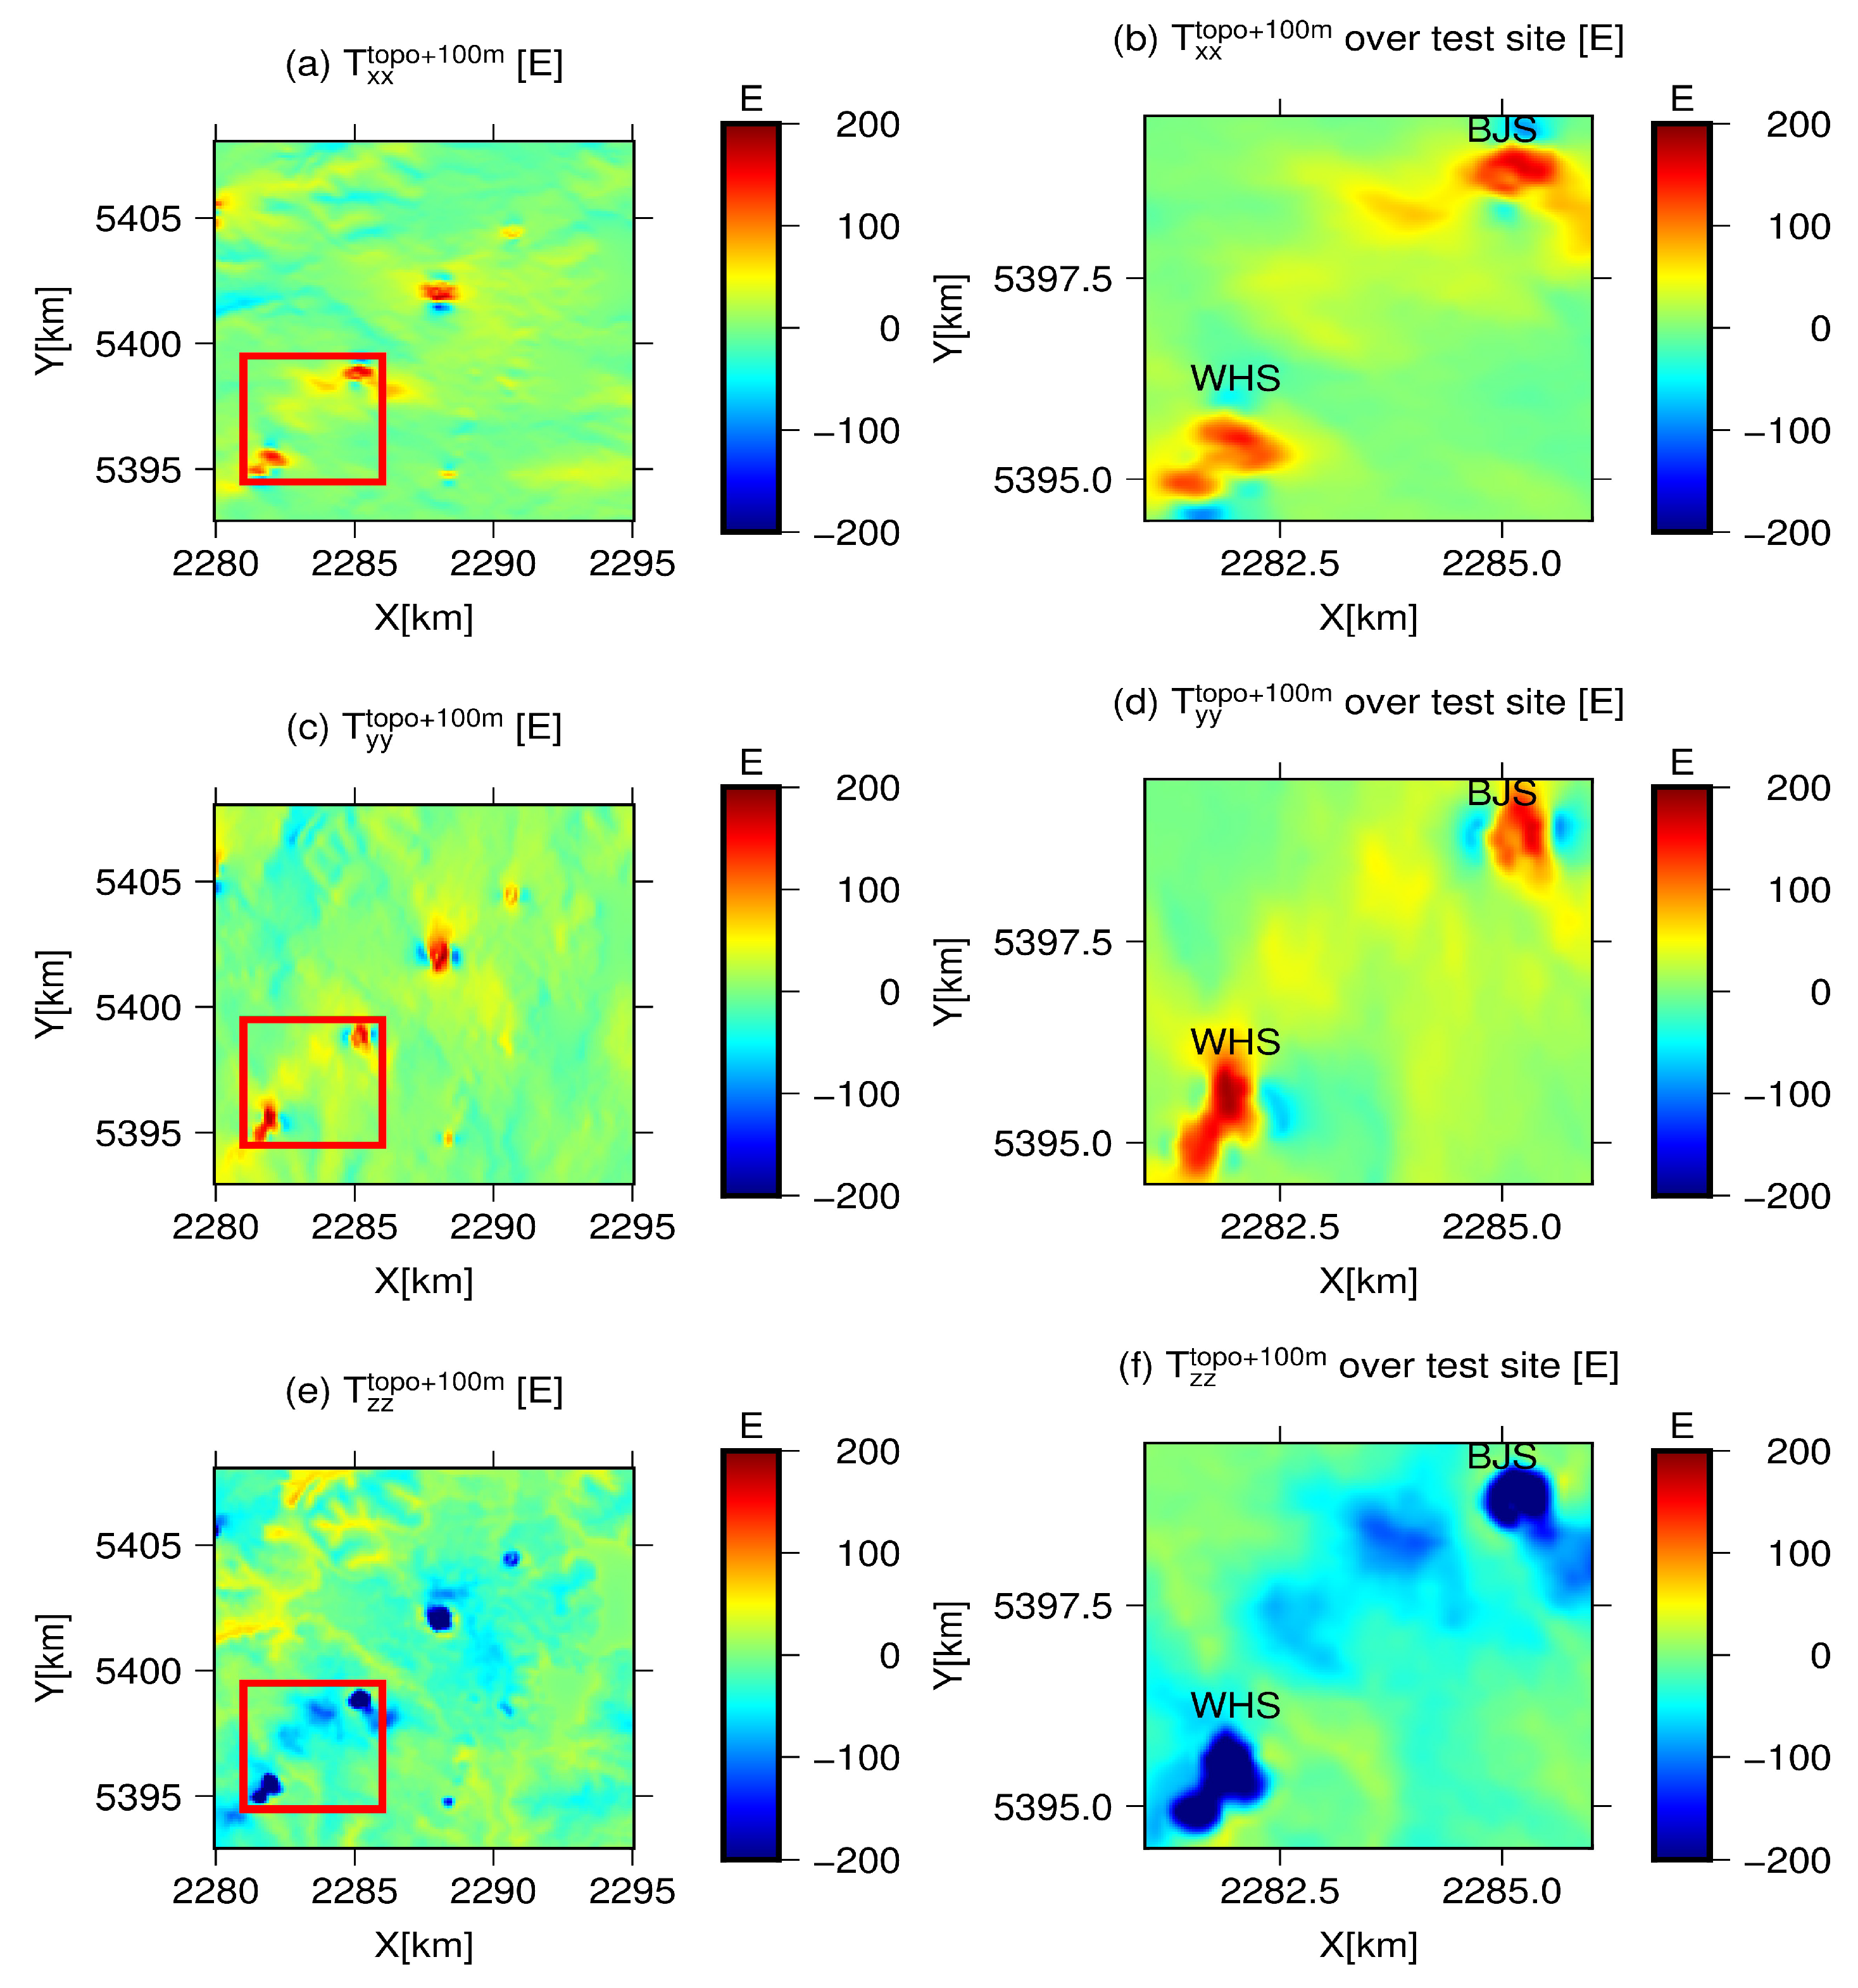
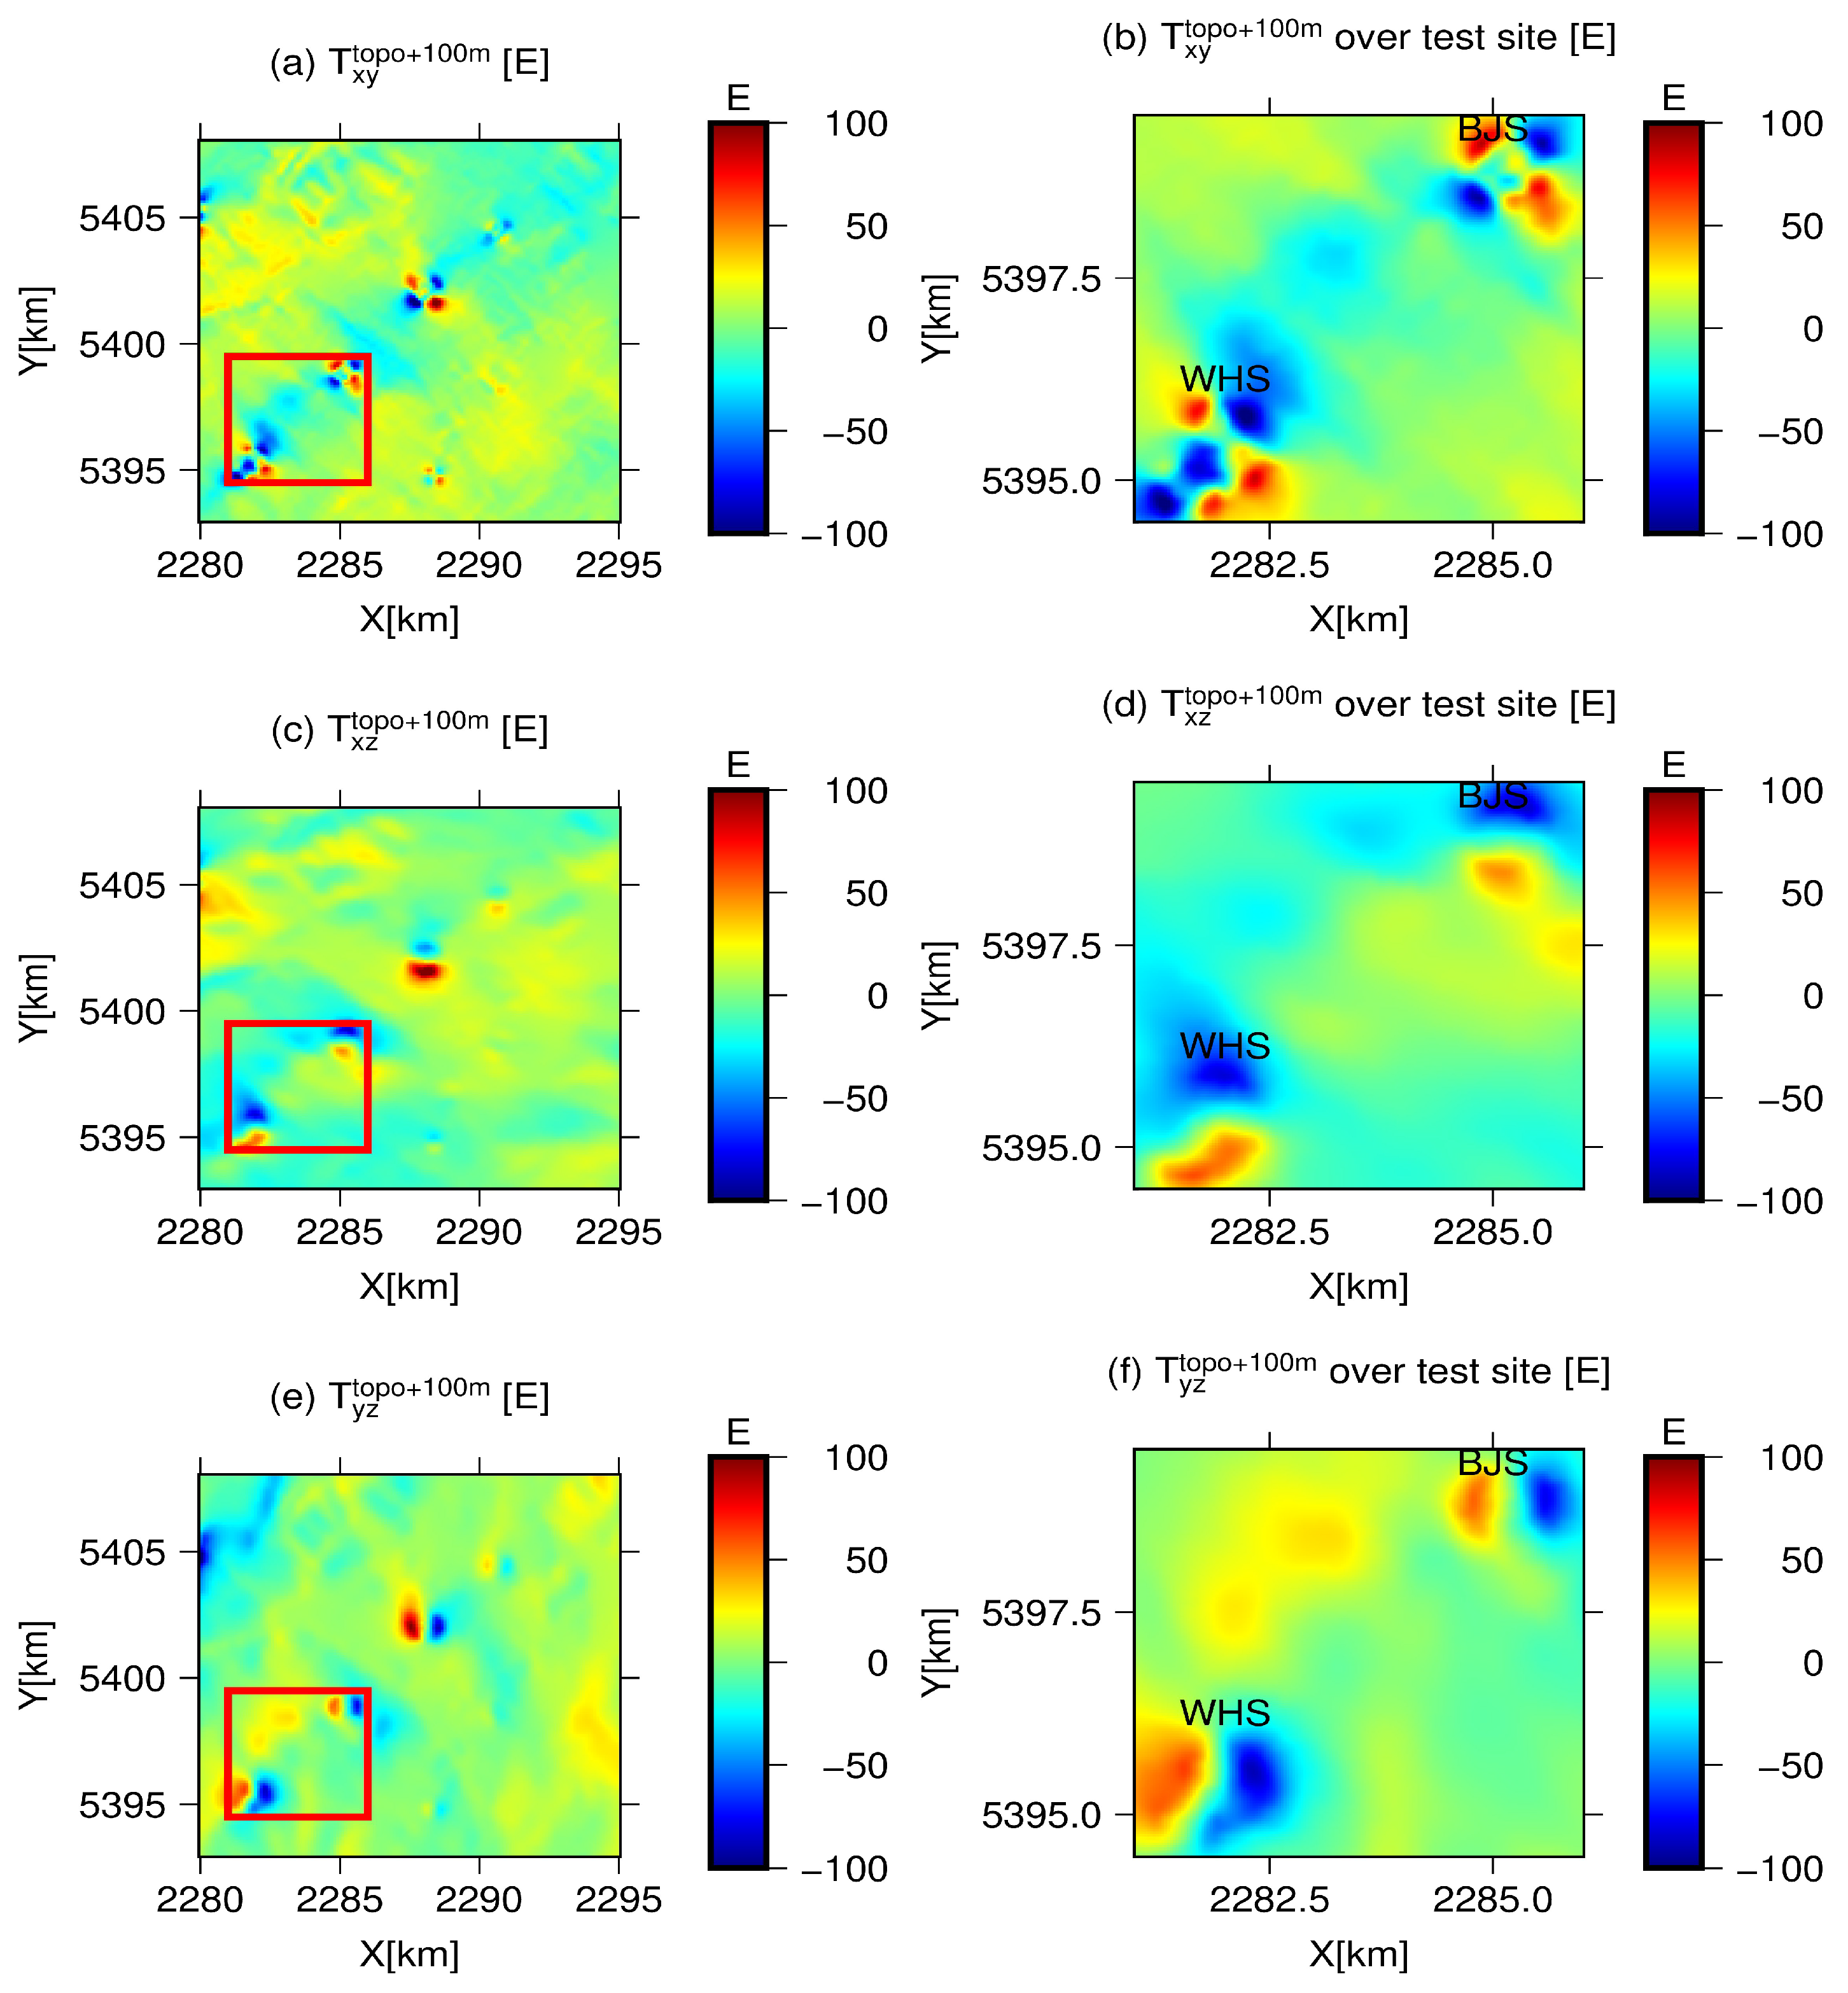
The gravity field features on the Earth’s surface in the southwest area are depicted in the left panels of Figure 5, Figure 6, Figure 7 and Figure 8. Specifically, the left panel of Figure 5 displays the gravity anomaly signals, while panels (a), (c) and (e) of Figure 6 and Figure 7 show the various gradient components (, , , , , ), respectively. It is obvious that the gravity anomaly signals tend to be negative in the southwest region and positive in the northeast. This is consistent with the distributions of density anomalies in Figure 4. Lower-density volcanic embryos in the southwest generate negative gravity anomalies, while positive density anomalies result in positive gravity anomalies in the northeast. Additionally, the most significant anomalies are concentrated around the volcano areas, with extreme values up to mGal (Table 2). Similarly, in terms of the gradient tensor in the panels (a), (c) and (e) of Figure 6 and Figure 7, larger values mainly occur around volcanos with values up to several hundred Eotvos. Compared to gravity anomalies, the gradients are more sensitive to the precise location of volcanic vent. Furthermore, gradient tensors show obvious subtle features even in areas distant from the volcanoes. Table 2 gives the statistical information about the gravity field on the Earth’s surface. Gravity anomalies vary from ∼ mGal to ∼ mGal, with a mean of ∼ mGal and an RMS of ∼ mGal. Meanwhile, the gradient components range from ∼ E to ∼ E for , from ∼ E to ∼ E for , ∼ E to ∼ E for , ∼ E to ∼ E for , ∼ E to ∼ E for , and ∼ E to ∼ E for components, respectively. The ranges of gradient tensors exceed 500 Etovos.

Figure 5.
The synthesised gravity anomaly signals on the Earth’s surface over WVF areas and test site. (Left): the gravity anomaly signals over WVF areas. (Right): the gravity anomaly signals over test site.

Figure 6.
The synthesised gradients , , signals on the Earth’s surface over WVF areas and test site. (Left): the gradient signals over WVF areas. (Right): the gradient signals over test site.

Figure 7.
The synthesised gradients , , signals on the Earth’s surface over WVF areas and test site. (Left): the gradient signals over WVF areas. (Right): the gradient signals over test site.

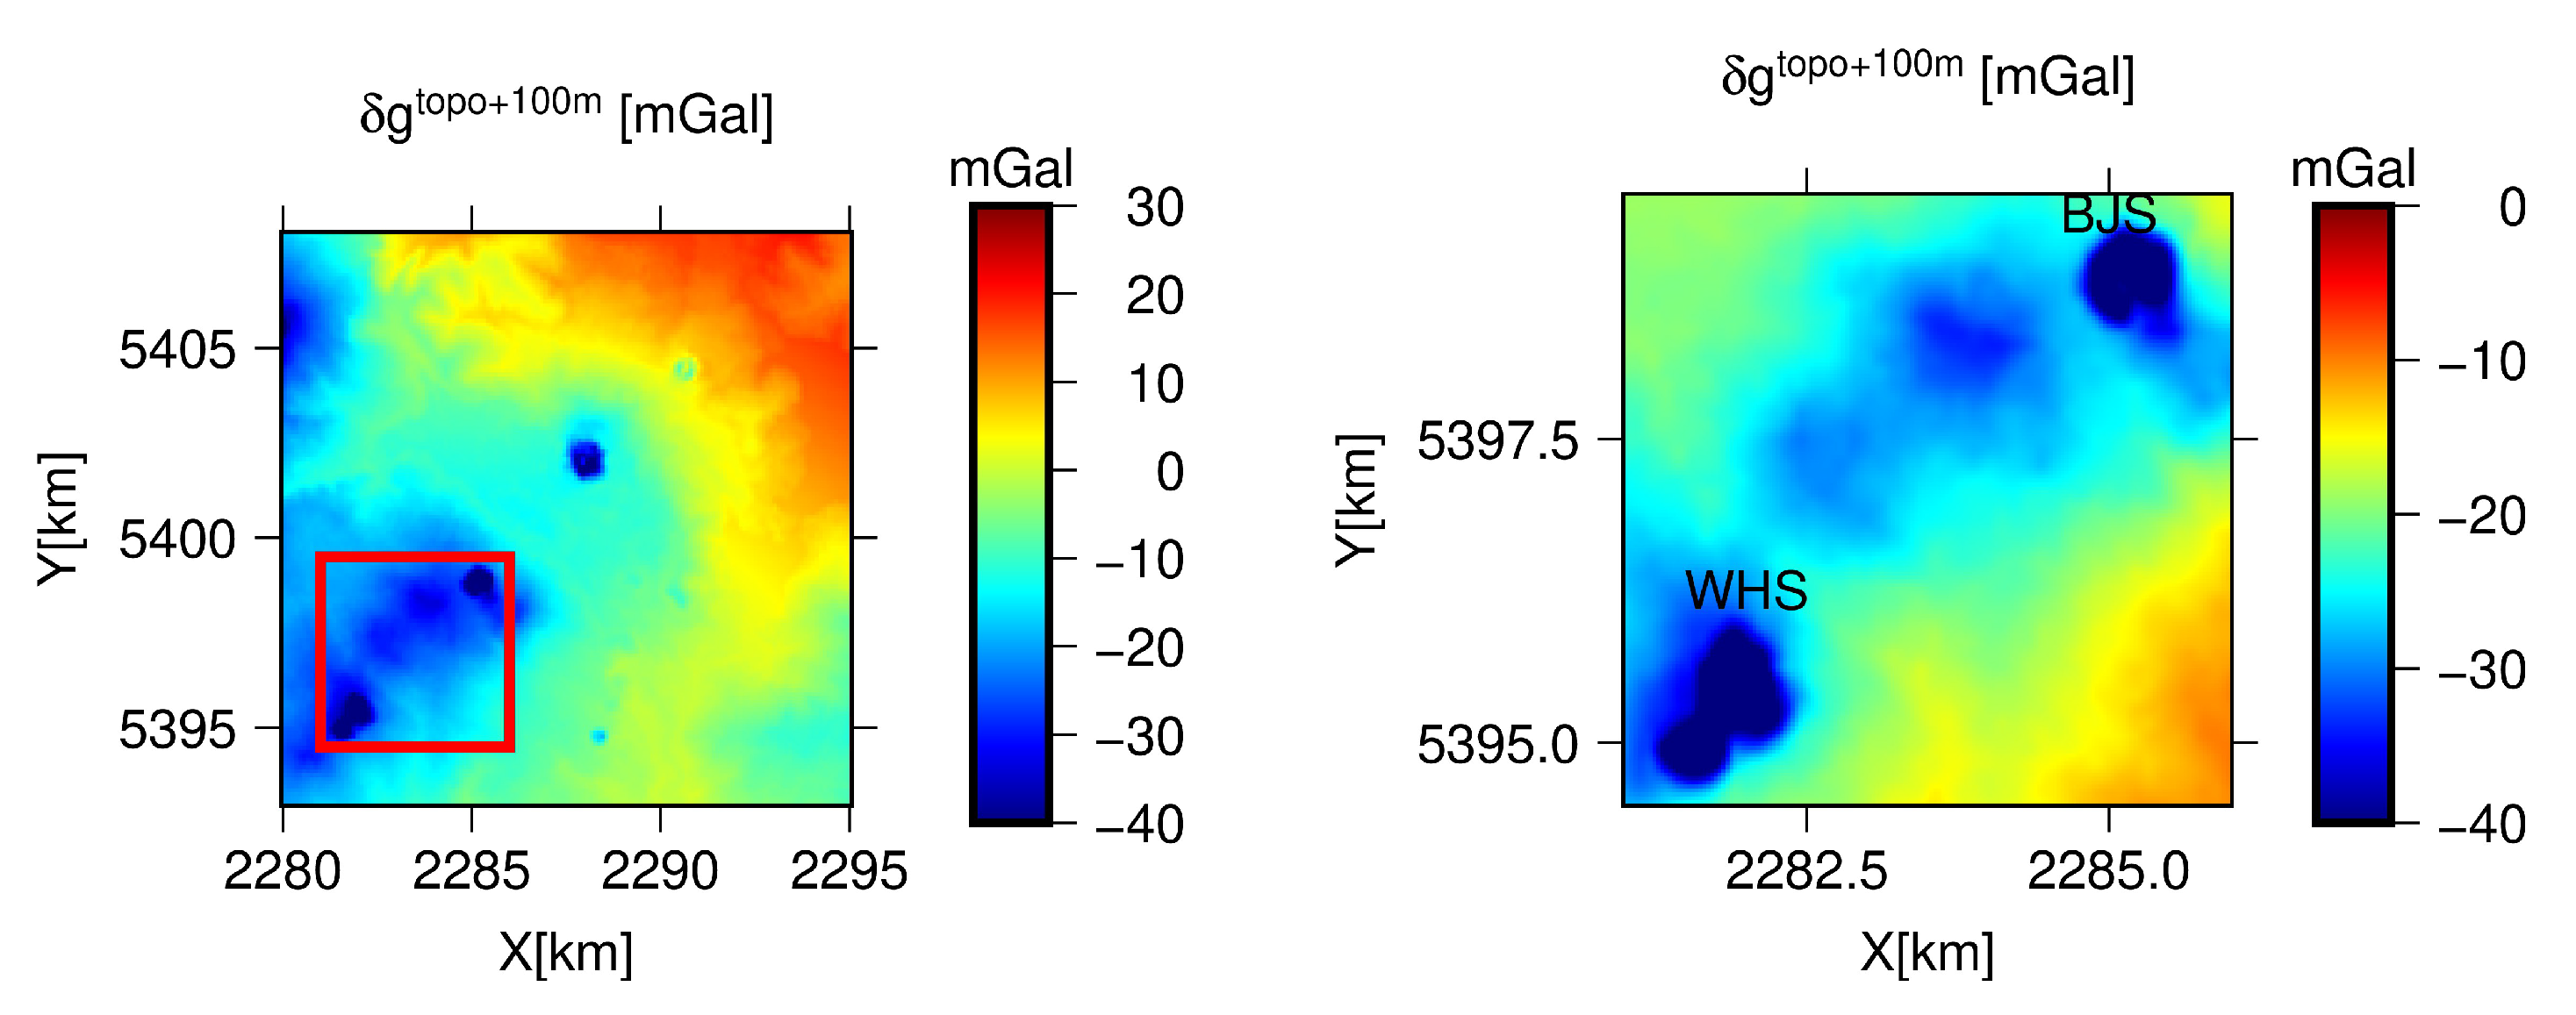
Figure 8.
The synthesised gravity anomaly characters at flight height with clearance of 100 m from the Earth’s surface over WVF areas and test site. (Left): the gravity anomaly signals over WVF areas. (Right): the gravity anomaly signals over test site.

Table 2.
The statistical information of gravitational field on the Earth’s surface.
The left panels of Figure 8, Figure 9 and Figure 10 provide the gravity field features at the flight height with a normal terrain clearance of 100 m, while Table 3 gives their descriptive statistical information. Gravity anomaly features at the flight height are very similar to those on the ground surface, with negative values in the southwest and positive values in the northeast (Figure 8 left panel). Gravity anomalies at the flight height range from ∼ mGal to ∼ mGal. With height increasing from the Earth’s surface to the flight height, the RMS values of gravity anomalies decrease from ∼ mGal to ∼ mGal. The gradient tensors attenuate much faster than the gravity anomalies. This can be seen in Figure 8, Figure 9 and Figure 10 and Table 3. The RMS values of gradient tensors are reduced to ∼ E for , ∼ for , ∼ for and ∼ for . In terms of and components, the RMS values increased to for and for while the magnitudes of maximum, minimum and mean values decrease from the ground upward to the flight height. The ranges of all six components are larger than 200 E. The large changes mainly happened around volcanos and the subtle features around them.

Figure 9.
The synthesised gradients , , signals at flight height with clearance of 100 m from the Earth’s surface over WVF areas and test site. (Left): the gradient signals over WVF areas. (Right): the gradient signals over test site.

Figure 10.
The synthesised gradients , , signals at flight height with clearance of 100 m from the Earth’s surface over WVF areas and test site. (Left): the gradient signals over WVF areas. (Right): the gradient signals over test site.

Table 3.
The statistical information of gravitational field at flight height.
4. Discussion
In this section, we will delve deeper into the numerical results obtained in this study. We will discuss the limitations of the classical RTM technique, analyse the contributions of GGM, RTM, and density anomaly to the gravity field, and provide recommendations for the location of an airborne gravity gradiometer test area.
1. The limitations of classical RTM technique over areas with large density anomaly
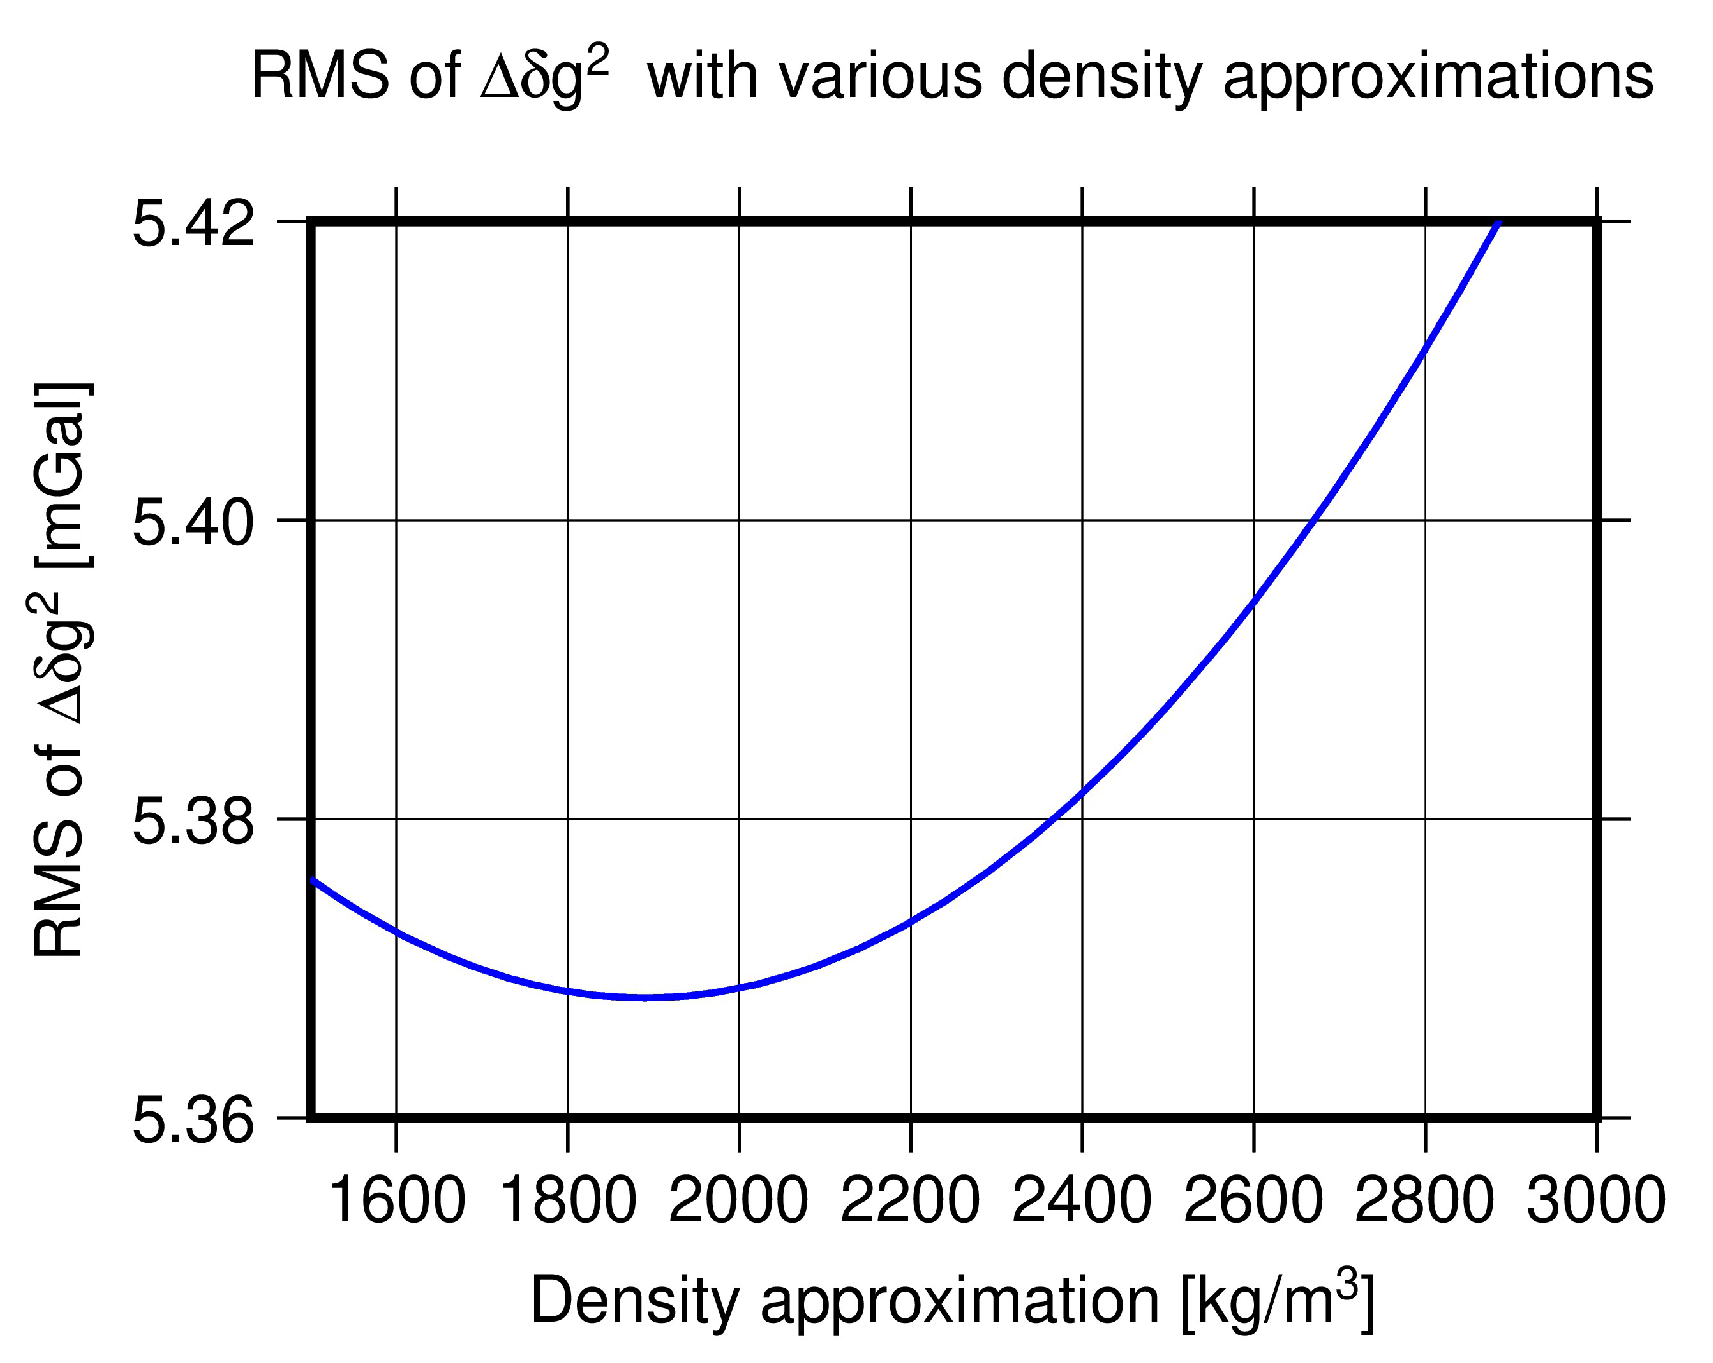
RTM technique together with a constant density assumption is widely applied in the high-frequency gravity recovery, especially over rough areas. Refs. [44,50,69], etc., have demonstrated the effectiveness of RTM combined with GGM for achieving ultra-high-resolution gravity fields globally and regionally, significantly enhancing the performance of GGMs. Additionally, various studies [44,52,70] have shown that this combined approach can recover approximately ∼ of gravity signals over rugged areas, making it a valuable tool in areas lacking terrestrial gravity measurements. However, as shown in Table 1, over areas with large density anomalies, the classical RTM has limited effectiveness. The combined gravity field, synthesized from both GGM and RTM, can only recover around ∼ of gravity field signals when a constant density of 2670 kg/m is adopted. As stated in [52], the performance of RTM in gravity field synthesis can vary with different density assumptions, achieving its best performance when using the regional optimal density. Figure 11 shows the RMS values of under various density assumptions. As the density values increase from 1500 to 3000 kg/m, the RMS value initially decreases, reaching a minimum value of mGal when a constant density value of 1890 kg/m is adopted. Afterwards, it rises as the density increases further. Therefore, our method, which incorporates density anomalies. Therefore, compared to using regional optimum density, our method involving density anomaly (Table 1) significantly enhances the performance of the RTM technique.

Figure 11.
RMS of under various density assumptions. Here .
2. The location of the airborne gravity gradiometer test area
In terms of the location of the airborne gravity gradient test area, a 5 km × 5 km area with significant gravity and gradient features is required. As shown in the Section 3, though the study area provides significant gravity and gradient signals on the Earth’s surface and at the flight height with a constant clearance of 100 m from the terrain, these high amplitudes primarily concentrated located around volcanos. The gradient features over most areas far from volcanos are relatively weak, with values generally below 30 E and showing a long-wavelength trend. Given this, it would be advisable to choose the test area in close proximity to the volcanoes, where the gradient signals are more prominent and exhibit greater variability. This will enable a more accurate assessment of the performance of airborne gravity gradient measurements in capturing subtle geological features.
The selected 5 km × 5 km area, outlined by red lines in Figure 5, Figure 6, Figure 7 and Figure 8, covering the volcanos of BJS and WHS. Within this area, there are significant gravity and gradient features both on the Earth’s surface and at the flight height. The detailed gravity field features are shown in panels (b) of Figure 5 and Figure 8 for the gravity disturbances on the Earth’s surface and at the flight height, respectively. The gravity disturbance values on the Earth’s surface vary from mGal to mGal with an RMS of mGal, while they are from ∼ mGal to ∼ mGal with an RMS of ∼ mGal at the flight height (Table 4 and Table 5). The gradient features are shown in panels (b), (d), and (f) of Figure 6, Figure 7, Figure 9 and Figure 10. The gradient tensors exhibit the northeast–southwest trending features, with larger gradients primarily concentrated around the volcanoes and subtle features present in other areas. The ranges of all gradient tensors are larger than 200 E (Table 4 and Table 5). These make it a good place for the gravity gradient test site.

Table 4.
The statistical information of gravitational field on the Earth’s surface.

Table 5.
The statistical information of gravitational field at flight height.
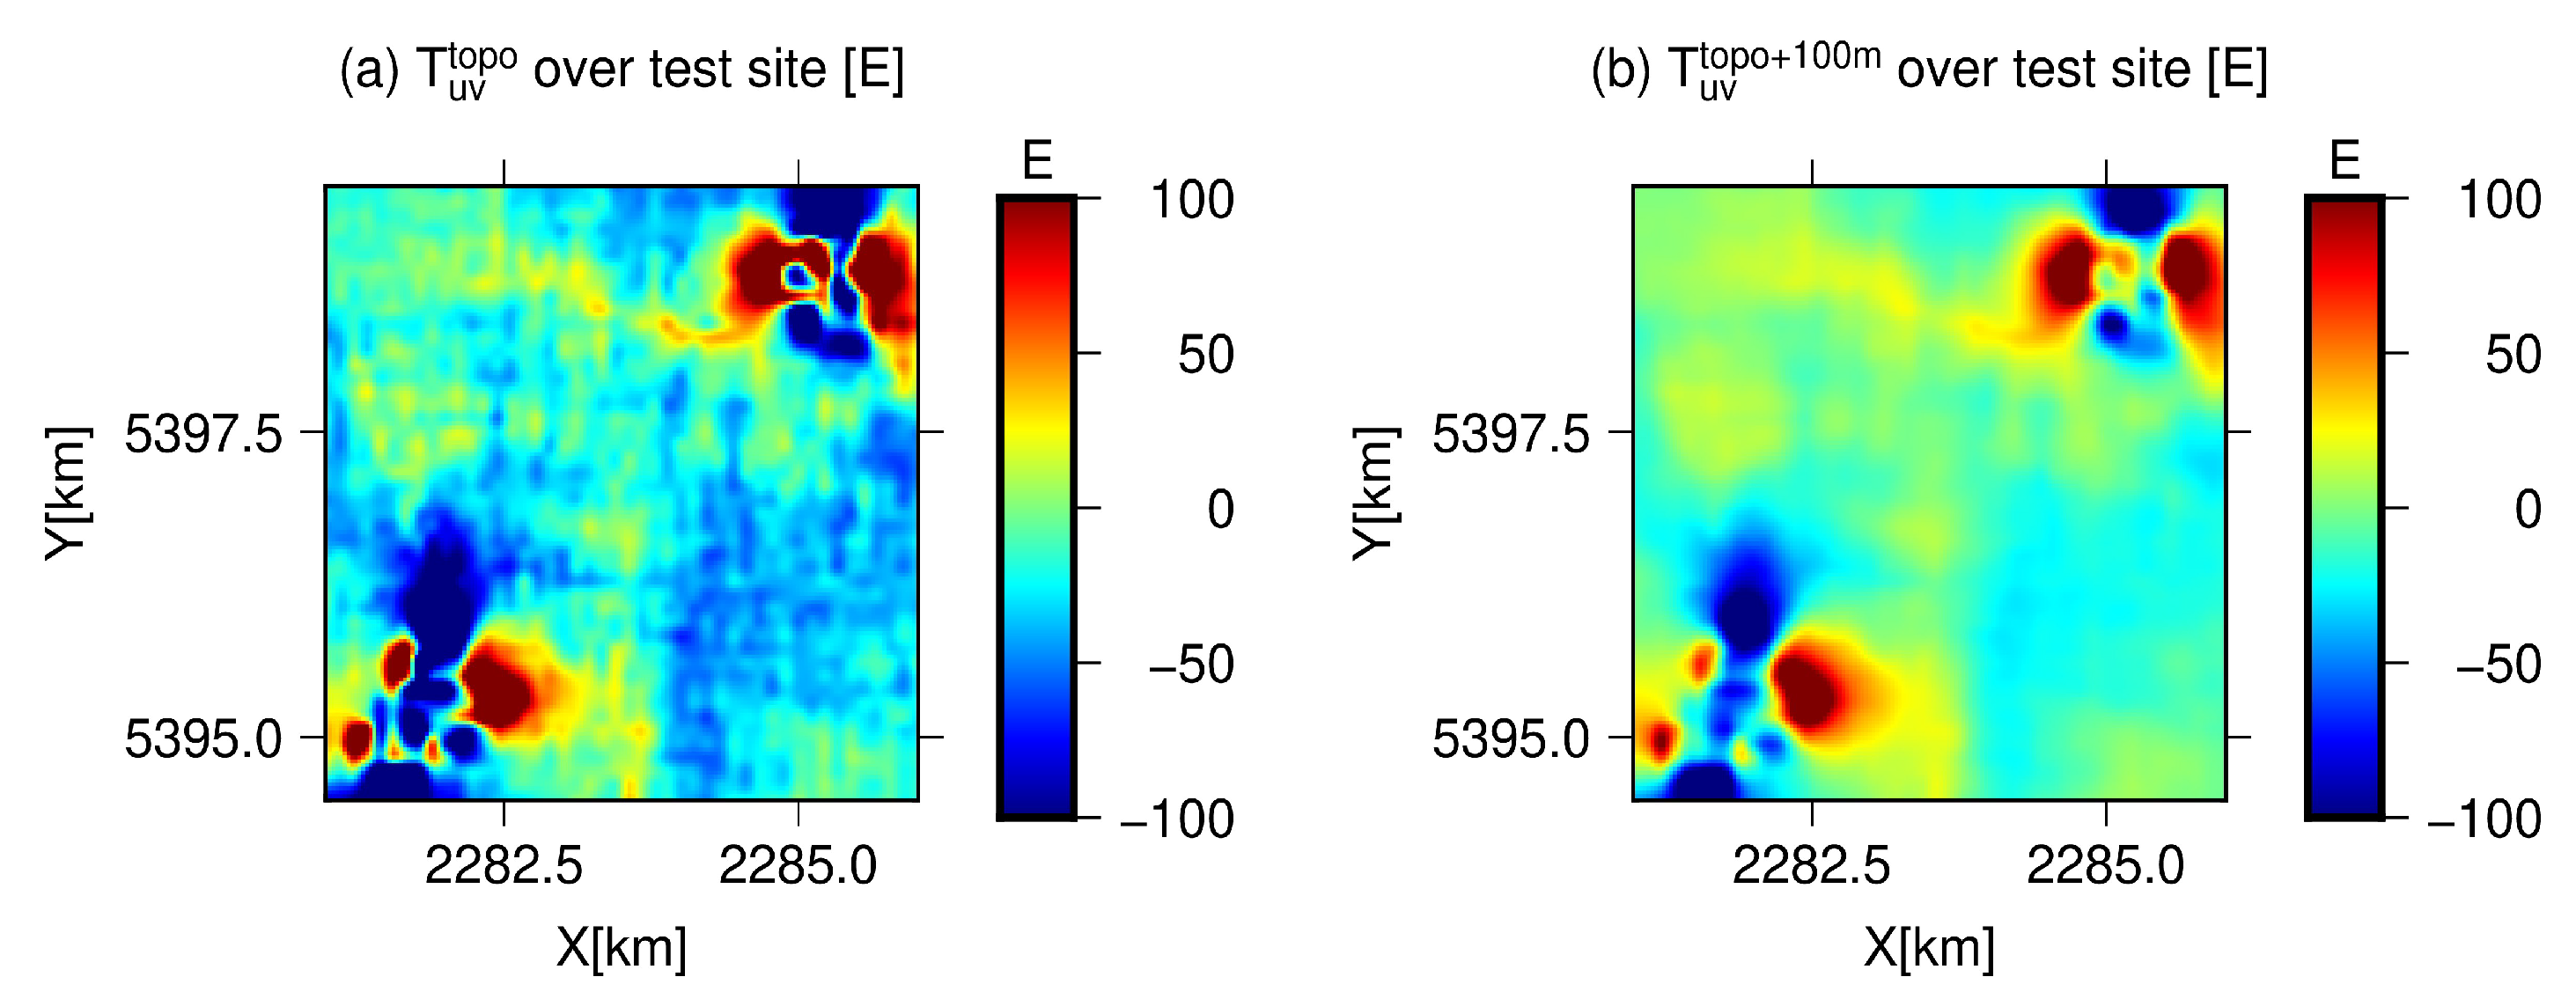
In addition to the previously discussed gradient components, the values of component are calculated on the Earth’s surface and at the flight height . The results are shown in Figure 12, Table 4 and Table 5. The values of ranges from ∼ E to ∼ E with RMS of ∼ E on the ground surface, and from ∼ E to ∼ E with RMS of ∼ E at the flight height. In terms of the distribution, the large magnitudes of are primarily concentrated over the volcanoes, with subtle features present in the surrounding areas.

Figure 12.
The synthesised component on the Earth’s surface (a) and at the flight height (b).
3. The contributions of GGM, RTM, and density anomaly
The synthesised gravity field signals are combined contributions of three main components: the long-wavelength signals implied by GGM , the contribution of RTM terrain with a constant density , and the contribution of density anomalies . The RMS values for each of these components are calculated and presented in Table 2 and Table 3. These will give insights into the contribution of each part. It is evident that the long-wavelength part implied by the GGM plays a dominant role in the gravity anomaly, with largest RMS values of ∼ mGal on the Earth’s surface and of ∼ mGal at the flight height. Differently from gravity anomaly, the contribution of residual terrain masses with maximum RMS values up to tens Etovos plays a dominant role in the synthesised gradients. This is reasonable considering the attenuation character of gradients with distance increasing. Therefore, the gradient changes are mainly caused by mass anomalies of topography.
At the flight height, the gradients implied by the GGM are reduced by ∼, while the gradients due to residual terrain of constant density are reduced by ∼, and the gradients due to residual terrain of density anomaly reduced by ∼. The values of reduce the most when the calculation height increases from the Earth’s surface to the flight height. This is primarily due to the rapid attenuation of high-frequency signals compared to the long-wavelength signals with distance increasing from the mass sources. Limited by the resolution of gravity observations for the inversion of density anomaly, the density anomaly implied gradients show a long-wavelength trend.
Therefore, the test site should be an area of moderate terrain of shallow density anomalies. In our recommended test site area over WVF, the terrain varies from ∼ m to ∼ m with a mean height of ∼ m. The terrain fluctuation generates significant gradient signals for calibration and the terrain is moderate enough for low-altitude flying.
5. Conclusions
The establishment of an airborne gravity gradiometer test site is essential for comparing and evaluating the performance of different airborne gradiometers, both those currently in use and those under development. Based on the comprehensive and precise terrestrial gravity measurements, it gives guidance for the capability and precision of the instrument. To ensure the effectiveness of the test site, it is crucial to select areas with moderate terrain and significant gradient variations, given the sensitivity of the instrument and the characteristics of the Earth’s gradient tensors. Therefore, the accurate modelling of the gravity field, i.e., gravity anomaly and tensor components, over the option areas is of paramount importance, particularly over areas absence of gravity measurements.
In this study, a new gravity field modelling method is introduced, which combines the GGM long-wavelength gravity field, the gravity field implied by the RTM terrain of constant density, and the gravity field generated by density anomalies. The density anomalies are initially derived through the inversion of sparse terrestrial gravity measurements using the ESL method. Its contribution to the gravity field modelling is then calculated using a forward modelling approach. Compared to the classical method, terrestrial gravity measurements and their indicated density anomalies are included. This results in a better figure of the gravity field with a recovering rate of ∼.
Using the promoted method, the gravity field, including gravity anomaly and gradient tensors on the ground and at the flight height, is calculated and investigated over the WVF volcanos geopark area. Based on the calculated gravity field, a recommended area for building the airborne gravity gradiometer test site is proposed, covering a 5 km × 5 km area around BJS and WHS volcanos. This recommended area exhibits significant gravity field signals with ranges of gradient tensors larger than 200 E. The gradients demonstrate a northeast–southwest trending feature with the high amplitude structure at volcanos and subtle features in surrounding areas. However, limited by the resolution of gravity observations used for the inversion of density anomaly, the density-anomaly-implied gradients show a long-wavelength trend. Therefore, the high-frequency signals associated with density anomalies are not fully captured in the synthesized results.
It is important to note that the gravity measurements used in this study, as mentioned in [64], are relative values. To keep consistency across all procedures, the absolute values calculated from GGM and RTM are transformed into relative values. Therefore, the generated gravity field signals including the gravity anomalies and gradient components, are relative gravity fields in this study. This transformation does not impact the conclusions drawn from the study.
The construction of the airborne gravity gradiometer test site over the WVF area will be of great significance both in geodesy and geophysics. This is because it will take place in extensive geodetic measurements. This includes dense and precise GNSS (Global Navigation Satellite System) and terrestrial gravity measurements at a 70 km × 80 km area around the test site and high-resolution LiDAR DEM (digital elevation model) measurements in the test site. Therefore, it will be of profound meaning both in geodesy and geophysics. Firstly, the precise and dense terrestrial measurements will provide detailed gravity field information of the test site. Together with the accurate transformation methodology, it is capable of recovering the precise gradient information of the test site, which will then provide the gauge for the capability of gravity gradiometers following various principles. Secondly, the precise and consequent gravity and gradient measurements provide the possibility for continuous monitoring of volcanic activities. Considering the relatively short history since the last eruption of Laoheishan and Huoshaoshan in the WVF, an active magmatic system is expected [54]. Gravity and gradient data provide valuable information for the continuous monitoring of the magmatic system. Thirdly, the area is located in the farming region. The extensive and precise GNSS measurements provide references for the methodology studies of LiDAR data processing.
Furthermore, the gravity field determination method presented in this study has the potential to be employed in data processing for the test site. The primary goal of a test site is to assess the accuracy of airborne gradiometry using precise terrestrial gravity measurements. The fundamental procedure typically involves: (1) calculating the gradient at flight height using terrestrial gravity data; (2) comparing the computed gradient at flight height with airborne gradient measurements; (3) evaluating the precision of airborne measurements. The method proposed in this study can be utilized for the first step, which involves transforming terrestrial gravity measurements into gradients at flight height. Moreover, this method could be applied in the downward continuation of airborne gradients, opening up opportunities for various geodetic and geophysical applications, including regional gravity field modelling, gravity inversion, and volcanic activity research.
Author Contributions
Conceptualization, M.Y., W.F. and M.Z.; methodology, M.Y. and W.-K.L.; software, M.Y. and W.-K.L.; validation, M.Y.; formal analysis, M.Y.; investigation, M.Y.; resources, Y.-G.W.; writing—original draft preparation, M.Y.; writing—review and editing, W.-K.L., W.F., R.P., Y.-G.W. and M.Z.; visualization, M.Y.; supervision, W.F. and M.Z.; funding acquisition, M.Y. and W.F. All authors have read and agreed to the published version of the manuscript.
Funding
This work was supported by the National Natural Science Foundation of China (Grant No. 42104083), the Natural Science Foundation of Guangdong Province, China (Grant No. 2021A1515011425), and Natural Science Fund for Distinguished Young Scholars of Hubei Province, China (Grant No. 2019CFA091).
Data Availability Statement
The EGM2008 data were downloaded from the International Centre for Global Earth Models (http://icgem.gfz-potsdam.de/series, accessed on 20 January 2022). The MERIT DEM dataset was downloaded from http://hydro.iis.u-tokyo.ac.jp/~yamadai/MERIT_DEM/, accessed on 3 August 2020. The raw terrestrial gravity datasets used in this study were measured and copyrighted by Prof. Yangang Wu’s (wuyangang@jlu.edu.cn) group of Jilin University. The synthesised gravity field data over the airborne gravity gradiometer test site are available upon request to M. Yang (yangmeng5@mail.sysu.edu.cn). The code to read these data is provided in Matlab. The software used for RTM gravity field calculation is available at this link (https://www.asg.ed.tum.de/iapg/forschung/schwerefeld/tgf/, accessed on 20 January 2020).
Conflicts of Interest
The authors declare no conflict of interest.
References
- Jekeli, C. A review of gravity gradiometer survey system data analyses. Geophysics 1993, 58, 508–514. [Google Scholar] [CrossRef]
- Dransfield, M.; Milkereit, B. Airborne gravity gradiometry in the search for mineral deposits. Proc. Explor. 2007, 7, 341–354. [Google Scholar]
- Wetherley, S.; Moore, D. Using FALCON® airborne gravity gradiometry for oil and gas exploration: Recent case studies. In Proceedings of the 12th SEGJ International Symposium, Tokyo, Japan, 18–20 November 2015; Society of Exploration Geophysicists. 2015; pp. 60–63. [Google Scholar] [CrossRef]
- DiFrancesco, D.; Grierson, A.; Kaputa, D.; Meyer, T. Gravity gradiometer systems–advances and challenges. Geophys. Prospect. 2009, 57, 615–623. [Google Scholar] [CrossRef]
- Evstifeev, M. The state of the art in the development of onboard gravity gradiometers. Gyroscopy Navig. 2017, 8, 68–79. [Google Scholar] [CrossRef]
- Janvier, C.; Menoret, V.; Desruelle, B.; Merlet, S.; dos Santos, F.P.; Landragin, A. Recent advances in quantum gravity sensors. In Proceedings of the SEG/AAPG/SEPM First International Meeting for Applied Geoscience & Energy, Denver, CO, USA, 26 September–1 October 2021; OnePetro: Richardson, TX, USA, 2021. [Google Scholar] [CrossRef]
- Eötvös, L. Untersuchungen über gravitation und erdmagnetismus. Ann. Phys. 1896, 295, 354–400. [Google Scholar] [CrossRef]
- Jekeli, C. The Gravity Gradiometer Survey System (GGSS); EOS: Norwell, MA, USA, 1988; Volume 69, p. 105. ISSN 0096-3941. [Google Scholar]
- DiFrancesco, D. Gravity gradiometry developments at Lockheed Martin. In Proceedings of the EGS-AGU-EUG Joint Assembly, Nice, France, 6–11 April 2003; p. 1069. [Google Scholar]
- Dransfield, M.H.; Lee, J.B. The FALCON airborne gravity gradiometer survey systems. In Proceedings of the ASEG-PESA Airborne Gravity 2004 Workshop, Sydney, Australia, 15 August 2004; pp. 15–19. [Google Scholar]
- Murphy, C.A. The Air-FTG airborne gravity gradiometer system. In Airborne Gravity; Commonwealth of Australia: Canberra City, Australia, 2004; pp. 7–14. [Google Scholar]
- Rummel, R.; Yi, W.; Stummer, C. GOCE gravitational gradiometry. J. Geod. 2011, 85, 777–790. [Google Scholar] [CrossRef]
- Moody, M. A superconducting gravity gradiometer for measurements from a moving vehicle. Rev. Sci. Instrum. 2011, 82, 094501. [Google Scholar] [CrossRef]
- Cuperus, R.; Flokstra, F.; Wiegerink, R.; Flokstra, J. MEMS based gravimeters and gravity gradiometers. In Proceedings of the Poster, presented at the MEMS Conference/University of Twente, Enschede, The Netherlands, 26–29 September 2010. [Google Scholar]
- Biedermann, G.; Wu, X.; Deslauriers, L.; Roy, S.; Mahadeswaraswamy, C.; Kasevich, M. Testing gravity with cold-atom interferometers. Phys. Rev. A 2015, 91, 033629. [Google Scholar] [CrossRef]
- Snadden, M.; McGuirk, J.; Bouyer, P.; Haritos, K.; Kasevich, M. Measurement of the Earth’s gravity gradient with an atom interferometer-based gravity gradiometer. Phys. Rev. Lett. 1998, 81, 971. [Google Scholar] [CrossRef]
- Fixler, J.B. Atom Interferometer-Based Gravity Gradiometer Measurements. Ph.D. Thesis, Yale University, New Haven, CT, USA, 2003. [Google Scholar]
- Dowling, J.P.; Milburn, G.J. Quantum technology: The second quantum revolution. Philos. Trans. R. Soc. Lond. Ser. A Math. Phys. Eng. Sci. 2003, 361, 1655–1674. [Google Scholar] [CrossRef]
- Hu, L.; Poli, N.; Salvi, L.; Tino, G.M. Atom interferometry with the Sr optical clock transition. Phys. Rev. Lett. 2017, 119, 263601. [Google Scholar] [CrossRef] [PubMed]
- Hu, L.; Wang, E.; Salvi, L.; Tinsley, J.N.; Tino, G.M.; Poli, N. Sr atom interferometry with the optical clock transition as a gravimeter and a gravity gradiometer. Class. Quantum Gravity 2019, 37, 014001. [Google Scholar] [CrossRef]
- Bresson, A.; Bidel, Y.; Bouyer, P.; Leone, B.; Murphy, E.; Silvestrin, P. Quantum mechanics for space applications. Appl. Phys. B 2006, 84, 545–550. [Google Scholar] [CrossRef]
- Duan, X.C.; Zhou, M.K.; Mao, D.K.; Yao, H.B.; Deng, X.B.; Luo, J.; Hu, Z.K. Operating an atom-interferometry-based gravity gradiometer by the dual-fringe-locking method. Phys. Rev. A 2014, 90, 023617. [Google Scholar] [CrossRef]
- Deng, Z.; Hu, C.; Huang, X.; Wu, W.; Hu, F.; Liu, H.; Tu, L. Scale Factor Calibration for a Rotating Accelerometer Gravity Gradiometer. Sensors 2018, 18, 4386. [Google Scholar] [CrossRef] [PubMed]
- Meng, Z.; Yang, Y.; Li, Z. Development of airborne gravity gradiometer based on a quartz flexible accelerometer. Acta Geol. Sin. Engl. Ed. 2019, 93, 352–364. [Google Scholar] [CrossRef]
- Zhang, H.; Mao, D.K.; Luo, Q.; Hu, Z.K.; Chen, L.L.; Zhou, M.K. The self-attraction effect in an atom gravity gradiometer. Metrologia 2020, 57, 045011. [Google Scholar] [CrossRef]
- Barzaghi, R.; Borghi, A.; Keller, K.; Forsberg, R.; Giori, I.; Loretti, I.; Olesen, A.V.; Stenseng, L. Airborne gravity tests in the Italian area to improve the geoid model of Italy. Geophys. Prospect. 2009, 57, 625–632. [Google Scholar] [CrossRef]
- Christensen, A.N.; Dransfield, M.H. Noise and repeatability of airborne gravity gradiometry. In Proceedings of the 76th EAGE Conference and Exhibition 2014, European Association of Geoscientists & Engineers, Amsterdam, The Netherlands, 16–19 June 2014; Volume 2014, pp. 1–5. [Google Scholar] [CrossRef]
- Christensen, A. Results from Falcon Airborne Gravity Gradiometer surveys over the Kauring AGG test site. Aseg Ext. Abstr. 2013, 2013, 1–4. [Google Scholar] [CrossRef]
- Bruton, A.; Hammada, Y.; Ferguson, S.; Schwarz, K.; Wei, M.; Halpenny, J. A comparison of inertial platform, damped 2-axis platform and strapdown airborne gravimetry. In Proceedings of the International Symposium on Kinematic Systems in Geodesy, Geomatics and Navigation, Banff, AB, Canada, 5–8 June 2001; pp. 542–550. [Google Scholar]
- Healey, D. Application of gravity data to geologic problems at Nevada Test Site. Nev. Test Site Geol. Soc. Am. Mem. 1968, 110, 147–156. [Google Scholar]
- Dal Pozzo, H.A.; Shukowsky, W.; Molina, E.C. Tietê Airborne Gravity Test Area. In Proceedings of the 10th International Congress of the Brazilian Geophysical Society, European Association of Geoscientists & Engineers, Rio de Janeiro, Brazil, 19–23 November 2007; pp. cp–172. [Google Scholar] [CrossRef]
- Peirce, J.; Sander, S.; Charters, R.; Lavoie, V. Turner Valley, Canada—A case history in contemporary airborne gravity. In SEG Technical Program Expanded Abstracts 2002; Society of Exploration Geophysicists: Houston, TX, USA, 2002; pp. 783–787. [Google Scholar] [CrossRef]
- Elieff, S.; Sander, S. AIRGrav airborne gravity survey in Timmins, Ontario. In Proceedings of the ASEG-PESA Airborne Gravity 2004 Workshop, Sydney, Australia, 15 August 2004; Volume 1519, p. 111119. [Google Scholar]
- Moritz, H. Least-squares collocation. Rev. Geophys. 1978, 16, 421–430. [Google Scholar] [CrossRef]
- Forsberg, R.; Tscherning, C.C. The use of height data in gravity field approximation by collocation. J. Geophys. Res. Solid Earth 1981, 86, 7843–7854. [Google Scholar] [CrossRef]
- Willberg, M.; Zingerle, P.; Liu, Q.; Schmidt, M.; Pail, R. The 1 cm geoid experiment with Least Squares Collocation. In Geophysical Research Abstracts; EBSCO Industries, Inc.: Birmingham, AL, USA, 2019; Volume 21. [Google Scholar]
- Klees, R.; Tenzer, R.; Prutkin, I.; Wittwer, T. A data-driven approach to local gravity field modelling using spherical radial basis functions. J. Geod. 2008, 82, 457–471. [Google Scholar] [CrossRef]
- Liu, Q.; Schmidt, M.; Sánchez, L.; Willberg, M. Regional gravity field refinement for (quasi-) geoid determination based on spherical radial basis functions in Colorado. J. Geod. 2020, 94, 99. [Google Scholar] [CrossRef]
- Mahbuby, H.; Amerian, Y.; Nikoofard, A.; Eshagh, M. Application of the nonlinear optimisation in regional gravity field modelling using spherical radial base functions. Stud. Geophys. Geod. 2021, 65, 261–290. [Google Scholar] [CrossRef]
- Sjöberg, L.E. Least Squares Modification of Stokes’ and Vening Meinesz’formulas by Accounting for Errors of Truncation, Potential Coefficients and Gravity Data; University of Uppsala, Institute of Geophysics, Department of Geodesy: Uppsala, Sweden, 1984. [Google Scholar]
- Bouman, J.; Koop, R. Calibration of GOCE SGG data combining terrestrial gravity data and global gravity field models. In Proceedings of the Gravity and Geoid 2002; 3rd Meeting of the IGGC Ziti Editions, Thessaloniki, Greece, 26–30 August 2002; pp. 275–280. [Google Scholar]
- Bouman, J.; Koop, R.; Tscherning, C.; Visser, P. Calibration of GOCE SGG data using high–low SST, terrestrial gravity data and global gravity field models. J. Geod. 2004, 78, 124–137. [Google Scholar] [CrossRef]
- Arabelos, D.; Tscherning, C.; Veicherts, M. External calibration of GOCE SGG data with terrestrial gravity data: A simulation study. In Proceedings of the Dynamic Planet: Monitoring and Understanding a Dynamic Planet with Geodetic and Oceanographic Tools IAG Symposium Cairns, Cairns, Australia, 22–26 August 2005; Springer: Berlin/Heidelberg, Germany, 2007; pp. 337–344. [Google Scholar]
- Bucha, B.; Janák, J.; Papčo, J.; Bezděk, A. High-resolution regional gravity field modelling in a mountainous area from terrestrial gravity data. Geophys. J. Int. 2016, 207, 949–966. [Google Scholar] [CrossRef]
- Kern, M.; Haagmans, R. Determination of gravity gradients from terrestrial gravity data for calibration and validation of gradiometric GOCE data. In Proceedings of the Gravity, Geoid and Space Missions; Jekeli, C., Bastos, L., Fernandes, J., Eds.; Springer: Berlin/Heidelberg, Germany, 2005; pp. 95–100. [Google Scholar]
- Rexer, M.; Hirt, C.; Pail, R.; Claessens, S. Evaluation of the third-and fourth-generation GOCE Earth gravity field models with Australian terrestrial gravity data in spherical harmonics. J. Geod. 2014, 88, 319–333. [Google Scholar] [CrossRef]
- Denker, H. Computation of gravity gradients over Europe for calibration/validation of GOCE data. In Proceedings of the 3rd Meeting of the International Gravity and Geoid Commission: Gravity and Geoid, Thessaloniki, Greece, 26–30 August 2002. [Google Scholar]
- Forsberg, R. A Study of Terrain Reductions, Density Anomalies and Geophysical Inversion Methods in Gravity Field Modelling; Technical report; Ohio State Univ Columbus Dept of Geodetic Science and Surveying: Columbus, OH, USA, 1984. [Google Scholar]
- Zhu, L.; Jekeli, C. Gravity gradient modeling using gravity and DEM. J. Geod. 2009, 83, 557–567. [Google Scholar] [CrossRef]
- Hirt, C.; Claessens, S.; Fecher, T.; Kuhn, M.; Pail, R.; Rexer, M. New ultrahigh-resolution picture of Earth’s gravity field. Geophys. Res. Lett. 2013, 40, 4279–4283. [Google Scholar] [CrossRef]
- Hirt, C.; Yang, M.; Kuhn, M.; Bucha, B.; Kurzmann, A.; Pail, R. SRTM2gravity: An ultrahigh resolution global model of gravimetric terrain corrections. Geophys. Res. Lett. 2019, 46, 4618–4627. [Google Scholar] [CrossRef]
- Yang, M.; Hirt, C.; Tenzer, R.; Pail, R. Experiences with the use of mass-density maps in residual gravity forward modelling. Stud. Geophys. Geod. 2018, 62, 596–623. [Google Scholar] [CrossRef]
- Yang, M.; Hirt, C.; Pail, R. TGF: A New MATLAB-based Software for Terrain-related Gravity Field Calculations. Remote Sens. 2020, 12, 1063. [Google Scholar] [CrossRef]
- Li, Z.; Ni, S.; Zhang, B.; Bao, F.; Zhang, S.; Deng, Y.; Yuen, D.A. Shallow magma chamber under the Wudalianchi Volcanic Field unveiled by seismic imaging with dense array. Geophys. Res. Lett. 2016, 43, 4954–4961. [Google Scholar] [CrossRef]
- Oldenburg, D.W.; Li, Y. Inversion for applied geophysics: A tutorial. Near-Surf. Geophys. 2005, 89–150. [Google Scholar] [CrossRef]
- Hirt, C.; Bucha, B.; Yang, M.; Kuhn, M. A numerical study of residual terrain modelling (RTM) techniques and the harmonic correction using ultra-high-degree spectral gravity modelling. J. Geod. 2019, 93, 1469–1486. [Google Scholar] [CrossRef]
- Yang, M.; Hirt, C.; Wu, B.; Deng, X.L.; Tsoulis, D.; Feng, W.; Wang, C.Q.; Zhong, M. Residual Terrain Modelling: The Harmonic Correction for Geoid Heights. Surv. Geophys. 2022, 43, 1201–1231. [Google Scholar] [CrossRef]
- Klees, R.; Seitz, K.; Slobbe, D. The RTM harmonic correction revisited. J. Geod. 2022, 96, 39. [Google Scholar] [CrossRef]
- Klees, R.; Seitz, K.; Slobbe, C. Exact closed-form expressions for the complete RTM correction. J. Geod. 2023, 97, 33. [Google Scholar] [CrossRef]
- Nagy, D.; Papp, G.; Benedek, J. The gravitational potential and its derivatives for the prism. J. Geod. 2000, 74, 552–560. [Google Scholar] [CrossRef]
- Li, Y.; Oldenburg, D.W. 3-D inversion of gravity data. Geophysics 1998, 63, 109–119. [Google Scholar] [CrossRef]
- Lawson, C.L.; Hanson, R. Linear least squares with linear inequality constraints. In Solving Least Squares Problems; Society for Industrial and Applied Mathematics: Philadelphia, PA, USA, 1974; pp. 158–173. [Google Scholar]
- Hansen, P.C. The L-curve and its use in the numerical treatment of inverse problems. In Computational Inverse Problems in Electrocardiology; Johnston, P., Ed.; WIT Press: Southampton, UK, 2001; pp. 119–142. [Google Scholar]
- Zhang, S.; Jia, X.; Zhang, Y.; Li, S.; Li, Z.; Tian, P.; Ming, Y.; Zhang, C. Volcanic Magma Chamber Survey and Geothermal Geological Condition Analysis for Hot Dry Rock at Weishan Volcano in Wudalianchi Region, Heilongjiang Province. Acta Geol. Sin. 2017, 91, 1506–1521. [Google Scholar]
- Bucha, B.; Janák, J. Definition of Functionals of the Geopotential Used in GrafLab Software; Scientific Technical Report; Slovak University of Technology in Bratislava: Bratislava, Slovak, 2021. [Google Scholar]
- Yamazaki, D.; Ikeshima, D.; Tawatari, R.; Yamaguchi, T.; O’Loughlin, F.; Neal, J.C.; Sampson, C.C.; Kanae, S.; Bates, P.D. A high-accuracy map of global terrain elevations. Geophys. Res. Lett. 2017, 44, 5844–5853. [Google Scholar] [CrossRef]
- Li, W.; Yang, M.; Zhong, M.; Feng, W. Methodology to calculate full tensor of airborne gravity gradient based on 3Dgravity inversion. J. Huazhong Univ. Sci. Technol. (Nat. Sci. Ed.) 2022, 50, 90–95. [Google Scholar] [CrossRef]
- DiFrancesco, D.; Meyer, T.; Christensen, A.; FitzGerald, D. Gravity gradiometry–today and tomorrow. In Proceedings of the 11th SAGA Biennial Technical Meeting and Exhibition, European Association of Geoscientists & Engineers, Swaziland, South Africa, 16–18 September 2009; pp. cp–241. [Google Scholar] [CrossRef]
- Ďuríčková, Z.; Janák, J. RTM-based omission error corrections for global geopotential models: Case study in Central Europe. Stud. Geophys. Geod. 2016, 60, 622–643. [Google Scholar] [CrossRef]
- Bucha, B.; Hirt, C.; Yang, M.; Kuhn, M.; Rexer, M. Residual terrain modelling (RTM) in terms of the cap-modified spectral technique: RTM from a new perspective. J. Geod. 2019, 93, 2089–2108. [Google Scholar] [CrossRef]
Disclaimer/Publisher’s Note: The statements, opinions and data contained in all publications are solely those of the individual author(s) and contributor(s) and not of MDPI and/or the editor(s). MDPI and/or the editor(s) disclaim responsibility for any injury to people or property resulting from any ideas, methods, instructions or products referred to in the content. |
© 2023 by the authors. Licensee MDPI, Basel, Switzerland. This article is an open access article distributed under the terms and conditions of the Creative Commons Attribution (CC BY) license (https://creativecommons.org/licenses/by/4.0/).

