Article

Investigating the Identification and Spatial Distribution Characteristics of Camellia oleifera Plantations Using High-Resolution Imagery

1
Research Center of Forestry Remote Sensing & Information Engineering, Central South University of Forestry & Technology, Changsha 410004, China
2
Hunan Provincial Key Laboratory of Forestry Remote Sensing Based Big Data & Ecological Security, Changsha 410004, China
3
Key Laboratory of National Forestry and Grassland Administration on Forest Resources Management and Monitoring in Southern China, Changsha 410004, China
*
Author to whom correspondence should be addressed.
Remote Sens. 2023, 15(21), 5218; https://doi.org/10.3390/rs15215218
Submission received: 4 August 2023 / Revised: 12 October 2023 / Accepted: 27 October 2023 / Published: 2 November 2023

Abstract

:
Camellia oleifera is a vital economic crop of southern China. Accurate mapping and monitoring of Camellia oleifera plantations are essential for promoting sustainable operations within the Camellia oleifera industry. However, traditional remote sensing interpretation methods are no longer feasible for the large-scale extraction of plantation areas. This study proposes a novel deep learning-based method that utilizes GF-2 remote sensing imagery to achieve precise mapping and efficient monitoring of Camellia oleifera plantations. First, we conducted a comparative analysis of the performance of various semantic segmentation models using a self-compiled dataset of Camellia oleifera plantations. Subsequently, we proceeded to validate the prediction results obtained from the most effective deep-learning network model for Camellia oleifera plantations in Hengyang City. Finally, we incorporated DEM data to analyze the spatial distribution patterns. The findings indicate that the U-Net++ network model outperforms other semantic segmentation methods when applied to our self-generated dataset of Camellia oleifera plantations. It achieves a recall rate of 0.89, a precision rate of 0.92, and an mIOU of 0.83, demonstrating the effectiveness of the proposed method in identifying and monitoring Camellia oleifera plantations. By combining the predicted results with the data from DEM, we discovered that these plantations are typically situated at elevations ranging from 50 to 200 m, with slopes below 25°, and facing south or southeast. Moreover, a significant positive spatial correlation and clustering phenomenon are observed among the townships in Hengyang City. The method proposed in this study facilitates rapid and precise identification and monitoring of Camellia oleifera plantations, offering significant theoretical support and a scientific foundation for the management and ecological conservation of Camellia oleifera plantations.

1. Introduction

Camellia oleifera is a group of oleaginous species within the Camellia genus of the Theaceae family. This plant species holds significant economic importance as a valuable crop in southern China [1]. The rapid and sustained development of China’s economy and society has led to an increasing demand for edible vegetable oil. While the rapid expansion of Camellia oleifera production has generated economic benefits, it has simultaneously resulted in adverse impacts on plantation ecosystems and biodiversity. As a result, the precise mapping of Camellia oleifera plantations, obtaining comprehensive spatial information, and conducting precise monitoring have emerged as crucial tasks for government departments responsible for land planning and management. Understanding and developing the Camellia oleifera industry’s planning and bolstering its competitiveness carry significant implications for these departments.
During the initial phases, the data acquisition for Camellia oleifera plantations primarily relied on field investigations. Scholars would directly engage in on-site assessments and surveys within the research domain to ascertain the geographical extent and boundaries of the Camellia oleifera plantation areas. While this approach often yields results of notable precision, it demands considerable commitments of time, manpower, and additional resources. Particularly when investigating vast territories characterized by intricate topographies or those situated in remote locales, it can pose formidable challenges. In certain instances, regional agriculturists or proprietors may convey details of their Camellia oleifera plantation areas to governmental entities or pertinent institutions, acting as an auxiliary avenue for data accumulation.
Conversely, the prowess of remote sensing technology, underscored by its broad reach and economic viability, facilitates the acquisition of imagery for vast territories, expediting the process of comprehensive data procurement and enabling real-time surveillance of terrestrial alterations [2]. Consequently, the interpretation of remote sensing data plays a crucial role in extracting information about large-scale planting areas. Current worldwide research on the identification of crops using remote sensing research primarily focuses on tea [3,4,5], corn [6], oil palm [7], and rice [8], while studies on remote sensing identification of Camellia oleifera planting areas remain limited. Regarding the classification, identification, and extraction of crop areas from remote sensing images, earlier studies mainly used visual interpretation performed manually. This method involved inspectors evaluating forest land within remote sensing images, guided by field investigations and specialist knowledge. Despite its high accuracy, it experiences significant subjectivity and inefficiency [9]. The introduction of machine learning techniques [10,11] analyzes color, texture, and spectral features in remote sensing imagery to extract crop characteristics, thereby achieving crop identification and area extraction. To some extent, these methods offer feasible solutions for mapping Camellia oleifera plantations. In specific applications, Julien et al. conducted a classification analysis of the crops in the Barakas region of Spain. This research utilized the Normalized Vegetation Index, Landsat TM imagery, and surface temperature data, employing the maximum likelihood estimation method for classification [12]. Similarly, Adrià Descals and colleagues employed fused Sentinel-1 and Sentinel-2 data to extract oil palm features, concluding that Sentinel-1 co-polarization bands and Sentinel-2 spectral bands can detect oil palm trees [13]. Despite the notable accuracy of these methods, they confront a myriad of challenges, including distinguishing them from other plants or crops and contending with object occlusion complications. Moreover, these techniques are contingent upon handcrafted algorithms for feature extraction tailored to specific problems, suggesting that the potential of crop feature information remains underexploited.
In contrast to traditional machine learning methodologies, deep learning aims to directly extract high-level features from data, demonstrating enhanced performance as data volume expands and handling large amounts of data efficiently and accurately [14,15,16]. In 2014, Long et al. [17] introduced the fully convolutional neural network (FCN) as a novel approach, substituting the fully connected layer at the terminal stage of the convolutional neural network with a convolutional layer to facilitate end-to-end pixel-level segmentation of images. Utilizing convolutional neural networks, Zhou [18] employed Landsat-8 multispectral remote sensing images to identify peanut plantation areas in remote sensing images, displaying superior efficacy compared to traditional methods according to experimental outcomes. Subsequently, in 2015, Ronneberger et al. [19] introduced the U-Net network, a model equipped with symmetrical encoders and decoders, supplemented with skip connections for accurate pixel-level localization. The U-Net model continues to evolve and has been implemented extensively for terrestrial information extraction from remote sensing images. Illustratively, Sisi Wei et al. [20] amalgamated multi-temporal, dual-polarization SAR data with the U-Net neural network model. The researchers used this combination to facilitate large-scale crop mapping in Fuyu City, situated in Jilin Province, reaching an accuracy rate of 85%. Zhou et al. [21,22] innovated the U-net++ network, an enhancement of the original U-net, introducing redesigned skip paths, dense skip connections, and profound supervision to bridge the semantic gap between the encoder and decoder feature maps. While extensive research has been undertaken in the domain of crop extraction employing deep learning and high-resolution imagery, the application of such methodologies to the extraction of Camellia oleifera plantations is comparatively nascent. Insights can be gleaned from sophisticated deep learning methodologies prevalent in diverse crop identification domains, facilitating the exploration of the feasibility of extracting of Camellia oleifera plantations utilizing GF-2 satellite data and advanced deep learning techniques.
Consequently, this study introduces an innovative methodology, amalgamating high-resolution remote sensing imagery with deep learning, to proffer groundbreaking solutions for the meticulous extraction of Camellia oleifera plantations. Furthermore, this study leverages DEM data to perform a comprehensive analysis of the spatial distribution characteristics of Camellia oleifera plantation areas, with the aspiration of furnishing invaluable references for the precise identification of diverse crops.

2. Materials and Methods

2.1. Study Area

The research area is situated in Hengyang City, in the south-central part of Hunan Province, near the middle reaches of the Xiangjiang River. Its location lies between 110°32′–113°16′E and latitudes 26°07′–27°28′N. Figure 1 presents a schematic diagram illustrating the study area’s location. Characterized by a subtropical monsoon climate, the region boasts a long growing season, abundant sunshine, and annual precipitation ranging from 800 to 2000 mm. Renowned for its Camellia oleifera production, the area has consistently ranked top among national prefecture-level cities in terms of planted area, tea oil output, and annual production value. The topography of the study area features a high southern and low northern landscape, with mountains and hills dominating the region and gentle slopes fostering optimal photosynthesis conditions for Camellia oleifera.

2.2. Data and Preprocessing

2.2.1. Data Sources

(1)
Remote Sensing Image Data: As shown in Table 1, in this study, we utilized high-resolution remote sensing imagery derived from a fusion of multiple GF-2 images captured in 2020. These images underwent a series of preprocessing steps, including orthorectification, radiometric calibration, image fusion, mosaicking, and color balancing, to enhance the accuracy and clarity of the remote sensing data. The preprocessed GF-2 images encompass multispectral information across four bands: red, green, blue, and near-infrared (sRGB). However, for the purposes of this study, only the red, green, and blue bands were employed. Initially, the spatial resolution of these high-resolution images was 3.2 m, but post resampling, it was refined to 2 m. All preprocessing tasks were executed using scripts developed in Pycharm. The predilection for high-resolution imagery stems from the potential ambiguity between Camellia oleifera plantations and other vegetative or terrestrial features in lower-resolution images. Such high-resolution captures substantially mitigate these ambiguities, fortifying the precision in extracting Camellia oleifera plantation areas. Additionally, the 30 m spatial resolution DEM data from NASA’s Shuttle Radar Topography Mission (SRTM) were gathered for a thorough analysis of the spatial distribution characteristics of the Camellia oleifera plantation areas.
(2)
Auxiliary Data: The research employs high-resolution, 18-level Google Earth images (with a spatial resolution of 0.54 m) and “Woodland Resources Map” data as additional resources. Access to the Google Maps platform and the use of pertinent tools facilitated the acquisition of these Google Earth images. These images provide a reliable basis for deep-learning label generation in Camellia oleifera plantation areas. Furthermore, the “Woodland Resources Map” is constructed by distinctly categorizing forested and non-forested areas. This implies that non-forested regions are excluded, thereby minimizing interference factors associated with them. Such an approach enhances the precision of subsequent analyses concerning the spatial distribution characteristics of Camellia oleifera plantations.

2.2.2. Dataset

This research is dedicated to the identification and spatial distribution of newly established Camellia oleifera plantation areas within Hengyang City, as depicted in Figure 2. Camellia oleifera is planted on lands with sparse vegetation or those that are unused and established through the systematic planting of saplings followed by diligent management. The maturation period for these plantations spans approximately 3 to 5 years. Post this cultivation phase, the saplings develop an initial canopy structure characterized by a sparse planting density. Predominantly, this species thrives in hilly and mountainous terrains [23]. Notably, these plantations manifest a distinct “spiral-shaped” pattern in high-resolution satellite imagery, facilitating their identification.
The present study employs 2020 GF-2 data for sample annotation within three counties of Hengyang City, namely Changning City, Leiyang City, and Hengyang County. These regions are notably characterized by their affluent resources of Camellia oleifera plantations and exhibit a widespread distribution, thereby furnishing us with a rich and diverse array of sample selection opportunities. Within each of these three counties, we created a 1 km × 1 km grid using ArcMap 10.7. A fifth of all grid samples were randomly chosen for annotation of the Camellia oleifera plantations. Both the Camellia oleifera plantation areas and non-plantation areas were annotated. We generated vector files required for label samples and produced annotated images that were identical in size to the original images, with a pixel value of 255. To process the image samples and corresponding label samples, we employed a sliding window technique to divide them into 256 × 256 pixels TIFF images. This approach facilitated the creation of image sample sets and label sample sets, utilizing the Python programming language. To enhance the accuracy and efficiency of the training process, we removed images from the dataset that were not from Camellia oleifera plantations, resulting in two effective categories in the dataset. Using the random splitting strategy in the Python programming language, we divided the filtered image samples and their corresponding labels into training, validation, and test sets with a ratio of 8:1:1. As illustrated in Table 2, specifically, the training set contains 6111 images dedicated to model training, while both the test set and validation set each contain 764 images intended for model evaluation.

2.3. Semantic Segmentation

This section delineates the utilization of semantic segmentation models for the identification of Camellia oleifera plantations. Throughout the model training and validation phases, we assessed the efficacy of U-Net++ [22,24], U-Net [19], DeepLabV3+ [25], and LinkNet [26] using a self-made dataset. This assessment was grounded in a variety of evaluation metrics and juxtaposed the model’s outcomes with manually annotated benchmarks. Our objective was to pinpoint the optimal model tailored for the extraction of Camellia oleifera plantation areas. Based on the evaluation results, the U-Net++ network model, which exhibited superior performance in both training and testing, was selected and further enhanced to predict Camellia oleifera plantations in Hengyang City. A comprehensive flowchart of this process is depicted in Figure 3.

2.3.1. Model Selection

This research employs an array of neural network models to heighten the identification accuracy of Camellia oleifera plantations, optimizing these models through hyperparameter tuning. The goal is to pinpoint the neural network most adept at identifying such plantations. In terms of model selection, we employed an encoder-decoder network to accomplish the task of recognizing Camellia oleifera plantations. During the evaluation process, various network models such as U-Net, LinkNet, and Deeplabv3+ were compared through a series of comprehensive experiments. Following meticulous deliberation, as shown in Figure 4, the U-Net++ encoder-decoder structure emerged as the most suitable, with Efficientnet-b0 serving as the encoder [27]. To ensure accurate feature extraction, we utilized the Sigmoid as the activation function [28], which is pivotal for binary classification, ensuring model outputs between 0 and 1—a crucial aspect for interpreting probability distributions. The U-Net++ model, building upon the U-Net architecture, introduces innovative design elements that significantly improve semantic segmentation tasks. It exhibits refined structural modifications, especially in its skip pathways. For instance, while U-Net connects node X 0 , 4 only to node X 0 , 0 , U-Net++ establishes connections with nodes X 0 , 0 and X 0 , 3 within the same layer, enhancing information exchange. U-Net++ also features a dense skip connection strategy and a multi-layered feature fusion system, merging feature maps across levels for robust representations. Through convolution and up-sampling, the model effectively captures multi-scale semantic nuances, bolstering segmentation precision. It offers an encoder and decoder component along with skip connections, making it more adaptable for expansion in comparison to rudimentary semantic segmentation models such as FCN and Segnet [29].
Utilizing the PyTorch framework and the Python language, we configured an experimental environment on the Windows 10 system, using PyTorch version 1.9.0. The training process utilized the NVIDIA RTX3060ti GPU with 12 GB memory and CUDA version 11.0. The deep learning server was equipped with an Intel(R) Core(TM) i7-10700KF CPU, operating at a maximum frequency of 3.79 GHz, 32 GB of RAM, and 4 TB of storage space.

2.3.2. Network Parameter Selection

In our training process, we utilized the BCE Loss function, specifically designed for binary classification tasks. The loss function was applied to the model’s output layer to quantify the disparity between the predicted results and the true labels. Our objective in employing the BCE Loss function was to optimize the model’s performance and enhance its accuracy in binary classification tasks. The initial learning rate significantly affects the network’s convergence speed. A large learning rate obstructs convergence, while an exceedingly small one decelerates convergence speed. Consequently, we implemented a strategy that progressively diminishes the learning rate from an initial value of 0.001 until it reaches a minimum, pausing further adjustments after 100 iteration cycles. This approach enhances the deep learning model’s performance by incrementally reducing the learning rate and fine-tuning model parameters, thus allowing for a better adaptation to changes in the dataset.

2.3.3. Model Evaluation Metrics

To quantitatively assess the effectiveness of the proposed identification method for Camellia oleifera plantations, we selected four metrics—recall, precision, F1Score, and mean Intersection over Union (mIOU)—to provide a comprehensive evaluation of the identification accuracy. When analyzing the results, we used manual visual interpretation as the ground truth and the predictions from the fully convolutional neural network model as the predicted values, ultimately computing accuracy based on pixel count. The expressions are as follows:
R = T P T P + F N
P = T P T P + F P
F 1 - S c o r e = 2 P R P + R
m I O U = 1 K + 1 i = 0 K T P F N + F P + T P
In these equations, TP represents the count of correctly predicted pixels, FP denotes the count of incorrectly predicted pixels, and FN signifies the count of missed detections. For further assessment of the results, we employed a comprehensive evaluation index, the F1Score (F1) [30]. This quantitative metric is the harmonic mean of precision (P) and recall (R).

2.3.4. Accuracy Validation

In this study, we evaluated the accuracy of extraction results from 2020. Utilizing Google Earth’s remote sensing imagery in Hengyang City, Hunan Province, we randomly selected 441 distinct points, encompassing both Camellia oleifera plantations and other land classifications. Intentionally, these points were not included in the model’s training phase to ensure unbiased validation. Our analysis led us to compute the producer’s accuracy (PA), user’s accuracy (UA), and overall accuracy (OA) as metrics to gauge the efficacy of our adopted methodology in delineating Camellia oleifera plantation areas.
P A = T P T P + F N 100 %
U A = T P T P + F P 100 %
In these equations, TP (True Positives) quantify instances where the model accurately categorized samples, FN (False Negatives) denote misclassifications to alternative categories, and FP (False Positives) indicate erroneous categorizations to the intended category. The OA metric, representing the proportion of accurately classified samples to the total, offers an overarching evaluation of the model’s proficiency.

2.4. Analysis of Spatial Distribution for Camellia oleifera Plantations

Factors such as altitude, slope, and aspect can indirectly affect the growth and development of Camellia oleifera by modulating light conditions and soil nutrient availability [31].
In the current study, we utilized ArcMap 10.7 software to extract the altitude values at the centroid of each Camellia oleifera plantation area. Based on the altitude range provided by the DEM data for Hengyang City (56–514 m), we categorized the data into five tiers: 50–100 m, 100–150 m, 150–200 m, 200–250 m, and ≥250 m. We conducted an aspect analysis using the default grading system of the ArcMap 10.7 software. The classifications included flat (0°), north (0–22.5° and 337.5–360°), northeast (22.5–67.5°), east (67.5–112.5°), southeast (112.5–157.5°), south (157.5–202.5°), southwest (202.5–247.5°), west (247.5–292.5°), and northwest (292.5–337.5°) slopes. Furthermore, following the “Soil Erosion Classification and Grading Standards” set by China’s Ministry of Water Resources, we divided the slopes of Hengyang City into six levels: flat (<5°), slight (5–8°), gentle (8–15°), moderate (15–25°), steep (25–35°), and very steep (>35°).

2.5. Evaluation of Spatial Aggregation Characteristics in Camellia oleifera Plantation Areas

In this study, we utilized the spatial clustering capabilities of ArcMap 10.7 to examine the spatial aggregation characteristics of Camellia oleifera plantations in diverse townships within Hengyang City. The primary methods employed comprise the Global Moran’s Index and the Local Moran’s Index [32].

2.5.1. Global Moran’s Index

The Global Moran’s I is employed to quantify the extent of spatial interrelation. Utilizing the Global Moran’s I, the autonomy, similarity, or disparity of the research object within the spatial context can be discerned.
I = n S 0 i = 1 n j = 1 n w i , j z i z j i = 1 n z i 2
The deviation of attribute i from its mean is denoted as z i , while the spatial weight between attribute i and j is symbolized as w i , j . In this context, n is equivalent to the total number of attributes, while the summation of all spatial weights is represented as w i , j . The Global Moran’s I value ranges between −1 and 1. A Global Moran’s I value greater than 0 implies a positive correlation, nearing 1 when attributes with similar properties are collectively clustered. Conversely, a Global Moran’s I value lesser than 0 signifies a negative correlation, nearing −1 when attributes with different properties cluster together. A Global Moran’s I value of 0 denotes either a random distribution of attributes or an absence of correlation. The Z statistics can verify the significance of Global Moran’s I under the premise of normal distribution.

2.5.2. Local Moran’s Index

The Local Moran’s I examines spatial autocorrelation, focusing on the aggregation within the vicinity of a specific research area. This index differs from the Global Moran’s Index, which inquires about the presence of aggregation across the entire region. Instead, the Local Moran’s Index investigates specific aggregation points within the study area.
I i = x i x ¯ S 2 j = 1 n w i , j x j x ¯
Here, S 2 = i = 1 n x i x ¯ and w i , j denote the spatial weights between elements i and j, while n signifies the total number of elements. The Local Moran’s I range from −1 to 1. A score greater than 0 signals a positive correlation. Approaching 1 suggests that the high (or low) values of the area I are surrounded by similar high (or low) values. Conversely, a score less than 0 indicates a negative correlation. Near −1, it implies that the high (or low) values of the area i are enclosed by contrasting low (or high) values. If the score equals 0, this signifies either a random distribution of attributes or a lack of spatial correlation.

2.6. Analysis of Camellia oleifera Plantation Patch Fragmentation

The average patch size and patch number fragmentation index [33,34] serve as crucial indicators for evaluating fragmentation levels in Camellia oleifera plantations. This study employs these two landscape pattern indices to assess the extent and spatial distribution of fragmentation in Camellia oleifera plantations in Hengyang City.

2.6.1. Average Patch Size

The average patch size, denoted as MPS (mean patch size), provides a direct measure of fragmentation in Camellia oleifera plantations. A smaller average patch size signifies a higher degree of fragmentation within the area. The calculation formula is as follows:
M P S = A / N
A represents the total area of Camellia oleifera plantation patches in the study area, and N represents the number of patches present.

2.6.2. Index of Patch Number Fragmentation

The Index of Patch Number Fragmentation (PNI) is an essential metric used to assess the fragmentation of Camellia oleifera plantation patches within the study area. The calculation formula is as follows:
P N I = ( N 1 ) a min / A
In the formula, a min represents the minimum patch area of the plantation within the study area (hm2). The PNI value varies between 0 and 1, where 0 signifies no fragmentation and 1 indicates total fragmentation.

3. Results

3.1. Analysis of Model Training and Validation Efficiency

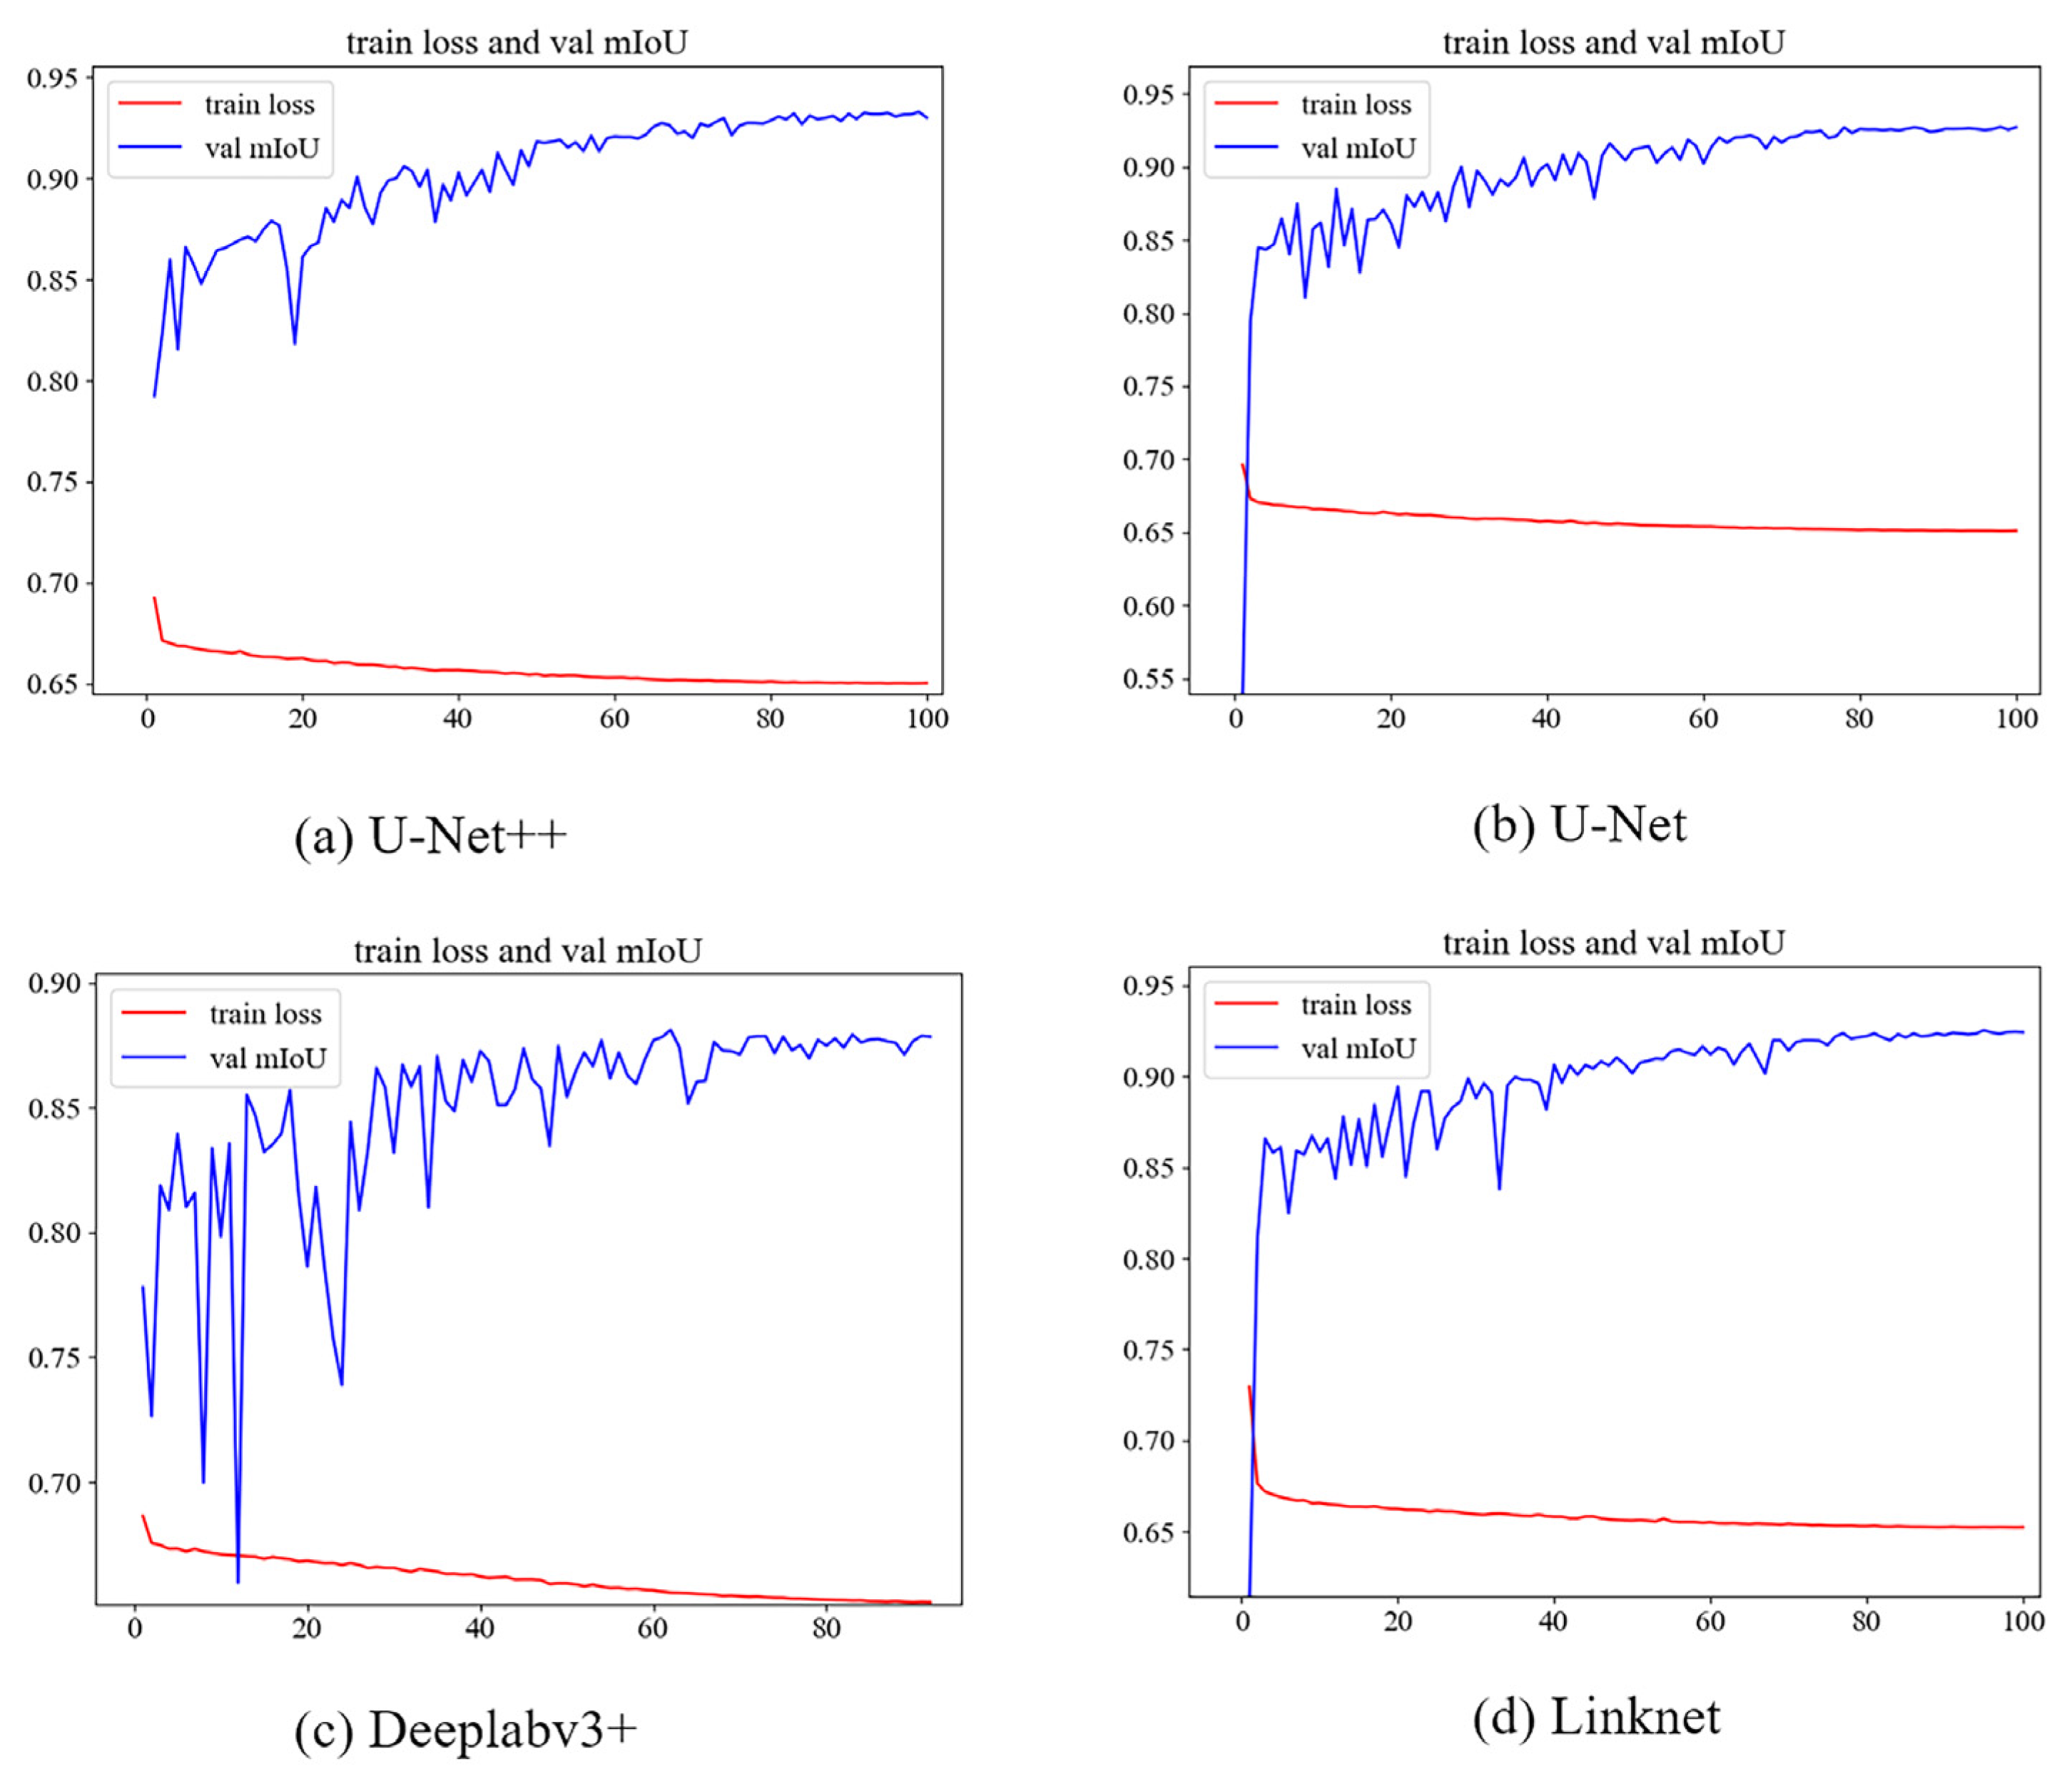
As illustrated in Figure 5, we present the loss and validation set mIOU curves for four distinct network segmentation models—U-Net++, U-Net, Deeplabv3+, and Linknet—over the course of training with an identical sample set. It is evident from the training set that the convergence speed and ultimate loss level of all four models closely align. However, a contrasting scenario emerges in the validation set mIOU, where U-Net++ consistently outperforms the other three models at both the onset and the completion of training. The U-Net++ model also exhibits a smoother validation set mIOU curve with minimal fluctuations, highlighting its superior stability during the learning process and enhanced generalization capability relative to the other models. Therefore, based on our analysis, we conclude that the U-Net++ model is optimally suited for identifying Camellia oleifera plantations in this research.

3.2. Performance Evaluation of the Train Model

The evaluation results of the performance for U-Net++ and other models on the test dataset are depicted in Figure 6. A comparison was conducted among U-Net++, U-Net, LinkNet, and DeepLabv3+ models, and the comprehensive evaluation metrics indicated that U-Net++ achieved the best performance. Specifically, U-Net++ exhibited the highest recall rate, precision, F1 score, and mIOU values, with scores of 0.89, 0.92, 0.9, and 0.83, respectively. Conversely, the DeepLabv3+ model demonstrated the least satisfactory performance, while the differences between the U-Net and LinkNet models were minimal, with the U-Net model marginally outperforming the LinkNet model.
Figure 7 illustrates examples of different network segmentation models employed to identify Camellia oleifera plantation areas in images. The U-Net model demonstrates commendable overall recognition of the Camellia oleifera plantation areas, with its ability to identify some surrounding planting areas. However, it lacks precision when defining the boundaries of the Camellia oleifera plantation areas. The Deeplabv3+ and Linknet models produce similar results, with both missing some Camellia oleifera plantation areas and failing to distinguish the surrounding non-planting areas. In contrast, U-Net++ provides results that closely match manually annotated maps, offering superior recognition of Camellia oleifera plantation areas and better distinction between Camellia oleifera plantation areas and non-Camellia oleifera plantation areas.

3.3. Accuracy Validation

Figure 8 illustrates the spatial distribution of the validation points in 2020. Based on a comprehensive analysis of randomly selected points and the extracted results of Camellia oleifera plantations, detailed statistical information regarding classification accuracy has been obtained, and the specific data are presented in Table 3. Within the Camellia oleifera category of Hengnan County, Qidong County, and Hengdong County, the producer’s accuracy (PA) values obtained were 89.50%, 83.09%, and 90.32%, respectively. Furthermore, the user’s accuracy (UA) values for these Camellia oleifera plantations were 90.50%, 91.87%, and 93.33%, respectively, highlighting the model’s ability to accurately differentiate Camellia oleifera plantations from other land classes. Overall, the achieved overall accuracy rates were 89.92%, 87.98%, and 93.40%. These findings offer robust support for the monitoring and management of Camellia oleifera plantations.

3.4. Analysis of Camellia oleifera Plantation Prediction Results

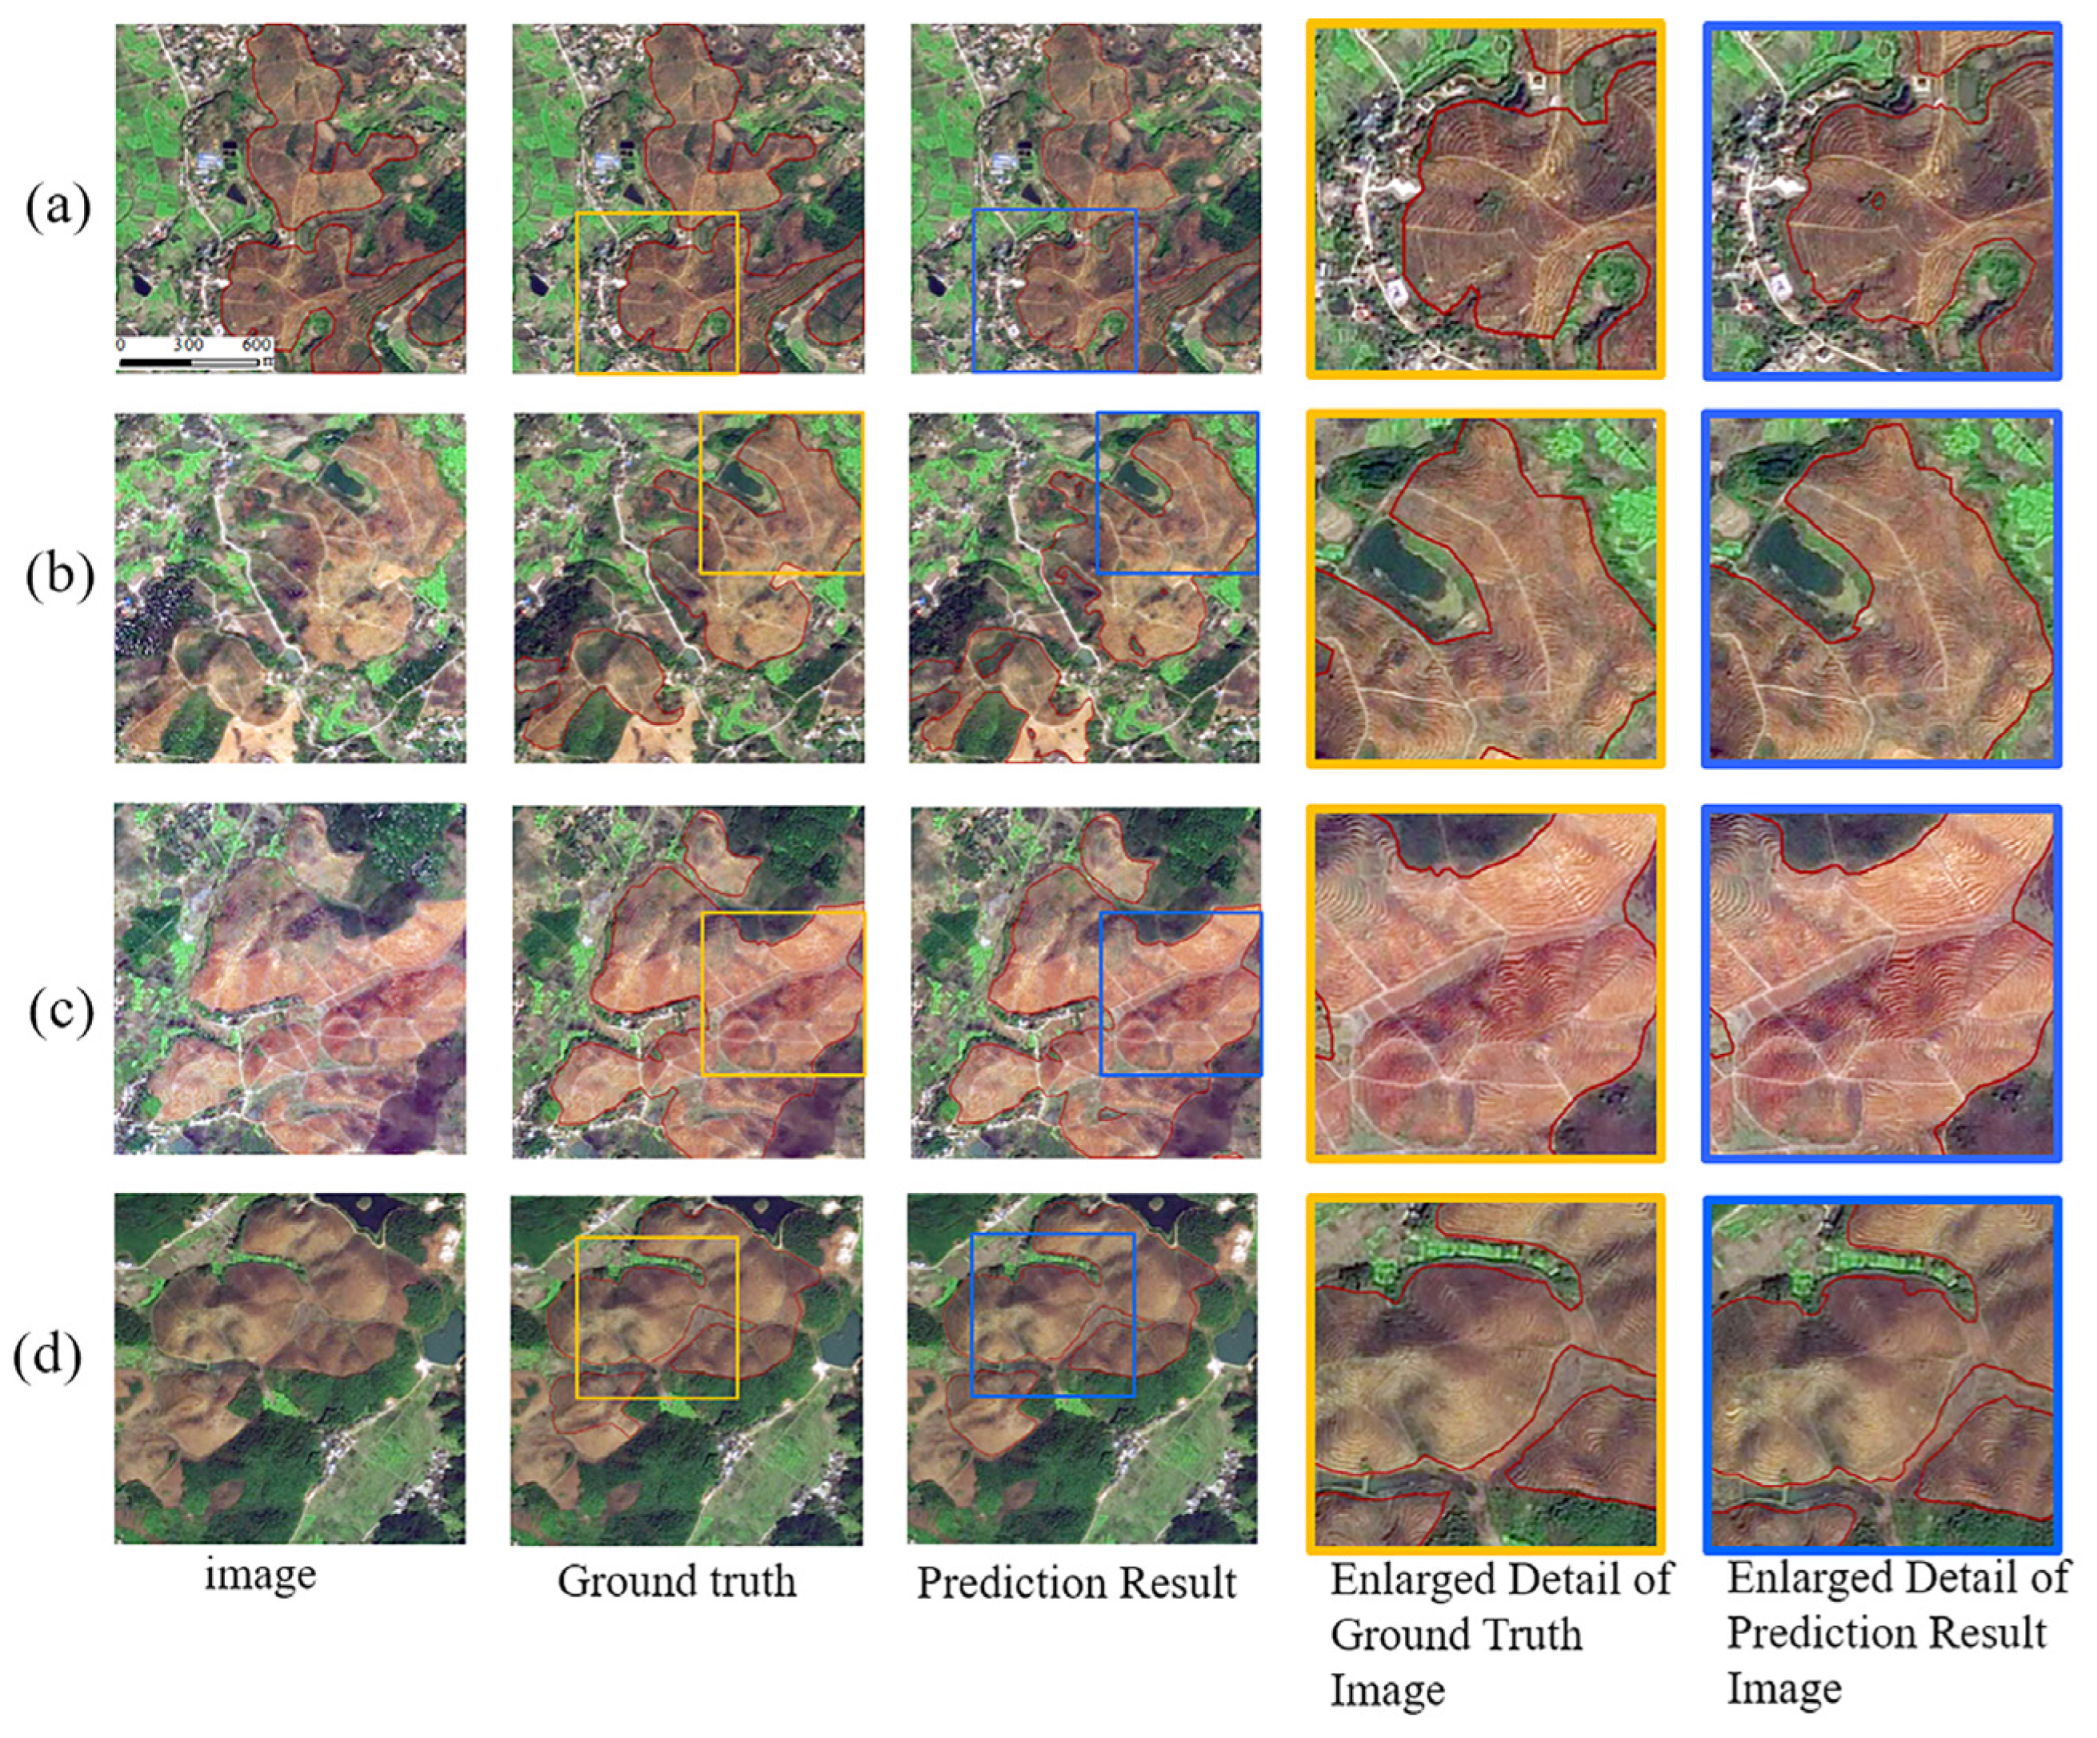
In this study, we utilized the U-Net++ model, which showcased superior performance in both training and testing stages, to provide a comprehensive analysis of the prediction outcomes across four distinct Camellia oleifera plantation scenarios (a–d). Importantly, these scenarios encompass not only Camellia oleifera plantations but also a variety of land features, including farmland, wasteland, and buildings. Our objective was to rigorously assess the U-Net++ network’s capability to differentiate between land features that exhibit significant similarities and potential ambiguities. A visual representation of this comparison is available in Figure 9.
Within this figure, the second column delineates the ground truth of the Camellia oleifera plantations, whereas the third column depicts the predictions made by the model. To elucidate the variances between the model’s predictions and the manually annotated data, we have included a detailed comparison between the ground truth and the predicted results in the fourth and fifth columns.
Upon comparing the predicted results with the ground truth for all four scenarios, it becomes evident that the U-Net++ model is adept at accurately identifying Camellia oleifera plantations of diverse dimensions. Notably, in terms of demarcating the boundaries of the Camellia oleifera plantations, the predictions rendered by the model align closely with the manual annotations. This underscores the robust capability of the U-Net++ model in intricate Camellia oleifera plantation settings. Nonetheless, certain instances of omissions and misclassifications were observed. These could be ascribed to abrupt shifts in texture luminosity, causing inconsistencies in the “spiral-shaped” characteristics of the Camellia oleifera plantations, or similarities in land feature attributes. Future enhancements should address these challenges to bolster the model’s precision.

3.5. Analysis of Spatial Distribution Characteristics in Camellia oleifera Plantations

3.5.1. Characteristics of Area Distribution

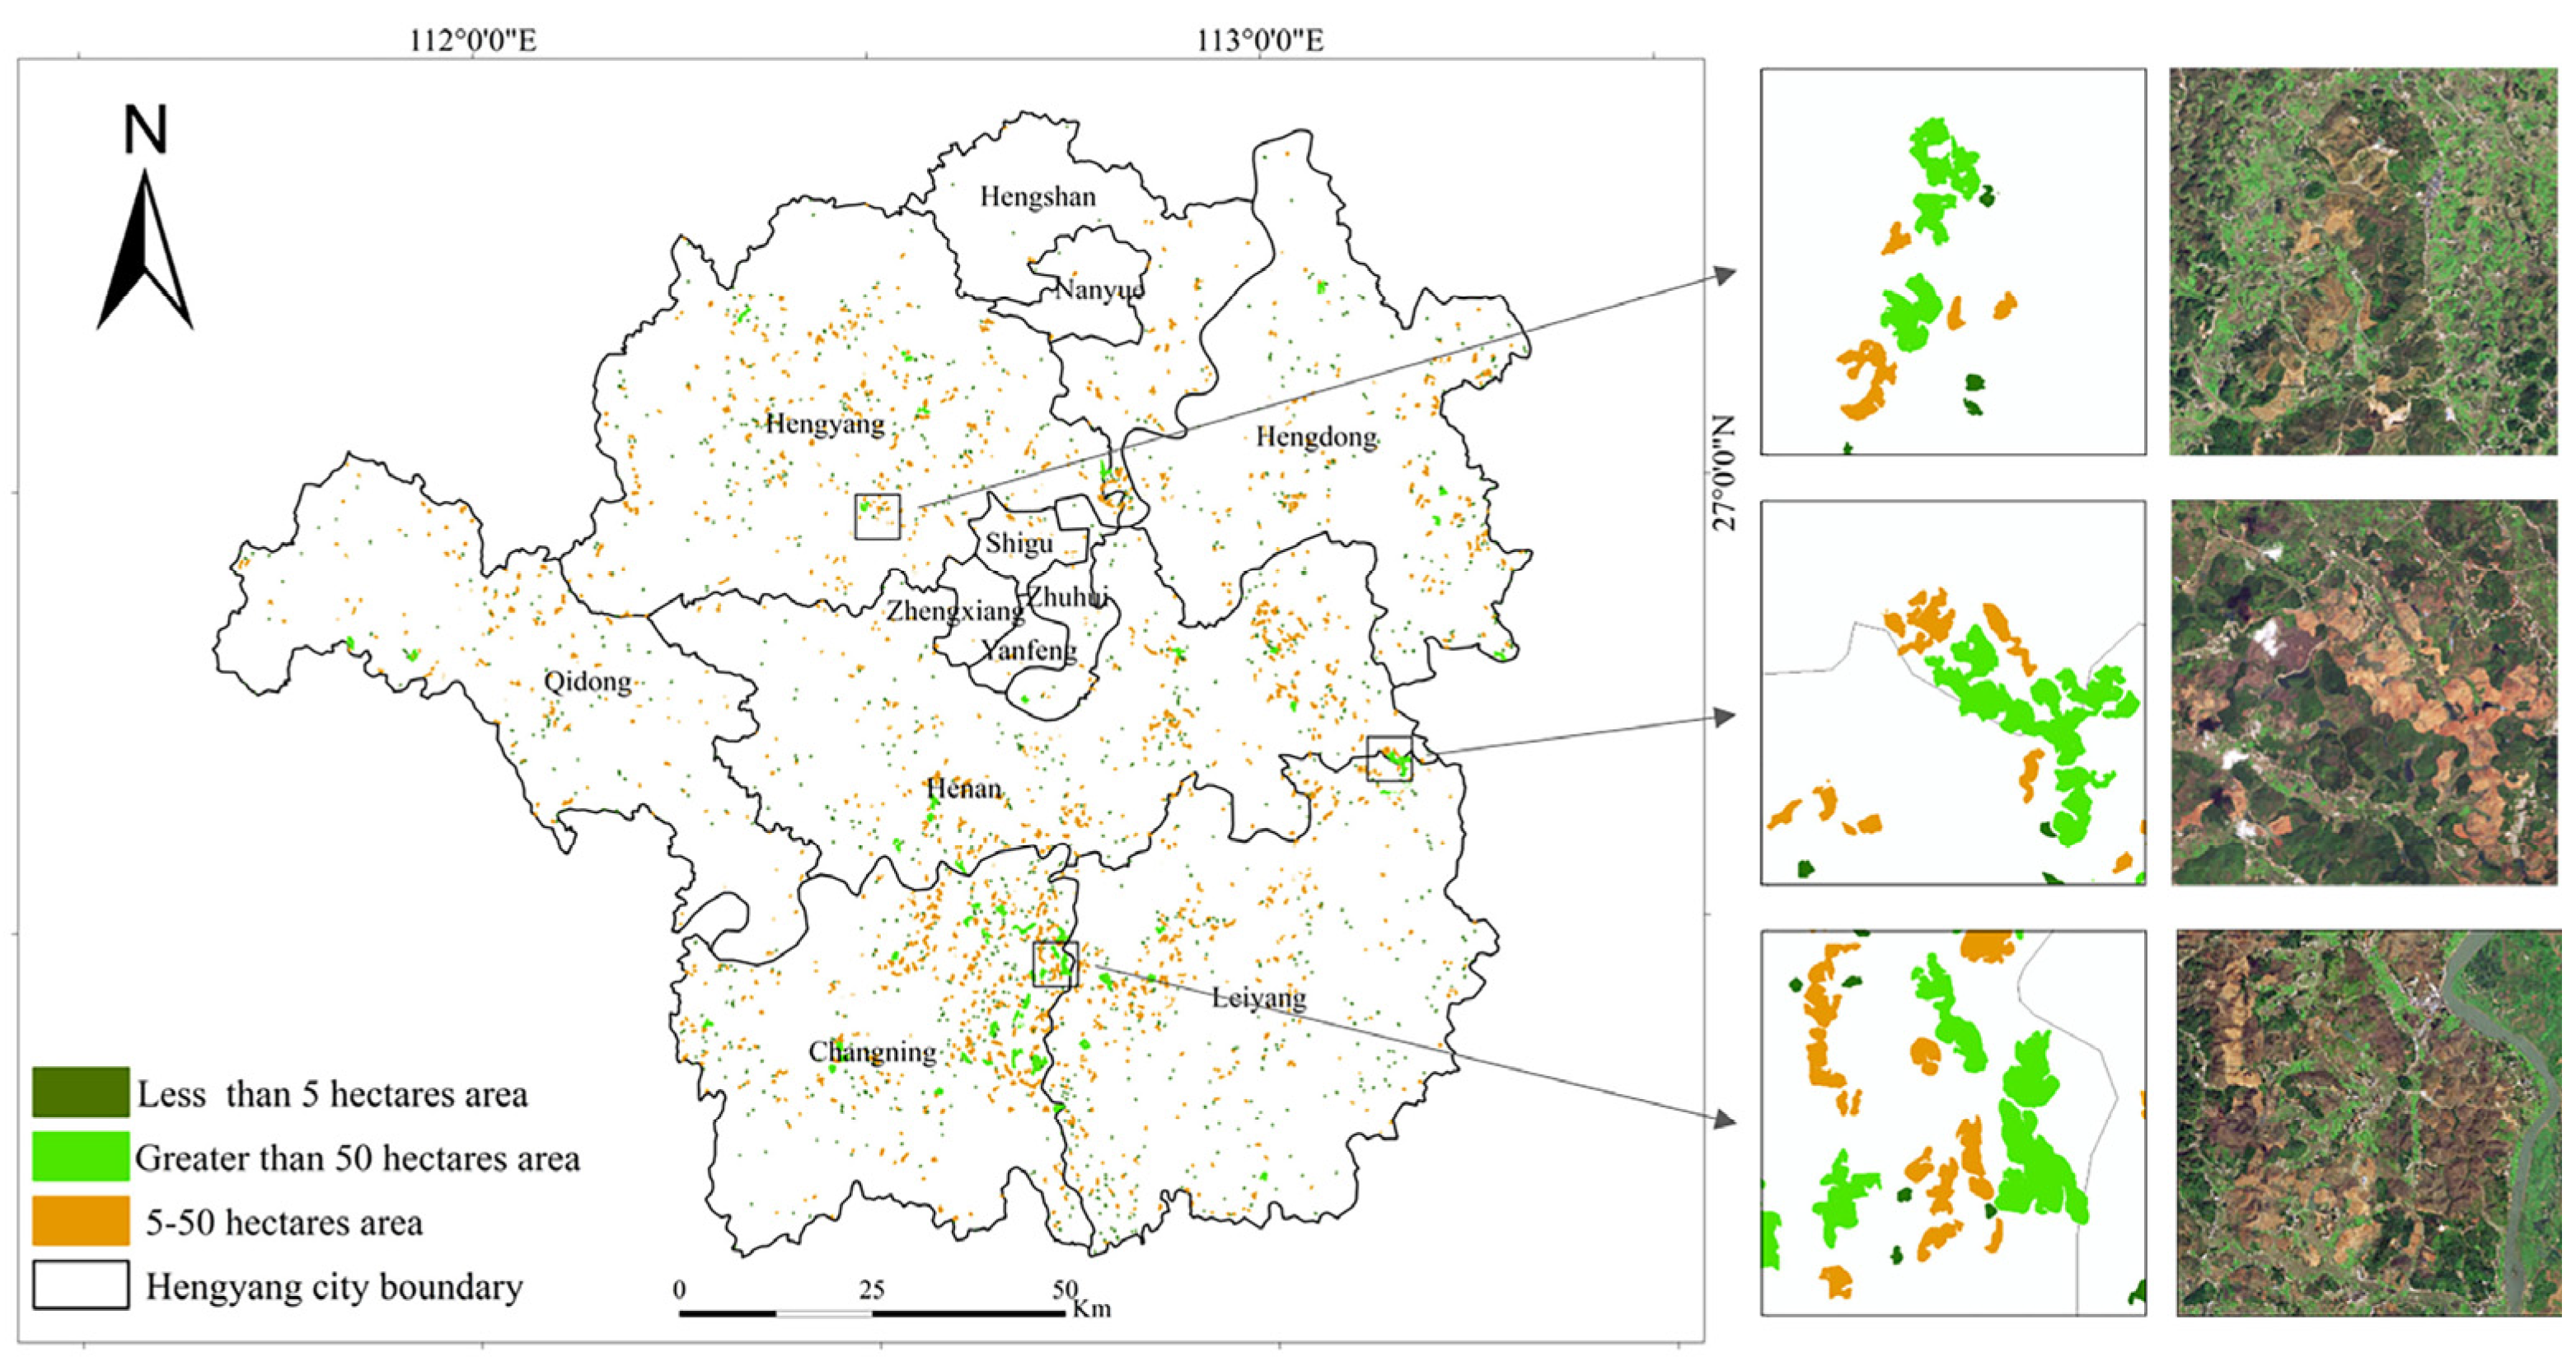
Figure 10 illustrates the distribution map of Camellia oleifera plantations in Hengyang City predicted using the enhanced U-Net++ network model. To further investigate the distribution of Camellia oleifera plantations across diverse scales, this study analyzed the plantation areas in Hengyang City based on three area gradients using the prediction results. In the range of 0–5 hectares, Camellia oleifera plantations exhibit a wide spatial distribution, covering various regions of Hengyang City. These smaller plantations can be found in urban, suburban, and rural areas, demonstrating the participation of local farmers and agricultural operators in Camellia oleifera cultivation. Within the 5–50 hectare range, these medium-sized Camellia oleifera plantations are primarily concentrated in regions characterized by intensive agricultural development and suitable conditions for Camellia oleifera cultivation. Conversely, within the range exceeding 50 hectares, the distribution of Camellia oleifera plantations is less prevalent. These large-scale Camellia oleifera plantations are primarily concentrated in key agricultural regions or within the scope of large enterprises.
Figure 11 reveals that Changning City exhibits the most extensive distribution of Camellia oleifera plantations, with Hengnan County and Leiyang City following closely, representing approximately 23.82%, 17.90%, and 17.52% of the total plantation area in Hengyang City, respectively. Conversely, in Zengxiang District, Yanfeng District, and Nanyue District, the distribution is significantly less dense, possibly influenced by factors like environmental conditions, land use, and population density.

3.5.2. Topographical Distribution Characteristics

As shown in Figure 12, utilizing the ArcMap10.7 software’s statistical analysis tool, we derived the area measurements of the Camellia oleifera plantations across various altitudes, orientations, and slopes. Figure 12a illustrates the spatial distribution of these plantations across altitude gradients. The majority of the Camellia oleifera plantations, approximately 89.7%, are found within altitudes of 50–200 m, followed by the 200–250 m and above 250 m zones, which constitute 5.4% and 4.9% of the total plantation area, respectively. Predominantly hilly and flat, these low-altitude areas (below 200 m) serve as residential areas and agricultural fields, thereby proving conducive to Camellia oleifera cultivation.
Figure 12b presents the spatial distribution of Camellia oleifera plantations across different slope orientations. The plantations are primarily located on the southeast and south slopes, comprising 17.6% and 60.7% of the total area, respectively. Given that orientation substantially influences sunlight radiation exposure, the south slope typically receives 1.6 to 2.3 times more light than the north slope, making the former, along with the southeast slope, more favorable for Camellia oleifera growth.
Finally, Figure 12c demonstrates the spatial distribution of these plantations across various slope categories. The majority of the plantations, about 92%, lie within the 5–15° slope category, succeeded by the 0–5° and 5–25° slope categories, which respectively constitute 2.13% and 5.83% of the Camellia oleifera plantation areas. For slopes exceeding 25°, the plantation density of the Camellia oleifera plantations noticeably decreases.

3.6. Aggregation Characteristics Analysis of Camellia oleifera Plantations

3.6.1. Global Moran’s Index

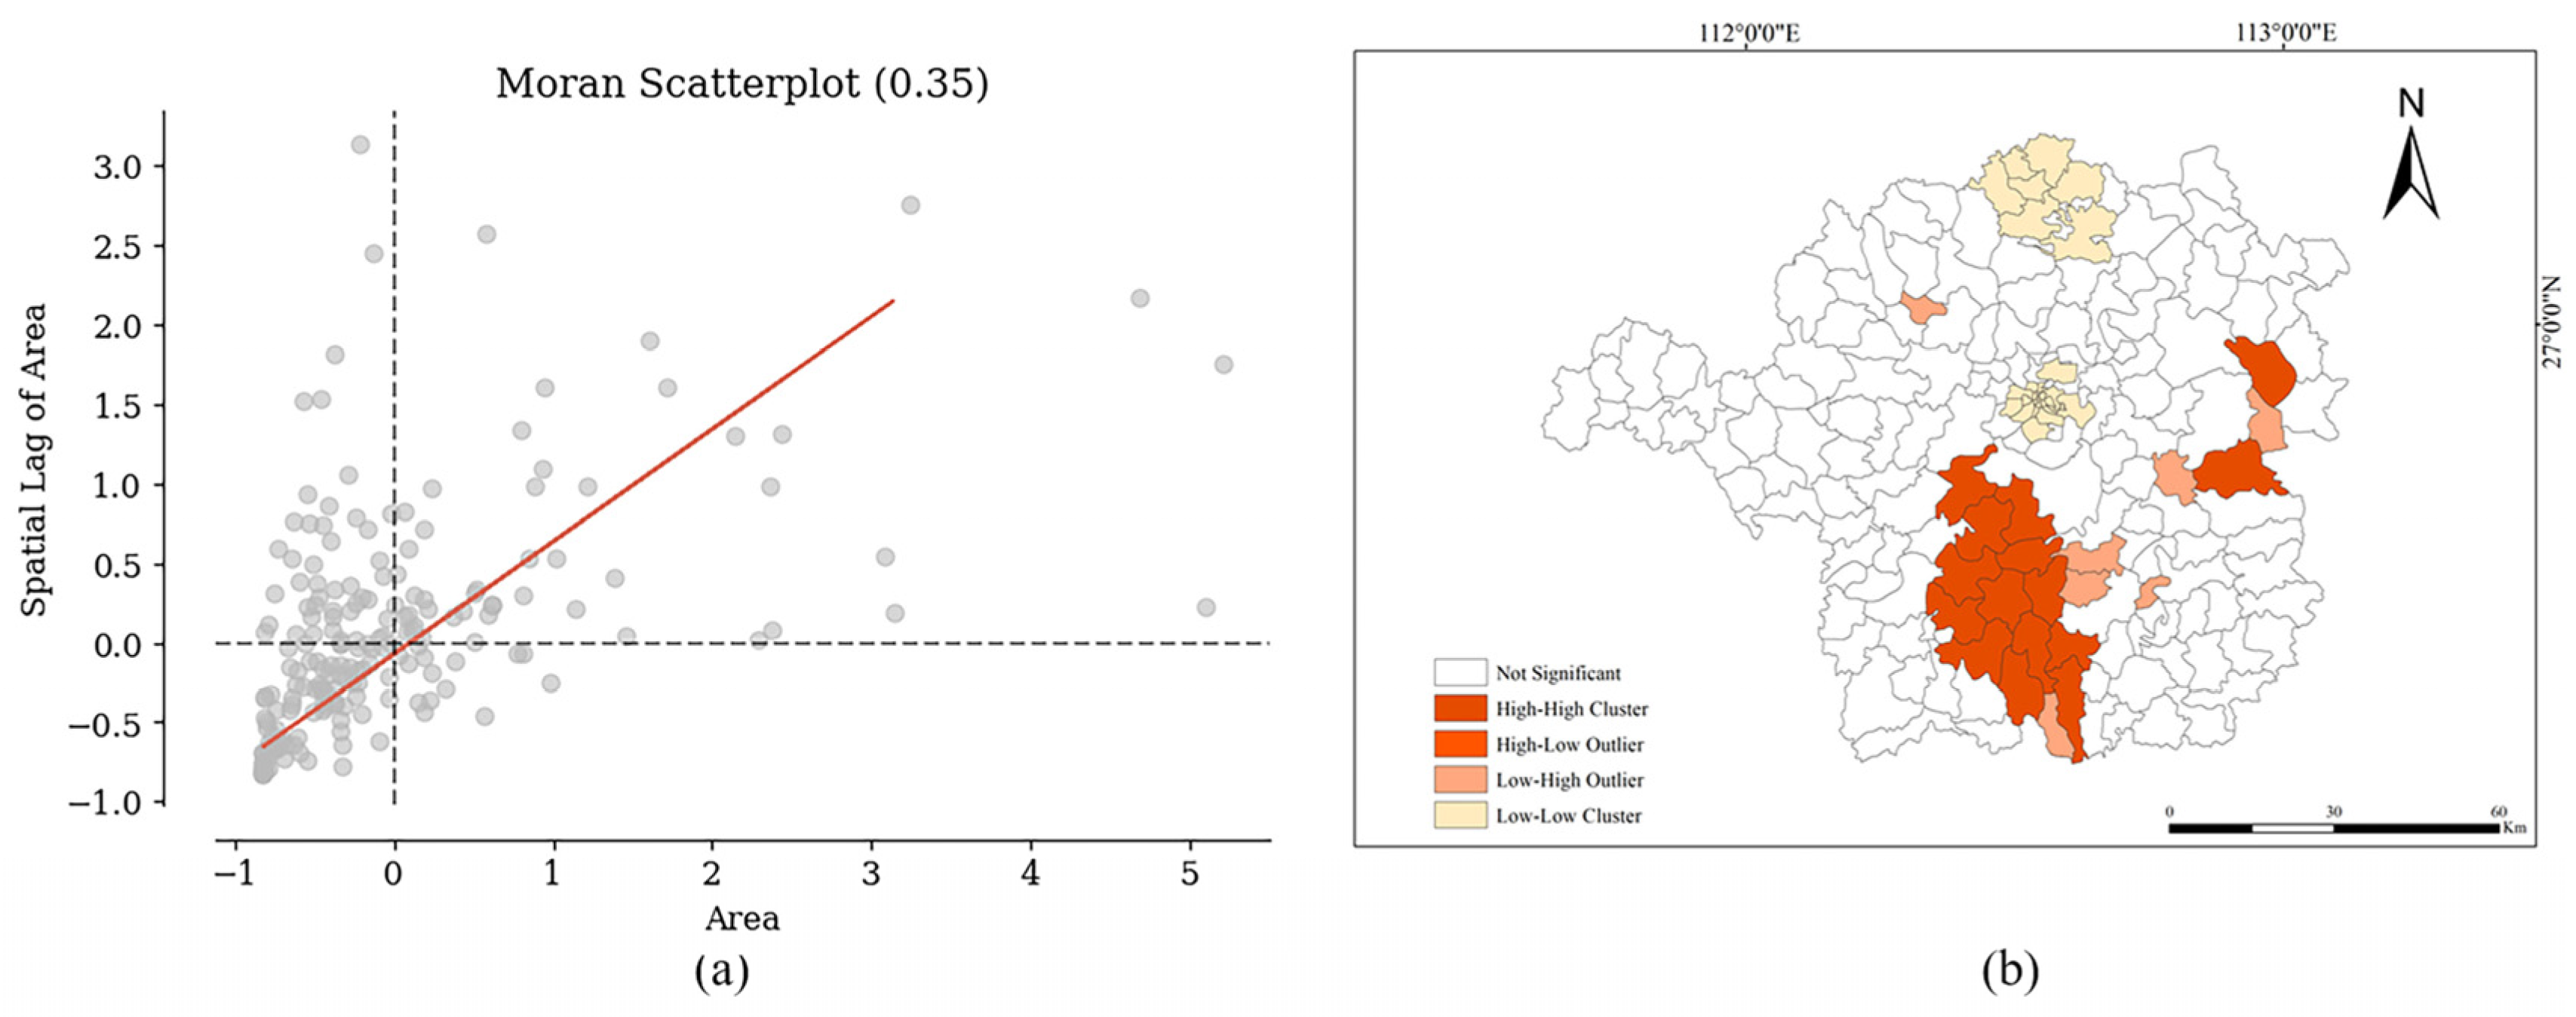
As shown in Figure 13a, the Global Moran’s Index test results indicate a relatively significant positive spatial correlation, with a Global Moran’s Index of 0.35 for the area of the Camellia oleifera plantations across the townships of Hengyang City in 2020. The p-value is 0.000000, statistically significant at less than 1%, and the Z-score is 8.23. This value indicates a notable aggregation trend among the plantations within the townships of Hengyang City.

3.6.2. Local Moran’s Index

The Local Moran’s Index, as presented in Figure 13b, reveals that the primary aggregation forms for the plantation areas within Hengyang City are high-high and low-low. Fifteen townships, including Yintian, Yanzhou, Xiling, and Baifang, manifest a high-high aggregation pattern of Camellia oleifera plantations. Conversely, in 28 townships, such as Baiguo, Lingpo, Guantang, and Jiangdong, a low-low aggregation pattern is observed. Within the highly aggregated areas, Camellia oleifera planting areas tend to be closely clustered, forming dense clusters of plantations. This clustering may be attributed to the uniformity in land use planning and agricultural policies among these townships, as well as shared factors such as terrain, soil, and climate. In the areas exhibiting low-low aggregation, factors such as terrain, soil, climate, urbanization, and population density contribute to the observed pattern. These regions may encounter challenges related to limited land resources, urban expansion, and economic development, resulting in a more dispersed distribution of Camellia oleifera planting areas.

3.7. Examination of Camellia oleifera Plantation Patch Fragmentation

This study presents an analysis of the patch structure within Camellia Oleifera plantations. The average patch area is found to be 56,562.7 square meters, accompanied by a fragmentation index of 0.177. These figures indicate a certain level of spatial fragmentation within the plantations, potentially leading to increased instances of fragmentation and separation, resulting in a dispersed and discontinuous spatial distribution. Factors such as urbanization, land development, and human activities may contribute to this fragmentation. Urbanization alters land use, potentially reducing the plantation area and causing further fragmentation. Human activities, like farmland cultivation and road construction, can also disrupt the spatial structure of the plantations, leading to patch isolation and fragmentation.

4. Discussion

This research endeavors to use GF-2 remote sensing imagery, utilizing deep learning models, to identify, analyze the spatial distribution of, and assess the clustering characteristics of newly established Camellia oleifera plantations. Over recent years, the expansion of Camellia oleifera plantations, while economically beneficial, has concurrently exerted specific impacts on local ecosystems and biodiversity. For example, extensive Camellia oleifera cultivation may modify land-use patterns and disrupt ecological equilibrium. Consequently, the accurate identification and surveillance of the distribution and proliferation of newly established Camellia oleifera plantation areas will enhance our understanding of the environmental and ecological impacts of this phenomenon, thereby furnishing scientific substantiation for prospective land-use planning and ecological preservation.

4.1. Performance Evaluation of Models

Figure 5 illustrates that the U-Net++ model demonstrates a smoother mIOU curve in the validation set, indicating its superior learning stability and generalization ability compared to other models. Furthermore, the U-Net++ model attains the highest performance in precision, recall, and F1 score among all models (Figure 6). Analyzing the segmentation maps of each model (Figure 7) reveals that the U-Net++ model produces recognition results for test samples that closely align with the manually labeled ground truth, especially in identifying the boundaries of Camellia oleifera plantation areas. This indicates its superior performance in accurately identifying Camellia oleifera plantation areas in high-resolution remote sensing imagery. Therefore, based on the test results using the self-developed dataset in this study, we conclude that the U-Net++ model is the optimal choice for identifying Camellia oleifera plantation areas. We acknowledge the significant challenge associated with the inability to generate a comprehensive and precise map detailing the distribution of Camellia oleifera plantations in Hengyang City. To address this issue, we employed a strategic methodology. We identified four representative plantation areas, and a thorough comparison between the model’s predictive outcomes and the manually labeled was conducted, as depicted in Figure 9. This evaluation objectively appraises the model’s precision and efficacy. Evidently, the findings underscore the model’s adeptness at identifying intricate patterns within complex Camellia oleifera plantation landscapes. Nevertheless, instances of missed and false detections continue to occur, potentially due to sudden changes in texture brightness or the high similarity of land features.
The uncertainty of the model is one of the primary factors leading to this issue. For instance, firstly, the design of the model’s structure, such as the dense skip connections and nested skip connections adopted by U-Net++, enhances the model’s performance but might also increase its complexity and the risk of overfitting. Secondly, the performance of U-Net++ largely depends on the quality and quantity of the training data. If there are errors in the annotations of the Camellia oleifera plantations in the training data or if the sample size is insufficient, the model might not accurately capture the true distribution characteristics of the Camellia oleifera plantations, thereby affecting its extraction results.
Moreover, exogenous information has a potential positive impact in several aspects, such as improving model performance, enhancing model generalization capabilities, and reducing model uncertainty. For instance, external data such as geographical data, soil types, and climate information can be combined with remote sensing image data, aiding in better identification of Camellia oleifera plantations. Additionally, external land-use data can assist the model in excluding areas known not to contain Camellia oleifera plantations, thereby reducing the likelihood of false detections. In future research, we will continue to explore the application of these methods to further enhance the efficiency and accuracy of Camellia oleifera plantation extraction tasks.

4.2. The Distribution of Camellia oleifera Plantations in Hengyang City

An analysis was conducted on the distribution of Camellia oleifera plantations at different scales (Figure 10). Firstly, plantations with an area of less than five8 hectares typically result from individual farmers efficiently utilizing small land parcels. Due to the relatively abundant and cost-effective land resources available for such small plots, these small-scale plantations are widely distributed. Secondly, Camellia oleifera plantations ranging from 5 to 50 hectares are primarily managed and operated by large-scale entities specializing in this type of cultivation. These medium-sized plantations tend to be concentrated in areas that are more suitable for Camellia oleifera growth. Lastly, Camellia oleifera plantations exceeding 50 hectares are typically established by large enterprises or government institutions. These entities prioritize land quality and sustainability when selecting plantation areas, resulting in fewer large-scale plantations. This reflects the increased demand for land resources and capital investment associated with the large-scale cultivation of Camellia oleifera.
With respect to the overall distribution (Figure 11), Changning City and Leiyang City host a relatively larger proportion of Camellia oleifera plantations, accounting for 23.82% and 17.90% of the total plantation area in Hengyang City, respectively. In contrast, the distribution of Camellia oleifera plantations in Zhengxiang District, Yanfeng District, and Nanyue District is relatively sparse. This distribution pattern may be influenced by factors such as natural environmental conditions, land utilization, government policies, and population density. For instance, Changning City and Leiyang City demonstrate a heightened focus on the Camellia oleifera industry, with substantial government and business resources dedicated to its cultivation. Additionally, the favorable climatic and topographical conditions in these regions are conducive to Camellia oleifera growth. Conversely, Zhengxiang District’s mostly flat terrain supports the cultivation of other crops, such as rice and vegetables. Nanyue District and other areas with rugged topography may limit the extent of Camellia oleifera cultivation. Furthermore, high population density can lead to competition and constraints in land resource utilization.

4.3. The Distribution Characteristics of Camellia oleifera Plantations on Different Terrains

Statistical analysis tools in ArcMap 10.7 were employed in this study to systematically examine the distribution of Camellia oleifera plantations across divergent altitudes, slopes, and aspects. The findings revealed that Camellia oleifera plantations in Hengyang City predominantly localize in mountainous and hilly regions. These are situated at altitudes ranging from 50 to 200 m, with slopes less than 25°, and facing south or southeast. This observation aligns with the terrain conditions deemed favorable for Camellia oleifera cultivation, thereby augmenting the reliability and validity of our research outcomes.
In areas of lower altitude, the concentration of Camellia oleifera plantations is comparatively higher, while at altitudes above 250 m, minimal human intervention renders these zones unsuitable for Camellia oleifera cultivation. In southeastern and southern aspects, owing to their increased potential for sunlight exposure relative to other directions, the ambient temperature tends to be higher, creating a warmer environment that favors Camellia oleifera growth. Concerning slope, steeper gradients can intensify soil erosion and moisture loss, making these areas unfit for plantations. The complex terrain impedes human activity, further heightening the unsuitability of these regions for Camellia oleifera cultivation. Conversely, excessively flat slopes may cause waterlogging, which can trigger root rot disease in Camellia oleifera plants, thus hampering their growth. Overall, the insights from this research have substantial significance for the planning and management of Camellia oleifera plantations in Hengyang City.

4.4. Spatial Aggregation Analysis of Camellia oleifera Plantations

The Global Moran’s index, at a positive value of 0.353678, coupled with a z-score of 8.23, indicates a significant spatial correlation among Camellia oleifera plantation areas. The Local Moran’s index highlights the presence of high-high and low-low aggregations. This pattern is influenced by the city’s terrain and land use types; hilly areas encourage denser planting, forming high-high aggregation areas, while towns and populous areas, where land is primarily used for urban development and habitation, limit agricultural space, leading to the dispersion of Camellia oleifera plantation areas and the formation of low-low aggregation phenomena. This spatial aggregation underscores the similarities and interactions among Camellia oleifera plantations across Hengyang’s townships, providing a valuable framework for future planning and decision-making. The research acknowledges certain limitations in its spatial analysis. While the current methodology reveals the spatial clustering tendencies of Camellia oleifera plantations, it may not fully capture the intricacies and complexities of spatial variations and relationships at the micro level. To gain a more precise understanding of the spatial distribution of Camellia oleifera plantations, we intend to explore and adopt advanced spatial analysis techniques [35,36] in the future.

4.5. Examination of Camellia oleifera Plantation Patch Fragmentation

By analyzing the fragmentation degree within Camellia oleifera plantation patches, we identified a certain level of spatial fragmentation, likely influenced by urbanization, land development, and human activities. Future management and planning processes should consider measures to optimize the spatial pattern of these plantations. This could involve promoting connectivity between smaller patches, reducing dispersed patches, and enhancing spatial continuity and stability. Such initiatives would contribute to ecological preservation and promote the sustainable development of Camellia oleifera plantations.

4.6. Outlook

This study focuses on the identification and analysis of Camellia oleifera plantations for a specific year and has not yet addressed its dynamic changes over a longer time span. Considering the significance of Camellia oleifera cultivation in China, we anticipate a comprehensive optimization and adjustment of the model architecture and training strategies in subsequent research. By leveraging the efficient learning and recognition mechanisms of deep neural network models, we aim to precisely identify Camellia oleifera plantations from different periods and regions, thereby achieving dynamic monitoring of large-scale planting areas. Furthermore, we hope to extend this technology to the delineation of plantations for other economic crops, aiming for broader applications.
In future research endeavors, the incorporation of remote sensing datasets, meteorological insights, and geospatial information emerges as a promising approach to enrich and extend the analysis of the dynamic alterations in the distributions of Camellia oleifera plantations. It is crucial to recognize that, despite the inherent strengths of our research, several limitations persist. Elements such as data accessibility and integrity, obstructions in land features, and climatic conditions can introduce potential inaccuracies or ambiguities. A meticulous comparative analysis with existing methodologies is a crucial aspect of future studies, aiming to clarify the advantages and constraints inherent in our methodology. In upcoming endeavors, we aim to explore wider application domains, such as land-use strategizing and environmental surveillance, to maximize the inherent value of the distribution data of Camellia oleifera plantations.

5. Conclusions

This study integrated deep learning techniques with the GF-2 remote sensing data from 2020. Using the U-Net++ model, it accurately identified the newly established Camellia oleifera plantation areas in Hengyang city and conducted spatial analysis based on their distribution. This exploration holds substantial importance for land use and related fields, while also providing valuable references for the future planning and management of Camellia oleifera planting areas.
Firstly, various deep-learning models were compared and evaluated using a self-created dataset of Camellia oleifera plantation areas. The results demonstrated that the U-Net++ model performed well, accurately identifying Camellia oleifera plantation areas within high-resolution remote sensing images and displaying robust generalization capabilities. The optimized model was then applied to predict the distribution of Camellia oleifera plantation areas throughout Hengyang City, providing valuable insights into distribution patterns for different plantation scales. The distribution of Camellia oleifera plantation areas was influenced by factors such as elevation, slope, and slope orientation, with suitable topographical conditions contributing to their formation. Furthermore, an initial examination of the spatial attributes of these forecasted areas indicates a significant level of cultivation in the majority of townships. These plantations are predominantly marked by high and low agglomerations, with noticeable fragmentation. Such patterns have a strong correlation with local trends, soil conditions, population density, and agricultural strategies.

Author Contributions

Y.L., Methodology, Software, Validation, Data curation, Writing—original draft, Visualization; D.M., Conceptualization, Methodology, Data curation, Resources, Supervision, Funding acquisition; E.Y., Conceptualization, Methodology, Data curation, Investigation, Writing—review & editing; J.J., Methodology, Software, Validation, Investigation; D.C., Investigation, Validation, Resources. All authors have read and agreed to the published version of the manuscript.

Funding

This research was funded by the Project Technology Innovation Plan Project of Hunan Provincial Forestry Department under Grant XLK202108-8; in part by the National Natural Science Foundation of China under Grant 32071682 and Grant 31901311; in part by the Open Innovation Fund Project: A Study on Disturbance Range Identification in Production Construction Projects Utilizing Deep Learning under Grant 20K149.

Data Availability Statement

Not applicable.

Conflicts of Interest

The authors declare no conflict of interest.

References

  1. Deng, Q.; Li, J.; Gao, C.; Cheng, J.; Deng, X.; Jiang, D.; Li, L.; Yan, P. New perspective for evaluating the main Camellia oleifera cultivars in China. Sci. Rep. 2020, 10, 20676. [Google Scholar] [CrossRef]
  2. Rogan, J.; Chen, D. Remote sensing technology for mapping and monitoring land-cover and land-use change. Prog. Plan. 2004, 61, 301–325. [Google Scholar] [CrossRef]
  3. Prokop, P. Tea plantations as a driving force of long-term land use and population changes in the Eastern Himalayan piedmont. Land Use Policy 2018, 77, 51–62. [Google Scholar] [CrossRef]
  4. Wei, Y.; Tong, X.; Chen, G.; Liu, D.; Han, Z. Remote detection of large-area crop types: The role of plant phenology and topography. Agriculture 2019, 9, 150. [Google Scholar] [CrossRef]
  5. Xu, X.; Zhang, L.; Chen, L.; Wei, F. Does COVID-2019 have an impact on the purchase intention of commercial long-term care insurance among the elderly in China? Healthcare 2020, 8, 126. [Google Scholar] [CrossRef]
  6. Shanahan, J.F.; Schepers, J.S.; Francis, D.D.; Varvel, G.E.; Wilhelm, W.W.; Tringe, J.M.; Schlemmer, M.R.; Major, D.J. Use of remote-sensing imagery to estimate corn grain yield. Agron. J. 2001, 93, 583–589. [Google Scholar] [CrossRef]
  7. Danylo, O.; Pirker, J.; Lemoine, G.; Ceccherini, G.; See, L.; McCallum, I.; Hadi; Kraxner, F.; Achard, F.; Fritz, S. A map of the extent and year of detection of oil palm plantations in Indonesia, Malaysia and Thailand. Sci. Data 2021, 8, 96. [Google Scholar] [CrossRef]
  8. Xiao, X.; Boles, S.; Frolking, S.; Li, C.; Babu, J.Y.; Salas, W.; Moore, B., III. Mapping paddy rice agriculture in South and Southeast Asia using multi-temporal MODIS images. Remote Sens. Environ. 2006, 100, 95–113. [Google Scholar] [CrossRef]
  9. Zhao, C. Advances of research and application in remote sensing for agriculture. Nongye Jixie Xuebao/Trans. Chin. Soc. Agric. Mach. 2014, 45, 277–293. [Google Scholar]
  10. Deng, L. The mnist database of handwritten digit images for machine learning research [best of the web]. IEEE Signal Process. Mag. 2012, 29, 141–142. [Google Scholar] [CrossRef]
  11. Brown, J.C.; Kastens, J.H.; Coutinho, A.C.; de Castro Victoria, D.; Bishop, C.R. Classifying multiyear agricultural land use data from Mato Grosso using time-series MODIS vegetation index data. Remote Sens. Environ. 2013, 130, 39–50. [Google Scholar] [CrossRef]
  12. Julien, Y.; Sobrino, J.A.; Jiménez-Muñoz, J.-C. Land use classification from multitemporal Landsat imagery using the Yearly Land Cover Dynamics (YLCD) method. Int. J. Appl. Earth Obs. Geoinf. 2011, 13, 711–720. [Google Scholar] [CrossRef]
  13. Descals, A.; Szantoi, Z.; Meijaard, E.; Sutikno, H.; Rindanata, G.; Wich, S. Oil palm (Elaeis guineensis) mapping with details: Smallholder versus industrial plantations and their extent in Riau, Sumatra. Remote Sens. 2019, 11, 2590. [Google Scholar] [CrossRef]
  14. Guo, Y.; Liu, Y.; Georgiou, T.; Lew, M.S. A review of semantic segmentation using deep neural networks. Int. J. Multimed. Inf. Retr. 2018, 7, 87–93. [Google Scholar] [CrossRef]
  15. Garcia-Garcia, A.; Orts-Escolano, S.; Oprea, S.; Villena-Martinez, V.; Garcia-Rodriguez, J. A review on deep learning techniques applied to semantic segmentation. arXiv 2017, arXiv:1704.06857. [Google Scholar]
  16. Gao, L.; Liu, H.; Yang, M.; Chen, L.; Wan, Y.; Xiao, Z.; Qian, Y. STransFuse: Fusing swin transformer and convolutional neural network for remote sensing image semantic segmentation. IEEE J. Sel. Top. Appl. Earth Obs. Remote Sens. 2021, 14, 10990–11003. [Google Scholar] [CrossRef]
  17. Long, J.; Shelhamer, E.; Darrell, T. Fully convolutional networks for semantic segmentation. In Proceedings of the IEEE Conference on Computer Vision and Pattern Recognition, Boston, MA, USA, 7–12 June 2015; pp. 3431–3440. [Google Scholar]
  18. Zhou, Z.; Li, S. Peanut planting area change monitoring from remote sensing images based on deep learning. In Proceedings of the 2017 4th International Conference on Systems and Informatics (ICSAI), Hangzhou, China, 11–13 November 2017; pp. 1358–1362. [Google Scholar]
  19. Ronneberger, O.; Fischer, P.; Brox, T. U-net: Convolutional networks for biomedical image segmentation. In Proceedings of the Medical Image Computing and Computer-Assisted Intervention–MICCAI 2015: 18th International Conference, Munich, Germany, 5–9 October 2015; pp. 234–241. [Google Scholar]
  20. Wei, S.; Zhang, H.; Wang, C.; Wang, Y.; Xu, L. Multi-temporal SAR data large-scale crop mapping based on U-Net model. Remote Sens. 2019, 11, 68. [Google Scholar] [CrossRef]
  21. Zhou, Z.; Siddiquee, M.M.R.; Tajbakhsh, N.; Liang, J. Unet++: Redesigning skip connections to exploit multiscale features in image segmentation. IEEE Trans. Med. Imaging 2019, 39, 1856–1867. [Google Scholar] [CrossRef]
  22. Zhou, Z.; Siddiquee, M.; Tajbakhsh, N.; Liang, J.U. A nested U-Net architecture for medical image segmentation. arXiv 2018, arXiv:1807.10165. [Google Scholar]
  23. Tu, J.; Chen, J.; Zhou, J.; Ai, W.; Chen, L. Plantation quality assessment of Camellia oleifera in mid-subtropical China. Soil Tillage Res. 2019, 186, 249–258. [Google Scholar] [CrossRef]
  24. Hoorali, F.; Khosravi, H.; Moradi, B. Automatic Bacillus anthracis bacteria detection and segmentation in microscopic images using UNet++. J. Microbiol. Methods 2020, 177, 106056. [Google Scholar] [CrossRef] [PubMed]
  25. Chen, L.-C.; Zhu, Y.; Papandreou, G.; Schroff, F.; Adam, H. Encoder-decoder with atrous separable convolution for semantic image segmentation. In Proceedings of the European Conference on Computer Vision (ECCV), Munich, Germany, 8–14 September 2018; pp. 801–818. [Google Scholar]
  26. Chaurasia, A.; Culurciello, E. Linknet: Exploiting encoder representations for efficient semantic segmentation. In Proceedings of the 2017 IEEE Visual Communications and Image Processing (VCIP), Petersburg, FL, USA, 10–13 December 2017; pp. 1–4. [Google Scholar]
  27. Xiang, J.; Xing, Y.; Wei, W.; Yan, E.; Jiang, J.; Mo, D. Dynamic Detection of Forest Change in Hunan Province Based on Sentinel-2 Images and Deep Learning. Remote Sens. 2023, 15, 628. [Google Scholar] [CrossRef]
  28. Langer, S. Approximating smooth functions by deep neural networks with sigmoid activation function. J. Multivar. Anal. 2021, 182, 104696. [Google Scholar] [CrossRef]
  29. Badrinarayanan, V.; Kendall, A.; Cipolla, R. Segnet: A deep convolutional encoder-decoder architecture for image segmentation. IEEE Trans. Pattern Anal. Mach. Intell. 2017, 39, 2481–2495. [Google Scholar] [CrossRef]
  30. Hand, D.; Christen, P. A note on using the F-measure for evaluating record linkage algorithms. Stat. Comput. 2018, 28, 539–547. [Google Scholar] [CrossRef]
  31. Wu, D.; Wang, P.; Huo, Z.; Yuan, X.; Jiang, H.; Yang, J.; Tang, J.; Ma, Y. Changes in climate suitability for oil-tea (C. oleifera Abel) production in China under historical and future climate conditions. Agric. For. Meteorol. 2022, 316, 108843. [Google Scholar] [CrossRef]
  32. Fu, W.J.; Jiang, P.K.; Zhou, G.M.; Zhao, K.L. Using Moran’s I and GIS to study the spatial pattern of forest litter carbon density in a subtropical region of southeastern China. Biogeosciences 2014, 11, 2401–2409. [Google Scholar] [CrossRef]
  33. Bryan-Brown, D.N.; Connolly, R.M.; Richards, D.R.; Adame, F.; Friess, D.A.; Brown, C.J. Global trends in mangrove forest fragmentation. Sci. Rep. 2020, 10, 7117. [Google Scholar] [CrossRef]
  34. Ma, J.; Li, J.; Wu, W.; Liu, J. Global forest fragmentation change from 2000 to 2020. Nat. Commun. 2023, 14, 3752. [Google Scholar] [CrossRef]
  35. Qi, J.; Lu, Y.; Han, F.; Ma, X.; Yang, Z. Spatial distribution characteristics of the rural tourism villages in the Qinghai-Tibetan Plateau and its influencing factors. Int. J. Environ. Res. Public Health 2022, 19, 9330. [Google Scholar] [CrossRef]
  36. Toosi, N.B.; Soffianian, A.R.; Fakheran, S.; Waser, L.T. Mapping disturbance in mangrove ecosystems: Incorporating landscape metrics and PCA-based spatial analysis. Ecol. Indic. 2022, 136, 108718. [Google Scholar] [CrossRef]
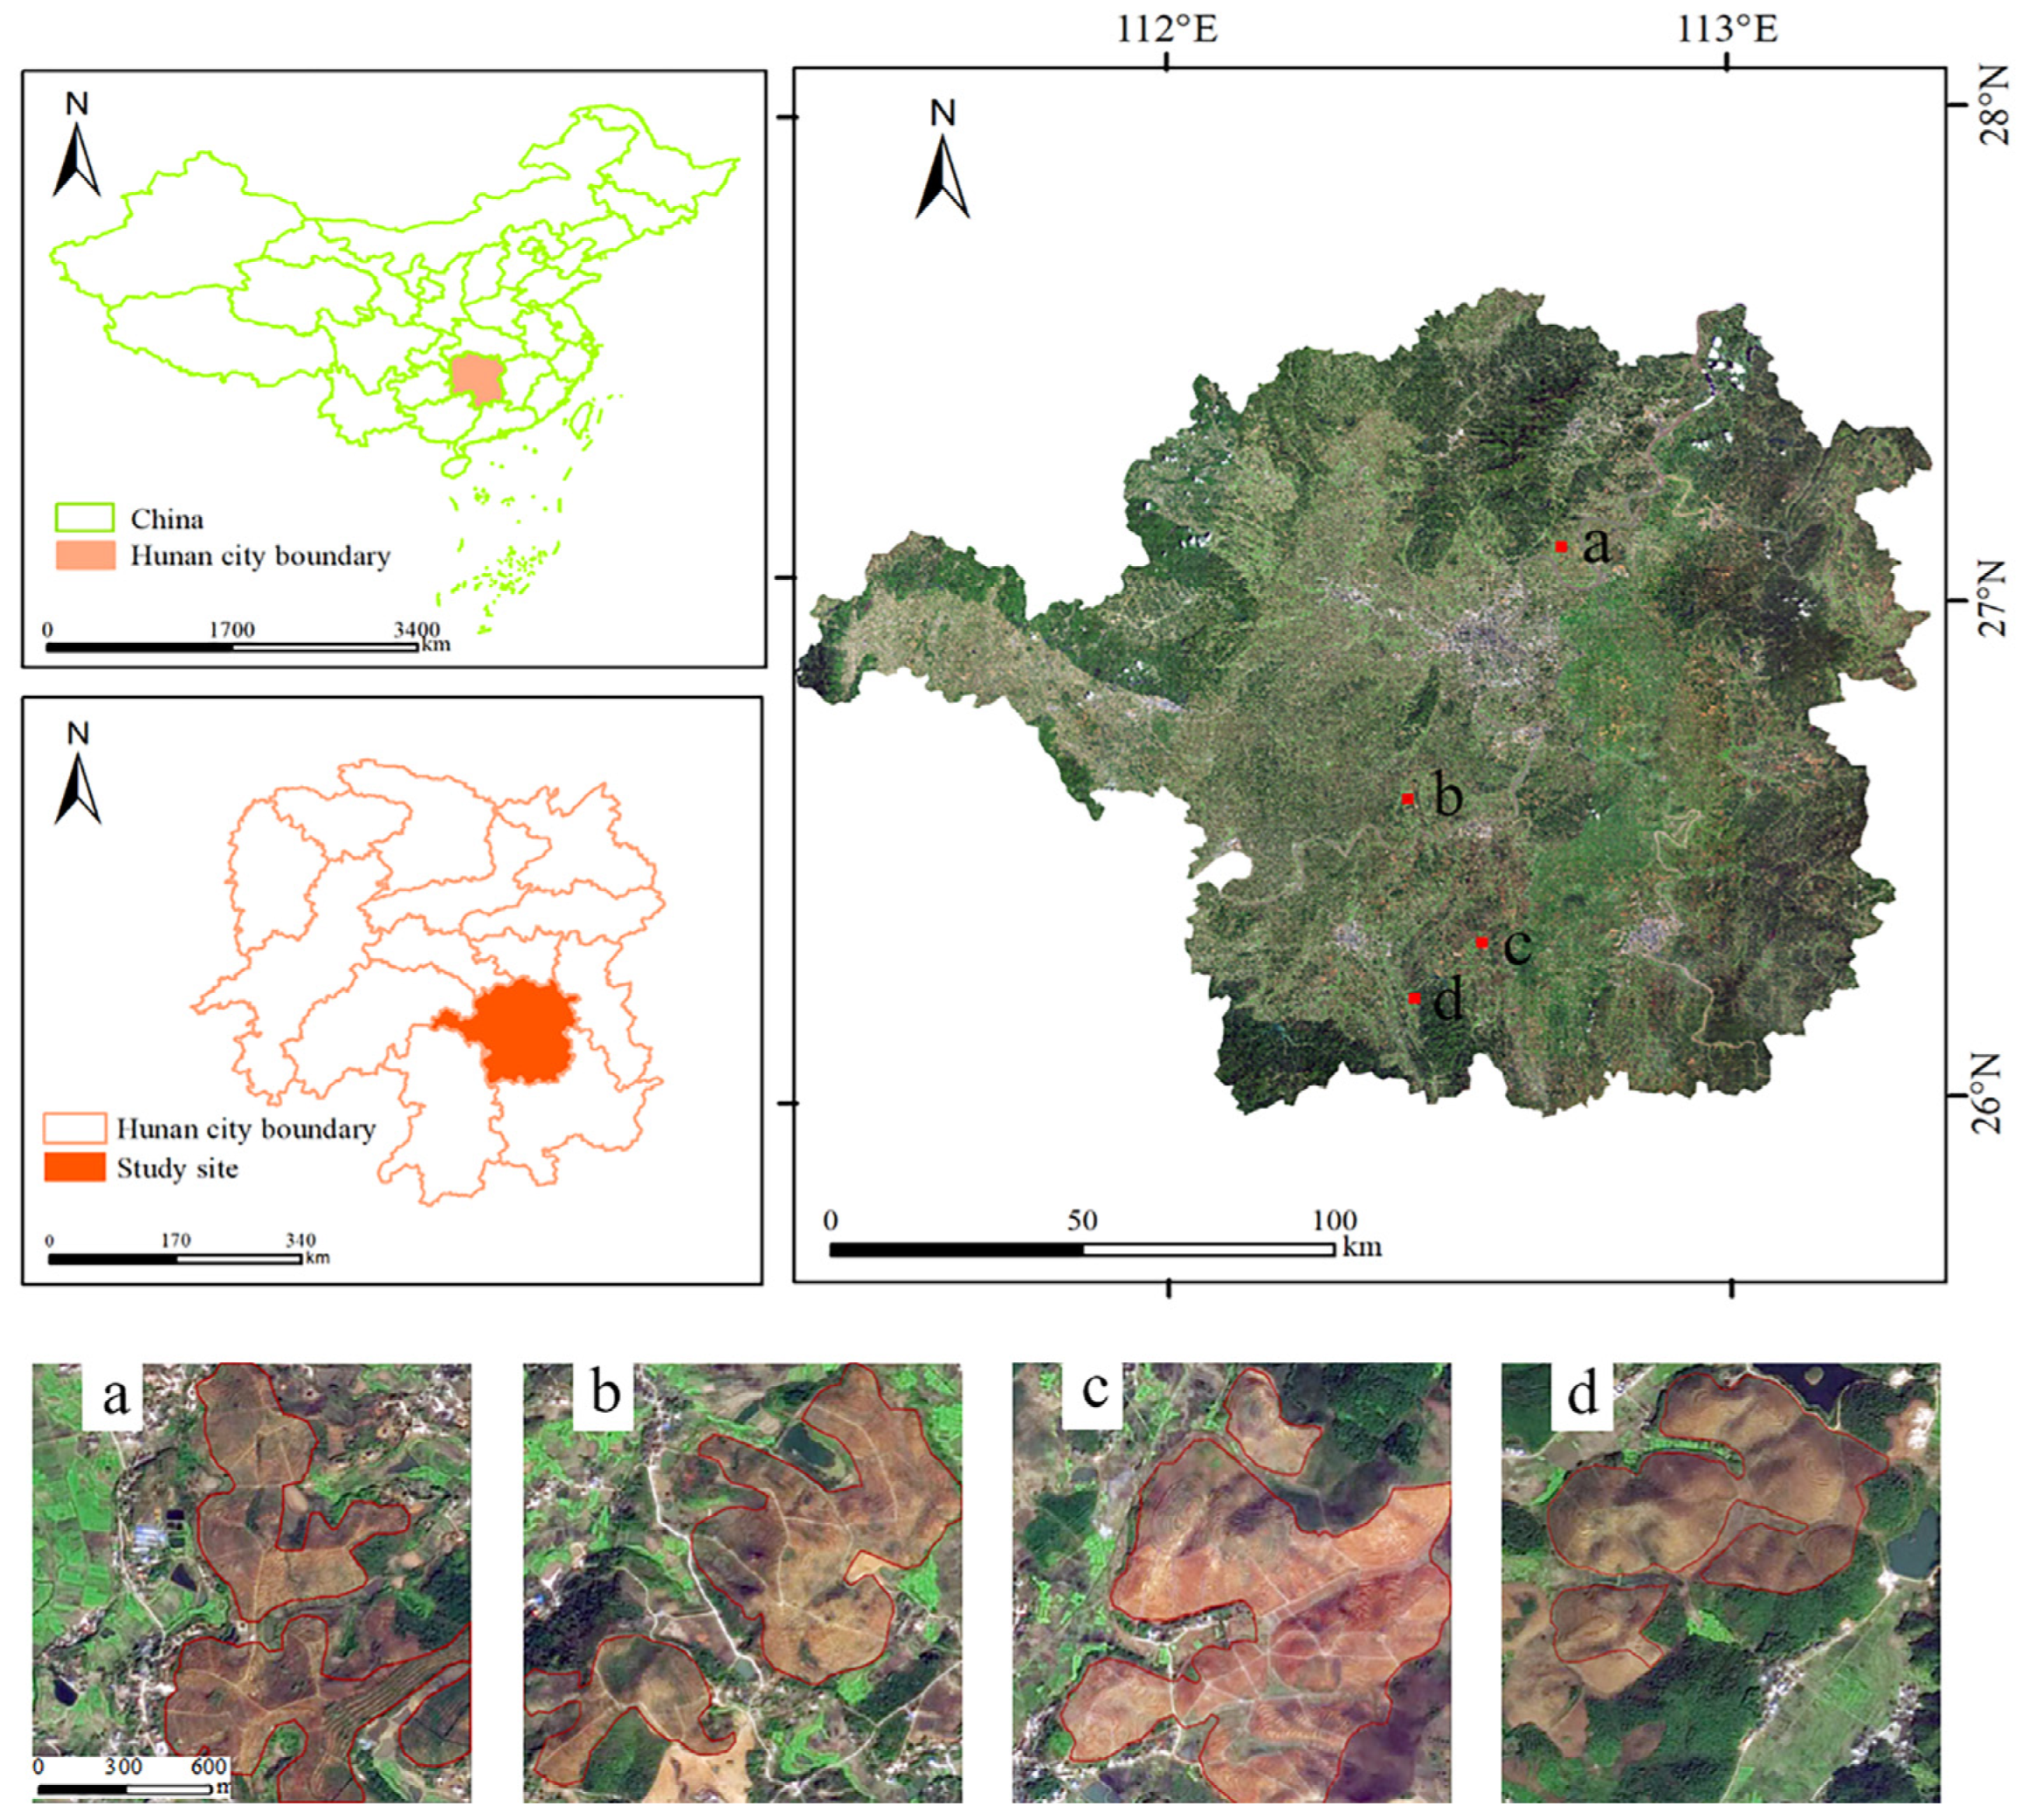
Figure 1. Overview of the study area in Hengyang, Hunan Province, China; (ad) are enlarged views of four typical Camellia oleifera plantation areas.
Remotesensing 15 05218 g001
Figure 2. GF-2 imagery of Camellia oleifera plantations.
Remotesensing 15 05218 g002
Figure 3. Flow chart of Camellia oleifera plantation identification and spatial distribution analysis.
Remotesensing 15 05218 g003
Figure 4. Schematic diagram of the U-net++ network model structure.
Remotesensing 15 05218 g004
Figure 5. Comparison of efficiency in training and validating network models.
Remotesensing 15 05218 g005
Figure 6. Accuracy metric of each model on the test dataset.
Remotesensing 15 05218 g006
Figure 7. Model extraction results.
Remotesensing 15 05218 g007
Figure 8. Spatial distribution map of validation points.
Remotesensing 15 05218 g008
Figure 9. Visualization of U-Net++ model predictions for Camellia oleifera plantations in areas (ad).
Remotesensing 15 05218 g009
Figure 10. Predicted results map of Camellia oleifera plantations.
Remotesensing 15 05218 g010
Figure 11. Area and proportion of Camellia oleifera plantations.
Remotesensing 15 05218 g011
Figure 12. Spatial distribution characteristics of Camellia oleifera plantations: (a) The spatial distribution of Camellia oleifera plantations at different elevation zones in GF-2 images; (b) The spatial distribution of Camellia oleifera plantations in different aspect zones in GF-2 images; (c) The spatial distribution of Camellia oleifera plantations in different slope zones in GF-2 images.
Remotesensing 15 05218 g012
Figure 13. (a) Scatter plot of Moran’s Index: The red line in Moran’s scatterplot represents the trend of spatial autocorrelation;(b) Camellia oleifera plantation areas in Hengyang City: A Local Moran’s I profile map.
Remotesensing 15 05218 g013
Table 1. Data sources.
Data SeriesName of DataData SourceSpatial Resolution (m)Time
Remote sensing dataGF-2Academy of Forestry Inventory and Planning, State Forestry, Administration,
China
22020
DEMSRTM30/
Auxiliary DataWoodland Resources MapAcademy of Forestry Inventory and Planning, State Forestry, Administration,
China
/2020
Google Earth imageGoogle Maps Platform0.52020
Table 2. Samples in the dataset.
DatasetTrain DatasetVal DatasetTest DatasetAll Dataset
Number of samples61117647647639
Table 3. Validation points confusion matrix of the Camellia oleifera plantation map.
Map Data
Other CropsCamellia oleiferaTotalProducer’s Accuracy
Hengnan County
Validation DataOther Crops1591717690.34%
Camellia oleifera1916218189.50%
Total178179357
User’s Accuracy89.33%90.50%
Overall Accuracy89.92%
Qidong County
Validation DataOther Crops1301014092.86%
Camellia oleifera2311313683.09%
Total153123276
User’s Accuracy84.97%91.87%
Overall Accuracy87.98%
Hengdong County
Validation DataOther Crops117812593.60%
Camellia oleifera1211212490.32%
Total129120249
User’s Accuracy90.70%93.33%
Overall Accuracy93.40%
Disclaimer/Publisher’s Note: The statements, opinions and data contained in all publications are solely those of the individual author(s) and contributor(s) and not of MDPI and/or the editor(s). MDPI and/or the editor(s) disclaim responsibility for any injury to people or property resulting from any ideas, methods, instructions or products referred to in the content.