Abstract
The photovoltaic (PV) industry boom has accelerated the need for accurately understanding the spatial distribution of PV energy systems. The synergy of remote sensing and artificial intelligence presents significant prospects for PV energy monitoring. Currently, numerous studies have focused on extracting rooftop PV systems from airborne or satellite imagery, but their small-scale and size-varying characteristics make the segmentation results suffer from PV internal incompleteness and small PV omission. To address these issues, this study proposed a size-aware deep learning network called Rooftop PV Segmenter (RPS) for segmenting small-scale rooftop PV systems from high-resolution imagery. In detail, the RPS network introduced a Semantic Refinement Module (SRM) to sense size variations of PV panels and reconstruct high-resolution deep semantic features. Moreover, a Feature Aggregation Module (FAM) enhanced the representation of robust features by continuously aggregating deeper features into shallower ones. In the output stage, a Deep Supervised Fusion Module (DSFM) was employed to constrain and fuse the outputs at different scales to achieve more refined segmentation. The proposed RPS network was tested and shown to outperform other models in producing segmentation results closer to the ground truth, with the F1 score and IoU reaching 0.9186 and 0.8495 on the publicly available California Distributed Solar PV Array Dataset (C-DSPV Dataset), and 0.9608 and 0.9246 on the self-annotated Heilbronn Rooftop PV System Dataset (H-RPVS Dataset). This study has provided an effective solution for obtaining a refined small-scale energy distribution database.
1. Introduction
The development of renewable energy systems presents an effective approach to tackle the limitations of fossil fuel usage and combat global climate change [1]. The rising demand for solar photovoltaic (PV) systems worldwide is driven by the aspiration to achieve carbon neutrality and fulfill the United Nations Sustainable Development Goals [2,3]. Several governments have proposed the establishment of utility-scale solar PV plants worldwide to achieve the transition from conventional to modern energy structures, but utility-scale PV power plants pose the challenges of not only substantial installation space but also high construction and maintenance costs [4,5]. In contrast, rooftop PV panels can be easily installed on residential, commercial, and industrial building rooftops, featuring the advantages of effective space utilization and cost-effectiveness, thereby reducing land requirements for utility-scale PV power plants and making rooftop-distributed PV systems a more attractive and encouraged option [6]. According to SolarPower Europe, global rooftop PV installations experienced a staggering growth of 50%, reaching 118 GW in 2022, representing 49.5% of total installations, demonstrating the promising potential of rooftop PV systems as an alternative energy generation technology.
The boom of the PV industry highlights the need for accurately understanding the spatial distribution of PV energy systems in the energy sector. Accurate and detailed spatial information on rooftop PV systems is crucial for effective capacity planning, energy modeling, and policymaking [7]. Currently, Collecting PV energy information based on field surveys and bottom-up reports is time-consuming, labor-intensive, and incomplete [8]. Fortunately, remotely sensed data have emerged as a potentially rich source [9,10,11]. By utilizing remote sensing imagery from various sensors, researchers and practitioners can monitor PV systems on a global or regional scale, encompassing both large-scale centralized PV power plants [12,13,14] and small-scale rooftop-distributed PV systems [15,16,17], enabling rapid and accurate acquisition of PV systems from remote sensing imagery to become a hot research area.
In the past few years, researchers have dedicated their efforts to monitoring PV energy systems from remote sensing imagery using various algorithms, such as the detection of rooftop PV panels using traditional machine learning approaches, including designing combinations of spectral features, texture features, and shape features based on pixels or objects [18,19]. Despite their ability to enhance the accuracy of PV footprint detection, these methods are susceptible to errors arising from imaging condition changes and background variations [20]. To address these limitations, Deep Learning (DL), such as the architectures of Convolutional Neural Networks (CNNs) [21] and Transformers [22], exhibit superior performance to traditional methods in semantic segmentation [23,24]. Many studies have been performed on applying deep learning methods to the segmentation of rooftop PV panels [25]. Based on U-Net [26], SegNet [27], DeepLab v3+ [28], SegFormer [29], and other deep learning frameworks, a series of rooftop PV panel segmentation methods, such as CrossNets [30], DeepSolar [31], Deep Solar PV Refiner [32], and PVNet [13], have been developed and successfully applied in the United States, Europe, and China. However, most of these studies primarily focused on improving the segmentation performance of PV panels using generalized models, neglecting the uniqueness of rooftop PV systems themselves [33]. Compared to utility-scale PV systems, rooftop PV systems are characterized by scattered distribution, small scale, and varying sizes. The size of the PV panels composing a rooftop PV system covers a range from a few square meters to several thousand square meters, making the rooftop PV systems segmentation results suffer from PV internal incompleteness and small PV omission [13]. Therefore, exploring models involving the unique features of rooftop PV panels is of great significance to improve the segmentation accuracy of PV panels and enhance the interpretability of deep learning models in this domain.
In previous studies, available PV datasets at different scales have been generated, including small-scale rooftop PV datasets at the panel level [34,35,36,37] and large-scale PV plant datasets at the site level [38,39,40], which have become fundamental references for power system operators and power market participants in downstream modeling and informed decision-making processes. Small-scale rooftop PV datasets are known to primarily rely on aerial or satellite imagery with very high-resolution capabilities, enabling a finer level of detail in describing these systems. However, the utilization of currently available rooftop PV panel datasets is not yet fully optimized due to differences in annotation standards and quality [8]. Addressing these limitations and enhancing the availability and quality of rooftop PV datasets can contribute to the advancement and broader application of remote sensing techniques in the monitoring and analysis of PV energy systems, thus contributing to the transition towards sustainable and renewable energy sources worldwide.
To address the aforementioned challenges, this paper aimed to finely segment small-scale rooftop PV systems from high-resolution imagery by introducing a size-aware deep learning network called Rooftop PV Segmenter (RPS). The major contributions and novelties of this study are as follows:
- (1)
- Considering the small-scale and varying sizes of rooftop PV systems, a Semantic Refinement Module (SRM) and a Feature Aggregation Module (FAM) were introduced into the RPS network. SRM was designed to sense size variations of PV panels and reconstruct high-resolution deep semantic features by employing joint upsampling, depth-separable feature pyramids, and dual-attention optimization. FAM enhanced the representation of robust features of rooftop PV panels by continuously aggregating deeper features into shallower ones.
- (2)
- In the output stage, a Deep Supervised Fusion Module (DSFM) was incorporated to constrain and fuse the outputs at different scales to achieve more refined segmentation. For the highly unbalanced distribution of PV data in the rooftop PV dataset, a combined loss function with more attention to the foreground was applied for model training.
- (3)
- The effectiveness of the RPS network was verified by testing on two datasets: the publicly available California Distributed Solar PV Array Dataset (C-DSPV Dataset) Dataset and the Heilbronn Rooftop PV System Dataset (H-RPVS Dataset), with the latter dataset as another contribution of this study.
2. Materials and Methods
2.1. Datasets
High-quality datasets are the foundation for accurately segmenting small-scale rooftop PV systems from high-resolution imagery. In this study, the efficacy of the proposed RPS deep learning network was comprehensively validated by utilizing the publicly available C-DSPV Dataset along with the self-annotated H-RPVS Dataset.
2.1.1. California Distributed Solar PV Array Dataset
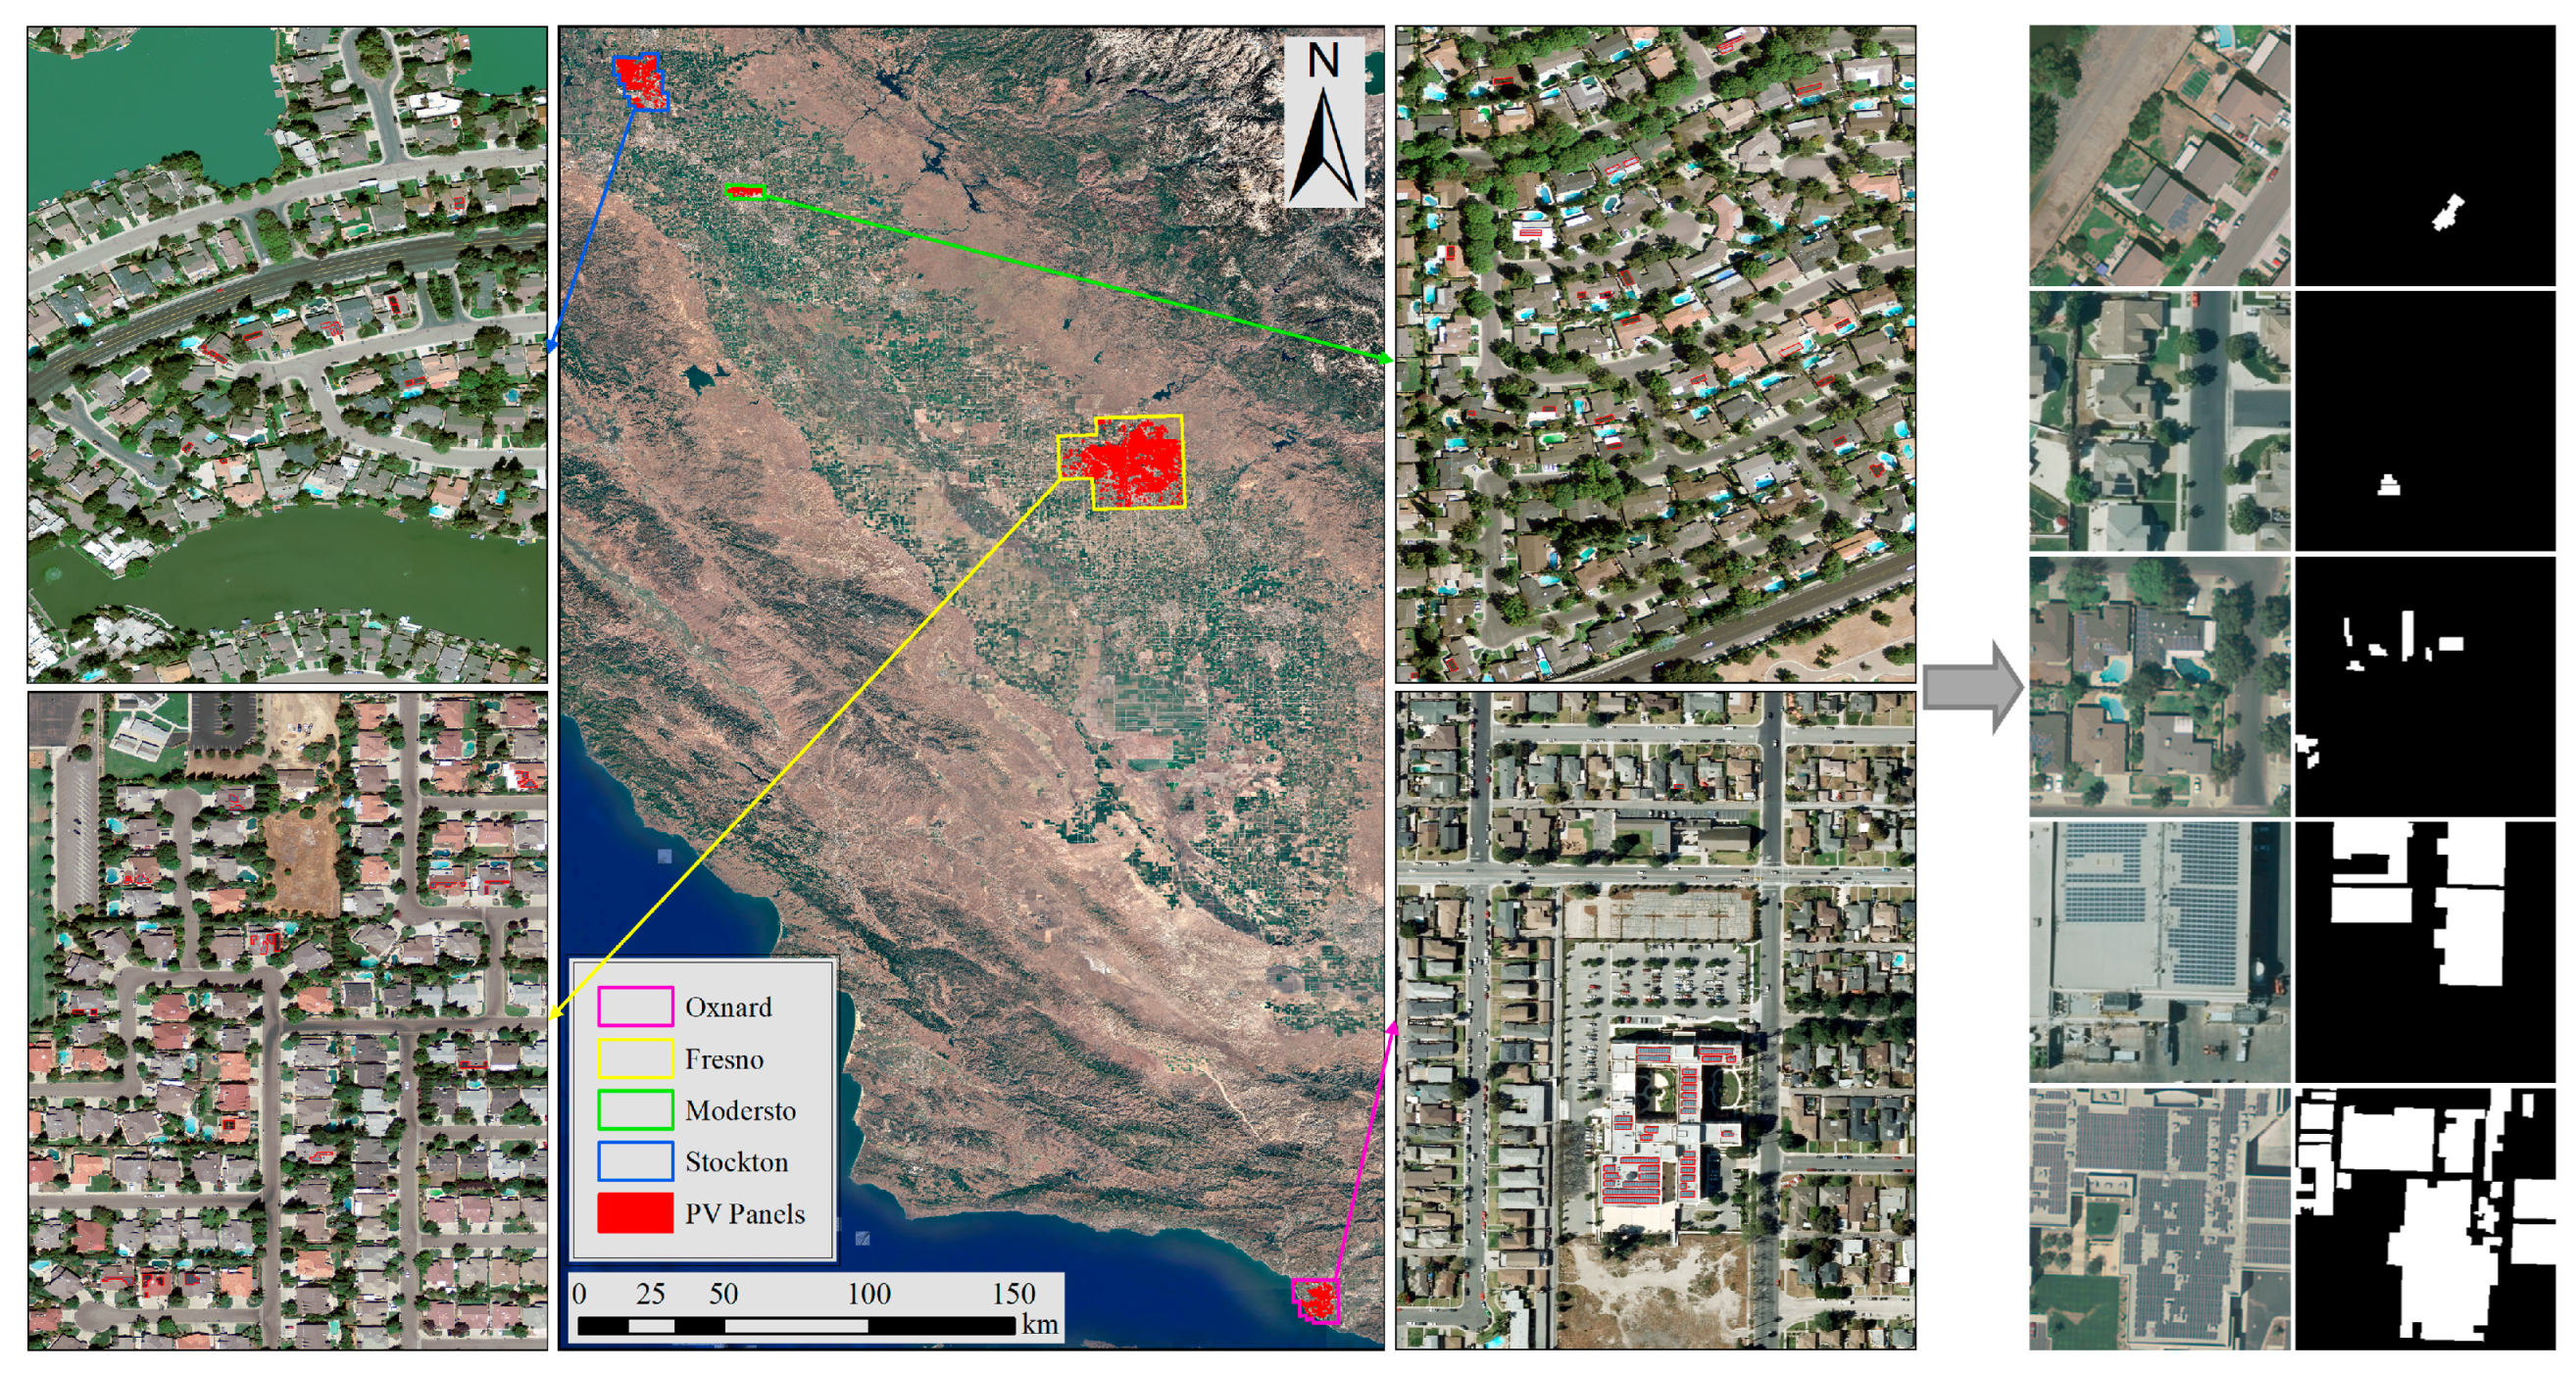
As a distributed solar PV array for identifying PV locations using high-resolution aerial imagery, the California Distributed Solar PV Array Dataset (C-DSPV Dataset) covers 601 images across the four cities of Fresno, Stockton, Modesto, and Oxnard in California, with three optical bands (Red, Green, and Blue) and a spatial resolution of 0.3 m [34]. The corresponding PV panels are annotated with a total of 19,433 individuals, including the geospatial coordinates and border vertices of each PV panel. According to the statistics, the rooftop PVs in the C-DSPV Dataset have a minimum area of 0.38 m2, a maximum area of 6154.61 m2, an average area of 40.38 m2, and a standard deviation of 125.83 m2. Considering the small-scale and size-varying characteristics of rooftop PV systems, the images were cropped to tiles with 256 × 256 pixels using a sliding window and obtained 11,169 pairs of samples for segmentation experiments. The distribution of PV panels within the C-DSPV Dataset and the sampling examples are shown in Figure 1.

Figure 1.
The distribution of PV panels within the C-DSPV Dataset and the sampling examples.
2.1.2. Heilbronn Rooftop PV System Dataset
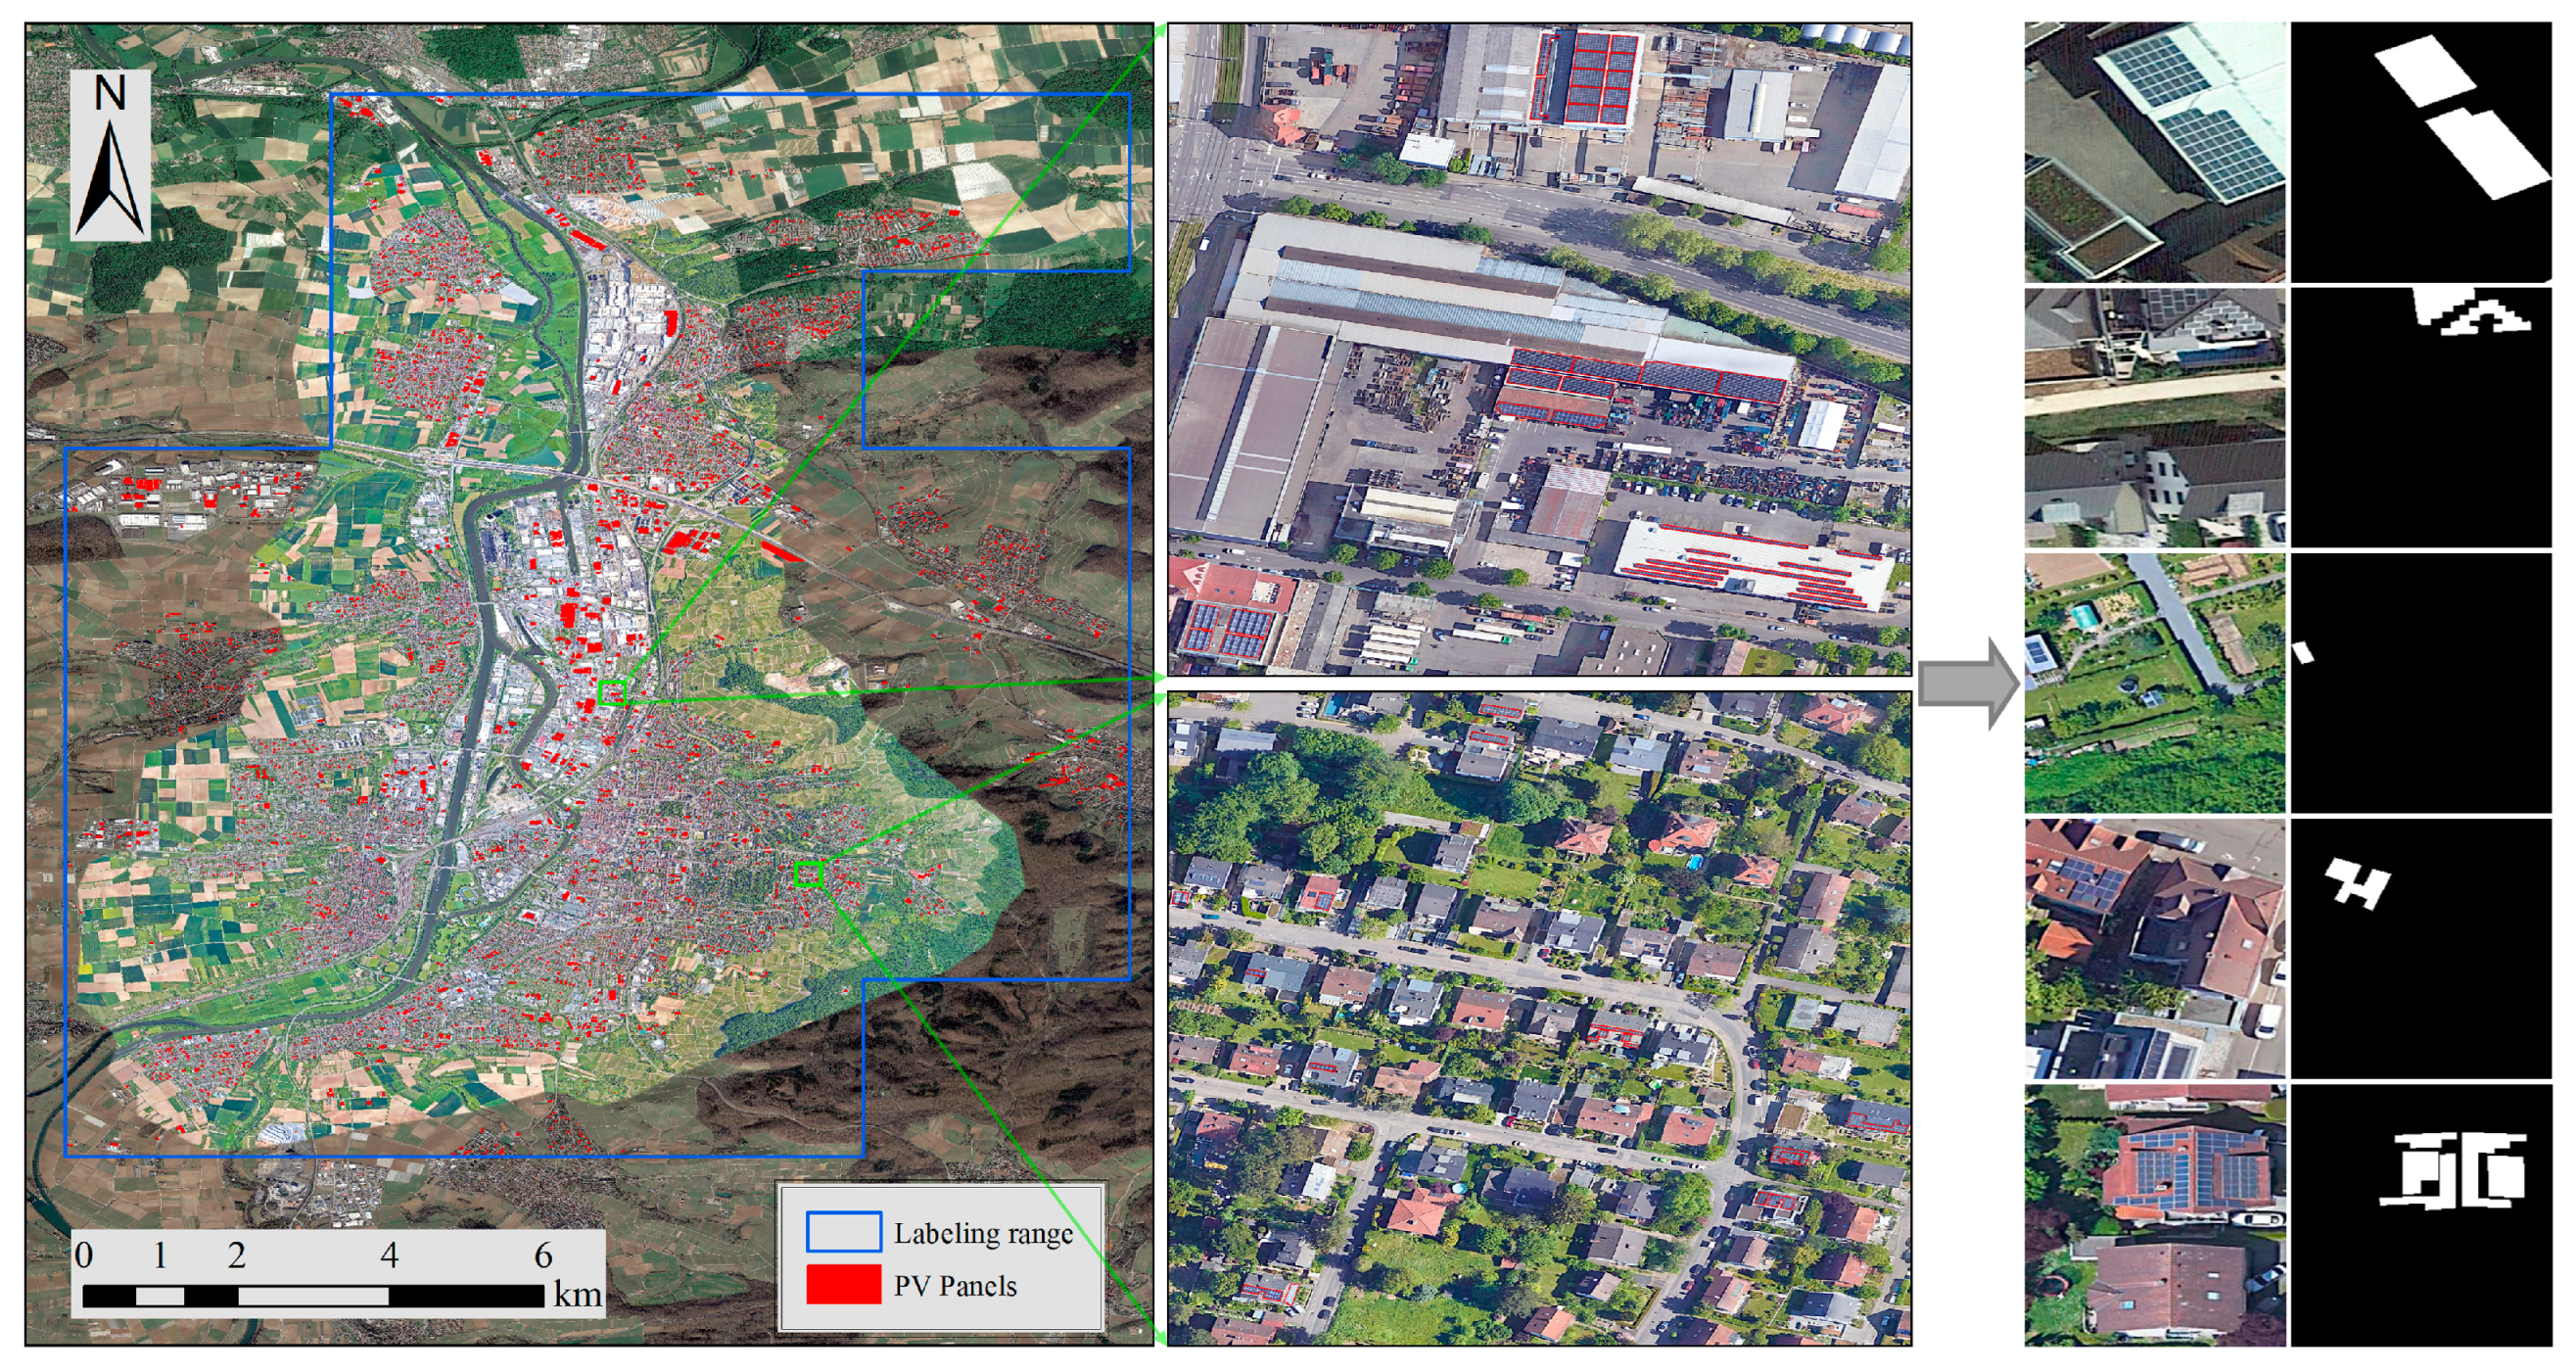
The H-RPVS Dataset has been meticulously annotated utilizing high-resolution imagery with spatial resolutions ranging from 0.15 m, sourced from Google Earth. This dataset encompasses 20 satellite images, each with 23,302 × 15,534 pixels, captured in Heilbronn, a city in Germany. The images feature three optical bands (Red, Green, and Blue), and annotation standards for the distributed rooftop PV panels are derived from the relevant literature [33]. The boundaries of PV panels were outlined using ArcGIS 10.8.2 software, and a total of 16,925 individual PV panels were obtained. According to the statistics, the rooftop PVs in the H-RPVS Dataset have a minimum area of 0.71 m2, a maximum area of 1494.06 m2, an average area of 25.33 m2, and a standard deviation of 50.30 m2. Compared to the C-DSPV Dataset, the images in the Heilbronn Rooftop PV System Dataset (H-RPVS Dataset) were acquired with different sensors and at different imaging times. For consistency with the C-DSPV Dataset, the images were cropped to tiles with 256 × 256 pixels using a sliding window and obtained 5866 pairs of samples for segmentation experiments. The distribution of PV panels within the H-RPVS Dataset and the sampling examples are shown in Figure 2.

Figure 2.
The distribution of PV panels in the H-RPVS Dataset and sampling examples.
2.2. Rooftop PV Segmenter
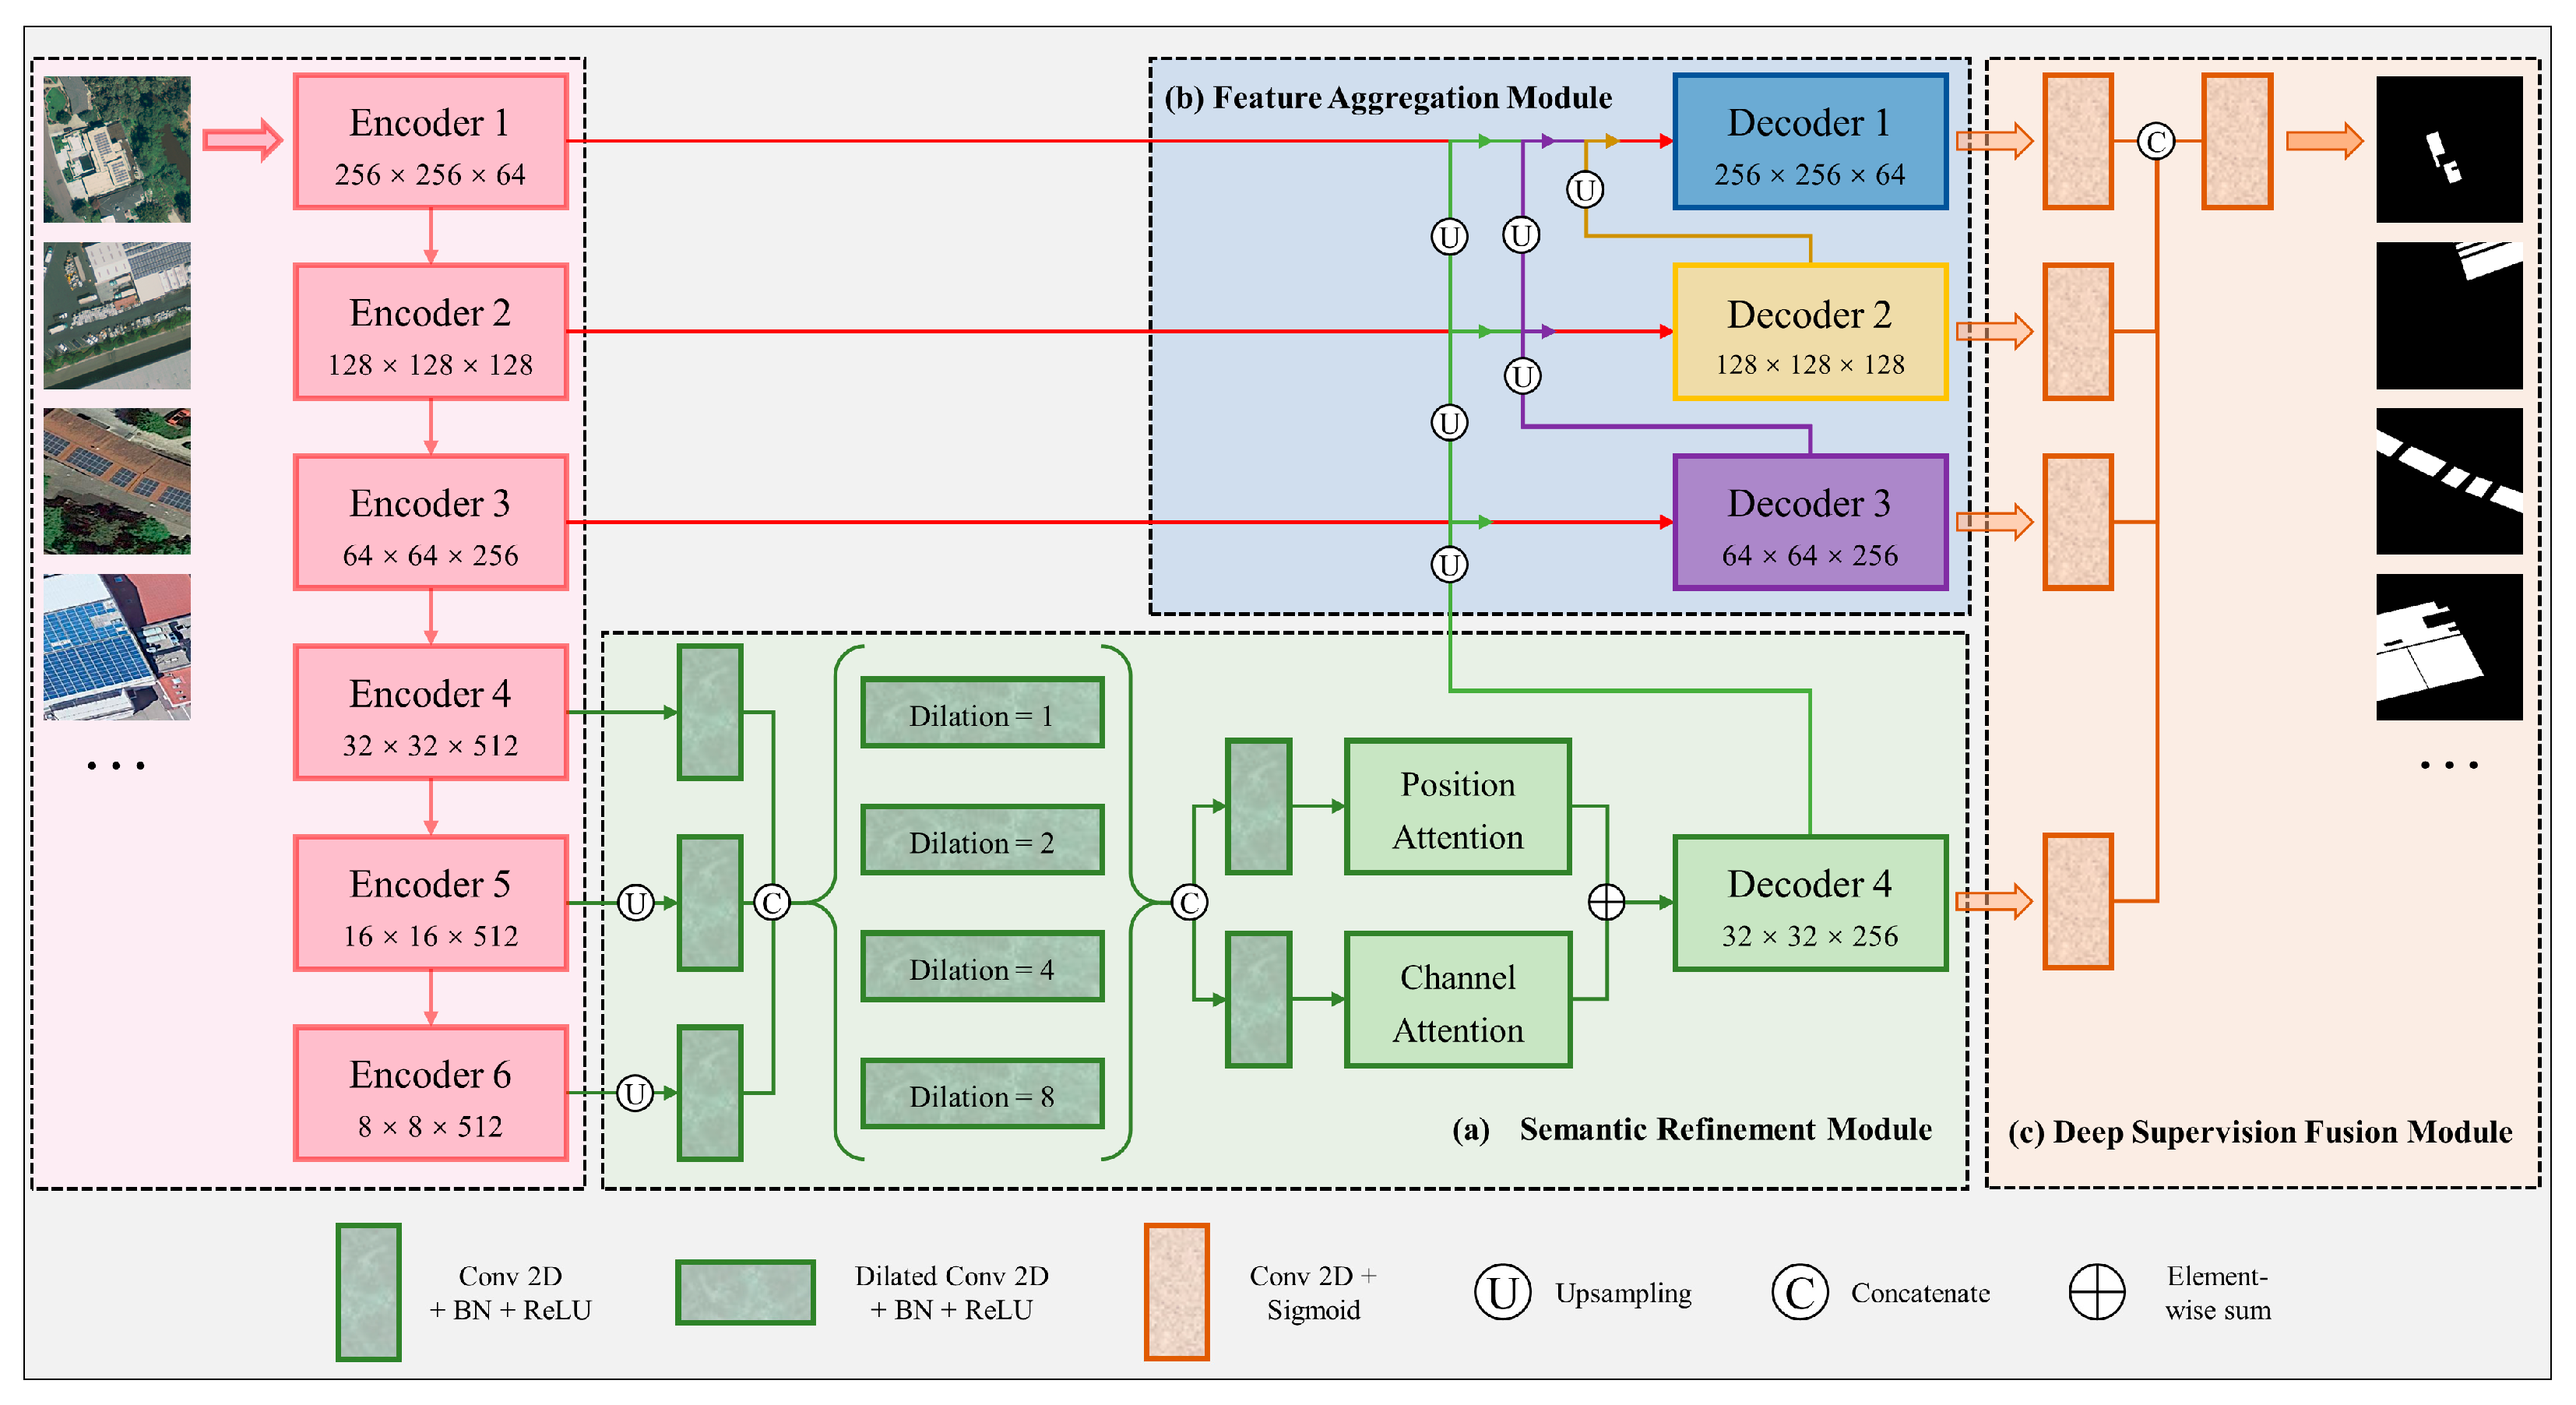
The proposed RPS size-aware deep learning network aimed to refine the segmentation of small-scale rooftop PV panels from high-resolution imagery, thus solving the problems of PV internal incompleteness and small PV omission. Figure 3 provides an overview of the RPS architecture.
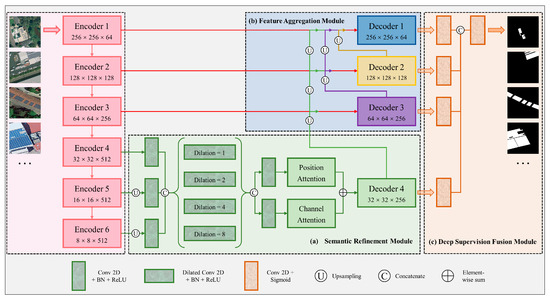
Figure 3.
The architecture overview of the Rooftop PV Segmenter.
The proposed RPS network follows the encoder–decoder structure commonly used for semantic segmentation. In the encoder stage, layers 1 to 4 of the classical ResNet-34 [41] are employed as encoder layers 1 to 4, with both encoder layers 5 and 6 composed of three layers of convolution, followed by a Batch Normalization (BN) and a ReLU activation function. After six encoder layers, the feature maps of 1, 1/2, 1/4, 1/8, 1/16, and 1/32 of the original image size can be generated in turn for decoding.
In the decoder stage, the RPS size-aware aspect can be manifested through the following two sub-modules. (i) Semantic Refinement Module (SRM), awareness size variations of rooftop PV panels, and reconstruction of high-resolution deep semantic features; (ii) Feature Aggregation Module (FAM), aggregating deeper features into shallower ones continuously to enhance the representation of robust features of rooftop PV panels.
In the output stage, the RPS network incorporates a Deep Supervised Fusion Module (DSFM) to constrain and fuse the outputs at different scales to achieve more refined segmentation. In DSFM, each of the decoding layers (1 to 4) will generate four probability maps through a 3 × 3 convolutional layer and a Sigmoid activation function. Subsequently, the generated probability maps of four sizes will be upsampled to the input image size and fused by a concatenation operation. Then, the map is produced via a 1 × 1 convolutional layer with a Sigmoid activation function. Finally, the optimal results are obtained by co-supervising the outputs of the four scales with the fused output. The implementation details of sub-modules (a) and (b) are presented in the two following sections. Section 2.2.3 describes the loss function.
2.2.1. Semantic Refinement Module
Compared to utility-scale photovoltaic power stations, rooftop-distributed PV panels are characterized by scattered distribution, small scale, and varying sizes. In the depth encoder stage, the intensive downsampling process can cause the loss of PV panel spatial information, which is detrimental to the recovery of pixel-level predictions from the low-resolution outputs [42]. Therefore, the RPS network introduces a Semantic Refinement Module (SRM) to sense size variations of rooftop PV panels and reconstruct high-resolution deep semantic features.
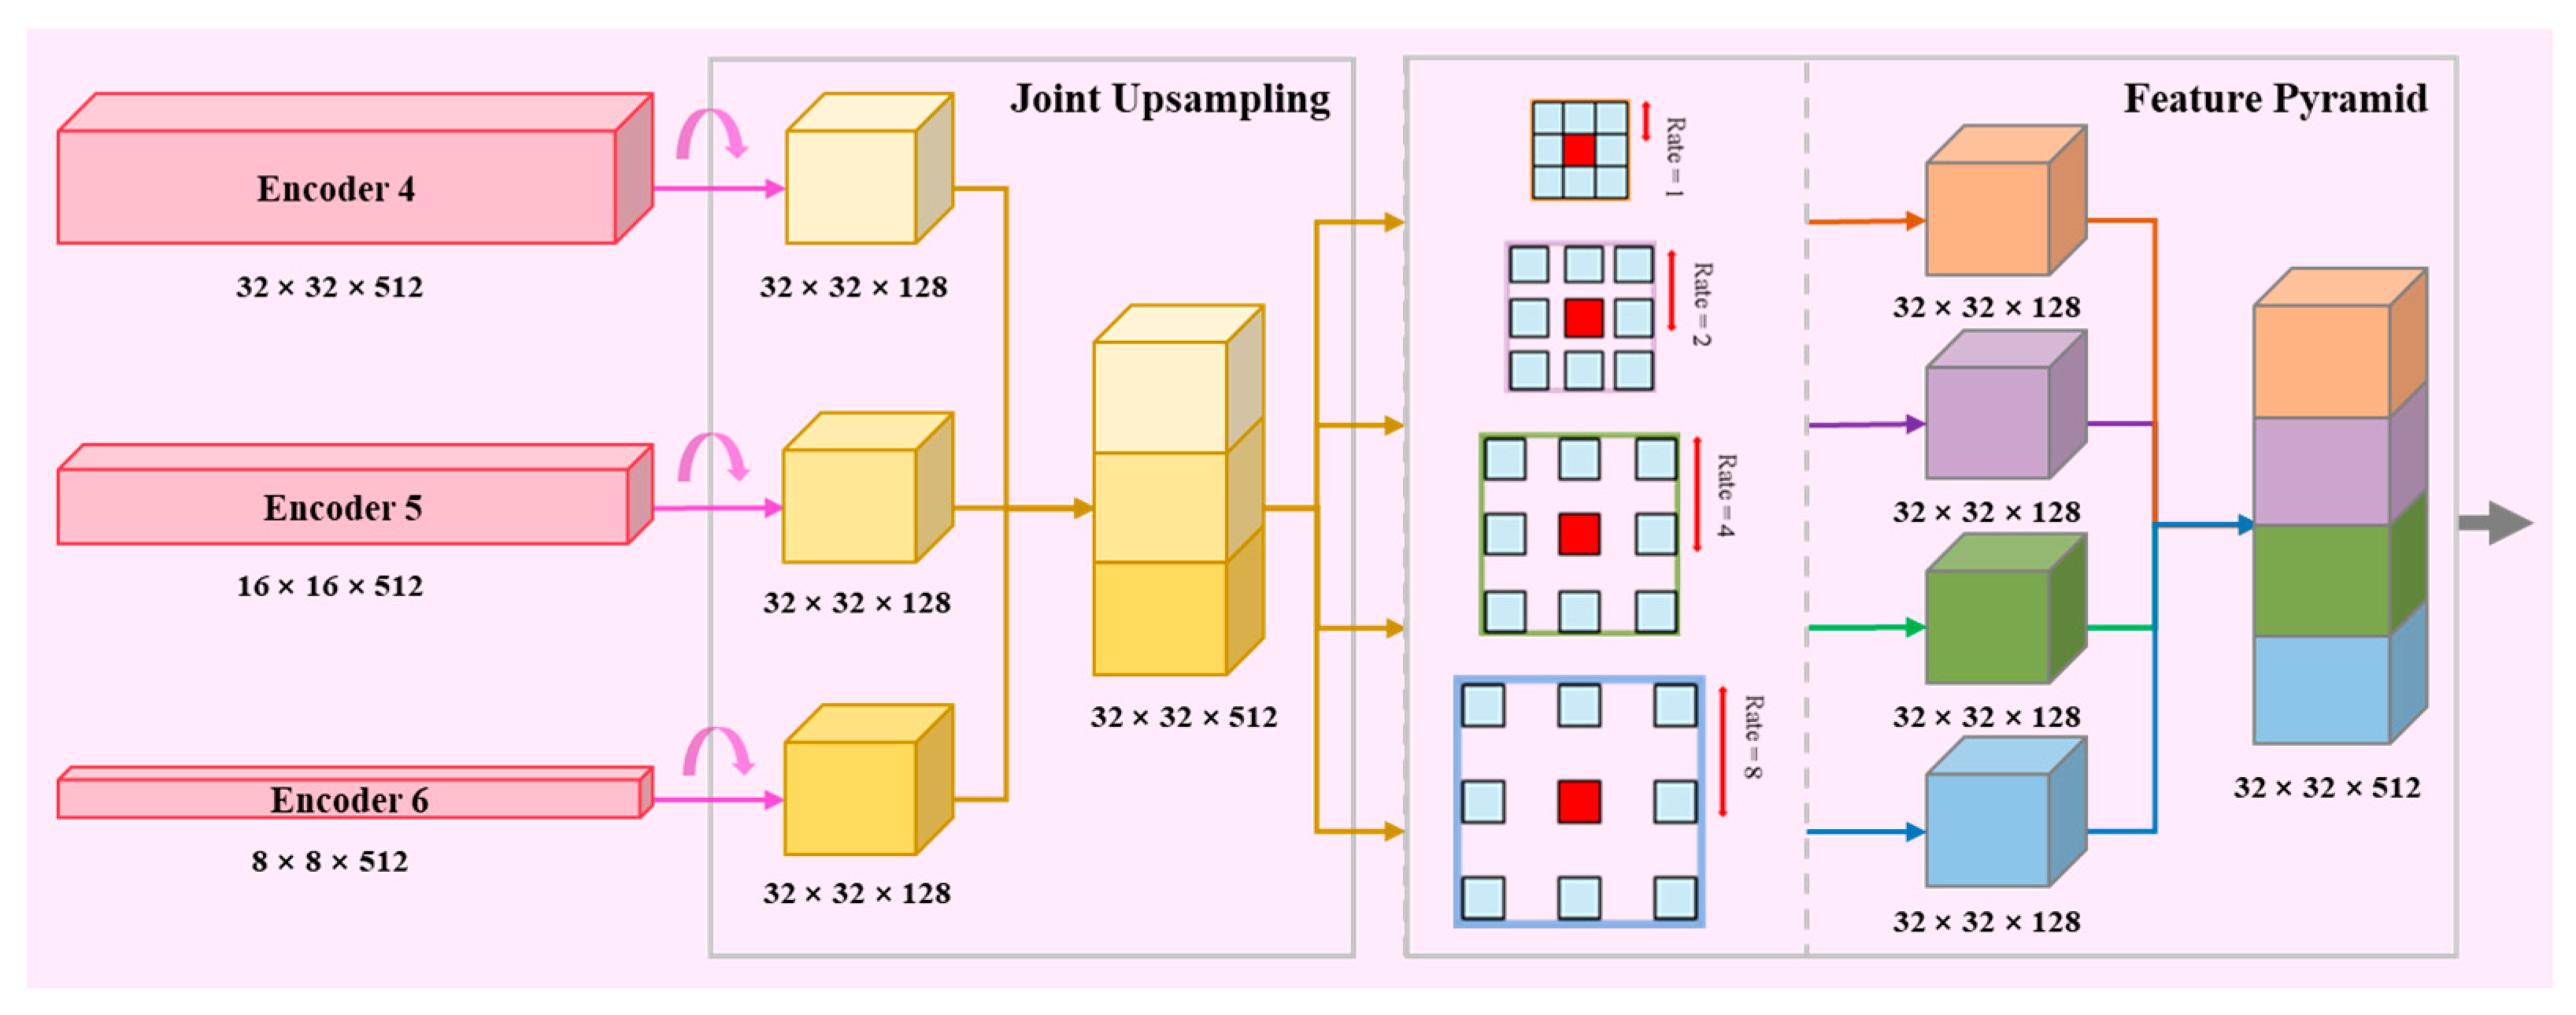
The SRM is implemented through the joint upsampling of feature maps generated by encoding layers 4 to 6 to unify them to 1/8 of the original size (i.e., the size of the outputs of encoder layer 4) for a concatenation operation. Secondly, the SRM deploys four distinct depth-separated convolutions, each with a varying dilation rate (1, 2, 4, and 8), allowing the effective formation of a feature pyramid. These parallel branches are engaged in the segmentation of features, followed by a concatenation operation. At different dilation rates (1, 2, 4, and 8), the contextual features of different scales are captured by increasing the receptive field. The structure of the JU and the feature pyramid are shown in Figure 4.

Figure 4.
The structure of joint upsampling and the feature pyramid.
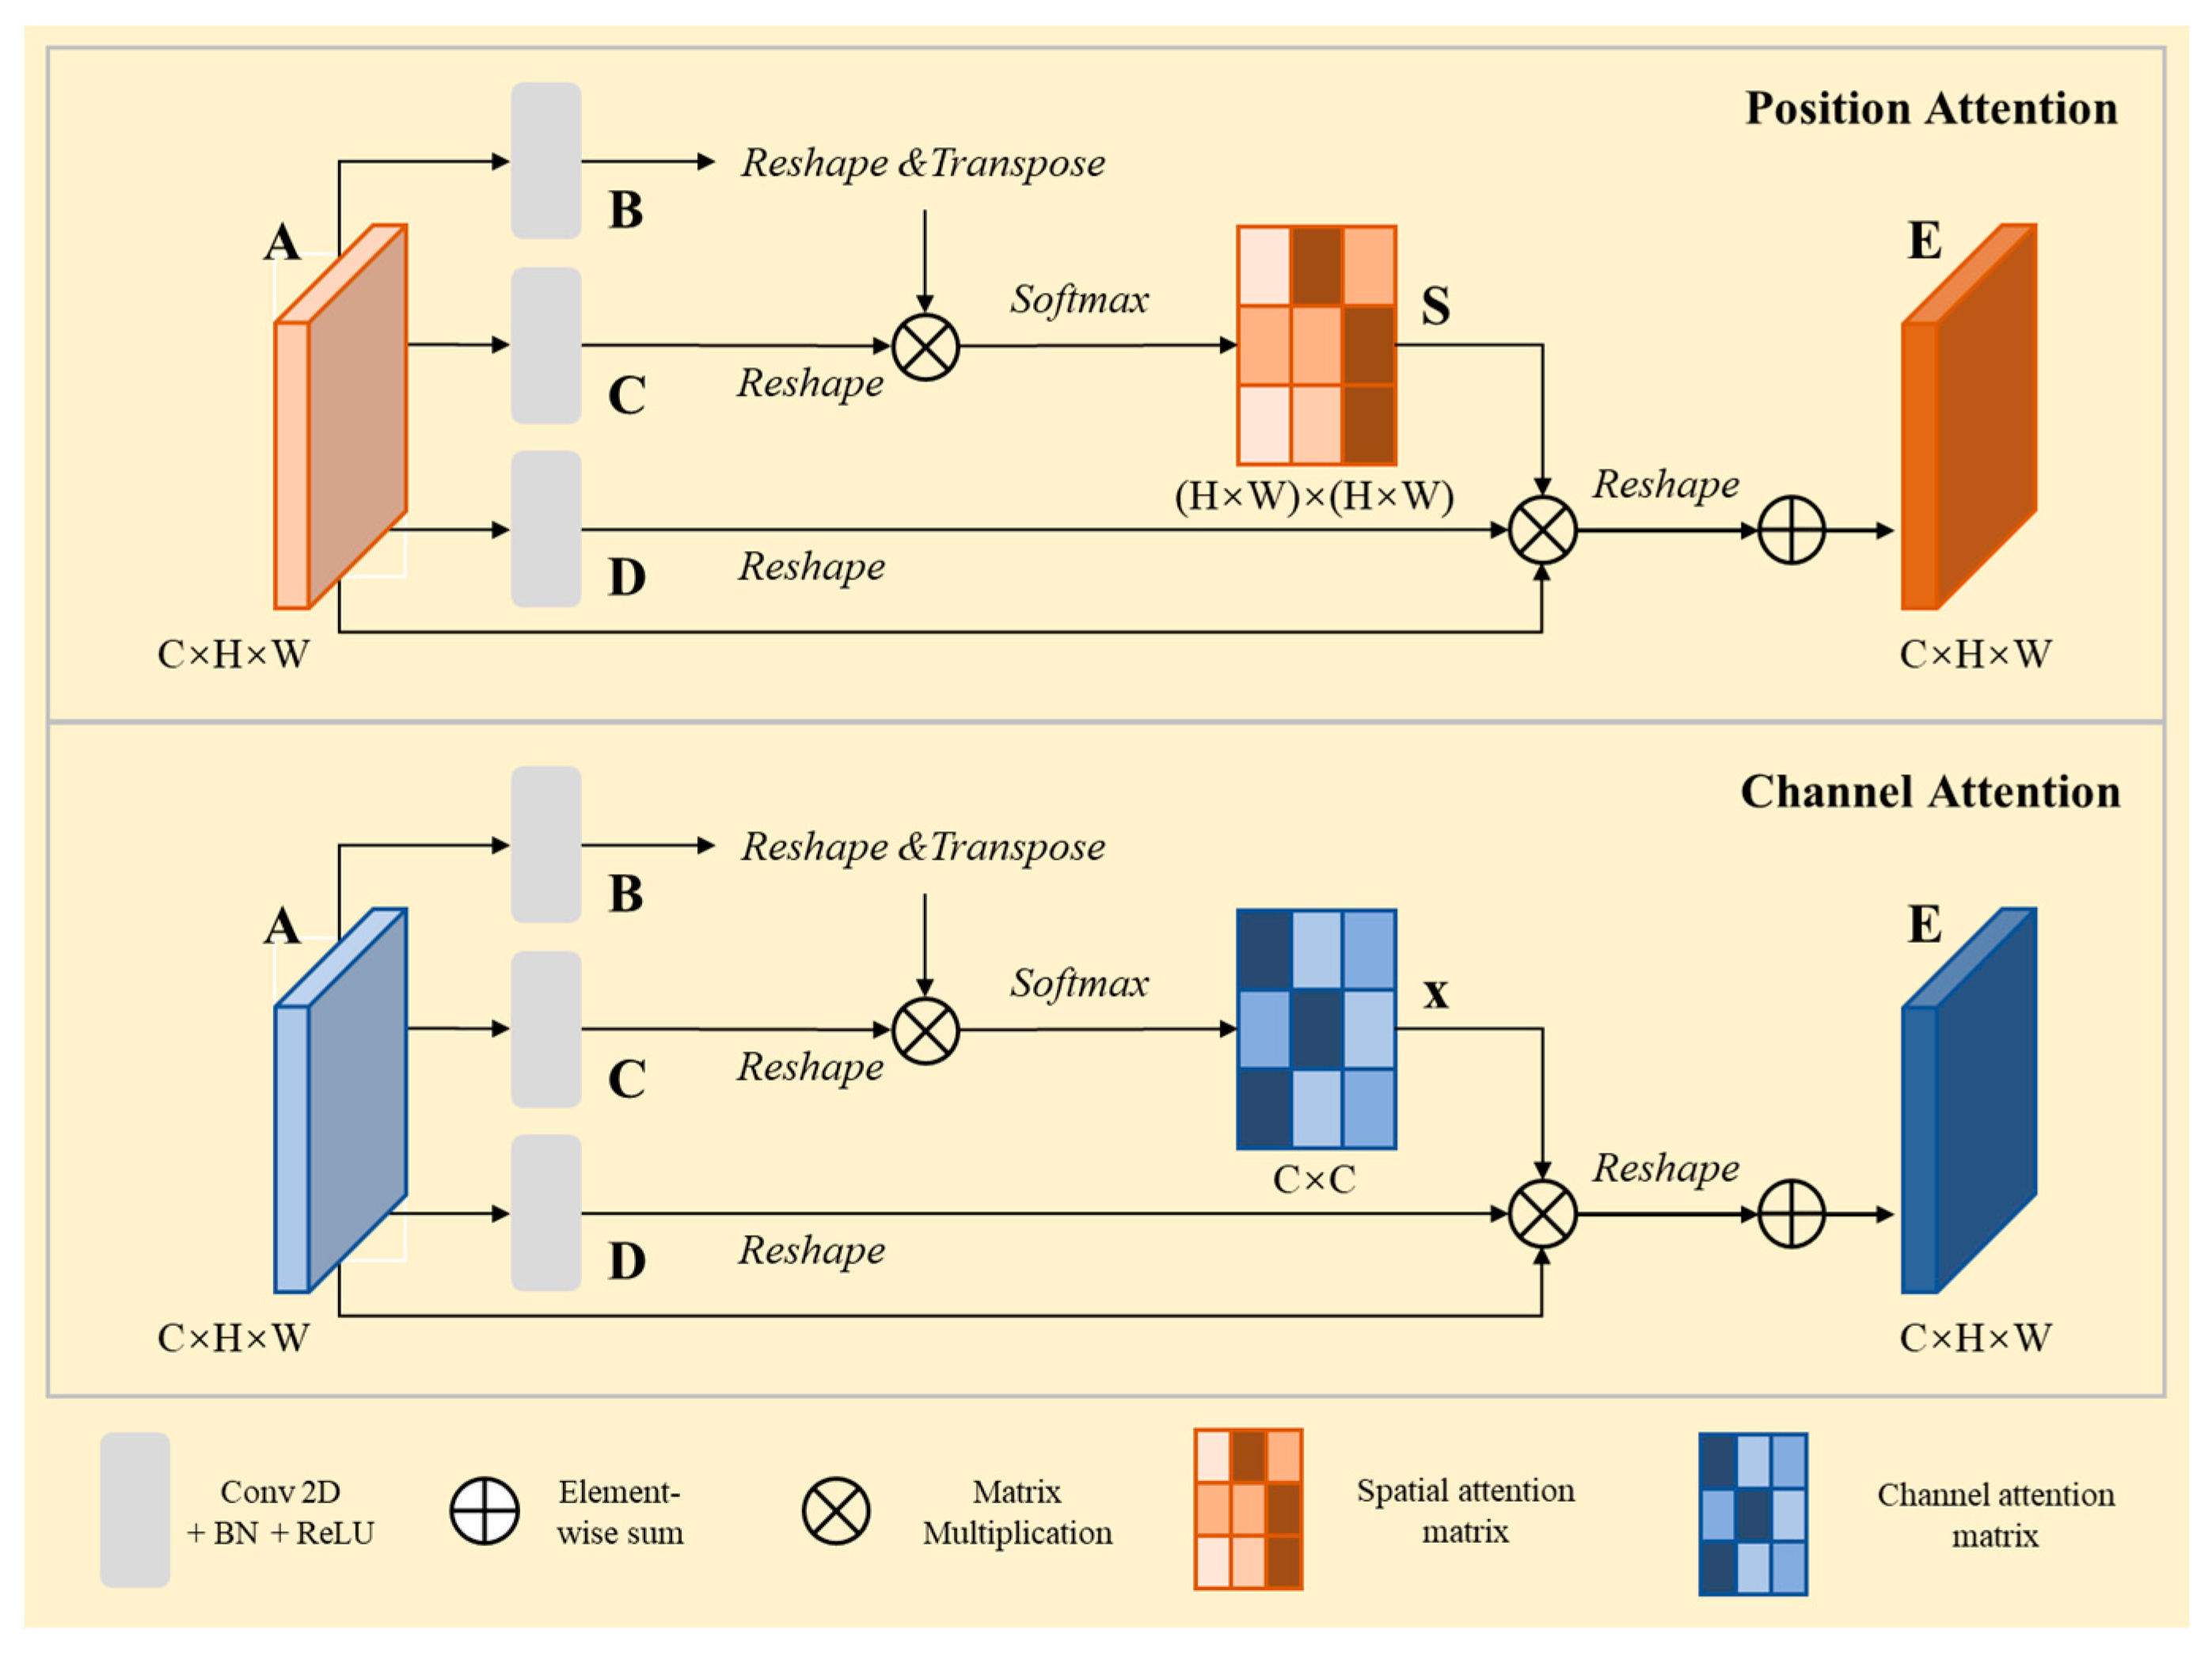
Subsequently, local features and global dependencies are integrated adaptively using position and channel attention [43] to optimize the reconstructed deep semantic features, whose structure is shown in Figure 5. The position attention systematically aggregates features at each position through a weighted summation across all positions, while the channel attention strategically accentuates the presence of interdependent channel mappings, harmonizing pertinent features across all channel mappings. The optimization of the rooftop PV panel feature representation is achieved by an element-wise summation of the outcomes from the two attention branches. Finally, the generation of high-resolution deep semantic features (1/8 of the original input size) is facilitated by a decoder layer 4, which consists of a 3 × 3 convolutional layer, followed by a BN and a ReLU activation function.

Figure 5.
The structure of position and channel attention.
2.2.2. Feature Aggregation Module
Traditional decoder layer outputs (such as U-Net, and SegNet) are usually derived from the fusion of outputs from the corresponding encoder layer and a higher decoding layer, resulting in the underutilization of deeper features in the output layer with a larger receptive field and stronger semantic information [44]. To overcome this limitation, a simple and efficient Feature Aggregation Module (FAM) is employed in the RPS network to fuse multi-scale semantic features and visual features to enhance the representation of robust features of rooftop PV panels by continuously aggregating deeper features to shallower ones, thus maximizing the utilization of the enriched semantic information. The structure of the FAM is presented in Figure 6.
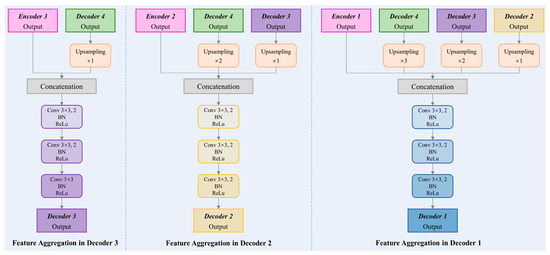
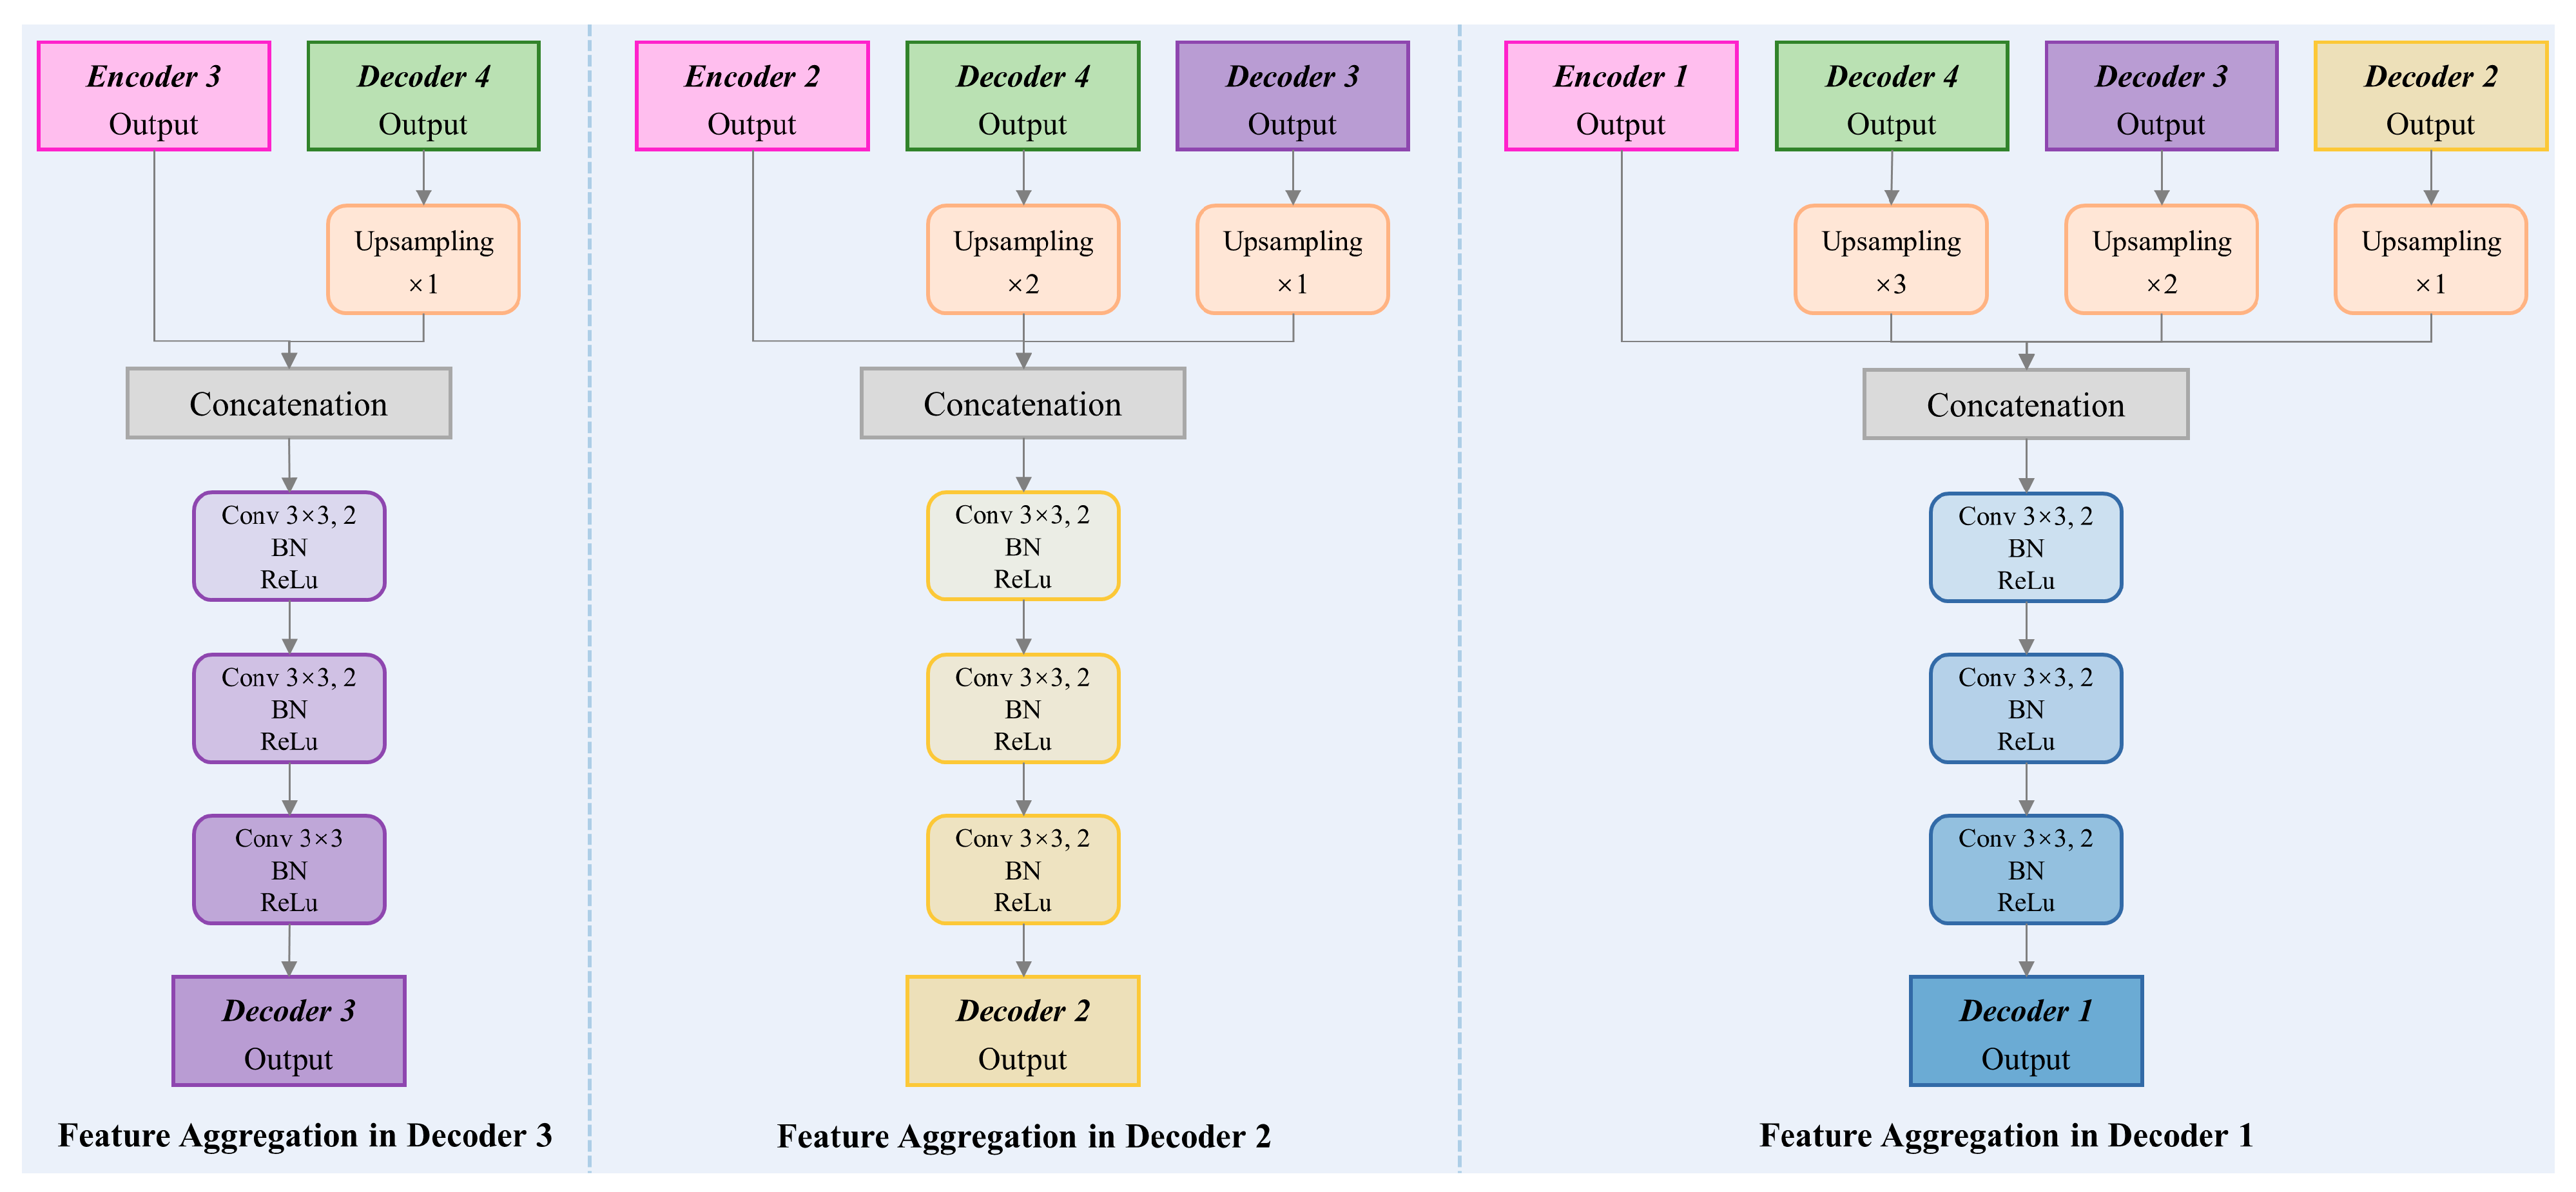
Figure 6.
The structure of the Feature Aggregation Module.
As shown in Figure 6, within FAM, the features aggregated by different decoder layers result from the fusion of their corresponding decoding layer outputs and all deeper features. The output of decoder layer 4 represents the deep semantic features of the rooftop PV panels, which is operated by concatenation with the output of encoder layer 3 to achieve feature aggregation at different scales, and then the output features of decoder layer 3 are enhanced by three convolutional layers followed by a BN and a ReLU activation function. Similarly, the features of decoder layer 2 aggregate the output features from decoder layer 4, decoder layer 3, and encoder layer 2, while the features of decoder layer 1 aggregate the output features from decoder layer 4, decoder layer 3, decoder layer 2, and encoder layer 1 output features. When features are aggregated, the features at different scales need to perform the upsampling operation for cross-scale aggregation. By aggregating deep semantic features to encoders at different scales, the representation of robust feature enhancement of rooftop PV panels at different scales was achieved.
2.2.3. Loss Function
In the cropped and selected C-DSPV Dataset and H-RPVS Dataset, the ratio of rooftop PV object pixels to non-object pixels is 1:79.89 and 1:12.88, respectively. Related studies have revealed the highly class-imbalanced distribution of PV data as a challenge for deep learning [33]. When employing the traditional Binary Cross Entropy (BCE) loss for semantic segmentation, the presence of this data imbalance gives rise to several challenges: (i) the calculation of pixel-level loss disregards the global structure of the image. (ii) The dominance of background pixels within loss calculation impedes effective learning of PV panel information. (iii) PV panel edge position pixels are misclassified due to weight equalization. To solve these problems, the present study adopted a weighted Binary Cross Entropy (wBCE) loss and a weighted IoU (wIoU) loss [45].
The wBCE loss realizes the learning of the local structure information of PV pixels by assigning larger weights to PV pixels, which can be defined by Equation (1):
where is the indicator function; , a hyper-parameter; is two kinds of labels; and are the prediction and ground truth of the pixel at the location in samples; is all the parameters of the network; is the predicted probability.
In , each pixel will be assigned a weight . PV pixel corresponds to larger and no-PV pixel will be assigned a smaller one. It can be regarded as the indicator of pixel importance, which is calculated according to the difference between the center pixel and its surroundings, which can be defined by Equation (2):
where represents the area surrounding the pixel at location . For all pixels,. If is large, the pixel is very different from its surroundings, and if is small, the pixel is considered plain and deserves less attention.
The wIoU loss is introduced to focus on the global structure and compensate for the deficiency of BCE loss. Unlike the IoU loss, the wIoU loss assigns more weights to hard pixels to emphasize their importance, which can be defined by Equation (3):
In addition, rooftop PV panels are objects with geometric features, so the Structural Similarity (SSIM) [46] loss function is added to learn their geometric information. SSIM is calculated based on image patches, which are generated through an 11 × 11 sliding window. The predicted probability maps and ground truth are cropped by the sliding window into and . The SSIM loss of and can be defined by Equation (4):
where , and , represent the mean and standard deviations of and , with as their covariance; and are used to avoid dividing by zero.
The three loss functions mentioned above are combined to form a compound loss function and can be defined by Equation (5):
Since the RPS network adopts a deeply supervised strategy, the total loss can be defined by Equation (6):
where , , , and are the losses of the output probabilities of decoder layers 1 to 4, and is the loss of the output probability after fusion, which can be calculated from Equation (5).
3. Experiments and Results
This section focuses on extensive experiments on rooftop PV panel segmentation. The proposed RPS network and ten comparative models were tested on both the publicly available C-DSPV Dataset and the self-annotated H-RPVS Dataset.
3.1. Experimental Strategy
3.1.1. Dataset Split
The proposed RPS network’s performance was evaluated by using two PV datasets, including the C-DSPV Dataset and the H-RPVS Dataset. All the cropped image tiles in the PV datasets were sliced into training, validation, and test datasets by a ratio of 3:1:1. The details of the two split datasets are shown in Table 1.

Table 1.
The details of the two datasets split in this study.
As shown in Table 1, the input size is 256 × 256 × 3 in both datasets, while the two datasets vary in the number of training, validation, and test sets. The numbers of image tiles in the training, validation, and test sets are 6703, 2233, and 2233 in the C-DSPV Dataset, while 3518, 1174, and 1174 in the H-RPVS Dataset, respectively.
3.1.2. Parameter Settings
The deep learning networks tested in this study were constructed using the Pytorch framework. On a server with a single NVIDIA GeForce RTX 3090 graphics processing unit (GPU) and 24 GB of GPU memory, all experiments were carried out. The batch size of input images in each training epoch was set to 16. To obtain a fast convergence speed, the model was optimized with Adaptive Moment Estimation (Adam), and the initial learning rate was set to 0.001. Each model was trained for 150 epochs, and the optimal model training parameters were acquired for testing.
3.1.3. Comparison Models
The performance of the proposed RPS network was compared with the ten comparison models from the field of semantic segmentation/salient target detection, including the classical models of U-Net [26], SegNet [27], DeepLab V3+ [28], and U-Net++ [47], and the latest models of HRNet [48], F3Net [45], DCENet [49], ACCoNet [50], STT [51], and CMTFNet [52]. For a fair comparison, each of these models was configured with identical parameter settings and loss functions as employed in the RPS network.
3.1.4. Evaluation Metrics
Considering the direct impact of the reliability of rooftop PV panel segmentation results on the subsequent modeling and analysis workflows in practical applications, the present study adopted four standard metrics widely used in semantic segmentation for accuracy assessment of rooftop PV segmentation results, including Precision, Recall, F1-Score, and Intersection over Union (IoU). Precision refers to the percentage of correctly classified PV pixels among all predicted PV pixels; Recall is the percentage of correctly classified PV pixels among all true PV pixels; F1-score points to the harmonized average of Precision and Recall; IoU indicates the intersection ratio of predicted result to ground truth. All metrics are calculated pixel by pixel by Equations (7)–(10):
where , and are true positive, false negative, and false positive results, respectively. is the number of pixels correctly predicted as PV pixels; is the number of pixels incorrectly predicted as PV pixels; is the number of pixels incorrectly predicted as non-PV pixels.
3.2. Experiments on C-DSPV Dataset
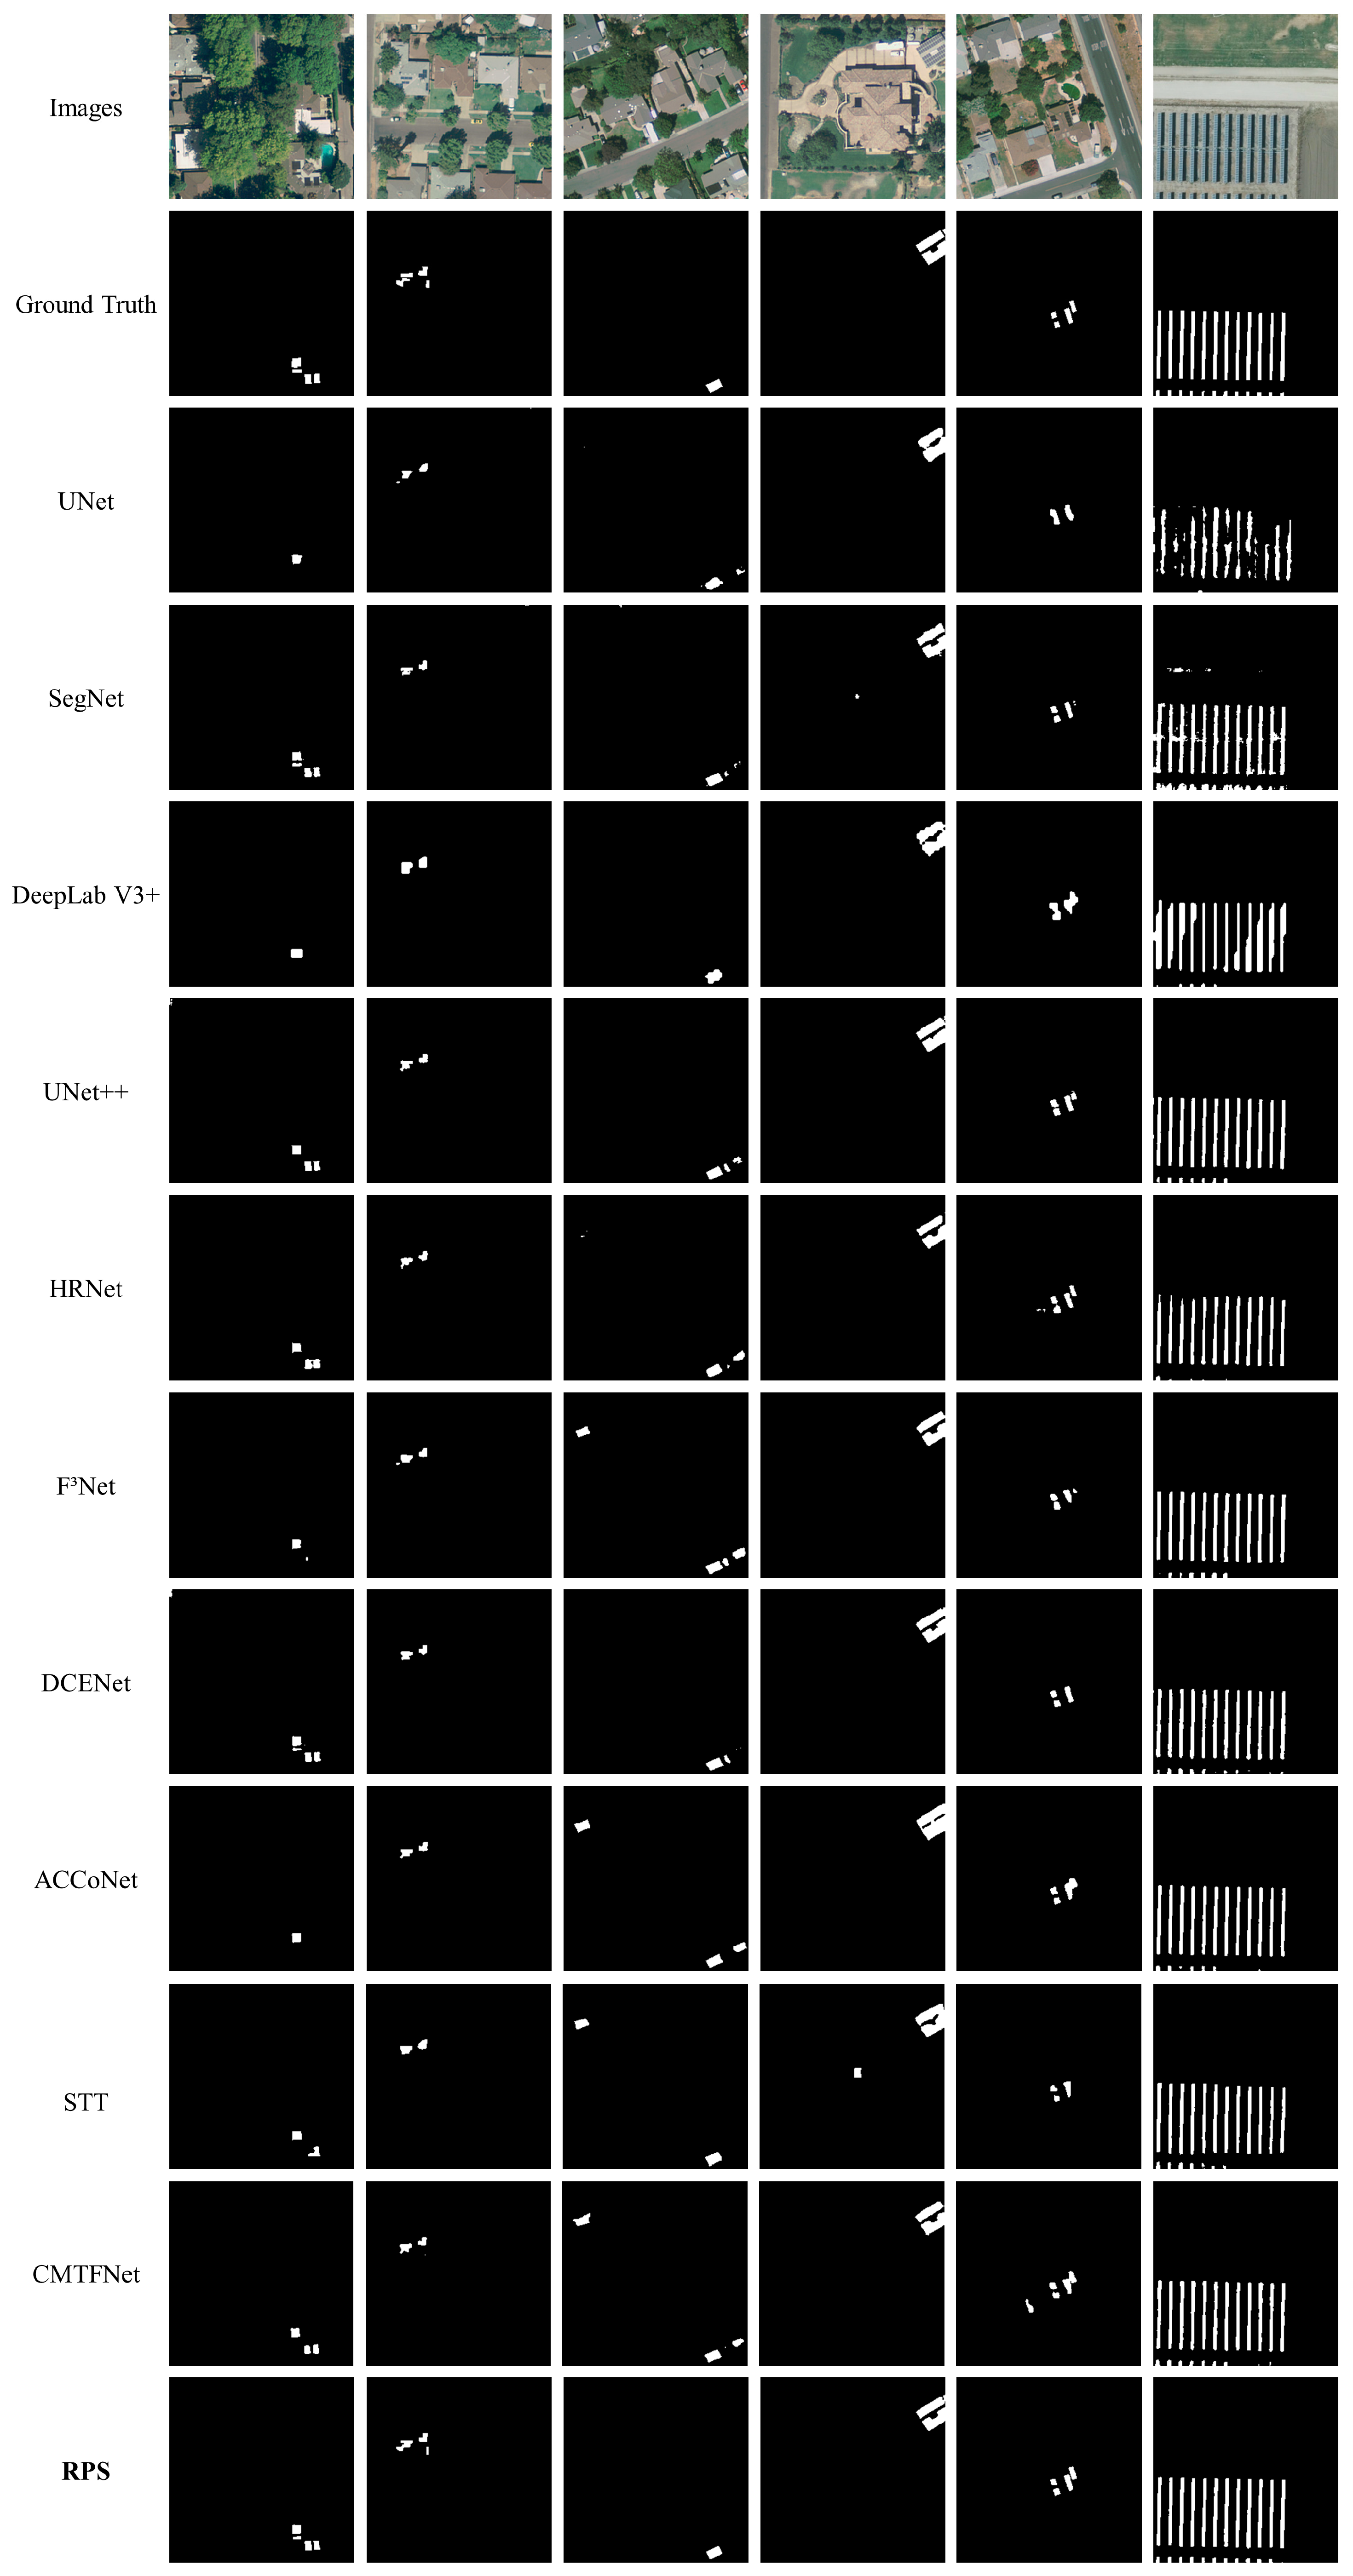
The training time for the RPS network on the C-DSPV Dataset was 508 s/epoch. During the prediction process, the inference time for each image took about 0.056 s, and the total time taken for inference on the test set was 123.67 s. Figure 7 shows the visualization results of rooftop PV panel segmentation on the C-DSPV Dataset. Due to their high percentage, the accurate detection of small-sized rooftop PV panels is the biggest challenge to this dataset. The thirteen rows show the original images, ground truth, and the prediction results produced by UNet, SegNet, DeepLab v3+, UNet++, HRNet, F3Net, DCENet, ACCoNet, STT, CMTFNet, and the proposed RPS network, while the six columns showcase the representative segmentation results.

Figure 7.
Rooftop PV panel segmentation results on C-DSPV Dataset.
In Figure 7, the proposed RPS network was seen to achieve the best results in controlling both false and missed detections of small-sized rooftop PV systems. The scattered small-sized residential rooftop PV panels could be easily missed by UNet, DeepLab v3+, F3Net, ACCoNet, and STT, as shown in the first and second columns of Figure 5. Additionally, SegNet, UNet++, HRNet, F3Net, DCENet, ACCoNet, STT, and CMTFNet are susceptible to confusion by spectrally or geometrically similar pixels, resulting in false detections, as shown in the third column. In contrast, the proposed RPS network is characterized by size-awareness, enabling it to be more effective than the comparison models in the discrimination of individual objects and accurate matching of geometrical shapes, as shown in the fourth and fifth columns. For non-residential rooftop PV systems, the RPS network can also accomplish the segmentation with the highest quality, as shown in the sixth column. The visual results are consistent with the quantitative accuracy metrics of the tested models shown in Table 2.
Table 2.
Accuracy assessment results of tested models on the C-DSPV Dataset (with the bold and underlined data for the best and second-best metrics).
In Table 2, the RPS network was also shown to outperform the other tested models in the four metrics. The highest Precision value of 0.9200 means the highest accuracy of the RPS network in PV panel detection. The highest Recall value of 0.9172 represents the best performance of RPS in missed detection control. In the F1-Score, the RPS network showed an improvement of 0.0085 to 0.0858 relative to the other models, indicating that RPS can achieve a balance between Precision and Recall. Furthermore, the RPS network improved in the IoU metrics by 0.1360, 0.0472, 0.1080, 0.0145, 0.0480, 0.0326, 0.0280, 0.0204, 0.0578, and 0.0353 relative to UNet, SegNet, DeepLab v3+, UNet++, HRNet, F3Net, DCENet, ACCoNet, STT, and CMTFNet, respectively, suggesting that the RPS results are the closest to ground truth.
3.3. Experiments on H-RPVS Dataset
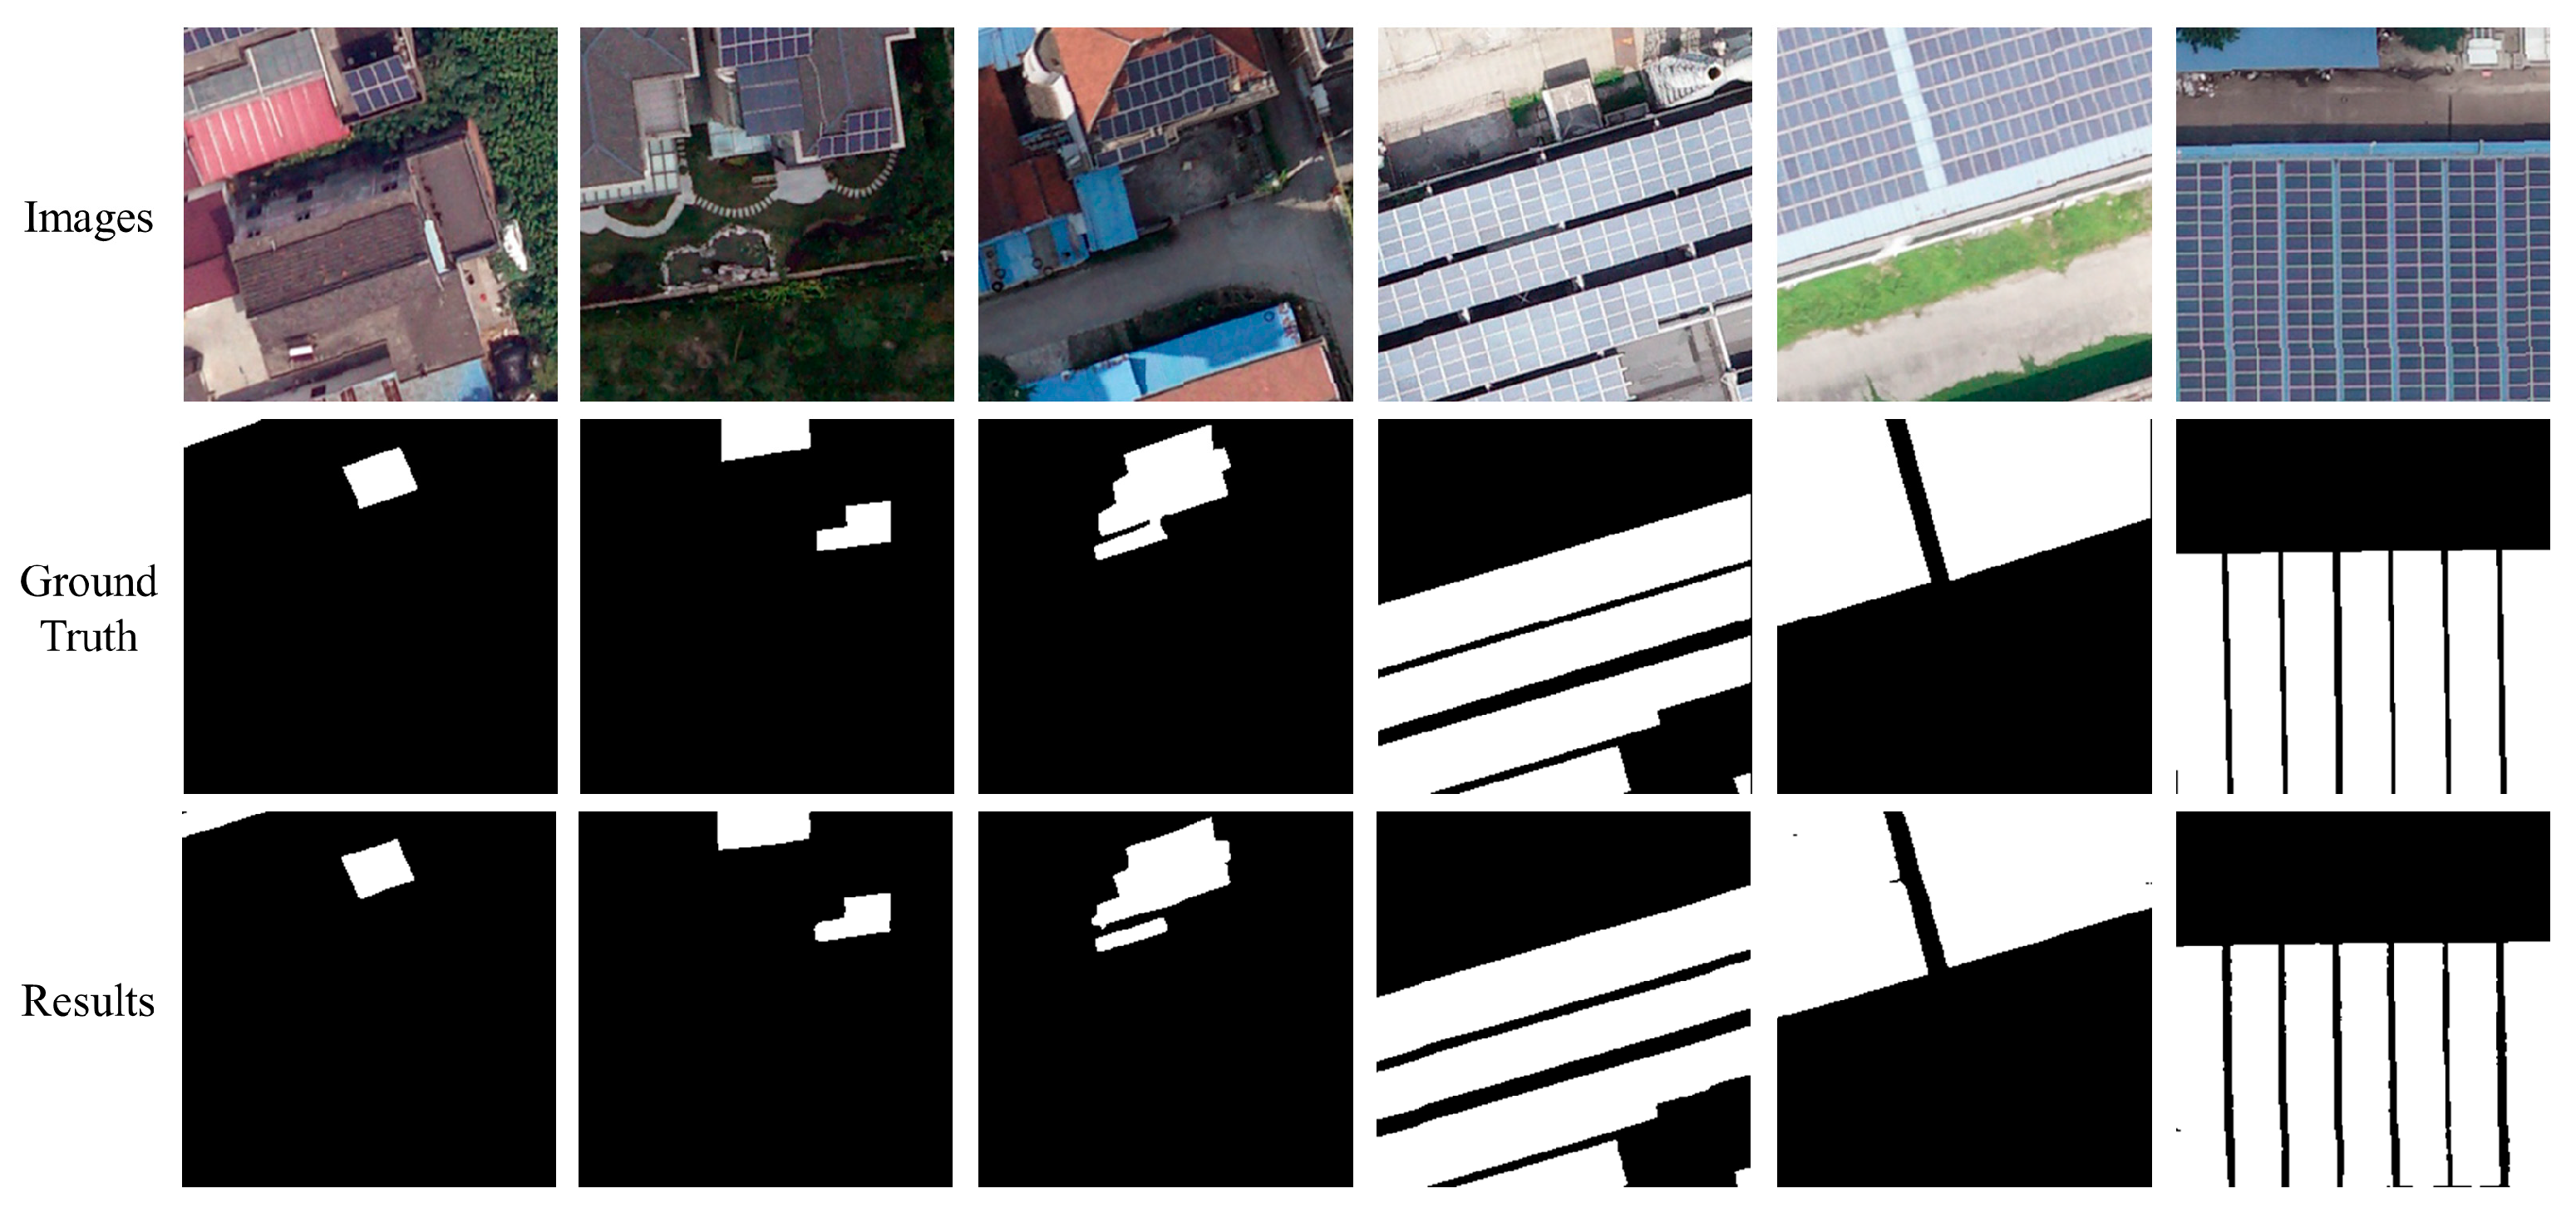
The training time for the RPS network on the H-RPVS Dataset was 285 s/epoch. During the prediction process, the inference time for each image took about 0.056 s, and the total time taken for inference on the test set was 67.46 s. Rooftop PV panel segmentation results on the H-RPVS Dataset are illustrated in Figure 8, with six columns representing representative segmentation results and thirteen rows representing the original images, ground truth, and prediction results produced independently by UNet, SegNet, DeepLab v3+, UNet++, HRNet, F3Net, DCENet, ACCoNet, STT, CMTFNet, and the proposed RPS network. In contrast to the C-DSPV Dataset, the images from the H-RPVS Dataset were acquired at different sensors and imaging times.
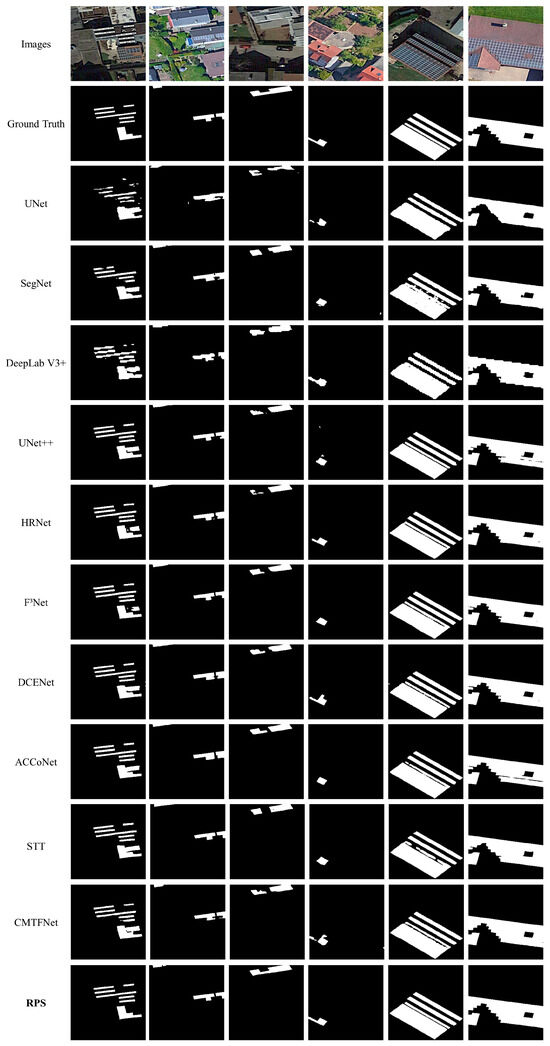
Figure 8.
Rooftop PV panel segmentation results on H-RPVS Dataset.
As shown in Figure 8, the first, third, and fifth columns belong to the same imaging condition, while the second, fourth, and sixth columns belong to another imaging condition. The RPS network is shown to be robust in different conditions and can generate the refined segmentation results of rooftop PV panels with various sizes. For smaller rooftop PV panels, UNet, SegNet, DeepLab v3+, UNet++, HRNet, F3Net, DCENet, ACCoNet, STT, and CMTFNet can be easily confused by rooftop glass and background, leading to false detections, as shown in the first and second column. Additionally, the RPS network is reliable in maintaining the integrity of prediction results and minimizing missed detections, as shown in the third and fourth columns. For larger rooftop PV systems, RPS not only provides more integrated and independent PV panel segmentation results but also acquires more fine-grained boundaries, as shown in the fifth and sixth columns. The results indicate that RPS is more aware of various sizes of rooftop PV panels. These visual results are well supported by the quantitative accuracy metrics for all the tested models shown in Table 3.
Table 3.
Accuracy assessment results of tested models on the H-RPVS Dataset (with the bold and underlined data for the best and second-best metrics).
In Table 3, the proposed RPS network is shown to achieve the highest values in Precision, Recall, F1-Score, and IoU, indicating its best performance in the refined segmentation of rooftop PV panels among all the tested models. For the comparison models, ACCoNet obtained results only second to RPS. The Precision value of 0.9583 and the Recall value of 0.9634 in the RPS network are 0.0017–0.0617 and 0.0055–0.0606 higher than those in the comparison models, respectively. The RPS F1-Score of 0.9608 is 0.0039 to 0.0611 higher than that of the comparison methods, indicating that the RPS network can best balance false and missed detections in all the tested models. The highest IoU of 0.9246 of RPS is 0.072–0.1070 higher than the IoU values of the comparison models, demonstrating that RPS has optimal applicability in extracting rooftop PV panels with varying sizes under different imaging conditions.
4. Analysis and Discussion
4.1. Ablation Analysis
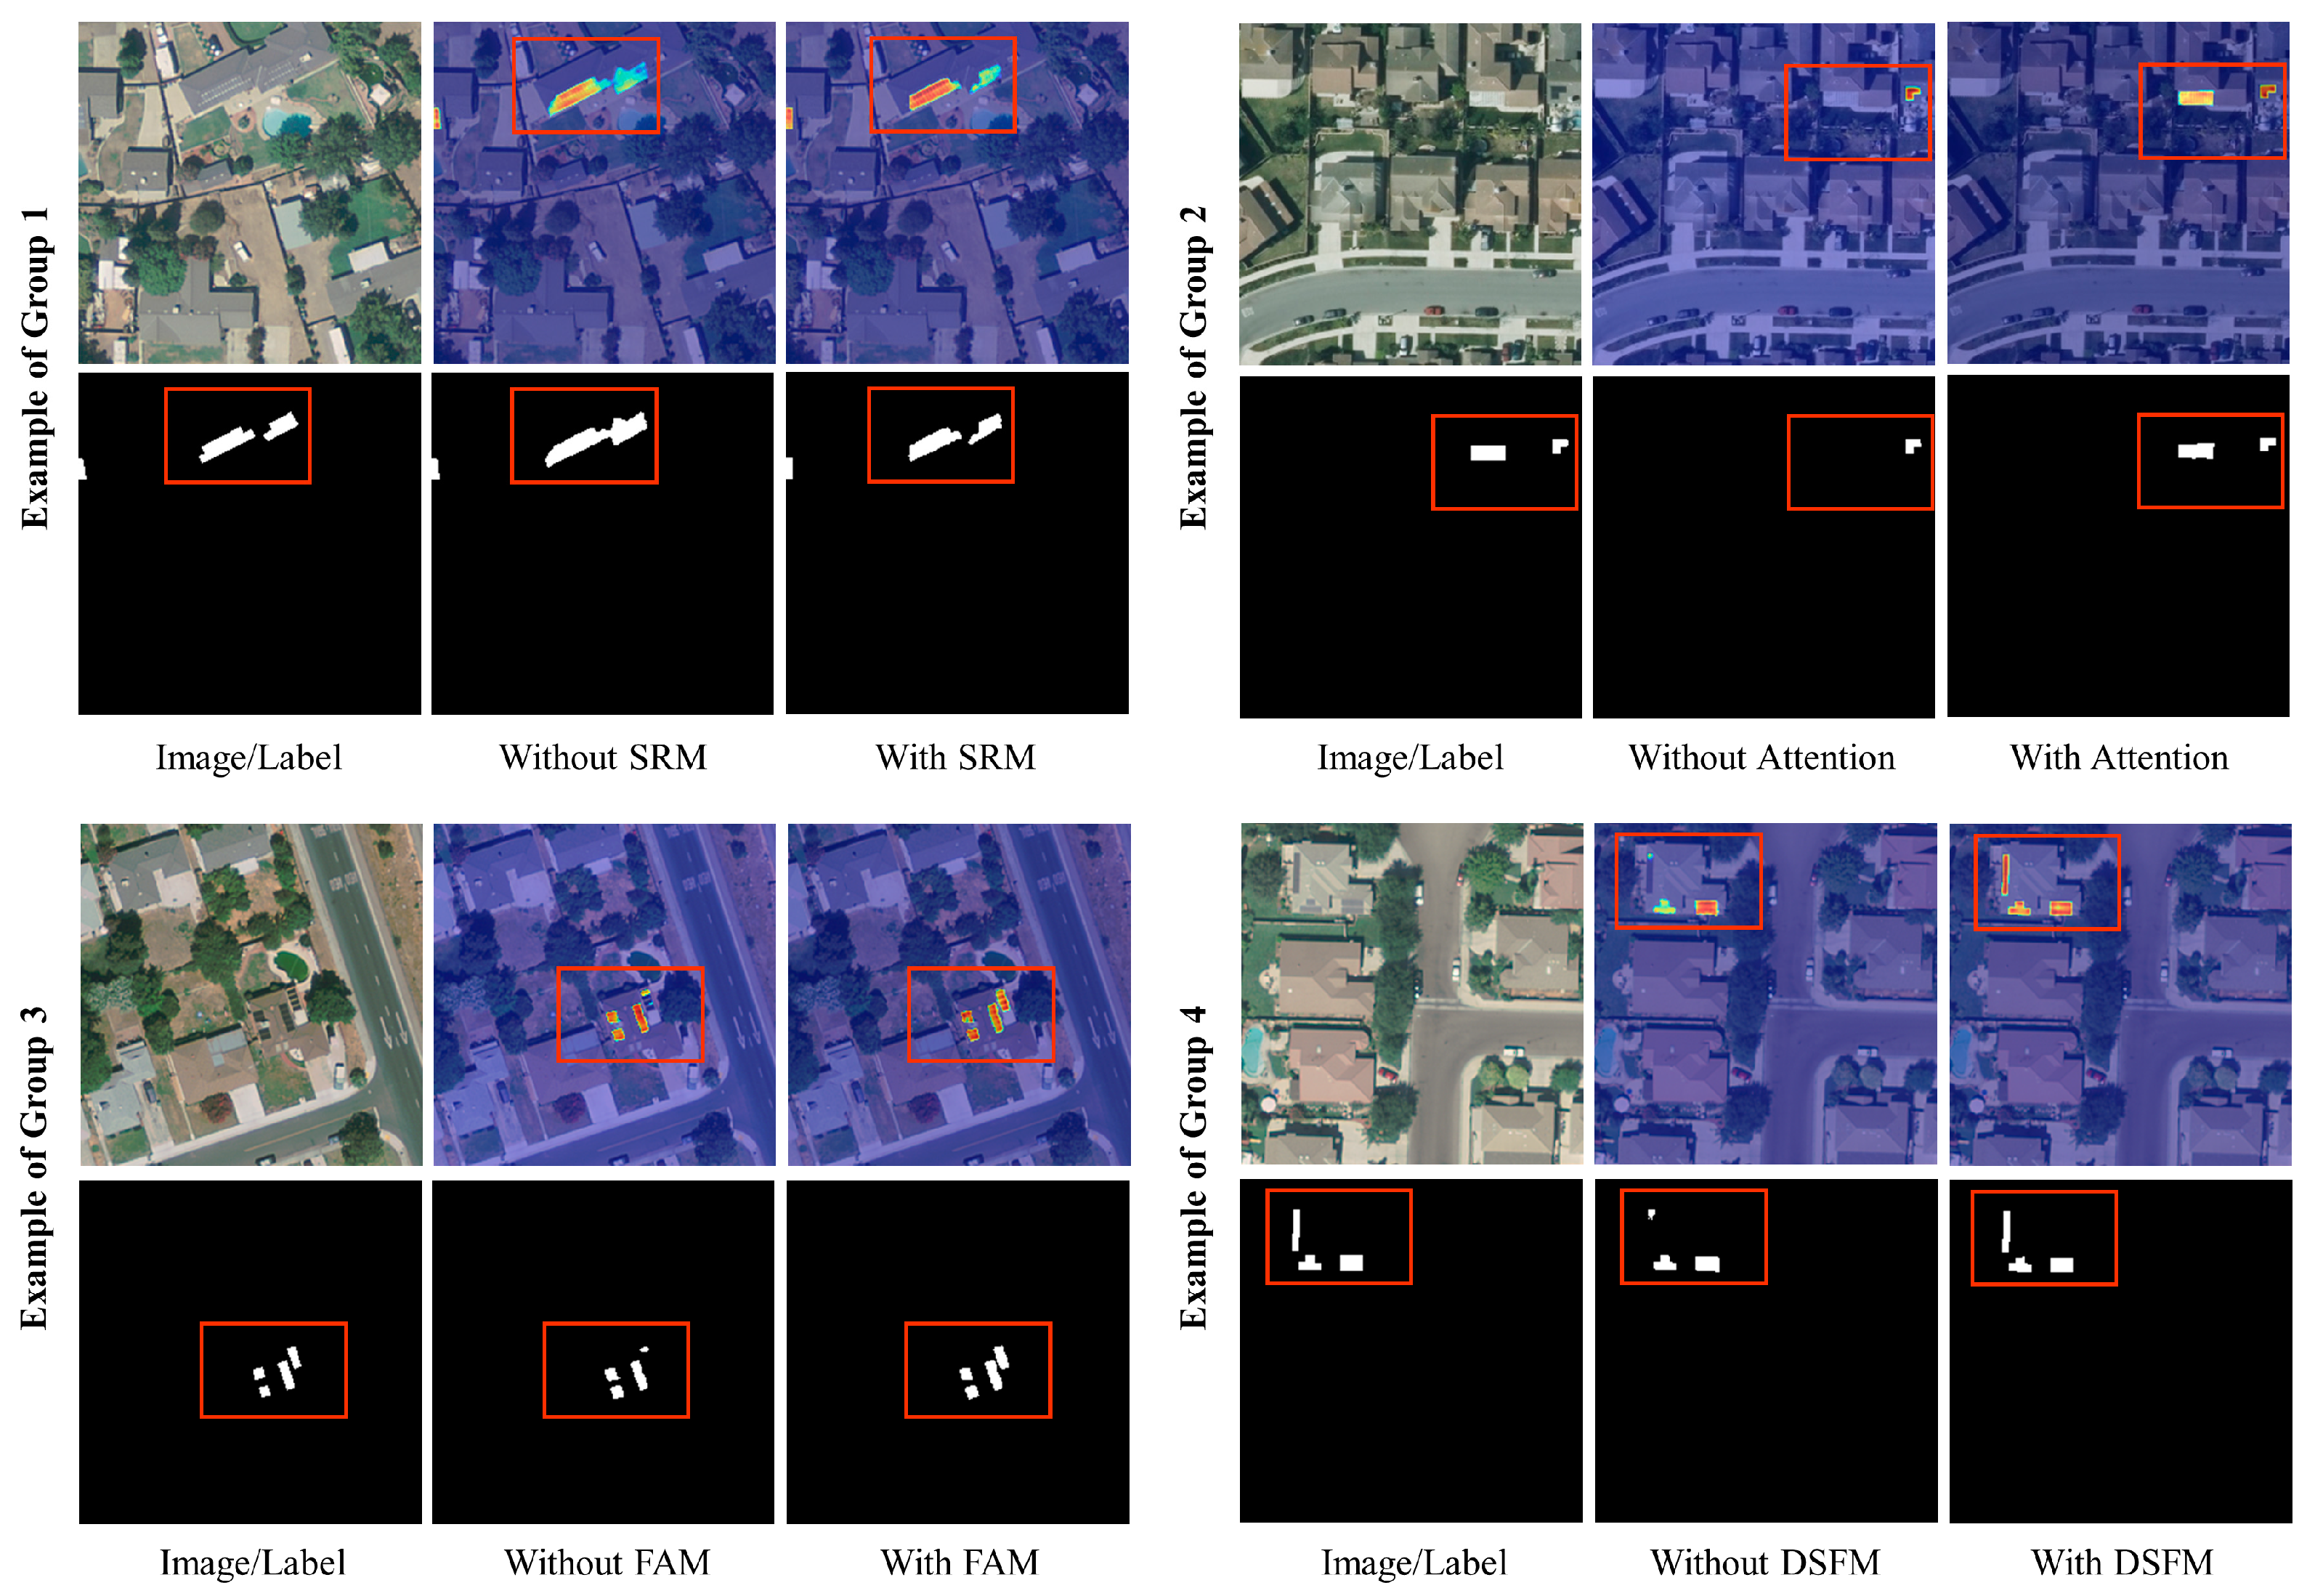
The qualitative and quantitative experimental results have demonstrated the superior performance of RPS on the C-DSPV Dataset and the H-RPVS Dataset. In this section, the effectiveness of different components of RPS was further analyzed by ablation experiments, which were all conducted on the C-DSPV Dataset. A total of four ablation experimental groups were established: (i) with or without SRM, without SRM using Joint Upsampling (JU); (ii) with (S-A) or without position and channel attention (S-NA) in SRM; (iii) with or without the aggregation and fusion of features by FAM; and (iv) with or without DSFM, without DSFM outputting the results of decoder layer 1. To ensure fairness, ResNet-34 was used as the backbone in the four groups of ablation experiments. Figure 9 presents the visualization rooftop PV panel segmentation results of the four groups of ablation experiments (each example includes two rows) in the test dataset. In the examples for each group, the three columns represent the original images/ground truth, as well as the Class Activation Mapping (CAM) [53] and prediction results generated separately with and without the corresponding component.
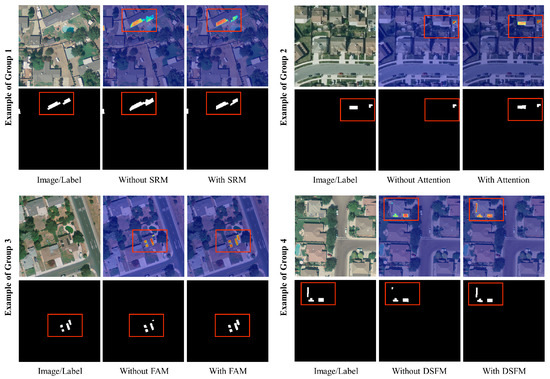
Figure 9.
Rooftop PV panel segmentation results of ablation experiments.
In Figure 9, the RPS network, encompassing all its constituent components, is seen to attain a highly superior performance, highlighting the indispensability of each component within the RPS network. The CAM can be used to visualize the region of interest of the model for rooftop PVs, thus helping to comprehend the differences between models containing different components. As shown in example 1, a SRM coupled with a depth-separated feature pyramid and attention mechanism optimization was more sensitive to sizes in rooftop PV arrays than traditional JU and therefore efficiently distinguished between individual PV panels. Position and channel attention could optimize the contextual features by modeling the semantic interdependence of spatial and channel dimensions, thus improving the saliency of rooftop PV detection, as shown in example 2. FAM could enhance the representation of robustness features of rooftop PV areas by aggregating multi-scale semantic and detailed features to avoid missed detections, as shown in example 3. Example 4 demonstrates that DSFM could obtain the closest result to the ground truth by constraining the output at different scales. The visual results are well supported by the accuracy assessment results of the ablation experiments shown in Table 4.
Table 4.
Accuracy assessment results of ablation experiments (with the bold and underlined data for the best and second-best accuracies, and “√” for the component used in this experiment).
In Table 4, the model integrating all components is seen to achieve the highest performance in Recall, F1-Score, and IoU. Despite not having the highest Precision value in the RPS equipped with constituent components, the best performance in controlling missed detections ensures an improvement of 0.003–0.0061 and 0.0052–0.0104 in F1-Score and IoU, with the importance of different components in the order of FAM, SRM, DSFM, and Attention mechanism. In summary, the RPS network that integrates all components can not only be aware of size variations of PV panels but also enhance feature representation by fusing semantic-visual features and multi-scale output depth-supervised constraints to achieve the refined segmentation of rooftop PV panels.
4.2. Generalization Capability
Ablation experiments have demonstrated the effectiveness of RPS networks. In this section, we utilized another rooftop PV dataset to test the generalization capability of the RPS network. The utilized dataset is from the multi-resolution dataset for PV panel segmentation published by Jiang et al. [35]. This dataset contains 3716 samples annotated in Jiangsu Province, China, including different types of PVs such as centralized PVs, distributed ground-mounted PVs, and fine-grained rooftop PVs. Considering the consistency with the objective of this study and the resolution used, we chose its subset “PV01” to test the generalization ability, which contains 645 rooftop PV samples (256 × 256 × 3) with a spatial resolution of 0.1 m. Segmentation of rooftop PV panels was carried out based on the proposed RPS network and H-RPVS Dataset. Figure 10 presents the visualization of rooftop PV segmentation results on the Chinese dataset. The three rows represent the original image, ground truth, and prediction results, and the six columns showcase the representative segmentation results.

Figure 10.
Rooftop PV panel segmentation results of the PV01 dataset.
As shown in Figure 10, the RPS network demonstrates excellent segmentation performance on the PV01 dataset. Smaller-size rooftop PV panels (the first three columns), as well as larger-size rooftop PV panels (the last three columns), can be successfully extracted. To further quantitatively verify the generalization capability of the RPS network, we further compared it with the accuracy assessment results of the Deep Solar PV Refiner (DSPR) proposed by Zhu et al. It is worth noting that DSPR also evaluated the generalization capability based on the PV01 dataset. To make a fair comparison, we also used the overall precision, recall, F1-Score, and IoU metrics for the accuracy assessment. Table 5 shows that compared with DSPR, although the recall of the RPS network decreases by 0.0232, the precision, F1-Score, and IoU increase by 0.0583, 0.0168, and 0.0303, which suggests that our proposed network has a stronger generalization performance across different datasets compared with DSPR.
Table 5.
Comparison of accuracy assessment on PV01 dataset (with the bold data for the best metrics).
4.3. Extension Applications
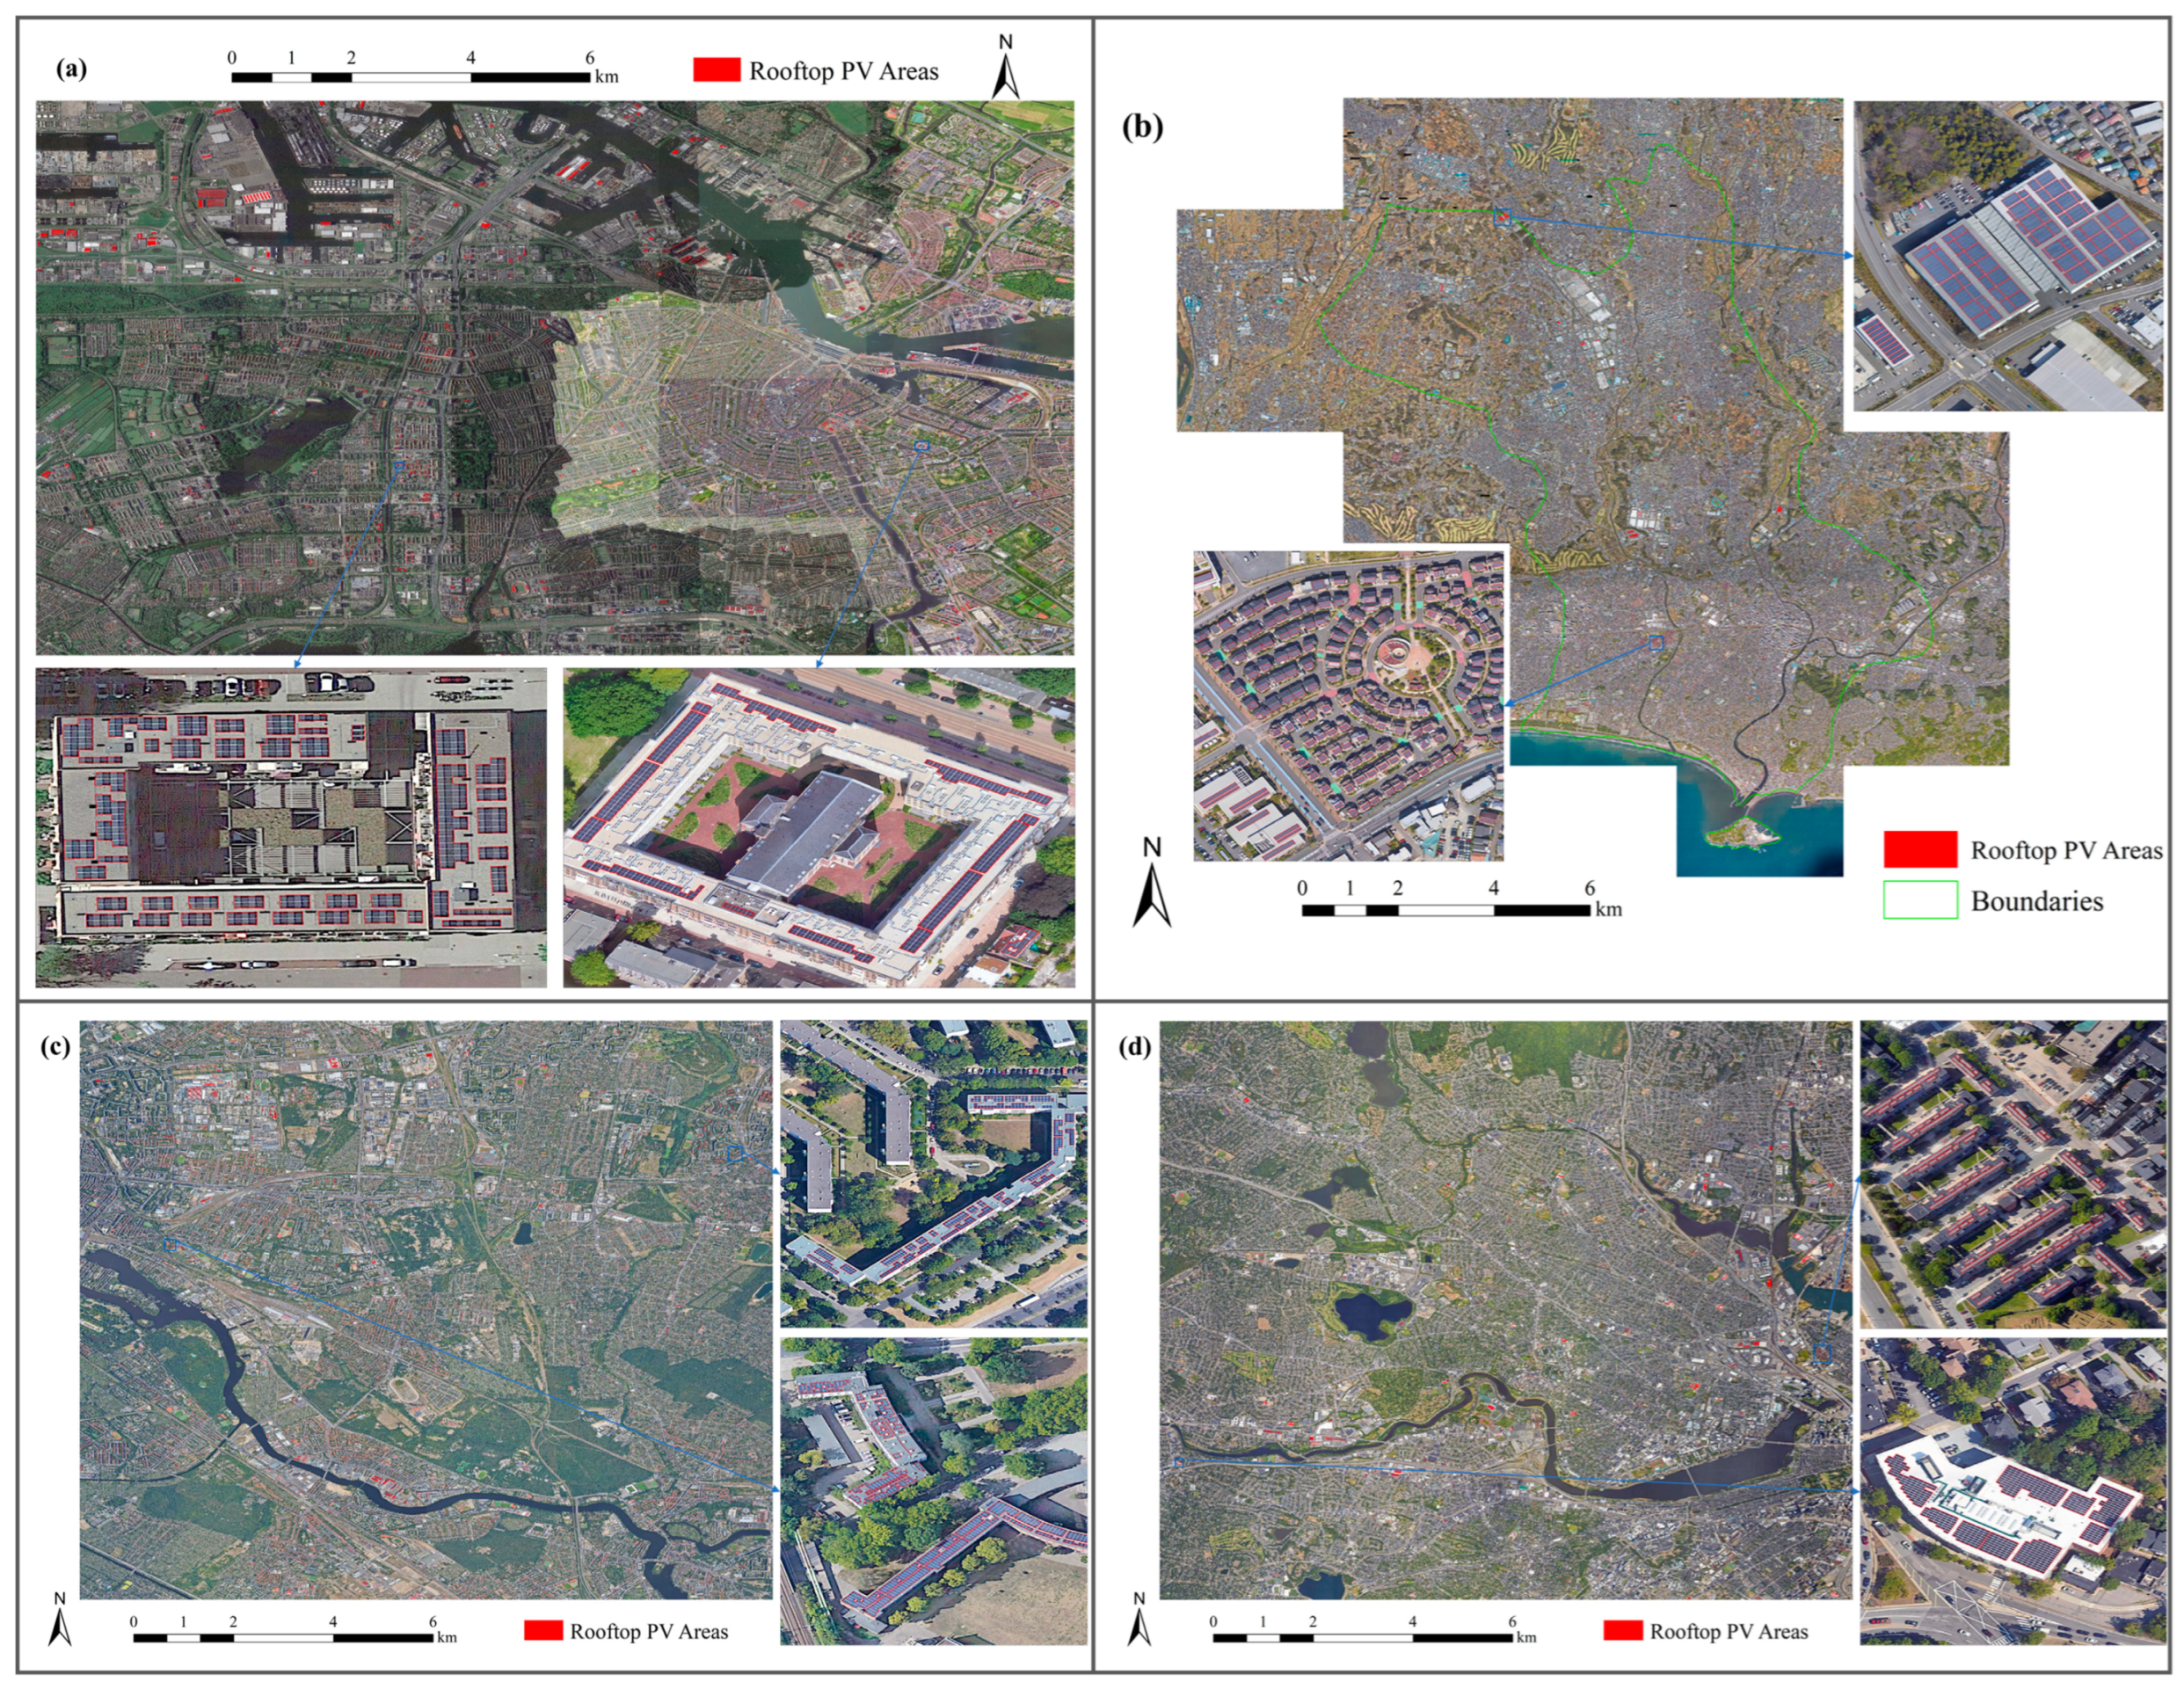
Rooftop PV modules and other components can be installed in roof areas. Analyzing the correlation between rooftop PV distribution and building rooftops to reveal rooftop PV utilization is critical for regional energy potential assessment and planning [54]. In this study, extension applications were performed in four regions around the world, and the results were compared with building rooftop footprints to understand the relationship between rooftop PV installations and building rooftop footprints in different regions. The four regions selected are from Amsterdam (The Netherlands), Fujisawa (Japan), Berlin (Germany), and Boston (USA), spanning an area of 98.6, 66.5, 119.1, and 98.6 km2, respectively, with imagery from Google Earth, and building footprints from building vectors provided by OpenStreetMap (OSM). Segmentation of rooftop PV panels was carried out based on the proposed RPS network and H-RPVS Dataset. Post-processing operations such as spatial filtering and semantic fusion are implemented on the predicted rooftop PV panel segmentation results to generate complete rooftop PV installations across different regions. Figure 11 displays the extension application results of rooftop PV installations within the four regions.

Figure 11.
The extension application results of rooftop PV installations within Amsterdam (a), Fujisawa (b), Berlin (c), and Boston (d).
As illustrated in Figure 9, the RPS network could effectively extract various sizes of rooftop PV installations in different regions. Due to regional differences in the spatial distribution characteristics of buildings, rooftop PV installations also exhibited different features, so the mapping results of rooftop PV installations were further compared with building footprints across the four regions in terms of quantity, area, average size, proportion of buildings with PV installations, and utilization rate of building roofs. Table 6 presents the statistics of buildings and PV installations in the four regions.
Table 6.
Comparison of the statistics of buildings and PVs in the four regions.
As shown in Table 6, Amsterdam, Fujisawa, Berlin, and Boston contain 138,569, 117,083, 55,035, and 109,585 buildings, with an area of 18.8, 13.1, 12.2, and 22.4 km2, respectively. Additionally, the quantity and area of PV installations are 19,454, 10,688, 8855, and 7097, covering an area of 0.53, 0.28, 0.23, and 0.29 km2, respectively. Although the size of rooftop PV installations is limited by the available roof area of a building, the average size of rooftop PV installations is not consistent with the size of the building roofs. A possible explanation for this inconsistency is the variations from region to region in the installation and maintenance costs of rooftop PV systems, new energy planning and promotion policies, and building styles. Berlin has the largest average size of buildings (221 m2), but the smallest average size of rooftop PV installations (25.4 m2); Fujisawa has the smallest average building size of 112 m2, lower than the 135 m2 in Amsterdam and 204 m2 in Boston, and their average sizes of rooftop PV installations are 25.9, 27.4, and 40.7 m2. The variations in the proportion of buildings with PVs indicate that the penetration of rooftop PV systems is different across the four regions. In Amsterdam, buildings with rooftop PV installations account for 6.59% of the total, which is the highest, followed by Fujisawa at 6.17%, Berlin at 5.17%, and Boston at 3.16%. The utilization rate of building roofs is directly related to the penetration of rooftop PV systems, showing a pattern consistent with the proportion of buildings with PVs in the four regions, which is 2.82% in Amsterdam, 2.15% in Fujisawa, 1.89% in Berlin, and 1.29% in Boston. Additionally, the rooftop utilization rate can be further used to assess the potential for regional development of rooftop PV systems. Boston has a high potential for developing rooftop PV systems due to its larger rooftop installation space, despite the current underutilization of its rooftop space. Overall, the RPS network and public dataset presented here can strongly support downstream applications in the energy sector.
4.4. Uncertainty and Outlook
In the present study, deep learning has been proven as able to refine the segmentation of small-scale rooftop PV panels from high-resolution imagery. However, in the segmentation process of rooftop PV panels, there are still some uncertainties that need further discussion and analysis. Here, we summarize the uncertainties in terms of PV panel characteristics, PV dataset distribution, and segmentation model applicability, intending to improve and optimize the proposed RPS network in the future.
PV panel characteristics: PV panels/modules that compose rooftop PV systems show a high degree of color and texture consistency, as well as regular boundaries in remote sensing imageries [17]. However, in the instantaneous view of aerospace/aerospace sensors, the phenomena of “different spectra for the same object” and “different objects with the same spectrum” remain, and it is difficult to unify the imaging features of PV panels under various sensors and scenarios. In the RGB-only image, the confusion of rooftop greenhouse/rooftop glass and PV panels can lead to false detections, while shadows and masking can result in missed detections. To solve these problems, more sensors and bands (hyperspectral, infrared, etc.) can be considered, which may contribute to enhancing the distinguishability to achieve a comprehensive recognition of rooftop PV panels.
PV dataset distribution: In the PV dataset, the PV data present a highly class-imbalanced and non-concentrated distribution [33]. Despite the design of the loss function with a focus on a smaller percentage of PV pixels to alleviate this problem in the present study, future research efforts can focus on quantifying the uncertainty of the above problems and exploring more effective approaches (e.g., sampling method, loss function, and model design). In addition, expanding PV datasets to cover more types of scenarios, more sizes, and more data sources with more sensors can broaden the applications of rooftop PV system segmentation.
Segmentation model applicability: Rooftop PV has a high size variable, and there is a difference in the segmentation results of smaller-scale residential rooftop PV panels and larger-scale non-residential rooftop PV systems [31]. In this study, the RPS network focused on the varying sizes of rooftop PV panels. Although the proposed RPS network can output the closest prediction to real rooftop PV panels, designing models able to account for more unique features (textures, boundaries, etc.) of rooftop PV panels is an effective approach to targeting PV segmentation performance. Additionally, building smart energy models with physical sense by integrating domain knowledge of rooftop PV into data-driven specialized models or foundation models, such as the Segment Anything Model (SAM) [55], is a potential way to optimize PV panel segmentation results.
5. Conclusions
So far, numerous studies have focused on improving the segmentation performance of rooftop PV panels using generalized models, but their small-scale and size-varying characteristics make the segmentation results suffer from PV internal incompleteness and small PV omission. To address these issues, a size-aware deep learning network called Rooftop PV Segmenter was proposed for segmenting small-scale rooftop PV systems from high-resolution imagery in this study. The test of the RPS network with eight comparison models revealed that the proposed model could effectively address the problems of PV internal incompleteness and small PV omission in PV segmentation results, generating results closest to the ground truth, with F1-score and IoU metrics reaching 0.9186 and 0.8495 on the publicly available C-DSPV Dataset, and 0.9608 and 0.9246 on the self-annotated H-RPVS Dataset. The effectiveness and generalizability of the RPS network were further verified by ablation and generalization capacity experiments. Moreover, the proposed RPS network was shown to have the potential for extension applications across different regions by the application in Amsterdam, Fujisawa, Berlin, and Boston. The overall results of this study indicated that the proposed RPS network can be an effective solution for establishing a refined small-scale energy distribution database.
Author Contributions
Conceptualization, J.W. and H.S.; methodology, J.W., X.C. and W.S.; software, J.W. and W.J.; validation, J.W., X.Z. and L.H.; formal analysis, J.W. and X.C.; investigation, J.W. and J.L; resources, H.S. and J.L.; data curation, X.C. and W.S.; writing—original draft preparation, J.W.; writing—review and editing, J.W., L.H., J.L. and H.S.; visualization, J.W., X.C. and W.J.; supervision, H.S. All authors have read and agreed to the published version of the manuscript.
Funding
This research was funded by the National Natural Science Foundation of China Major Program (42192580, 42192583) and the Guangxi Science and Technology Major Project (No. AA22068072).
Data Availability Statement
The California Distributed Solar PV Array Dataset can be downloaded from https://figshare.com/collections/Full_Collection_Distributed_Solar_Photovoltaic_Array_Location_and_Extent_Data_Set_for_Remote_Sensing_Object_Identification/3255643 (accessed on 31 July 2020); The H-RPVS Dataset is available at https://github.com/RS-Wangjx/H-RPVS-Dataset (accessed on 28 August 2023).
Acknowledgments
We thank Xin Chen and Li Hua of Huazhong agricultural University for the support in conducting this study.
Conflicts of Interest
The authors declare that they have no known competing financial interests or personal relationships that could have appeared to influence the work reported in this paper.
Correction Statement
This article has been republished with a minor correction to resolve spelling and grammatical errors. This change does not affect the scientific content of the article.
Nomenclature
| PV | Photovoltaic |
| RPS | Rooftop PV Segmenter |
| DL | Deep Learning |
| CNNs | Convolutional Neural Networks |
| SRM | Semantic Refinement Module |
| FAM | Feature Aggregation Module |
| DSFM | Deep Supervised Fusion Module |
| C-DSPV | California Distributed Solar PV Array |
| H-RPVS | Heilbronn Rooftop PV System |
| BN | Batch Normalization |
| GPU | Graphics Processing Unit |
| BCE | Binary Cross Entropy |
| IoU | Intersection over Union |
| SSIM | Structural Similarity |
| JU | Joint Upsampling |
| S-A | SRM with Attention |
| S-NA | SRM without Attention |
| CAM | Class Activation Mapping |
| DSPR | Deep Solar PV Refiner |
| OSM | OpenStreetMap |
References
- Olabi, A.; Abdelkareem, M.A. Renewable energy and climate change. Renew. Sustain. Energy Rev. 2022, 158, 112111. [Google Scholar] [CrossRef]
- Zakari, A.; Khan, I.; Tan, D.; Alvarado, R.; Dagar, V. Energy efficiency and sustainable development goals (SDGs). Energy 2022, 239, 122365. [Google Scholar] [CrossRef]
- Hepburn, C.; Qi, Y.; Stern, N.; Ward, B.; Xie, C.; Zenghelis, D. Towards carbon neutrality and China’s 14th Five-Year Plan: Clean energy transition, sustainable urban development, and investment priorities. Environ. Sci. Ecotechnol. 2021, 8, 100130. [Google Scholar] [CrossRef] [PubMed]
- Talayero, A.P.; Melero, J.J.; Llombart, A.; Yürüşen, N.Y. Machine Learning models for the estimation of the production of large utility-scale photovoltaic plants. Sol. Energy 2023, 254, 88–101. [Google Scholar] [CrossRef]
- Libra, M.; Daneček, M.; Lešetický, J.; Poulek, V.; Sedláček, J.; Beránek, V. Monitoring of defects of a photovoltaic power plant using a drone. Energies 2019, 12, 795. [Google Scholar] [CrossRef]
- Jayasooriya, V.; Fernando, S.; Silva, C.; Muthukumaran, S. Comparative analysis on the effectiveness of green roofs and photovoltaic panels as sustainable rooftop technologies. Environ. Sci. Pollut. Res. 2023, 30, 98977–98992. [Google Scholar] [CrossRef]
- Gassar, A.A.A.; Cha, S.H. Review of geographic information systems-based rooftop solar photovoltaic potential estimation approaches at urban scales. Appl. Energy 2021, 291, 116817. [Google Scholar] [CrossRef]
- Ren, S.; Hu, W.; Bradbury, K.; Harrison-Atlas, D.; Valeri, L.M.; Murray, B.; Malof, J.M. Automated extraction of energy systems information from remotely sensed data: A review and analysis. Appl. Energy 2022, 326, 119876. [Google Scholar] [CrossRef]
- Oh, M.; Kim, C.K.; Kim, B.; Kang, Y.; Kim, H.G. Real-Time Terrain Correction of Satellite Imagery-Based Solar Irradiance Maps Using Precomputed Data and Memory Optimization. Remote Sens. 2023, 15, 3965. [Google Scholar] [CrossRef]
- Zhang, C.; Zhang, H.; Tian, S. Phenology-assisted supervised paddy rice mapping with the Landsat imagery on Google Earth Engine: Experiments in Heilongjiang Province of China from 1990 to 2020. Comput. Electron. Agric. 2023, 212, 108105. [Google Scholar] [CrossRef]
- Zhang, L.; Zhang, L. Artificial intelligence for remote sensing data analysis: A review of challenges and opportunities. IEEE Geosci. Remote Sens. Mag. 2022, 10, 270–294. [Google Scholar] [CrossRef]
- Jiang, W.; Tian, B.; Duan, Y.; Chen, C.; Hu, Y. Rapid mapping and spatial analysis on the distribution of photovoltaic power stations with Sentinel-1&2 images in Chinese coastal provinces. Int. J. Appl. Earth Obs. Geoinf. 2023, 118, 103280. [Google Scholar] [CrossRef]
- Wang, J.; Chen, X.; Jiang, W.; Hua, L.; Liu, J.; Sui, H. PVNet: A novel semantic segmentation model for extracting high-quality photovoltaic panels in large-scale systems from high-resolution remote sensing imagery. Int. J. Appl. Earth Obs. Geoinf. 2023, 119, 103309. [Google Scholar] [CrossRef]
- Xia, Z.; Li, Y.; Guo, X.; Chen, R.J. High-resolution mapping of water photovoltaic development in China through satellite imagery. Int. J. Appl. Earth Obs. Geoinf. 2022, 107, 102707. [Google Scholar] [CrossRef]
- Mayer, K.; Rausch, B.; Arlt, M.-L.; Gust, G.; Wang, Z.; Neumann, D.; Rajagopal, R. 3D-PV-Locator: Large-scale detection of rooftop-mounted photovoltaic systems in 3D. Appl. Energy 2022, 310, 118469. [Google Scholar] [CrossRef]
- Ren, S.; Malof, J.; Fetter, R.; Beach, R.; Rineer, J.; Bradbury, K. Utilizing Geospatial Data for Assessing Energy Security: Mapping Small Solar Home Systems Using Unmanned Aerial Vehicles and Deep Learning. ISPRS Int. J. Geo-Inf. 2022, 11, 222. [Google Scholar] [CrossRef]
- Tan, H.; Guo, Z.; Zhang, H.; Chen, Q.; Lin, Z.; Chen, Y.; Yan, J. Enhancing PV panel segmentation in remote sensing images with constraint refinement modules. Appl. Energy 2023, 350, 121757. [Google Scholar] [CrossRef]
- Malof, J.M.; Bradbury, K.; Collins, L.M.; Newell, R.G.; Serrano, A.; Wu, H.; Keene, S. Image features for pixel-wise detection of solar photovoltaic arrays in aerial imagery using a random forest classifier. In Proceedings of the IEEE International Conference on Renewable Energy Research and Applications (ICRERA), Birmingham, UK, 20–23 November 2016; pp. 799–803. [Google Scholar] [CrossRef]
- Malof, J.M.; Bradbury, K.; Collins, L.M.; Newell, R.G. Automatic detection of solar photovoltaic arrays in high resolution aerial imagery. Appl. Energy 2016, 183, 229–240. [Google Scholar] [CrossRef]
- Wang, M.; Cui, Q.; Sun, Y.; Wang, Q.; Sensing, R. Photovoltaic panel extraction from very high-resolution aerial imagery using region–line primitive association analysis and template matching. ISPRS-J. Photogramm. Remote Sens. 2018, 141, 100–111. [Google Scholar] [CrossRef]
- Li, Z.; Liu, F.; Yang, W.; Peng, S.; Zhou, J. A survey of convolutional neural networks: Analysis, applications, and prospects. IEEE Trans. Neural Netw. Learn. Syst. 2021, 33, 6999–7019. [Google Scholar] [CrossRef]
- Strudel, R.; Garcia, R.; Laptev, I.; Schmid, C. Segmenter: Transformer for semantic segmentation. In Proceedings of the IEEE/CVF International Conference on Computer Vision (ICCV), Virtual, 11–17 October 2021; pp. 7262–7272. [Google Scholar] [CrossRef]
- Minaee, S.; Boykov, Y.; Porikli, F.; Plaza, A.; Kehtarnavaz, N.; Terzopoulos, D. Image segmentation using deep learning: A survey. IEEE Trans. Pattern Anal. Mach. Intell. 2021, 44, 3523–3542. [Google Scholar] [CrossRef] [PubMed]
- Kotaridis, I.; Lazaridou, M. Remote sensing image segmentation advances: A meta-analysis. ISPRS-J. Photogramm. Remote Sens. 2021, 173, 309–322. [Google Scholar] [CrossRef]
- Chen, Q.; Li, X.; Zhang, Z.; Zhou, C.; Guo, Z.; Liu, Z.; Zhang, H. Remote sensing of photovoltaic scenarios: Techniques, applications and future directions. Appl. Energy 2023, 333, 120579. [Google Scholar] [CrossRef]
- Ronneberger, O.; Fischer, P.; Brox, T. U-net: Convolutional networks for biomedical image segmentation. Int. Conf. Med. Image Comput. Comput.-Assist. Interv. 2015, 3, 234–241. [Google Scholar] [CrossRef]
- Badrinarayanan, V.; Kendall, A.; Cipolla, R. Segnet: A deep convolutional encoder-decoder architecture for image segmentation. IEEE Trans. Pattern Anal. Mach. Intell. 2017, 39, 2481–2495. [Google Scholar] [CrossRef]
- Chen, L.-C.; Zhu, Y.; Papandreou, G.; Schroff, F.; Adam, H. Encoder-decoder with atrous separable convolution for semantic image segmentation. In Proceedings of the European Conference on Computer Vision (ECCV), Munich, Germany, 8–14 September 2018; pp. 801–818. [Google Scholar]
- Xie, E.; Wang, W.; Yu, Z.; Anandkumar, A.; Alvarez, J.M.; Luo, P. SegFormer: Simple and efficient design for semantic segmentation with transformers. Adv. Neural Inf. Process. Syst. 2021, 34, 12077–12090. [Google Scholar]
- Zhuang, L.; Zhang, Z.; Wang, L. The automatic segmentation of residential solar panels based on satellite images: A cross learning driven U-Net method. Appl. Soft. Comput. 2020, 92, 106283. [Google Scholar] [CrossRef]
- Yu, J.; Wang, Z.; Majumdar, A.; Rajagopal, R. DeepSolar: A machine learning framework to efficiently construct a solar deployment database in the United States. Joule 2018, 2, 2605–2617. [Google Scholar] [CrossRef]
- Zhu, R.; Guo, D.; Wong, M.S.; Qian, Z.; Chen, M.; Yang, B.; Chen, B.; Zhang, H.; You, L.; Heo, J. Deep solar PV refiner: A detail-oriented deep learning network for refined segmentation of photovoltaic areas from satellite imagery. Int. J. Appl. Earth Obs. Geoinf. 2023, 116, 103134. [Google Scholar] [CrossRef]
- Li, P.; Zhang, H.; Guo, Z.; Lyu, S.; Chen, J.; Li, W.; Song, X.; Shibasaki, R.; Yan, J. Understanding rooftop PV panel semantic segmentation of satellite and aerial images for better using machine learning. Adv. Appl. Energy 2021, 4, 100057. [Google Scholar] [CrossRef]
- Bradbury, K.; Saboo, R.; Johnson, T.L.; Malof, J.M.; Devarajan, A.; Zhang, W.; Collins, L.M.; Newell, R.G. Distributed solar photovoltaic array location and extent dataset for remote sensing object identification. Sci. Data 2016, 3, 160106. [Google Scholar] [CrossRef] [PubMed]
- Jiang, H.; Yao, L.; Lu, N.; Qin, J.; Liu, T.; Liu, Y.; Zhou, C. Multi-resolution dataset for photovoltaic panel segmentation from satellite and aerial imagery. Earth Syst. Sci. Data 2021, 13, 5389–5401. [Google Scholar] [CrossRef]
- Kasmi, G.; Saint-Drenan, Y.-M.; Trebosc, D.; Jolivet, R.; Leloux, J.; Sarr, B.; Dubus, L. A crowdsourced dataset of aerial images with annotated solar photovoltaic arrays and installation metadata. Sci. Data 2023, 10, 59. [Google Scholar] [CrossRef] [PubMed]
- Stowell, D.; Kelly, J.; Tanner, D.; Taylor, J.; Jones, E.; Geddes, J.; Chalstrey, E. A harmonised, high-coverage, open dataset of solar photovoltaic installations in the UK. Sci. Data 2020, 7, 394. [Google Scholar] [CrossRef] [PubMed]
- Kruitwagen, L.; Story, K.; Friedrich, J.; Byers, L.; Skillman, S.; Hepburn, C. A global inventory of photovoltaic solar energy generating units. Nature 2021, 598, 604–610. [Google Scholar] [CrossRef]
- Ortiz, A.; Negandhi, D.; Mysorekar, S.R.; Nagaraju, S.K.; Kiesecker, J.; Robinson, C.; Bhatia, P.; Khurana, A.; Wang, J.; Oviedo, F. An artificial intelligence dataset for solar energy locations in India. Sci. Data 2022, 9, 497. [Google Scholar] [CrossRef]
- Zhang, X.; Xu, M.; Wang, S.; Huang, Y.; Xie, Z. Mapping photovoltaic power plants in China using Landsat, random forest, and Google Earth Engine. Earth Syst. Sci. Data 2022, 14, 3743–3755. [Google Scholar] [CrossRef]
- He, K.; Zhang, X.; Ren, S.; Sun, J. Deep residual learning for image recognition. In Proceedings of the IEEE Conference on Computer Vision and Pattern Recognition (CVPR), Las Vegas, NV, USA, 27–30 June 2016; pp. 770–778. [Google Scholar] [CrossRef]
- Wu, H.; Zhang, J.; Huang, K.; Liang, K.; Yu, Y. Fastfcn: Rethinking dilated convolution in the backbone for semantic segmentation. arXiv 2019, arXiv:1903.11816. [Google Scholar] [CrossRef]
- Fu, J.; Liu, J.; Tian, H.; Li, Y.; Bao, Y.; Fang, Z.; Lu, H. Dual attention network for scene segmentation. In Proceedings of the IEEE Conference on Computer Vision and Pattern Recognition (CVPR), Long Beach, CA, USA, 15–20 June 2019; pp. 3146–3154. [Google Scholar] [CrossRef]
- Zhou, W.; Jin, J.; Lei, J.; Yu, L. CIMFNet: Cross-layer interaction and multiscale fusion network for semantic segmentation of high-resolution remote sensing images. IEEE J. Sel. Top. Signal Process. 2022, 16, 666–676. [Google Scholar] [CrossRef]
- Wei, J.; Wang, S.; Huang, Q. F3Net: Fusion, feedback and focus for salient object detection. In Proceedings of the AAAI Conference on Artificial Intelligence, New York, NY, USA, 7–12 February 2020; pp. 12321–12328. [Google Scholar] [CrossRef]
- Wang, Z.; Bovik, A.C.; Sheikh, H.R.; Simoncelli, E. Image quality assessment: From error visibility to structural similarity. IEEE Trans. Image Process. 2004, 13, 600–612. [Google Scholar] [CrossRef]
- Zhou, Z.; Rahman Siddiquee, M.M.; Tajbakhsh, N.; Liang, J. Unet++ A nested u-net architecture for medical image segmentation. In Deep Learning in Medical Image Analysis and Multimodal Learning for Clinical Decision Support, Proceedings of the 4th International Workshop, DLMIA 2018, and 8th International Workshop, ML-CDS 2018, Held in Conjunction with MICCAI 2018, Granada, Spain, 20 September 2018; Springer: Cham, Switzerland, 2018; pp. 3–11. [Google Scholar] [CrossRef]
- Wang, J.; Sun, K.; Cheng, T.; Jiang, B.; Deng, C.; Zhao, Y.; Liu, D.; Mu, Y.; Tan, M.; Wang, X.; et al. Deep high-resolution representation learning for visual recognition. IEEE Trans. Pattern Anal. Mach. Intell. 2020, 43, 3349–3364. [Google Scholar] [CrossRef] [PubMed]
- Mei, H.; Liu, Y.; Wei, Z.; Zhou, D.; Wei, X.; Zhang, Q.; Yang, X. Exploring dense context for salient object detection. IEEE Trans. Circuits Syst. Video Technol. 2021, 32, 1378–1389. [Google Scholar] [CrossRef]
- Li, G.; Liu, Z.; Zeng, D.; Lin, W.; Ling, H.J. Adjacent context coordination network for salient object detection in optical remote sensing images. IEEE Trans. Cybern. 2022, 53, 526–538. [Google Scholar] [CrossRef]
- Chen, K.; Zou, Z.; Shi, Z. Building extraction from remote sensing images with sparse token transformers. Remote Sens. 2021, 13, 4441. [Google Scholar] [CrossRef]
- Wu, H.; Huang, P.; Zhang, M.; Tang, W.; Yu, X. CMTFNet: CNN and Multiscale Transformer Fusion Network for Remote Sensing Image Semantic Segmentation. IEEE Trans. Geosci. Remote Sens. 2023, 61, 1–12. [Google Scholar] [CrossRef]
- Zhou, B.; Khosla, A.; Lapedriza, A.; Oliva, A.; Torralba, A. Learning deep features for discriminative localization. In Proceedings of the IEEE Conference on Computer Vision and Pattern Recognition (CVPR), Las Vegas, NV, USA, 27–30 June 2016; pp. 2921–2929. [Google Scholar] [CrossRef]
- Allegrini, J.; Orehounig, K.; Mavromatidis, G.; Ruesch, F.; Dorer, V.; Evins, R. A review of modelling approaches and tools for the simulation of district-scale energy systems. Renew. Sustain. Energ. Rev. 2015, 52, 1391–1404. [Google Scholar] [CrossRef]
- Kirillov, A.; Mintun, E.; Ravi, N.; Mao, H.; Rolland, C.; Gustafson, L.; Xiao, T.; Whitehead, S.; Berg, A.C.; Lo, W.-Y.; et al. Segment anything. arXiv 2023, arXiv:2304.02643. [Google Scholar]

Disclaimer/Publisher’s Note: The statements, opinions and data contained in all publications are solely those of the individual author(s) and contributor(s) and not of MDPI and/or the editor(s). MDPI and/or the editor(s) disclaim responsibility for any injury to people or property resulting from any ideas, methods, instructions or products referred to in the content. |
© 2023 by the authors. Licensee MDPI, Basel, Switzerland. This article is an open access article distributed under the terms and conditions of the Creative Commons Attribution (CC BY) license (https://creativecommons.org/licenses/by/4.0/).