Simple Summary
The framework for assessing the loss of access to critical infrastructure is presented, taking into account surface elevation and different types of critical facilities. Two types of analysis were performed—ex post to quantify the immediate damage and ex ante to provide information for precautionary measures. The framework provides detailed information on the population’s loss of access to each type of facility; we propose the use of network statistics to quantify and explain the consequences of flooding. To account for the possibility of accessing buildings from different sides, the notion of a multiedge facility is introduced. The simulations with randomly generated flood events, using a probability model estimated from observations, were performed as part of the ex ante assessment.
Abstract
This work presents a framework for assessing the socio-physical disruption of critical infrastructure accessibility using the example of Greater Jakarta, a metropolitan area of the Indonesian city. The first pillar of the framework is damage quantification based on the real flood event in 2020. Within this pillar, the system network statistics before and shortly after the flood were compared. The results showed that the flood impeded access to facilities, distorted transport connectivity, and increased system vulnerability. Poverty was found to be negatively associated with surface elevation, suggesting that urbanization of flood-prone areas has occurred. The second pillar was a flood simulation. Our simulations identified the locations and clusters that are more vulnerable to the loss of access during floods, and the entire framework can be applied to other cities and urban areas globally and adapted to account for different disasters that physically affect urban infrastructure. This work demonstrated the feasibility of damage quantification and vulnerability assessment relying solely on open and publicly available data and tools. The framework, which uses satellite data on the occurrence of floods made available by space agencies in a timely manner, will allow for rapid ex post investigation of the socio-physical consequences of disasters. It will save resources, as the analysis can be performed by a single person, as opposed to expensive and time-consuming ground surveys. Ex ante vulnerability assessment based on simulations will help communities, urban planners, and emergency personnel better prepare for future shocks.
1. Introduction
Cities, as places with a high concentration of population and resources, have been playing a major role in the advancement of disaster management systems. In modern society, cities are gaining an increasingly important role. The projections estimate that, by 2050, at least 68% of the world’s population will live in cities [1]. We might soon see a rise of megacities with population counts exceeding dozens of millions of people [2]. This exposes an even larger population to the risk of experiencing extreme events. Urban infrastructure is crucial to the operation of a city and required for an efficient emergency response. Risk-reduction strategies should ensure the safety of infrastructure to make it possible for facilities, such as hospitals, educational institutes, police, fire stations, communication systems, energy systems, as well as transportation systems, to continue providing services when they are needed the most [3].
This paper considered the city as a complex self-regulating system [4] consisting of a number of components that are so complex that we view them as systems within a system. Urban infrastructure together with social organization represent an ensemble of such systems; therefore, we define a city as a hybrid social–physical system or a network, where all components are embedded into its simplified topological structures. The basis of the network in this framework is roads. Although this simplistic framework cannot account for off-road travel, it is able to generate near-accurate results, because it is known that the movement in cities in the course of disasters and after disasters happens to a large degree on the roads [5].
The growth of cloud computing, big data analytics, and AI infrastructure, as well as the IoT, coupled with the massive expansion of transportation infrastructure, is making critical components of cities more interdependent and more vulnerable to attack [6]. Over-reliance on various sensors and centralized data collection and decision-making mechanisms can lead to serious problems in the event of a minor power outage or cyberattack, so the more complex a city is, the more vulnerable it is [7]. The emergence of megacities will bring even more problems, because the more edges the system has, the more likely it is to become unstable, and this transition will be sudden and catastrophic [8].
All of this significantly increases the interest of researchers, policy-makers, and practitioners in the vulnerability of urban systems to crises and disasters. Special attention is given to floods. Floods occur when water levels in rivers, lakes, ponds, reservoirs, aquifers, and estuaries exceed critical values and water overflows onto land. A flood event can also occur when the sea surges on coastal lands above the average sea level. Although flooding is a natural phenomenon that is important for the life cycle of a number of organisms, including human beings, uncontrolled urbanization of floodplains has led to huge problems with material and financial losses and has cost many human lives [9]. Satellite and airborne remote sensing systems can provide much of the information needed to delineate flood-prone areas, assess damage, and feed models that can forecast the vulnerability of inland and coastal areas to flooding [10].
We attempted to quantify the damage to the socio-physical system of the city caused by a real flood case and to assess the vulnerability of critical infrastructure and communities to future disasters. Jabodetabek, the Jakarta metropolitan area in Indonesia, also known as Greater Jakarta, was the geographical focus of this research. We quantified losses from the January 2020 major flood, which resulted in the displacement of sixty-thousand inhabitants and the death of eighty people (see Figure A1 in Appendix A).
The major problem of the Jakarta metropolitan area is that a significant portion of it is low-lying [11]; large populated areas are located below sea level, which seems to be the result of uncontrollable urbanization [12]. In the case of the January 2020 flood, heavy rainfall intensity coincided with high tides. The water was pushed into low-lying areas from the side of the ocean and from the upland areas, which caused a severe flood. The drainage system did not manage the inflow, and flooding occurred even in the higher-lying areas. This hazard caused power outages and transportation system collapse.
The paper raises three major questions:
- Research Question 1
How did the 2020 flood in Greater Jakarta affect the urban structure? What types of objects and facilities suffered the most? What percentage of the population was left without access to services?
- Research Question 2
What is the relationship between the loss of access, poverty, and elevation in Greater Jakarta?
- Research Question 3
What is the spatial socio-physical vulnerability of Greater Jakarta to the future disruption of access to services due to flooding?
The structure of the paper is as follows. This Section 1 presents a brief literature review with a description of a flood-related situation in Jakarta. Section 2, Materials and Methods, lists the data sources and discusses the peculiarities of the data collection and cleaning, as well as the data reliability, and then, explains the authors’ methodological framework. Section 3, Results, discusses the results of this research and their limitations. Section 4, Discussion, outlines the way forward. The paper ends with Section 5, Conclusions.
1.1. Vulnerability, Robustness, Resilience, and Antifragility
The risk of catastrophes is related to a power-law distribution, where the probability of an event typically varies as a power of its size [13]. The power law also governs the outcome of disasters [14]. A hazard that leads to catastrophic events is characterized by its frequency distribution and its severity distribution. It is impossible to predict the exact timing and magnitude of a future disaster event. Taking this into account, one should focus on preparedness, rather than on forecasting [15,16,17,18]. When a disaster hits, the affected community needs immediate help to save as many lives as possible, and later, it needs resources to recover quickly. When the community is prepared, it is less vulnerable and, therefore, more resilient [16].
Researchers still struggle to clearly define the system characteristics related to its ability to withstand shocks. Vulnerability is usually understood as the degree of susceptibility to the negative effects of disasters [19]. If a system is vulnerable, it can be easily damaged and lose some of its functionality. In other words, it is “the potential to suffer loss or harm” [20]. The transition of a system from a vulnerable state to a robust state means that it is no longer as easy to break or damage the system. The system becomes more resistant to stress. The accumulated damage from a hazard, however, can still cause too much stress and move the whole system into a broken state. The question is how quickly this will happen. In this framework, resilience is the ability of a system to withstand the damage of the flood and continue to provide access to critical services for the population. Resilience is a vague concept with dozens of definitions, which vary widely. It is usually understood as the ability of a system to recover quickly from damage, which is fundamentally different from robustness.
There are two main dimensions of resilience definitions—the disaster and crisis management view and the hybrid social–physical perspective. This paper deals with the social–physical dimension. Studying socio-technical systems, i.e., the combination of physical systems research with the study of communities and individuals, allows for a relatively holistic approach. The roots of this approach lie in the practices of the post-World War II era, when large restoration projects were initiated. Current research on socio-technical systems focuses on the networks of information and action, required for their sustainability [21]. In this approach, physical and social systems are interdependent: without technology, society faces limits; without the society, technology is useless.
In addition to being resilient and robust, the system can be antifragile. Not only does it withstand impacts and recover quickly, it goes beyond that. It actually becomes stronger as a result of the stress it is subjected to [15,22]. In this paper, we focused on the vulnerability and robustness stages, paving the way for further exploration of the resilient and antifragile dimensions.
1.2. City as a Hybrid Social–Physical Network
Infrastructure is widely considered as a multilayer network and is studied jointly [23]. Interconnectedness is observed, for example, between the layers of oil and gas infrastructure (fuel and supply, compression stations), electric power (power plants, supply, substations), communications (end office, switching office), emergency services (fire stations, ambulances and hospitals, police stations), transportation, and water (reservoir substations).
The main focus of research on hazard-prone interconnected infrastructure is on robustness and resilience. The degree of interconnectedness can have different effects on resilience depending on the characteristics of the network. If the network of transport routes represent negative influences, such as contagion, then a dense network can cause cascading effects [23]. On the other hand, if the network links represent the desired reachability of nodes, then a dense network is good at resilience [24]. In addition, critical infrastructure and cascading failures are the subject of a dedicated line of research [25,26,27,28,29,30]. Possible scenarios for improving the robustness and resilience of networks were proposed in [31,32,33]. The authors in [34] reviewed the resilience metrics and measurements of transportation infrastructure.
Currently, there is a limited number of papers that consider the urban system as a whole, which implies examining not only transportation or critical infrastructure, but also communities, socio-economic topographical characteristics, and urban space. One of the research lines proposes and develops a network approach that represents each of the urban system elements as a network [35,36,37]. A detailed account of recent literature was presented in the line of research in [38,39,40,41].
1.3. Percolation as a Robustness Measure of the Network
Percolation theory from statistical physics and mathematics has inspired many researchers in network science to apply it to their studies of the robustness properties of various networks. The inverse percolation transition helps to identify the impact of node failures on the overall integrity of a network [42]. In classical applications, the Giant Connected Component (GCC) is used as an indicator of the state of network functionality. One can find research focused on the analysis of multimodal transportation systems [43], critical facilities [5], power grids [44], and universal models of resilience potentially applicable to different types of networks [45,46]. In addition to studying robustness to failure, researchers are looking for optimal attack strategies and post-failure recovery and restoration approaches. For instance, using percolation theory in complexity science, it is possible to generate a classification of fragility and service geographical distribution imbalances in cities [47]. The authors analyzed the robustness of road networks and services in fifty-four cities relying solely on publicly available data. They believe that it is possible to develop objective methods for measuring urban resilience, but there is more work to do [47]. Another study considers different infrastructure failures jointly, rather than in isolation [43]. The authors believe that given today’s cyber–physical threats, intentional targeted attacks on top of random failures during ongoing crises will exacerbate the severity of a situation. They analyze the urban transport network of networks and develop a framework for assessing its resilience. They found that it is more important to maximize robustness, rather than efficiency, as the network with maximized efficiency is more vulnerable to compounded crises and cascading failures.
Applying GCC analysis to real networks, however, one should demonstrate distinguished accurateness, as it is generally known that spatial networks with real-world topologies differ significantly in their properties from randomly generated networks. Recent studies have moved away from the idea of using the GCC to assess network robustness and resilience to flooding [5,48], since the GCC plays only a limited role in the people’s access to critical services. The major drawback of GCC research is that it ignores those inhabitants who sit outside of a targeted giant component. One, however, cannot exclude parts of the urban population when planning an emergency response, for example. All inhabitants must be equally valuable and cannot be left behind. In our paper, we analyzed each component of the city, not just a connected giant. In addition, some researchers argued that flooding is not a random percolation transition [5], and others proved it empirically [48].
1.4. Graph-Based Approach with Focus on Floods
Floods from a network science perspective were studied in [5,43,49,50,51,52,53,54]. A working version of this paper was first published in [55]. Our framework is closest to the work of [5], who developed an approach for assessing the physical vulnerability of a city to flooding in terms of the community’s ability to access critical facilities and tolerate access disruptions. The authors utilized a modified percolation method, calculated a disruption tolerance index, and revealed spatial clusters of vulnerability in Houston, Texas. One critical facility type they considered was hospitals. They found that vulnerable areas tend to form spatial clusters. The information revealed by their framework is of practical essence and important for city planners and emergency managers.
Similar to [5], we departed from the common idea of focusing on the GCC analysis. We adopted the authors’ notion of the robust component, understanding it as a set of connected edges that have access to at least one critical service of a certain type. We considered the social dimensions of inhabitants’ access to facilities, even though the publicly available data for Jakarta are not as detailed and rich as for U.S. cities. There are, however, some differences. First, we added additional information on the surface elevation to the assessment. Second, we incorporated more types of services: in addition to hospitals, our framework included police stations, fire stations, grocery stores, pharmacies, educational facilities (transformable space), and shelters. Third, we conducted 140 simulations based on the probabilistic flood return periods specific to Greater Jakarta, which are related to flood depths. In the simulations, we accounted for the random failure of the drainage system. We calculated the proportions of the loss of access to services. The floods in our model were static. This provides a simple way to test the framework for calculating network statistics in the course of service loss. A more-practical application of this technique will require a more-rigorous approach with propagating floods, which will allow a more-dynamic assessment of access loss; probability models with input from machine learning investigations will further enrich the calculations. Fourth, we paid special attention to network statistics in the course of flooding and give a detailed account of different service access disruptions by district. Finally, there may be technical differences in the way we constructed our networks. The most-important difference is that we embedded facilities into one network in the form of edge properties. Since, in reality, buildings can be accessed from different sides, we introduced the notion of multiedge facilities, which are created by assigning a single facility property to all edges located in a certain proximity to that facility. We will discuss this in more detail in the following sections.
2. Materials and Methods
2.1. Materials
The framework of this research relies on the availability of data. To successfully quantify the impact of flooding on the network, we need high-resolution raster or detailed vector data to obtain information about the topology of urban systems and the occurrence of flooding.
Despite the increasing availability of satellite data, there are still a limited number of high-quality sources that depict disasters. The main sources of such data are currently Maxar, the U.S.-based space technology company, Copernicus, the EU Earth observation program, and Sentinel Asia, the Earth observation initiative for the Asia–Pacific region. Maxar is providing optical satellite imagery of a number of catastrophes around the world as part of its Open Data Program. Copernicus and Sentinel Asia provide access to both optical and radar satellite data. In some cases, vector data are available with information on the estimated damage from the catastrophes. In this research, we used publicly available categorized and vectorized flood occurrence data provided by [56].
Apart from the disaster- and damage-related sources, we need to have data about urban systems. For this purpose, we used the free and open platform Open Street Map [57], which is a project uniting thousands of volunteers, who digitize physical objects on the surface. Another source of specialized data based on the OSM platform is [58]. It should be noted, however, that both professionals and amateurs provide inputs to the platform, which raises legitimate questions such as: Are these sources reliable? Researchers and GIS professionals evaluate the accurateness of OSM. For example, Reference [59] evaluated the quality of the OSM database and concluded that critical asset types are well represented. The accuracy of public green spaces in OSM was estimated in [60]; the authors found that the spaces were mapped with a high degree of completeness. Another study reports that “the spatial indicators derived from points, lines, and areas are able to reflect socio-economic characteristics”, therefore OSM has important capabilities and advantages for assessing urban resilience [61].
Returning to this paper, it is known that surface elevation plays an important role in flood occurrence; therefore, we used the ALOS Global Digital Surface Model [11] to add an elevation dimension to the framework. The social characteristics of Greater Jakarta were extracted from [12] (population density) and [62,63,64] (poverty severity). Poverty severity is the index that explains the share of the population below a minimum income threshold, disaggregated by district. Population density is initially a raster dataset for the whole country. The data types and sources are summarized in Table 1.

Table 1.
Overview of data types and sources. The data related to transportation and facility location were obtained from [57,58]; flood occurrence data are provided by [56]; physical surface information was extracted from [11]; population density was obtained from [12]; poverty severity indices were from the official statistics services [62,63,64].
2.2. Methods’ Discussion
Christopher [65] in his book Notes on the synthesis of form described fit as the absence of misfit. To assess the object, it is possible to list all of its good qualities, but the list is likely to be long. A more-efficient way to do this is to make a list of detrimental qualities—those qualities that are not just unfavorable, but seriously harmful: “… it is through misfit that the problem originally brings itself to our attention. We take just these relations between form and context which obtrude most strongly, which demand attention most clearly, which seem most likely to go wrong” [65]. This framework revolves around the same principle. We analyzed and show what is wrong or what will go wrong, rather than focusing on a few best practices. In summary, we assessed the vulnerability of people’s access to critical infrastructure in the event of flooding and quantified the damage from the 2020 flood in Greater Jakarta, identifying its implications for the whole system. We looked for relationships between the loss of access to services, poverty, and elevation. We ran 140 simulations of floods of various degrees to identify the most-vulnerable places. This framework is the combination of two major quantitative methods—geographic information systems and network analysis. The final results can be used by policy-makers and planners to (1) identify vulnerable neighborhoods that are more likely to lose access to services in the event of a disaster, (2) prepare for the next emergency, and (3) plan for the placement of new services or the relocation of the existing ones.
The selected components of the urban system are listed in Table 2. The selection was based on a review of literature and the availability of open data.
Table 2.
Studied urban systems.
2.3. Geographic Information Systems
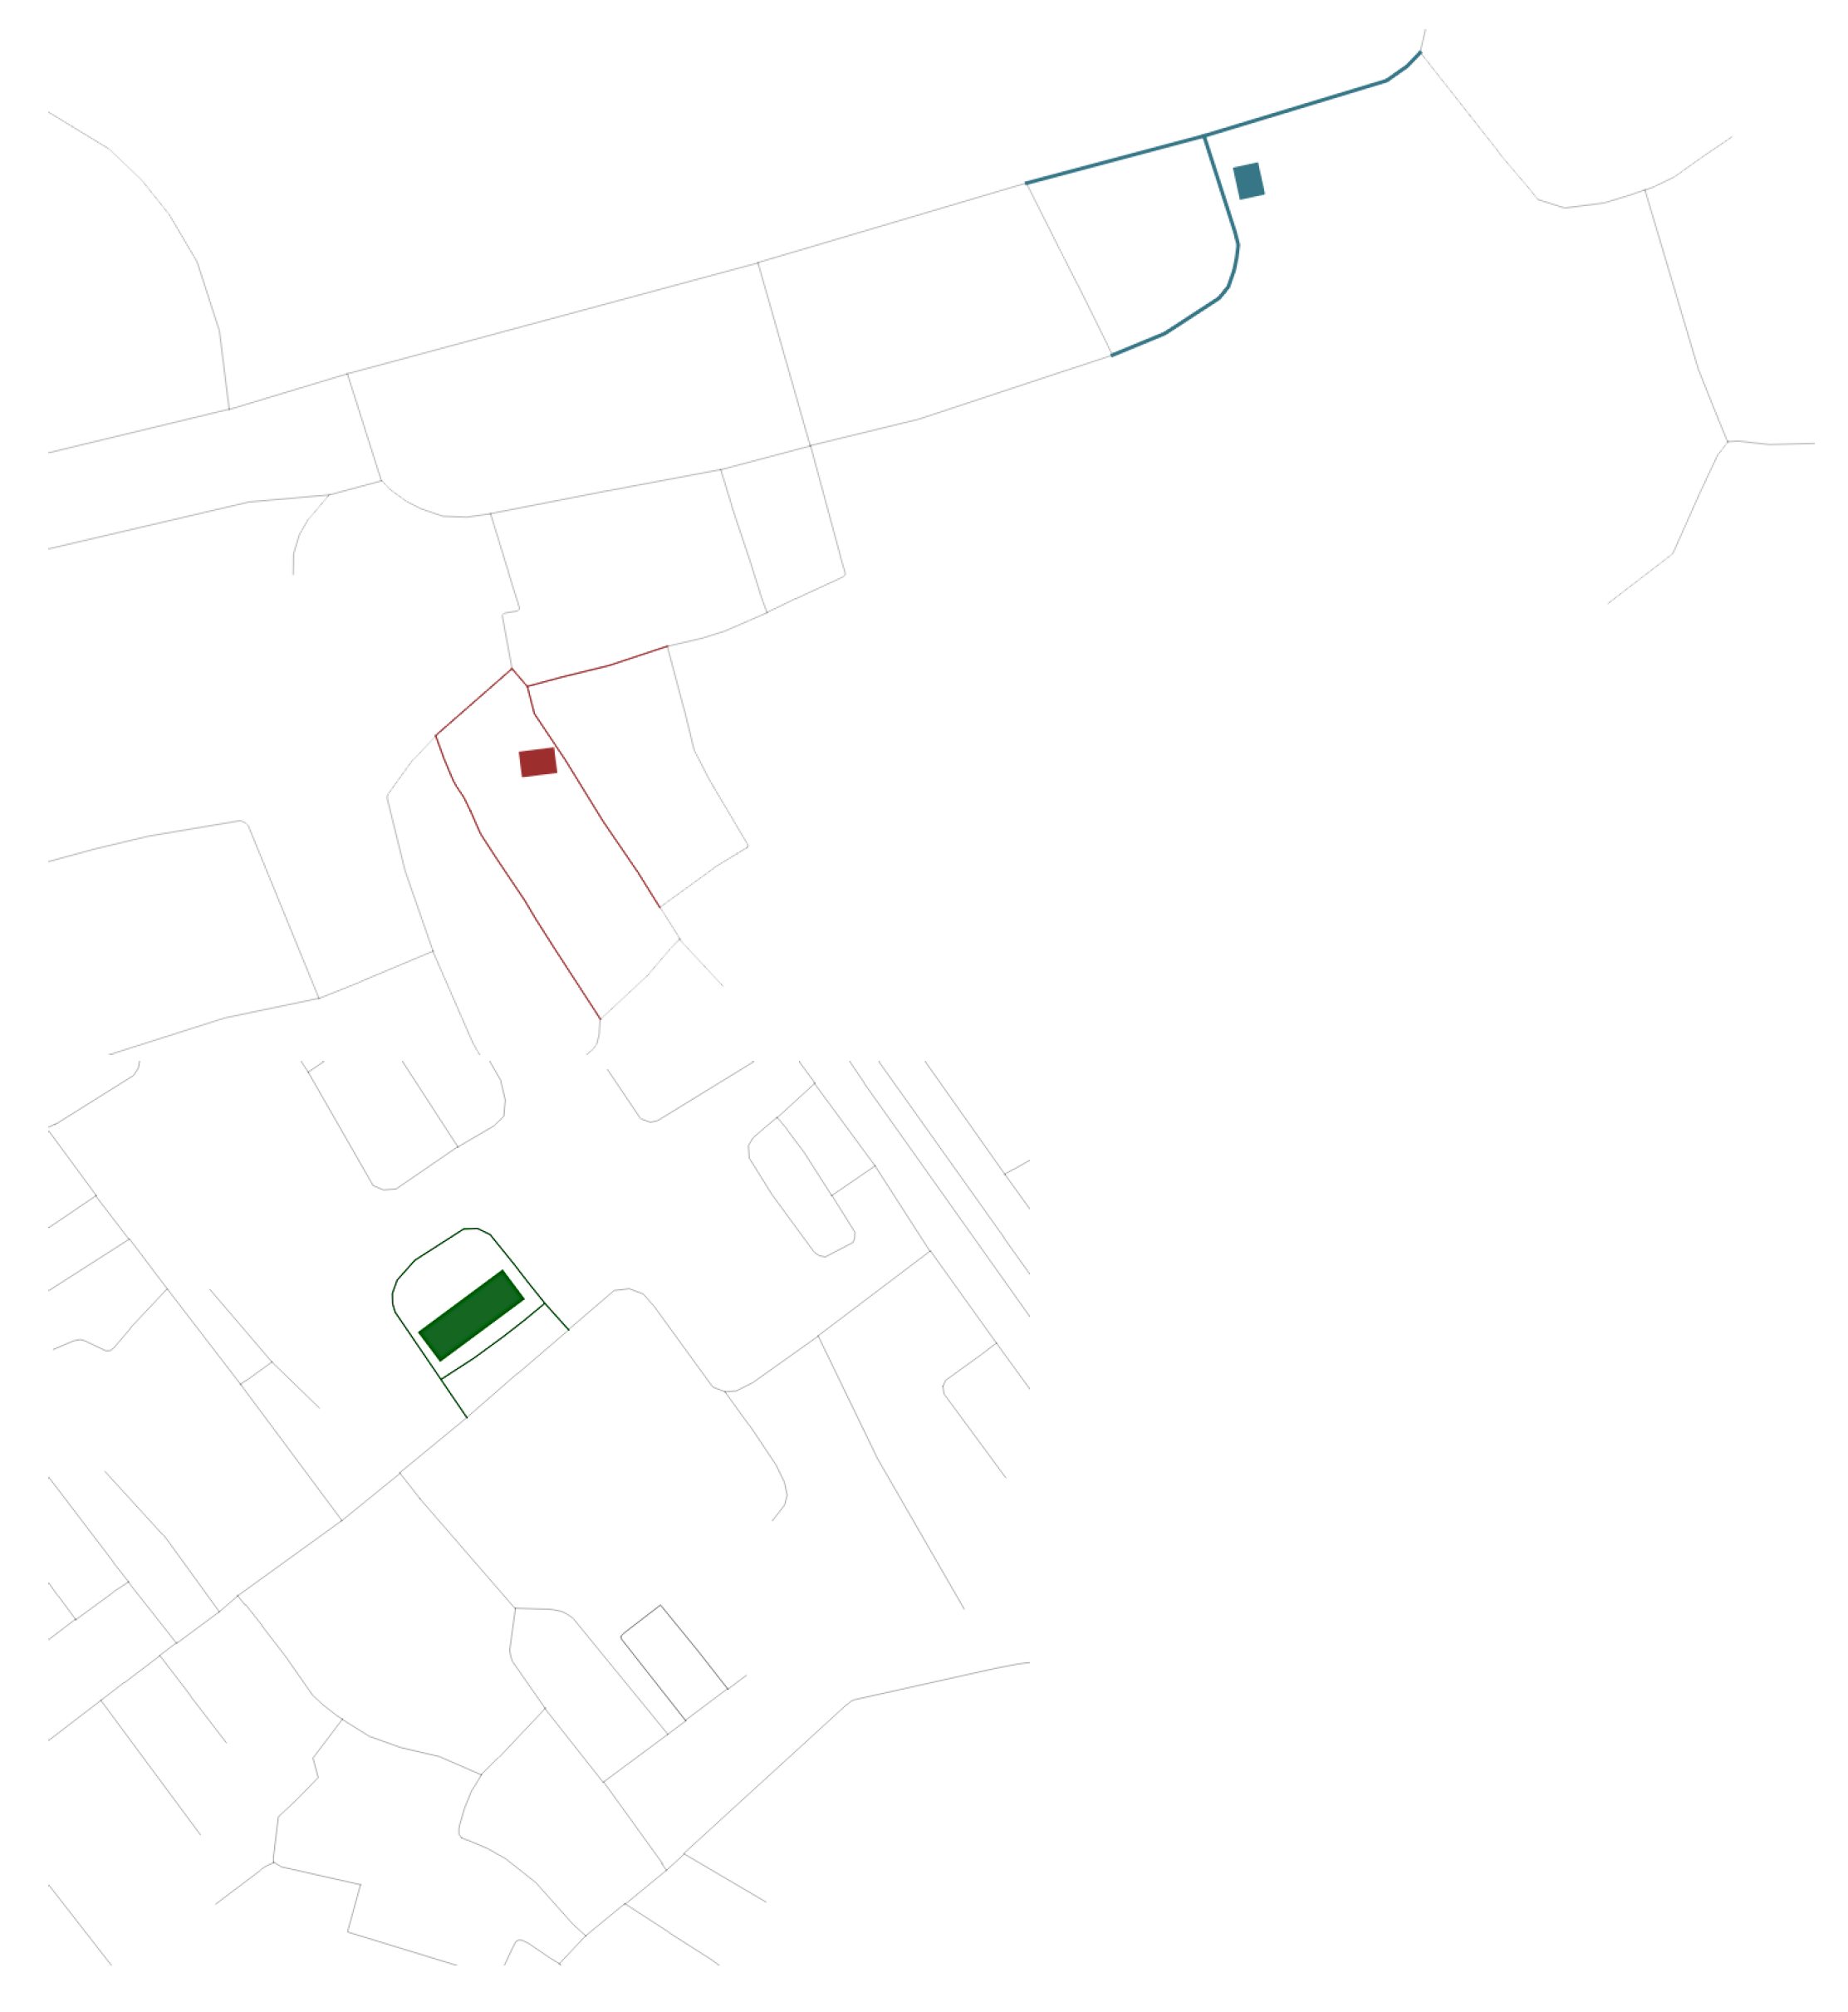
Embedding the data structure of the urban system into a GIS system that happens in a preparatory stage of research is the most-time-consuming part. The street topography from OpenStreetMap usually needs to be simplified and cleaned from geometric errors. Initially, each urban system (facilities, roads, population) represents an individual data layer. Our task was to create a single dataset that embodies all the individual layers. This unification was performed based on the road network. All other elements were joined to the nearest road segment in the form of a vector attribute (see Figure A2 in Appendix B). Instead of joining a facility as a property to a single edge, we connected it to all the nearest edges. This was performed to account for the possibility of accessing facilities from different sides of the building, not just from the street side. For this reason, we distinguish multiedge facilities and facility edges. The former is a single facility consisting of several edges that contain the properties of a single facility; the latter is a single edge that is part of a multiedge facility. In damage quantification, when a multiedge facility loses all of its edges, we call this a loss of access. If some, but not all, edges of the facility are damaged, we define this situation as hindering of access to services. The same was performed with flood occurrence. Flood becomes a Boolean property of each road segment indicating 0, when there is no flood, and 1, when the flood occurs on a segment.
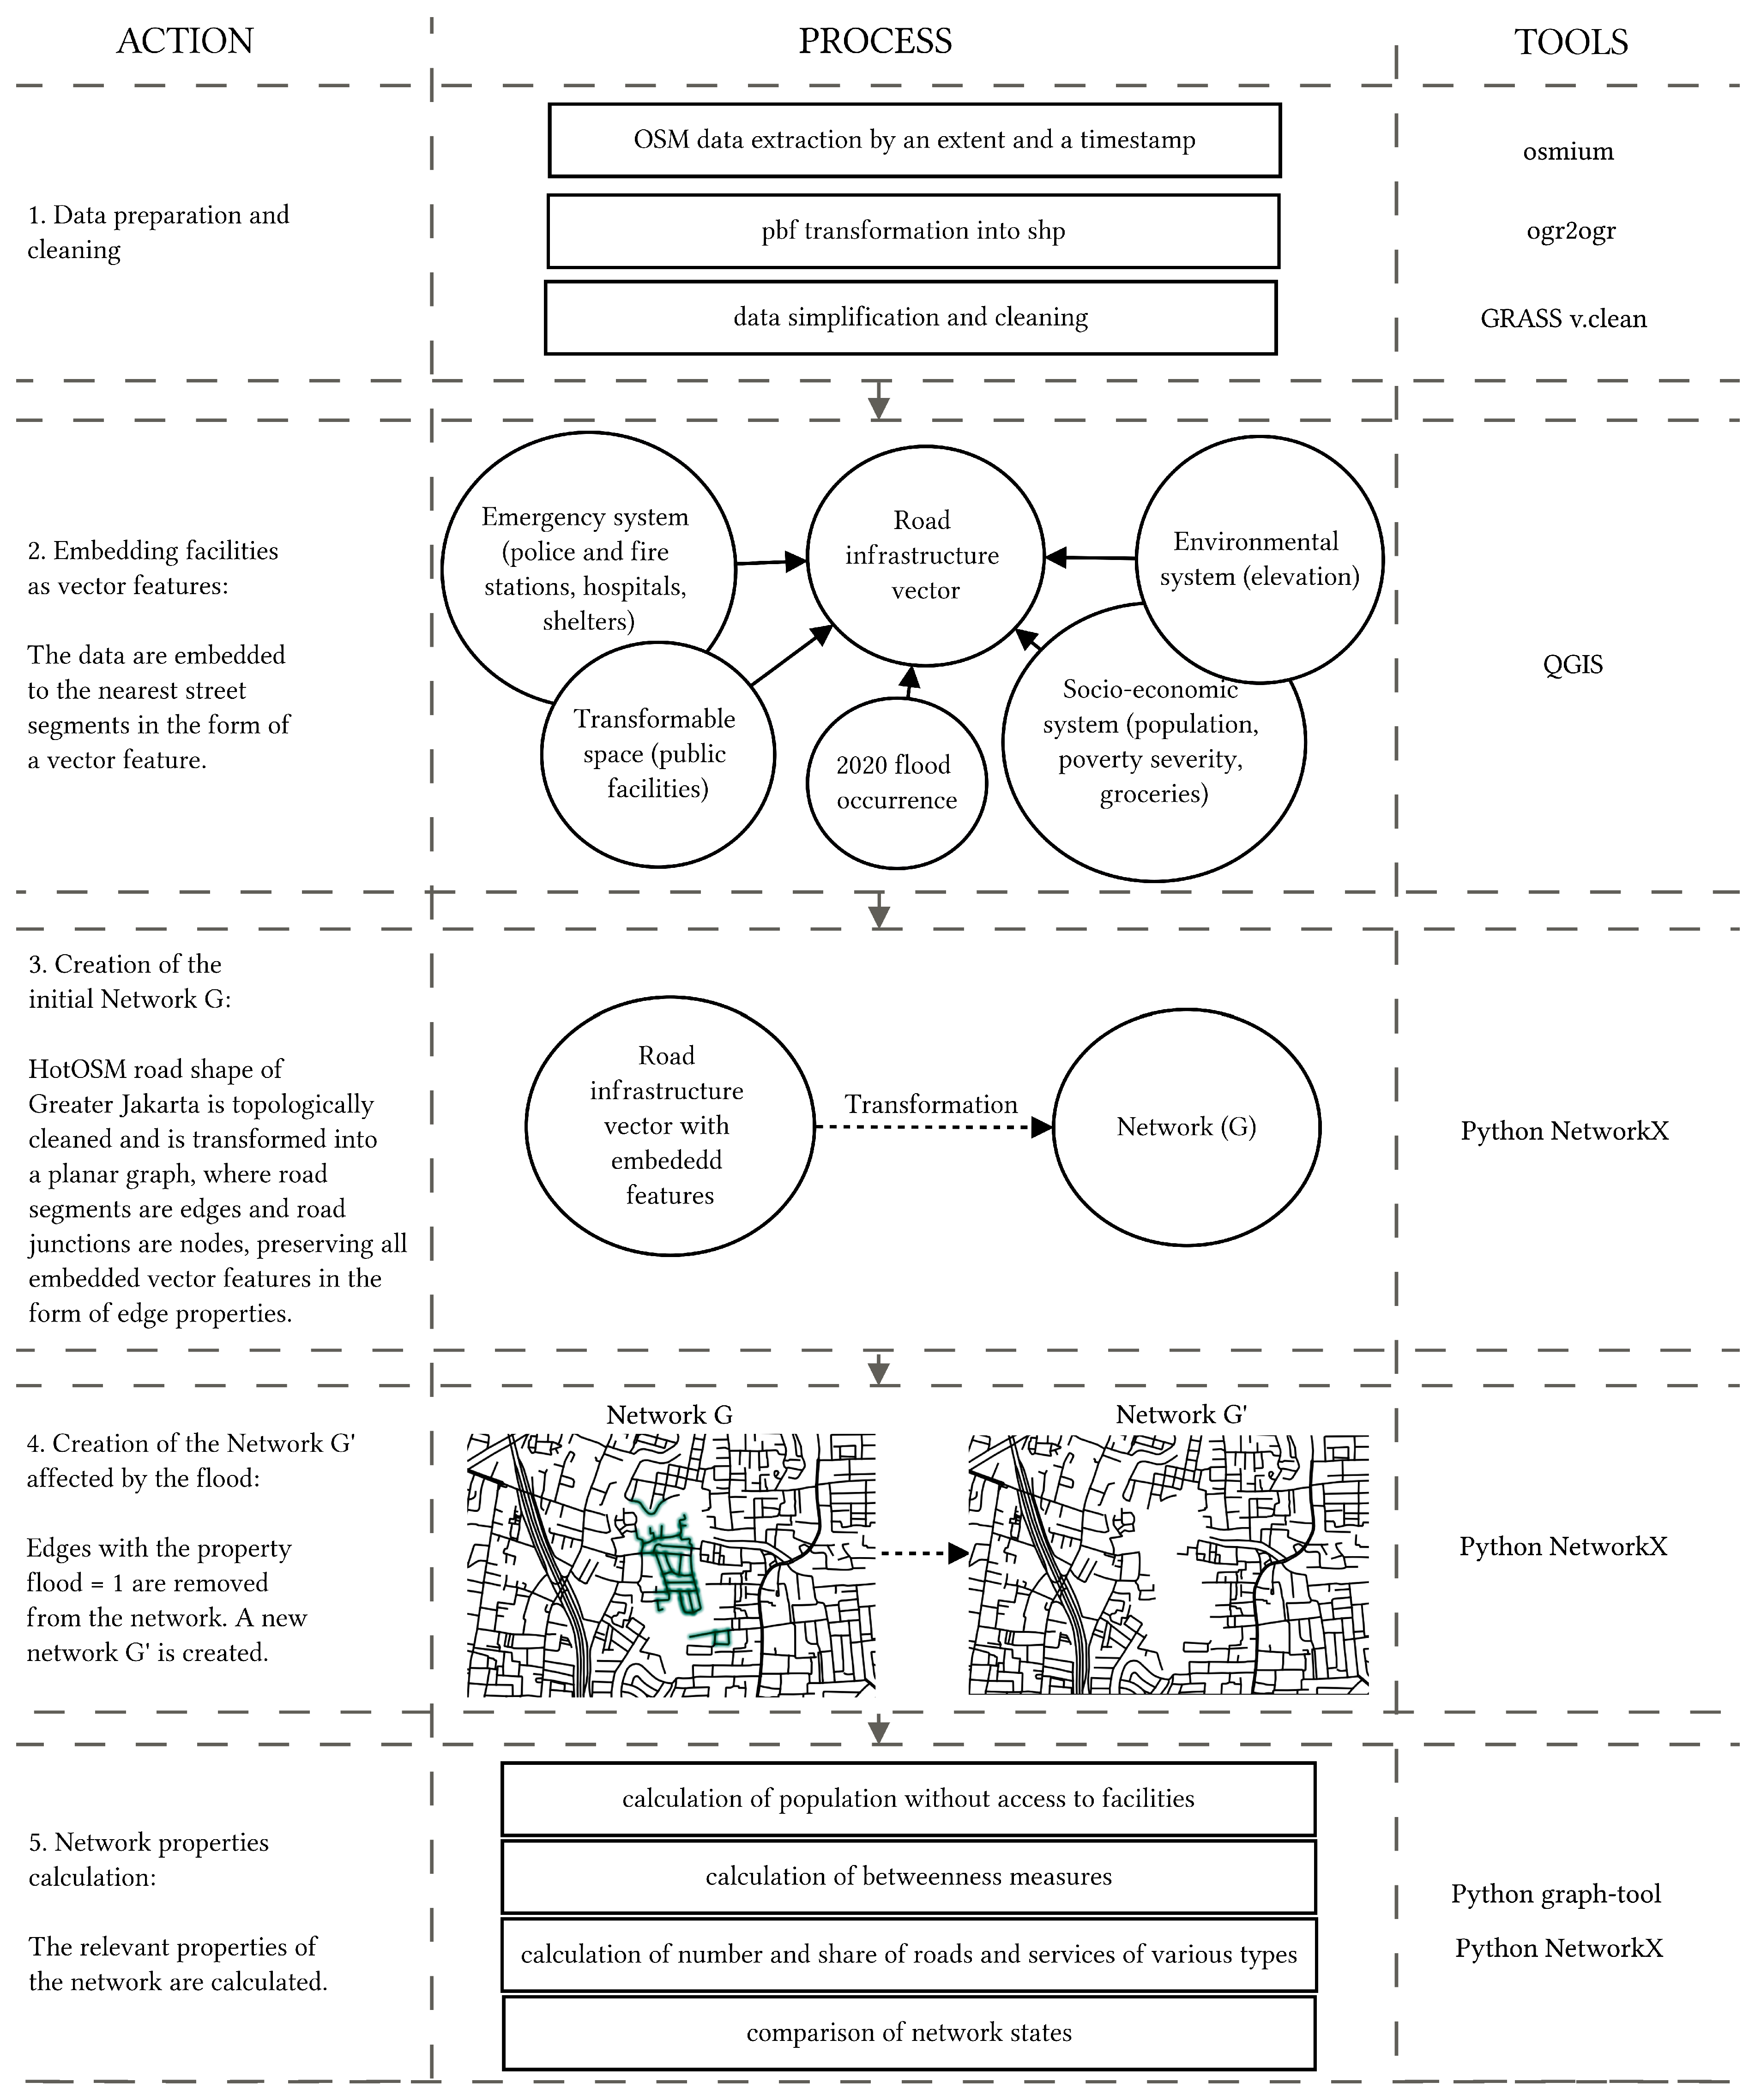
Other Geographic Information System (GIS) techniques, such as fixing geometries, raster vectorization, and joining attributes by location, were also used when necessary. The software used was QGIS, a free and open desktop GIS application [66]. The complete workflow is shown in Figure 1.
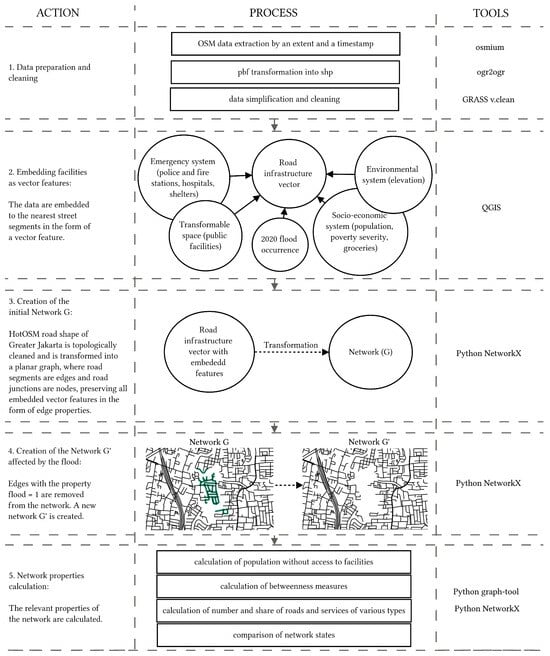
Figure 1.
The methodological workflow for the ex post evaluation.
2.4. Network Statistics
The cleaned geospatial data were then transformed into a two-dimensional graph (network) consisting of vertices (nodes) and edges. This way, road infrastructure becomes a network of road segments (edges) that are connected by road junctions (vertices). Critical facilities, surface elevation parameters, population density, and poverty data are embedded in the network as edge properties.
The mathematical formulation of the network is as follows. Let be a planar undirected graph of the urban transportation system, where V is a set of vertices representing road junctions (intersections) and E is a set of edges representing parts of the road that link those junctions. The number of V equals 785,442; the number of E equals 995,074. Each edge in E has a corresponding feature vector indicating the elements of critical infrastructure that are adjacent to this edge, in particular police stations (equal to 0 or 1), hospitals (0 or 1), fire stations (0 or 1), shelters (0 or 1), public facilities (0 or 1), grocery stores (0 or 1), population (in count), poverty severity (as a numerical index), and elevation (in meters) (components listed in Table 2). and are the sets of vertices and edges affected by the flood. Let be a copy of the initial network with all the edges from removed. The number of then will be 899,628.
Using the Python NetworkX [67] and graph-tool [68] specialized modules, we obtained basic network statistics and performed all the other calculations.
- Number and share of roads and services of a certain type:
We calculated and reveal what types of roads there are (e.g., trunk, primary, secondary, residential), what is the total share of affected edges of each type, how many and what critical services are available, what is the fracture of disabled services due to disasters.
- Population without access to facilities:
The share of the population left with no access to critical facilities was calculated for the entire system and for each district.
- Betweenness centrality of edges
The edge betweenness centrality is defined as the number of shortest paths that go through that edge [69]. Knowing the betweenness of edges will help to see how important the roads that are damaged during disasters are. If, for example, a critical amount of important roads is prone to a disaster, the vulnerability of the whole system should be of our concern. If the most-important roads are still available or some other roads can take over their function even in the case of a major disaster, this may be an indication of the system robustness. The limitation of this measure is that it considers only the shortest paths, and if another path is only slightly larger than the shortest path, it is not considered, even though it may serve as an alternative route with only minimally higher costs. We define and compute betweenness centrality as in [68,70]. An alternative measure of the betweenness of an edge can also be measured by comparing the average shortest distance between all pairs of nodes with the same number, but with that edge removed from the graph. If removing an edge significantly increases the average shortest distance, this is an indication of its importance.
- Average betweenness:
We can also took the average of edge betweenness as a measure of network robustness. Intuitively, the smaller the average, the more robust the network. The average betweenness is a linear function of the average distance.
- Highest betweenness:
This is the value of the top edge in the betweenness centrality distribution. You also want this number to be as small as possible.
- Comparison of network states:
Summarizing all the collected statistics, we compared two networks: the initial network and the network affected by the flood .
2.5. Relationship Identification
This involves running linear regressions to reveal the associations between the loss of access to services, poverty, and elevation. The hypothesis is that the higher the loss of access to services, the higher the poverty rate is, and that the lower the surface elevation, the higher the poverty is.
2.6. Flood Simulation
Having confirmed the existence of a negative relationship between the loss of access to services and elevation (Table A1 in Appendix C), we ran flood simulations based on surface elevation levels for historical and projected rainfall observations. We had no information about the fragility of the drainage system, but we tried to account for it by introducing random failures that occur with a randomly assigned probability varying between one and ten percent.
In total, we used fourteen intervals of flood depth levels (D: from less than 0.62 m to less than 3.78 m), each corresponding to a particular flood return period and consisting of the two values—the bottom cap and the upper cap (Table 3) [71]. These intervals were used as background data in the paper [71] and were provided by its authors. The thresholds were based on the rainfall–runoff coefficient calculations applied to a 28-year (1980–2008) record of monthly rainfall observations in Jakarta. There is a logarithmic relationship between the frequency of events, measured by return period, and the severity, measured by flood depth. The authors extrapolated the results to unknown return periods, and that allowed us to run ten simulations for each of the intervals. The flood variability was provided by the lower and upper caps. For each simulation, a new feature vector was created describing the weight attributes assigned based on certain flood occurrence probabilities (see Section 2 for more information on the weight distribution among the levels). The probability values were the assumptions, and in a single simulation, they were distributed as follows:
- of flood occurrence on edge for (values smaller than the lower cap elevation level).
- of flood occurrence for (values smaller than the upper cap but greater than the lower cap elevation level), where D is a flood depth level, and and are the lower and upper caps of flood depth levels correspondingly, which are specific for respective flood return periods.
- (randomly assigned) is a possibility of a drainage system failure for all other elevation values, i.e., .
Table 3.
Lower and upper cap flood depth levels in meters (D) and corresponding return periods in years.
Table 3.
Lower and upper cap flood depth levels in meters (D) and corresponding return periods in years.
| Return Period | ||
|---|---|---|
| 2 | 0.31 | 0.62 |
| 5 | 0.48 | 0.96 |
| 10 | 0.6 | 1.22 |
| 20 | 0.73 | 1.47 |
| 50 | 0.9 | 1.81 |
| 100 | 1.03 | 2.07 |
| 200 | 1.15 | 2.33 |
| 500 | 1.32 | 2.67 |
| 750 | 1.4 | 2.82 |
| 1000 | 1.45 | 2.93 |
| 1500 | 1.52 | 3.08 |
| 2000 | 1.58 | 3.18 |
| 5000 | 1.74 | 3.52 |
| 10,000 | 1.87 | 3.78 |
Table 4 shows an example of the probability of an edge being flooded for a simulation of a two-year return period.
Table 4.
An example of an edge failure probability distribution for return period 2.
The recorded weighted outcomes helped us construct a spatial vulnerability map. We performed this by recording all edges that have lost access to at least one service after each flood occurrence simulation. This type of simulation was not intended to be an accurate reflection of the real flood and is mostly used for demonstration purposes.
3. Results
3.1. System State Description: Before and after the 2020 Greater Jakarta Flood
3.1.1. Global Level
Table 5 summarizes the statistics for two systems—Greater Jakarta network before the flood () and Greater Jakarta network after the flood (). describes the number of edges. The hazard directly affected 9.6% of the edges within the studied area. The completeness of the network is represented by the parameter , which indicates the number of connected components within the whole system. The first network is a monolithic unaffected network; therefore, it has only one component. After the event, the system breaks down into 62,772 individual components.
Table 5.
Network information and robustness properties’ comparison between the two system states—before and after the flood, where is the number of edges, —the number of components in the network, P—the population share with access to all facilities, is the number of existing facility edges of all types of facilities, F—the number of multiedge facilities belonging to all types of facilities, indicates the maximum betweenness centrality, and is average betweenness centrality.
The share of population P with access to all critical facilities is 100% in the first case and 87% in the second. and F correspond to a number of facility edges and multiedge facilities. The reason why we distinguished facility edges from multiedge facilities is grounded in the way the edge properties were assigned. Figure A2 explains how an individual facility is embedded into its nearby edges, which together form a multiedge facility. The comparison of in two systems shows how many edges regardless of their facility attachment are flooded. This may or may not mean that a certain facility is flooded. The comparison of F suggests how many multiedge facilities are completely flooded, which only happens when all facility edges, attributed to a certain facility, are affected by the flood. For example, if a multiedge facility consists of five facility edges and four of them are disabled, the facility is still considered functional, although we assumed that the access to it is, to some extent, hindered.
The betweenness centrality comparison allowed us to see how the importance of the edges is redistributed after the flood. The edges high in betweenness centrality tell us that their position has significant influence on connectivity in the whole graph. It may be a case when the street has few connections, but it is located in such a way that, if taken out, some large parts of the graph will be disconnected. We wanted this measure to be as small as possible, because a small number is a sign of less dependency on certain edges. Here, we observed a dramatic increase in both the highest () and average betweenness centrality (), which suggests that, after a stress has been imposed in the form of flood, the system has become more vulnerable. This assumption finds support in [43], who demonstrated how natural hazards make technical systems increasingly more fragile, in particular with respect to compound attacks.
Table 6 shows the flood effect on the types of roads. The roads that suffered the most from flood occurrence were residential, tertiary, and secondary. Trunk and primary roads are usually of paramount importance in the urban transportation system; therefore, even 4.2–4.4% of damage is considered a significant loss.
Table 6.
The 2020 flood’s direct impact on road infrastructure by road type, number of edges, and percentage change. Comparison of the two system states—before and after the flood.
The direct impact of flood disaggregated by services is shown in Table 7.
Table 7.
The 2020 flood’s direct impact, number of facility edges (in parentheses—multiedge facilities), and percentage change. Comparison of the two system states—before and after the flood.
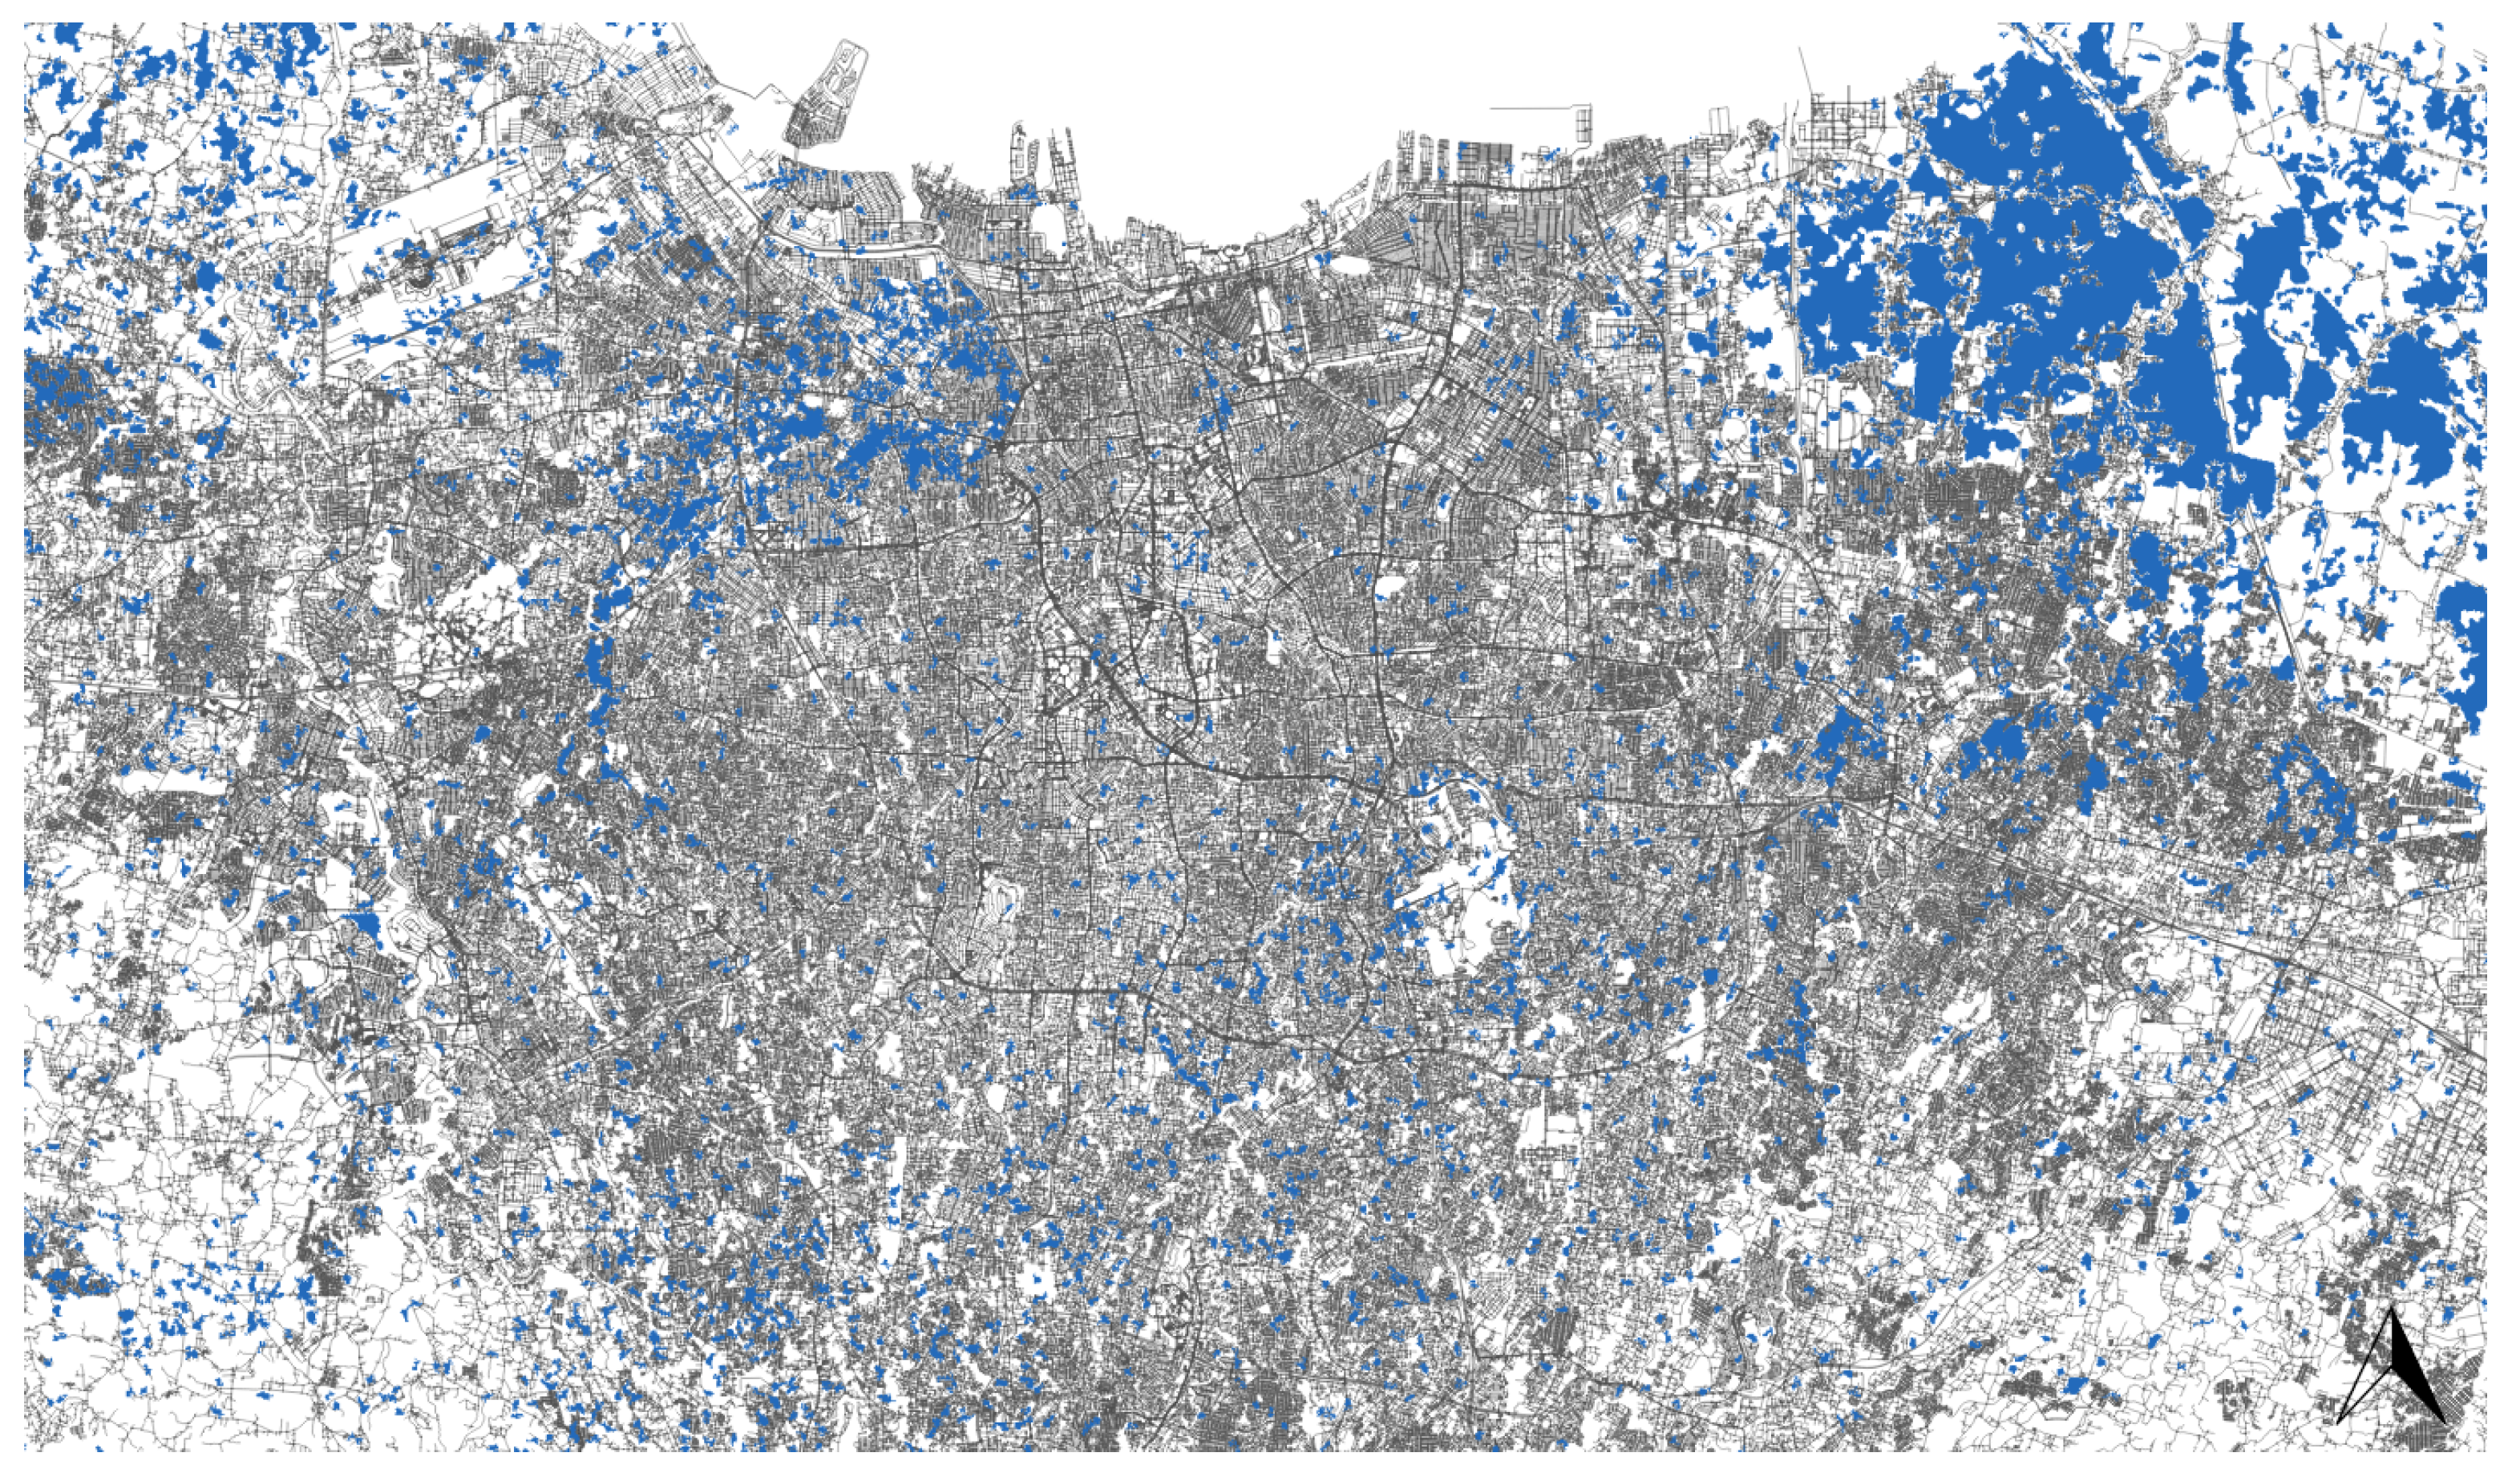
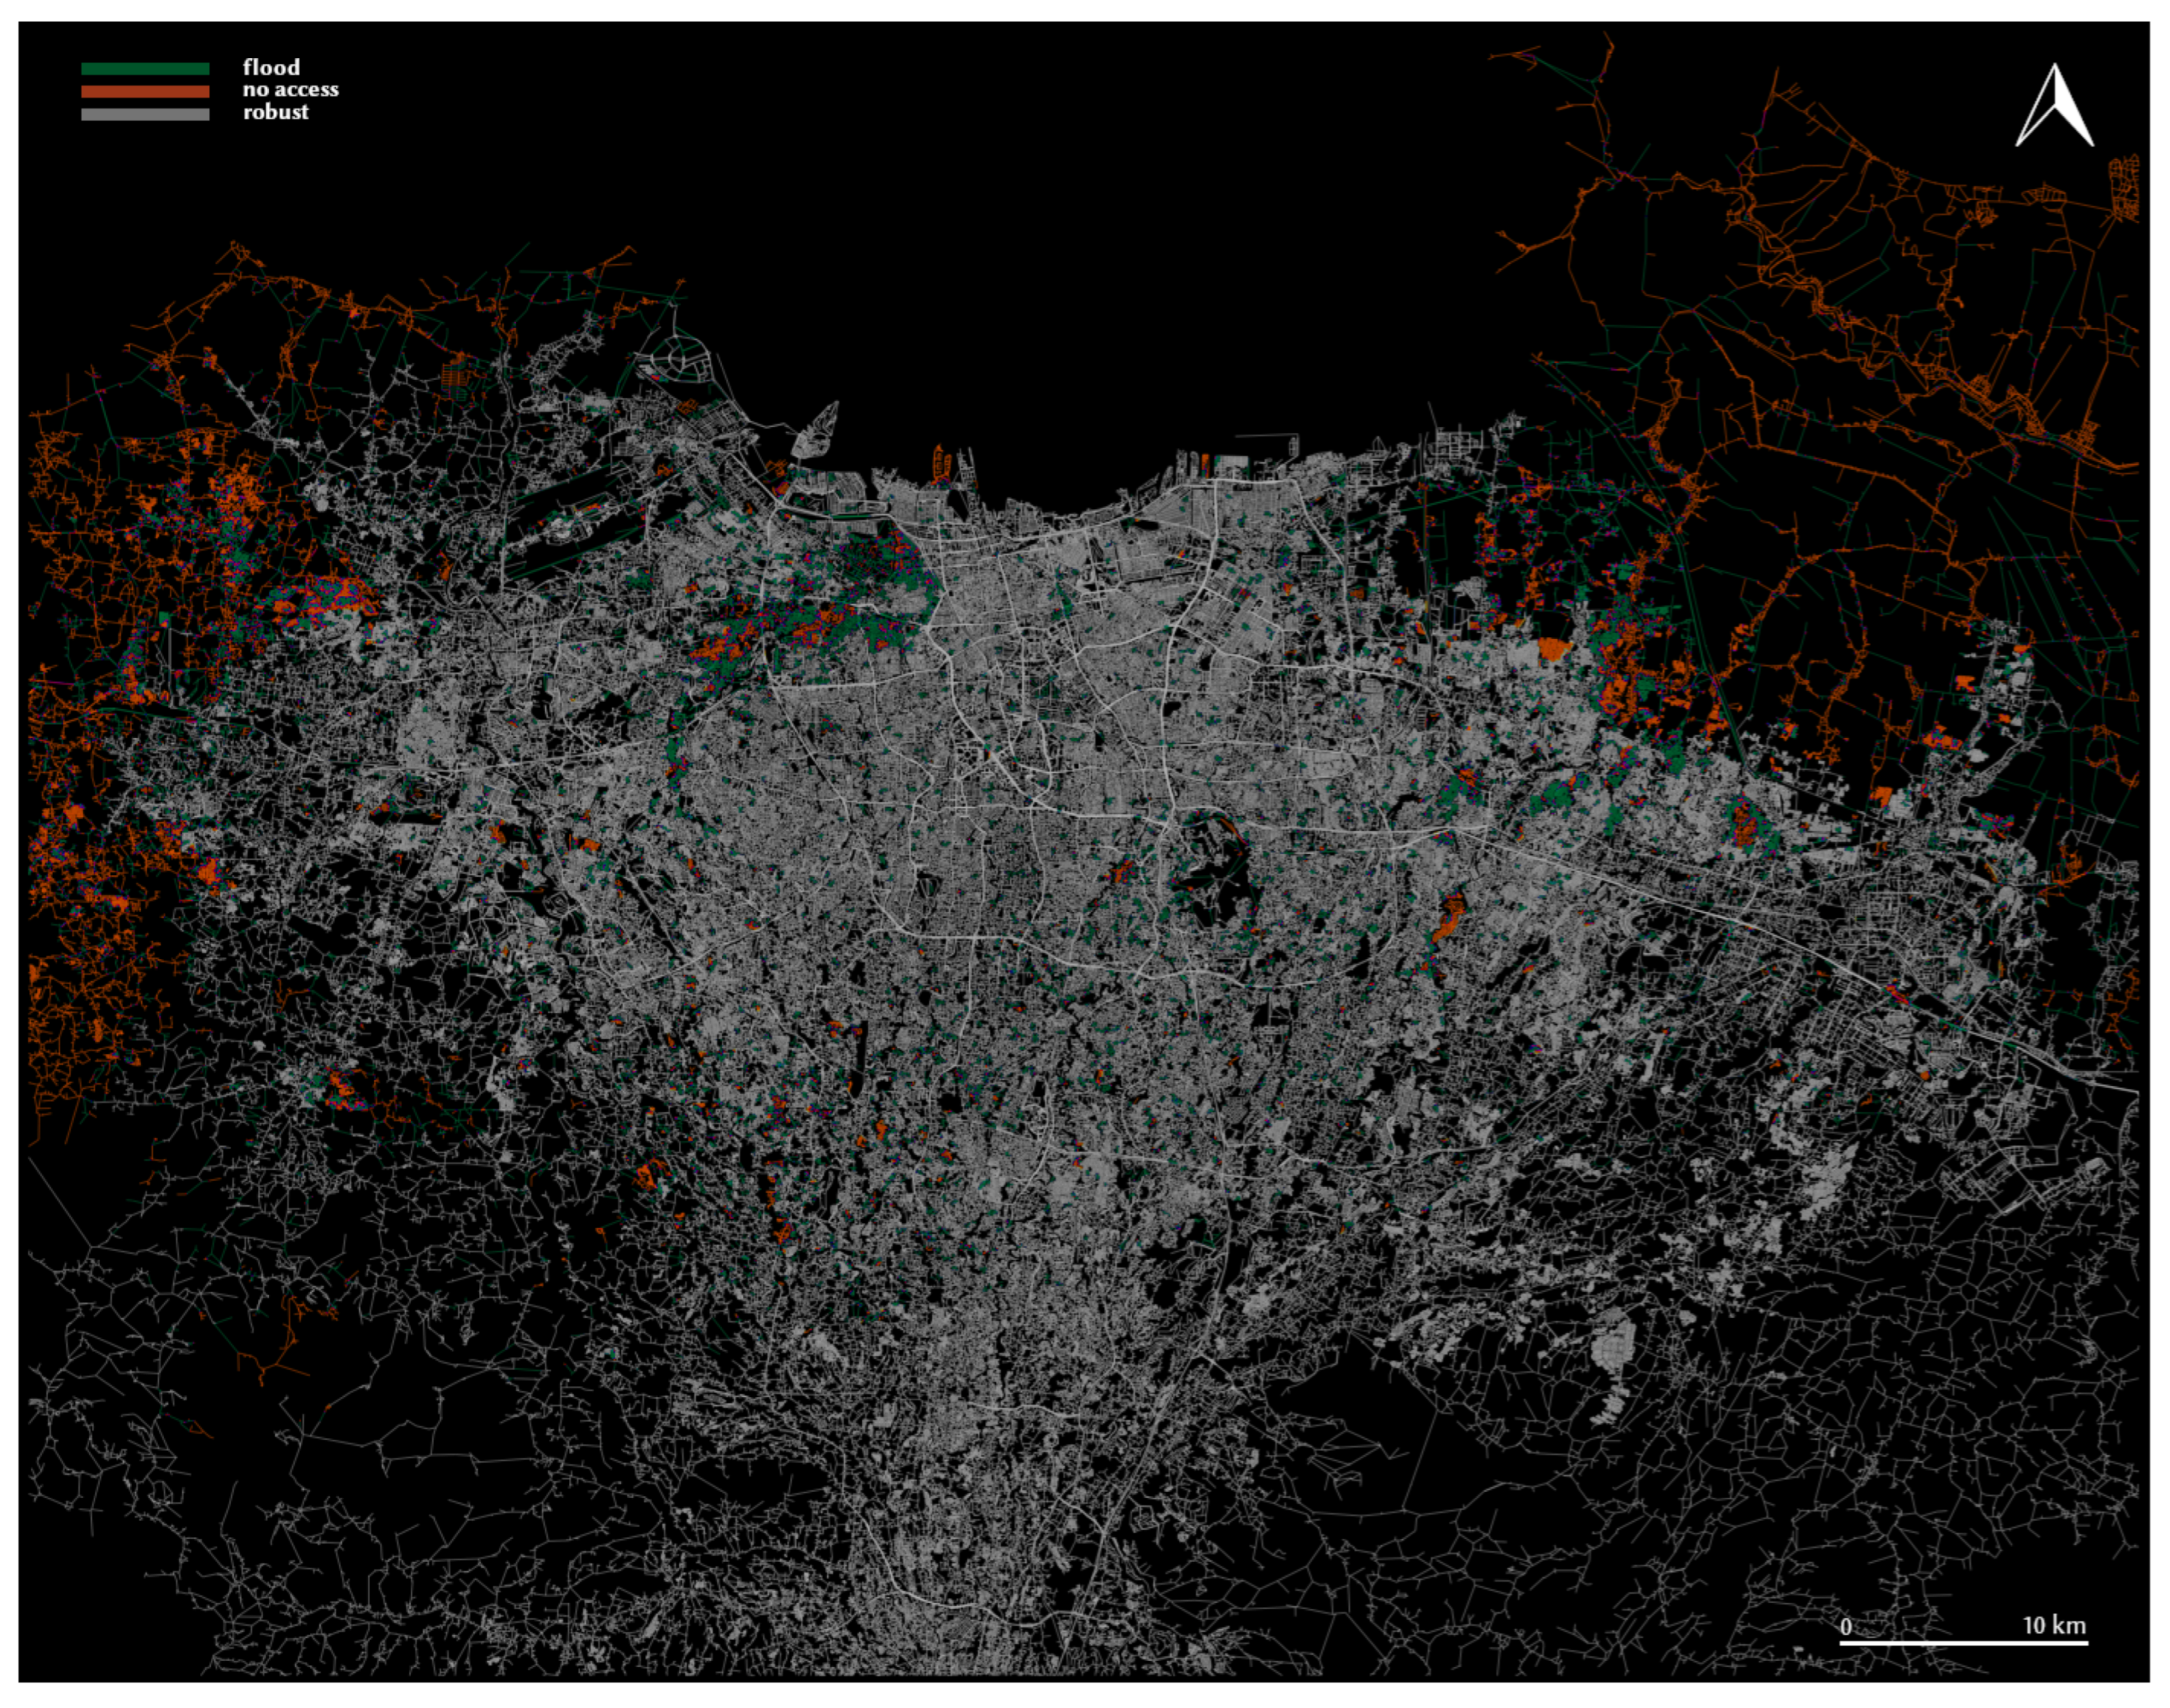
In Table 8, we show the indirectly affected population and total population left without access to all services. The population that was directly affected by the flood and, as a result, lost access was equal to 2,082,678, which amounted to 9.22%. We calculates simply by adding up the directly affected population and indirectly affected population. All services were ranked from 1 to 4. The smallest share of population lost access to hospitals, and the largest share ended up without access to police stations, fire stations, pharmacies, and shelters. Figure 2 visualizes edges that were flooded, edges that lost access to at least one service, and a robust fully functional component.
Table 8.
Approximate population and its share left without access to facilities as a result of indirect and both direct and indirect impacts from the 2020 flood, where the service ranked 1 is the service to which the biggest number of people lost access.
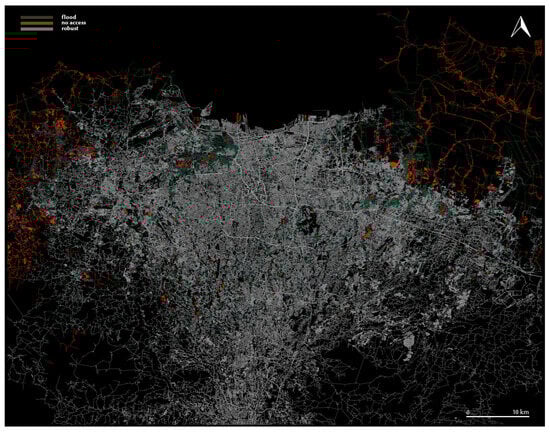
Figure 2.
Greater Jakarta network after major flood in January 2020. Green color marks the edges, which, according to the satellite data, were affected directly by the flood; the edges highlighted in orange were affected indirectly, i.e., they were isolated from access to at least one service due to the flood occurrence elsewhere; the robust component that maintains the access to services is gray. Sources: [57] (2020), [58] (2020), [56] (2020).
3.1.2. District Level
To obtain a more-detailed picture of the flood implications on the urban system, we conducted calculations for each district in Greater Jakarta. Table 9 shows a comparison of the population share with access to all services P, the poverty severity index S, the number of facility edges , and the number of multiedge facilities F before and soon after the flood. The most-robust districts were Bogor, Kota Jakarta Pusat, and Kota Jakarta Selatan. The inhabitants of the districts Karawang, Tangerang, Kota Jakarta Barat, and Bekasi suffered the most from the loss of access.
Table 9.
Network statistics and robustness properties by district comparison between the two system states—before (0) and after (1) the 2020 flood. P means population share with access to all facilities; S is the corresponding poverty severity index; shows the number of existing facility edges in each system state; F indicates how many multiedge facilities each of the districts possessed in both systemic states.
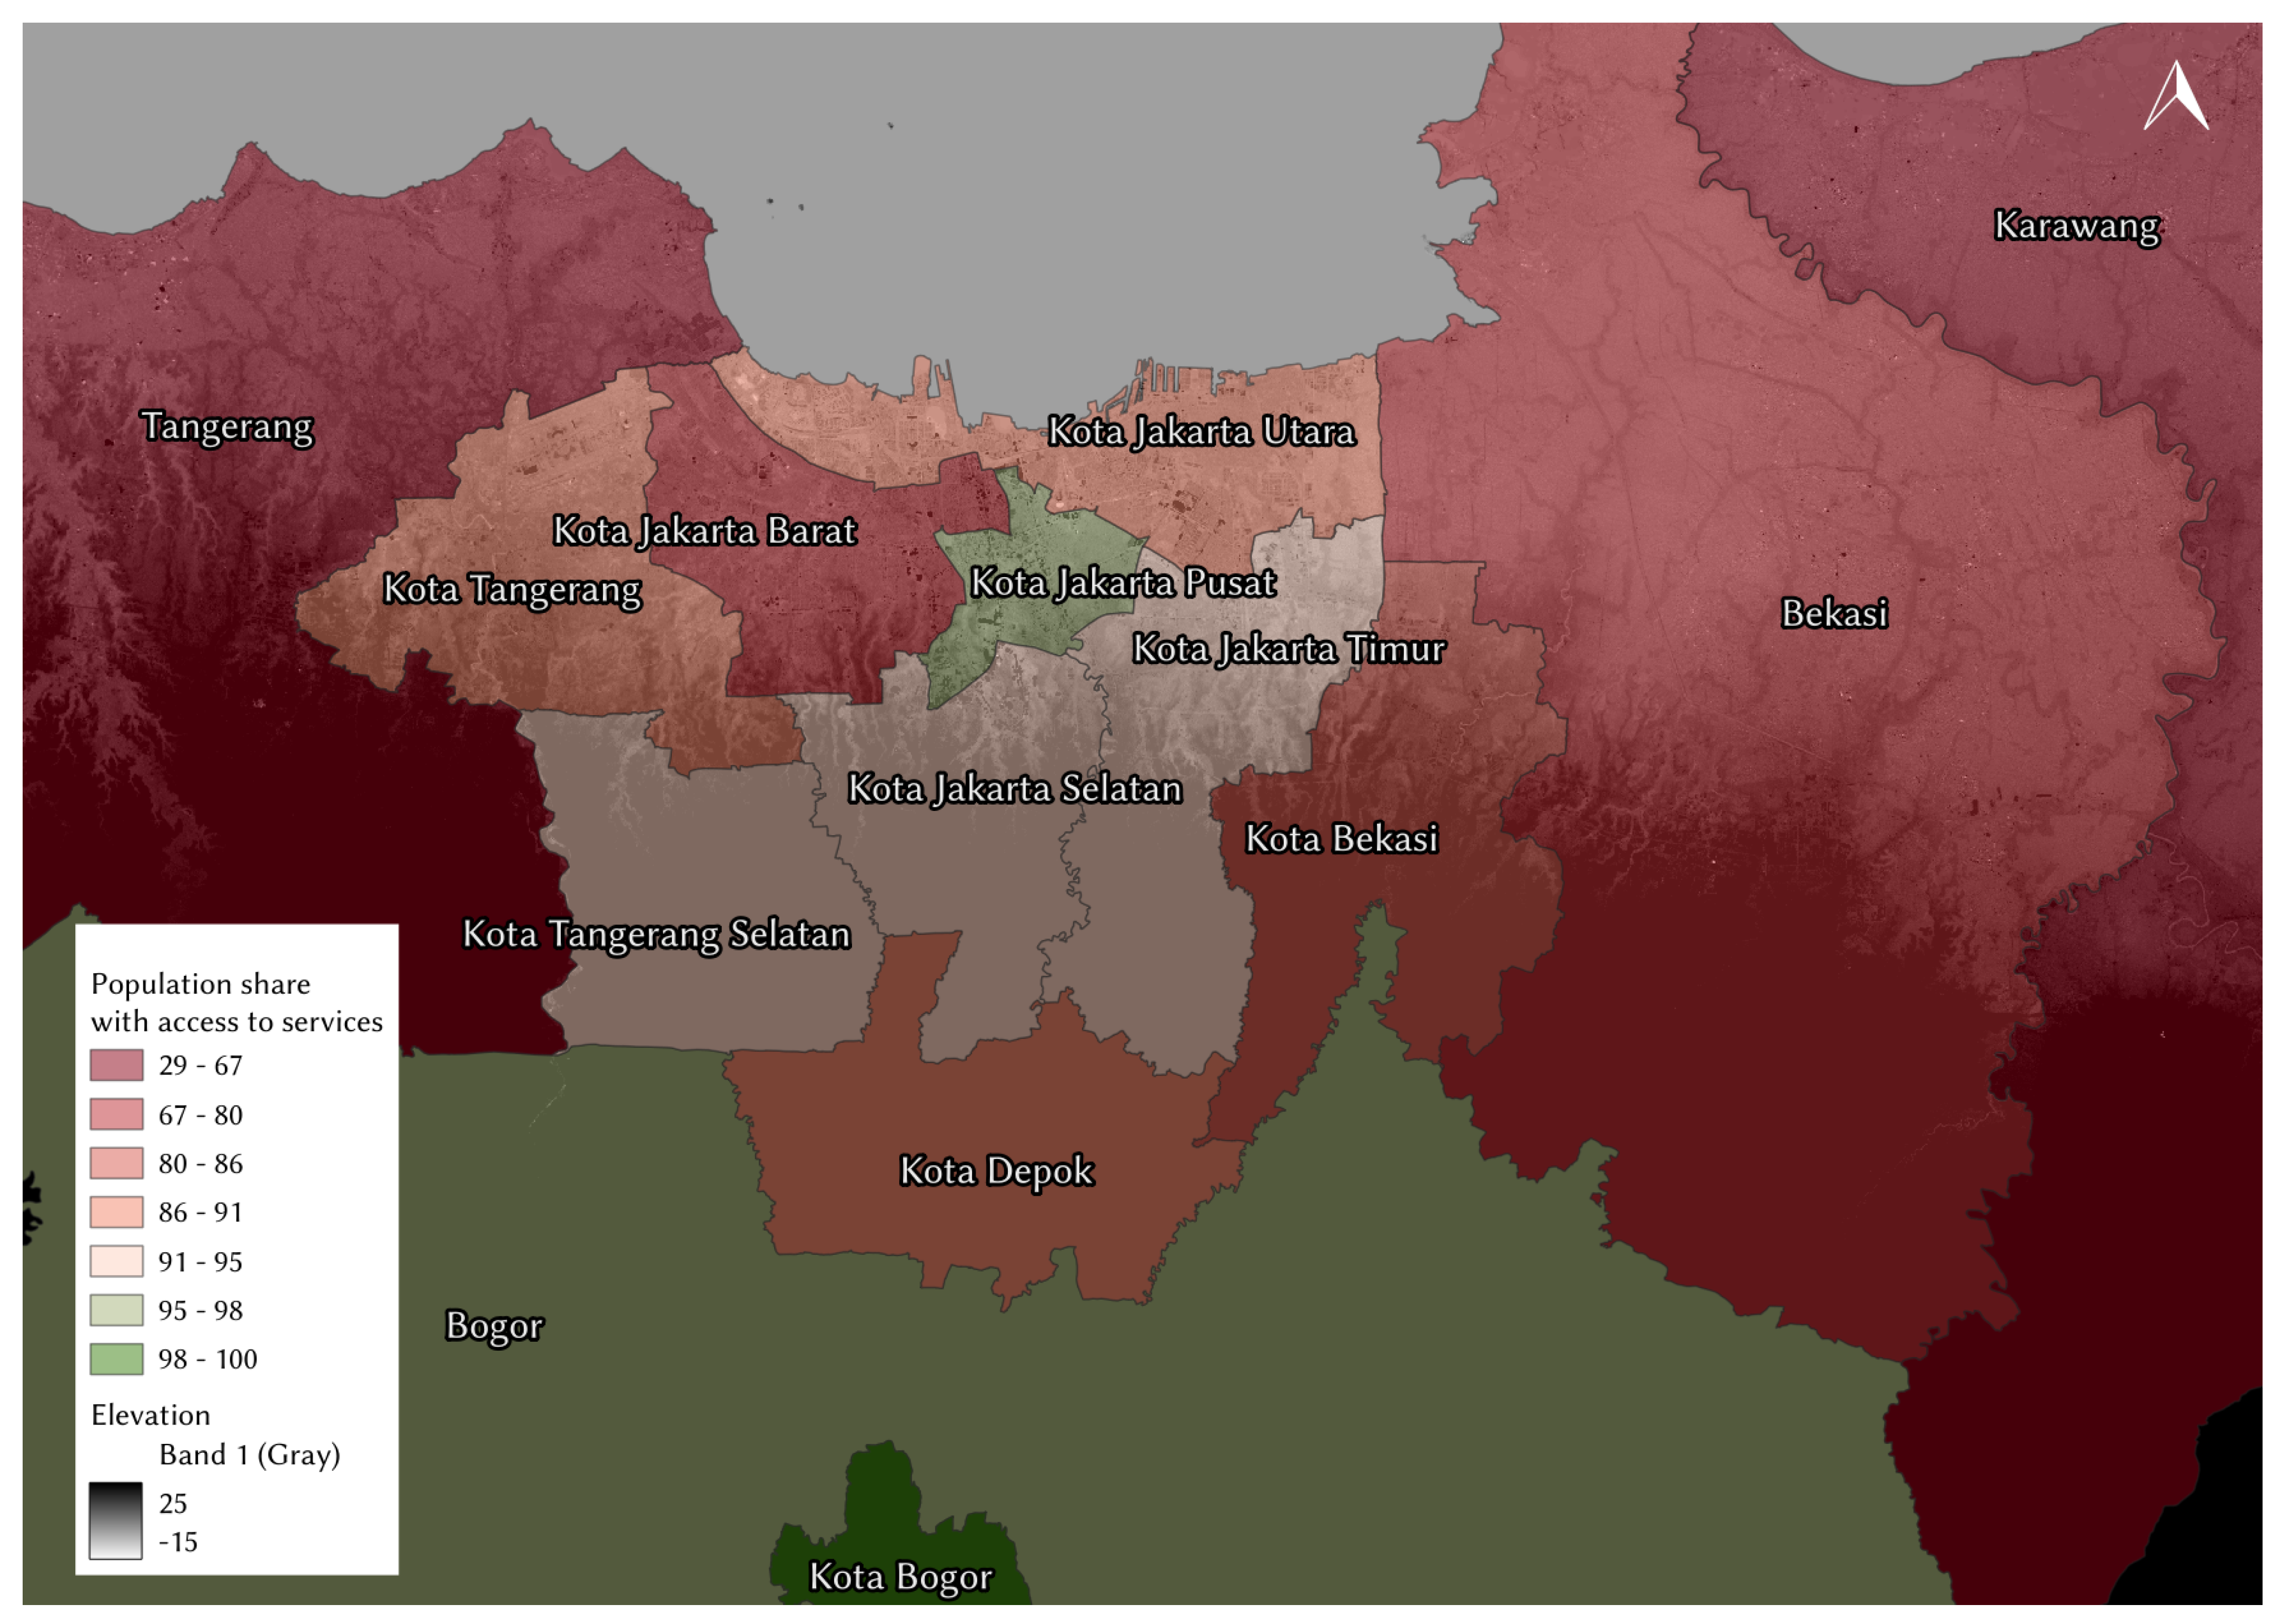
Figure 3 is the illustration of the access variability across districts with a background layer of surface elevation. The access is excellent in the districts colored in green, and it is difficult in the districts colored in red. The lighter (whiter) areas of elevation correspond to lower sea levels and darker areas to higher sea levels. One can see that the northern part of the city is situated on low ground. We assumed that elevation and vulnerability to losing access to services should be related, and a simple analysis proved this point (Table A1). In Figure 3, one can see two major clusters of districts with robust and less-robust access to facilities. A more-robust cluster is concentrated in the high-lying areas and in the heart of the city, and a less-robust cluster forms an arc of districts touching the ocean.

Figure 3.
Share of population with access to all services after the flood in January 2020 by district. Green areas represent the districts that maintained excellent access to services after the flood event; these districts are high-lying Bogor and Kota Bogor and low-lying Kota Jakarta Pusat. In the middle of the metro, there is a cluster of districts with good access to services; they are Kota Tangerang Selatan, Kota Jakarta Selatan, and Kota Jakarta Timur. The rest of the regions form an arc cluster of less-robust districts, Kota Tangerang, Kota Jakarta Utara, and Kota Depok, and problematic districts with critical levels of access to services, which include Kota Jakarta Barat, Kota Bekasi, Bekasi, Tangerang, and Karawang (we have to make an assumption concerning the latter two, as they are cut on the sides and may have access to services that are outside of the scope of the studied network; although, considering a scale of flood occurrence and high poverty levels in these districts, even this incomplete network should reflect the reality).
Table 10 is a closer look at the access to all facility types. Here, we show the poverty severity index with the population share together with the access to all facilities of the considered types. To give some idea about the availability of services within the district, we calculated the number of facilities of certain types per 10,000 persons.
Table 10.
Access to facilities by district after the flood (system ) and the availability of facilities before the flood per 10,000 people (system ). The poverty severity index (S) and the number of facilities per 10,000 persons before the flood () are provided to give readers a general idea about the poverty and facilities availability in the studied districts.
3.2. Poverty, Lack of Access, and Elevation: All Related?
To understand better the relationships between poverty, the population’s lack of access to facilities as the result of a flood, and elevation, we ran simple linear regressions.
We found that there was a negative significant association between access loss and elevation and a positive significant association between access loss and the poverty severity index (Table A2 in Appendix C). This tells us that, in Greater Jakarta, poor people are more exposed to impacts from disasters. This also suggests that the elevation with regard to floods is an important indicator and can be used as the defining parameter when running flood simulations.
3.3. Vulnerability Simulation
Table 11 summarizes the 140 flood simulations conducted on the real network of Greater Jakarta. The simulations were based on the lower cap of flood depth levels in meters (with a 95% probability of failure), upper cap (with a 90% probability of failure), and assumed drainage system failure (with the probability of failure varying from 1 to 10%).
Table 11.
Simulation results. Each row represents a set of ten simulations and contains the information on the average population’s share left with access to all services after simulated flood occurrence () and the average poverty severity in the affected edges (). The column D shows the corresponding flood depth levels with lower and upper caps in meters, and the column W is the yearly probability that an event of this return period occurs.
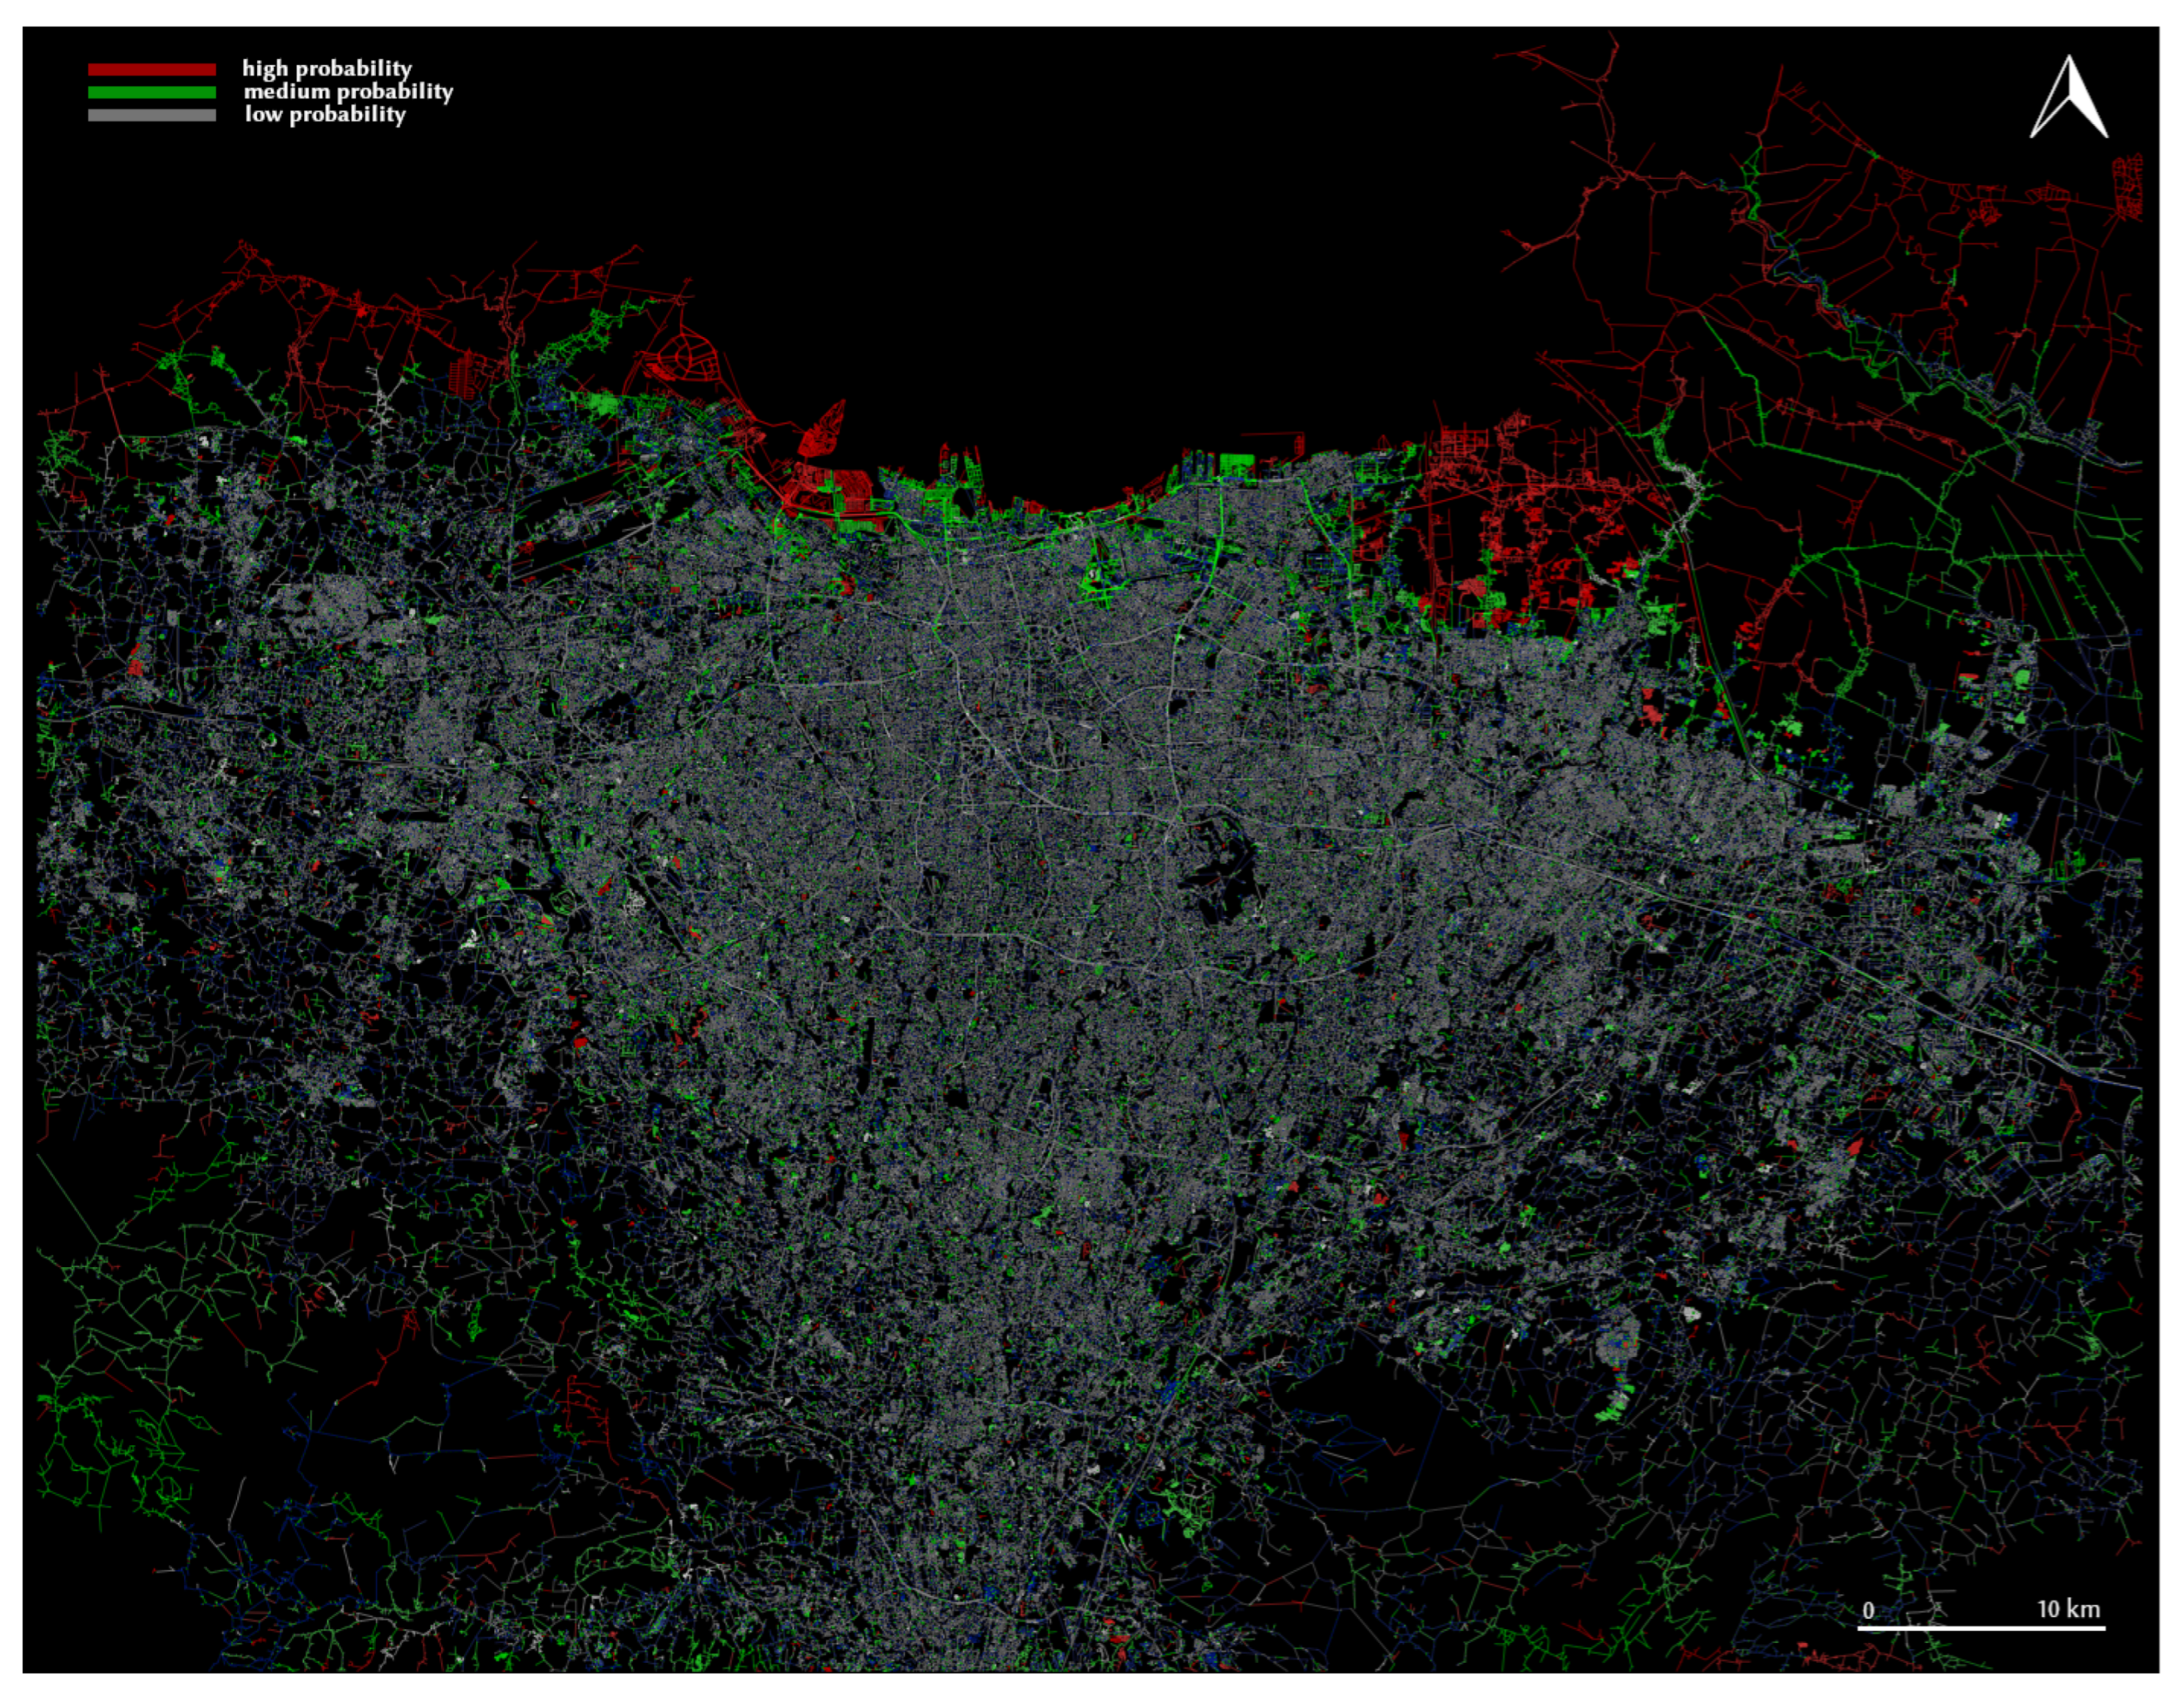
In the table, the average of ten simulations within each elevation interval is calculated for the share of population with access to all facilities and for the poverty severity index in the affected edges. The third column of the table shows the upper and lower elevation caps for flood depth (in meters). The last column is the weight. With this information, it is possible to create a vulnerability map that depicts the probabilities of losing access to critical infrastructure and services in the spatially embedded network (Figure 4). This analysis is only a demonstration of how the information from more-sophisticated flood risk models can be used in a graph-based approach to calculate the vulnerability to not only the occurrence of floods, but also the vulnerability of the population to losing access to vital services. This approach will enable further practical post-disaster analysis and the development of more-effective preparedness measures.
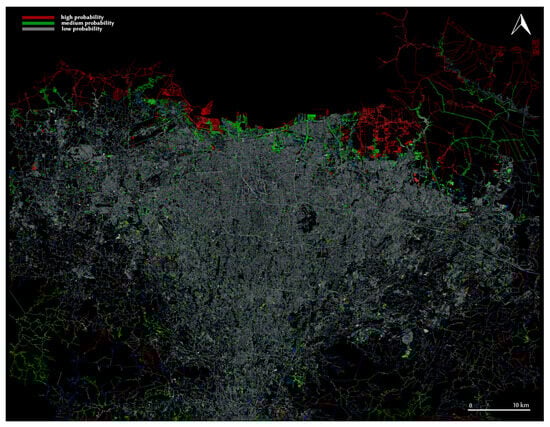
Figure 4.
Greater Jakarta vulnerability map based on simulated flood occurrence probability accounting for flood depth levels and random drainage system failure with the calculated consequent loss of access. Bright red gradient colors present the edges that are very likely to loose access to services during floods; bright green colors indicate a medium probability of this happening; gray colors mean low probability. Base map source: [57] (2020), [58] (2020).
4. Discussion
At the beginning, we mentioned vulnerability, robustness, resilience, and antifragility. So far, this framework has only covered the vulnerability and robustness stages. Thus, this paper is only a segue to a broader discussion of the resilience and antifragility of urban systems. These are all matters for future research—strategies for restoring crippled networks, the time and resources required for restoration, strategies for not simply returning to the initial state, but for rebuilding better, the pursuit of continuous improvement, and the use of shocks as opportunities to rise from the ashes in the form of a more-robust, -resilient, and -antifragile system. The framework, which considers the vulnerability of access to facilities, also opens the door to discussions about facility placement under uncertainty and the facility location problem in general. The framework can be applied to other cities with minimal adaptation. The physical infrastructure data sources will remain the same. What will require some changes is the social dimension, which includes information on population density and poverty. In some cases, these data may not be available, but in other cases, it is possible that more-detailed data can be found. Overall, the better the quality of the data, the more accurate the results will be. In addition, the proposed framework requires categorized satellite data of actual floods; this research is not possible without remote sensing data of a disaster. The mechanisms for activating disaster monitoring, such as Sentinel Asia and the International Charter on Space and Major Disasters, allow space agencies and specialized private companies to make satellite data on disaster damage more accessible, which will also lead to a wider applicability of this framework.
Our framework has generated data for many more insights than those discussed here. Based on the needs of city planners, individual vulnerability maps can be generated for each critical service considered. The simulations can be improved by taking into account more flood factors—environmental, social, and technological. For instance, incorporating information about the past failures of a drainage system will lead to a more-realistic vulnerability assessment. To compare the selected indicators in this paper with some used in the flood risk assessment literature on a more-global scale, Reference [72] used data on average annual precipitation, distance to rivers, elevation, slope, NDVI, population density, GDP, and global land cover. While we took into account the elevation, population density, and poverty level (which may correspond to what the authors were trying to show with the GDP index), in future research, other indicators can also be considered when creating urban vulnerability maps.
At the same time, we must remember that simulations, however complex they are, provide merely an indication of what may be affected in the first place. We have to remember that disaster occurrence is governed by the power law and it is always more beneficial for emergency planners to prepare an urban system for an attack from any possible direction. The idea that improving one part of a system requires improving the system as a whole [73] may work here as well.
It should be noted that a general departure from a focus on the giant connected component in graph-based disaster research is beneficial to the field as a whole. Findings on the absence of traditional random percolation in floods also advance the line of research, making this approach more applicable to crisis management practices.
5. Conclusions
The Jakarta flood that occurred in January 2020 was a devastating catastrophe that affected the lives of hundreds of thousands of people. The framework proposed in this paper allowed quantifying the direct and indirect damage to the physical infrastructure and the loss of access of the population to critical facilities. It was found that 9.6% of all edges were flooded. The hazard broke the urban network into dozens of thousands of disconnected components, increased the betweenness centrality, making the whole system more vulnerable to potential compound attacks, and significantly distorted the road connectivity and people’s access to critical facilities. Both major and minor roads were affected (residential roads being the most affected). Damage to trunk and primary roads was sufficient to cause transportation collapse on other major roads. All types of facilities studied in this paper were directly affected by the flood. Between 12.22 and 12.71% of the population (more than 2.7-million people) lost access to at least one critical facility as a result of this disaster. Access to police stations, fire stations, pharmacies, and shelters was most severely affected.
The tests showed that poor people, on average, settle more in the lowland areas, confirming the hypothesis of uncontrolled urbanization of flood-prone areas in Greater Jakarta. A positive relationship exists between poverty and loss of access, although this does not allow for predictions. A closer look at how the inhabitants lose access to services in different districts revealed vulnerable areas of the city and allowed for the identification of more- and less-robust clusters of districts. We found that the districts Kota Jakarta Barat, Kota Bekasi, Bekasi, Karawang, and Tangerang were the most vulnerable to losing access to critical services during the 2020 flood. Kota Jakarta Utara, Kota Tangerang, and Kota Depok were also significantly affected by the flood. The most-robust districts were Kota Jakarta Pusat and Bogor. An important contribution of this research is the introduction of the notions of facility edge and multiedge facility, where a facility edge is a segment of the road adjacent to the facility and a multiedge facility is a set of all facility edges located in the vicinity of the building. This allowed us to consider ways to reach the facility from different sides and to distinguish between a complete loss of access (if all facility edges are flooded) and an impeded access to a facility (if some, but not all facility edges are flooded).
The flood simulations showed that northern coastal areas and all suburban areas are most vulnerable to flooding. A simulation model used for the calculations, however, is too simplistic: it relies on elevation and rainfall data, but many more factors should be taken into account. Currently, the risk map produced does not reflect the vulnerability of Kota Depok and Kota Bekasi, and it does not explain the large occurrences of real flooding in Kota Jakarta Barat, as well as it does not explain why low-lying poor Kota Jakarta Pusat is relatively safe.
The transformation of geospatial data into a network and the embedding of socio-physical characteristics into this network in the form of edge properties with consequential analysis provides a simplified enough (simple, but not simpler) framework for quantifying the damage from disasters, assessing the vulnerability of access to services, and discussing vulnerability and robustness. This framework relies on the open publicly available data and will be of interest to urban planners, policy-makers, and emergency specialists as a tool for the rapid quantification of hazard impacts without the need for ground surveys and for preliminary assessment of the vulnerability of access to critical facilities.
Author Contributions
Conceptualization, P.K.; methodology, P.K.; software, P.K.; validation, P.K. and G.P.; formal analysis, P.K.; investigation, P.K.; data curation, P.K.; writing—original draft, P.K.; writing—review and editing, P.K. and G.P.; visualization, P.K.; supervision, V.L. and G.P. All authors have read and agreed to the published version of the manuscript.
Funding
Funding support was received from the Austrian Academy of Sciences (Österreichischen Akademie der Wissenschaften). Any opinions, findings, and conclusions or recommendations expressed in this research are those of the authors and do not necessarily reflect the view of the funding organization. The research was conducted within the Young Scientist Summer Program (YSSP) at the International Institute for Applied System Analysis (IIASA) in 2021 in Laxenburg, Austria.
Data Availability Statement
The data presented in this study and the Python code used to analyze them are available upon request from the corresponding author.
Acknowledgments
The authors acknowledge the support of Stefan Hochrainer-Stigler, who provided background data for the simulations. The authors thank Márton Pósfai and Anastasia Kvasha for reviewing an earlier draft and three anonymous reviewers for useful comments and for taking the time to review this paper.
Conflicts of Interest
The authors declare no conflict of interest.
Appendix A
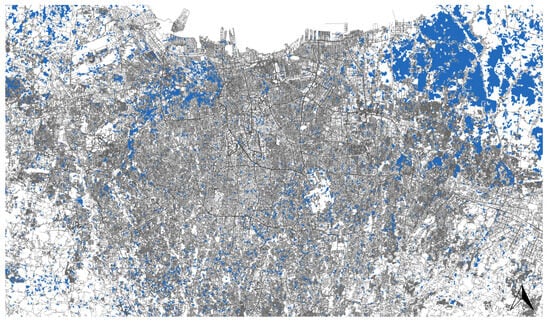
Figure A1.
Flood occurrence in Greater Jakarta, January 2020. Data: [56,57].
Figure A1.
Flood occurrence in Greater Jakarta, January 2020. Data: [56,57].
Appendix B
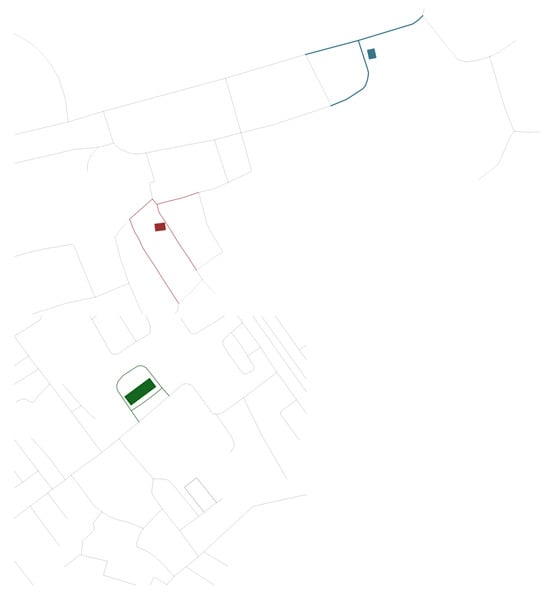
Figure A2.
Approach for embedding critical facilities into the network. The building that hosts the facility usually can be accessed from various sides; therefore, we embedded the facility into all near road segments (edges). A set of edges containing the properties of the same facility forms a multiedge facility. An edge in this set is called a facility edge.
Appendix C
Table A1.
OLS regression to search for relationships between the loss of access, on the one side, and poverty severity and elevation levels, on the other side.
Table A1.
OLS regression to search for relationships between the loss of access, on the one side, and poverty severity and elevation levels, on the other side.
| Dep. Variable: | ACCESS LOSS | R-Squared: | 0.052 | |||
|---|---|---|---|---|---|---|
| Model: | OLS | Adj. R-Squared: | 0.052 | |||
| Method: | Least Squares | F-Statistic: | 2.716 × | |||
| Prob (F-Statistic): | 0.00 | Log-Likelihood: | −3.9708 × | |||
| No. Observations: | 995,074 | |||||
| coef | std err | t | p | [0.025] | [0.975] | |
| const | 0.1312 | 0.001 | 116.923 | 0.000 | 0.129 | 0.133 |
| POVERTY INDEX | 0.5913 | 0.006 | 98.852 | 0.000 | 0.580 | 0.603 |
| ELEVATION | −0.0013 | 7.42 × | −173.281 | 0.000 | −0.001 | −0.001 |
Table A2.
OLS regression to search for relationships between the poverty severity situation, on the one side, and loss of access and elevation levels, on the other side.
Table A2.
OLS regression to search for relationships between the poverty severity situation, on the one side, and loss of access and elevation levels, on the other side.
| Dep. Variable: | POVERTY | R-Squared: | 0.093 | |||
|---|---|---|---|---|---|---|
| Model: | OLS | Adj. R-Squared: | 0.093 | |||
| Method: | Least Squares | F-Statistic: | 5.112 × | |||
| Prob (F-Statistic): | 0.00 | Log-Likelihood: | 1.3851 × | |||
| No. Observations: | 995,074 | |||||
| coef | std err | t | p | [0.025] | [0.975] | |
| const | 0.1656 | 8.91 × | 1857.921 | 0.000 | 0.165 | 0.166 |
| ACCESS LOSS | 0.0164 | 0.000 | 98.852 | 0.000 | 0.016 | 0.017 |
| ELEVATION | −0.0003 | 1.21 × | −277.190 | 0.000 | −0.000 | −0.000 |
References
- UNDESA. 2018 Revision of World Urbanization Prospects; United Nations Department of Economic and Social Affairs: New York, NY, USA, 2018. [Google Scholar]
- Bettencourt, L.M. Introduction to Urban Science: Evidence and Theory of Cities as Complex Systems; MIT Press: Cambridge, MA, USA, 2021. [Google Scholar]
- Center, A.D.R. Sendai Framework for Disaster Risk Reduction 2015–2030; United Nations Office for Disaster Risk Reduction: Geneva, Switzerland, 2015. [Google Scholar]
- Forrester, J.W. Urban Dynamics; The MIT Press: Cambridge, MA, USA, 1969. [Google Scholar]
- Dong, S.; Esmalian, A.; Farahmand, H.; Mostafavi, A. An integrated physical-social analysis of disrupted access to critical facilities and community service-loss tolerance in urban flooding. Comput. Environ. Urban Syst. 2020, 80, 101443. [Google Scholar] [CrossRef]
- Telo, J. Smart City Security Threats and Countermeasures in the Context of Emerging Technologies. Int. J. Intell. Autom. Comput. 2023, 6, 31–45. [Google Scholar]
- Vale, L.J.; Campanella, T.J. The Resilient City: How Modern Cities Recover from Disaster; Oxford University Press: Oxford, UK, 2005. [Google Scholar]
- May, R.M. Will a large complex system be stable? Nature 1972, 238, 413–414. [Google Scholar] [CrossRef] [PubMed]
- Casale, R.; Margottini, C. Floods and Landslides: Integrated Risk Assessment: Integrated Risk Assessment; with 30 Tables; Springer Science & Business Media: Berlin/Heidelberg, Germany, 1999. [Google Scholar]
- Klemas, V. Remote sensing of floods and flood-prone areas: An overview. J. Coast. Res. 2015, 31, 1005–1013. [Google Scholar] [CrossRef]
- ALOS Global Digital Surface Model “ALOS World 3D-30m (AW3D30)”. Available online: https://www.eorc.jaxa.jp/ALOS/en/dataset/aw3d30/aw3d30_e.htm (accessed on 20 August 2023).
- Energydata.info. Indonesia—Population Density. Available online: https://energydata.info/dataset/indonesia--population-density-2015 (accessed on 20 August 2023).
- Malamud, B.D.; Turcotte, D.L. The applicability of power-law frequency statistics to floods. J. Hydrol. 2006, 322, 168–180. [Google Scholar] [CrossRef]
- Hanson, R. Catastrophe, social collapse, and human extinction. In Global Catastrophic Risks; Oxford University Press: Cambridge, MA, USA, 2008; pp. 363–378. [Google Scholar]
- Taleb, N.N. Antifragile: How to Live in a World We Don’t Understand; Allen Lane: London, UK, 2012. [Google Scholar]
- Cimellaro, G.P. Urban Resilience for Emergency Response and Recovery: Fundamental Concepts and Applications; Springer: Berlin/Heidelberg, Germany, 2016. [Google Scholar]
- Blečić, I.; Cecchini, A. On the antifragility of cities and of their buildings. City Territ. Archit. 2017, 4, 3. [Google Scholar] [CrossRef]
- Blečić, I.; Cecchini, A. Antifragile planning. Plan. Theory 2019, 19, 172–192. [Google Scholar] [CrossRef]
- Fuchs, S.; Thaler, T. Vulnerability and Resilience to Natural Hazards; Cambridge University Press: Cambridge, UK, 2018. [Google Scholar]
- Burton, C.; Rufat, S.; Tate, E. Social vulnerability. In Vulnerability and Resilience to Natural Hazards; Fuchs, S., Thaler, T., Eds.; Cambridge University Press: Cambridge, UK, 2018; pp. 53–81. [Google Scholar]
- Newman, M. Networks; Oxford University Press: Oxford, UK, 2018. [Google Scholar]
- Johnson, J.; Gheorghe, A.V. Antifragility analysis and measurement framework for systems of systems. Int. J. Disaster Risk Sci. 2013, 4, 159–168. [Google Scholar] [CrossRef]
- Bianconi, G. Multilayer Networks: Structure and Function; Oxford University Press: Oxford, UK, 2018. [Google Scholar]
- Brummitt, C.D.; D’Souza, R.M.; Leicht, E.A. Suppressing cascades of load in interdependent networks. Proc. Natl. Acad. Sci. USA 2012, 109, E680–E689. [Google Scholar] [CrossRef]
- Rinaldi, S.M.; Peerenboom, J.P.; Kelly, T.K. Identifying, understanding, and analyzing critical infrastructure interdependencies. IEEE Control. Syst. Mag. 2001, 21, 11–25. [Google Scholar]
- Grubesic, T.H.; Matisziw, T.C. A typological framework for categorizing infrastructure vulnerability. GeoJournal 2013, 78, 287–301. [Google Scholar] [CrossRef]
- Pinnaka, S.; Yarlagadda, R.; Çetinkaya, E.K. Modelling robustness of critical infrastructure networks. In Proceedings of the 2015 11th International Conference on the Design of Reliable Communication Networks (DRCN), Kansas City, MI, USA, 24–27 March 2015; pp. 95–98. [Google Scholar]
- Cheng, Q. A new mathematical framework and spatial decision support system for modeling cascade interdependency of critical infrastructure during geo-disasters. J. Earth Sci. 2017, 28, 131–146. [Google Scholar] [CrossRef]
- Mao, Q.; Li, N. Assessment of the impact of interdependencies on the resilience of networked critical infrastructure systems. Nat. Hazards 2018, 93, 315–337. [Google Scholar] [CrossRef]
- Wang, W.; Yang, S.; Hu, F.; Stanley, H.E.; He, S.; Shi, M. An approach for cascading effects within critical infrastructure systems. Phys. A Stat. Mech. Its Appl. 2018, 510, 164–177. [Google Scholar] [CrossRef]
- Zhou, D.; Gao, J.; Stanley, H.E.; Havlin, S. Percolation of partially interdependent scale-free networks. Phys. Rev. E 2013, 87, 052812. [Google Scholar] [CrossRef] [PubMed]
- Zhou, Y.; Sheu, J.B.; Wang, J. Robustness assessment of urban road network with consideration of multiple hazard events. Risk Anal. 2017, 37, 1477–1494. [Google Scholar] [CrossRef] [PubMed]
- Radicchi, F.; Bianconi, G. Redundant interdependencies boost the robustness of multiplex networks. Phys. Rev. X 2017, 7, 011013. [Google Scholar] [CrossRef]
- Sun, W.; Bocchini, P.; Davison, B.D. Resilience metrics and measurement methods for transportation infrastructure: The state of the art. Sustain. Resilient Infrastruct. 2020, 5, 168–199. [Google Scholar] [CrossRef]
- Cavallaro, M.; Asprone, D.; Latora, V.; Manfredi, G.; Nicosia, V. Assessment of urban ecosystem resilience through hybrid social–physical complex networks. Comput.-Aided Civ. Infrastruct. Eng. 2014, 29, 608–625. [Google Scholar] [CrossRef]
- Bozza, A.; Asprone, D.; Manfredi, G. Developing an integrated framework to quantify resilience of urban systems against disasters. Nat. Hazards 2015, 78, 1729–1748. [Google Scholar] [CrossRef]
- Bozza, A.; Asprone, D.; Parisi, F.; Manfredi, G. Alternative resilience indices for city ecosystems subjected to natural hazards. Comput.-Aided Civ. Infrastruct. Eng. 2017, 32, 527–545. [Google Scholar] [CrossRef]
- Gonçalves, L.; Ribeiro, P. Resilience of urban transportation systems. Concept, characteristics, and methods. J. Transp. Geogr. 2020, 85, 102727. [Google Scholar] [CrossRef]
- Pan, S.; Yan, H.; He, J.; He, Z. Vulnerability and resilience of transportation systems: A recent literature review. Phys. A Stat. Mech. Its Appl. 2021, 581, 126235. [Google Scholar] [CrossRef]
- Gajanayake, A.; Zhang, G.; Khan, T.; Mohseni, H. Postdisaster impact assessment of road infrastructure: State-of-the-art review. Nat. Hazards Rev. 2020, 21, 03119002. [Google Scholar] [CrossRef]
- Mattsson, L.G.; Jenelius, E. Vulnerability and resilience of transport systems–A discussion of recent research. Transp. Res. Part A Policy Pract. 2015, 81, 16–34. [Google Scholar] [CrossRef]
- Barabási, A.L.; Pósfai, M. Network Science; Cambridge University Press: Cambridge, UK, 2016. [Google Scholar]
- Yadav, N.; Chatterjee, S.; Ganguly, A.R. Resilience of Urban transport network-of-networks under intense flood Hazards exacerbated by targeted Attacks. Sci. Rep. 2020, 10, 10350. [Google Scholar] [CrossRef] [PubMed]
- Smith, A.M.; Pósfai, M.; Rohden, M.; González, A.D.; Dueñas-Osorio, L.; D’Souza, R.M. Competitive percolation strategies for network recovery. Sci. Rep. 2019, 9, 11843. [Google Scholar] [CrossRef]
- Gao, J.; Barzel, B.; Barabási, A.L. Universal resilience patterns in complex networks. Nature 2016, 530, 307–312. [Google Scholar] [CrossRef]
- Duan, D.; Lv, C.; Si, S.; Wang, Z.; Li, D.; Gao, J.; Havlin, S.; Stanley, H.E.; Boccaletti, S. Universal behavior of cascading failures in interdependent networks. Proc. Natl. Acad. Sci. USA 2019, 116, 22452–22457. [Google Scholar] [CrossRef]
- Abbar, S.; Zanouda, T.; Borge-Holthoefer, J. Robustness and resilience of cities around the world. arXiv 2016, arXiv:1608.01709. [Google Scholar]
- Loreti, S.; Ser-Giacomi, E.; Zischg, A.; Keiler, M.; Barthelemy, M. Local impacts on road networks and access to critical locations during extreme floods. Sci. Rep. 2022, 12, 1552. [Google Scholar] [CrossRef] [PubMed]
- Abdulla, B.; Mostafavi, A.; Birgisson, B. Characterization of the vulnerability of road networks to fluvial flooding using network percolation approach. In Computing in Civil Engineering 2019: Smart Cities, Sustainability, and Resilience; American Society of Civil Engineers: Reston, VA, USA, 2019; pp. 428–435. [Google Scholar]
- Wang, W.; Yang, S.; Stanley, H.E.; Gao, J. Local floods induce large-scale abrupt failures of road networks. Nat. Commun. 2019, 10, 2114. [Google Scholar] [CrossRef] [PubMed]
- Fan, C.; Jiang, X.; Mostafavi, A. A network percolation-based contagion model of flood propagation and recession in urban road networks. Sci. Rep. 2020, 10, 1–12. [Google Scholar] [CrossRef] [PubMed]
- Dong, S.; Mostafizi, A.; Wang, H.; Gao, J.; Li, X. Measuring the topological robustness of transportation networks to disaster-induced failures: A percolation approach. J. Infrastruct. Syst. 2020, 26, 04020009. [Google Scholar] [CrossRef]
- Ganin, A.A.; Kitsak, M.; Marchese, D.; Keisler, J.M.; Seager, T.; Linkov, I. Resilience and efficiency in transportation networks. Sci. Adv. 2017, 3, e1701079. [Google Scholar] [CrossRef]
- Farahmand, H.; Liu, X.; Dong, S.; Mostafavi, A.; Gao, J. A network observability framework for sensor placement in flood control networks to improve flood situational awareness and risk management. Reliab. Eng. Syst. Saf. 2022, 221, 108366. [Google Scholar] [CrossRef]
- Kiparisov, P. Urban System Resilience to Floods in Greater Jakarta; IIASA: Laxenburg, Austria, 2021. [Google Scholar]
- Sentinel-Asia. Indonesia Flood on 01 Jan 2020. Available online: https://sentinel-asia.org/EO/2020/article20200101ID.html (accessed on 20 August 2023).
- OpenStreetMap. OSM History Dump © OpenStreetMap Contributors. Available online: https://planet.openstreetmap.org/planet/full-history/ (accessed on 20 August 2023).
- Humanitarian-OSM. ©Humanitarian-OSM Contributors. Available online: https://data.humdata.org/organization/hot (accessed on 20 August 2023).
- Herfort, B.; Eckle, M.; de Albuquerque, J.P.; Zipf, A. Towards assessing the quality of volunteered geographic information from OpenStreetMap for identifying critical infrastructures. In Proceedings of the ISCRAM, Kristiansand, Norway, 24–27 May 2015. [Google Scholar]
- Ludwig, C.; Hecht, R.; Lautenbach, S.; Schorcht, M.; Zipf, A. Assessing the Completeness of Urban Green Spaces in OpenStreetMap. In Proceedings of the Academic Track, Heidelberg, Germany, 21–23 September 2019; p. 21. [Google Scholar]
- Sauter, H.; Feldmeyer, D.; Birkmann, J. Exploratory study of urban resilience in the region of Stuttgart based on OpenStreetMap and literature resilience indicators. Int. Arch. Photogramm. Remote. Sens. Spat. Inf. Sci. 2019, 42, 213–220. [Google Scholar] [CrossRef]
- Open Data Jakarta. Data Indeks Keparahan Kemiskinan Menurut KabKota DKI Jakarta 2018. Available online: https://jakarta.bps.go.id/indicator/23/910/2/indeks-keparahan-kemiskinan-p2-menurut-kabupaten-kota-di-provinsi-dki-jakarta.html (accessed on 20 August 2023).
- Open Data Jabar. Indeks Keparahan Kemiskinan Berdasarkan Kabupaten/Kota di Jawa Barat 2021. Available online: https://jabar.bps.go.id/dynamictable/2020/01/29/192/indeks-keparahan-kemiskinan-menurut-kabupaten-kota-di-jawa-barat-2019.html (accessed on 20 August 2023).
- Badan Pusat Statistik. Indeks Keparahan Kemiskinan (P2) Menurut Kabupaten/Kota 2019–2020. Available online: https://www.bps.go.id/indicator/23/623/2/indeks-keparahan-kemiskinan-p2-menurut-kabupaten-kota.html (accessed on 20 August 2023).
- Alexander, C. Notes on the Synthesis of Form; Harvard University Press: Cambridge, MA, USA, 1964. [Google Scholar]
- QGIS, D.T. QGIS Geographic Information System. QGIS Association. 2021. Available online: https://qgis.org/en/site/ (accessed on 20 August 2023).
- Hagberg, A.; Swart, P.; S Chult, D. Exploring Network Structure, Dynamics, and Function Using NetworkX; Technical Report; Los Alamos National Lab. (LANL): Los Alamos, NM, USA, 2008. [Google Scholar]
- Peixoto, T.P. The Graph-Tool Python Library. 2014. Available online: https://figshare.com/articles/dataset/graph_tool/1164194 (accessed on 20 August 2023).
- Eric, D.; Kolaczy, K. Statistical Analysis of Network Data: Methods and Models; Springer Series in Statistics; Springer: New York, NY, USA, 2009. [Google Scholar]
- The Graph-Tool Centrality Measures. Available online: https://graph-tool.skewed.de/static/doc/centrality.html#graph_tool.centrality.betweenness (accessed on 15 November 2022).
- Hochrainer-Stigler, S.; Kunreuther, H.; Linnerooth-Bayer, J.; Mechler, R.; Michel-Kerjan, E.; Muir-Wood, R.; Ranger, N.; Vaziri, P.; Young, M. The Costs and Benefits of Reducing Risk from Natural Hazards to Residential Structures in Developing Countries; University of Pennsylvania: Philadelphia, PA, USA, 2010. [Google Scholar]
- Guoyi, L.; Liu, J.; Shao, W. Urban flood risk assessment under rapid urbanization in Zhengzhou City, China. Reg. Sustain. 2023, 4, 332–348. [Google Scholar] [CrossRef]
- Forrester, J.W. Counterintuitive behavior of social systems. Technol. Forecast. Soc. Change 1971, 3, 1–22. [Google Scholar] [CrossRef]
Disclaimer/Publisher’s Note: The statements, opinions and data contained in all publications are solely those of the individual author(s) and contributor(s) and not of MDPI and/or the editor(s). MDPI and/or the editor(s) disclaim responsibility for any injury to people or property resulting from any ideas, methods, instructions or products referred to in the content. |
© 2023 by the authors. Licensee MDPI, Basel, Switzerland. This article is an open access article distributed under the terms and conditions of the Creative Commons Attribution (CC BY) license (https://creativecommons.org/licenses/by/4.0/).