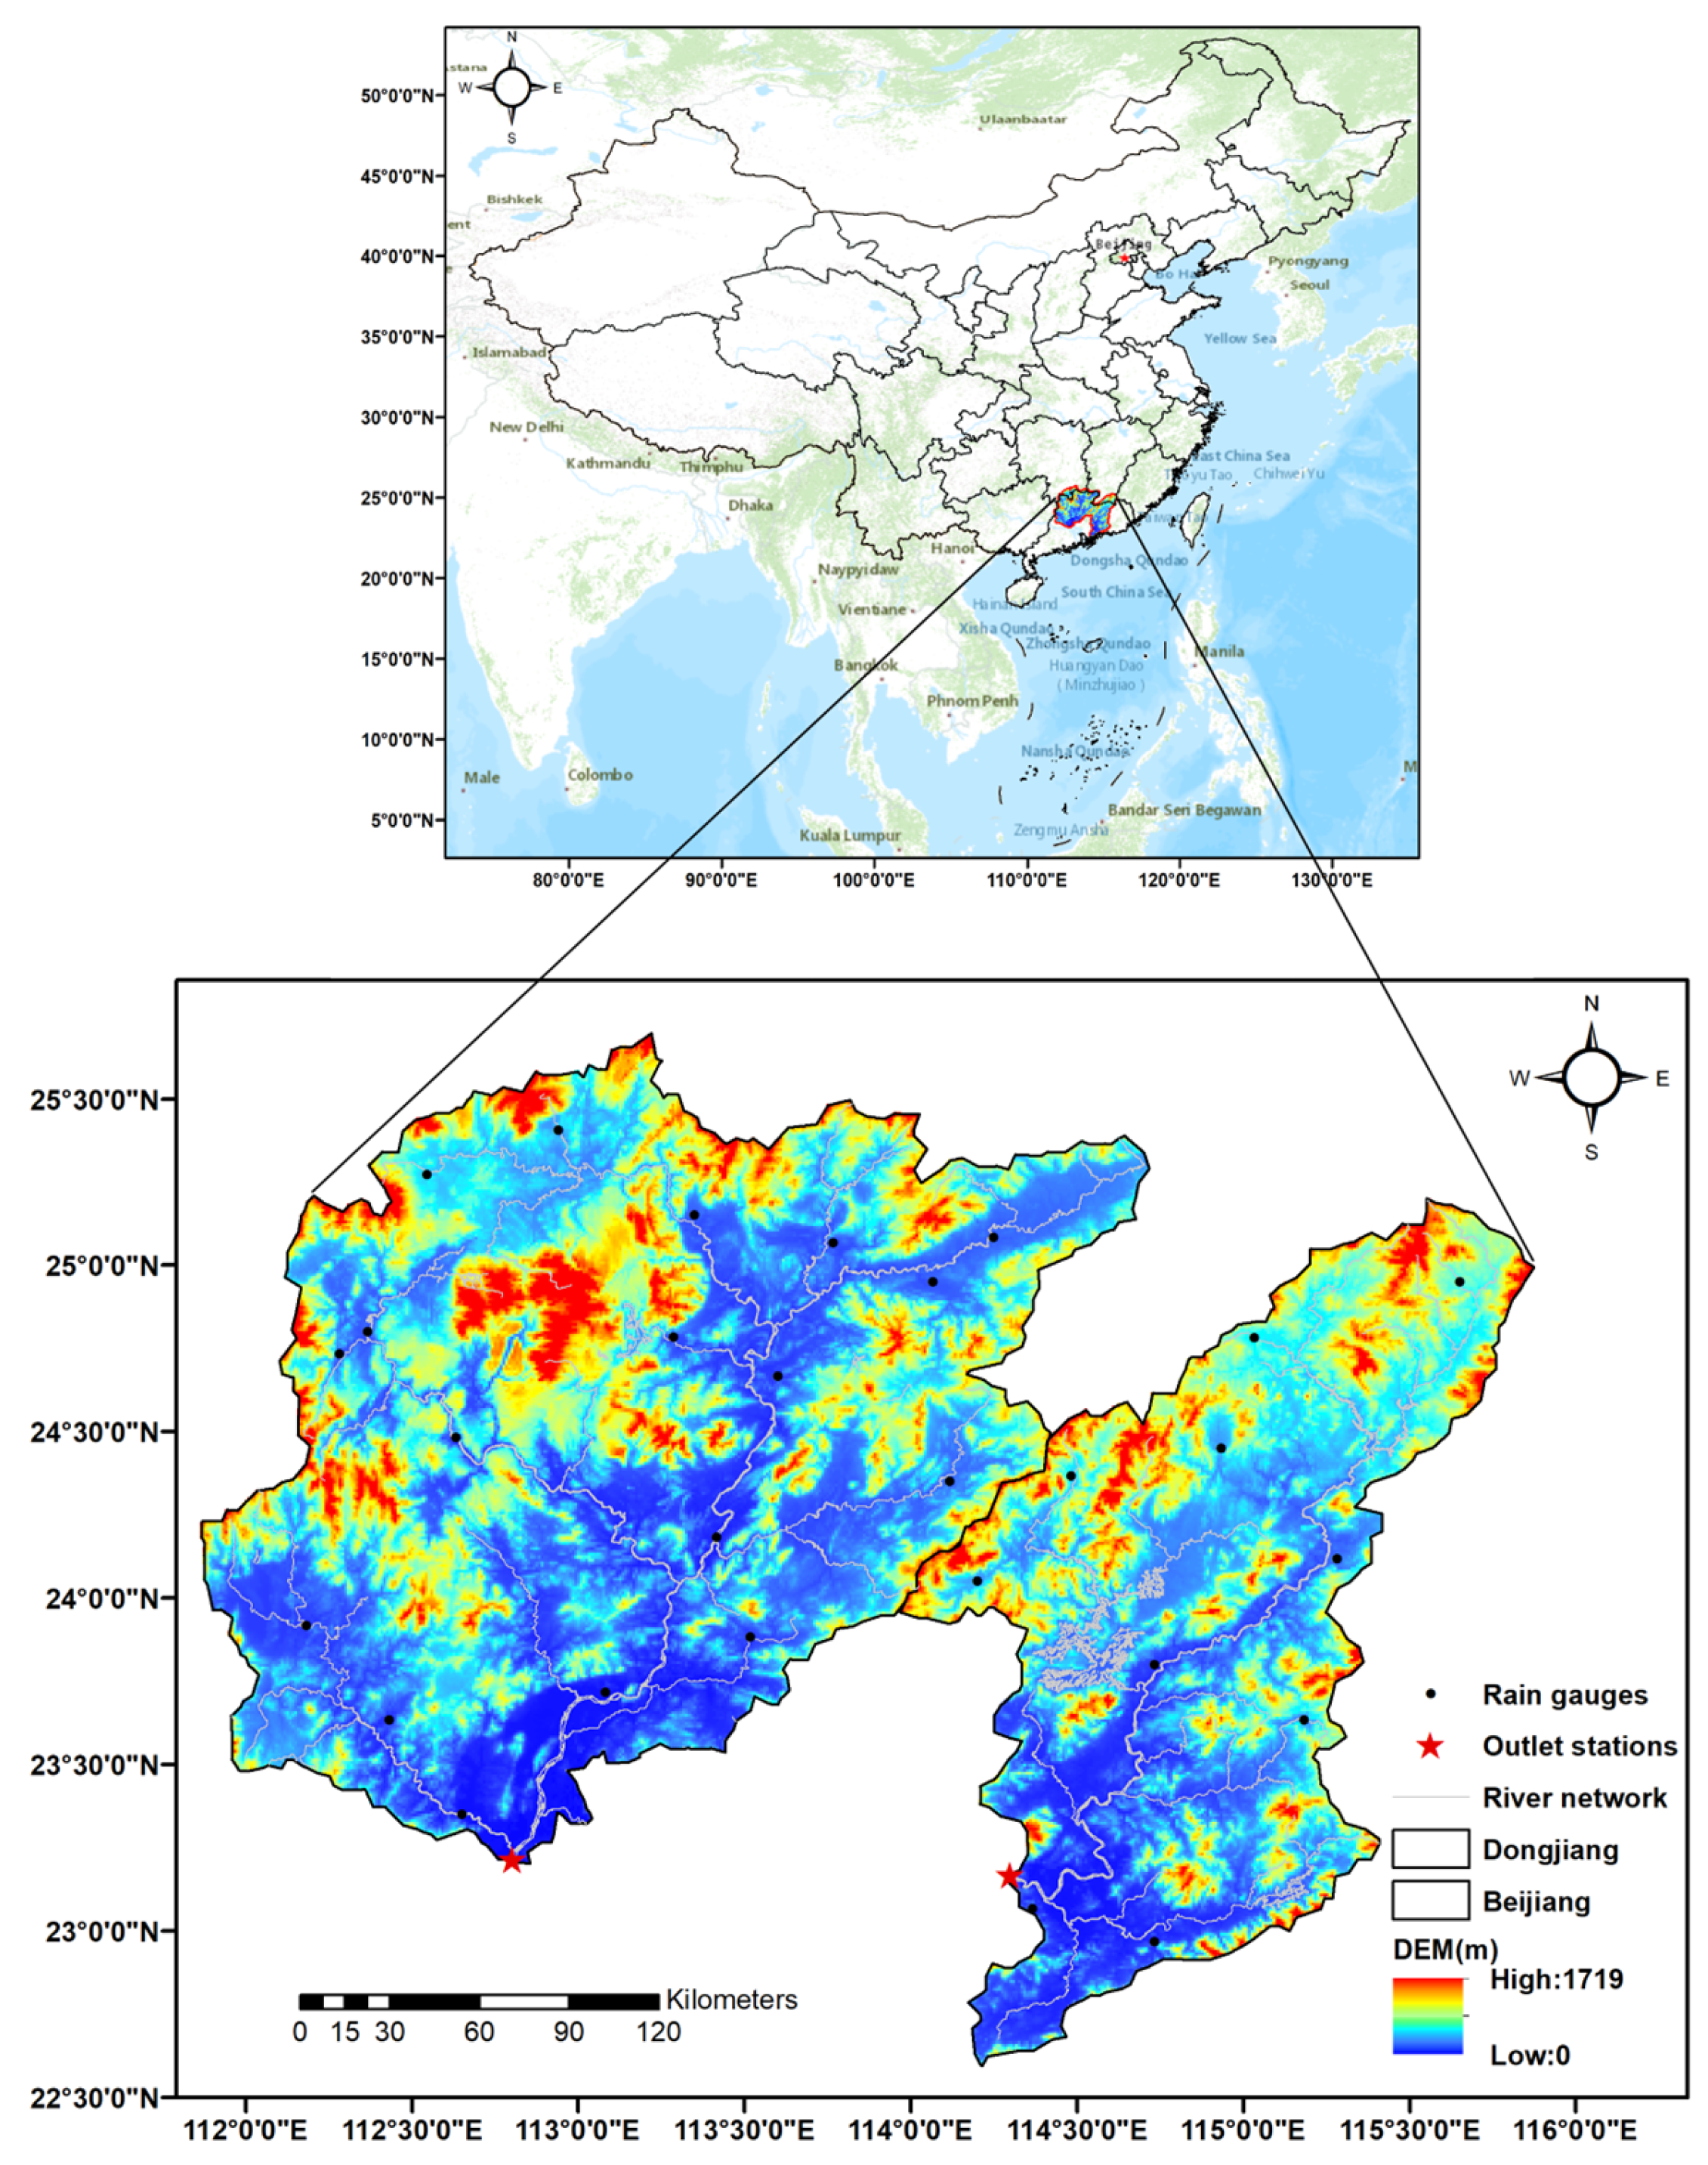
Article

Evaluation of Multiple Satellite, Reanalysis, and Merged Precipitation Products for Hydrological Modeling in the Data-Scarce Tributaries of the Pearl River Basin, China

1
Center for Ocean Remote Sensing of Southern Marine Science and Engineering Guangdong Laboratory (Guangzhou), Key Laboratory of Guangdong for Utilization of Remote Sensing and Geographical Information System, Guangdong Open Laboratory of Geospatial Information Technology and Application, Guangzhou Institute of Geography, Guangdong Academy of Sciences, Guangzhou 510070, China
2
Climate and Global Dynamics, National Center for Atmospheric Research, Boulder, CO 80305, USA
3
Southern Marine Science and Engineering Guangdong Laboratory, Guangzhou 511485, China
*
Author to whom correspondence should be addressed.
Remote Sens. 2023, 15(22), 5349; https://doi.org/10.3390/rs15225349
Submission received: 26 July 2023 / Revised: 18 October 2023 / Accepted: 10 November 2023 / Published: 13 November 2023

Abstract

:
Satellite and reanalysis precipitation estimates of high quality are widely used for hydrological modeling, especially in ungauged or data-scarce regions. To improve flood simulations by merging different precipitation inputs or directly merging streamflow outputs, this study comprehensively evaluates the accuracy and hydrological utility of nine corrected and uncorrected precipitation products (TMPA-3B42V7, TMPA-3B42RT, IMERG-cal, IMERG-uncal, ERA5, ERA-Interim, GSMaP, GSMaP-RNL, and PERSIANN-CCS) from 2006 to 2018 on a daily timescale using the Coupled Routing and Excess Storage (CREST) hydrological model in two flood-prone tributaries, the Beijiang and Dongjiang Rivers, of the Pearl River Basin, China. The results indicate that (1) all the corrected precipitation products had better performance (higher CC, CSI, KGE’, and NSCE values) than the uncorrected ones, particularly in the Beijiang River, which has a larger drainage area; (2) after re-calibration under Scenario II, the two daily merged precipitation products (NSCE values: 0.73–0.87 and 0.69–0.82 over the Beijiang and Dongjiang Rivers, respectively) outperformed their original members for hydrological modeling in terms of BIAS and RMSE values; (3) in Scenario III, four evaluation metrics illustrated that merging multi-source streamflow simulations achieved better performance in streamflow simulation than merging multi-source precipitation products; and (4) under increasing flood levels, almost all the performances of streamflow simulations were reduced, and the two merging schemes had a similar performance. These findings will provide valuable information for improving flood simulations and will also be useful for further hydrometeorological applications of remote sensing data.

1. Introduction

Flooding is among the most prevalent natural disasters around the world, with particularly heavy socio-economic impacts in low-income countries [1]. In recent decades, the frequency and intensity of floods have been increasing, which can cause critical damage to property and loss of life, especially in densely populated low-lying coastal areas [2,3,4]. As precipitation is a key component of the global water cycle and the primary input for hydrological models, its accurate measurement is vital to improving our understanding of meteorology, hydrology, and agriculture [5,6]. Although ground-based rain gauges, weather radar networks, and ocean-based instruments can observe more accurate precipitation at points or on small scales, they are usually sparsely and unequally spatially distributed [7,8]. Moreover, hydrological modeling and forecasting is a challenging task in ungauged and data-scare basins, especially in remote areas with complex terrains in developing countries [9,10,11]. This indicates that the restricted in-situ observations and weaknesses leave a knowledge gap in our understanding of complex hydrological processes and water resource management [12].
Following rapid advances in remote sensing technologies, satellite sensors and reanalysis models can provide continuous, open-access, and quasi-global precipitation estimates at high spatial and temporal resolutions [13,14,15]; examples include the Precipitation Estimates from Remotely Sensed Information using Artificial Neural Networks Cloud Classification System (PERSIANN-CCS) [16], the gauge-corrected version of Global Satellite Mapping of Precipitation (GSMaP) [17], the Tropic Rainfall Measuring Mission (TRMM) Multi-Satellite Precipitation Analysis (TMPA) [18], and the Integrated Multi-Satellite Retrievals for Global Precipitation Measurement (GPM IMERG) [19]. In addition, the latest fifth generation of the European Center for Medium-Range Weather Forecasts (ECMWF) reanalysis database (ERA5) [20] integrates a large amount of historical observations into global estimates using advanced modelling and data assimilation systems. Although these gridded remote-sensing-based precipitation products have been broadly applied in numerous fields at different temporal and spatial scales, their performances are greatly restricted by errors and show areas for further improvement [21,22,23,24,25,26,27]. On the one hand, the quality of satellite precipitation data varies with climate, topography, temporal variability, and precipitation intensity, which may be limited by the satellite sensors, retrieval algorithms, and spatial sampling frequency [28]. On the other hand, uncertainties in reanalysis precipitation datasets can arise from the forcing data and the prediction model in the assimilation system, making their performances inconsistent in different regions [29]. Consequently, it is essential to assess the reliability and applicability of multi-source precipitation products and to make some adjustments and improvements for better hydrometeorological applications.
In recent years, many studies have investigated the hydrological utility of commonly used satellite and reanalysis precipitation products for streamflow simulation during different time periods at basin or global scales [30,31,32,33,34,35]. Several other studies have evaluated the error propagation of satellite precipitation uncertainties through hydrological modeling over different areas [36,37,38,39]. Nevertheless, previous studies have mainly evaluated multi-satellite and reanalysis precipitation products combined with statistical indicators using lumped hydrological models, thereby excluding the internal spatially variable characteristics of river basins [32,40,41,42,43]. Often, hydrological models have not been re-calibrated for each remotely sensed precipitation product; thus, they fail to compare uncorrected satellite or reanalysis products with the ones based on rain gauge networks [43]. Additionally, these studies have not explored the suitability of satellite and reanalysis precipitation estimates for identifying flood characteristics in hydrological simulations [44,45]. Furthermore, the recently released ERA5 precipitation product has not been assessed for hydrological applications over the Pearl River Basin [46,47]. From the perspective of flood modeling, it can generally be hard to conclude which of the existing precipitation products performs the best, as each has its own advantages.
To improve the accuracy of precipitation estimates for hydrological applications, some studies have attempted to merge multi-source precipitation products [14,48,49,50,51]. However, almost all these related merging studies have focused on adjusting precipitation magnitudes and improving their temporal-spatial resolutions, instead of comparing the corrected satellite products with their uncorrected ones for better hydrological modeling [52]. Few works have investigated the possible ways to improve streamflow simulation by directly merging the modeled streamflow outputs of their corresponding precipitation inputs [48], while the state-of-the-art satellite and reanalysis precipitation datasets such as IMERG and ERA5 have not been taken into account. Overall, there is a prominent gap in the hydrology literature associated with comparing multiple-precipitation-input merging and streamflow-output merging for better flood modeling at individual catchments, which is a crucial motivation for the present research.
To explore the above issues, this study comprehensively evaluated and investigated hydrological simulations of multiple uncorrected and corrected satellite and reanalysis precipitation products, by two merging strategies in the flood-prone Beijiang and Dongjiang Rivers of the Pearl River Basin, China. The objectives of this study were two-fold: (1) to evaluate the hydrological utility of nine satellite and reanalysis precipitation products during 2006–2018 at a daily scale using the Coupled Routing and Excess Storage (CREST) hydrologic model, and (2) to develop and compare two merging schemes—(i) precipitation input merging and (ii) streamflow output merging—using the arithmetic mean method, to investigate their capabilities for improving streamflow and flood simulations. We seek deeper insights into the merging approaches for better flood modeling, and new findings regarding the uncertainties of global precipitation products are revealed and discussed. This study will provide valuable references for hydrological applications and also facilitate better flood modeling.

2. Materials and Methods

2.1. Study Area

This study focuses on the flood-prone rivers in Guangdong Province in southern China; namely, the Beijiang and Dongjiang River Basins of the Lower Pearl River, which are the main water supplies for the Guangdong–Hong Kong–Macao Greater Bay Area (Figure 1).
The Beijiang River, located in southern China within 111°51′–114°42′E and 23°12′–25°41′N, is 468 km long with a mean gradient of around 0.026%; the total drainage area of the basin is 38,363 km2 above the Shijiao hydrological station. It is the second-largest tributary in the Pearl River Basin and is an important water source for the Pearl River Delta region. Most areas of the basin are hilly and mountainous, with elevations ranging from 1719 m (in the north) to 0 m above sea level. Climatically, under the influence of summer monsoons and tropical cyclones, the mean annual precipitation and temperature of this river basin are ~1785 mm and ~21 °C, respectively. The rainfall regime displays a notable summer maximum during the wet season (from April to September), since over 75% of the annual total amount occurs during this period. Due to its complex topography and the associated effect of the east Asian monsoon climate, rainstorms and floods are frequent in the Beijiang River Basin. For instance, the recent extraordinary flood that occurred in June 2022 had a peak flow of up to 18,500 m3/s at the Shijiao station; this exceeded the historically measured maximum and caused enormous damage to local society.
The Dongjiang River, adjacent to the Beijiang River in the east is located within 113°58′–115°52′ E and 22°35′–25°12′ N; it is 562 km long with a mean gradient of about 0.039%; the total drainage area of the basin is 25,325 km2 above the Boluo hydrological station. As the third tributary of the Pearl River Basin, it is crucial not only for the local region but also for Hong Kong City, as around 80% of Hong Kong’s water supply comes from this river through cross-river transference. The hilly mountains with an elevation of >200 m account for 49.1% of the basin, with elevations ranging from 1325 m in the north to 0 m above sea level from northeast to southwest. The predominant land use type is forest, occupying ~70% of the basin, but the urban city is expanding rapidly, particularly in the low-lying areas. Under the influence of the subtropical monsoon climate, the mean annual precipitation and temperature of this river basin are ~1795 mm and ~21 °C, respectively. Approximately 80% of the annual precipitation and runoff occur during the rainy season from April to September.

2.2. Data Availability

2.2.1. Rainfall and Discharge Observations

To assess the multi-source remote-sensing-based precipitation products, the China Gauge-based Daily Precipitation Analysis (CGDPA) product developed by the China Meteorological Administration was used in this research [53]. Using climatological optimal interpolation (OI) based on ~2700 national rain gauges over China’s mainland, this product is updated in real time at a spatial resolution of 0.25° × 0.25° (http://cdc.nmic.cn, accessed on 1 January 1998). Because of CGDPA’s superior quality, it is often used as a reference for satellite precipitation information both in data analysis and hydrologic evaluations [54]. As shown in Figure 1, there are 18 and 10 grid cells with at least one rain gauge per grid cell at 0.25° × 0.25° over the entire Beijiang and Dongjiang River Basins, respectively. This research uses only 0.25° grid cells to assess various products spanning the period 2006–2018; these are resampled by the nearest neighbor allocation method using ArcGIS 10.6 software.
Daily streamflow records of two catchments were obtained from hydrologic year books published by the Hydrologic Bureau of the Ministry of Water Resources of China. The hydrological modeling was restricted to the time period from 2006 to 2018 due to the availability of both streamflow observations and satellite precipitation.

2.2.2. Satellite and Reanalysis Precipitation Products

As summarized in Table 1, seven satellite precipitation, two reanalysis precipitation, and two merged precipitation products were intercompared with the primary information and references. All the products were freely downloaded through the Google Earth Engine.

2.2.3. Topography and Potential Evapotranspiration

The digital terrain DEM, FAC, and FAR data used in this research were derived from the HydroSHEDS database (https://www.hydrosheds.org/hydrosheds-core-downloads accessed on 17 October 2023) provided by the US Geological Survey (USGS). The river network, flow direction, and convergence information were extracted from the DEM using the ArcGIS software.
The required potential evapotranspiration (PET) data adopted the global daily database provided by the Famine Early Warning Systems Network global data portal (http://earlywarning.usgs.gov/fews, accessed on 1 January 2001).

2.3. Methodology

2.3.1. Distributed Hydrological Model

The CREST hydrologic model was jointly developed by the University of Oklahoma and the NASA SERVIR project team [58]. It has been publicly available for a decade and widely used in a number of research projects from basin to global scales [10,59,60,61,62,63]. We used the common version CREST v2.1 to assess the hydrologic availability and capabilities of multi-source precipitation estimates [64]. As attached in Appendix A, the CREST model allows users to define the grid cell resolution at which the spatio-temporal variation in water and energy fluxes and storages are simulated, thereby enabling multi-scale applications (http://hydro.ou.edu/research/CREST/, accessed on 25 January 2015). To calibrate the model parameters, autocalibration via the shuffled complex evolution (SCE) global optimization algorithm is used [65], which has proved to be efficient.

2.3.2. Evaluation Indicators

Table 2 shows the statistical and hydrological metrics used for comparison and evaluation in this study. Five statistical indicators—i.e., the Pearson correlation coefficient (CC), relative bias (BIAS), mean absolute error (MAE), root-mean-square error (RMSE), and Kling–Gupta efficiency (KGE′)—were selected to quantitatively assess the agreement of multi-satellite and reanalysis precipitation estimates against gauge-observed data. Another three detection indicators—i.e., the probability of detection (POD), false alarm ratio (FAR), and critical success index (CSI)—were used to evaluate the detection ability above the daily rainfall threshold of 1.0 mm/d [30,66].
According to the standards of the Precipitation Intensity Classification adopted by the China Meteorological Administration (https://www.cma.gov.cn/, accessed on 16 August 2013), daily rainfall was divided into five categories: no/tiny rain (<0.1 mm/d), light rain (0.1–10 mm/d), moderate rain (10–25 mm/d), heavy rain (25–50 mm/d), and storm (≥50 mm/d), respectively.
In addition, a Taylor diagram was utilized to directly analyze the error characteristics of rainfall datasets in the calibration and validation periods; it comprises the CC, standard deviation (STD), and centered root-mean-square deviation (RMSD).
For hydrologic model performance, the Nash–Sutcliffe coefficient of efficiency (NSCE), CC, BIAS, and RMSE were generally used to evaluate the streamflow simulations. Then, the Quantile–Quantile (Q–Q) plot was selected to assess whether two datasets were generated from the same distribution.

2.3.3. Hydrological Simulation Scenarios

After assessing the accuracy of precipitation, this research used gauge-observed, satellite-based, and reanalysis precipitation products as forcing data in the hydrological model CREST for streamflow simulations in the Beijiang and Dongjiang River Basins. In addition, we developed and compared two merging schemes (i.e., precipitation input merging and streamflow output merging) to investigate their capability for improving streamflow and flood simulations. The arithmetic mean method was applied to merge these three uncorrected precipitation datasets (TMPA-3B42RT, IMERG-uncal, and ERA5) as well as another three corrected products (TMPA-3B42V7, IMERG-cal, and GSMaP).
To better examine the effectiveness of multi-source precipitation products during the study period, three hydrological simulation scenarios were designed as follows. Considering Scenario I shown in Table 3 and Table 4, the values of CC for ERA-Interim, GSMaP-RNL, and PERSIANN-CCS were less than 0.4, and we chose not to use them in Scenario II or III.
  • Scenario I (calibrated by gauge-observed products)
As shown in Table 3 and Figure 2, this scenario used the CGDPA precipitation data to force and calibrate the CREST model with the observed streamflow data from 2006 to 2010 at a daily scale. Then, based on the same model parameters calibrated by CGDPA for the independent validation period from 2011 to 2018, the model was driven by precipitation inputs from CGDPA, TMPA-3B42V7, TMPA-3B42RT, IMERG-cal, IMERG-uncal, ERA5, ERA-Interim, GSMaP, GSMaP-RNL, PERSIANN-CCS, and two merged precipitation products, respectively.
2.
Scenario II (recalibrated by satellite-based/reanalysis products)
CGDPA benchmarking in Scenario I was usually applied over gauged areas, while Scenario II could be viewed as a replacement for the utility of remotely sensed precipitation products over data-scarce basins that lack rain gauges [10,31]. During the same calibration period of 2006–2010, this model was recalibrated using TMPA-3B42V7, TMPA-3B42RT, IMERG-cal, IMERG-uncal, ERA5, ERA-Interim, GSMaP, and two merged precipitation products, respectively. Then, the different parameter sets of each product were used to simulate the streamflow obtained with their corresponding precipitation forcing during the validation period of 2011–2018.
3.
Scenario III (manually controlled ensemble simulation)
To further improve the streamflow simulations after Scenario II, we manually compared two merging schemes—precipitation input merging and streamflow output merging—using the arithmetic mean method. In this scenario, the new streamflow series were respectively derived from two arithmetic means of three selected streamflow simulations driven by each individual precipitation dataset (TMPA-3B42RT, IMERG-uncal, and ERA5) as well as another three (TMPA-3B42V7, IMERG-cal, and GSMaP).

3. Results and Discussion

3.1. Hydrometeorological Characteristics

As shown in Figure 3a, the annual average observed flow during 2006–2018 for the Beijiang River Basin showed an annual growth rate of 0.27 m3/s, while the annual rate decreased by 13.65 m3/s for the Dongjiang River Basin. According to the daily flow duration curves (FDCs) obtained from the discharge observations (Figure 3b), the flows were 134 m3/s and 170 m3/s in the Beijiang and Dongjiang River Basins, respectively, with a 99.98% probability exceedance. For the Beijiang River Basin, the flow of 1490 (1750, 2780, 3980, and 6500, respectively) m3/s had a 25% (20%, 10%, 5%, and 2%, respectively) probability exceedance. For the Dongjiang River Basin, the flow of 839 (971, 1440, 2030, and 3120, respectively) m3/s had a 25% (20%, 10%, 5%, and 2%, respectively) probability exceedance.
The different exceed-probability flood flows are necessary elements which can guide the design and construction of multiple water-conservancy projects, including hydraulic power, flood control planning, and water supply and drainage engineering [11].

3.2. Comparison of Multi-Satellite and Reanalysis Precipitation Inputs

The temporal variation of precipitation considerably affects the hydrologic process on the land surface. To systematically evaluate the quality of the eleven precipitation products (namely, TMPA-3B42V7, TMPA-3B42RT, IMERG-cal, IMERG-uncal, ERA5, ERA-Interim, GSMaP, GSMaP-RNL, PERSIANN-CCS, and Average Rain 1 and Rain 2), they were separately compared with CGDPA data over the two river basins from 2006 to 2018 at a daily scale.
Figure 4 displays scatter plots along with their corresponding statistical metrics for the calibration period (blue dots) as well as the validation period (red dots), as derived from the basin-average precipitation of the Beijiang River Basin. Among all these precipitation estimates, the findings demonstrate that the best simulations were obtained from eight precipitation datasets during the whole period; these showed good agreement with CGDPA (CC and KGE′ values ranging from 0.84 to 0.97 and from 0.74 to 0.97) and were especially good at capturing precipitation events (CSI values ranging from 0.68 to 0.86). However, PERSIANN-CCS showed the worst BIAS, KGE′, and CSI (Calibration/Validation: −57.8%/−62.7%, 0.27/0.22, and 0.49/0.50), followed by GSMaP-RNL (−32.5%/−45.1%, 0.54/0.43, and 0.66/0.63) and ERA-Interim (−13.1%/9.24%, 0.70/0.57 and 0.72/0.70), which was due to the fact that instrumental and systematic biases could contribute to significant uncertainties in rainfall amounts. Generally, all these corrected precipitation datasets (TMPA-3B42V7, IMERG-cal, ERA5, and GSMaP) outperformed their corresponding uncorrected datasets (TMPA-3B42RT, IMERG-uncal, ERA-Interim, and GSMaP-RNL) (Figure 3 and Figure 4). GSMaP exhibited the best performance of all precipitation data during the whole period (CC = 0.97/0.94, RMSE = 2.51/3.54 mm/d, MAE = 1.16/1.55 mm/d, KGE′ = 0.97/0.94, and CSI = 0.84/0.86), followed by Average Rain 1 (CC = 0.95/0.93, RMSE = 3.22/3.83 mm/d, MAE = 1.54/1.80 mm/d, KGE′ = 0.94/0.90, and CSI = 0.81/0.83) and Average Rain 2 (CC = 0.92/0.93, RMSE = 3.91/4.26 mm/d, MAE = 1.86/2.06 mm/d, KGE′ = 0.90/0.90, and CSI = 0.80/0.80). It can be seen clearly that both Average Rain 1 and Rain 2 showed better metrics than their primary members except GSMaP, highlighting the feasibility of using the simple arithmetic mean method for merging multiple precipitation datasets over two study basins (Figure 3 and Figure 4).
Figure 5 shows scatter plots along with their corresponding statistical metrics for the calibration period (blue dots) as well as the validation period (red dots), derived from the basin-average precipitation of the Dongjiang River Basin. Similar to the Beijiang River, results indicate that eight precipitation products could capture precipitation events quite well (CSI values ranging from 0.66 to 0.86) during the calibration period and had good agreement with CGDPA (KGE′ values ranging from 0.72 to 0.92) during the whole period. However, PERSIANN-CCS showed the worst BIAS, KGE′, and CSI (Calibration/Validation: −52.7%/−59.2%, 0.32/0.24, and 0.54/0.53), followed by GSMaP-RNL (−34.1%/−25.7%, 0.52/0.57, and 0.67/0.66) and ERA-Interim (−26.2%/−7.5%, 0.60/0.55, and 0.71/0.69). According to CC, RMSE, MAE, and CSI, GSMaP exhibited the best performance of all precipitation data during the whole period (CC = 0.96/0.85, RMSE = 3.56/5.61 mm/d, MAE = 1.34/1.88 mm/d, and CSI = 0.86/0.82), followed by the Average Rain 1 (CC = 0.95/0.83, RMSE = 3.72/6.16 mm/d, MAE = 1.70/2.28 mm/d, and CSI = 0.82/0.79) and Rain2 (CC = 0.93/0.82, RMSE = 4.29/6.30 mm/d, MAE = 2.06/2.59 mm/d, and CSI = 0.80/0.77). Additionally, Average Rain 1 had the highest KGE′ (0.92/0.83) during the whole period, followed by Average Rain 2 during the calibration period or by GSMaP during the validation period. This implies that the simple averaged multi-source precipitation data could serve as a more suitable choice in climatology studies than their primary members for the Dongjiang River Basin.
Figure 6 presents the comparison of sample proportions in different precipitation intensities, as obtained by the gauged observation and 11 precipitation products over the study period. It was obvious that the sample proportions of no/tiny rain and light rain levels of all precipitation were 0.80–0.94 and 0.83–0.93 over the Beijiang and Dongjiang River Basins, respectively; meanwhile, heavy and storm rain were relatively rare (<0.05). For moderate and above precipitation intensities, the sample proportions of PERSIANN-CCS and GSMaP-RNL were much lower than that of CGDPA. Additionally, all the proportions of corrected precipitation products were slightly closer to the reference than their uncorrected ones. For the Beijiang River (Figure 6a), the majority of the evaluated products could well capture the distribution of precipitation of CGDPA, but estimation biases were still observed. For instance, PERSIANN-CCS, GSMaP-RNL, TMPA-3B2V7, and 3B42RT noticeably overestimated the proportion of no/tiny rain and underestimated that of light and moderate rains. By contrast, both PERSIANN-CCS and GSMaP-RNL showed similar precipitation frequency distributions to CGDPA, with the most common being no/tiny rain over the Dongjiang River Basin (Figure 6b).
Figure 7 illustrates the spatially distributed KGE′ of various precipitation products against CGDPA at a spatial resolution of 0.25° and a daily scale from 2006 to 2018 for the basins. Overall, Average Rain 1 had the highest KGE′ (0.71–0.89), followed by GSMaP (0.48–0.95) and Average Rain 2 (0.65–0.83). As shown in the figure, all the corrected precipitation datasets (TMPA-3B42V7, IMERG-cal, ERA5, and GSMaP) showed higher KGE′ values than their corresponding uncorrected datasets (TMPA-3B42RT, IMERG-uncal, ERA-Interim, and GSMaP-RNL). The results confirm that PERSIANN-CCS performed the worst with approximately 90% of KGE′ values less than 0.3; this phenomenon seems reasonable because its limited features were insufficient to interpret actual cloud types [20]. Furthermore, GSMaP-RNL and ERA-Interim (KGE′ = 0.18–0.65 and 0.33–0.55, respectively) showed notably poorer performances than any of the others.
The Taylor diagrams were applied to analyze the error characteristics of precipitation datasets at a basin scale; specifically, we focused on precipitation intensity evaluation. Figure 8 shows that according to the CGDPA points (black stars), the closer the Taylor diagram points representing the multi-source precipitation products are, the better the accuracy. GSMaP performed the highest (the blue stars) over the Beijiang and Dongjiang River Basins both in the calibration and validation sets, which means it has the biggest similarity to CGDPA, followed by Average Rain 1 and Rain 2 (the red points), respectively. IMERG-cal also displayed larger values for RMSD and lower values for CC than the other satellite and reanalysis products in Figure 6a–d. Clearly, PERSIANN-CCS and GSMaP-RNL performed far worse than the others over two river basins during the calibration period (Figure 6a,c), while PERSIANN-CCS and ERA-Interim performed much worse than the others over the study basins during the validation period (Figure 8b,d). Moreover, TMPA-3B42RT and ERA5 showed similar performances over the two river basins during the whole period (Figure 8a–d). Considering the performances of all crops in the Dongjiang River Basin were marginally lower than those in the Beijiang River Basin, there might be two reasons for this: On the one hand, the rain gauge number of the Dongjiang River Basin, whose drainage area is smaller, was smaller than that of the Beijiang River Basin. On the other hand, the Dongjiang River Basin has a comparatively complicated topography and lower rainfall intensity (Figure 1).
In summary, considering the quantitative evaluation and Taylor diagram analysis, the multi-source gridded precipitation products show considerable differences in their performance. However, this may lead to confusion when choosing a precipitation product for practical applications using a single performance metric. Hence, the combination of multiple criteria for selection can reduce the chance of subpar metrics outperforming themselves for random reasons [67]. It is worth noting that GSMaP exhibits the best performance, while the worst performance was found for PERSIANN-CCS and GSMaP-RNL. Their differing behavior patterns across the study basins may be attributed to the differences in the gauge-adjustment methods and the biases in their pre-non-gauge-adjusted products [68]. In addition, the spatial variability of errors in precipitation estimation can be caused by various factors such as complex terrains, climate, land-cover changes, and anthropogenic influences [69].

3.3. Streamflow Simulation Scenarios and Results

The widely used approach for addressing the basin-scale discrepancies between ground- and reanalysis/satellite-based precipitation estimates is to use them to drive hydrological models, subsequently evaluating the model performance against observational flood records [7]. Nevertheless, the error of precipitation inputs may result in substantial uncertainty in future flood forecasting. In this section, we compare the effects of various precipitation estimates for hydrological modeling at the outlets of the Beijiang and Dongjiang River Basins. Three scenarios were assessed with regard to their day-to-day streamflow simulations and comparisons.

3.3.1. Scenario I: Hydrological Model Calibrated by Gauge Observations

  • Simulated streamflow forced by CGDPA
First, we used the daily gauge observations of both rainfall and streamflow data from April 2006 to December 2010 to calibrate the CREST model parameters, where the previous 3 months were used to warm up the hydrological model [70]. For the Beijiang and Dongjiang River Basins, Table 4 and Table 5 indicate the considerable agreement of model streamflow simulations with their observations during the calibration and validation periods, respectively. As shown in Table 4 and Figure 9a and Figure 10a, there was a good match between most magnitudes and timings of flood peaks that were forced by CGDPA precipitation over the whole period (e.g., NSCE, BIAS, CC, and RMSE values were 0.82–0.89, −9.37%–−10.47%, 0.91–0.95, and 546.91–662.95 m3/s, respectively). Under increasing observed streamflow (over 5690 m3/s) for the Beijiang River Basin, it is obvious that the modeled streamflow was almost underestimated. According to Table 5 and Figure 11a and Figure 12a for the Dongjiang River Basin, the majority of flood magnitudes and timings were a close match during the calibration period (e.g., NSCE, BIAS, CC, and RMSE values were 0.87, −2.99%, 0.93, and 305.77 m3/s, respectively), whereas the model streamflow simulation was underestimated as their observed streamflow increased during the validation period (e.g., NSCE, BIAS, CC, and RMSE values were 0.62, −9.76%, 0.81, and 379.28 m3/s, respectively). As discussed in Section 3.2, the uncertainty in rainfall products along with topographical and geophysical characteristics can contribute to the discrepancy in hydrological performance between these two watersheds and—particularly for small catchments—degrade the model-simulated streamflow [61,71]. Using the CGDPA precipitation inputs, the CREST model could be well simulated at a daily scale during both the calibration and validation periods over the Beijiang and Dongjiang River Basins, respectively. Hence, CGDPA could serve as an appropriate reference to assess the hydrological accuracy of various satellite- and reanalysis-based precipitation products for this study region.
Table 4. Statistics of daily simulated streamflow during the calibration (1 April 2006–31 December 2010) and validation (1 January 2011–31 December 2018) periods under Scenario I for the Beijiang River Basin.
PeriodPrecipitation InputNSCEBIAS (%)CCRMSE (m3/s)
CalibrationCGDPA0.89−10.470.95546.91
ValidationCGDPA0.82−9.370.91662.95
3B42V70.71−8.970.86835.39
3B42RT0.611.690.84972.68
IMERG-cal0.73−11.410.86810.01
IMERG-uncal0.63−21.940.81951.71
ERA50.66−5.320.82902.55
ERA-Interim0.450.850.701154.42
GSMaP0.78−13.230.89724.98
GSMaP-RNL0.40−50.940.771200.90
PERSIANN-CCS−0.30−83.840.571769.10
Average Rain 10.77−12.330.89746.78
Average Rain 20.71−12.750.86830.60
2.
Streamflow simulations forced by multi-source precipitation
After that, using the same model parameters calibrated via CGDPA, we applied eleven precipitation datasets to force the CREST model during the validation period from January 2011 to December 2018, respectively. As shown in Table 4, GSMaP performed best for hydrological modeling (i.e., the values of NSCE, BIAS, CC, and RMSE were 0.78, −13.23%, 0.89, and 724.98 m3/s, respectively), followed by Average Rain 1 and IMERG-cal in the Beijiang River Basin. In contrast, PERSIANN-CCS showed the worst performance, followed by GSMaP-RNL and ERA-Interim (e.g., NSCE and RMSE values were less than 0.45 and more than 1154.42 m3/s, respectively). As shown in Table 5, IMERG-cal performed best in hydrological modeling (i.e., the values of NSCE, BIAS, CC, and RMSE were 0.69, −5.53%, 0.86, and 340.65 m3/s, respectively), followed by Average Rain 1 and Average Rain 2 in the Dongjiang River Basin. PERSIANN-CCS also showed the worst performance, followed by ERA-Interim and GSMaP-RNL (e.g., the values of NSCE, BIAS, and RMSE were less than 0.38, −40.20%, and more than 483.95 m3/s, respectively).
Overall, all the corrected precipitation datasets performed much better than their corresponding uncorrected datasets for hydrologic modeling. The reason for this is that the corrected precipitation products have lower uncertainties compared with their uncorrected ones, whose information was incorporated into the hydrological model. Furthermore, it can be found that the uncorrected products exhibited greater error propagation at the outlet of the catchment [72]. Moreover, the growing magnitude of floods diminished the effect of model error as the drainage area increased [73]. As a result, the bigger streamflow magnitudes generally tended to exhibit better hydrological model performance in the Beijiang River Basin (with its larger basin area). Additionally, the best performance of the selected eleven precipitation products for hydrological modeling was different over the Beijiang and Dongjiang River Basins.

3.3.2. Scenario II: Hydrological Model Calibrated by Different Precipitation Estimates

To further assess the utility of multi-source precipitation estimates on model simulations of streamflow, each of the CREST models was re-parameterized using the TMPA-3B42V7, TMPA-3B42RT, IMERG-cal, IMERG-uncal, ERA5, ERA-Interim, GSMaP, and Average Rain 1 and Rain 2 for the same calibration and validation periods as in Scenario I. As an alternative, the calibration approach can be employed specifically for ungauged catchments, where only remotely sensed precipitation estimates are free to the public [10,31]. Figure 9 and Figure 10 show comparisons of the daily model-simulated hydrographs using nine satellite- and reanalysis-based precipitation inputs versus the observed ones and their Q–Q plots for the Beijiang River Basin, respectively. Meanwhile, for the Dongjiang River Basin, the comparisons of the daily model-simulated hydrographs using nine selected precipitation inputs versus the observed ones and their Q–Q plots are shown in Figure 11 and Figure 12, respectively. Table 6 and Table 7 present a summary of the evaluation indicators; these re-calibrated and validated results in Scenario II, compared with those in Scenario I, have been relatively improved.
For the Beijiang River Basin (as shown in Figure 9b–j and Figure 10b–j), most of the daily flow peaks obtained from the product-specific recalibration for Scenario II could be well captured and fitted to their observed ones comparatively well, whereas the hydrological model tended to underestimate both the high and low flows equally. The statistical performance of discharge simulation displayed in Table 6 shows that there was a slight improvement of NSCE and CC values and an obvious reduction of RMSE values (except for ERA-Interim) during the validation period. ERA5 outperforms ERA-Interim and performs similar to TMPA-3B42RT. In terms of NSCE, CC, and RMSE, the ranking of the nine selected precipitation estimates was Average Rain 1, GSMaP, Average Rain 2, TMPA-3B42V7, IMERG-cal, ERA5, TMPA-3B42RT, IMERG-uncal, and ERA-Interim, which are the best suited to Scenario II. This means that these corrected precipitation products have better hydrological simulation utilities than the uncorrected ones using their corresponding re-calibrated model parameter sets.
For the Dongjiang River Basin (as shown in Figure 11b–j and Figure 12b–j), the recalibration specific to precipitation products in Scenario II showed reasonable agreement with gauged observations, and the efficiency of hydrologic simulation was also improved. On the basis of model category performances in Table 7, GSMaP, IMERG-cal, and Average Rain 1 showed similar improved performances, followed by Average Rain 2, TMPA-3B42V7, TMP-3B42RT, ERA5, and IMERG-uncal. However, ERA-Interim showed the worst performance (e.g., the values of NSCE, BIAS, and CC were 0.16, 9.93%, and 0.67 in the validation period, respectively). The findings show that the error magnitudes in streamflow simulations could be relatively big even for small basins [74], which are very sensitive to basin characteristics [43]. The main sources of uncertainties are inherent in multiple source precipitation estimates, including sampling, geography, climate, seasonal conditions, and algorithmic error; these contribute to the influence of streamflow estimations along with basin areas [61].
Above all, for both the Beijiang and Dongjiang River Basins, the results of comparing Scenarios I and II demonstrated that the hydrologic utility of all corrected precipitation datasets had been improved regardless of whether the CREST model was calibrated by CGDPA or re-calibrated using satellite and reanalysis precipitation inputs. By referring to performance indicators, after gauge (CGDPA), Average Rain 1, and GSMaP proved to be better than other precipitation estimates for simulating the streamflow at the daily scale during the calibration and validation periods from 2006 to 2018. Combined with the results in Section 3.1, Average Rain 2 was found to significantly improve the evaluation indicators of both precipitation and hydrologic simulations compared to TMPA-3B42RT, IMERG-uncal, and ERA5. In a way, reasonably merged precipitation products can help reduce the uncertainty of individual precipitation datasets and even improve hydrologic applications.

3.3.3. Scenario III: Comparison of Manually Controlled Ensemble Simulation for the Two River Basins

In Scenario III, we consider merging streamflow simulations obtained by individual satellite/reanalysis precipitation datasets as another alternative. In brief, Average Streamflow 01 and 1 are arithmetic means of three selected streamflow simulations driven by each single precipitation dataset (TMPA-3B42V7, IMERG-cal, and GSMaP) under Scenario I and Scenario II, respectively. Furthermore, Average Streamflow 02 and 2 are arithmetic means of three selected streamflow simulations driven by each single precipitation dataset (TMPA-3B42RT, IMERG-uncal, and ERA5) under Scenario I and Scenario II, respectively.
Table 8 provides the values of four indicators (NSCE, BIAS, CC, and RMSE) of the new direct average streamflow series over these two river basins, respectively. For the Beijiang River Basin, when compared with the hydrologic modeling performances in Table 4 and Table 6, all the NSCE and CC values of different Average Streamflow series were nearly the same as those of their corresponding Average Rain 1 or 2 products. Meanwhile, all the BIAS and RMSE values of different Average Streamflow series were reduced slightly under Scenario III. For the Dongjiang River Basin, when compared with the hydrologic modeling performances in Table 5 and Table 7, all the evaluation values (NSCE, BIAS, CC, and RMSE) for different Average Streamflow series were slightly better than those of their corresponding Average Rain products. In this section, it is suggested that merging streamflow simulations obtained by individual satellite/reanalysis precipitation datasets as well as merging precipitation datasets can represent a good alternative for hydrological applications across the study area.

3.4. Analysis of Merge Data at Five Flood Levels

To assess the performance of various merged data across different flood levels according to national flood-control standards, the daily flood stages were further divided into five levels based on probability of exceedance (i.e., I: 25%; II: 20%; III: 10%; IV: 5%; and V: 2%). Figure 13 and Figure 14 show the overall evaluation results (CC, BIAS, RMSE, and KGE′) for streamflow, based on the merged and original satellite/reanalysis-based precipitation products under Scenario II (including CGDPA under Scenario I) in the five flood levels, as measured against the observed discharges from 2006 to 2018 over the Beijiang and Dongjiang River Basins, respectively.
For the Beijiang River Basin, except for ERA-Interim, all the CC, BIAS, and KGE′ (MAE) showed descending (increasing) trend lines from Flood Level I to V (Figure 13a–d). After gauge (CGDPA) and GSMaP showed better performances than the others (e.g., CC, BIAS, MAE, and KGE′ values were 0.67–0.86, −4.67%–20.97%, 791.14–2083.07 m3/s, and 0.61–0.83, respectively), followed by Average Rain 1 and Average Streamflow 1 (e.g., KGE′ values ranged from 0.55 to 0.81 and from 0.50 to 0.78, respectively). However, with the KGE′ values of 0.29–0.51, ERA-Interim showed the worst performances of all and was not good for flood simulations. In terms of KGE′ values exceeding 0.59, the highest rankings of the twelve streamflow series from Flood Level I to IV were CGDPA, GSMaP, Average Rain 1, Average Streamflow 1, Average Rain 2, TMPA-3B42V7, IMERG-cal, and Average Streamflow 2 (Figure 11d). Additionally, ERA5 and 3B42RT showed similar performances from Flood Level I to V, based on three indicators (CC, MAE, and KGE′).
For the Dongjiang River Basin, Figure 14a–d shows that the performances of all twelve streamflow series were reduced from Flood Level I to V. For KGE′ values exceeding 0.57, the highest rankings of the twelve streamflow series from Flood Level I to IV were CGDPA, IMERG-cal, Average Rain 1, Average Rain 2, GSMaP, Average Streamflow 1, TMPA-3B42V7, and Average Streamflow 2. However, all the KGE′ values except CGDPA were less than 0.47 in Flood Level V over the Dongjiang River Basin (Figure 12d). Overall, it is noted that the performances of the two merged precipitation products were slightly better than those of the two merged streamflow series in the five flood levels for both the Beijiang and Dongjiang River Basins. Furthermore, Average Rain 1 (TMPA-3B42V7, IMERG-cal, and GSMaP) outperformed Average Rain 2 (TMPA-3B42RT, IMERG-uncal, and ERA5) for hydrologic applications in the whole study. These findings validate the feasibility of merging satellite/reanalysis precipitation estimates for better understanding of flood characteristics.
On the whole, the results suggested that directly merging modeled streamflow outputs was more effective than merging multi-source precipitation inputs in the Beijiang and Dongjiang River Basins, which demonstrates that the streamflow simulation generated by Scenario III was superior to those from both Scenario II and I.

4. Conclusions

In this study, the performances of nine uncorrected versus corrected satellite and reanalysis precipitation products, including TMPA-3B42V7, TMPA-3B42RT, IMERG-cal, IMERG-uncal, ERA5, ERA-Interim, GSMaP, GSMaP-RNL, and PERSIANN-CCS, were comprehensively evaluated at the daily scale from 2006 to 2018 over the Beijiang and Dongjiang River Basins. Further, we compared two merging methods to improve hydrological simulation: merging multi-source precipitation inputs and directly merging their corresponding streamflow outputs. The major findings are drawn as below:
In general, compared with the best performance of the GSMaP precipitation dataset, two merged precipitation products were more consistent with gauge observations than their original members, while the worst performance was found for PERSIANN-CCS and GSMaP-RNL. All the corrected precipitation products showed an increased ability to capture spatial precipitation patterns and trends compared to their uncorrected counterparts, particularly in the Beijiang River, which has a larger drainage area. In addition, TMPA-3B42RT and ERA5 showed similar performances across the study basins during the whole period.
For Scenarios I and II, the performance of streamflow simulations derived from the merged uncorrected precipitation data (Average Rain 2) were better than their original members, but the merged corrected ones (Average Rain 1) failed to improve streamflow simulations. This indicates that merging IMERG-cal and GSMaP precipitation makes little difference to hydrological modeling. For Scenario III, all the BIAS values of different merged streamflow simulations were slightly reduced compared to those of their merged precipitation products over the study basins, which indicates that streamflow simulations under Scenario III achieve better results than those of Scenarios II and I.
According to different flood categories, for each river basin, the performances of almost all streamflow series deteriorated from Flood Level I to V. The rankings of two merged precipitation products were similar to those of their corresponding merged streamflow simulation. In conclusion, the results suggest that merging multi-source modeled streamflow outputs was more efficient than merging multi-source precipitation inputs.
The findings presented in this study will provide valuable information for improving the hydrological simulation of global precipitation products. However, it is essential to note that the quality of merged gridded precipitation datasets is greatly affected by merging approaches and various errors propagated from each individual component. Furthermore, it is also necessary to clarify the potential effects of hydrological model structure and associated model parameters and basin characteristics in future work. Finally, due to the limitations of the available discharge data, further efforts should be made to use different approaches to expand applicability in more regions, to facilitate comparison.

Author Contributions

Conceptualization, Z.G., G.T. and W.J.; methodology, Z.G. and G.T.; analysis, Z.G.; writing—original draft preparation, Z.G.; writing—review and editing, Z.G., G.T., W.J., Z.H., J.Y. and J.S.; funding acquisition, Z.G. and W.J. All authors have read and agreed to the published version of the manuscript.

Funding

This research was jointly funded by the National Key R&D Program of China (2022YFF0711602), the National Natural Science Foundation of China (42271479), the Science and Technology Program of Guangzhou (2023A04J1993), the GDAS’ Project of Science and Technology Development (2024GDASZH-2024010101, 2022GDASZH-2022010202, 2022GDASZH-2022020402-01), and the Science and Technology Program of Guangdong (2021B1212100006). We appreciate the extensive efforts from the developers of the ground, satellite, and reanalysis precipitation datasets to make their products available.

Data Availability Statement

The multiple-source satellite and reanalysis precipitation datasets used in this study were downloaded from respective websites, which are publicly available. The ground-based precipitation and discharge data were obtained from the China Meteorological Administration and the Guangdong Provincial Hydrographic Bureau, respectively, which are not publicly available.

Conflicts of Interest

The authors declare no conflict of interest.

Appendix A

As shown in Figure A1, the scalability of CREST simulations is accomplished through sub-grid-scale representations of soil moisture storage capacity (using a variable infiltration curve) and multi-scale runoff generation processes (using multi-linear reservoirs). The representation of primary water fluxes such as infiltration and routing are physically related to the spatially variable land surface characteristics (i.e., vegetation, soil type, and topography, etc.). The runoff generation component and routing scheme are coupled, thereby providing realistic interactions between the lower atmospheric boundary layers, terrestrial surface, and subsurface water.
Figure A1. Core components of the CREST model (CREST User Manual v2.1.0): (a) Vertical profile of a cell including rainfall-runoff generation, evapotranspiration, sub-grid cell routing and feedbacks from routing; (b) variable infiltration curve of a cell; (c) plane view of cells and flow directions; and (d) vertical profile along several cells including sub-grid cell routing, downstream routing, and subsurface runoff redistribution from a cell to its downstream cells.
Remotesensing 15 05349 g0a1

References

  1. Rentschler, J.; Salhab, M.; Jafino, B.A. Flood exposure and poverty in 188 countries. Nat. Commun. 2022, 13, 3527. [Google Scholar] [CrossRef]
  2. Swain, D.L.; Wing, O.E.J.; Bates, P.D.; Done, J.M.; Johnson, K.A.; Cameron, D.R. Increased Flood Exposure Due to Climate Change and Population Growth in the United States. Earth’s Future 2020, 8, e2020EF001778. [Google Scholar] [CrossRef]
  3. Fang, J.; Wahl, T.; Fang, J.; Sun, X.; Kong, F.; Liu, M. Compound flood potential from storm surge and heavy precipitation in coastal China: Dependence, drivers, and impacts. Hydrol. Earth Syst. Sci. 2021, 25, 4403–4416. [Google Scholar] [CrossRef]
  4. Huang, Z.; Wu, H.; Adler, R.F.; Schumann, G.; Gourley, J.J.; Kettner, A.; Nanding, N. Multisourced Flood Inventories over the Contiguous United States for Actual and Natural Conditions. Bull. Am. Meteorol. Soc. 2021, 102, E1133–E1149. [Google Scholar] [CrossRef]
  5. Gao, Z.; Huang, B.; Ma, Z.; Chen, X.; Qiu, J.; Liu, D. Comprehensive Comparisons of State-Of-The-Art Gridded Precipitation Estimates for Hydrological Applications over Southern China. Remote Sens. 2020, 12, 3997. [Google Scholar] [CrossRef]
  6. Li, R.; Li, D.; Nanding, N.; Wang, X.; Fan, X.; Chen, Y.; Tian, F.; Tett, S.F.B.; Dong, B.; Lott, F.C. Anthropogenic Influences on Heavy Precipitation during the 2019 Extremely Wet Rainy Season in Southern China. Bull. Am. Meteorol. Soc. 2021, 102, S103–S109. [Google Scholar] [CrossRef]
  7. Tang, G.; Clark, M.P.; Papalexiou, S.M.; Ma, Z.; Hong, Y. Have satellite precipitation products improved over last two decades? A comprehensive comparison of GPM IMERG with nine satellite and reanalysis datasets. Remote Sens. Environ. 2020, 240, 111697. [Google Scholar] [CrossRef]
  8. Kidd, C.; Huffman, G.; Maggioni, V.; Chambon, P.; Oki, R. The Global Satellite Precipitation Constellation: Current Status and Future Requirements. Bull. Am. Meteorol. Soc. 2021, 102, E1844–E1861. [Google Scholar] [CrossRef]
  9. Khan, S.I.; Hong, Y.; Wang, J.; Yilmaz, K.K.; Gourley, J.J.; Adler, R.F.; Brakenridge, G.R.; Policelli, F.; Habib, S.; Irwin, D. Satellite remote sensing and hydrologic modeling for flood inundation mapping in Lake Victoria basin: Implications for hydrologic prediction in ungauged basins. IEEE Trans. Geosci. Remote Sens. 2010, 49, 85–95. [Google Scholar] [CrossRef]
  10. Xue, X.; Hong, Y.; Limaye, A.S.; Gourley, J.J.; Huffman, G.J.; Khan, S.I.; Dorji, C.; Chen, S. Statistical and hydrological evaluation of TRMM-based Multi-satellite Precipitation Analysis over the Wangchu Basin of Bhutan: Are the latest satellite precipitation products 3B42V7 ready for use in ungauged basins? J. Hydrol. 2013, 499, 91–99. [Google Scholar] [CrossRef]
  11. Khatakho, R.; Talchabhadel, R.; Thapa, B.R. Evaluation of different precipitation inputs on streamflow simulation in Himalayan River basin. J. Hydrol. 2021, 599, 126390. [Google Scholar] [CrossRef]
  12. Usman, M.; Ndehedehe, C.E.; Farah, H.; Ahmad, B.; Wong, Y.; Adeyeri, O.E. Application of a Conceptual Hydrological Model for Streamflow Prediction Using Multi-Source Precipitation Products in a Semi-Arid River Basin. Water 2022, 14, 1260. [Google Scholar] [CrossRef]
  13. Hou, A.Y.; Kakar, R.K.; Neeck, S.; Azarbarzin, A.A.; Kummerow, C.D.; Kojima, M.; Oki, R.; Nakamura, K.; Iguchi, T. The global precipitation measurement mission. Bull. Am. Meteorol. Soc. 2014, 95, 701–722. [Google Scholar] [CrossRef]
  14. Yin, J.; Guo, S.; Gu, L.; Zeng, Z.; Liu, D.; Chen, J.; Shen, Y.; Xu, C.-Y. Blending multi-satellite, atmospheric reanalysis and gauge precipitation products to facilitate hydrological modelling. J. Hydrol. 2021, 593, 125878. [Google Scholar] [CrossRef]
  15. Pradhan, R.K.; Markonis, Y.; Godoy, M.R.V.; Villalba-Pradas, A.; Andreadis, K.M.; Nikolopoulos, E.I.; Papalexiou, S.M.; Rahim, A.; Tapiador, F.J.; Hanel, M. Review of GPM IMERG performance: A global perspective. Remote Sens. Environ. 2022, 268, 112754. [Google Scholar] [CrossRef]
  16. Hong, Y.; Gochis, D.; Cheng, J.-T.; Hsu, K.-L.; Sorooshian, S. Evaluation of PERSIANN-CCS Rainfall Measurement Using the NAME Event Rain Gauge Network. J. Hydrometeorol. 2007, 8, 469–482. [Google Scholar] [CrossRef]
  17. Kubota, T.; Shige, S.; Hashizume, H.; Aonashi, K.; Takahashi, N.; Seto, S.; Hirose, M.; Takayabu, Y.N.; Ushio, T.; Nakagawa, K.; et al. Global Precipitation Map Using Satellite-Borne Microwave Radiometers by the GSMaP Project: Production and Validation. IEEE Trans. Geosci. Remote Sens. 2007, 45, 2259–2275. [Google Scholar] [CrossRef]
  18. Huffman, G.J.; Bolvin, D.T.; Nelkin, E.J.; Wolff, D.B.; Adler, R.F.; Gu, G.; Hong, Y.; Bowman, K.P.; Stocker, E.F. The TRMM Multisatellite Precipitation Analysis (TMPA): Quasi-Global, Multiyear, Combined-Sensor Precipitation Estimates at Fine Scales. J. Hydrometeorol. 2007, 8, 38–55. [Google Scholar] [CrossRef]
  19. Huffman, G.J.; Bolvin, D.T.; Braithwaite, D.; Hsu, K.; Joyce, R.; Xie, P.; Yoo, S.H. NASA global precipitation measurement (GPM) integrated multi-satellite retrievals for GPM (IMERG). Algorithm Theor. Basis Doc. (ATBD) Version 2015, 4, 30. [Google Scholar]
  20. Hersbach, H.; Bell, B.; Berrisford, P.; Hirahara, S.; Horányi, A.; Muñoz-Sabater, J.; Thépaut, J.N. The ERA5 global reanalysis. Q. J. R. Meteorol.Soc. 2020, 146, 1999–2049. [Google Scholar] [CrossRef]
  21. Nguyen, P.; Ombadi, M.; Sorooshian, S.; Hsu, K.; AghaKouchak, A.; Braithwaite, D.; Ashouri, H.; Thorstensen, A.R. The PERSIANN family of global satellite precipitation data: A review and evaluation of products. Hydrol. Earth Syst. Sci. 2018, 22, 5801–5816. [Google Scholar] [CrossRef]
  22. Sun, Q.; Miao, C.; Duan, Q.; Ashouri, H.; Sorooshian, S.; Hsu, K.-L. A review of global precipitation data sets: Data sources, estimation, and intercomparisons. Rev. Geophys. 2018, 56, 79–107. [Google Scholar] [CrossRef]
  23. Ehsan Bhuiyan, M.A.; Nikolopoulos, E.I.; Anagnostou, E.N. Machine Learning—Based Blending of Satellite and Reanalysis Precipitation Datasets: A Multiregional Tropical Complex Terrain Evaluation. J. Hydrometeorol. 2019, 20, 2147–2161. [Google Scholar] [CrossRef]
  24. Satgé, F.; Defrance, D.; Sultan, B.; Bonnet, M.-P.; Seyler, F.; Rouché, N.; Pierron, F.; Paturel, J.-E. Evaluation of 23 gridded precipitation datasets across West Africa. J. Hydrol. 2020, 581, 124412. [Google Scholar] [CrossRef]
  25. Li, W.; Jiang, Q.; He, X.; Sun, H.; Sun, W.; Scaioni, M.; Chen, S.; Li, X.; Gao, J.; Hong, Y. Effective multi-satellite precipitation fusion procedure conditioned by gauge background fields over the Chinese mainland. J. Hydrol. 2022, 610, 127783. [Google Scholar] [CrossRef]
  26. Zhang, L.; Chen, X.; Lai, R.; Zhu, Z. Performance of satellite-based and reanalysis precipitation products under multi-temporal scales and extreme weather in mainland China. J. Hydrol. 2022, 605, 127389. [Google Scholar] [CrossRef]
  27. Maneechot, L.; Wong, Y.J.; Try, S.; Shimizu, Y.; Bharambe, K.P.; Hanittinan, P.; Ram-Indra, T.; Usman, M. Evaluating the necessity of post-processing techniques on d4PDF data for extreme climate assessment. Environ. Sci. Pollut. Res. 2023, 30, 102531–102546. [Google Scholar] [CrossRef]
  28. Maggioni, V.; Massari, C.; Kidd, C. Errors and Uncertainties Associated with Quasiglobal Satellite Precipitation Products; Precipitation Science; Elsevier: Amsterdam, The Netherlands, 2022; pp. 377–390. [Google Scholar]
  29. Jiang, Q.; Li, W.; Fan, Z.; He, X.; Sun, W.; Chen, S.; Wen, J.; Gao, J.; Wang, J. Evaluation of the ERA5 reanalysis precipitation dataset over Chinese Mainland. J. Hydrol. 2021, 595, 125660. [Google Scholar] [CrossRef]
  30. Yong, B.; Ren, L.-L.; Hong, Y.; Wang, J.-H.; Gourley, J.J.; Jiang, S.-H.; Chen, X.; Wang, W. Hydrologic evaluation of Multisatellite Precipitation Analysis standard precipitation products in basins beyond its inclined latitude band: A case study in Laohahe basin, China. Water Resour. Res. 2010, 46, 759–768. [Google Scholar] [CrossRef]
  31. Tang, G.; Zeng, Z.; Long, D.; Guo, X.; Yong, B.; Zhang, W.; Hong, Y. Statistical and Hydrological Comparisons between TRMM and GPM Level-3 Products over a Midlatitude Basin: Is Day-1 IMERG a Good Successor for TMPA 3B42V7? J. Hydrometeorol. 2016, 17, 121–137. [Google Scholar] [CrossRef]
  32. Beck, H.E.; Vergopolan, N.; Pan, M.; Levizzani, V.; Van Dijk, A.I.; Weedon, G.P.; Brocca, L.; Pappenberger, F.; Huffman, G.J.; Wood, E.F. Global-scale evaluation of 22 precipitation datasets using gauge observations and hydrological modeling. Hydrol. Earth Syst.Sci. 2017, 21, 6201–6217. [Google Scholar] [CrossRef]
  33. Maggioni, V.; Massari, C. On the performance of satellite precipitation products in riverine flood modeling: A review. J. Hydrol. 2018, 558, 214–224. [Google Scholar] [CrossRef]
  34. Hinge, G.; Hamouda, M.A.; Long, D.; Mohamed, M.M. Hydrologic utility of satellite precipitation products in flood prediction: A meta-data analysis and lessons learnt. J. Hydrol. 2022, 612, 128103. [Google Scholar] [CrossRef]
  35. Wu, X.; Su, J.; Ren, W.; Lü, H.; Yuan, F. Statistical comparison and hydrological utility evaluation of ERA5-Land and IMERG precipitation products on the Tibetan Plateau. J. Hydrol. 2023, 620, 129384. [Google Scholar] [CrossRef]
  36. Falck, A.S.; Maggioni, V.; Tomasella, J.; Vila, D.A.; Diniz, F.L. Propagation of satellite precipitation uncertainties through a distributed hydrologic model: A case study in the Tocantins–Araguaia basin in Brazil. J. Hydrol. 2015, 527, 943–957. [Google Scholar] [CrossRef]
  37. Nanding, N.; Wu, H.; Tao, J.; Maggioni, V.; Beck, H.E.; Zhou, N.; Huang, M.; Huang, Z. Assessment of Precipitation Error Propagation in Discharge Simulations over the Contiguous United States. J. Hydrometeorol. 2021, 22, 1987–2008. [Google Scholar] [CrossRef]
  38. Zhang, Y.; Ye, A.; Nguyen, P.; Analui, B.; Sorooshian, S.; Hsu, K. Error Characteristics and Scale Dependence of Current Satellite Precipitation Estimates Products in Hydrological Modeling. Remote Sens. 2021, 13, 3061. [Google Scholar] [CrossRef]
  39. Hartke, S.H.; Wright, D.B.; Quintero, F.; Falck, A.S. Incorporating IMERG satellite precipitation uncertainty into seasonal and peak streamflow predictions using the Hillslope Link hydrological model. J. Hydrol. X 2023, 18, 100148. [Google Scholar] [CrossRef]
  40. Essou, G.R.; Arsenault, R.; Brissette, F.P. Comparison of climate datasets for lumped hydrological modeling over the continental United States. J. Hydrol. 2016, 537, 334–345. [Google Scholar] [CrossRef]
  41. Wanzala, M.A.; Ficchi, A.; Cloke, H.L.; Stephens, E.M.; Badjana, H.M.; Lavers, D.A. Assessment of global reanalysis precipitation for hydrological modelling in data-scarce regions: A case study of Kenya. J. Hydrol. Reg. Stud. 2022, 41, 101105. [Google Scholar] [CrossRef]
  42. Gu, L.; Yin, J.; Wang, S.; Chen, J.; Qin, H.; Yan, X.; He, S.; Zhao, T. How well do the multi-satellite and atmospheric reanalysis products perform in hydrological modelling. J. Hydrol. 2023, 617, 128920. [Google Scholar] [CrossRef]
  43. Mazzoleni, M.; Brandimarte, L.; Amaranto, A. Evaluating precipitation datasets for large-scale distributed hydrological modelling. J. Hydrol. 2019, 578, 124076. [Google Scholar] [CrossRef]
  44. Brunner, M.I.; Sikorska-Senoner, A.E. Dependence of flood peaks and volumes in modeled discharge time series: Effect of different uncertainty sources. J. Hydrol. 2019, 572, 620–629. [Google Scholar] [CrossRef]
  45. Brunner, M.I.; Melsen, L.A.; Wood, A.W.; Rakovec, O.; Mizukami, N.; Knoben, W.J.M.; Clark, M.P. Flood spatial coherence, triggers, and performance in hydrological simulations: Large-sample evaluation of four streamflow-calibrated models. Hydrol. Earth Syst. Sci. 2021, 25, 105–119. [Google Scholar] [CrossRef]
  46. Su, J.; Li, X.; Ren, W.; Lü, H.; Zheng, D. How reliable are the satellite-based precipitation estimations in guiding hydrological modelling in South China? J. Hydrol. 2021, 602, 126705. [Google Scholar] [CrossRef]
  47. Jiao, D.; Xu, N.; Yang, F.; Xu, K. Evaluation of spatial-temporal variation performance of ERA5 precipitation data in China. Sci. Rep. 2021, 11, 17956. [Google Scholar] [CrossRef] [PubMed]
  48. Zhu, Q.; Gao, X.; Xu, Y.-P.; Tian, Y. Merging multi-source precipitation products or merging their simulated hydrological flows to improve streamflow simulation. Hydrol. Sci. J. 2019, 64, 910–920. [Google Scholar] [CrossRef]
  49. Rahman, K.U.; Shang, S.; Shahid, M.; Wen, Y. Hydrological evaluation of merged satellite precipitation datasets for streamflow simulation using SWAT: A case study of Potohar Plateau, Pakistan. J. Hydrol. 2020, 587, 125040. [Google Scholar] [CrossRef]
  50. Zhang, L.; Ren, D.; Nan, Z.; Wang, W.; Zhao, Y.; Zhao, Y.; Ma, Q.; Wu, X. Interpolated or satellite-based precipitation? Implications for hydrological modeling in a meso-scale mountainous watershed on the Qinghai-Tibet Plateau. J. Hydrol. 2020, 583, 124629. [Google Scholar] [CrossRef]
  51. Mtibaa, S.; Asano, S. Hydrological evaluation of radar and satellite gauge-merged precipitation datasets using the SWAT model: Case of the Terauchi catchment in Japan. J. Hydrol. Reg. Stud. 2022, 42, 101134. [Google Scholar] [CrossRef]
  52. Alexander, L.V.; Bador, M.; Roca, R.; Contractor, S.; Donat, M.G.; Nguyen, P.L. Intercomparison of annual precipitation indices and extremes over global land areas from in situ, space-based and reanalysis products. Environ. Res. Lett. 2020, 15, 055002. [Google Scholar] [CrossRef]
  53. Shen, Y.; Xiong, A. Validation and comparison of a new gauge-based precipitation analysis over mainland China. Int. J. Climatol. 2016, 36, 252–265. [Google Scholar] [CrossRef]
  54. Tang, G.; Ma, Y.; Long, D.; Zhong, L.; Hong, Y. Evaluation of GPM Day-1 IMERG and TMPA Version-7 legacy products over Mainland China at multiple spatiotemporal scales. J. Hydrol. 2016, 533, 152–167. [Google Scholar] [CrossRef]
  55. Mega, T.; Ushio, T.; Kubota, T.; Kachi, M.; Aonashi, K.; Shige, S. Gauge adjusted global satellite mapping of precipitation (GSMaP_Gauge). In Proceedings of the 2014 XXXIth URSI General Assembly and Scientific Symposium (URSI GASS), Beijing, China, 16–23 August 2014; pp. 1–4. [Google Scholar]
  56. Copernicus Climate Change Service (C3S). ERA5: Fifth generation of ECMWF atmospheric reanalyses of the global climate. Copernic. Clim. Change Serv. Clim. Data Store (CDS) 2017, 15, 2020. [Google Scholar]
  57. Dee, D.P.; Uppala, S.M.; Simmons, A.J.; Berrisford, P.; Poli, P.; Kobayashi, S.; Andrae, U.; Balmaseda, M.A.; Balsamo, G.; Bauer, P.; et al. The ERA-Interim reanalysis: Configuration and performance of the data assimilation system. Q. J. R. Meteorol. Soc. 2011, 137, 553–597. [Google Scholar] [CrossRef]
  58. Wang, J.; Hong, Y.; Li, L.; Gourley, J.J.; Khan, S.I.; Yilmaz, K.K.; Adler, R.F.; Policelli, F.S.; Habib, S.; Irwn, D.; et al. The coupled routing and excess storage (CREST) distributed hydrological model. Hydrol. Sci. J. 2011, 56, 84–98. [Google Scholar] [CrossRef]
  59. Hardy, J.; Gourley, J.J.; Kirstetter, P.-E.; Hong, Y.; Kong, F.; Flamig, Z.L. A method for probabilistic flash flood forecasting. J. Hydrol. 2016, 541, 480–494. [Google Scholar] [CrossRef]
  60. Clark, R.A.; Flamig, Z.L.; Vergara, H.; Hong, Y.; Gourley, J.J.; Mandl, D.J.; Frye, S.; Handy, M.; Patterson, M.; Iii, R.A.C. Hydrological Modeling and Capacity Building in the Republic of Namibia. Bull. Am. Meteorol. Soc. 2017, 98, 1697–1715. [Google Scholar] [CrossRef]
  61. Gao, Z.; Long, D.; Tang, G.; Zeng, C.; Huang, J.; Hong, Y. Assessing the potential of satellite-based precipitation estimates for flood frequency analysis in ungauged or poorly gauged tributaries of China’s Yangtze River basin. J. Hydrol. 2017, 550, 478–496. [Google Scholar] [CrossRef]
  62. Dis, M.O.; Anagnostou, E.; Mei, Y. Using high-resolution satellite precipitation for flood frequency analysis: Case study over the Connecticut River Basin. J. Flood Risk Manag. 2018, 11, S514–S526. [Google Scholar] [CrossRef]
  63. Gao, S.; Chen, M.; Li, Z.; Cook, S.; Allen, D.; Neeson, T.; Yang, T.; Yami, T.; Hong, Y. Mapping dynamic non-perennial stream networks using high-resolution distributed hydrologic simulation: A case study in the upper blue river basin. J. Hydrol. 2021, 600, 126522. [Google Scholar] [CrossRef]
  64. Shen, X.; Hong, Y.; Zhang, K.; Hao, Z. Refining a Distributed Linear Reservoir Routing Method to Improve Performance of the CREST Model. J. Hydrol. Eng. 2017, 22, 04016061. [Google Scholar] [CrossRef]
  65. Duan, Q.; Sorooshian, S.; Gupta, V. Effective and efficient global optimization for conceptual rainfall-runoff models. Water Resour. Res. 1992, 28, 1015–1031. [Google Scholar] [CrossRef]
  66. Ebert, E.E.; Janowiak, J.E.; Kidd, C. Comparison of Near-Real-Time Precipitation Estimates from Satellite Observations. Bull. Am. Meteorol. Soc. 2007, 88, 47–64. [Google Scholar] [CrossRef]
  67. Lawal, I.M.; Bertram, D.; White, C.J.; Jagaba, A.H.; Hassan, I.; Shuaibu, A. Multi-Criteria Performance Evaluation of Gridded Precipitation and Temperature Products in Data-Sparse Regions. Atmosphere 2021, 12, 1597. [Google Scholar] [CrossRef]
  68. Lee, C.A.; Huang, W.R. Advantages of GSMaP Data for Multi-Timescale Precipitation Estimation in Luzon. Earth Space Sci. 2023, 10, e2023EA002980. [Google Scholar] [CrossRef]
  69. Pan, X.; Wu, H.; Chen, S.; Nanding, N.; Huang, Z.; Chen, W.; Li, C.; Li, X. Evaluation and Applicability Analysis of GPM Satellite Precipitation over Mainland China. Remote Sens. 2023, 15, 2866. [Google Scholar] [CrossRef]
  70. Xu, L. Two-Layer Variable Infiltration Capacity Land Surface Representation for General Circulation Models; University of Washington: Seattle, WA, USA, 1994. [Google Scholar]
  71. Gebregiorgis, A.S.; Hossain, F. Estimation of Satellite Rainfall Error Variance Using Readily Available Geophysical Features. IEEE Trans. Geosci. Remote Sens. 2013, 52, 288–304. [Google Scholar] [CrossRef]
  72. Mei, Y.; Anagnostou, E.N.; Shen, X.; Nikolopoulos, E.I. Decomposing the satellite precipitation error propagation through the rainfall-runoff processes. Adv. Water Resour. 2017, 109, 253–266. [Google Scholar] [CrossRef]
  73. Vergara, H.; Hong, Y.; Gourley, J.J.; Anagnostou, E.N.; Maggioni, V.; Stampoulis, D.; Kirstetter, P.-E. Effects of Resolution of Satellite-Based Rainfall Estimates on Hydrologic Modeling Skill at Different Scales. J. Hydrometeorol. 2014, 15, 593–613. [Google Scholar] [CrossRef]
  74. Nijssen, B.; Lettenmaier, D.P. Effect of precipitation sampling error on simulated hydrological fluxes and states: Anticipating the Global Precipitation Measurement satellites. J. Geophys. Res. Atmos. 2004, 109. [Google Scholar] [CrossRef]
Figure 1. Maps of the DEM, river network, rain gauge distributions, and streamflow stations over the Beijiang and Dongjiang River Basins.
Remotesensing 15 05349 g001
Figure 2. Flowchart of Scenarios I–III used in this study. See Table 3 for definitions of other scenarios.
Remotesensing 15 05349 g002
Figure 3. Characteristics of observed daily discharge during 2006–2018: (a) annual mean discharge and (b) flow duration curve. The dashed lines in Figure a represent the regression lines.
Remotesensing 15 05349 g003
Figure 4. Scatterplots and associated statistics of (a) 3B42V7, (b) 3B42RT, (c) IMERG-cal, (d) IMERG-uncal, (e) ERA5, (f) ERA-Interim, (g) GSMaP, (h) GSMaP-RNL, (i) PERSIANN-CCS, (j) average Rain 1, and (k) average Rain 2 derived from the basin-average precipitation for the training (calibration, blue dots) and testing (validation, red dots) periods over the Beijiang River Basin.
Remotesensing 15 05349 g004
Figure 5. Scatterplots and associated statistics of (a) 3B42V7, (b) 3B42RT, (c) IMERG-cal, (d) IMERG-uncal, (e) ERA5, (f) ERA-Interim, (g) GSMaP, (h) GSMaP-RNL, (i) PERSIANN-CCS, (j) average Rain 1, and (k) average Rain 2 derived from the basin-average precipitation for the training (calibration, blue dots) and testing (validation, red dots) periods over the Dongjiang River Basin.
Remotesensing 15 05349 g005
Figure 6. Comparison of sample proportions at different precipitation intensities for CGDPA and 11 precipitation products over the (a) Beijiang River and (b) Dongjiang River Basins.
Remotesensing 15 05349 g006
Figure 7. Spatial patterns of KGE′ values for multi-source precipitation datasets against CGDPA at a daily scale from 2006 to 2018 and 0.25° × 0.25° resolution for the two basins.
Remotesensing 15 05349 g007
Figure 8. Taylor diagrams of (a) calibration over the Beijiang River, (b) validation over the Beijiang River, (c) calibration over the Dongjiang River, and (d) validation over the Dongjiang River (i.e., the centered root-mean-square difference, correlation coefficient, and standard deviation) for the performance of multi-source precipitation products against CGDPA.
Remotesensing 15 05349 g008
Figure 9. Comparison of (a) modeled streamflow driven by CGDPA-calibrated parameters under Scenario I; (bj) modeled streamflow with satellite, reanalysis, and two merged precipitation-recalibrated parameters under Scenario II; and (k,l) two merged streamflow series under Scenario III from 2006 to 2018 in the Beijiang River Basin.
Remotesensing 15 05349 g009
Figure 10. Q–Q plots for (a) modeled streamflow driven by CGDPA-calibrated parameters under Scenario I; (bj) CREST-simulated streamflow with satellite, reanalysis, and two merged precipitation-recalibrated parameters under Scenario II; and (k,l) two merged streamflow series under Scenario III from 2006 to 2018 in the Beijiang River Basin.
Remotesensing 15 05349 g010
Figure 11. Comparison of (a) modeled streamflow driven by CGDPA-calibrated parameters under Scenario I; (bj) modeled streamflow with satellite, reanalysis, and two merged precipitation-recalibrated parameters under Scenario II; and (k,l) two merged streamflow series under Scenario III from 2006 to 2018 in the Dongjiang River Basin.
Remotesensing 15 05349 g011
Figure 12. Q–Q plots for (a) modeled streamflow driven by CGDPA-calibrated parameters under Scenario I; (bj) CREST-simulated streamflow with satellite, reanalysis, and two merged precipitation-recalibrated parameters under Scenario II; and (k,l) two merged streamflow series under Scenario III from 2006 to 2018 in the Dongjiang River Basin.
Remotesensing 15 05349 g012
Figure 13. Statistical metrics of (a) CC, (b) BIAS, (c) MAE, and (d) KGE’ of the daily CREST-simulated and two merged streamflow series versus the observations for five flood categories during 2006–2018 in the Beijiang River Basin.
Remotesensing 15 05349 g013
Figure 14. Statistical metrics of (a) CC, (b) BIAS, (c) MAE, and (d) KGE’ of the daily CREST-simulated and two merged streamflow series versus the observations for five flood categories during 2006–2018 in the Dongjiang River Basin.
Remotesensing 15 05349 g014
Table 1. Description of multiple satellite- and reanalysis-based precipitation products utilized in this research.
DatasetFull Name of the DatasetResolutionPeriodReference
Satellite precipitation dataset
IMERG-calIntegrated Multi-satellitE Retrievals for GPM Final run V06B0.1°/0.5 h2006–present[19]
IMERG-uncalIntegrated Multi-satellitE Retrievals for GPM Final run0.1°/0.5 h2006–present
TMPA-3B42V7TRMM (TMPA) Multi-satellite Precipitation Analysis 3B42V70.25°/3 h1998–present[18]
TMPA-3B42RTTRMM (TMPA) Near Real-Time Precipitation 3B42RT0.25°/3 h2000–present
PERSIANN-CCSPrecipitation Estimation from Remotely Sensed Information using Artificial Neural Networks-Cloud Classification System0.04°/0.5 h2000–present[16]
GSMaPGauge-adjusted Global Satellite Mapping of Precipitation V6/V70.1°/1 h2000–present[55]
GSMaP-RNLGlobal Satellite Mapping of Precipitation Project0.1°/1 h2000–present[17]
Reanalysis precipitation dataset
ERA5Fifth generation of ECMWF atmospheric reanalyses of the global climate~0.25°/1 h1979–present[56]
ERA-InterimECMWF ReAnalysis Interim~0.75°/3 h1979–present[57]
Merged precipitation product
Average Rain 1The arithmetic mean of 3B42V7, IMERG-cal, and GSMaP0.083°/1 d2006–2018
Average Rain 2The arithmetic mean of 3B42RT, IMERG-uncal, and ERA50.083°/1 d2006–2018
Table 2. Summary of the statistical and hydrological metrics used for comparison and evaluation *.
Statistical IndicatorsUnitEquationPerfect Value
Correlation coefficient (CC)NA C C = 1 N i = 1 N P i P ¯ O i O ¯ i = 1 N P i P ¯ 2   i = 1 N O i O ¯ 2 1
Relative bias (BIAS)% B I A S = i = 1 N P i O i i = 1 N O i × 100 % 0
Mean absolute error (MAE)mm/d M A E = 1 N i = 1 N P i O i 0
Root mean squared error (RMSE)mm/d R M S E = 1 N i = 1 N ( P i O i ) 2 0
Probability of detection (POD)NA P O D = H H + M 1
False alarm ratio (FAR)NA F A R = F H + F 0
Critical success index (CSI)NA C S I = H H + M + F = 1 1 / 1 F A R + 1 / P O D 1 1
Kling–Gupta efficiency (KGE′)
NA
K G E = 1 ( C C 1 ) 2 + ( β 1 ) 2 + ( r 1 ) 2 1
β = μ P μ O ,       r = σ P / μ P σ O / μ O
Nash–Sutcliffe coefficient efficiency (NSCE)NA N S C E = 1 i = 1 N ( O i P i ) 2 i = 1 N ( O i O ¯ ) 2 1
* Notes: N, the number of samplings; Pi, “test” field (P) that represents remote-sensing precipitation product or model-simulated streamflow; Oi, reference field (O) that represents ground-observed rainfall or discharge; H, the number of hit events for observed rain correctly detected; M, the number of missed events for observed rain not detected; F, the number of false events for rain detected but not observed; β, the bias ratio; r, the variability ratio; μ, the mean value; σ, the standard deviation.
Table 3. Precipitation data and simulation parameters for each period for Scenarios I–II *.
ScenarioPeriodTimePrecipitationParameters
ICalibration2006–2010Gauge-observedPara1
Validation2011–2018Gauge-observedPara1
7 Satellite
2 Reanalysis
2 Merged
IICalibration2006–2010TMPA-3B42V7Para2
TMPA-3B42RTPara3
IMERG-calPara4
IMERG-uncalPara5
GSMaPPara6
ERA5Para7
ERA-InterimPara8
Average Rain 1Para9
Average Rain 2Para10
Validation2011–2018TMPA-3B42V7Para2
TMPA-3B42RTPara3
IMERG-calPara4
IMERG-uncalPara5
GSMaPPara6
ERA5Para7
ERA-InterimPara8
Average Rain 1Para9
Average Rain 2Para10
* Notes: Para1 denotes the parameter sets calibrated using data from CGDPA from 2006 to 2010. Para2 to Para9 are calibrated from 2011 to 2018 using data from TMPA-3B42V7, TMPA-3B42RT, IMERG-cal, IMERG-uncal, GSMaP, ERA5, ERA-Interim, and two merged precipitation products, respectively.
Table 5. Statistics of daily simulated streamflow during the calibration (1 April 2006–31 December 2010) and validation (1 January 2011–31 December 2018) periods under Scenario I for the Dongjiang River Basin.
PeriodPrecipitation InputNSCEBIAS (%)CCRMSE (m3/s)
CalibrationCGDPA0.87−2.990.93305.77
ValidationCGDPA0.62−9.760.81379.28
3B42V70.65−8.460.83366.67
3B42RT0.5212.490.81427.78
IMERG-cal0.69−5.530.86340.65
IMERG-uncal0.59−19.450.81392.91
ERA50.52−29.330.80427.95
ERA-Interim0.09−47.810.64588.57
GSMaP0.60−30.310.85393.08
GSMaP-RNL0.38−40.290.78483.95
PERSIANN-CCS−0.66−82.090.59793.82
Average Rain 10.69−18.460.86342.38
Average Rain 20.68−18.760.86347.07
Table 6. Statistics of daily simulated streamflow during the calibration (1 April 2006–31 December 2010) and validation (1 January 2011–31 December 2018) periods under Scenario II for the Beijiang River Basin.
PeriodPrecipitation InputNSCEBIAS (%)CCRMSE (m3/s)
Calibration3B42V70.84−9.590.92637.68
3B42RT0.78−13.260.89753.08
IMERG-cal0.84−10.470.92651.98
IMERG-uncal0.75−17.310.88811.29
ERA50.79−7.920.89735.02
ERA-Interim0.70−6.190.84889.43
GSMaP0.87−10.010.94574.55
Average Rain 10.87−10.310.94587.44
Average Rain 20.85−14.560.93628.41
Validation3B42V70.73−8.170.86813.05
3B42RT0.67−11.570.84895.53
IMERG-cal0.73−9.620.86802.20
IMERG-uncal0.64−12.350.81936.56
ERA50.67−5.900.83897.44
ERA-Interim0.2233.680.711372.53
GSMaP0.78−10.970.89722.47
Average Rain 10.78−9.610.89735.70
Average Rain 20.73−15.290.87809.53
Table 7. Statistics of daily simulated streamflow during the calibration (1 April 2006–31 December 2010) and validation (1 January 2011–31 December 2018) periods under Scenario II for the Dongjiang River Basin.
PeriodPrecipitation InputNSCEBIAS (%)CCRMSE (m3/s)
Calibration3B42V70.78−3.580.89389.41
3B42RT0.76−4.980.87414.30
IMERG-cal0.82−4.740.91353.33
IMERG-uncal0.76−7.600.88411.61
ERA50.74−3.330.86431.49
ERA-Interim0.65−11.020.82494.52
GSMaP0.83−1.420.91346.75
Average Rain 10.82−9.930.91352.03
Average Rain 20.82−6.180.91352.15
Validation3B42V70.67−5.300.83354.25
3B42RT0.64−6.520.82367.73
IMERG-cal0.71−9.840.86332.75
IMERG-uncal0.61−18.440.81387.06
ERA50.63−8.760.80372.93
ERA-Interim0.1619.930.67565.66
GSMaP0.70−2.000.85335.17
Average Rain 10.71−13.040.86334.78
Average Rain 20.69−13.620.85341.06
Table 8. Comparison of the averaged streamflow simulation during the calibration (1 April 2006–31 December 2010) and validation (1 January 2011–31 December 2018) periods under Scenario III for the two river basins.
WatershedStreamflow SimulationPeriodMerged StreamflowNSCEBIAS (%)CCRMSE (m3/s)
BeijiangUnder Scenario IValidationAverage Streamflow 010.77−11.200.89739.01
ValidationAverage Streamflow 020.74−8.520.87793.20
Under Scenario IICalibrationAverage Streamflow 10.87−10.020.94574.63
ValidationAverage Streamflow 10.78−9.590.89729.99
CalibrationAverage Streamflow 20.85−12.830.92635.31
ValidationAverage Streamflow 20.74−9.940.86799.77
DongjiangUnder Scenario IValidationAverage Streamflow 010.71−14.770.86333.71
ValidationAverage Streamflow 020.70−12.100.85335.84
Under Scenario IICalibrationAverage Streamflow 10.83−3.250.91343.56
Validationmerged Streamflow 10.73−5.710.86320.07
CalibrationAverage Streamflow 20.82−5.300.91358.63
ValidationAverage Streamflow 20.71−11.240.85334.92
Disclaimer/Publisher’s Note: The statements, opinions and data contained in all publications are solely those of the individual author(s) and contributor(s) and not of MDPI and/or the editor(s). MDPI and/or the editor(s) disclaim responsibility for any injury to people or property resulting from any ideas, methods, instructions or products referred to in the content.

