3.1. Datasets
The NWPU VHR-10 [
53,
54,
55] dataset contains 800 high-resolution satellite images collected from Google Earth and Vaihingen datasets and then manually annotated by experts. The dataset contains ten categories (airplanes, ships, storage tanks, baseball fields, tennis courts, basketball courts, ground runways, ports, bridges, and vehicles).
The DIOR dataset [
28] is a large-scale benchmark dataset for object detection in optical remote sensing images.The DIOR dataset is satellite images from Google Earth and containing 23,463 images and 192,472 instances, covering 20 object classes. The 20 object classes are airplane, airport, baseball field, basketball court, bridge, chimney, dam, expressway service area, expressway toll station, harbor, golf course, ground track field, overpass, ship, stadium, storage-tank, tennis court, train station, vehicle, and windmill.
The “Dataset for Object Detection in Aerial Images” (DOTA) dataset is specifically designed for detecting and classifying various object categories within high-resolution aerial images. Aerial imagery is collected using aircraft or drones equipped with high-resolution cameras. Currently, there are multiple versions of DOTA datasets. This paper uses the DOTAv1.0 version for the study of few-shot object detection. The DOTA dataset contains 2806 images of 15 classes. The object classes include planes, ships, storage tanks, baseball diamonds, tennis courts, basketball courts, ground track fields, harbors, bridges, large vehicles, small vehicles, helicopters, roundabouts, soccer ball fields and swimming pools.
Our experimental setup uses the same general settings as previous work [
29,
50,
51,
52]. For the NWPU VHR-10 dataset, which is also based on a satellite, three classes (airplane, baseball diamond, and tennis court) were used as novel classes, and the others were used as base classes. For larger datasets such as the DIOR dataset, five classes (airplane, baseball field, train station, windmill, and tennis court) were used as novel classes and the others were used as base classes. For the aerial dataset DOTA, we selected four novel classes (plane, baseball-field, tennis-court and helicopter). When training the base class with sufficient sample instances, the few-shot object detection focuses only on the performance of the novel class target. K sample instances can be used per class when training the fewer new class samples. For the NWPU VHR-10 dataset, the number of annotated instances
K was set as 3, 5, and 10. For the DIOR dataset, the number of annotated instances
K was set as 5, 10, and 20. For the DOTA dataset, the number of annotated instances
K was set as 3, 5, 10, and 20. We used ten random number seeds and calculated their average to ensure that we could obtain algorithmically stable results.
3.2. Experimental Set and Evaluation Metrics
We trained the model using two RTX 3090 GPUs, each with a batch size of 4. The base training phase used a stochastic gradient descent (SGD) optimization algorithm with an initial learning rate of 0.01. We trained 10,000 iterations on the NWPU VHR-10 dataset, dividing the learning rate by ten into 4000 and 6000 iterations. We also used the same initial learning rate in the fine-tuning phase. We trained 20,000 iterations on the base class for the DIOR data and performed learning rate decay from 14,000 to 16,000 iterations. Training the model on both datasets for up to 2000 iterations is sufficient to achieve good performance.
We use the mean average precision (mAP) [
70] as an evaluation metric to evaluate the detection performance (Equation (
12)). The mAP is a commonly used evaluation metric in object detection. It comprehensively considers precision and recall to evaluate detection results. Precision measures the accuracy of the predicted bounding boxes, while recall measures the fraction of ground-truth objects that are successfully detected. We can obtain the AP value of the c-th category by calculating the area under the precision–recall (P–R) curve, the formula for which is shown in Equation (
12).
where
P denotes precision,
R denotes recall, and
refers to the average AP value of multiple detection categories.
where
n denotes the number of novel classes under the few-shot object detection setting.
3.3. Results
We validated our proposed few-shot detector on the NWPU VHR-10 and DIOR datasets along with state-of-the-art FSOD methods, such as meta-learning-based RepMet [
40], FSODM [
50], PAMS-Det [
51], DCNet [
43], FCT [
44], and fine-tuning-based CIR-FSD [
52], MPSR [
47], TFA [
46], SAGS [
29], and DeFRCN [
48]. The meta-learning-based methods construct several episodes to learn and obtain the class representative vector. These methods then use the class representative vector to re-weight the query features and to predict the target. The transfer-learning-based methods use a batch training strategy and then directly predict the target in the image.
The DIOR dataset is a large-scale dataset.
Table 2 shows that our proposed method achieves the best performance. We highlight the mAP score of the best detection performance in bold for
Table 2,
Table 3,
Table 4,
Table 5,
Table 6 and
Table 7. Compared with the baseline model DCNet, our method has a 1.5% improvement in the 20-shot setting, a 2.3% improvement in the 10-shot setting, and a 2% improvement in the 5-shot setting.
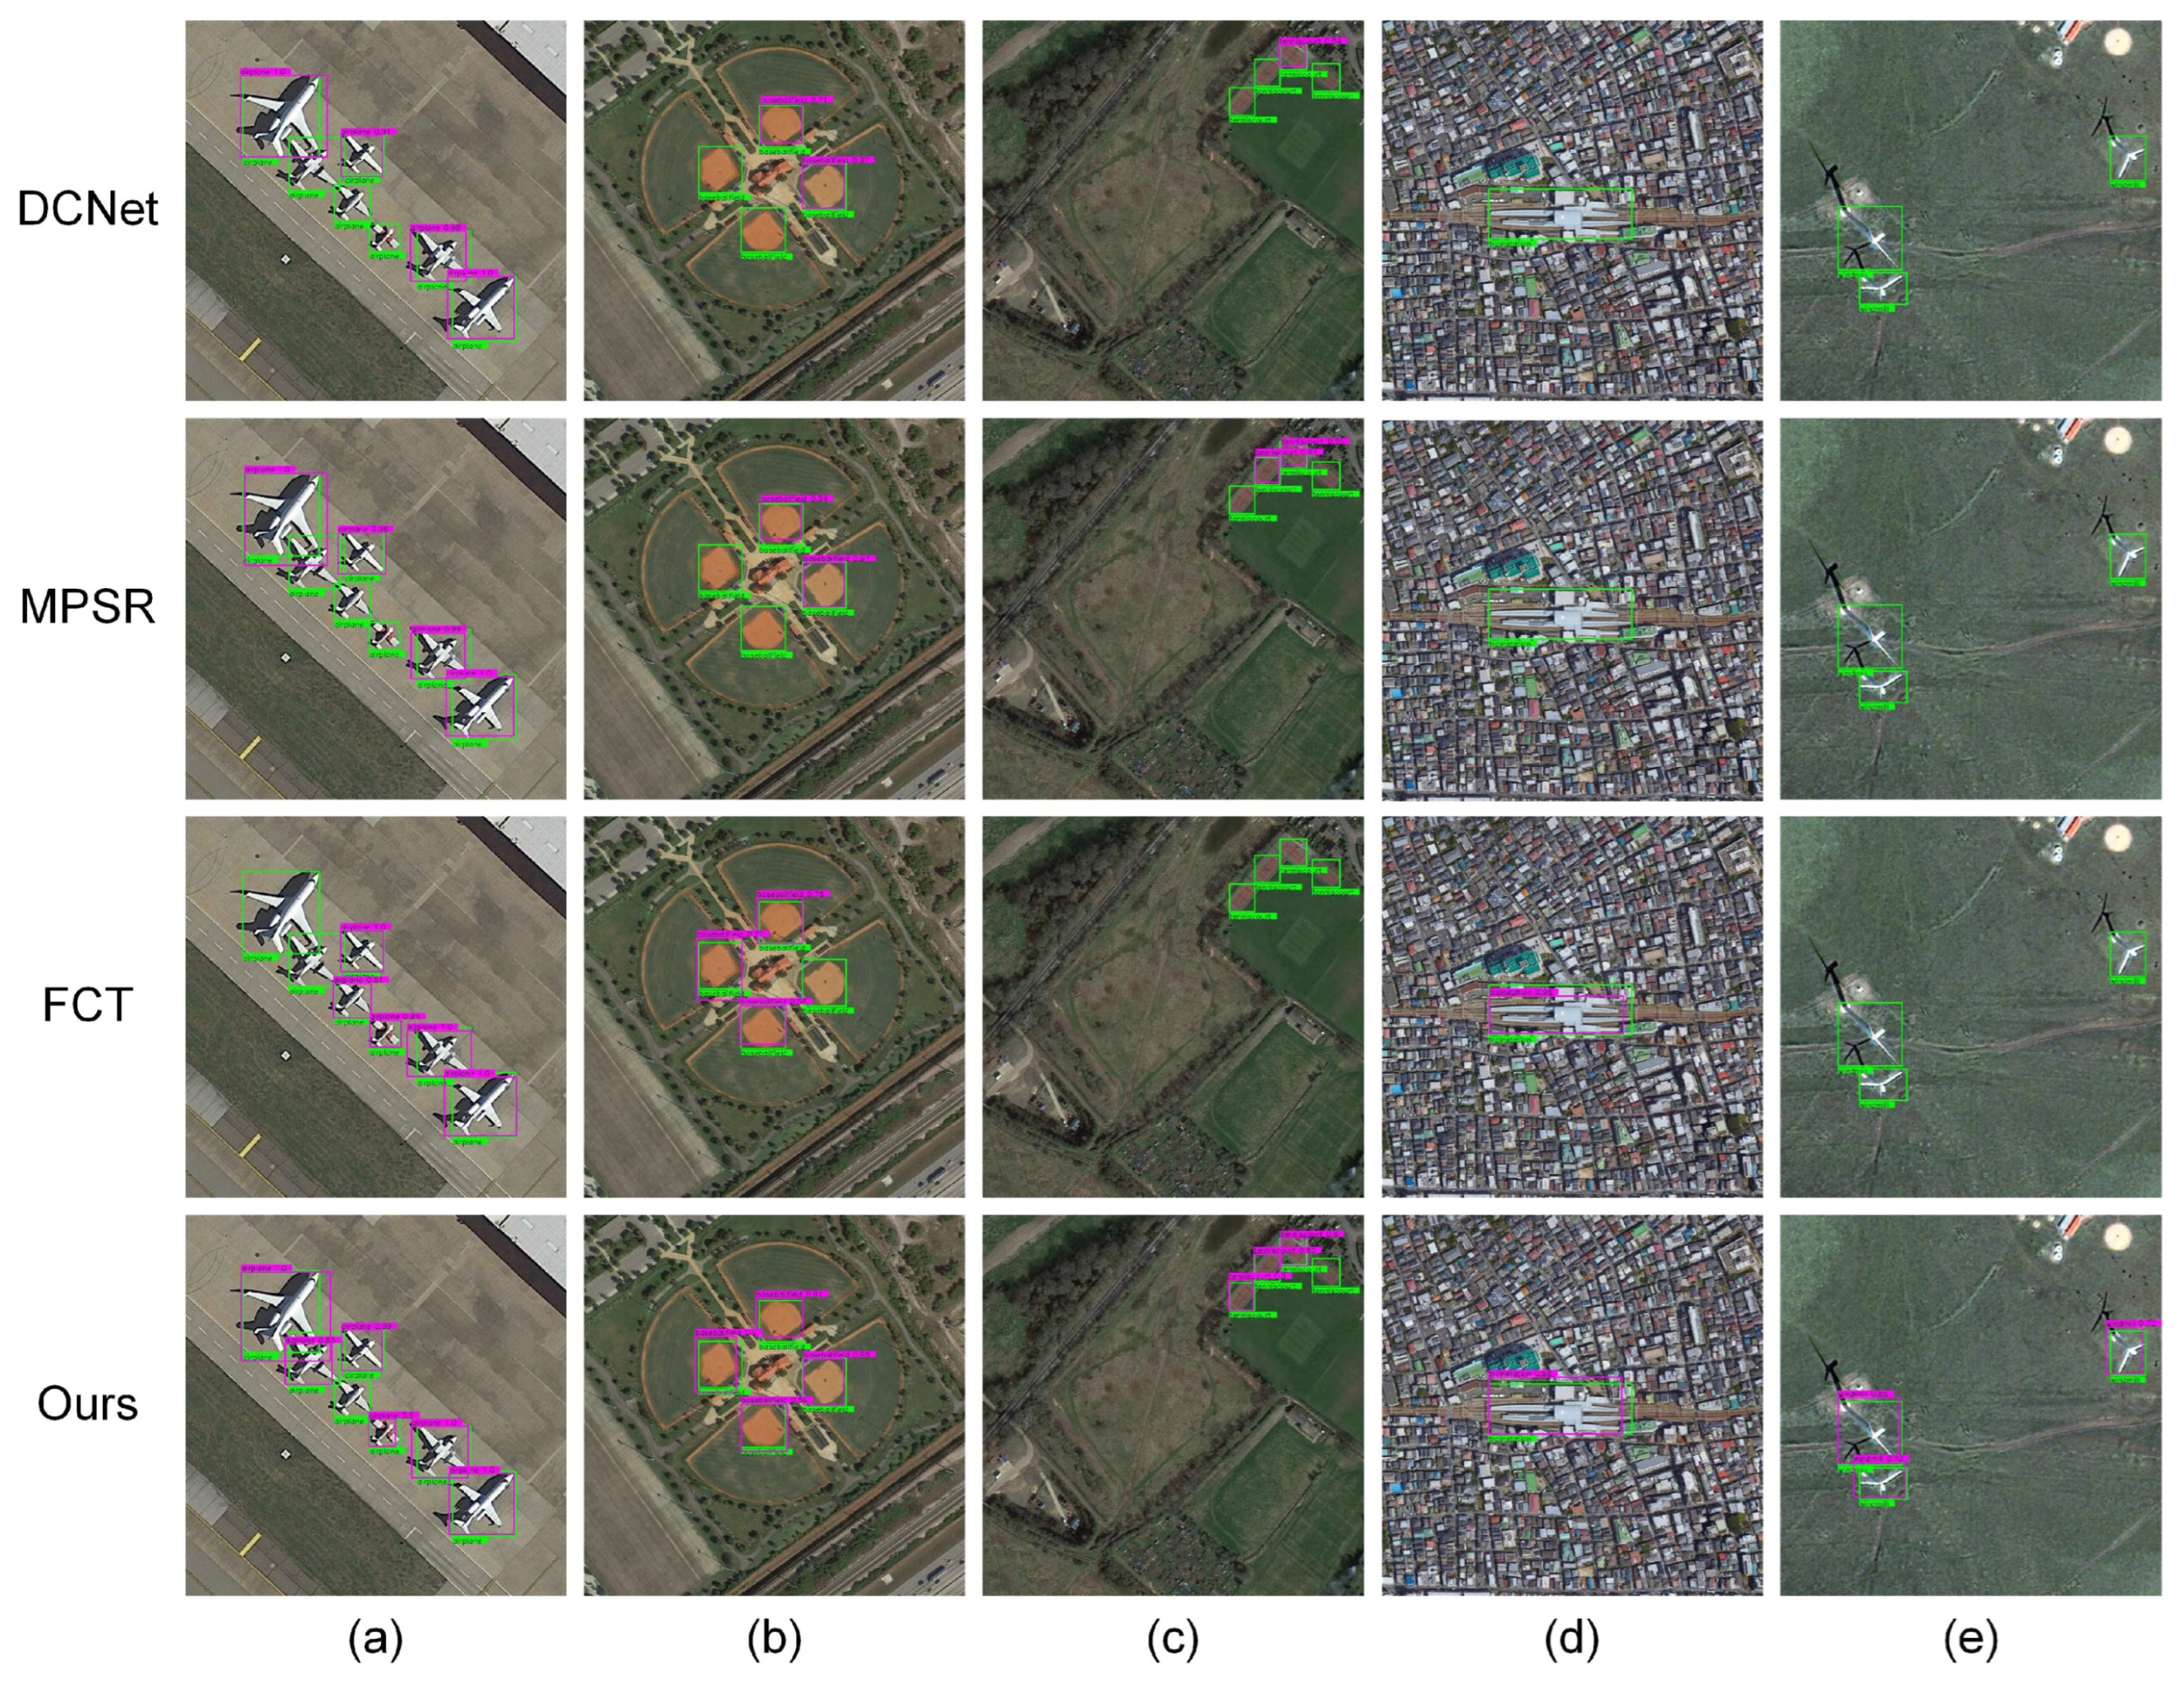
As shown in
Figure 5a, the airplanes in the pictures are of different sizes and environments, which makes it a challenging detection task. With the help of the Gaussian-scale enhancement strategy, our method has the best performance with the lowest missed detection rate. The field rotation in
Figure 5b shows another challenge. Since the proposed MPEAA module can efficiently extract the multi-scale features, the proposed method achieves the best performance in
Figure 5b. Furthermore, when targets with tiny or large sizes are in the scene, such as the tennis court in
Figure 5c, our method can also accurately localize and classify them.
The results of the NWPU VHR-10 dataset are shown in
Table 3. Our method outperforms the other state-of-the-art methods, with a 3.4% improvement in the 3-shot setting, a 3.3% improvement in the 5-shot setting, and a 2.6% improvement in the 10-shot setting when compared with DCNet.
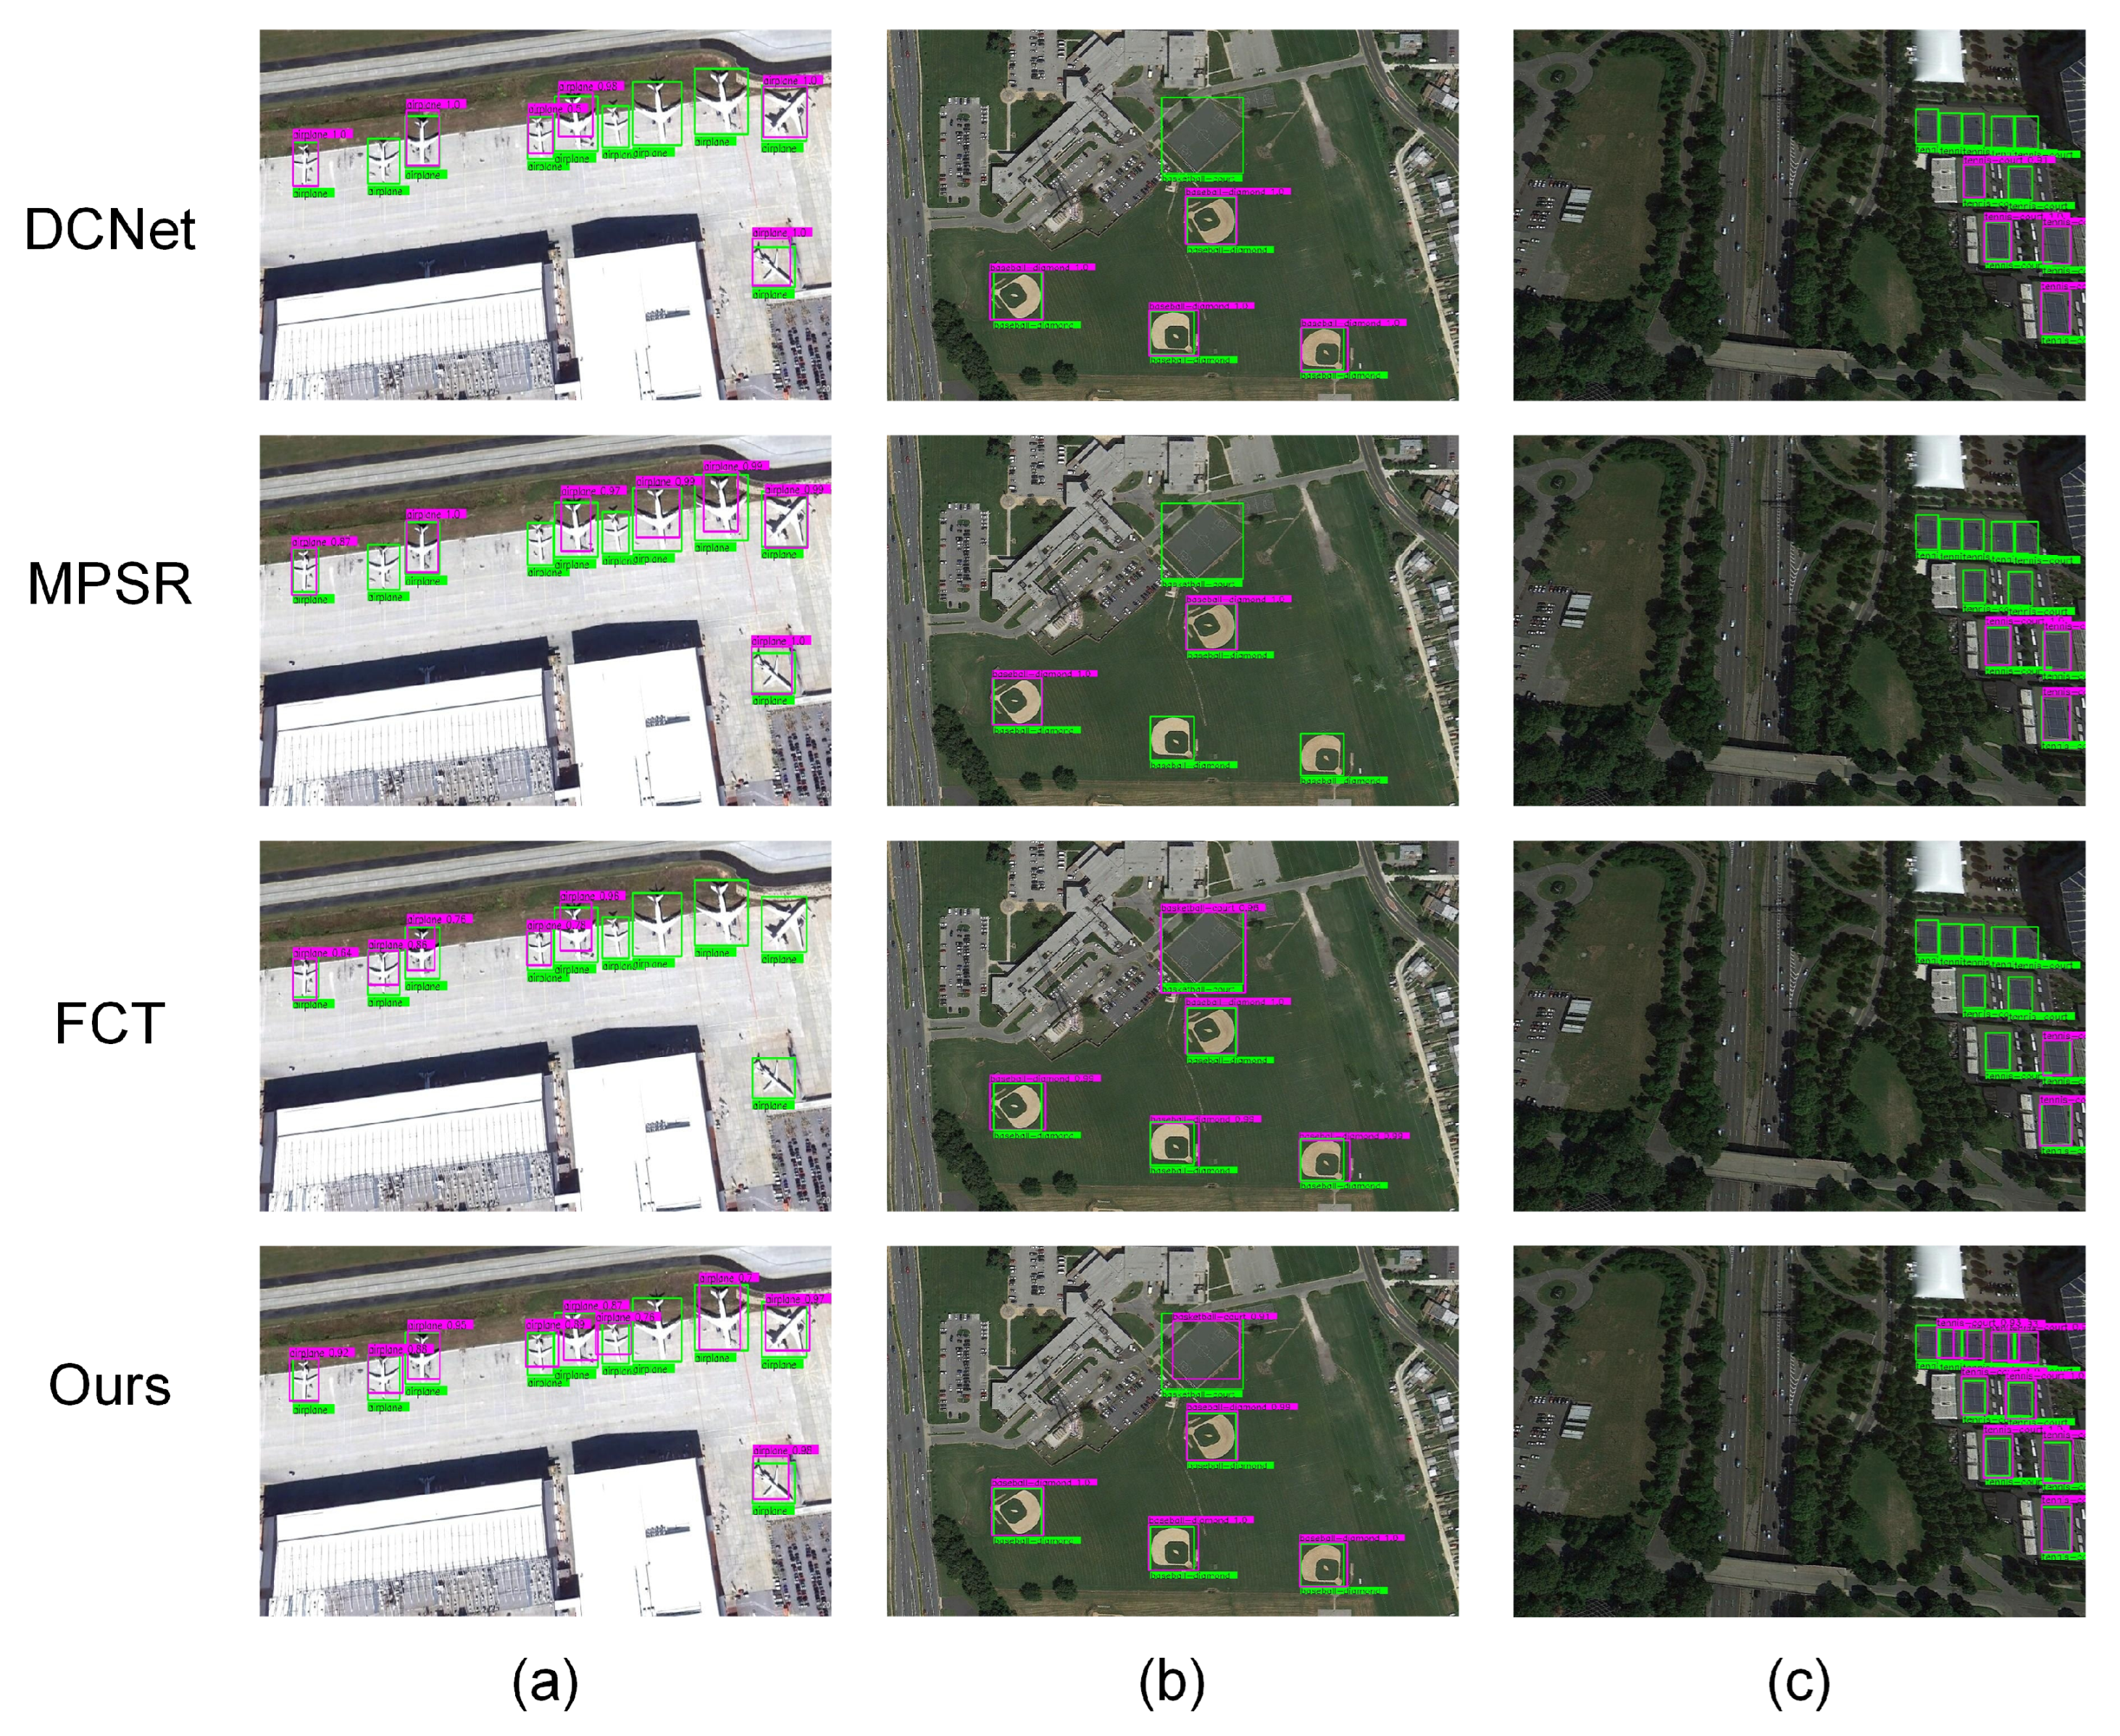
Figure 6 shows a visualization of the experimental results on the NWPU-NHR10 dataset. In
Figure 6a, the missed detection rate is relatively high when the object (aircraft) size changes. Aided by the Gaussian-scale enhancement strategy, our method has the best detection performance.
Figure 6c shows a dense object detection challenge: almost all the tennis courts are small and densely arranged. While most other methods include many missing objects, our method can accurately detect densely arranged small-sized targets with the help of the MEPAA module.
Table 4 compares our method with other few-shot object detectors. Our method consistently outperforms DCNet and other counterparts with each shot setting. Compared to MPSR, our method significantly improves accuracy by 1.7%/3.8%/2.9%/3.6% mAP with 3/5/10/20-shot setting. The detection result verifies the effectiveness of our proposed method on satellite and aerial image data.
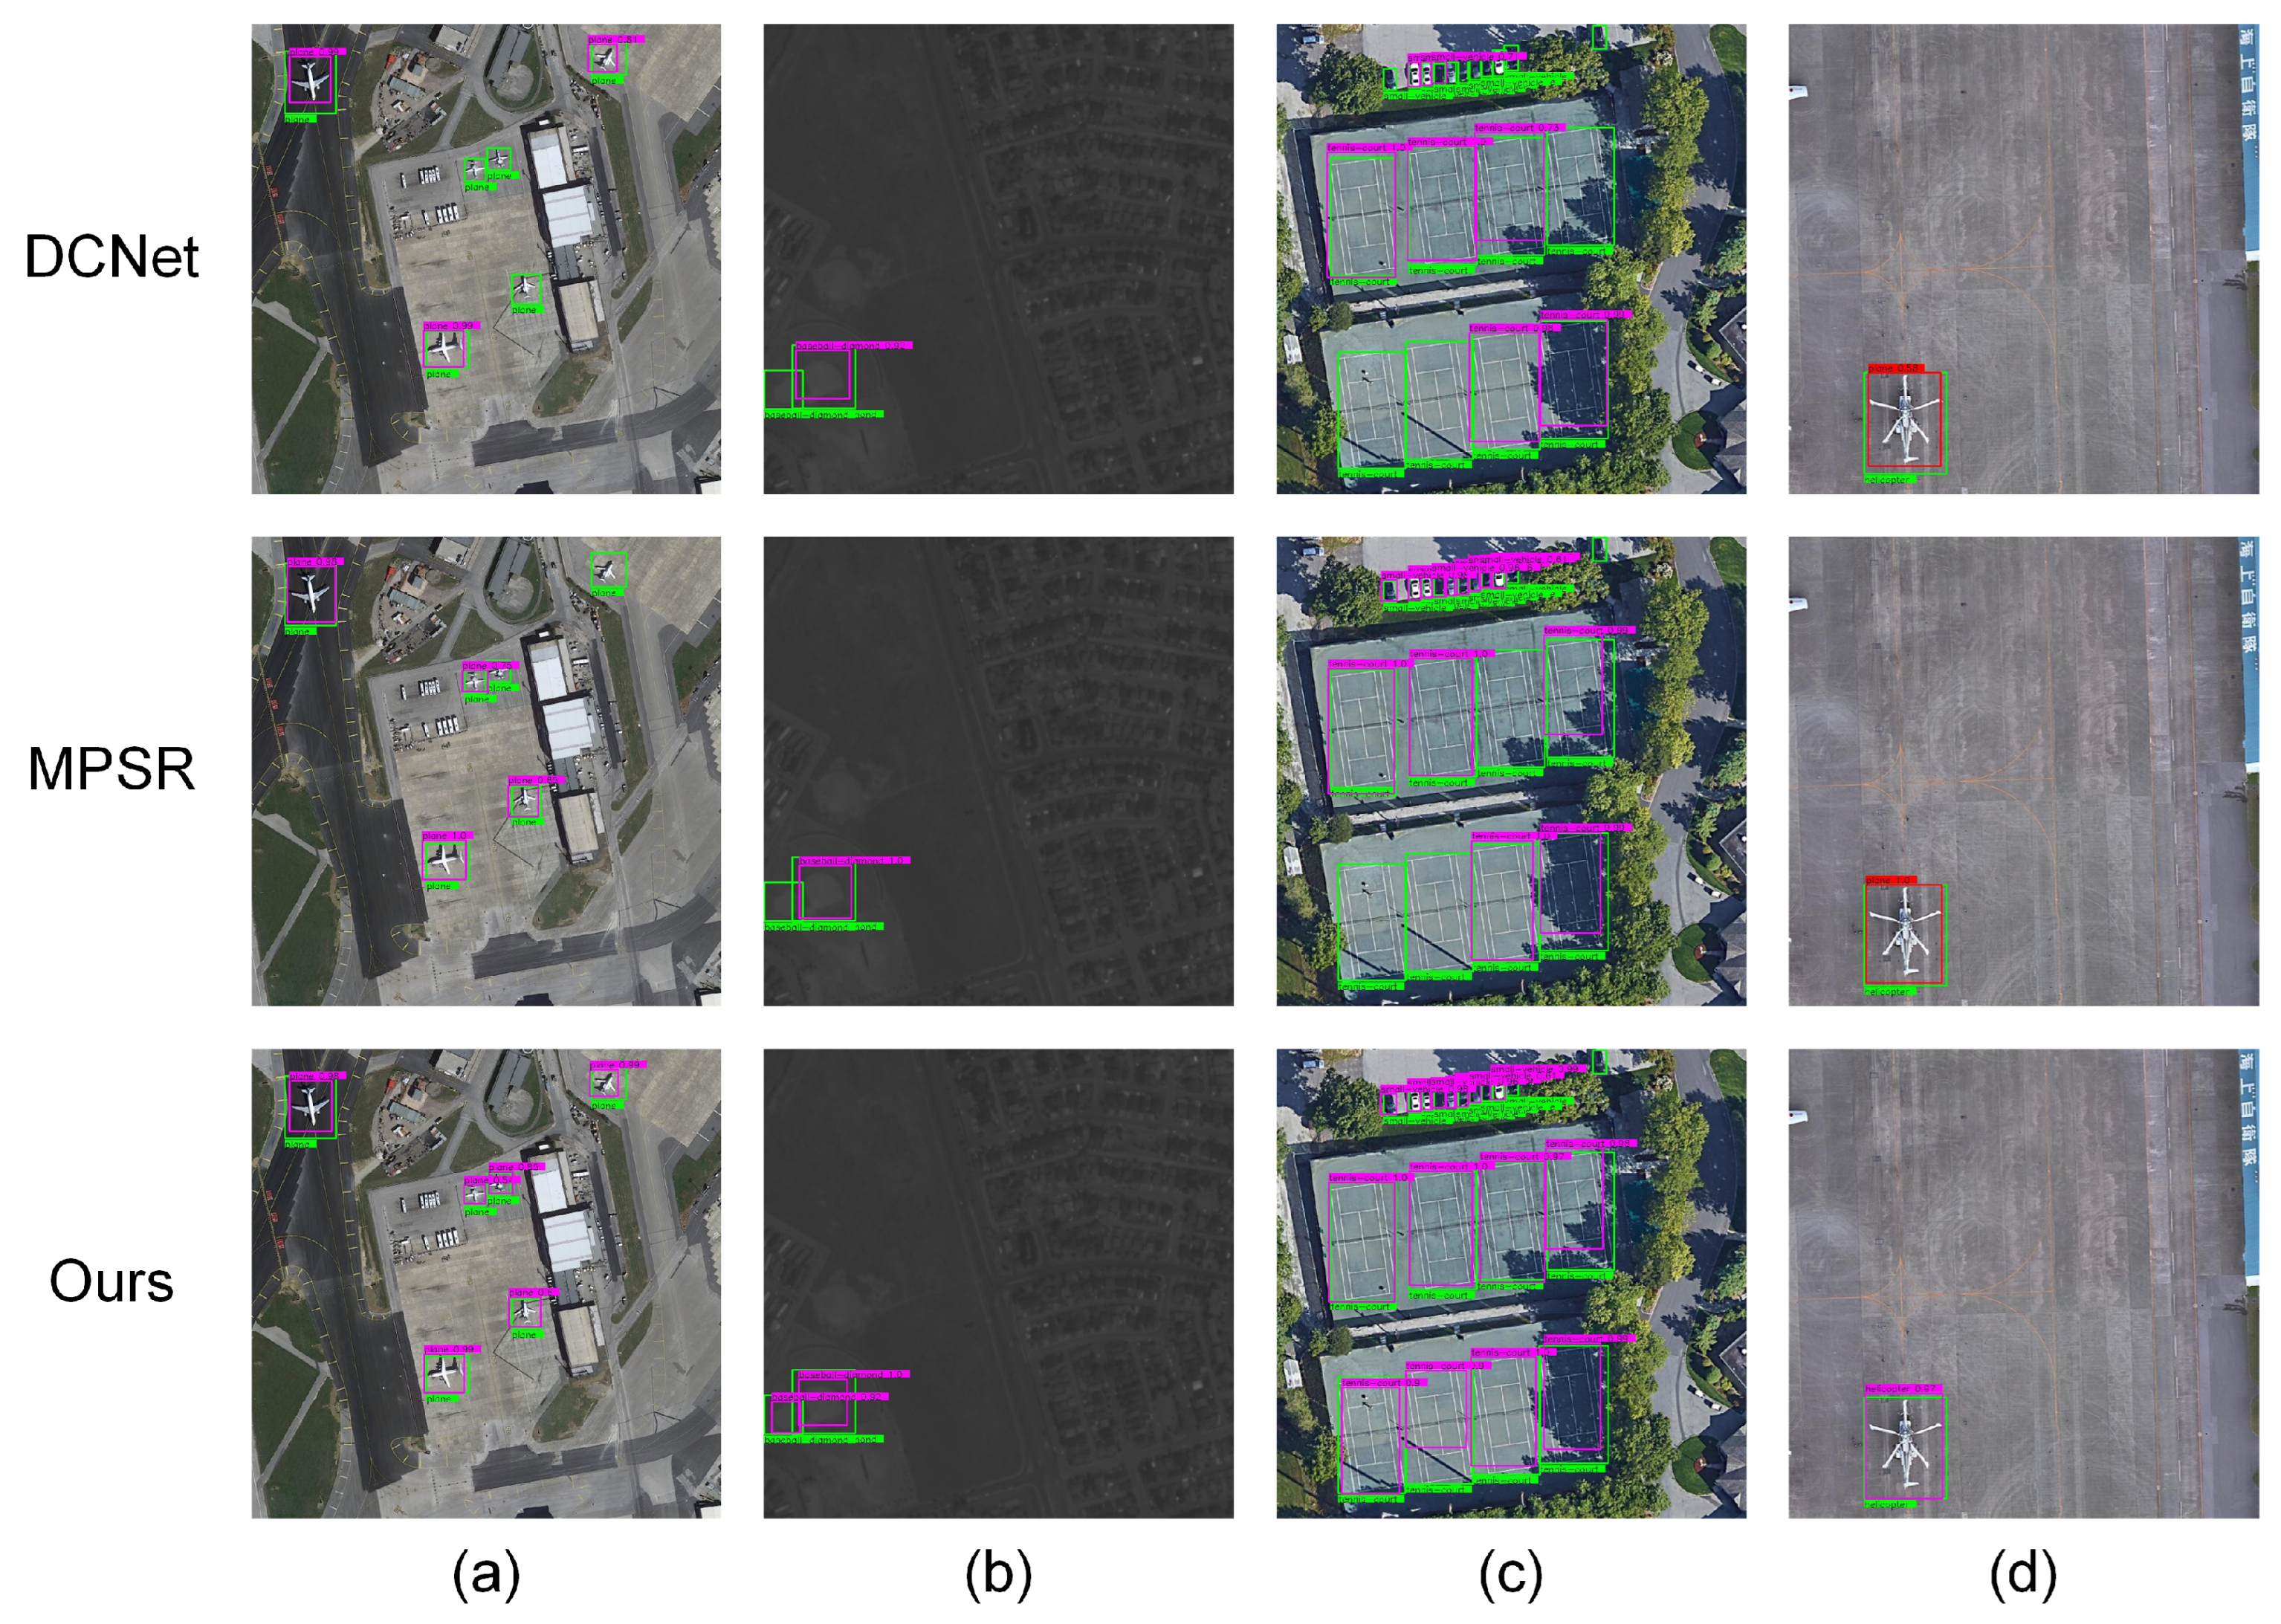
Figure 7 shows a visualization of the experimental results on the DOTA dataset. With the help of the GSE strategy, our method can successfully detect planes and baseball fields of various sizes, and other methods will lose some targets. Our proposed MPEAA module can achieve high-quality feature reweighting, and our method can detect densely arranged tennis courts. The red box represents a misdetection.
Figure 7d shows a challenge case. The helicopter can be considered as a class with similar patterns of planes, causing both MPSR and DCNet to detect helicopters as airplanes. The proposed model can successfully recognize the helicopter with the help of MPEAA module.
3.4. Ablation Experiments
To demonstrate the effectiveness of each module of our proposed method, we conducted ablation experiments using the Gaussian-scale enhancement strategy and the multi-branch patch-embedding attention aggregation module. The ablation experiment
Table 5 shows that GSDA achieved a 0.7–1.7% improvement on the DIOR dataset. As shown in
Table 6, an improvement of 1.5–3% is also obtained on the NWPU VHR-10 dataset, proving the strategy’s effectiveness. Also, using the MPEAA module, improvements of about 0.7% and 0.4–0.8% were obtained on the DIOR dataset and the NWPU VHR-10 dataset, respectively. We used the Gaussian-scale enhancement strategy and the MPEAA module to maximize these improvements.
Table 5.
Ablation experiment on the DIOR dataset.
Table 5.
Ablation experiment on the DIOR dataset.
| GSE | MPEAA | 5-Shot | 10-Shot | 20-Shot |
|---|
| | | 33.2 | 38.3 | 44.9 |
| √ | | 34.9 | 39.9 | 45.6 |
| | √ | 33.9 | 39.0 | 45.6 |
| √ | √ | 35.2 | 40.6 | 46.4 |
Table 6.
Ablation experiment on the NWPU VHR-10 dataset.
Table 6.
Ablation experiment on the NWPU VHR-10 dataset.
| GSE | MPEAA | 3-Shot | 5-Shot | 10-Shot |
|---|
| | | 56.7 | 64.8 | 72.1 |
| √ | | 59.7 | 67.6 | 73.6 |
| | √ | 57.4 | 65.2 | 72.9 |
| √ | √ | 60.1 | 68.1 | 74.7 |
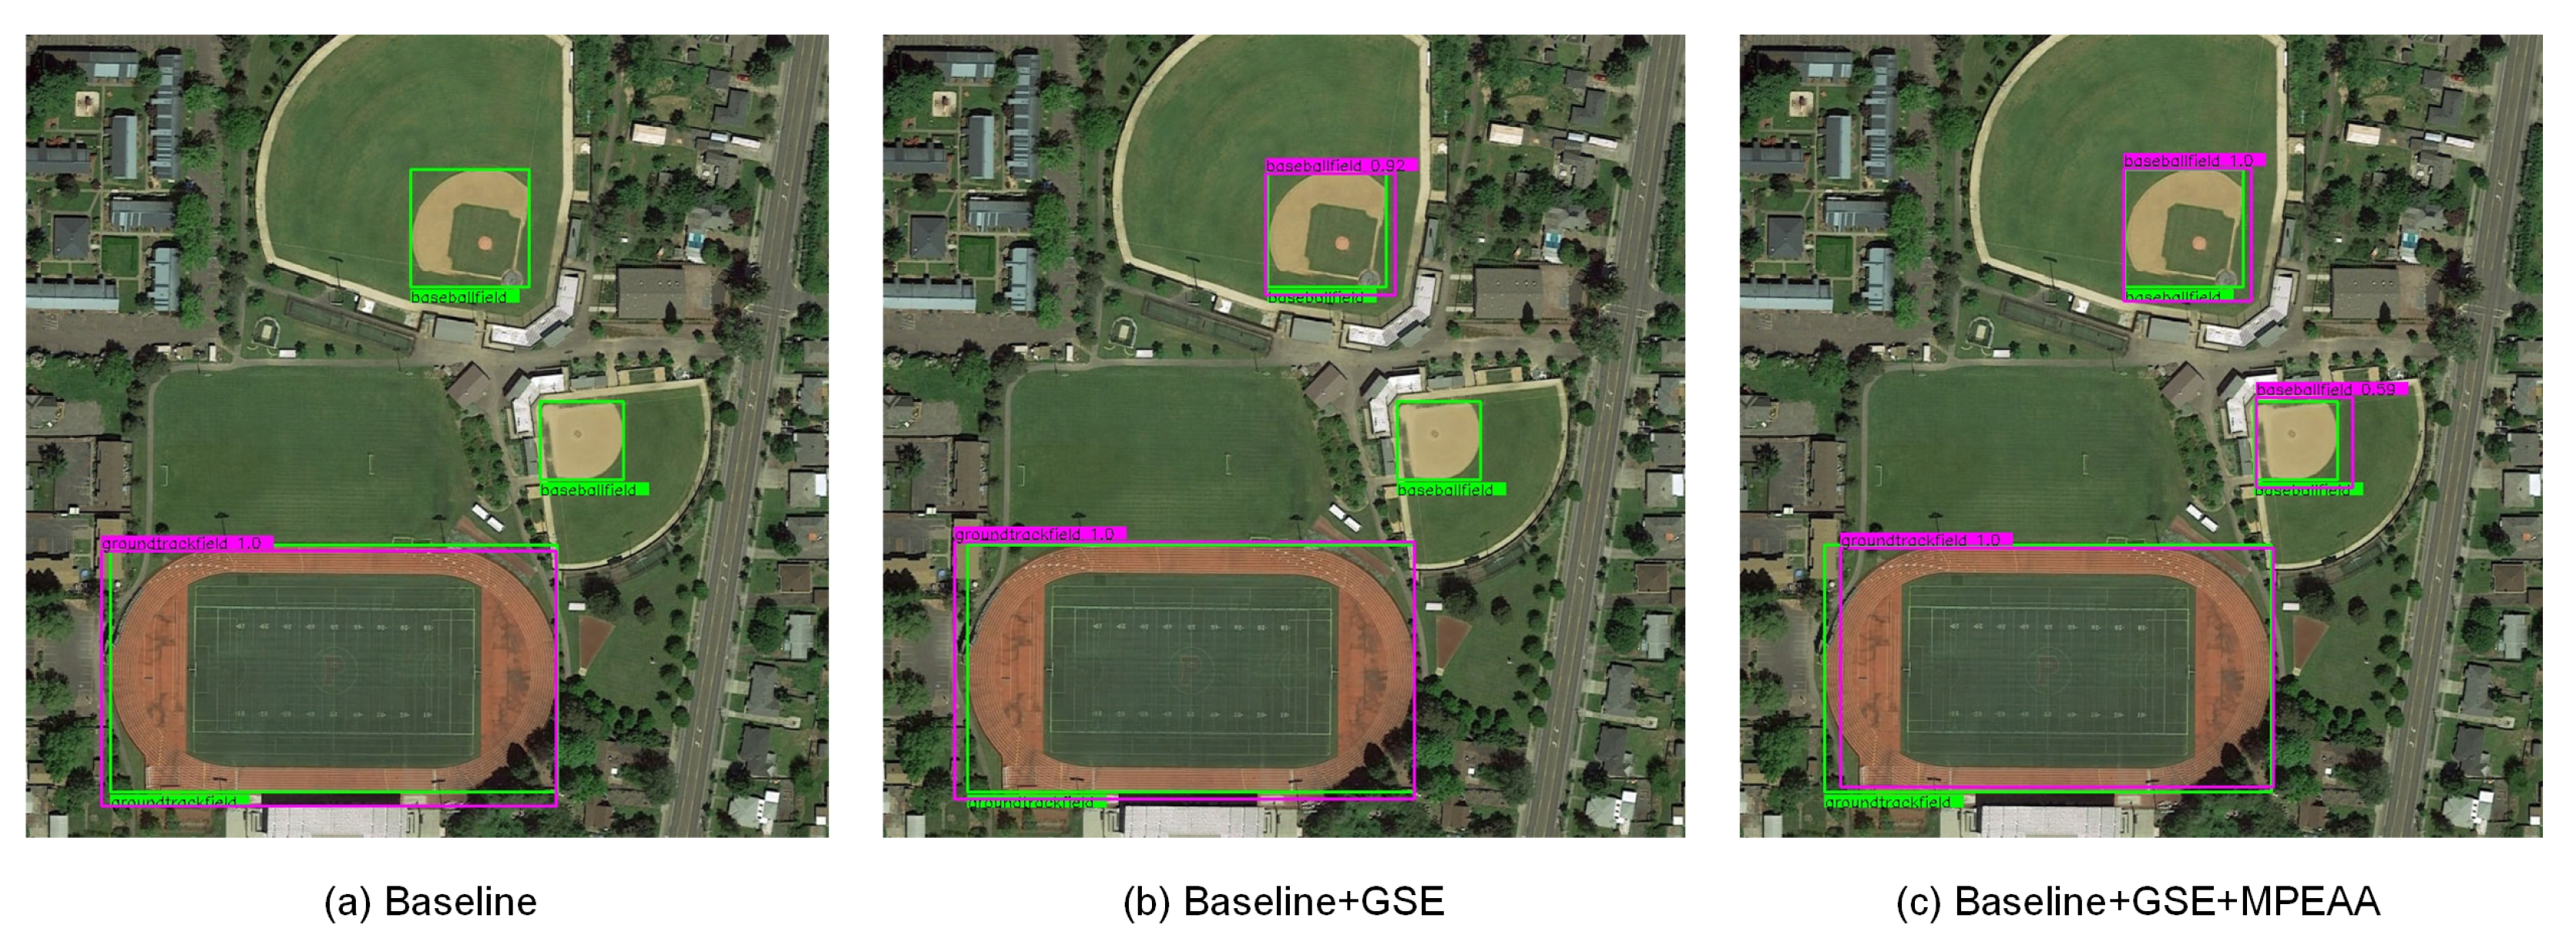
Figure 8 shows a visualization of the ablation experiment results. The baseline model cannot detect the targets of the two baseball fields at different sizes. After adding GSE, the model can detect ground track files with larger scales and smaller baseball files. However, our method can detect the baseball files with appearance changes and at minor scales after using the MPEAA module. This proves the effectiveness of our proposed method.
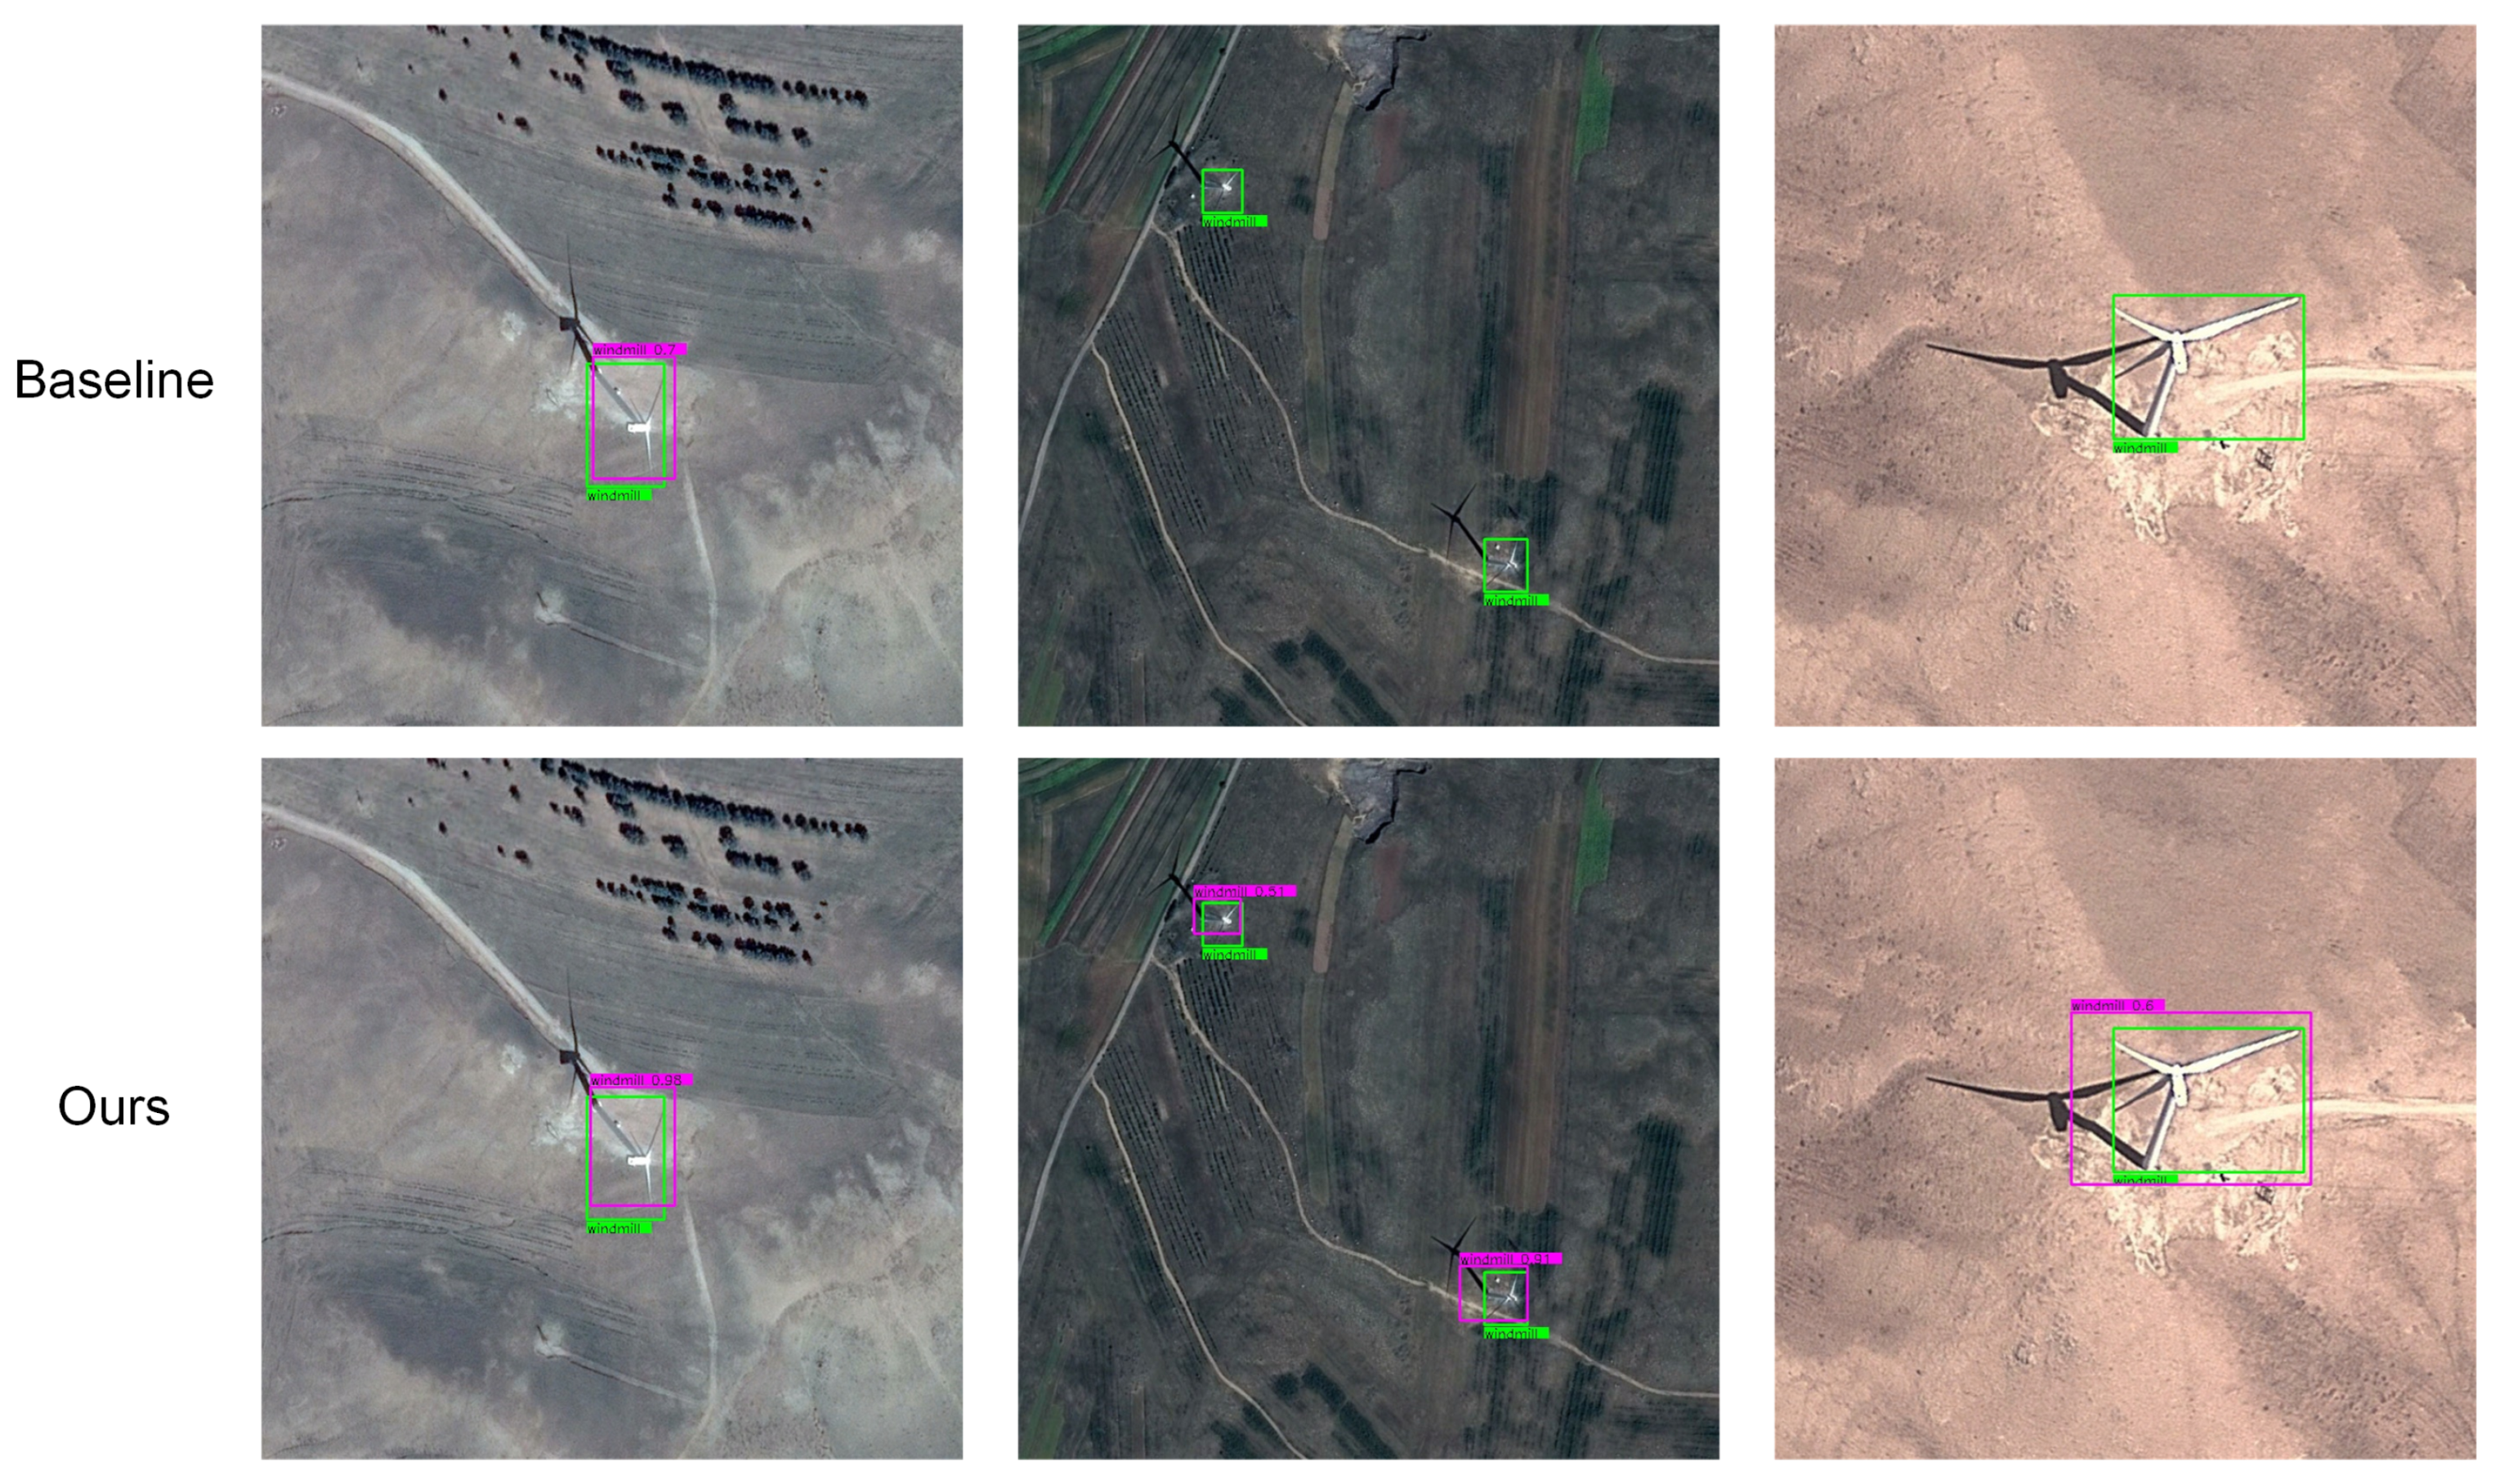
We compared the abilities of our method and the baseline model to detect the cross-scale targets. As shown in
Figure 9, the baseline model cannot detect windmills with different scales. Thanks to the GSE strategy and the MPEAA module improving the ability of our method to detect multi-scale targets, our method can successfully detect windmills at each scale.
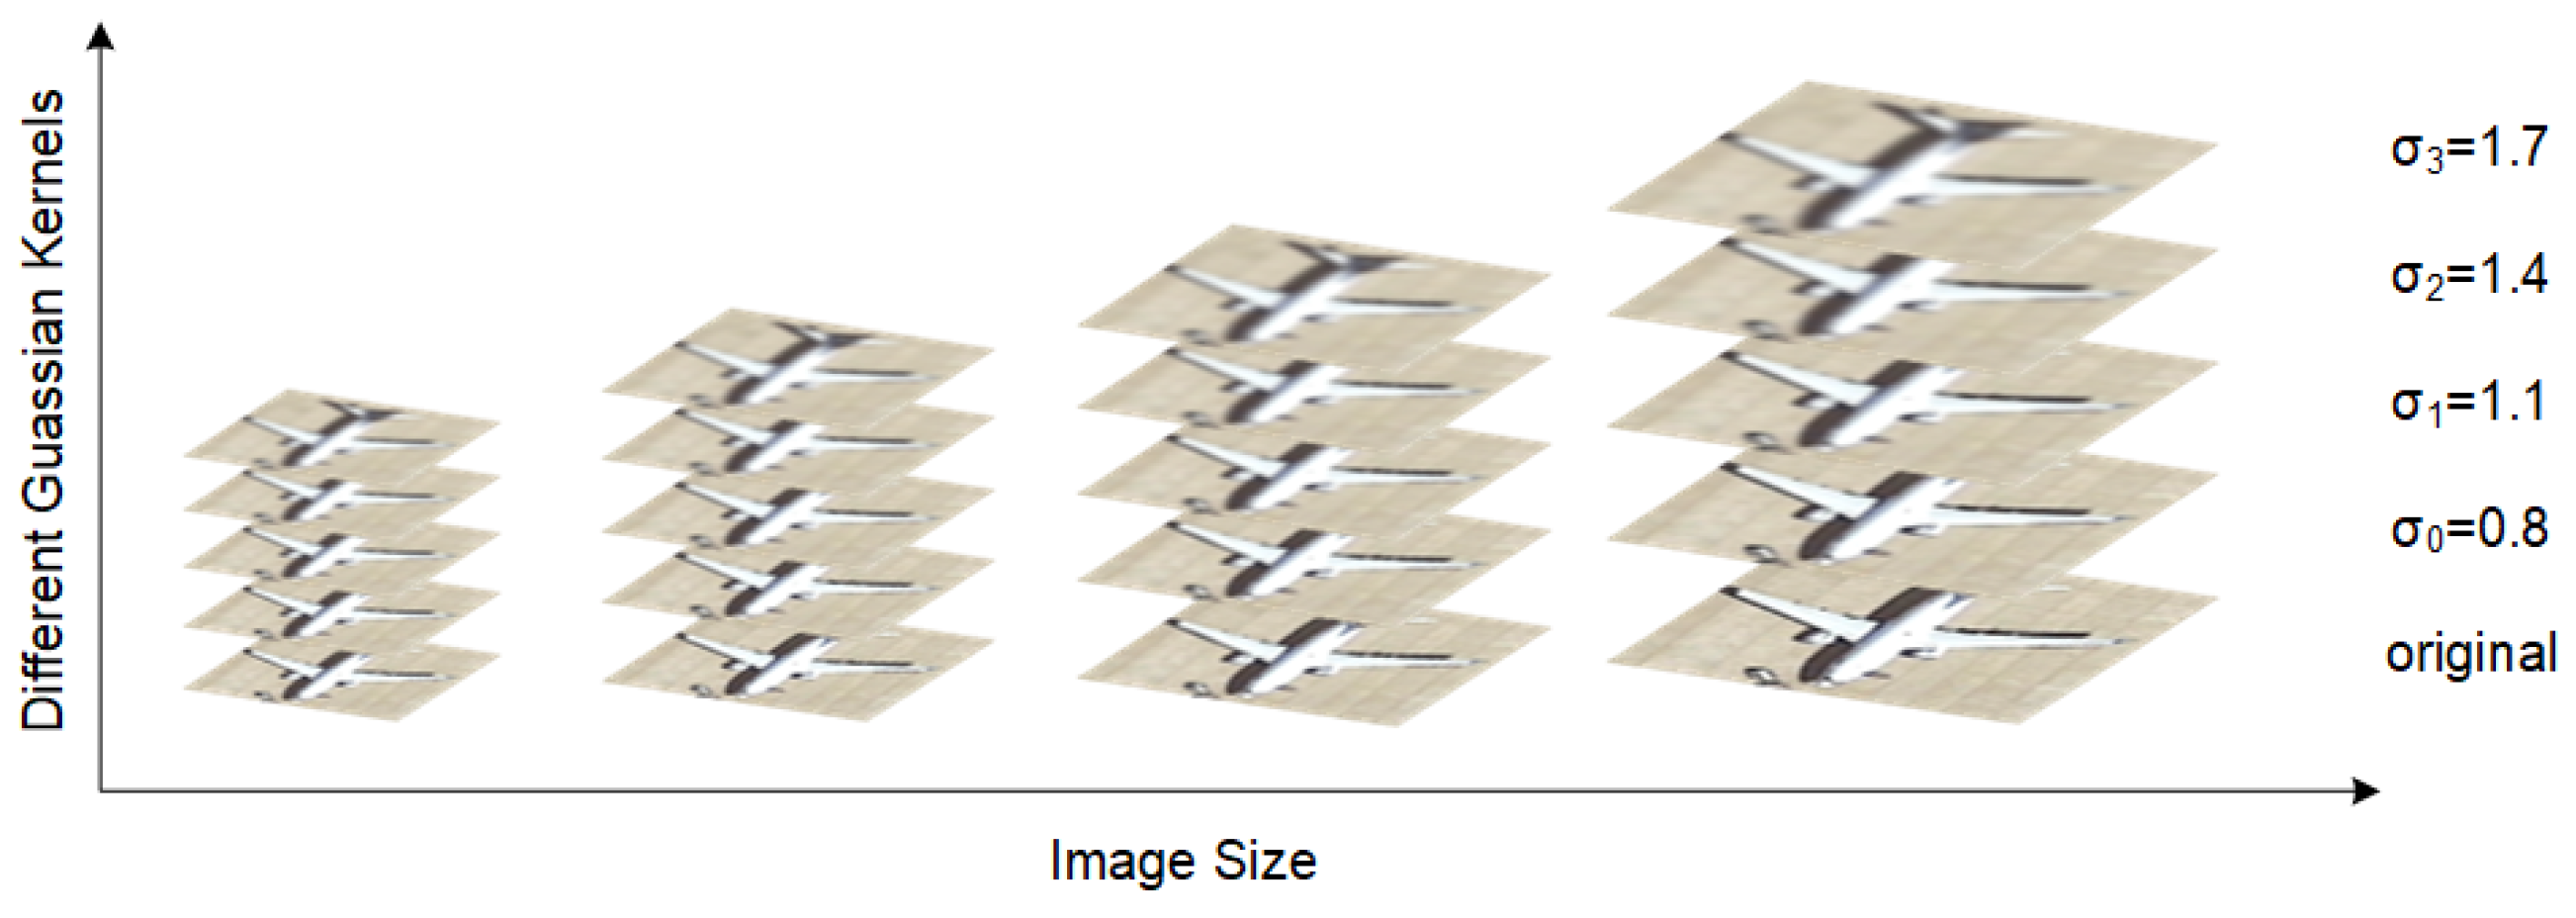
In addition, to explore the optimal number of the support image sizes in Gaussian-scale enhancement strategy, we conduct a comparison experiment setting the number of image sizes in the scale space from 2 to 5. We evaluate the indicators, including mAP and latency.
Table 7 shows the detection accuracy with the 5-shot setting on the NWPU-VHR dataset and the training speed of each episode. When the number of support images’ sizes is 5, the detector achieves the best accuracy of 68.2% mAP and the highest latency of 0.46 s. As observed, increasing the number of crop sizes will improve detection accuracy and reduce training speed. As the number of sizes increases, the range of learnable target scale distribution becomes wider. Constructing a complete scale space can effectively enhance scale information for network learning. Meanwhile, due to the increasing number of supporting images, it will inevitably take a longer time to train the network. Compared to size 2, size 4 improves accuracy by 1.3% mAP and increases the latency by 29%. Size 5 delivers 1.4% mAP improvement but increases the latency by 43%. The accuracy difference between the size 4 and size 5 is minimal, but the size 5 requires much more training time. Considering comprehensive accuracy and speed, cropping the support images into size 4 is a better choice.
Table 7.
Our comparison results with different numbers of the support image sizes.
Table 7.
Our comparison results with different numbers of the support image sizes.
| | | | | | | mAP (%) | Latency (s) |
|---|
| 2 sizes | | | | √ | √ | 66.8 | 0.326 |
| 3 sizes | | | √ | √ | √ | 67.6 | 0.375 |
| 4 sizes | | √ | √ | √ | √ | 68.1 | 0.423 |
| 5 sizes | √ | √ | √ | √ | √ | 68.2 | 0.468 |


