Article

Biomass Burning Plume from Simultaneous Observations of Polarization and Radiance at Different Viewing Directions with SGLI

1
School of Applied Information Technology, The Kyoto College of Graduate Studies for Informatics, Kyoto 606-8225, Japan
2
CNRS (Centre National de la Recherche Scientifique), University of Lille, F-59000 Lille, France
3
Faculty of Applied Sociology, Kindai University, Higashiosaka 577-8502, Japan
*
Author to whom correspondence should be addressed.
Remote Sens. 2023, 15(22), 5405; https://doi.org/10.3390/rs15225405
Submission received: 18 August 2023 / Revised: 15 October 2023 / Accepted: 15 November 2023 / Published: 17 November 2023

Abstract

:
The Earth Observation Satellite Global Change Observation Mission—Climate (GCOM)-C (SHIKISAI in Japanese), carrying a second-generation global imager (SGLI), was launched in 2017 by the Japan Aerospace Exploration Agency. The SGLI performs wide-swath multi-spectral measurements in 19 channels, from near-ultraviolet to thermal infrared (IR), including the red (674 nm; PL1 channel) and near-IR (869 nm; PL2 channel) polarization channels. This work aimed to demonstrate the advantages of SGLI, particularly the significance of simultaneous off-nadir polarized and nadir multi-spectral observations. The PL1 and PL2 channels were tilted at 45° for the off-nadir measurements, whereas the other channels took a straight downward view for the nadir measurements. As a result, the SGLI provided two-directional total radiance data at two wavelengths (674 and 869 nm) that were included in both off-nadir and nadir observations. Using these bidirectional data, an algorithm was applied to derive the altitude of the aerosol plume. Furthermore, because of the significance of the simultaneous observation of polarized and non-polarized light, the sensitivity difference between the radiance and polarized radiance was demonstrated. Severe wildfire events in Indonesia and California were considered as examples of specific applications. Herein, we present the results of our analysis of optically thick biomass-burning aerosol events. The results of the satellite-based analysis were compared with those of a chemical transport model. Exploring the SGLI’s unique capability and continuous 5-year global record paves the way for advanced data exploitation from future satellite missions as a number of multi-directional polarization sensors are programmed to fly in the late 2020s.

Graphical Abstract

1. Introduction

Severe wildfires, which occur frequently worldwide, have become a major environmental problem. A considerable amount of biomass-burning aerosols (BBAs) are released into the atmosphere, causing air pollution and adversely affecting the health and social lives of humans [1,2,3,4]. The BBAs released by wildfires travel long distances by advection and often traverse oceans or continents. Although such long-range transport depends predominantly on meteorology, in some parts of the world, thermally driven pollutant flows have been reported to be systematized as a feature of mountainous weather and climates [5]. Therefore, both topographic effects and meteorological fields should be considered to understand the local air pollution [6,7,8,9]. In addition, the BBAs released from large-scale wildfires often form a BBA plume, which is an optically thick layer with limited horizontal and vertical extents. BBA plumes are too thick for standard global aerosol retrieval algorithms and are often misclassified as clouds. These complexities regarding the nature of BBAs, challenges in the standard global products, and the social impact of BBAs are the main drivers of the exploratory study presented in this article. The objective of this study was to demonstrate the potential capabilities and advantages of the second-global imager (SGLI) instrument [10] beyond the publicly available standard product suite.
A Japanese mission, the Japan Aerospace Exploration Agency (JAXA)/Global Change Observation Mission—Climate (GCOM)-C (SHIKISAI in Japanese), launched in 2017, carried an SGLI. Over the past few years, we have been involved in the analysis of optically thick BBA events, such as severe BBA (SBBA) plumes, using the features of SGLI data [11,12,13,14]. The difficulty in SBBA plume analysis is the possibility of confusion between aerosols and clouds, as well as the limited implementation of the algorithm suitable for the SBBA plume in the standard product chain. Our previous studies addressed these challenges [12,14,15], and we continue to focus on SBBAs to advance the analysis of faint borders between clouds and aerosols, or the mixing zone between the two. The SGLI has 19 channels ranging from near-UV to thermal infrared (IR), including the red (674 nm; PL1 band) and near-IR (869 nm; PL2 band) polarization channels. The instantaneous field-of-view is 250 m in the near-UV to short-IR wavelength range and 1 km for polarization measurements. This spatial resolution is the best among the multiyear global-scale polarization measurement datasets available.
The polarization optics of the SGLI make oblique observations at ±45° (the switch between 45° and −45° is made near the equator), while the radiance (R)-only optics take a straight downward view. As a result, the SGLI provides two-directional total R data at two wavelengths (674 and 869 nm). As previous studies with the multi-angle imaging spectroradiometer (MISR) have shown, multi-directional data make it possible to derive geometrical information about clouds and aerosol plumes [16,17,18,19]. Atmospheric motion vector detection using MISR and GOES was extended and derived from the GOES-R series of the moderate-resolution imaging spectroradiometer (MODIS) and the GOES-R series Advanced Baseline Imager [20]. These promising results drive us to advance the application of SGLI data in stereoscopy and triangulation, although the application of historic MISR algorithms to SGLI is not straightforward because of the difference in the number of view directions and swath widths between the two instruments.
In addition to polarimetric and multi-spectral measurements by the SGLI, geostationary satellites and ground-based measurements provide information regarding the temporal evolution of the SBBA event. Although the swath width of the SGLI is as wide as 1150 km, the next measurement after an overpass occurs between one and three days later at mid- and low latitudes, which is insufficient to fully capture fast-changing SBBA events. Therefore, the use of high-temporal-resolution data obtained by geostationary satellites or ground-based observations is necessary to place the event in context. Here, the Japanese geostationary meteorological satellites Himawari-8/Advanced Himawari Imager (AHI) [21] and National Aeronautics and Space Administration (NASA)/aerosol robotic network (AERONET) [22] are effective.
The remainder of this paper is organized as follows. The method, described in Section 2, specifies the analytical processing. First, previously proposed algorithms for the retrieval of SBBAs are briefly reviewed. Second, a calculation method for the aerosol plume height using two-directional total R data from off-nadir and nadir observations is presented. Third, chemical transport model (CTM) configurations and other ancillary datasets are discussed. Section 3 presents the results of R-to-polarized-R (PR) comparison, stereoscopic altitude estimation, and CTM simulation for case studies in Sumatra and the West Coast of North America. Section 4 discusses the validity of the methodology used and the possibilities for further work. Finally, the observations reported in this study are summarized.

2. Methods

2.1. Retrieval for BBA Properties from the GCOM-C/SGLI Data

The instantaneous field-of-view of the SGLI is 250 m in the near-UV to near-IR wavelength range and 1 km for the polarization measurements. Such a multi-channel capability is useful in characterizing the types of aerosols that exist in the atmosphere. Once the aerosol type is predicted, it is useful to efficiently characterize their optical thickness and microphysical properties.
This study focused on SBBAs, which are optically thick biomass-burning aerosols that often occur in the form of a plume as a result of massive forest fires. In previous studies, we proposed two SBBA detection indicators and discussed their application to the SGLI data [15,16,17,18]. The first indicator, the absorbing aerosol index (AAI), takes advantage of the sensitivity of near-UV channels to SBBA and is defined as follows:
A A I = R 412 R 380 ,
where R 412 is the reflectance at the 412 nm near-UV channel, and R 380 is the same at the 380 nm channel. The second indicator, the polarized radiance index (PRI), is defined by the polarimetric reflectance ( P R ) at 869 and 674 nm as follows:
P R I = P R 869 P R 674 ,
where P R λ is defined by the second and third Stokes parameters Q and U at wavelength λ by the following equation:
P R λ = Q λ 2 + U λ 2
Using the SGLI recorded data for four years from 2018 to 2021, the pixels satisfying AAI ≥ 1.1 and PRI ≥ 1.2 are candidates for SBBA pixels [18]. In practice, a large fraction of AAI ≥ 1.1 pixels include PRI ≥ 1.2 pixels, and, hence, it is sufficient to use AAI ≥ 1.1 for the quick selection of the SBBA candidate area. This simplification is effective for aerosol retrieval, particularly when polarimetric observations are not available. The details of the aerosol retrieval algorithms and obtained aerosol optical properties and the validation of the results have been presented in a previous paper [11].
Figure 1 demonstrates the SBBA pre-selection based on the AAI performed before the main BBA retrieval. The SGLI data over western North America on 13 September 2020 have been used as an example. Figure 1a shows a color composite image with (R, G, B) corresponding to the (674, 530, 443) channels, showing heavy smoke from the fire sources. The thick brown plume running northwest from the lower-central part of the figure is clearly visible. Figure 1b shows the aerosol optical thickness (AOT) at 500 nm from the official Level 2 products of JAXA (version 2). The densest part of the smoke plume was grayed out as this part was identified as a cloud, and no aerosol retrieval was attempted. In addition, the areas surrounding the grayed out pixels were removed because the official products of JAXA set the upper limit of the AOT at 5.0. This confusion between thick aerosols and clouds, combined with the AOT retrieval limit, is often present in operational processing systems and poses a challenge for the study of SBBA plumes. The direct detection of SBBAs using the indices AAI ≥ 1.1 and PRI ≥ 1.2, based on the SGLI’s near-ultraviolet and polarization channels, alleviated this challenge, as shown in Figure 1c,d [11]. Figure 1e shows the SBBA candidate areas defined by the condition AAI ≥ 1.0. Clouds were not excluded, and the peripheries of SBBA areas were included in our retrieval process as long as they satisfied the AAI ≥ 1.0 condition. The reason for this is that we were searching for areas where clouds and aerosols were confused or even misconstrued [15], and we also intended to capture BBAs that were sufficiently dense without strictly satisfying the SBBA requirements [12].

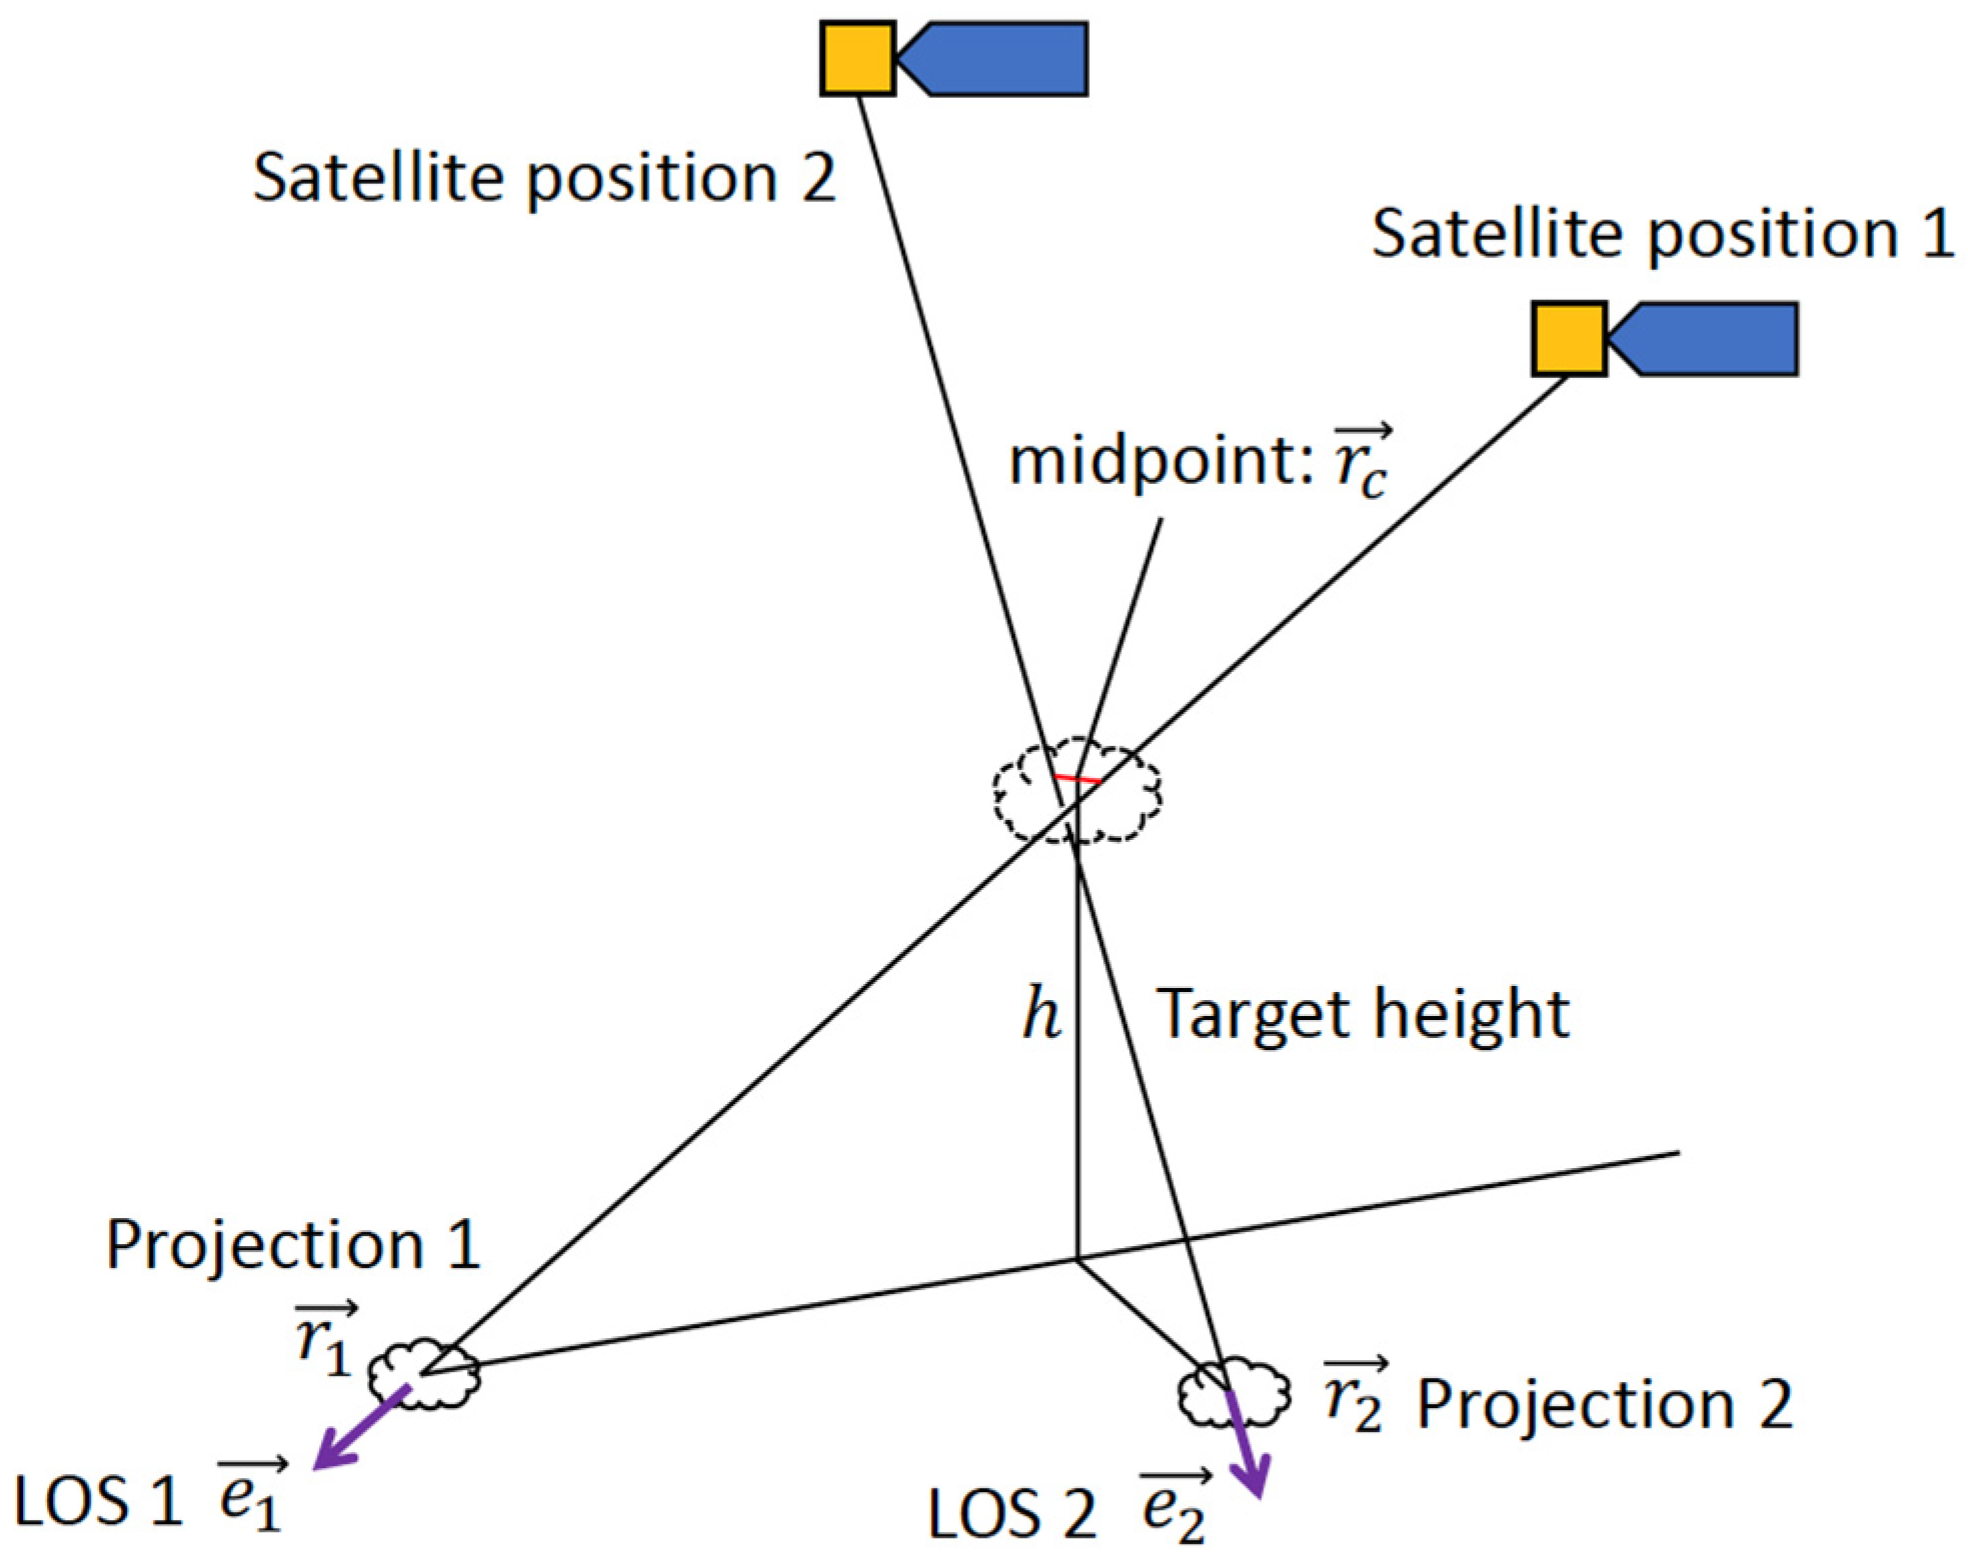
2.2. Estimating Target Height from the SGLI Multi-Directional Data

The polarization channels of the SGLI use dedicated optics mounted on the spacecraft via a tilt mechanism. Combined with downward-looking multi-spectral R-only optics, tilted polarization optics enable global two-directional R measurements. Figure 2 shows a schematic of this capability.
The tilt mechanism rotates the polarization optics in the along-track direction, allowing them to point at an arbitrary tilt angle. In the standard operation configuration, the tilt angle is fixed at +45° in the Northern Hemisphere and −45° in the Southern Hemisphere. As the SGLI travels from north to south on the day side of the orbit, a forward-to-backward switch is programmed near the equator. In the Northern Hemisphere, a ground target is first measured by forward-tilted polarization optics and then by straight-downward-looking R-only optics approximately 2 min later. In the Southern Hemisphere, R-only optics first measure a ground target, followed by backward-tilted polarization optics.
In addition, multi-directional polarization measurements are performed below the zone of tilt switching as the switching is fast enough to measure the same ground target immediately before and after.
From the global two-directional data measured by the SGLI, the target altitude was estimated using the following procedure. First, a reflectance image at 674 nm measured using R-only optics was projected onto the reflectance image measured using polarization optics. The area satisfying the SBBA candidate condition (AAI > 1.1) was selected for analysis. The R range in this area was stretched to fit the 8-bit value range (0–255), and the histogram was equalized. After preprocessing the images, the scale-invariant feature transform (SIFT) method was applied to identify feature points [23]. The detected feature points were paired based on the similarity of the surrounding pixels, and the three-dimensional position of the target was estimated from the coordinates and geometric information provided by the SGLI Level 1B products.
Figure 3 shows a schematic of the target position estimation from a pair of ground projections: Projections 1 and 2. The positions of projections r 1 and r 2 , as well as the measurement line-of-sight (LOS) vectors e 1 and e 2 , were obtained from the geometry information of the SGLI Level 1B product. In theory, two LOSs intersect at the target position; however, errors in the geometric information and feature matching often separate them by a distance up to the spatial resolution of the image. Therefore, we selected the midpoint of the line that joined the two LOSs at the minimum distance as the best estimate of the target position. The midpoint position was computed using the following equation:
r c = 1 2 r 1 s   e 1 + r 2 t   e 2 ,
where s and t are parameters computed as follows:
s = e 1 e 2 e 1 e 2 r 1 r 2 1 e 1 e 2 2
t = e 2 e 1 e 1 e 2 r 2 r 1 1 e 1 e 2 2 .
Projection pairs with minimum distances exceeding 500 m were excluded from further analysis.

2.3. Synergistic Use of Regional Numerical Model and Other Measurements

The wildfire-origin aerosol simulation results of the CTM were validated using the BBA plume distribution from the SGLI data. A chemical transport model [24] was implemented, and the Scalable Computing for Advanced Library and Environment (SCALE) meteorological model [25,26] results were used for offline calculations. SCALE is a fundamental library in next-generation weather and climate science and is mainly developed at the RIKEN Center for Computational Science. Computation of the wind field was constrained by the initial and boundary conditions of the wind vector, temperature, relative humidity, and atmospheric pressure from the National Centers for Environmental Prediction operational global analysis data. For the surface terrain model, we selected GTOPO30 from the United States Geological Survey, with a spatial resolution of 30 arcseconds. The accuracy of the SCALE winds was found to be reasonable in the present work [11]. We verified the reproducibility of the offline CTM using SCALE by simulation in a Japanese region [27]. The Global Fire Assimilation System [28] was used for biomass-burning emissions to reproduce aerosol distributions of forest fire origin. The simulations were performed at spatial resolutions of 5 km each in latitude and longitude. In the CTM, the plume was injected uniformly into the atmospheric layers from the surface to an altitude of 1 km. The results were compared to the satellite-derived spread of the plume.
As supporting observations, we also used geostationary satellite data from the AHI on Himawari-8, the MODIS Level 2 thermal anomaly fire product, and ground-based sun photometer data from the AERONET.

3. Experiments

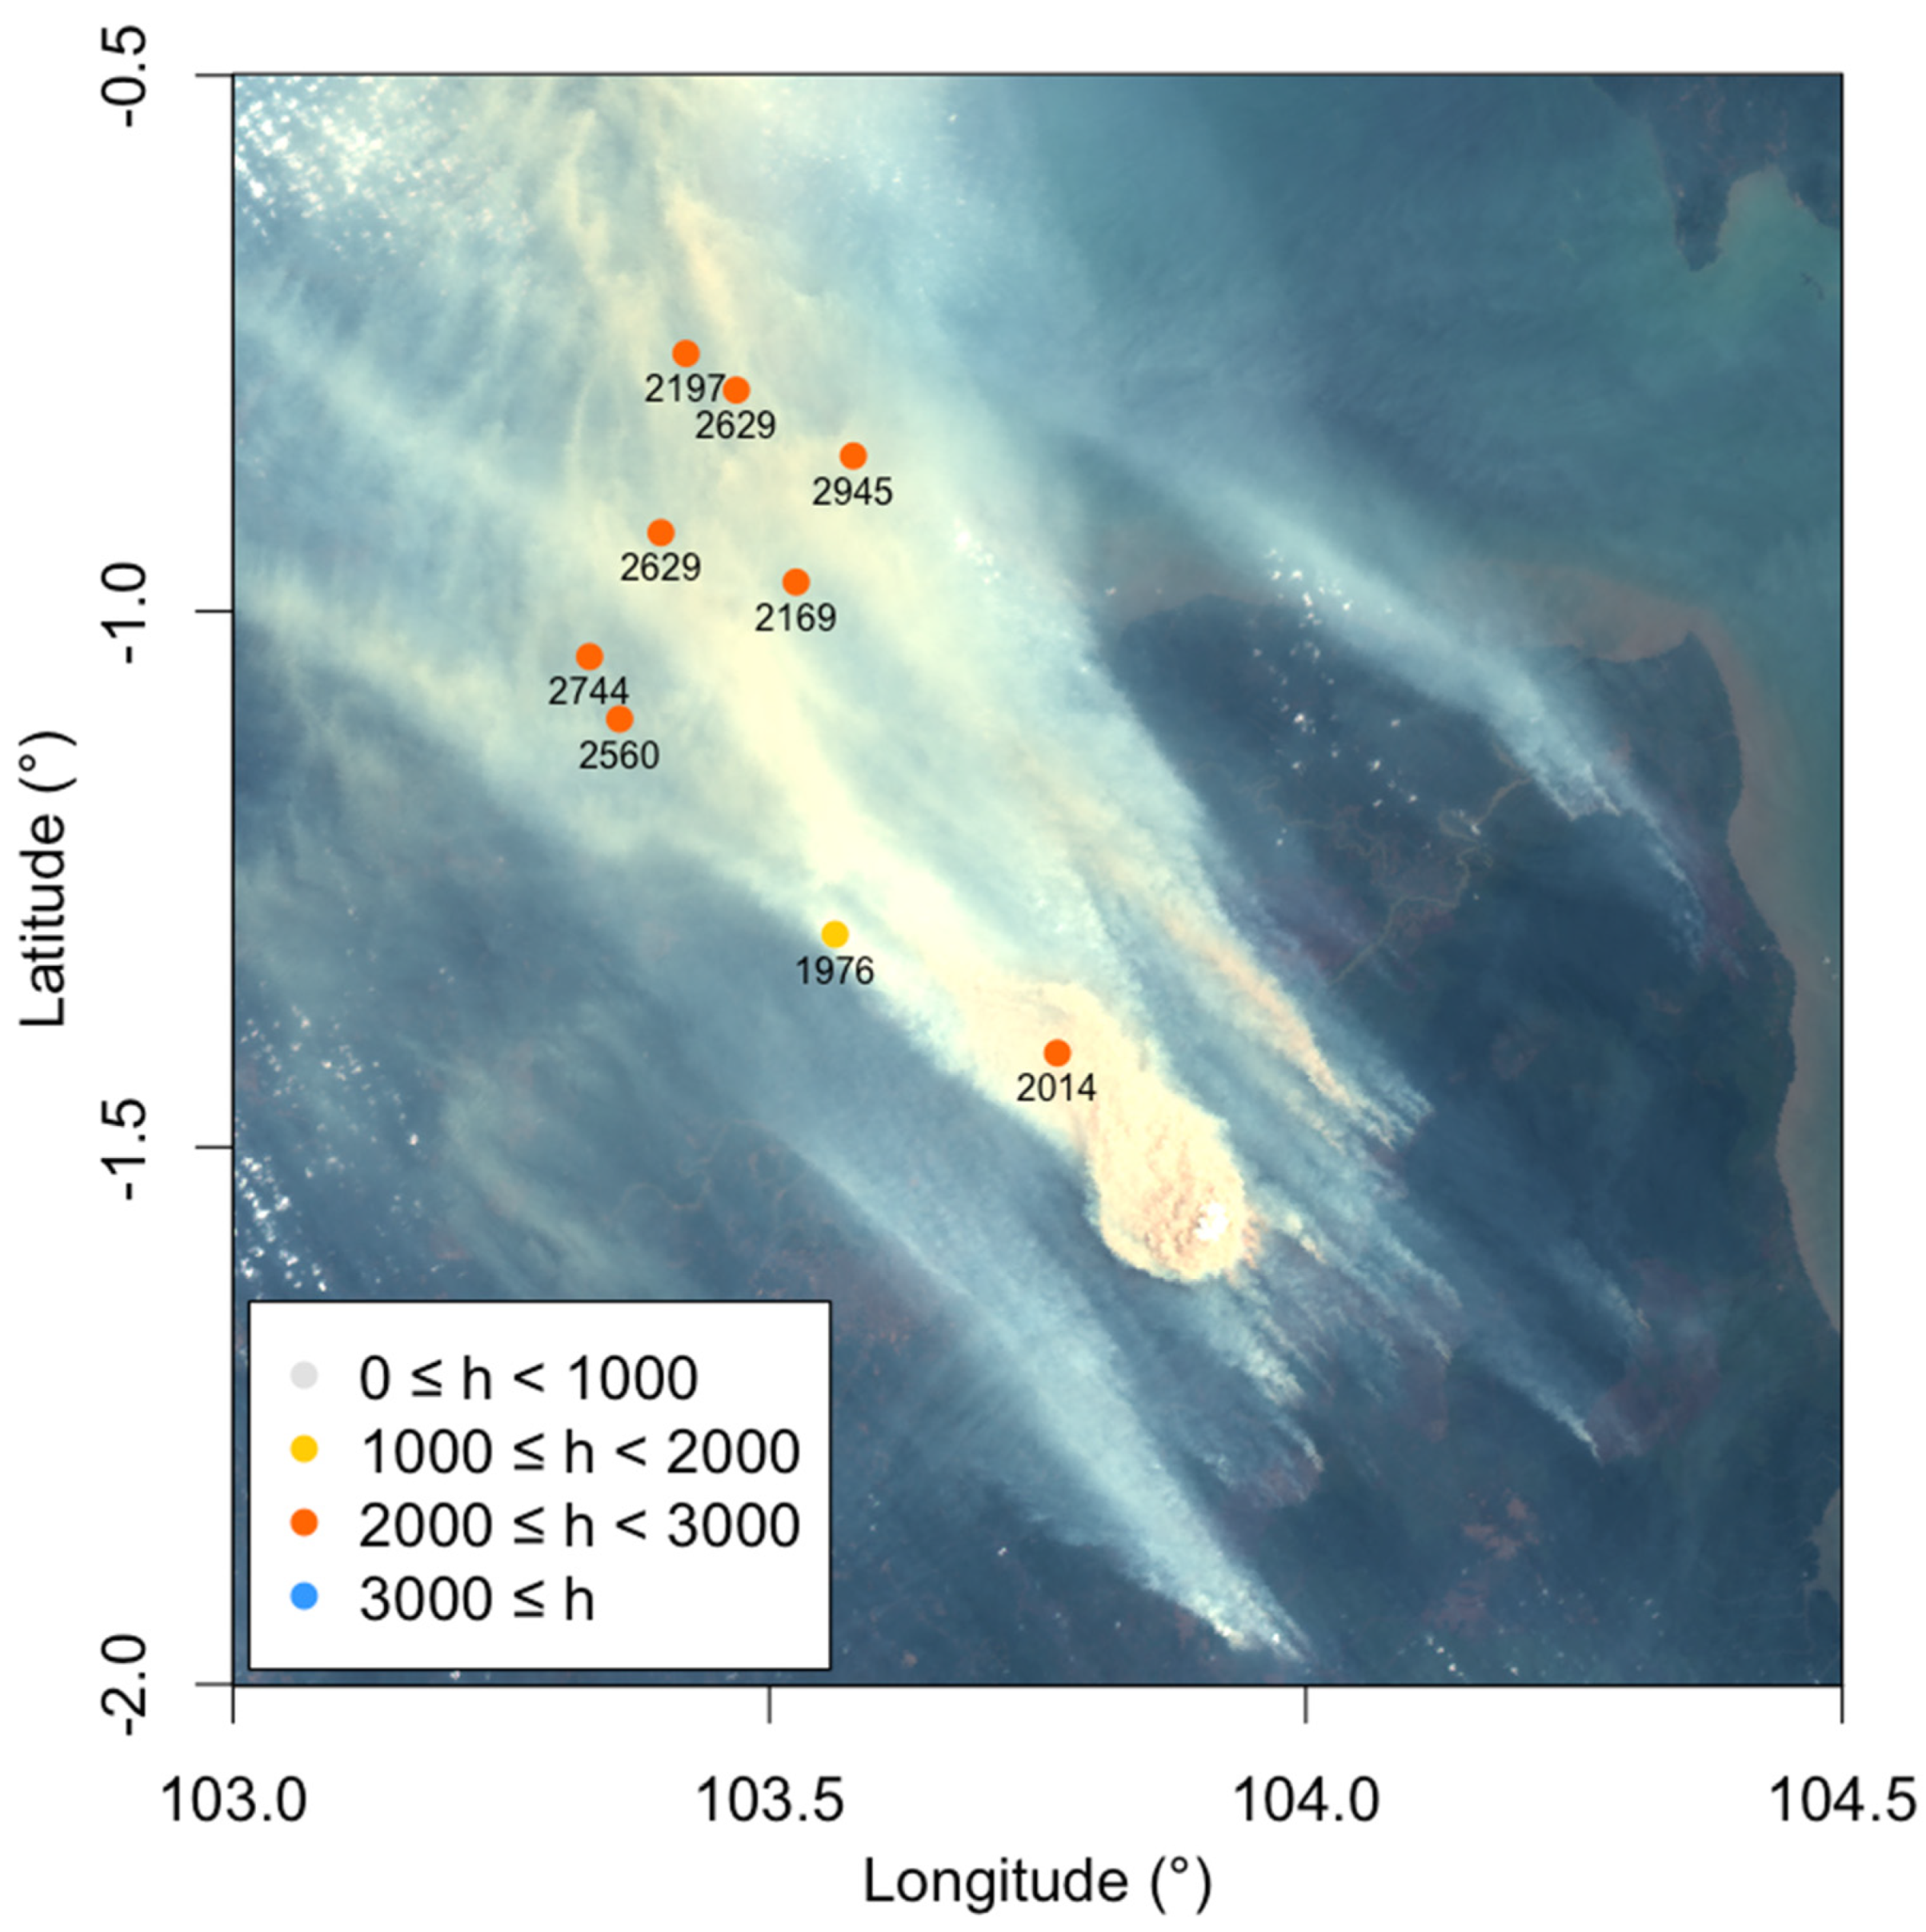
3.1. Sumatran Island in September 2019

3.1.1. Wildfires in Indonesia

One of the targets that satisfied the conditions for our study was Indonesia in September 2019. In Indonesia, severe wildfires usually peak during the dry season from July to October. This slash-and-burn practice causes peat fires that emit significant amounts of BBAs. The haze spreads to Malaysia, Singapore, the south of Thailand, and the Philippines and causes widespread air pollution and associated respiratory and other health hazards [29,30]. This region was selected for analysis because of its high atmospheric impact and large number of measurements. Smoke evolution was monitored using an AHI instrument on the Himawari-8 geostationary satellite.
Figure 4 shows the accumulated hotspot map for September 2019, derived from the MODIS Level 2 Thermal Anomalies/Fire product (MOD14, Collection 6) [31]. Hereafter, equal longitude and latitude projections were used for the presented maps. Figure 4 shows that Indonesia experienced several large-scale wildfires in September 2019, particularly in Sumatra and southern Kalimantan.
Figure 5 shows a topographic map of Indonesia. The small black squares denote AERONET stations (Jambi, Pontianak, and Palangkaraya). The intense wildfire area near the Jambi station is represented by a black square and is further expanded on the left side of the figure. The topographic information of the area shows that the fire was not in the alpine forest but at a height of several hundred meters. This implies that the observed hotspots near the Jambi station are likely well-known peatland fires [30].
The SGLI overpass, on 21 September, 2019, captured one of the intense wildfire events in this area. Figure 6a shows the color composite image (R, G, B) = (674, 530, 443) with hotspots on 20 and 21 September as red and orange dots, respectively. As the overpass time was 03:30 UTC (10:30 local Jakarta time), the hotspots on 20 September may be responsible for some parts of the observed BBA distribution. Figure 6b,c show AAI and PRI, respectively. As described in Section 2.1, the pixels satisfying AAI ≥ 1.1 and PRI ≥ 1.2 indicate the possible presence of SBBAs. Figure 6 demonstrates that this wildfire produced a large amount of BBAs and heavy smoke. The upper and lower images in Figure 6a represent instances with and without clouds, derived from the SGLI L2/version 2 product, respectively. Both images clearly show a mixture of clouds and dense smoke. In other words, it is a difficult and meaningful task to distinguish between the two.

3.1.2. Significance of Simultaneous Observation of Polarized and Un-Polarized Light

In this subsection, we compare the total R and polarized radiance (PR) measured by the SGLI. Figure 7 presents additional data in the same domain as shown in Figure 6. Figure 7a shows the AOT values at 500 nm obtained from official JAXA SGLI Level 2 products. Figure 7b,c show the histograms of the R and PR at 674 and 869 nm, respectively, for the same scene, excluding the pixels identified as cloudy by the official JAXA SGLI Level 2 cloud mask product. The excluded pixels are shaded in gray in the other panels. Figure 7d,d’ show R and PR at 674 nm, and Figure 7e,e’ show R and PR at 869 nm.
As shown in Figure 7, both the R and PR at 869 nm were larger than those at 674 nm, and it is possible that their respective images did not considerably affect the distribution pattern. For example, all R and PR images show a clear reflectance peak near the fire, but the stretch of the plume appears to be different in all four images. The PR image at 674 nm does not show a clear stretch of the plume, the PR image at 869 nm marks the southwestern boundary, and the R images identify the thickest part of the plume. In addition, the blob of the plume in the left center of the figure is evident in the color composite and R images but not in the PR image at 674 nm. Such differences between R and PR images, manifesting as a difference in the location and shape of the plume, indicate the effectiveness of simultaneous observations of R and the polarization of the SGLI. Thus, PR and R have different sensitivity characteristics [13].
This is due to the high sensitivity of the PR image to the presence of small particles in the first few optical thicknesses from the top of the plume. Small aerosol particles produce polarization, which is quenched by multiple scattering. For small aerosol particles to effectively polarize the reflectance, they must be present in a small optical thickness from the top of the plume. We have shown the relationship between the polarization effect and the mean number of scatterings in a semi-infinite atmospheric model (Appendix A). According to the theory of atmospheric radiative transfer, strong polarization over an SBBA plume indicates the presence of small particles near the top of the plume. This implies that R represents the total column of aerosols accumulated from the surface to the top of the plume, and PR carries microphysical information near the top of the plume. The difference between the R and PR measured simultaneously by the SGLI over the SBBA plume demonstrates the potential of the SGLI to detect vertical variations in aerosol properties.

3.1.3. Estimation of Plume Height from SGLI’s Multi-Directional Data

The plume height was estimated by the method described in Section 2.2 from the two-directional data acquired, as shown in Figure 2. Focusing on the fire source of the Sumatra wildfire on 21 September, 2019, the estimated plume height values according to Equations (1)–(3) are presented in Figure 8.
The estimated plume top heights were mostly between 2000 and 3000 m. At this vertical level, the CTM predicted that the wind would transport the plume to the northwest, as observed by the SGLI. The plume height appeared to be stable from the source to the tail, although it was not accurately measured near the plume source. The difficulty in plume height estimation near the source arises from the limited width of the plume and the spatial scale of the plume texture. Figure 8 clearly shows the fine texture of the plume top; however, the polarization image failed to capture most of them. This challenge is discussed in detail in Section 4.
To place this SGLI measurement in a temporal context, Figure 9 presents sequential images observed by the Japanese geostationary satellite Himawari-8/AHI over Sumatra on 21 September 2019, and the lower left panel shows the AERONET measurements at the Jambi station. Comparing the AHI images with the SGLI images observed simultaneously over the same area presented in Figure 6a, the fine spatial resolution of the SGLI is clearly visible. However, it can be observed from the sequential AHI data in Figure 10a that the wildfire continued to intensify after the SGLI overpass (03:30 UTC). The time variation provides details of spatial changes, such as the diffusion and advection of BBA particles, as expected from the results in Figure 9a. This tendency coincides with the ground-based AERONET measurements shown in Figure 9b. This strongly suggests that the integrated use of multi-satellite and ground-based observation data is very effective in elucidating aerosols.

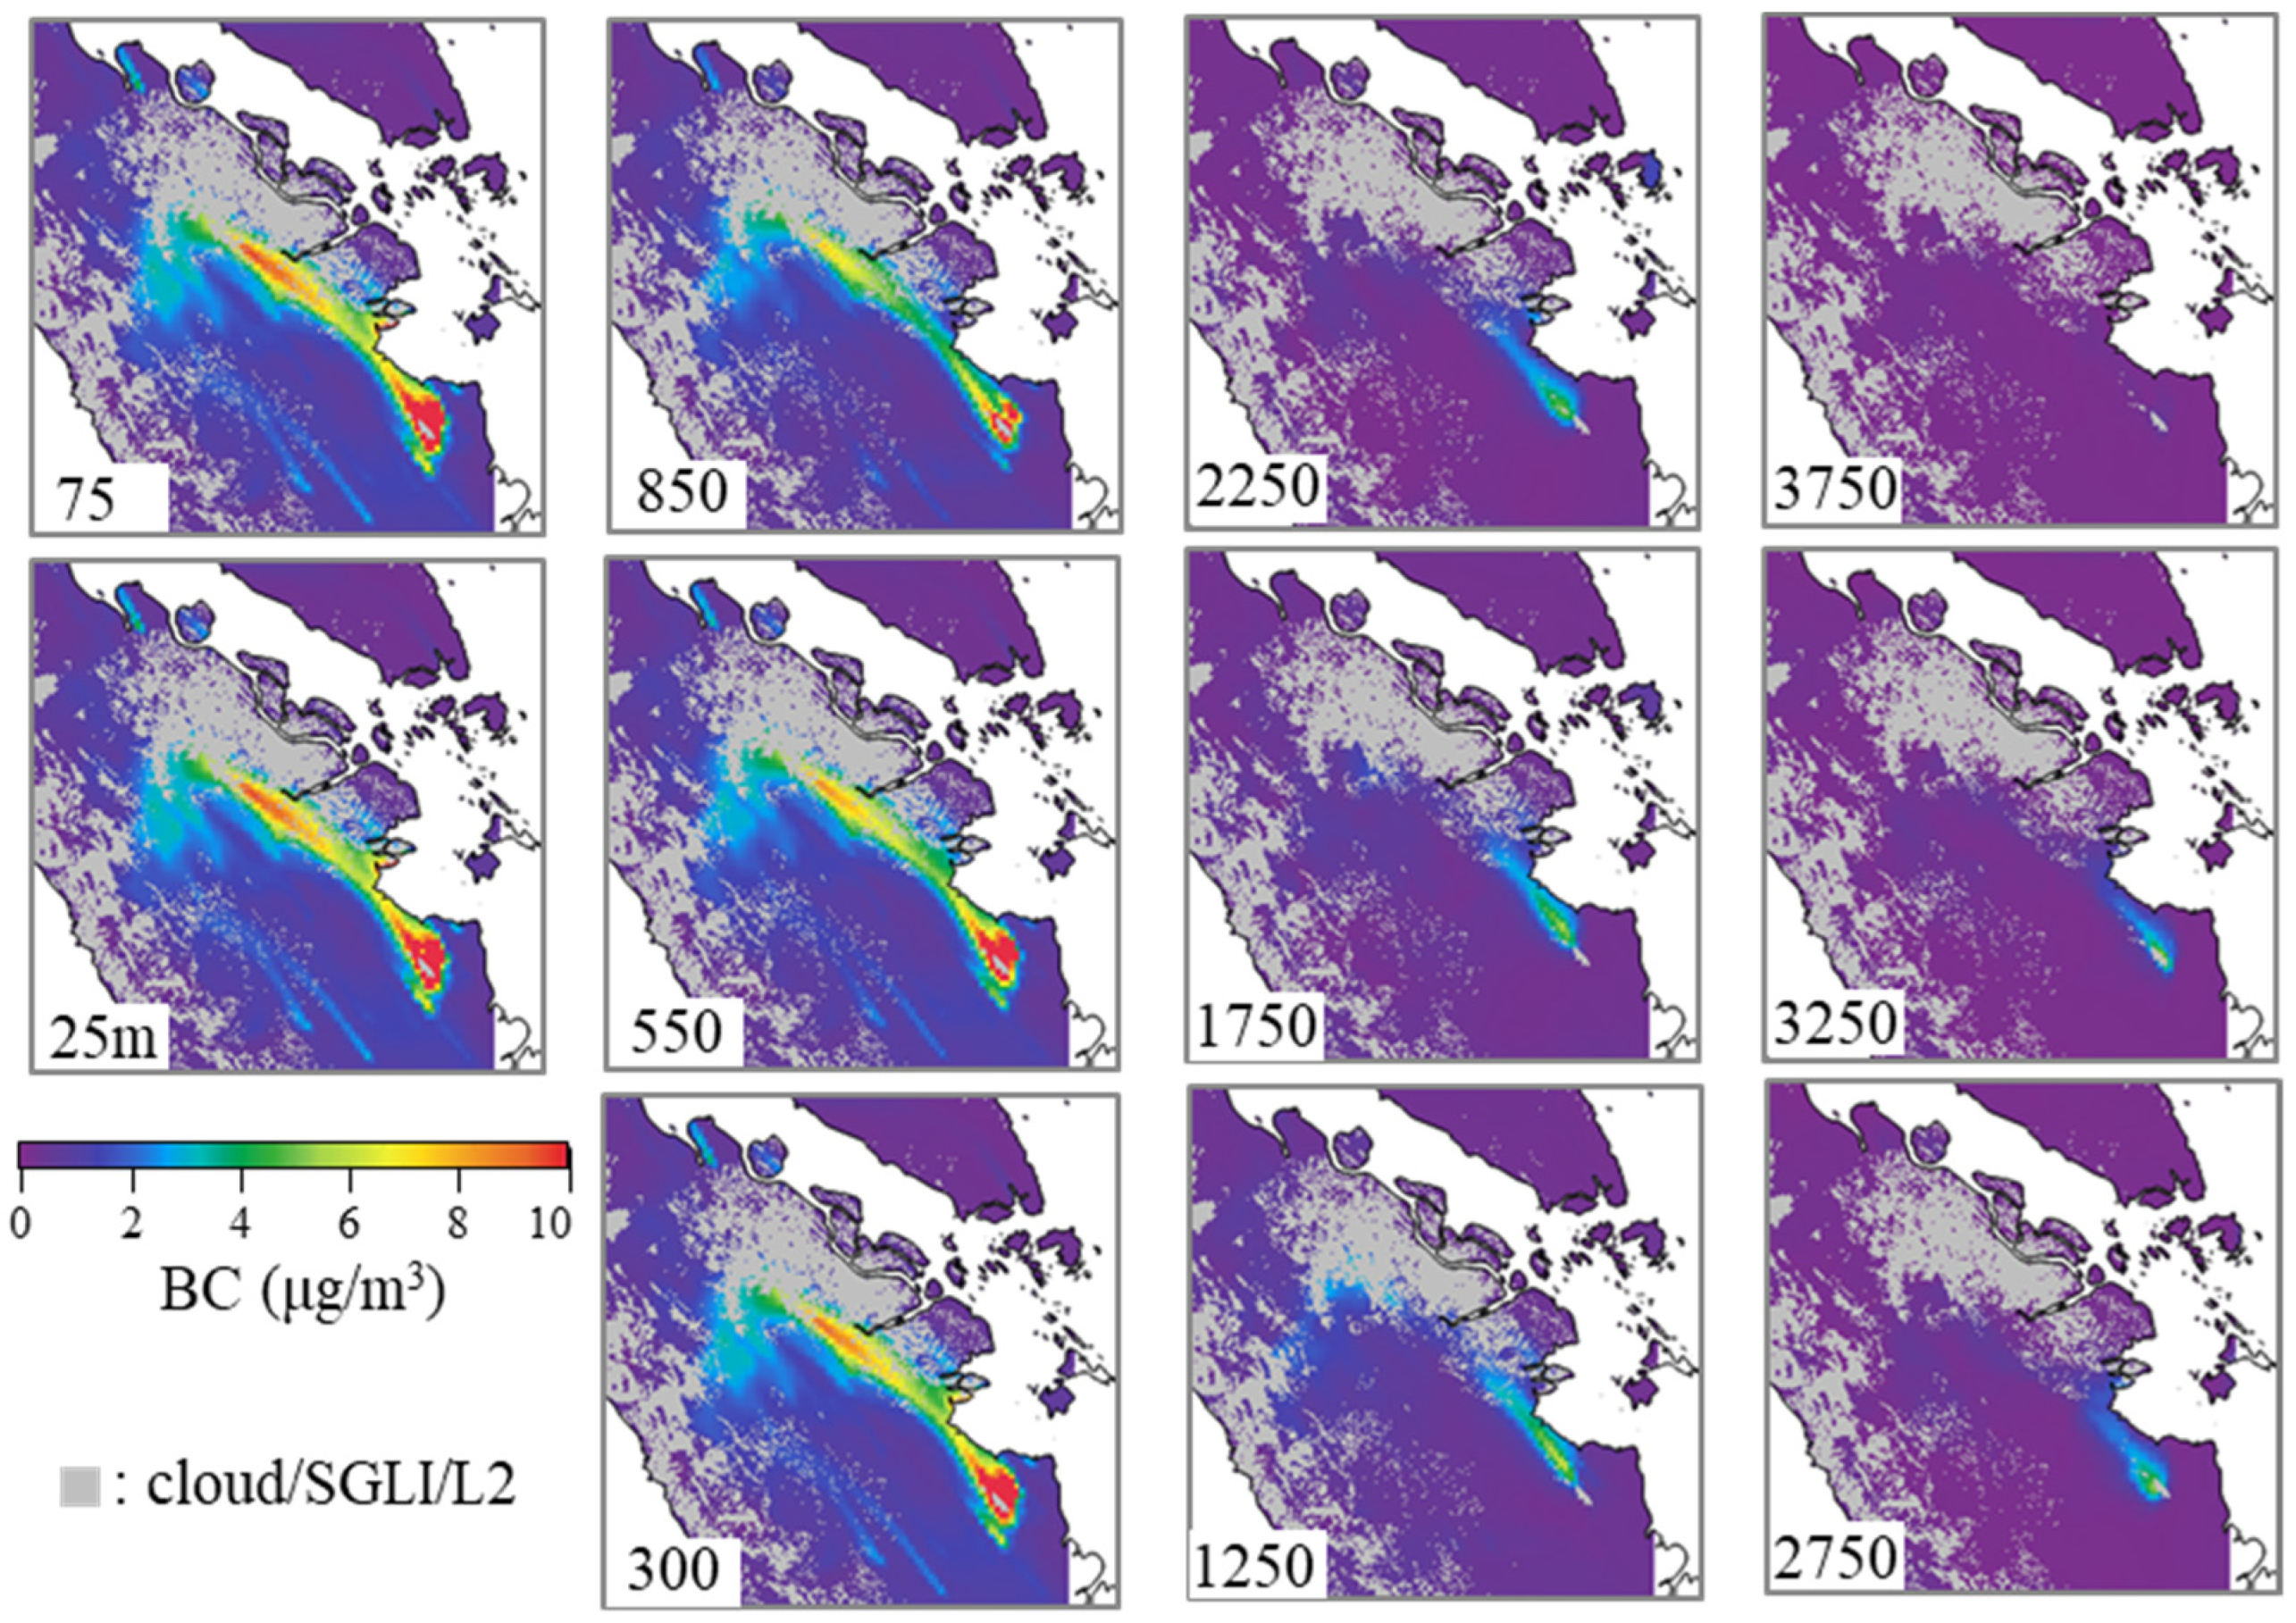
3.1.4. Simulation by the Regional CTM

We compared and verified the forest fire origin aerosol distributions simulated by the CTM using BBA distributions derived from SGLI data. Figure 10 presents the black carbon (BC), a typical aerosol of fire origin, concentration (μg/m3) derived from the CTM at a 5 × 5 km resolution at various altitudes in meters. The gray-shaded areas are cloudy pixels identified using the SGLI Level 2 cloud mask product (version 2). Here, because we aimed to compare and refer to the images in Figure 7, we focused on the distribution, i.e., the pattern, rather than the absolute value of the BC concentration. A comparison of the satellite data and CTM simulations showed that the model simulations reproduced the distribution of BC from Eastern Sumatra to the northwest. However, compared with the satellite data, the BC distribution tended not to extend. As shown in Figure 10, the BC concentration decreased slightly from 25 m to 850 m, but there was no significant change in the BC concentration pattern. The BC pattern began to change at 1250 m, and the high BC concentration area was limited to the fire source area in the lower right of the figure at 2750 m. The plume height estimated from SGLI multi-directional data exceeded 2 km from the emission source. The weak spread of BC over the distance may be due to the injection altitude setting in the CTM simulation.

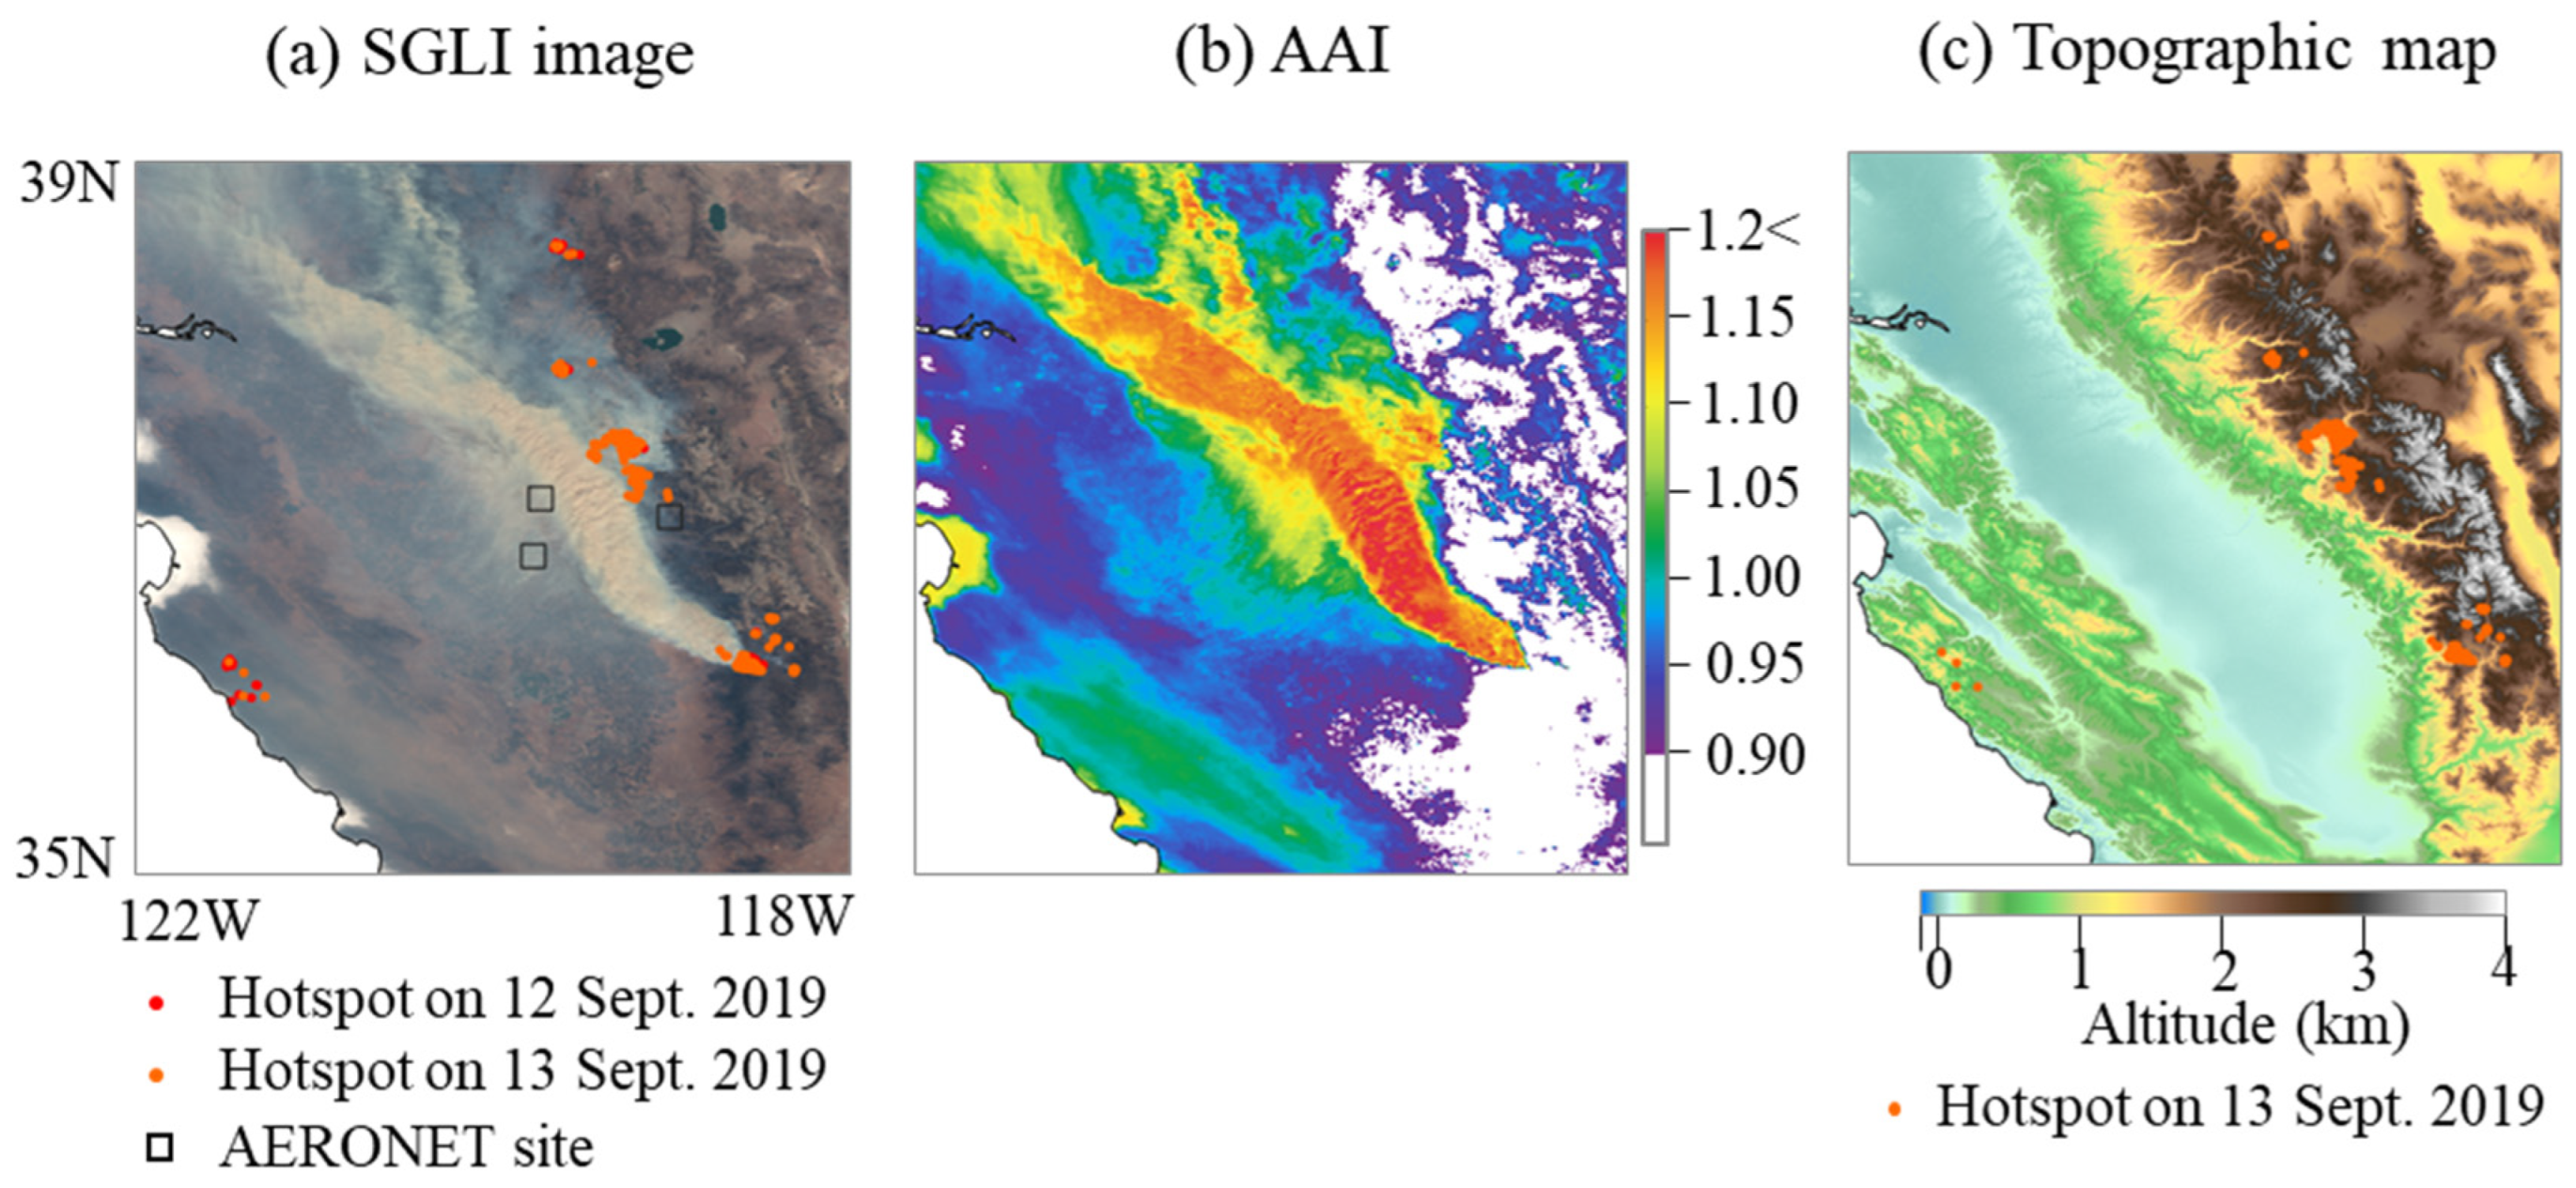
3.2. The West Coast of North America in September 2020

3.2.1. Forest Fire on the West Coast of North America

The method and results mentioned above were applied to forest fires on the west coast of North America to confirm their adaptability and scalability. It is well known that forest fires frequently occur in this region. Figure 11 presents the SGLI observations for 13 September 2020, as shown in Figure 1. For this case study, the optical properties of BBA were retrieved from a previous study [11]. The SGLI Level 2 product classified the central part of the most pronounced brown plume in Figure 11a as a cloud, making it difficult to distinguish heavy aerosols from clouds. Although there was an impressive mass of thick and dense smoke, optically thin BBA areas were observed in the surroundings where the ground surface was visible. This feature is shown in the AAI distribution in Figure 11b. The SBBAs likely exist in the central part of Figure 11b because of high AAI values (AAI ≥ 1.1), and the areas with AAI < 0.9 denoted by a white color correspond to optically thin regions. In particular, a value lower than 0.9 implies significant surface reflection. Figure 11c shows a topographic map. The plume of interest consisted of smoke generated by large-scale forest fires in the mountains in the southeastern part of the figure, flowing along the valley to the west side of the high mountains.

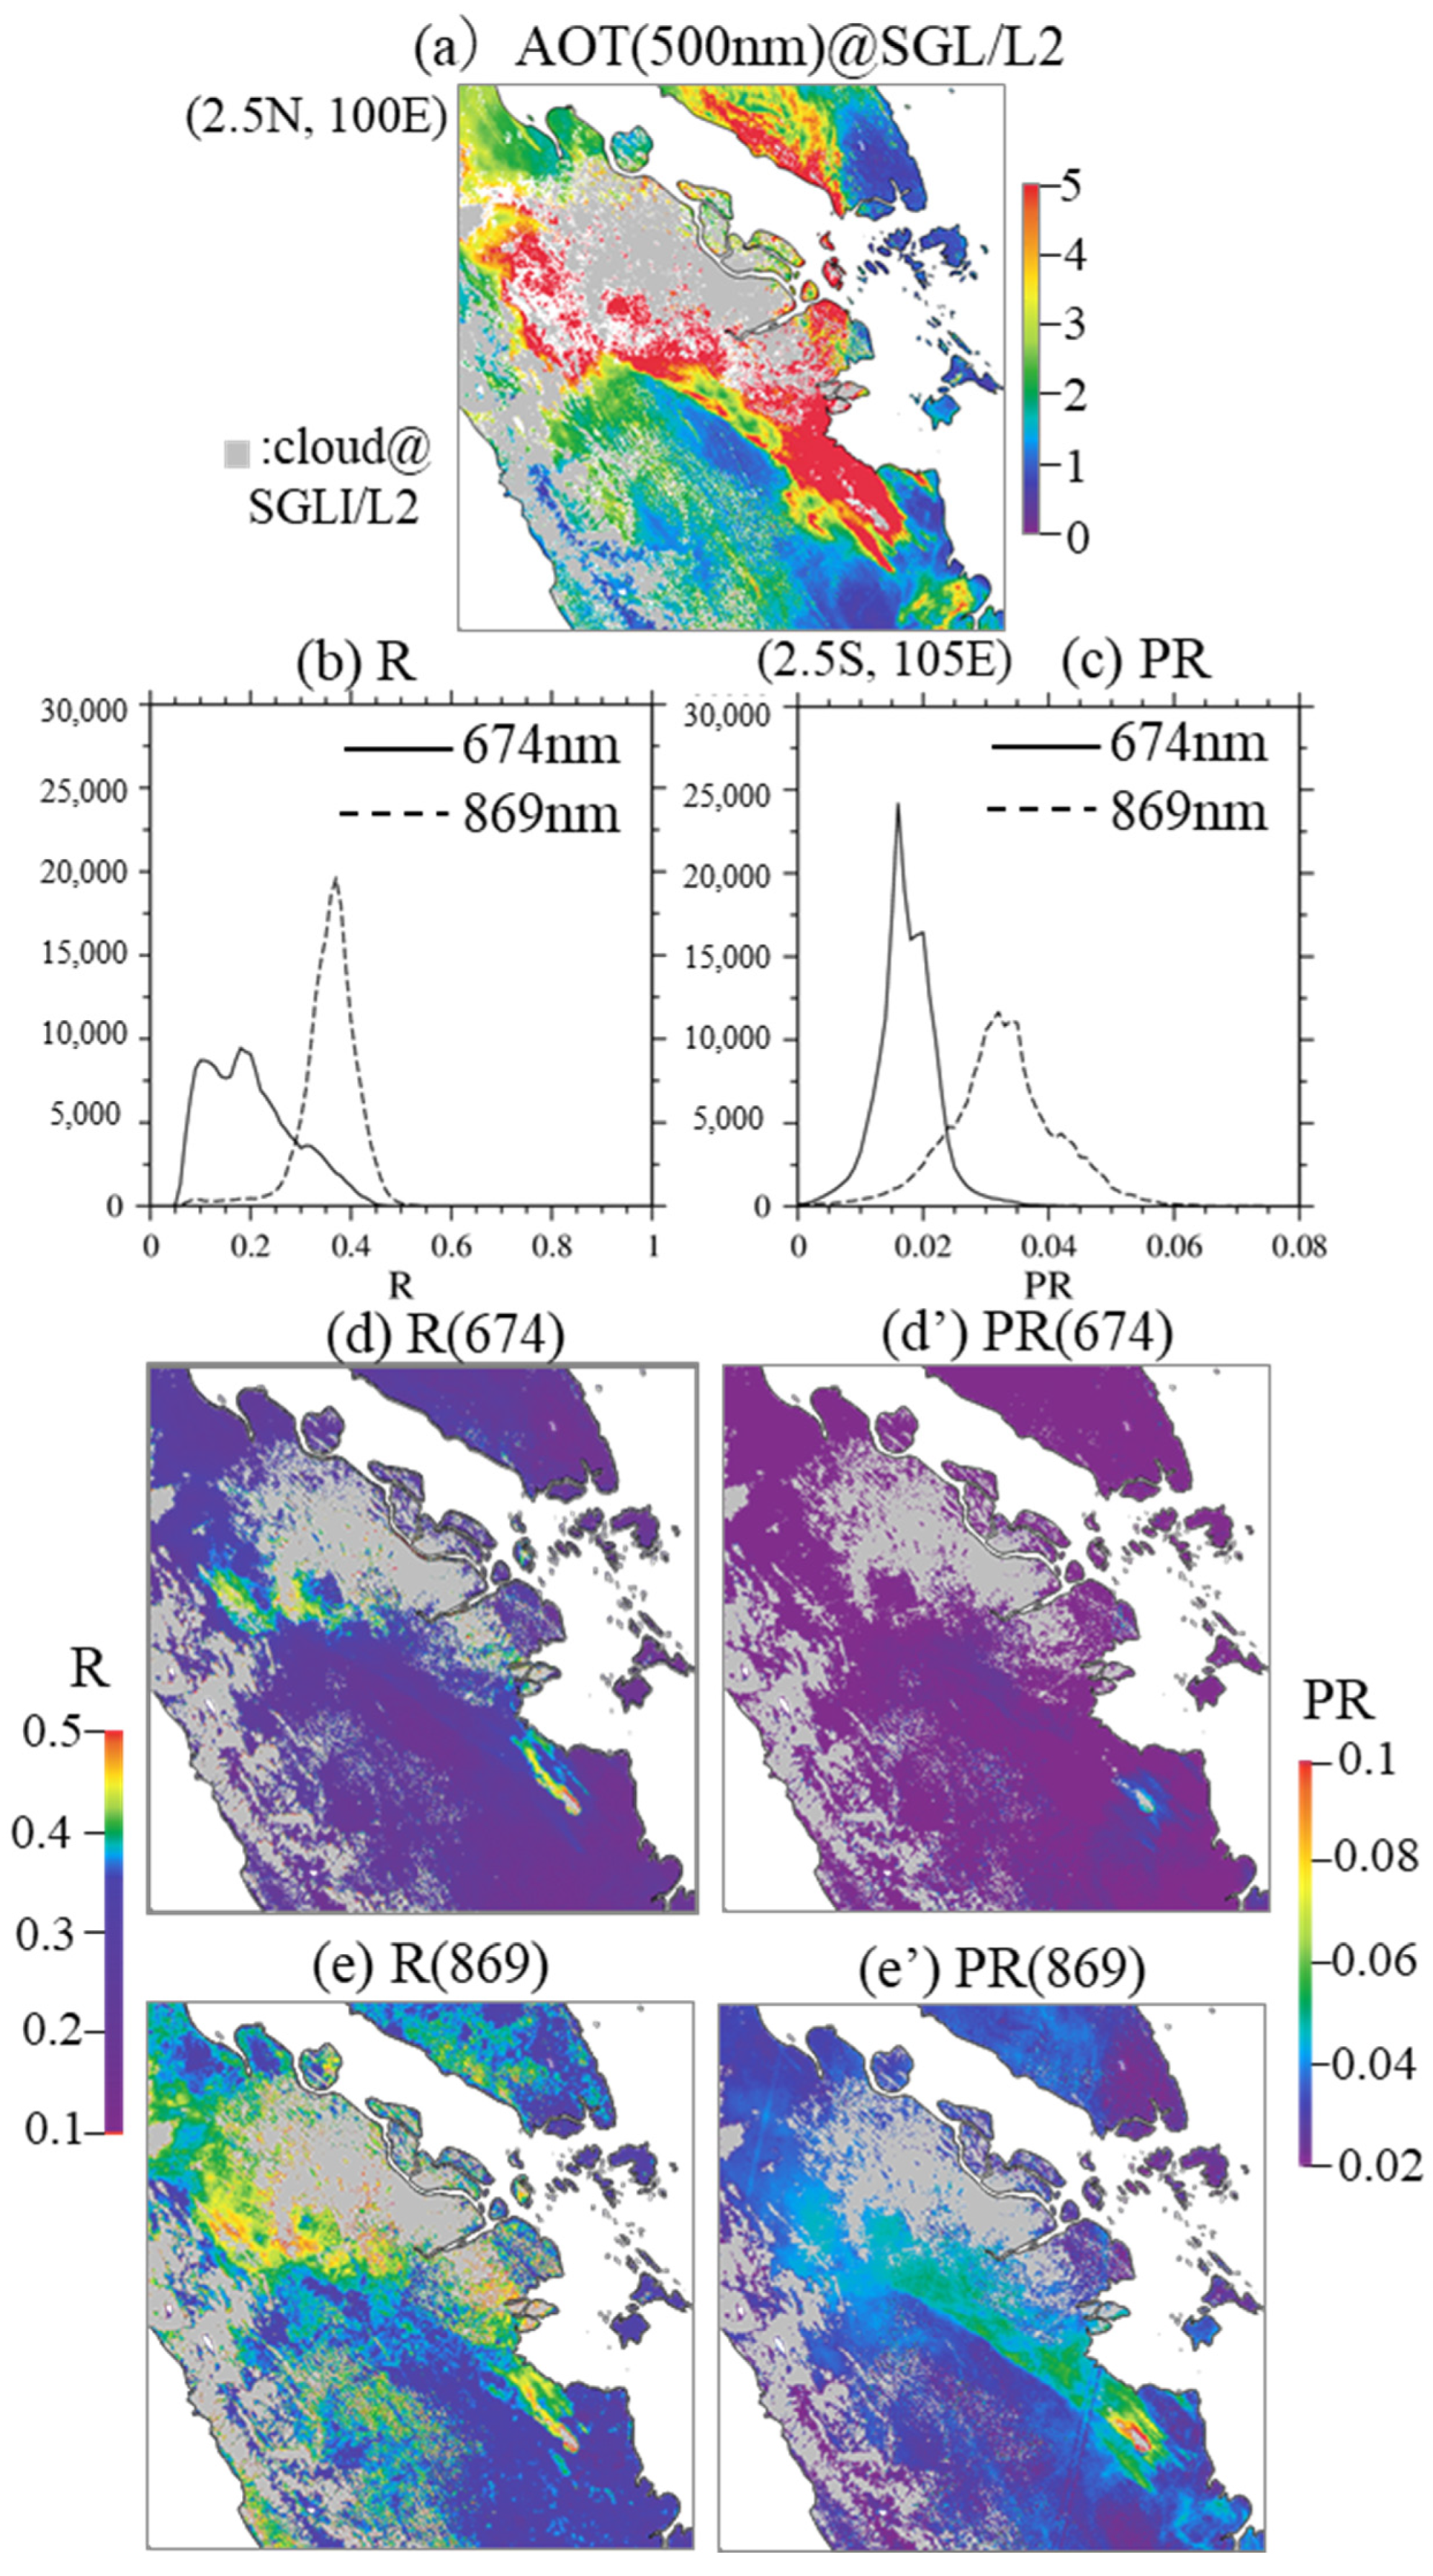
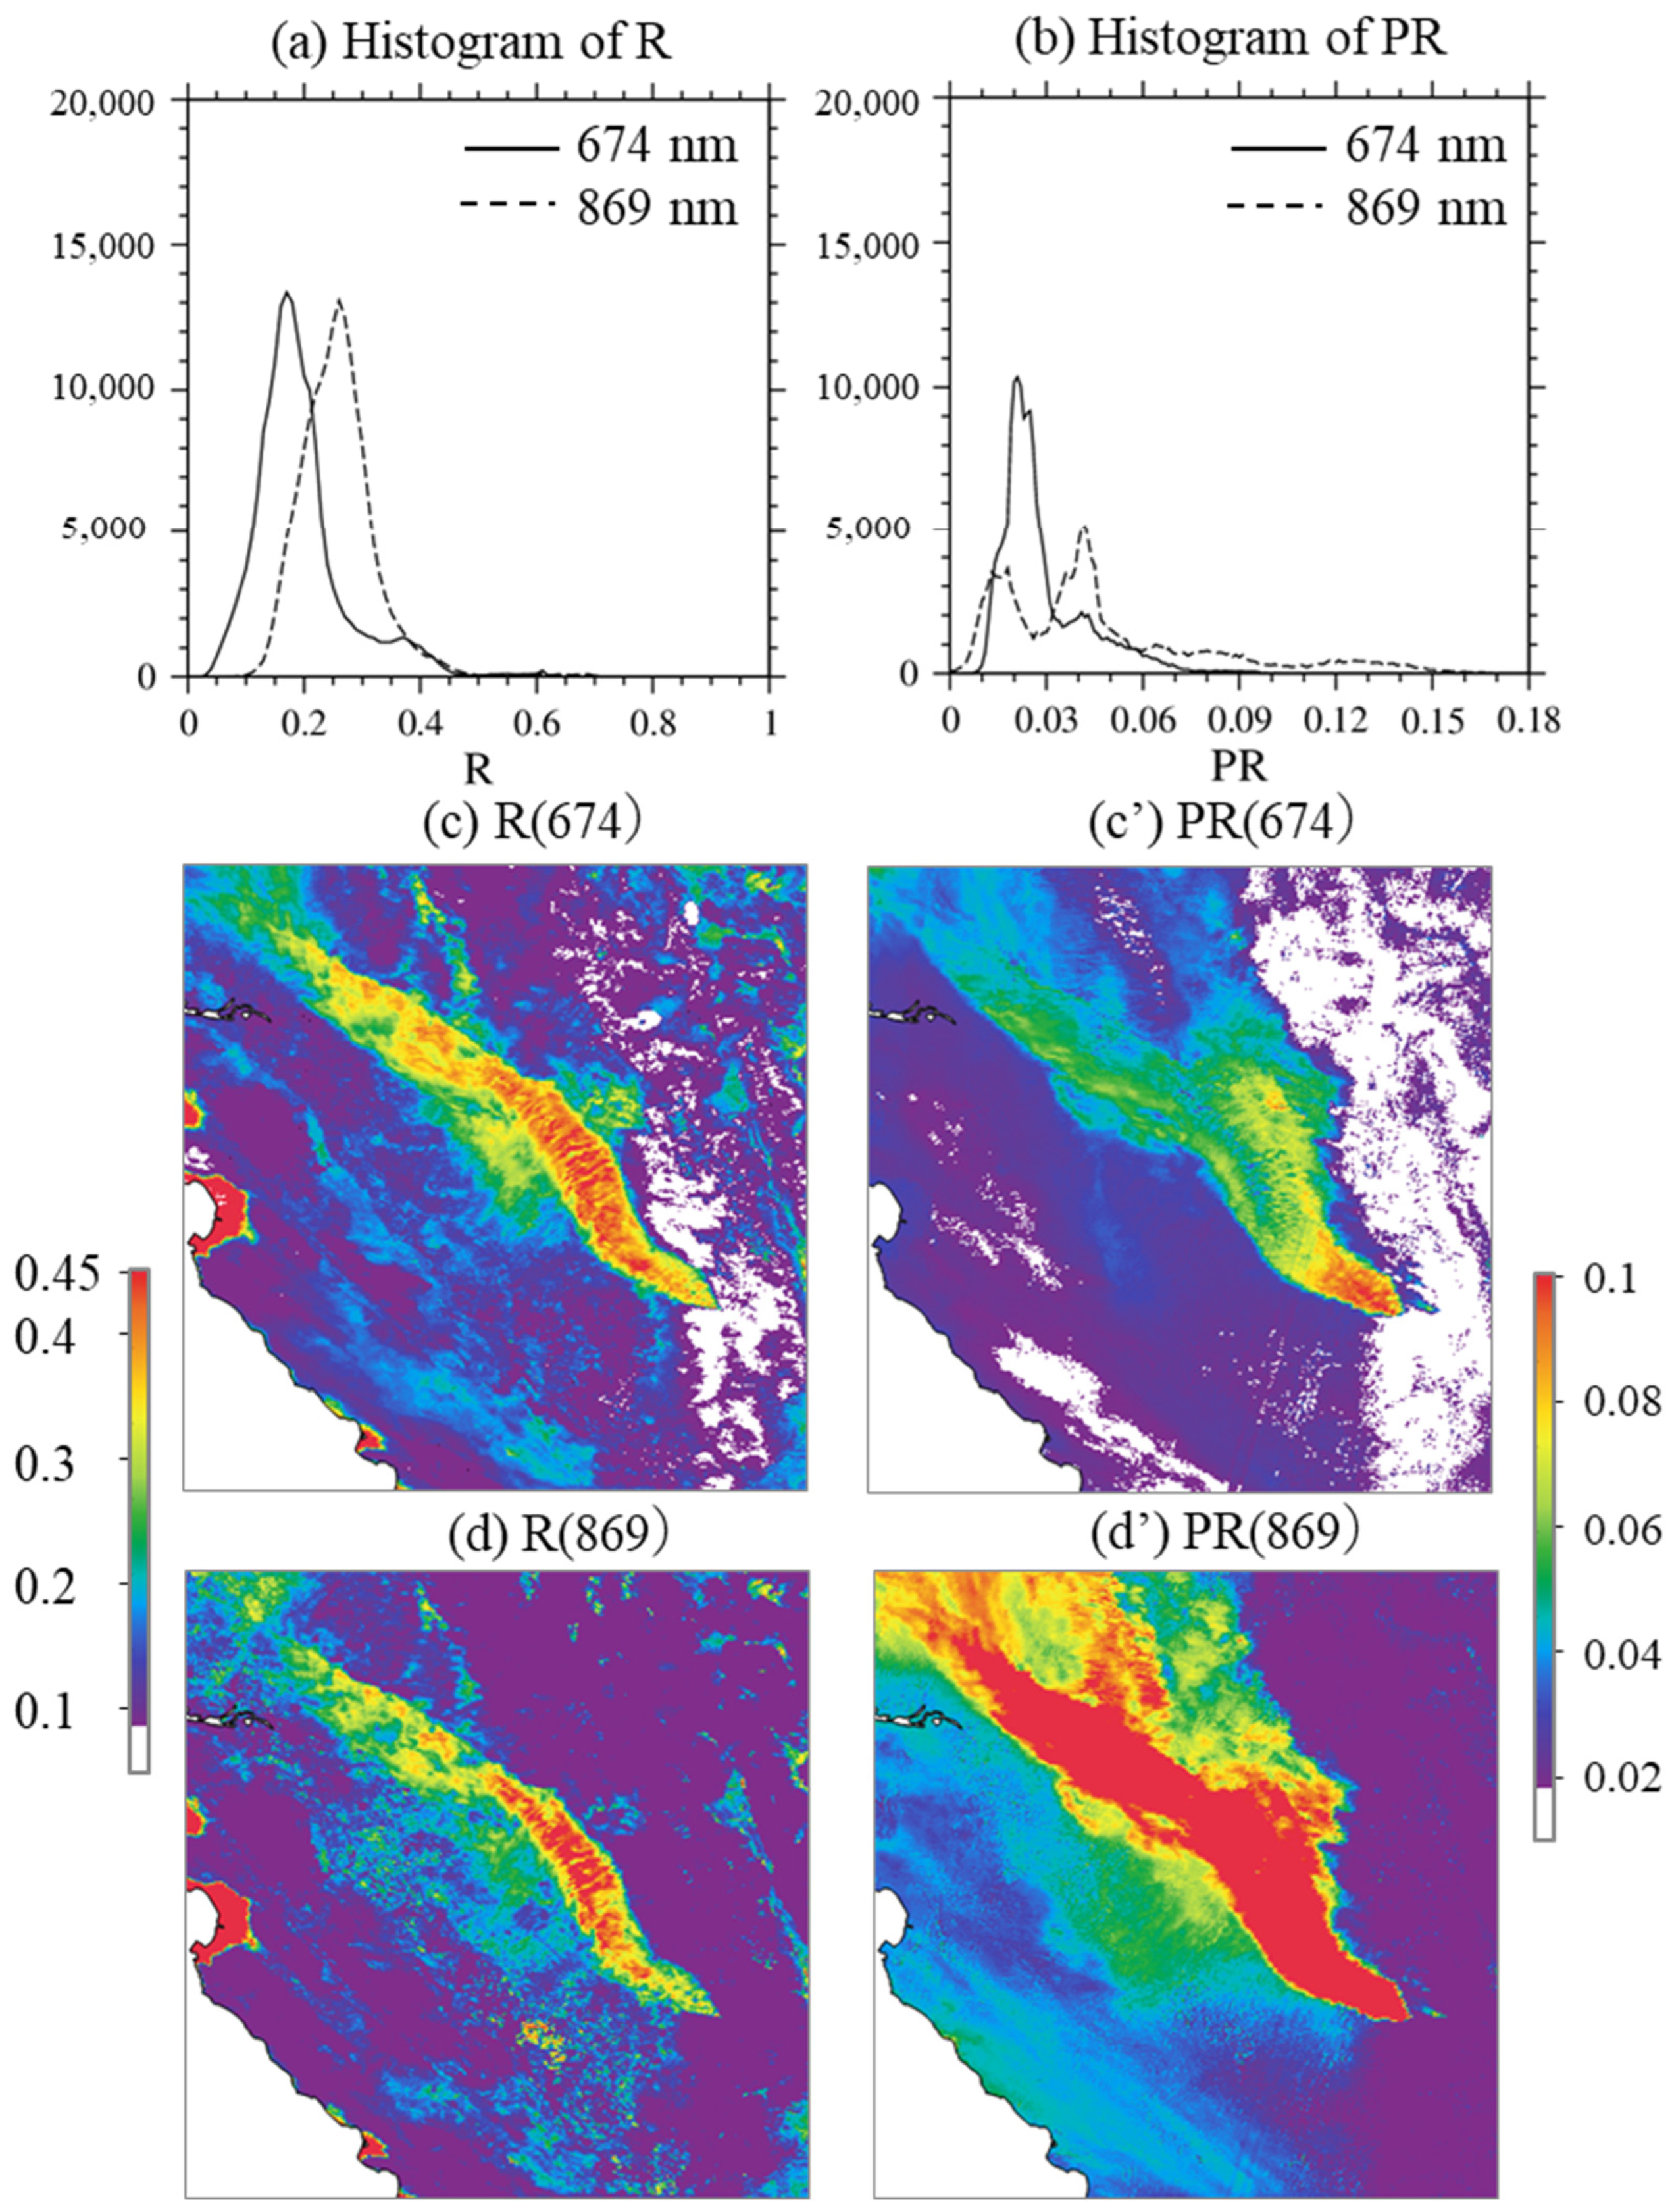
3.2.2. R and PR Measurements

The differences between the R and PR are shown in Figure 12. The histograms of the R values in Figure 12a show a similar distribution, except that the values are shifted. In contrast, the histogram of the PR values in Figure 12b displays a significant difference between 869 and 674 nm. The PR histogram at 869 nm shows multiple peaks that were not observed in the Sumatra case study, as shown in Figure 7c. The different histogram patterns of PR (674) and PR (869) may reflect their different spectral sensitivities to small particles. The longer the wavelength, the smaller the particle becomes with respect to the wavelength, and smaller particles induce stronger polarization. Figure 12c,d show that the Rs at 674 and 869 nm are similar to the brightness of the color composite image in Figure 11a. The smoke plume in question stood out, with high PR values at 674 and 869 nm, as shown in Figure 12e,f. The distribution of the PR at 869 nm (Figure 12d) corresponds to the AAI distribution shown in Figure 11b.
In this case, the meteorological field is complex as the target area is a mountainous region, and the meteorological field may have been affected by the topography. To investigate this, a SCALE simulation of the meteorological field was performed. The mesoscale analysis produced by the National Centers for Environmental Prediction Global Forecast System was used for the initial and boundary conditions of the SCALE. A wind field 10 m above the surface in this complex area has complex implications. The southwestern half of Figure 13(b1) (colored light blue) is the lowest level of the simulation and has altitudes lower than 850 hPa (approximately 1500 m). For this mountainous area in the northeastern corner of the domain, the wind field 10 m above the surface colored light brown in Figure 13(b3) was higher than the 850 hPa level referred to in the topographic map. Figure 13(b4) shows the wind field at the 500 hPa level (approximately 5500 m). The wind fields were then listed by altitude from the lowest to highest as follows: Figure 13(b1–b4).
Figure 13 shows that the wind was northwesterly near the surface of the valley and southeasterly at altitudes higher than 850 hPa (1500 m). BBA particles emitted near the surface travel southeastward along the valley and then turn east and further north as they approach the mountains. The particles may climb along the mountain because of the orographic effect, and the atmospheric disturbance near the mountains because of the strong vertical shear likely enhances vertical diffusion. This complex flow of air near mountains provides favorable conditions for the transport of small BBA particles to higher altitudes in the atmosphere. It is likely that the spread of the plume measured by the PR was significantly wider than that in the Sumatra case, as shown in Figure 12c’,d’.

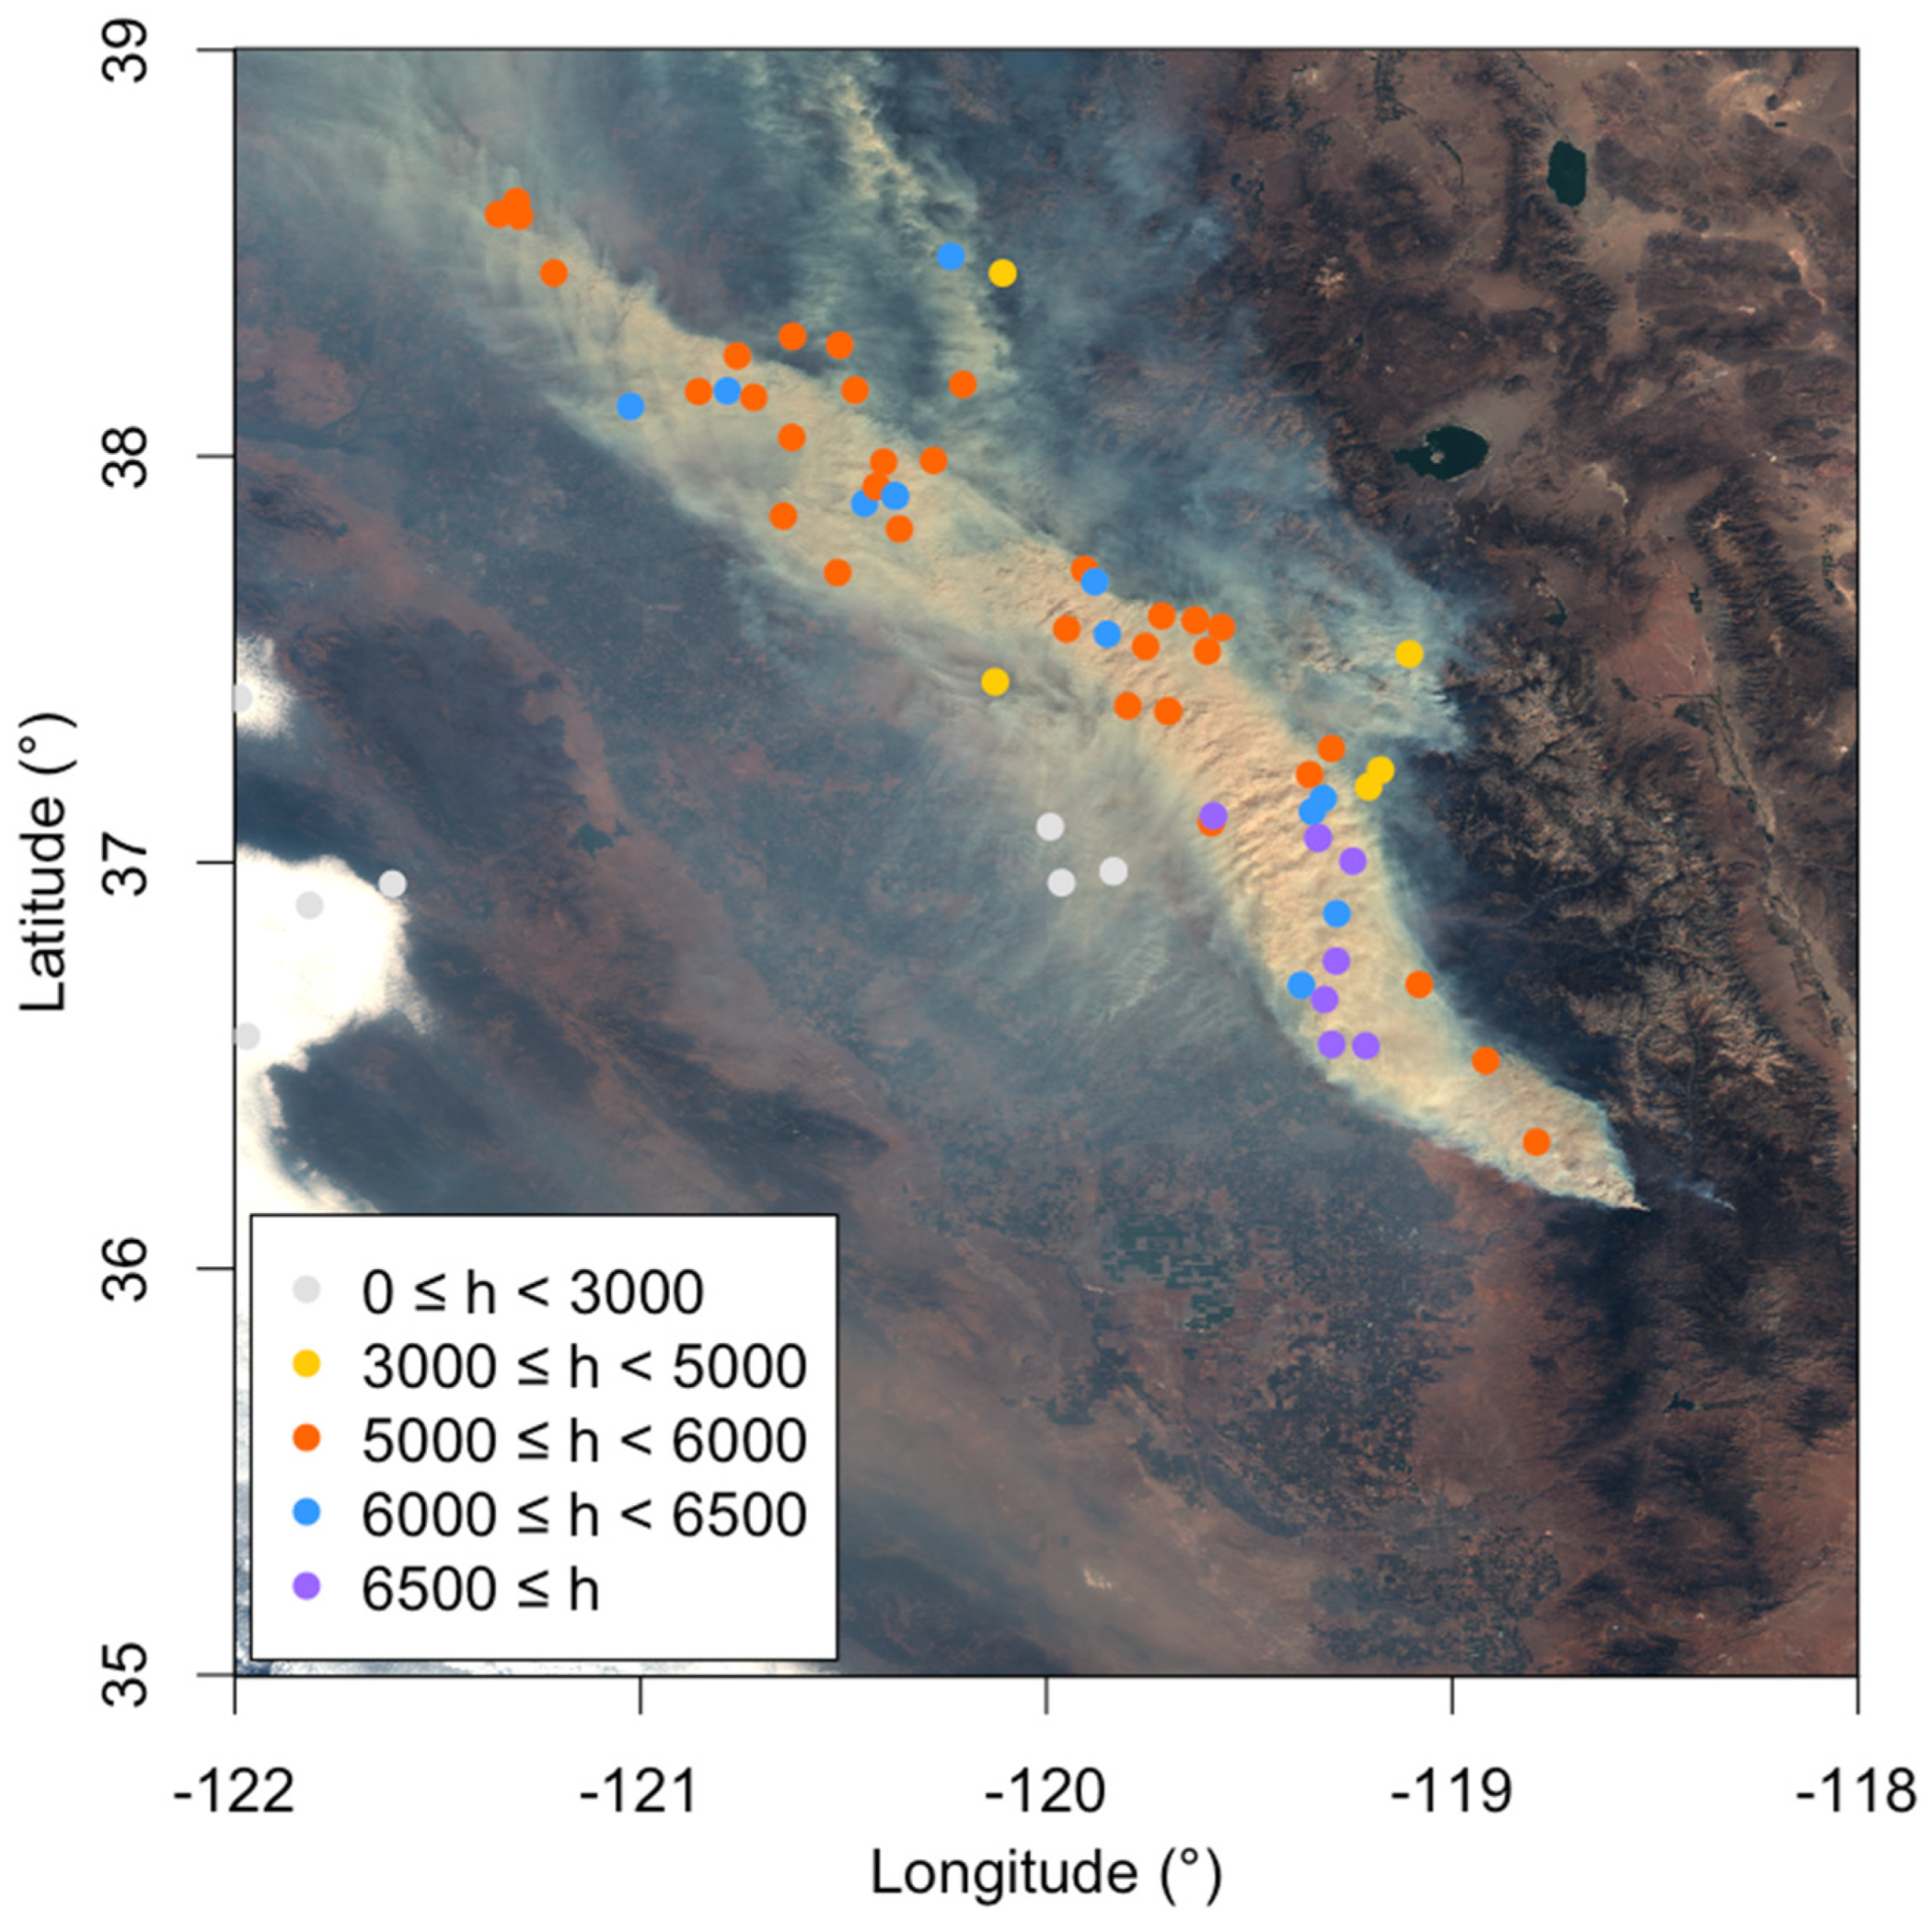
3.2.3. Stereoscopic Plume Height Estimation

The smoke plume height estimation was performed in a manner similar to that described in Section 3.1.3, in the case of the Sumatra wildfires. Figure 14 shows the estimated plume height for the entire smoke image observed by the SGLI, as shown in Figure 11.
The smoke plume was estimated to be higher than 5000 m, as a few points outside the main thick stream showed an estimated height of less than 5000 m. The rising backbone of the plume from area A to B in Figure 15 had an altitude higher than 6000 m, and the highest parts appeared near 36.7°N, with an altitude exceeding 6500 m.

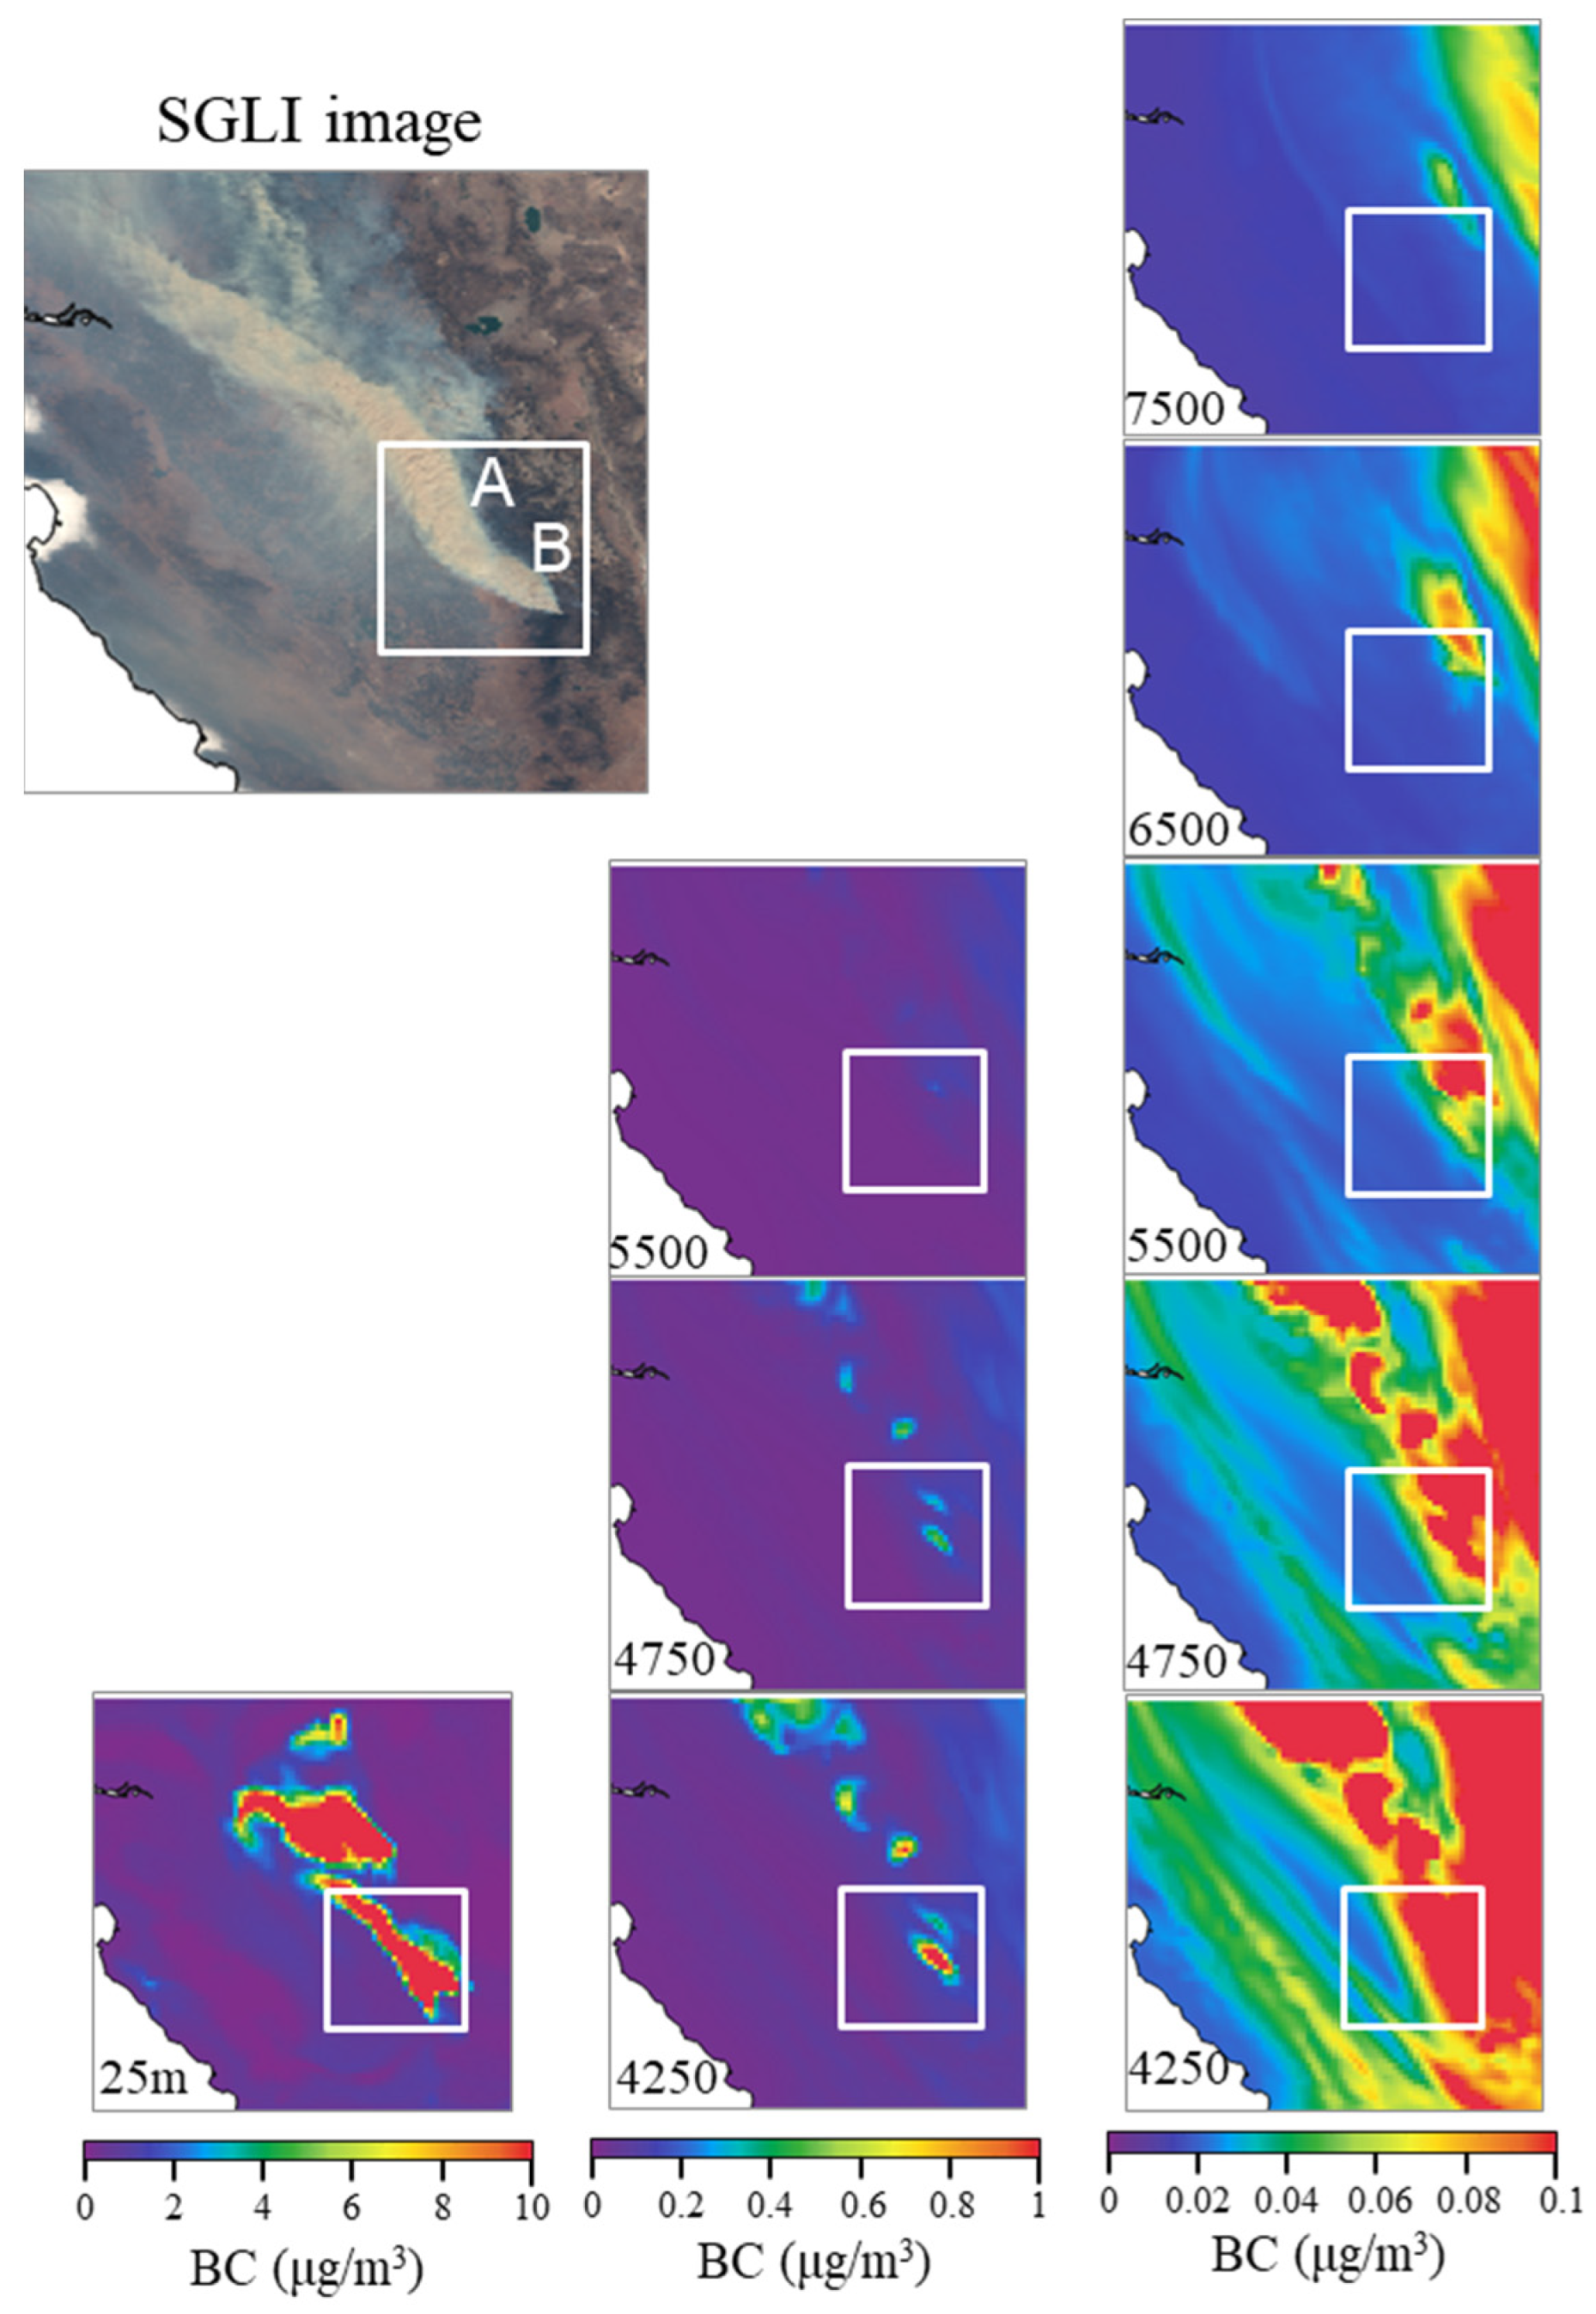
3.2.4. Plume Advection Simulation by the Regional CTM

With the complex wind field presented in Figure 13, the BC concentration (μg/m3) was simulated using the CTM. Figure 15 shows the BC concentrations near the surface and at high altitudes at the three different scales. The plume between points A and B, where the stereoscopic method estimated the greatest plume height (Figure 14), is indicated by a small white square in each figure. The air mass spreads northwestward as it moves higher in the atmosphere, reflecting the wind behavior shown in Figure 13. The CTM simulation also showed a distribution of BC high-concentration areas, corresponding to the plume observed in the SGLI image. However, at the plume altitudes estimated from the two-directional SGLI data, the simulated BC concentrations were much lower. In any case, the improved reproducibility of the vertical profiles should be considered when simulating aerosol plumes from large forest fires using the CTM.

4. Discussion

The difference between total and polarized radiance images measured by the GCOM-C/SGLI indicates the sensitivity to different aspects of aerosols. A further extension of the results would be to exploit the simultaneous observations of R and polarization to observe different altitudes (i.e., different types of aerosols) and resolve the vertical variations in aerosols. Further efforts are necessary to construct algorithms based on the theoretical framework of climate dynamics, the microphysics of atmospheric particles, and image processing. The usefulness of multi-directional data, MISR, plays a significant role. It is well known that multi-directional data and its research products have been provided by MISR for the last 23 years [32].
For precise estimation of the injection height from satellite observations, improvements in the feature detection algorithm and feedback on the instrument design are necessary. The adoption of a more suitable image analysis technique is desirable to improve the matching efficiency. The SIFT algorithm and other feature detection algorithms that we have already tested were specifically designed to detect edge corners. Forest fire plumes and clouds are bulky in nature, and edge corners may not be optimal features. In addition, many edge corner algorithms require information on nearby pixels, imposing a lower spatial scale limit on their application. In the instances presented in this study, it was challenging to find favorable feature points for a part of the plume narrower than 10 km in width (i.e., 10 pixels of the tilted polarization measurements). Improvements in the instrument’s spatial resolution would improve the matching efficiency between the two viewing directions. In addition, a better instrument spatial resolution results in a better vertical resolution. A tilted measurement at a spatial resolution of 1 km implies a vertical resolution of approximately 1 km on the satellite ground track if the instrument performs binary detection of the presence of a plume. Although non-binary R values currently enable us to estimate intermediate altitudes, the practical accuracy achievable from the SGLI data is no better than 500 m. If a tilted measurement is performed at a spatial resolution of 250 m, a vertical resolution as high as 200 m can be achieved. Therefore, continuous algorithm development and feedback for future instrument designs are essential.
The rising mechanism of BBAs resulting from wildfires is difficult to handle in model simulations as it depends on the fire temperature and area of combustion. The Goddard Chemistry Aerosol Radiation Transport model treats emission injection heights by assuming that BBA emissions are uniformly distributed throughout the planetary boundary layer of the grid box, where fire emissions occur owing to the heat generated during burning [33,34]. However, some researchers have pointed out that the assumption that biomass combustion smoke emissions are uniformly distributed throughout the boundary layer may not accurately represent reality [19]. In the Spectral Radiation-Transport Model for Aerosol Species, the model-calculated planetary boundary layer is used for the aerosol injection height. However, for the BBA emission, a method that provides a constant mixing ratio up to an altitude of approximately 3 km is used [35]. In the model (CTM) used in this study, BBAs were assumed to be uniformly distributed up to an altitude of 1 km. A method was also proposed to provide different injection heights for BBA emissions depending on the location and type of wildfire [36]. It has been shown that the reproducibility of model simulations is enhanced by accounting for transport by convection resulting from the initial strong buoyancy of aerosols emitted during vegetation fires [37]. Various efforts have been made to determine the injection height for BBA emissions in models; however, it is not possible to provide an accurate height for each wildfire. Real-time simulations of smoke with forest fire origins have been conducted using satellite data [38]. If satellite observations can provide wildfire-derived smoke heights, which can then be applied to model simulations, it would certainly improve the reproduction of the BBA vertical distribution around the fire source.

5. Conclusions

This study demonstrates the application of SGLI data to case studies of SBBAs. As examples of large-scale wildfires, wildfires in Sumatra on 21 September 2019, and those on the west coast of North America on 13 September 2020, were selected for their different natures and surrounding terrains. The Sumatra wildfire was a peat fire over relatively flat land, whereas the west coast fire was a forest fire near steep slopes and highlands. In both cases, the simultaneously measured Rs and PRs presented different spatial distributions, indicating that they were sensitive to different aspects of aerosol plumes. The radiative transfer simulation confirms that the R increases with an increasing total column amount, even over the SBBA, while the PR saturates at a few optical thicknesses and carries a polarization signature only from the top of the plume. This simulation suggests that the R represents the total column, and the PR is sensitive to the microphysical properties of aerosols near the plume top.
From the two-directional data acquired by the SGLI, feature detection using the SIFT algorithm and triangulation was applied to determine the aerosol plume height. Although the algorithm has scope for improvement in terms of efficiency and spatial coverage, it has been demonstrated that the geometric precision of the SGLI is sufficient to perform consistent altitude estimation. The results encourage further development and application of the historic and latest stereoscopic techniques to two-directional SGLI data.
These satellite-derived distributions of the R, PR, and plume top height validate the regional CTM for the better forecasting of local pollution by BBAs. The CTM simulations for the two selected wildfire cases showed high concentrations of pollutants near the source and advection downwind. However, the satellite-derived plume top altitude implies that the injection altitude set in the CTM was too low, which may be the cause of pollutant underestimation far from the source. The plume height estimated by the satellite may improve the simulation of local pollution distribution.
With the advent of POLDER sensors, multi-directional polarization observations have brought great progress in satellite remote sensing. Starting with the multi-viewing multi-channel multi-polarization imager (3MI) [39], the successor of POLDER, many multi-directional polarization sensors have been programmed to fly in the late 2020s [40,41,42]. In preparation for future polarimetric and multi-directional missions, global data from the SGLI provide an opportunity to demonstrate the utility of multi-directional and polarimetric measurements.

Author Contributions

Conceptualization, S.M.; Formal analysis, S.H.; Investigation, M.N.; Writing—original draft, S.M., S.H. and M.N.; Funding acquisition, S.M. and S.H. All authors have read and agreed to the published version of the manuscript.

Funding

This research was funded by the Global Change Observation Mission—Climate Project of JAXA.

Data Availability Statement

No new data were created or analyzed in this study. Data sharing is not applicable to this article.

Acknowledgments

The authors would like to thank Toshiyuki Fujito for the assistance in preparing the satellite data, JAXA for distributing the observed data with GCOM-C/SGLI and HIMAWARI-8/AHI, and NASA for the Terra/MODIS and AERONET data. This work was supported by CNES through research grants focused on SGLI/GCOM-C and 3MI/EPS-SG.

Conflicts of Interest

The authors declare no conflict of interest.

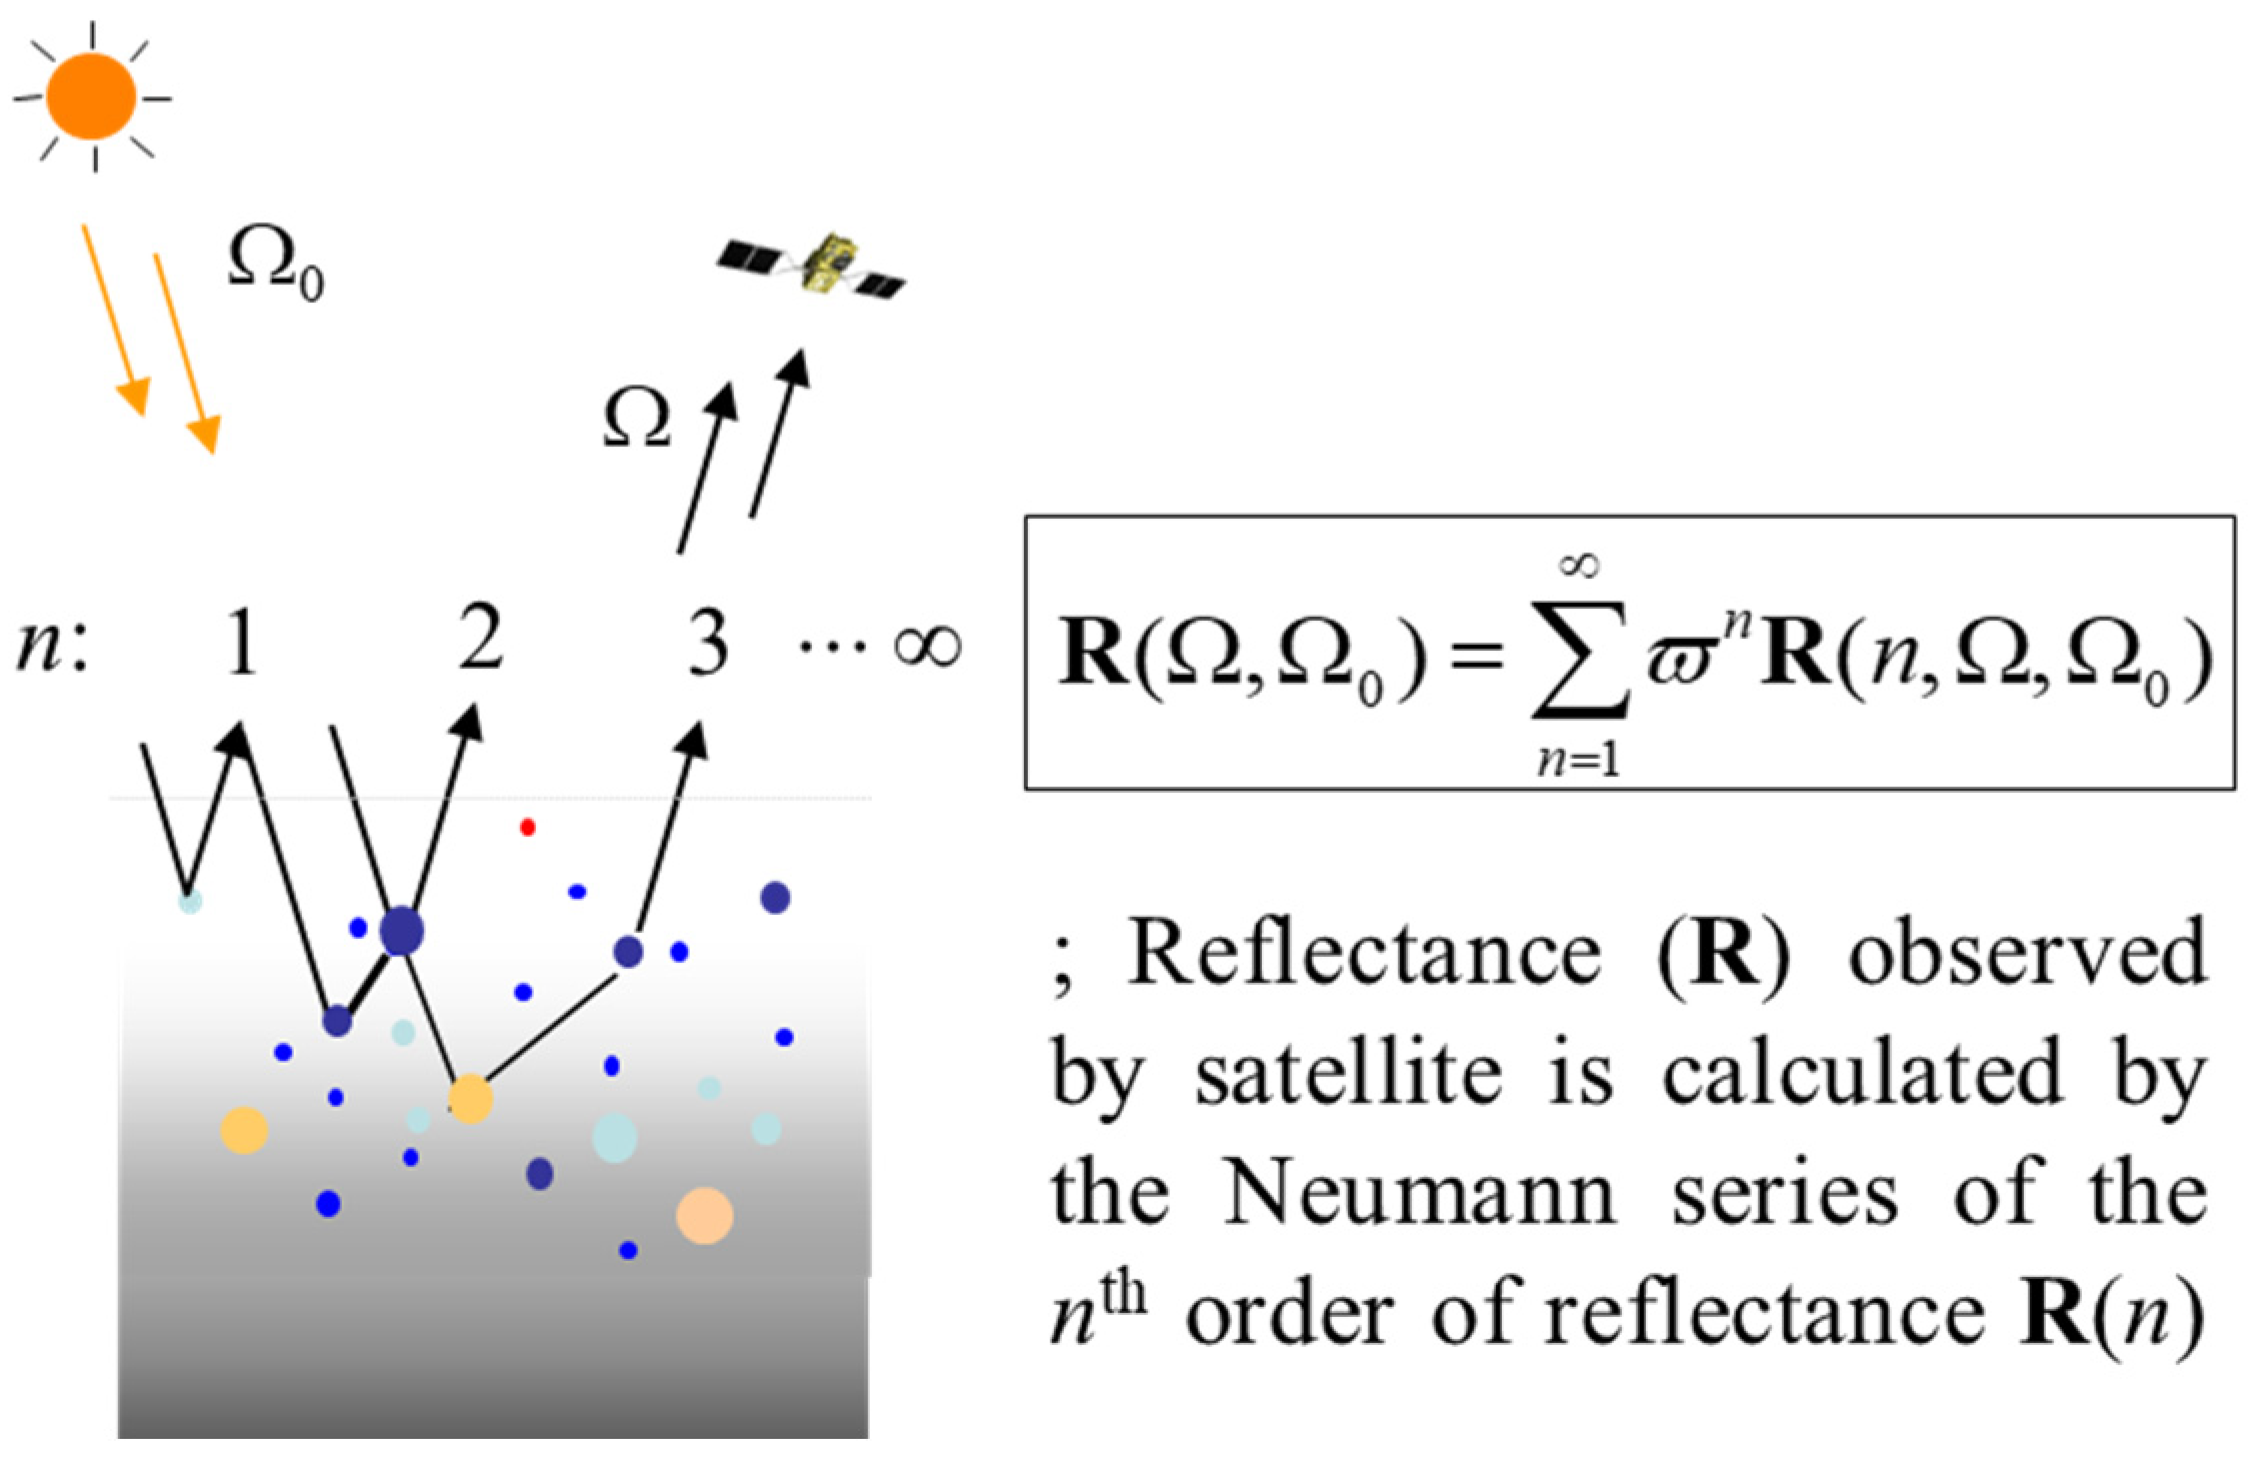
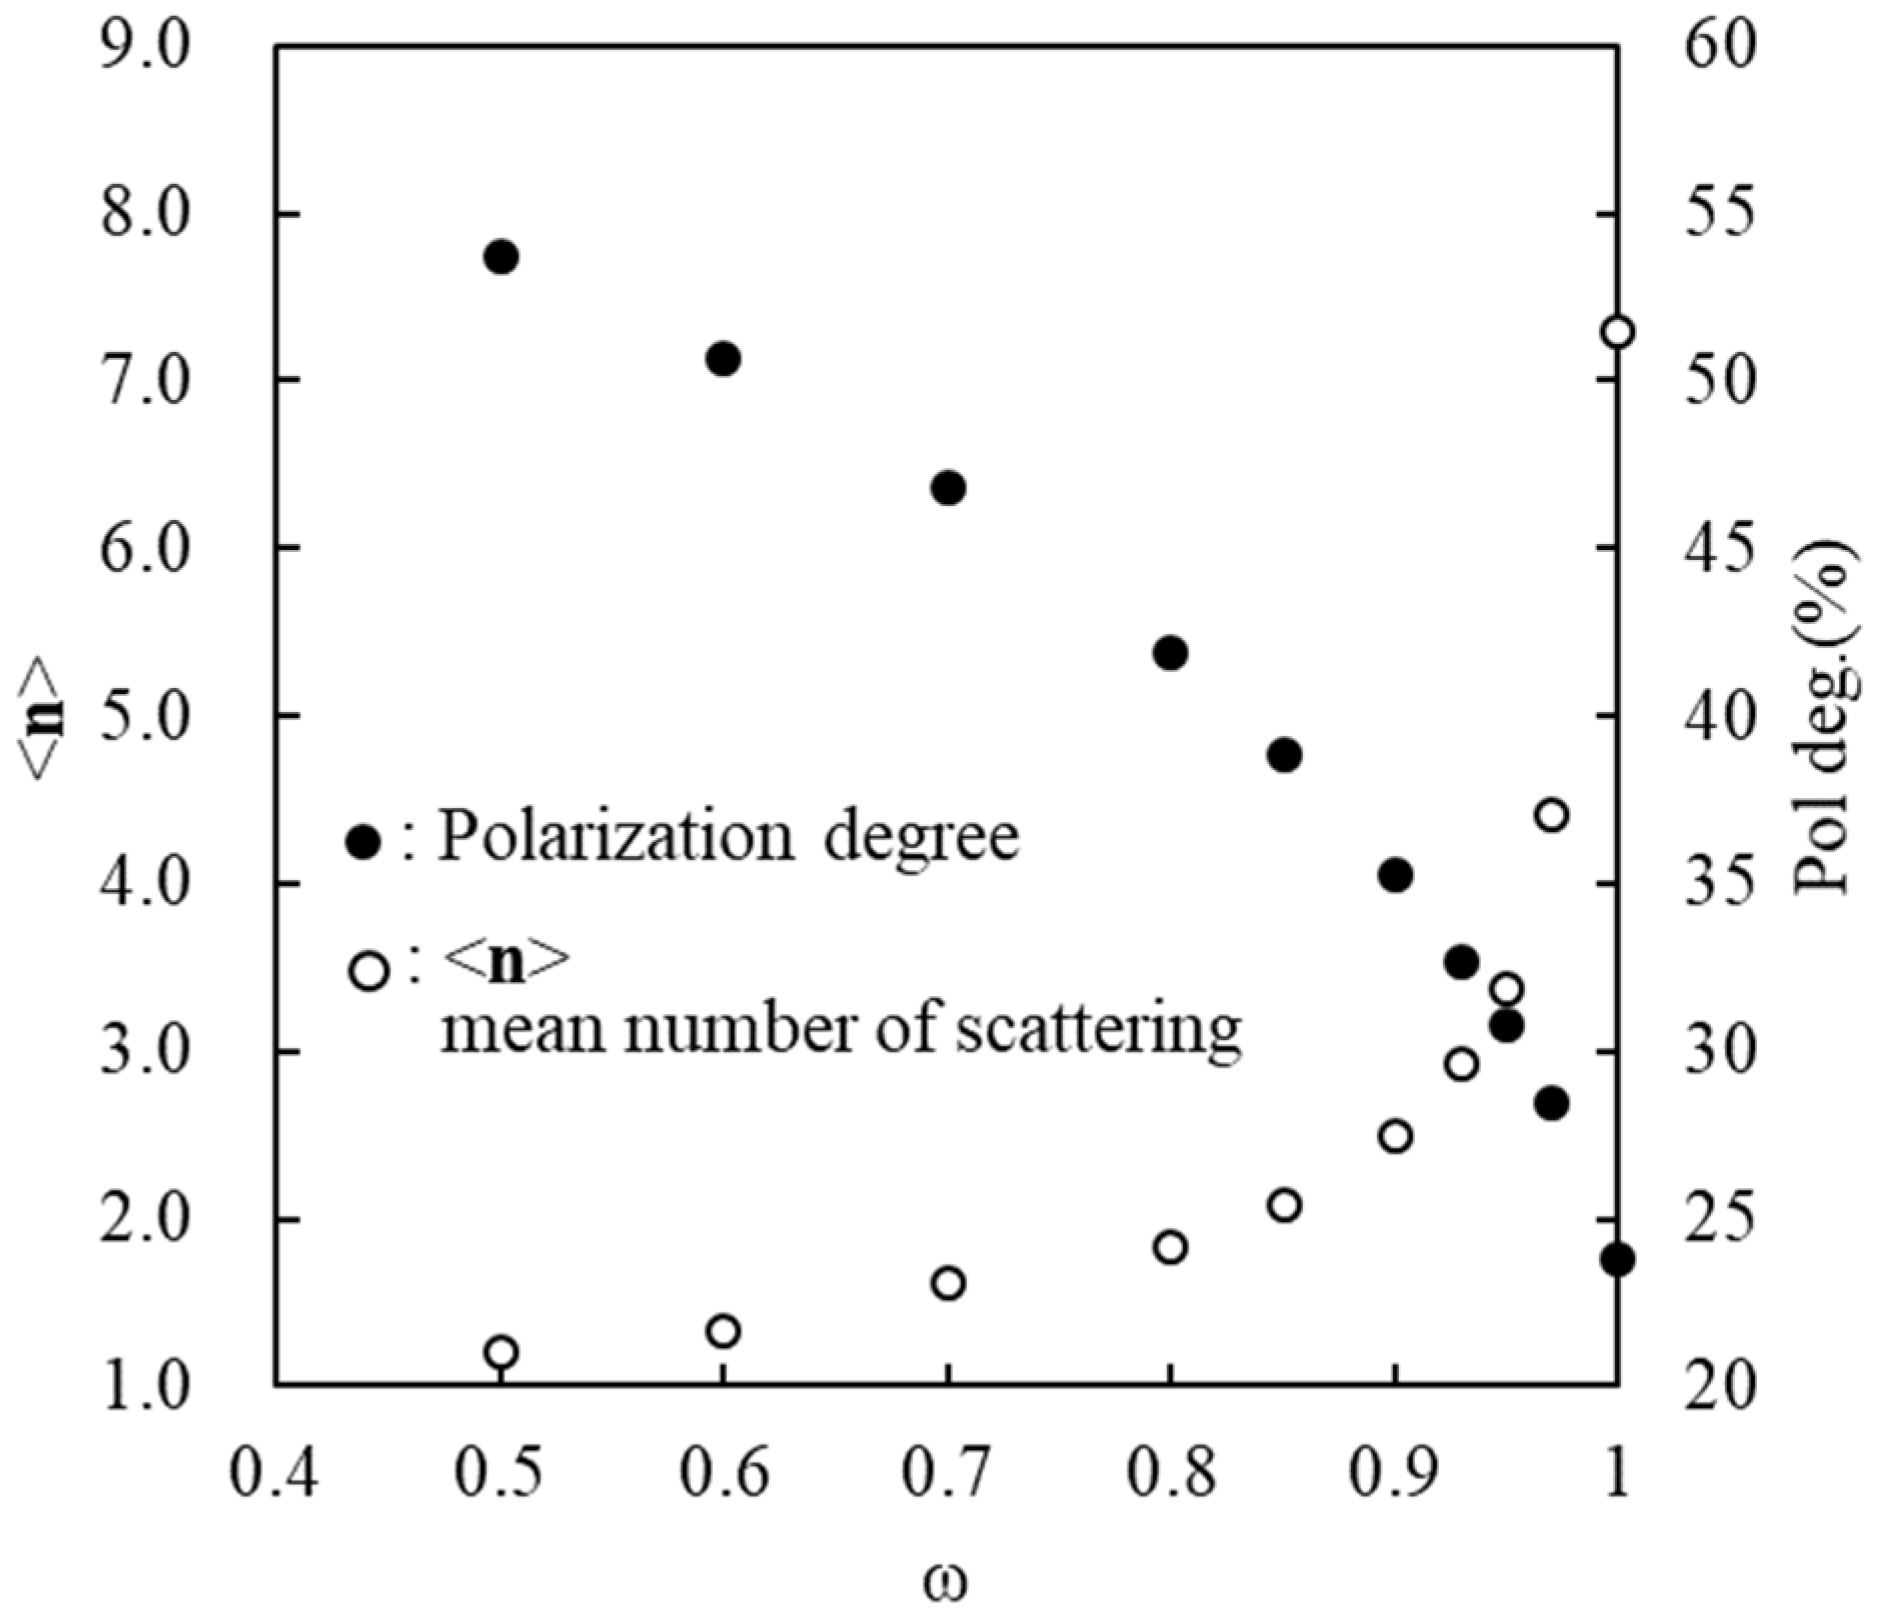
Appendix A. Polarized Reflectance from Semi-Infinite Atmosphere Based on VMSOS Method

An efficient algorithm to calculate the polarized reflectance from a semi-infinite medium based on the method of successive orders of scattering is briefly described and verified numerically using Rayleigh scattering. Space-borne sensors measure the upwelling R at the top of the atmosphere, and incident solar light interacts multiple times with atmospheric particles. Now, function I τ , Ω is defined to be the specific intensity vector at the optical depth τ in the direction of Ω represented by the zenith angle ( θ ) and azimuth angle ( φ ). Hereafter, we describe the vector method of successive orders of scattering (VMSOS), where the I , Q , U , V Stokes parameters are employed. Therefore, I denotes the four-dimensional intensity vector as I = ( I , Q , U , V ) and P ~ is a 4 × 4 phase matrix. VMSOS has been used to characterize hazy biomass-burning aerosols caused by severe wildfires [12]. This is the first step, and we expect VMSOS to be used in a variety of situations.
It is assumed that there is incident radiation of flux F in direction μ 0 ,   φ 0 falling on the top of a semi-infinite atmosphere. The direction of Ω is represented by the zenith angle ( θ ) and azimuth angle ( φ ). Usually, in the radiative transfer calculation, the direction is defined by Ω = μ , φ , where μ is the cosine of the zenith angle θ (i.e., μ = cos θ ). R Ω , Ω 0 is considered as a reflection matrix from an optically semi-infinite medium, and the emergent intensity at the top of medium I e m 0 , Ω is given by
I e m 0 , Ω = 1 μ 1 4 π R Ω , Ω   F Ω   d Ω ,
where the integration covers the inward hemisphere. Moreover, we can define the nth order of reflection matrix R n , Ω , Ω 0 after n times scattering in the medium. The total reflection matrix R Ω , Ω 0 is related to R n , Ω , Ω 0 as
R Ω ,   Ω 0 = n = 1 ϖ n   R n ,   Ω ,   Ω 0 .
Now, letting
F Ω = δ μ μ 0 δ φ φ 0 E = δ Ω Ω 0 E ,
where E is the unit vector, we obtain
1 μ + 1 μ 0 R 1 , Ω ,   Ω 0 = P ~ Ω , Ω 0 .
For the second-order one,
1 μ + 1 μ 0 R 2 , Ω ,   Ω 0 = d Ω 4 π R 1 , Ω , Ω 1 μ P ~ Ω , Ω 0 + + d Ω 4 π P ~ Ω , Ω 0 1 μ R 1 , Ω , Ω .
Generally, the equation for the nth order R n (n ≥ 3) can be derived in a similar manner as shown above.
1 μ + 1 μ 0 R n , Ω ,   Ω 0 = d Ω 4 π R n 1 , Ω , Ω 1 μ P ~ Ω , Ω 0 + + d Ω 4 π P ~ Ω , Ω 0 1 μ R n 1 , Ω , Ω + n = 1 n 2 d Ω 4 π + d Ω 4 π R n , Ω ,   Ω 1 μ P ~ Ω , Ω 1 μ R n n 1 ,   Ω , Ω 0 .
Figure A1 presents a simple diagram to explain the above-mentioned radiative transfer method in a semi-infinite medium (VMSOS), where the variables follow the description in the text and the various colored spots represent aerosols.
Figure A1. Schematic diagram of radiative transfer method (VMSOS) in a semi-infinite atmosphere model.
Remotesensing 15 05405 g0a1
When the Stokes emergent intensity vector is represented by S Ω ,   Ω 0 = S I Ω , Ω 0 , S Q Ω , Ω 0 ,   S U Ω , Ω 0 , S V Ω , Ω 0 , the degree of linear polarization is calculated as follows:
P o l Ω ,   Ω 0 = S Q Ω ,   Ω 0 S I Ω ,   Ω 0 .
It is of interest to mention that MSOS provides us with the mean number of scattering using S n , Ω ,   Ω 0 = R n , Ω , Ω 0 F ,
n Ω , Ω 0 = n = 1 n ϖ n S n , Ω ,   Ω 0 / n = 1 ϖ n S n , Ω ,   Ω 0 .
In this paper, we present the numerical results of the VMSOS method using Rayleigh scattering. Figure A2 shows the numerical results of the reflected intensity at θ = 60 ° , θ 0 = 60 ° , and φ φ 0 = 0 ° versus the number of scatterings ( n ) for several albedos of single scattering ϖ in the case of Rayleigh scattering. Figure A2 shows the convergence of VMSOS computations. From this figure, it is clear that the convergence of VMSOS is inversely proportional to the value of ϖ Thus, the calculation is fast when ϖ is small compared to unity. However, the Earth’s atmospheric aerosols take the values of ϖ near 1 usually, because the albedo for single scattering depends on the imaginary part of the refractive index.
Figure A2. Convergence behavior of reflected intensity for the number of scatterings (n) calculated by radiative transfer method (VMSOS) in the case of Rayleigh scattering at θ = 60 ° , θ 0 = 60 ° , and φ φ 0 = 0 ° with several albedos of single scattering ( ϖ ; ω in figure).
Remotesensing 15 05405 g0a2
The mean number of scatterings n Ω , Ω 0 defined in Equation (A8) is numerically calculated for several albedos of single scattering ϖ and presented in Figure A3 (refer to the left vertical axis). It shows the variation in the mean number of scatterings with ϖ . Simultaneously, the change in the degree of polarization defined in Equation (A7) is demonstrated according to the scale on the right axis of Figure A3.
Figure A3. The mean number of scatterings n θ = 60 ° , θ 0 = 60 ° , φ φ 0 = 0 ° (refer to the left vertical axis) and the degree of linear polarization “Pol. deg.” in percent according to the scale on the right axis versus albedo for single scattering ω.
Remotesensing 15 05405 g0a3
From Figure A3, it is shown that the absolute value of the degree of linear polarization increases as ϖ decreases. It is believed that the degree of polarization is reduced by multiple scattering. At this point, we can confirm that the degree of polarization decreases with an increase in the mean number of scatterings, because the mean number of scatterings increases as the effect of multiple scattering increases, as shown in Figure A3. Thus, mean number of scatterings n Ω , Ω 0 indicates the multiple scattering effect, and, hence, polarization decreases as the multiple scattering effect increases. These results support the conclusion derived from the SGLI observations that the PR reflects aerosols in the upper part of the optically thick atmosphere [11,13].

References

  1. Liu, J.C.; Pereira, G.; Uhl, S.A.; Bravo, M.A.; Bell, M.L. A systematic review of the physical health impacts from non-occupational exposure to wildfire smoke. Environ. Res. 2015, 136, 120–132. [Google Scholar] [CrossRef]
  2. Reid, C.E.; Brauer, M.; Johnston, F.H.; Jerrett, M.; Balmes, J.R.; Elliott, C.T. Critical review of health impacts of wildfire smoke exposure. Environ. Health Perspect. 2016, 124, 1334–1343. [Google Scholar] [CrossRef]
  3. Dickman, K. The hidden toll of wildfire. Sci. Am. 2020, 322, 38–45. [Google Scholar]
  4. IPCC. Climate Change 2021: The Physical Science Basis. Contribution of Working Group I to the Sixth Assessment Report of the Intergovernmental Panel on Climate Change; Cambridge University Press: London, UK, 2021. [Google Scholar]
  5. Giovannini, L.; Laiti, L.; Serafin, S.; Zardi, D. The thermally driven diurnal wind system of the Adige Valley in the Italian Alps. Q. J. R. Meteorol. Soc. 2017, 143, 2389–2402. [Google Scholar] [CrossRef]
  6. Schmidli, J.; Böing, S.; Fuhrer, O. Accuracy of simulated diurnal valley winds in the Swiss Alps: Influence of grid resolution. Atmosphere 2018, 9, 196. [Google Scholar] [CrossRef]
  7. Zhang, Z.; Xu, X.; Qiao, L.; Gong, D.; Kim, S.J.; Wang, Y.; Mao, R. Numerical simulations of the effects of regional topography on haze pollution in Beijing. Sci. Rep. 2018, 8, 5504. [Google Scholar] [CrossRef] [PubMed]
  8. Su, B.; Li, H.; Zhang, M.; Bilal, M.; Wang, M.; Atique, L.; Ziyue Zhang, Z.; Han, G.; Qiu, Z.; Ali, A. Optical and physical characteristics of aerosol vertical layers over Northeastern China. Atmosphere 2020, 11, 501. [Google Scholar] [CrossRef]
  9. Hu, W.; Zhao, T.; Bai, Y.; Shen, L.; Sun, X.; Gu, Y. Contribution of regional PM2.5 transport to air pollution enhanced by sub-basin topography, A modeling case over Central China. Atmosphere 2020, 11, 1258. [Google Scholar] [CrossRef]
  10. Imaoka, K.; Kachi, M.; Fujii, H.; Murakami, H.; Hori, M.; Ono, A.; Igarashi, T.; Nakagawa, K.; Oki, T.; Honda, Y.; et al. Global change observation mission (GCOM) for monitoring carbon, water cycles, and climate change. Proc. IEEE 2010, 98, 717–734. [Google Scholar] [CrossRef]
  11. Nakata, M.; Sano, I.; Mukai, S.; Kokhanovsky, A. Characterization of wildfire smoke over complex terrain using satellite observations, ground-based observations, and meteorological models. Remote Sens. 2022, 14, 2344. [Google Scholar] [CrossRef]
  12. Mukai, S.; Sano, I.; Nakata, M. Algorithms for the Classification and Characterization of Aerosols: Utility Verification of Near-UV Satellite Observations. J. Appl. Remote Sens. 2019, 13, 014527. [Google Scholar] [CrossRef]
  13. Mukai, S.; Sano, I.; Nakata, M. Improved algorithms for remote sensing-based aerosol retrieval during extreme biomass burning. Atmosphere 2021, 12, 403. [Google Scholar] [CrossRef]
  14. Nakata, M.; Mukai, S.; Fujito, T. Direct Detection of Severe Biomass Burning Aerosols from Satellite. Atmosphere 2022, 13, 1913. [Google Scholar] [CrossRef]
  15. Eck, T.; Holben, B.; Reid, J.; Giles, D.; Rivas, M.; Singh, R.; Tripathi, S.; Bruegge, C.; Platnick, S.; Arnold, G.; et al. Fog- and cloud-induced aerosol modification observed by the Aerosol Robotic Network (AERONET). J. Geophys. Res. 2012, 117, D07206. [Google Scholar] [CrossRef]
  16. Diner, D.J.; Beckert, J.C.; Reilly, T.H.; Bruegge, C.J.; Conel, J.E.; Kahn, R.A.; Martonchik, J.V.; Ackerman, T.P.; Davies, R.; Gerstl, S.A.W.; et al. Multi-angle Imaging SpectroRadiometer (MISR)—Instrument description and experiment overview. IEEE Trans. Geosci. Remote Sens. 1998, 36, 1072–1087. [Google Scholar] [CrossRef]
  17. Diner, D.J.; Beckert, J.C.; Bothwell, G.W.; Rodriguez, J.I. Performance of the MISR instrument during its first 20 months in earth orbit. IEEE Trans. Geosci. Remote Sens. 2002, 40, 1449–1466. [Google Scholar] [CrossRef]
  18. Moroney, C.; Davis, R.; Muller, J.-P. MISR stereoscopic image matchers: Techniques and results. IEEE Trans. Geosci. Remote Sens. 2002, 40, 1547–1559. [Google Scholar] [CrossRef]
  19. Kahn, R.A.; Chen, Y.; Nelson, D.L.; Leung, F.-Y.; Li, Q.; Diner, D.J.; Logan, J.A. Wildfire Smoke Injection Heights: Two perspectives from Space. Geophys. Res. Lett. 2008, 35, L04809. [Google Scholar] [CrossRef]
  20. Carr, J.L.; Wu, D.L.; Wolfe, R.E.; Madani, H.; Lin, G.; Tan, B. Joint 3D-Wind Retrievals with Stereoscopic Views from MODIS and GOES. Remote Sens. 2019, 11, 2100. [Google Scholar] [CrossRef]
  21. Himawari Satellite Data Archive. Available online: https://sc-web.nict.go.jp/himawari/himawari-data-archive.html (accessed on 1 August 2023).
  22. Kinne, S.; Lohmann, U.; Feichter, J.; Schulz, M.; Timmreck, C.; Ghan, S.; Easter, R.; Chin, M.; Ginoux, P.; Takemura, T.; et al. Monthly averages of aerosol properties: A global comparison among models, satellite data and AERONET ground data. J. Geophys. Res. 2003, 108, 4634. [Google Scholar] [CrossRef]
  23. Lowe, D.G. Object recognition from local scale-invariant features. Proc. IEEE Int. Conf. Comput. Vis. 1999, 2, 1150–1157. [Google Scholar] [CrossRef]
  24. Kajino, M.; Deushi, M.; Sekiyama, T.T.; Oshima, N.; Yumimoto, K.; Tanaka, T.Y.; Ching, J.; Hashimoto, A.; Yamamoto, T.; Ikegami, M.; et al. Comparison of three aerosol representations of NHM-Chem (v1.0) for the simulations of air quality and climate-relevant variables. Geosci. Model Dev. 2021, 14, 2235–2264. [Google Scholar] [CrossRef]
  25. Nishizawa, S.; Yashiro, H.; Sato, Y.; Miyamoto, Y.; Tomita, H. Influence of grid aspect ratio on planetary boundary layer turbulence in large-eddy simulations. Geosci. Model Dev. 2015, 28, 3393–3419. [Google Scholar] [CrossRef]
  26. Sato, Y.; Nishizawa, S.; Yashiro, H.; Miyamoto, Y.; Kajikawa, Y.; Tomita, H. Impacts of cloud microphysics on trade wind cumulus: Which cloud microphysics processes contribute to the diversity in a large eddy simulation? Prog. Earth Planet. Sci. 2015, 2, 23. [Google Scholar] [CrossRef]
  27. Nakata, M.; Kajino, M.; Sato, Y. Effects of mountains on aerosols determined by AERONET/DRAGON/J-ALPS measurements and regional model simulations. AGU Adv. Earth Space Sci. 2021, 8, e2021EA001972. [Google Scholar] [CrossRef]
  28. Kaiser, J.W.; Heil, A.; Andreae, M.O.; Benedetti, A.; Chubarova, N.; Jones, L.; Morcrette, J.-J.; Razinger, M.; Schultz, M.G.; Suttie, M.; et al. Biomass burning emissions estimated with a global fire assimilation system based on observed fire radiative power. Biogeosciences. 2012, 9, 527–554. [Google Scholar] [CrossRef]
  29. Wulandari, E.; Mardianto, D.; Susilastuti, D.H.; Maryudi, A. Scholarly interest in forest fires in Indonesia: A bibliographical review. For. Soc. 2022, 6, 609–619. [Google Scholar] [CrossRef]
  30. Hein, L.; Spadaro, J.V.; Oatro, B.; Hammer, M.; Sumarga, E.; Salmayenti, R.; Boer, R.; Tata, H.; Atmoko, D.; Castañeda, J. The health impacts of Indonesia peatland fires. Environ. Health 2022, 21, 62. [Google Scholar] [CrossRef]
  31. Giglio, L.; Schroeder, W.; Justice, C.O. The Collection 6 MODIS active fire detection algorithm and fire products. Remote Sens. Environ. 2016, 178, 31–41. [Google Scholar] [CrossRef]
  32. Limbacher, J.E.; Kahn, R.A.; Lee, J. The new MISR research aerosol retrieval algorithm: A multi-angle, multi-spectral. bounded-variable least squares retrieval of aerosols particle properties over both land and water. Atmos. Meas. Tech. 2022, 15, 6865–6887. [Google Scholar] [CrossRef]
  33. Colarco, P.; da Silva, A.; Chin, M.; Diehl, T. Online simulations of global aerosol distributions in the NASA GEOS-4 model and comparisons to satellite and ground-based aerosol optical depth. J. Geophys. Res. 2010, 115, D14207. [Google Scholar] [CrossRef]
  34. Das, S.; Harshvardhan, H.; Bian, H.; Chin, M.; Curci, G.; Protonotariou, A.P.; Mielonen, T.; Zhang, K.; Wang, H.; Liu, X. Biomass burning aerosol transport and vertical distribution over the South African-Atlantic region. J. Geophys. Res. Atmos. 2017, 122, 6391–6415. [Google Scholar] [CrossRef]
  35. Takemura, T.; Okamoto, H.; Maruyama, Y.; Numaguti, A.; Higurashi, A.; Nakajima, T. Global three-dimensional simulation of aerosol optical thickness distribution of various origins. J. Geophys. Res. 2000, 105, 17853–17873. [Google Scholar] [CrossRef]
  36. Dentener, F.; Kinne, S.; Bond, T.; Boucher, O.; Cofala, J.; Generoso, S.; Ginoux, P.; Gong, S.; Hoelzemann, J.J.; Ito, A.; et al. Emissions of primary aerosol and precursor gases in the years 2000 and 1750 prescribed datasets for AeroCom. Atmos. Chem. Phys. 2006, 6, 4321–4344. [Google Scholar] [CrossRef]
  37. Freitas, S.R.; Longo, K.M.; Chatfield, R.; Latham, D.; Silva Dias, M.A.F.; Andreae, M.O.; Prins, E.; Santos, J.C.; Gielow, R.; Carvalho, J.A., Jr. Including the sub-grid scale plume rise of vegetation fires in low resolution atmospheric transport models. Atmos. Chem. Phys. 2007, 7, 3385–3398. [Google Scholar] [CrossRef]
  38. Chow, F.K.; Yu, K.A.; Young, A.; James, E.; Grell, G.A.; Csiszar, I.; Tsidulko, M.; Freitas, S.; Pereira, G.; Giglio, L.; et al. High-Resolution Smoke Forecasting for the 2018 Camp Fire in California. Bull. Am. Meteorol. Soc. 2022, 103, E1531–E1552. [Google Scholar] [CrossRef]
  39. Fougnie, B.; Marbach, T.; Lacan, A.; Lang, R.; Schluessel, P.; Poli, G.; Munro, R.; Couto, A.B. The multi-viewing multi-channel multi-polarisation imager—Overview of the 3MI polarimetric mission for aerosol and cloud characterization. J. Quant. Spectrosc. Radiat. Transf. 2018, 219, 23–32. [Google Scholar] [CrossRef]
  40. Kokhanovsky, A.A.; Davis, A.B.; Cairns, B.; Dubovik, O.; Hasekamp, O.; Sano, I.; Mukai, S.; Rozanov, V.; Litvinov, P.; Lapyonok, T.; et al. Space-Based Remote Sensing of Atmospheric Aerosols: The Multi-Angle Spectropolarimetric Frontier. Earth Sci. Rev. 2015, 45, 85–116. [Google Scholar] [CrossRef]
  41. Dubovik, O.; Li, Z.; Mishchenko, M.I.; Tanré, D.; Karol, Y.; Bojkov, B.; Cairns, B.; Diner, D.J.; Espinosa, W.R.; Goloub, P.; et al. Polarimetric remote sensing of atmospheric aerosols: Instruments, methodologies, results, and perspectives. J. Quant. Spectrosc. Radiat. Transf. 2019, 224, 474–511. [Google Scholar] [CrossRef]
  42. Gao, M.; Knobelspiesse, K.; Franz, B.A.; Zhai, P.-W.; Sayer, A.M.; Ibrahim, A.; Cairns, B.; Hasekamp, O.; Hu, Y.; Martins, V.; et al. Effective uncertainty quantification for multi-angle polarimetric aerosol remote sensing over ocean. Atmos. Meas. Tech. 2022, 15, 4859–4879. [Google Scholar] [CrossRef]
Figure 1. Diagram showing the pre-selection process of SBBA candidate pixels before the main BBA retrieval using GCOM-C/SGLI observations over western North America on 13 September 2020. (a) Color composite image from SGLI data, (b) distribution of AOT (500) from SGLI/L2, (c) distribution of index AAI from SGLI data, (d) same as (c) but for index PRI and (e) the area with AAI ≥ 1.1 is colored by pink. BBA: biomass-burning aerosol; SBBA: severe BBA; SGLI: second-generation global imager; AOT: aerosol optical thickness; AAI: absorbing aerosol index; PRI: polarized radiance index.
Remotesensing 15 05405 g001
Figure 2. SGLI’s two-directional image acquisition. White triangles show the lines of sight of radiance-only optics, and the green triangles show the lines of slightly tilted polarization optics. (a) Northern Hemisphere configuration; (b) same as (a) but approximately 2 min later; (c) Southern Hemisphere configuration; (d) same as (c) but approximately 2 min later. SGLI: second-generation global imager.
Remotesensing 15 05405 g002
Figure 3. Schematic diagram for estimation of the target position from two-directional data with satellite. LOS: line of sight.
Remotesensing 15 05405 g003
Figure 4. Accumulated hotspot (•) map in September 2019 derived from the MODIS Level 2 Thermal Anomalies/Fire product (MOD14, Collection 6) [31]. MODIS: moderate-resolution imaging spectroradiometer.
Remotesensing 15 05405 g004
Figure 5. Topographic map over Sumatra islands and the tip of the Malay peninsula.
Remotesensing 15 05405 g005
Figure 6. Wildfires in Sumatra observed by the SGLI at 03:30 UT on 21 September, 2019 with hotspots from MODIS Level 2 Thermal Anomalies/Fire product (MOD14, Collection 6) and Jambi AERONET site. (a) Color composite image: (R, G, B) = (674, 530, 443 nm) with and without cloud/SGLI/L2, (b) AAI, (c) PRI. MODIS: moderate-resolution imaging spectroradiometer; SGLI: second-generation global imager; PRI: polarized radiance index; AERONET: aerosol robotic network.
Remotesensing 15 05405 g006
Figure 7. SGLI measurements over Sumatra on 21 September 2019. (a) AOT (500 nm) from SGLI/L2 products; (b) frequency histogram of the R in Figure 6a at wavelengths of 674 and 869 nm; (c) the same as Figure 7b, but for PR; (d) distribution of R and PR images, respectively, at 674 nm; (e,e’) the same as (d,d’) but for 869 nm. AOT: aerosol optical thickness; SGLI: second-generation global imager; R: radiance; PR: polarized radiance.
Remotesensing 15 05405 g007
Figure 8. Estimation of BBA plume height using the stereoscopic approach over Sumatra wildfire on 21 September 2019. BBA: biomass-burning aerosol.
Remotesensing 15 05405 g008
Figure 9. Sequential measurements over North Sumatra on 21 September, 2019. (a) Color composite images observed by Himawari-8/AHI, (b) AOT measured at Jambi site of NASA/AERONET. AOT: aerosol optical thickness; NASA: National Aeronautics and Space Administration; AERONET: aerosol robotic network.
Remotesensing 15 05405 g009
Figure 10. BC concentration (μg/m3) simulated by a regional meteorological model CTM in 5 × 5 km resolution at altitude h (m). BC: black carbon; CTM: chemical transport model.
Remotesensing 15 05405 g010
Figure 11. Forest fires in California observed by SGLI at 18:47 UT on 13 September, 2020. (a) Color composite image: (R, G, B) = (674, 530, 443 nm) with hotspots on 12 and 13 September from MODIS Level 2 Thermal Anomalies/Fire product (MOD14) and AERONET site; (b) AAI distribution; (c) topographic map with hotspots on 13 September, where SGLI: second-generation global imager; MODIS: moderate-resolution imaging spectroradiometer; AERONET: aerosol robotic network; AAI: absorbing aerosol index.
Remotesensing 15 05405 g011
Figure 12. SGLI measurements over the west coast of North America on 13 September 2020. (a) Frequency histogram of R at 674 nm and 869 nm wavelengths; (b) the same as Figure 12a but for PR; (c) distribution of R at 674 nm; (c’) distribution of PR at 674 nm; (d) distribution of R at 879 nm; (d’) distribution of PR at 869 nm. SGLI: second-generation global imager; R: radiance; PR: polarized radiance.
Remotesensing 15 05405 g012
Figure 13. Wind field at the resolution of 5 × 5 km at 19:00 (UT) on 13 September, 2020, used in SCALE. (a) Near the surface superposed on the topographic map; (b1) (light blue area) near valley surface; (b2) at 850 hPa (~1500 m); (b3) (light brown area) near the surface of the mountain; (b4) at 500 hPa (~5000 m). MODIS: moderate-resolution imaging spectroradiometer; NASA: National Aeronautics and Space Administration; SCALE: Scalable Computing for Advanced Library and Environment.
Remotesensing 15 05405 g013
Figure 14. The estimated plume height for the entire smoke image observed by SGLI shown in Figure 11a. SGLI: second-generation global imager.
Remotesensing 15 05405 g014
Figure 15. BC concentration in μg/m3, simulated by the regional CTM in 5 × 5 km resolution at altitude h (m) on 13 September, 2020, over the west coast of North America. The scale of BC concentration at 25 m altitude is the same as that for the Sumatran case in Figure 10, but other figures show different scales of BC concentrations (μg/m3). BC: black carbon. A figure in the upper left represents the color composite image and the letters A and B indicate the fire source area.
Remotesensing 15 05405 g015
Disclaimer/Publisher’s Note: The statements, opinions and data contained in all publications are solely those of the individual author(s) and contributor(s) and not of MDPI and/or the editor(s). MDPI and/or the editor(s) disclaim responsibility for any injury to people or property resulting from any ideas, methods, instructions or products referred to in the content.

