Article

Suspended Sediment Concentration Estimation along Turbid Water Outflow Using a Multispectral Camera on an Unmanned Aerial Vehicle

1
Brain Korea 21 School of Earth Environmental Systems, Pusan National University, Busan 46241, Republic of Korea
2
Water and Eco-Bio Corporation, Kunsan National University, Kunsan 54156, Republic of Korea
3
Department of Oceanography and Marine Research Institute, Pusan National University, Busan 46241, Republic of Korea
*
Author to whom correspondence should be addressed.
Remote Sens. 2023, 15(23), 5540; https://doi.org/10.3390/rs15235540
Submission received: 3 October 2023 / Revised: 21 November 2023 / Accepted: 23 November 2023 / Published: 28 November 2023
(This article belongs to the Section Ocean Remote Sensing)

Abstract

:
Optical remote sensing using unmanned aerial vehicles (UAVs) is proposed to monitor changes in marine environments effectively. Optical measurements were performed using a UAV multispectral camera (RedEdge, five spectral wavelengths of 475, 560, 668, 717, and 842 nm) with high spatial (5 cm) and temporal (1 s) resolutions to monitor the rapidly changing suspended sediment concentration (SSC) in the Saemangeum coastal area on the western coast of Korea. To develop the SSC algorithm, optical field, and water sample measurements were obtained from outside (11 stations) and inside (three stations) regions separated by a seawall, accounting for 100 measurements from 2018 to 2020. Accordingly, the remote sensing reflectance (Rrs) was estimated at each sampling station and used to develop the SSC algorithm based on multiple linear regression. The algorithm reasonably estimated the SSC with an R2 and root mean square error of 0.83 and 4.27 (mg L−1), respectively. Continuous individual UAV measurements over the coastal area of Saemangeum were combined to generate a wider SSC map. For the UAV observational data, the atmospheric influence at each altitude was reduced to the surface altitude level using a relative atmospheric correction technique. The SSC map enabled front monitoring of SSC fluctuations caused by discharge water due to the sluice gate opening. These results demonstrated the usability of the UAV-based SSC algorithm and confirmed the possibility of monitoring rapid SSC fluctuations.

1. Introduction

Suspended sediment (SS) is a water quality indicator in coastal areas [1,2] that can be quantitatively estimated as the SS concentration (SSC), which includes clay, silt, and small inorganic and organic matter [3]. Thus, SSC is the most critical factor determining water turbidity [4,5,6]. As the concentration of particles suspended in water increased, the scattered light intensity increased while the transparency decreased. Therefore, a high SSC reduces the transparency of water and shallows the photic zone, affecting phytoplankton and algal photosynthesis and reducing ecological productivity [7,8]. Additionally, time-series changes in SS can be used as indicators of environmental and climate change or anthropogenic influences on surrounding waters [9].
Monitoring coastal and estuarine SSC is of great interest to water quality researchers. Traditional SSC measurements are based on field observations that measure the weight of sediment particles per liter by directly filtering water sampled from the field. However, these measurements were obtained through field sampling at discrete locations accessible by ships. Hence, determining the spatiotemporal distribution of SSC is challenging. Remote sensing approaches can overcome these limitations and serve as practical tools for monitoring the broad spatial distribution of SSC [2]. A new technique for estimating SSC by observing the optical properties of water using a spectrometer has been proposed as a faster and more economical method than in situ SSC measurements [10,11,12,13,14]. Optical SSC measurements are obtained by estimating the physical properties of water using its absorption and scattering coefficients [15] and remote sensing reflectance [16].
SSC has been estimated through remote sensing using satellite sensors, such as the Landsat-8 Operational Land Imager and Moderate Resolution Imaging Spectroradiometer (MODIS). Research has been conducted to estimate SSC based on empirical relations through comparative analyses of single-band, multiband, and field observation data [17,18,19,20]. A statistical SSC algorithm can efficiently reflect regional SSC changes. Semi-analytical sediment models with inherent optical properties (IOPs) observed in situ can be used to develop SSC estimation algorithms [1,21,22]. This model can estimate SSC more accurately than using statistical methods but requires field-observed IOP data. Studies on precise SSC calculations using multisensor-based reflectance corrections have been conducted [13,23,24]. This could increase the reflectance accuracy and enable the accurate verification of the SSC reflectance relationship in the observation area.
Although satellite remote sensing is widely used in coastal monitoring, it has insufficient spatiotemporal resolution to monitor the rapidly changing physical environment of the coast [25]. The Geostationary Ocean Color Imager (GOCI) and GOCI-II have been used to monitor SSC in coastal areas and lakes because of their high temporal resolutions of eight and ten times daily, respectively [26,27,28,29]. However, data with higher spatiotemporal resolution are required to monitor changes in ocean currents and water quality in coastal areas [30]. Satellite data have uncertainty around the coastline and the disadvantage of missing data due to clouds [31].
Unmanned aerial vehicles (UAVs) and small spectral sensors can overcome the shortcomings of satellites for coastal observations [2]. UAVs can acquire images at high temporal (approximately 1 s) and spatial (approximately 5 cm) resolutions. In addition, data can be acquired efficiently in the desired area and time, and because the images are taken below clouds, data availability is high in coastal areas. Water quality variables, such as SSC and chlorophyll-a concentration, can be estimated using multispectral and hyperspectral sensors mounted on UAVs [20,32,33,34,35,36]. Additionally, continuous observations using UAVs allow for monitoring environmental changes, such as changes in water quality and the movement of water masses.
This study aimed to estimate SSC along the Saemangeum coast of the Korean Peninsula using a UAV with a multispectral sensor. First, radiometric, geometric, and atmospheric corrections were performed on the UAV observation data to calculate water surface reflectance. Subsequently, a multispectral camera-based SSC estimation algorithm was developed by comparatively analyzing the field data. The SSC estimation algorithm was applied to UAV multispectral images to produce a wide-range, high-resolution SSC map.

2. Materials and Methods

2.1. Study Area

This study was conducted near the Sinsi sluice gate of the Saemangeum Seawall, located off the western coast of Korea (Figure 1). The Saemangeum seawall, 33.9 km long, crosses the coastal area of Saemangeum and separates the interior and exterior of the seawall [37]. The inflow of freshwater from rivers desalinates the water inside the seawall, and the SSC is high because of the continuous supply of terrestrial sediments. Artificial SSC changes occur continuously in this area because of seawall expansion construction [38,39]. Two sluice gates built on the seawall were periodically opened and closed to control for differences between the inside and outside water levels. When opened, a strong current is created near the sluice gates, and a considerable amount of suspended matter is resuspended and transported. The sluice gate may always be open in summer due to high rainfall, and the surface SSC may increase to 55 mg/L−1 due to the river water flowing from the Mangyeong and Dongjin Rivers inside the seawall [17]. Discharged water can drastically change the physical marine environment outside the seawall [40,41,42,43]. Therefore, SSC monitoring is essential for understanding the changes in the marine environment around the Saemangeum coastal area.

2.2. Field Measurements

Field observations were performed from April 2018 to December 2020 at in situ sampling stations (Figure 1c) located outside the seawall and random sampling stations near the Sinsi sluice gate. In addition, aperiodic observations were performed at a random in situ sampling station inside the seawall to investigate the SSC of the water inside the seawall. In situ observations at each sampling station included water sampling and measurements using multispectral and hyperspectral sensors. One hundred sampling stations were sampled over four years (Table 1).

2.2.1. Water Sampling to Measure SSC

In situ SSC measurements were collected to validate the SSC calculated using the multispectral sensor. Specifically, water, approximately 30 cm below the sea surface, was collected using a 3 L bucket and poured into 2 L sterile sample bottles until overflowing. Each bottle was labeled and stored at <0 °C and the samples were immediately analyzed in the laboratory. The collected samples were filtered with 0.7 μm GF/F filter paper and dried at 105–110 °C to measure the total weight (provided by Water and Eco-Bio Co., Ltd., Kunsan, Republic of Korea). The filtered paper was measured on a scale of milligrams per liter of seawater (mg L−1), and this measurement was recorded as the SSC.

2.2.2. In situ Spectral Measurements for the Water Surface

This study observed sea-surface spectral signals using a RedEdge multispectral camera (Figure 2). This camera can be used in agriculture and water quality monitoring and can be handheld or mounted on a UAV to capture multispectral images. RedEdge has five independent spectral lenses (475, 560, 668, 717, and 840 nm) (Figure 2b). The five imagers of the RedEdge are arranged in the order of blue, green, red, near-infrared (NIR), and red-edge wavelength (Figure 2a). The file names of raw images are numbered according to the order of the imagers (“IMG_0000_1-5. tif”). Because RedEdge was developed for vegetation monitoring using red-edge wavelengths, the red-edge lens was placed at the center (Imager 5) of the camera (even though NIR has a longer wavelength). Therefore, the order of the RedEdge images does not match the wavelength order. By changing the order of imagers 4 and 5, all band names were arranged in the order of increasing wavelength. Each lens simultaneously captured images for each wavelength band, and the lens-specific and standard camera parameters were written into the metadata for each image. When observations were performed at an altitude of approximately 120 m using RedEdge mounted on a UAV, the ground sample distance (GSD) was 8 cm per pixel, and the area was approximately 80 × 106 m2 (VHOV: 36.9°; HFOV: 47.9°) [44].
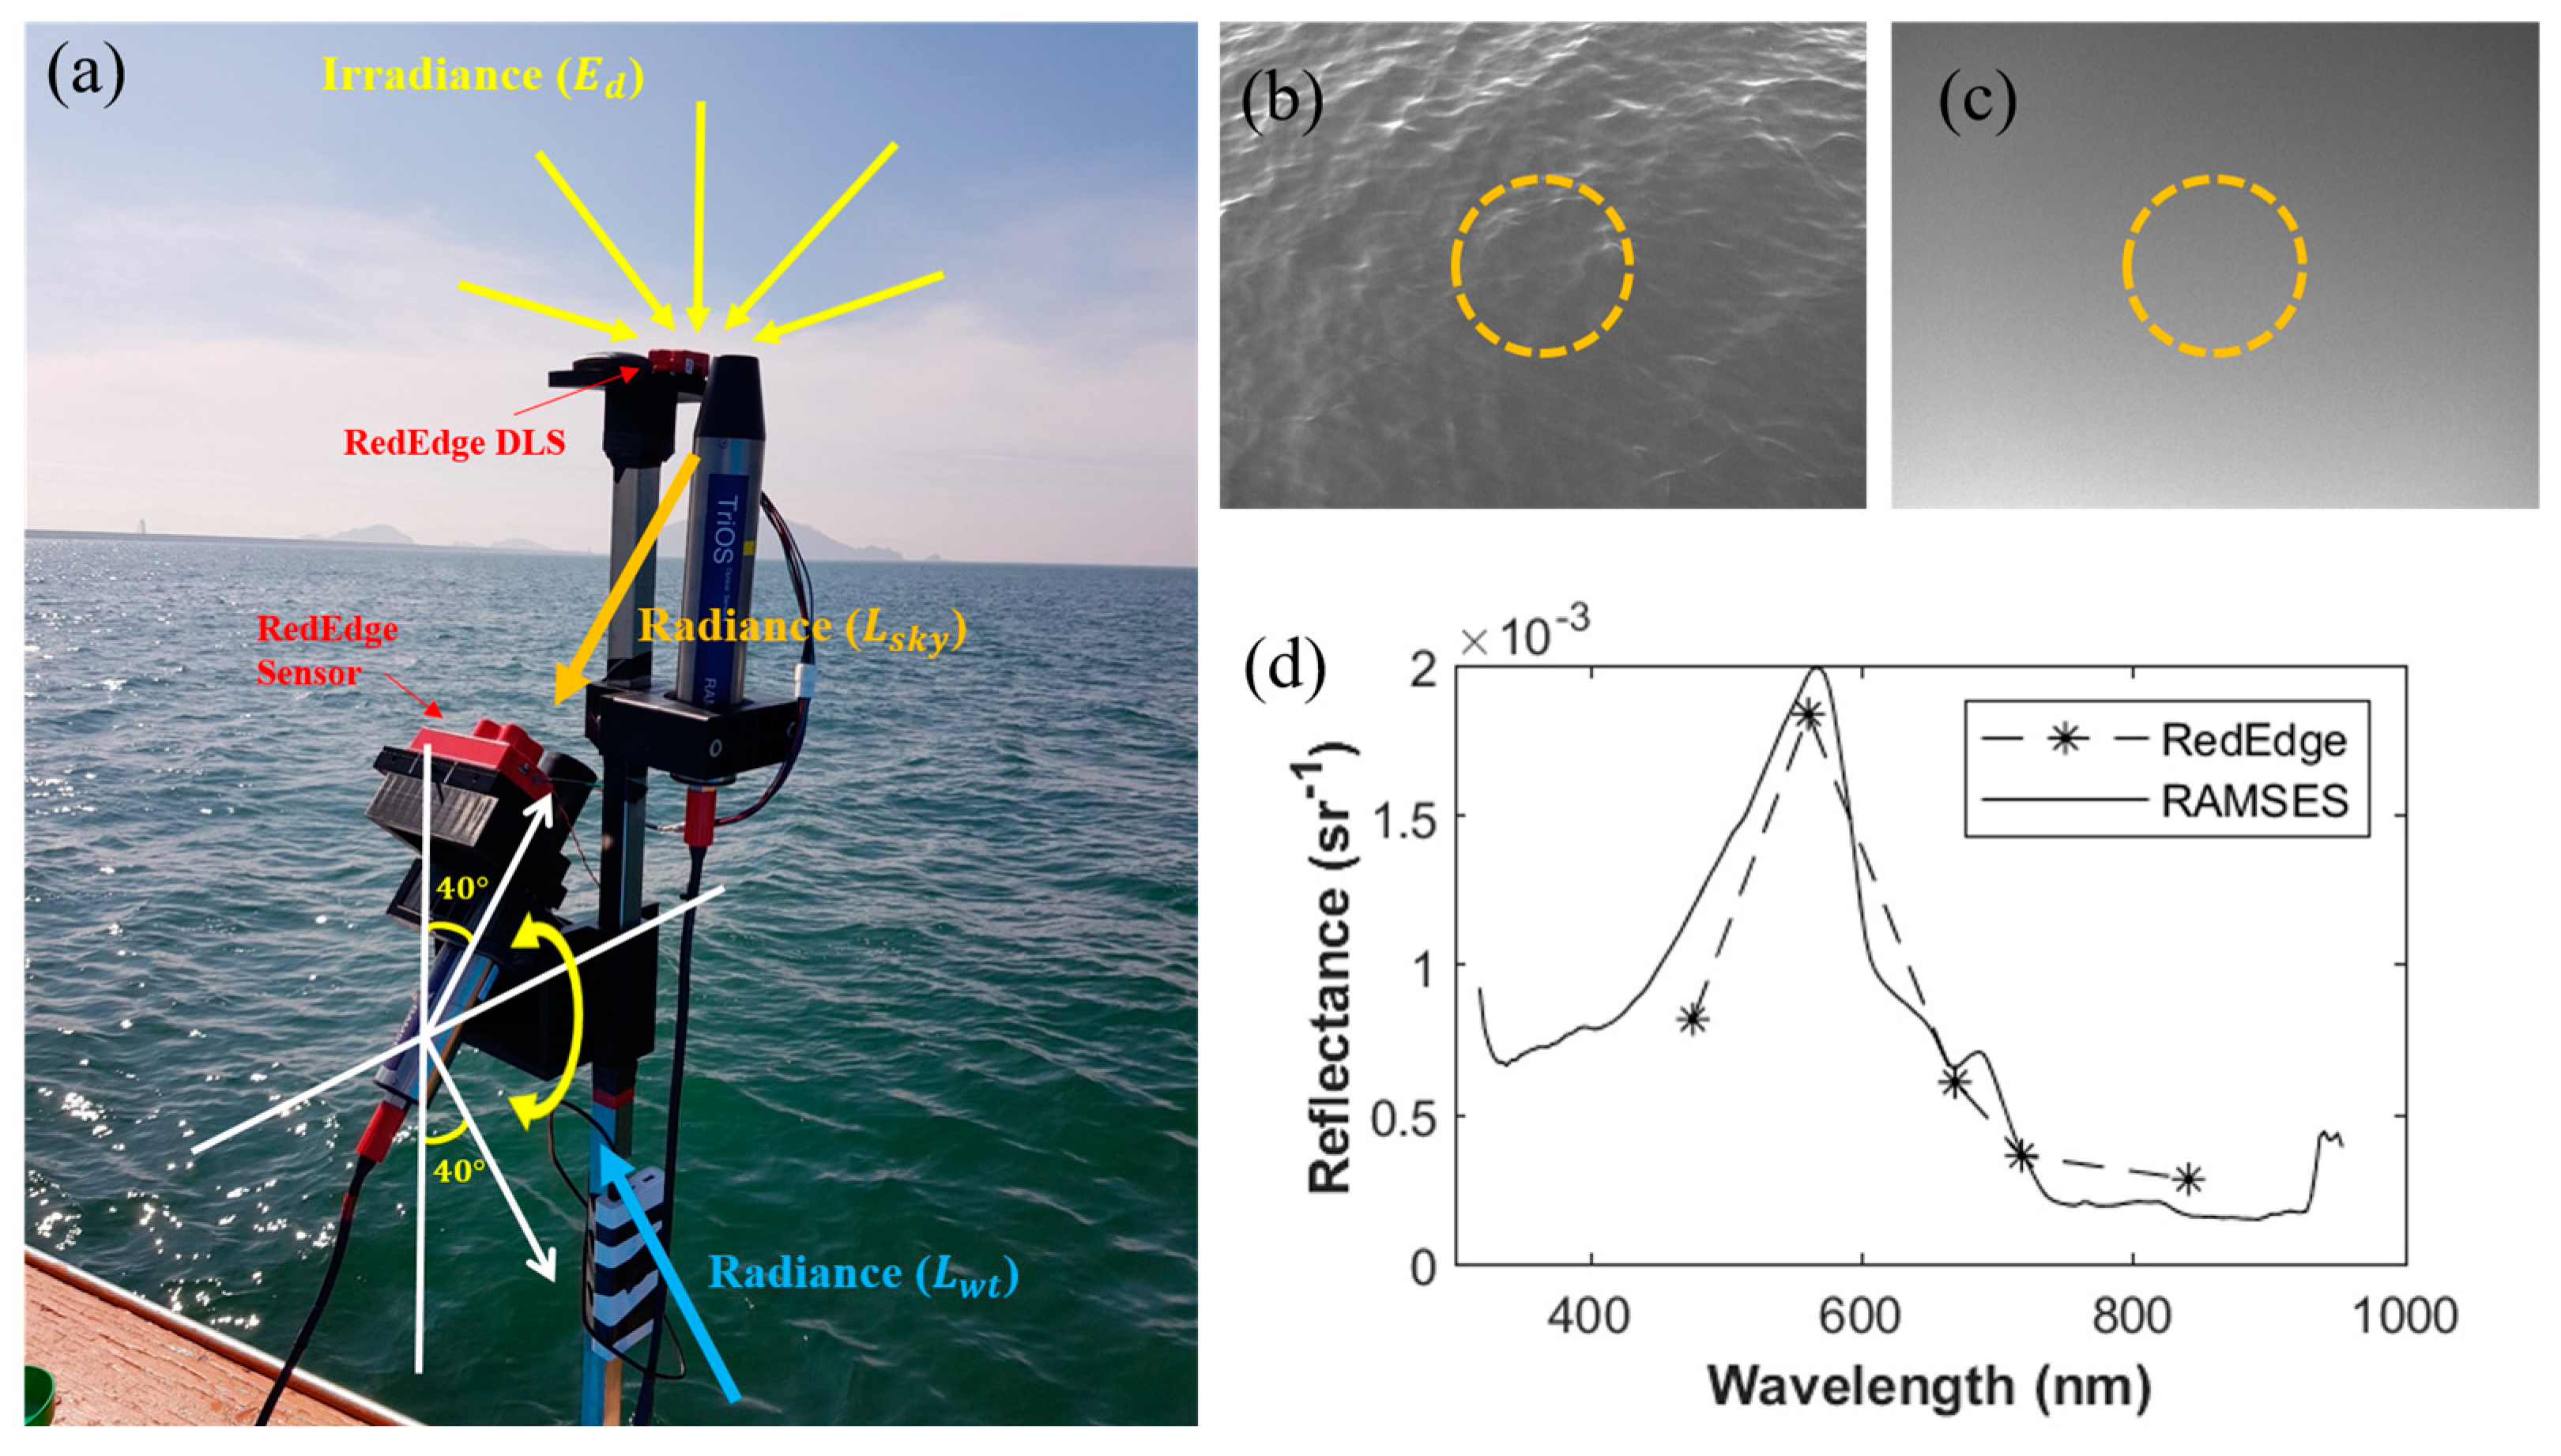
RedEdge was mounted on a 3 m high pole installed on the side of the boat (Figure 3a). An observation frame fabricated using a 3D printer was designed to control the pitch direction of RedEdge. RedEdge can be adjusted to an angle of 40° in the off-zenith and off-nadir directions for the water surface, and images corresponding to sky radiance and water-leaving radiance can be captured in each direction (Figure 3b,c). At the top of the observation frame, the downwelling light sensor (DLS) module of RedEdge, which observes downwelling irradiance, was installed skyward. In addition, camera posture and location information can be acquired using Global Positioning System (GPS) and Inertial Navigation System (IMU) sensors within the DLS module.
Performance was evaluated to confirm the sensitivity of RedEdge to water quality observations (Figure 3d). TriOS RAMSES [45] is a hyperspectral sensor with 256 channels for the UV-Vis wavelength band (320–950 nm) and is a high-precision radiometer used for monitoring land and water quality. Kim et al. [46] showed that the radiance and irradiance had lower spectral values in the NIR wavelength band of RedEdge than in the TriOS RAM SES; however, their differences were negligible in most bands. Thus, RedEdge can obtain 2D ocean color observations instead of the TriOS RAMSES. This study performed inter-calibration of RedEdge data with TriOS RAMSES data to ensure the reliability of the RedEdge observation data. The radiance radiometer of TriOS RAMSES was installed on the same frame as the RedEdge, and the irradiance radiometer was installed at the same height as the observation plane of the RedEdge DLS sensor. The data from each sensor were recorded for 2 min at intervals of 5 s per station. The position and orientation of the boat were fixed during the observations.

2.2.3. Multispectral Imagery from the UAV-Borne RedEdge

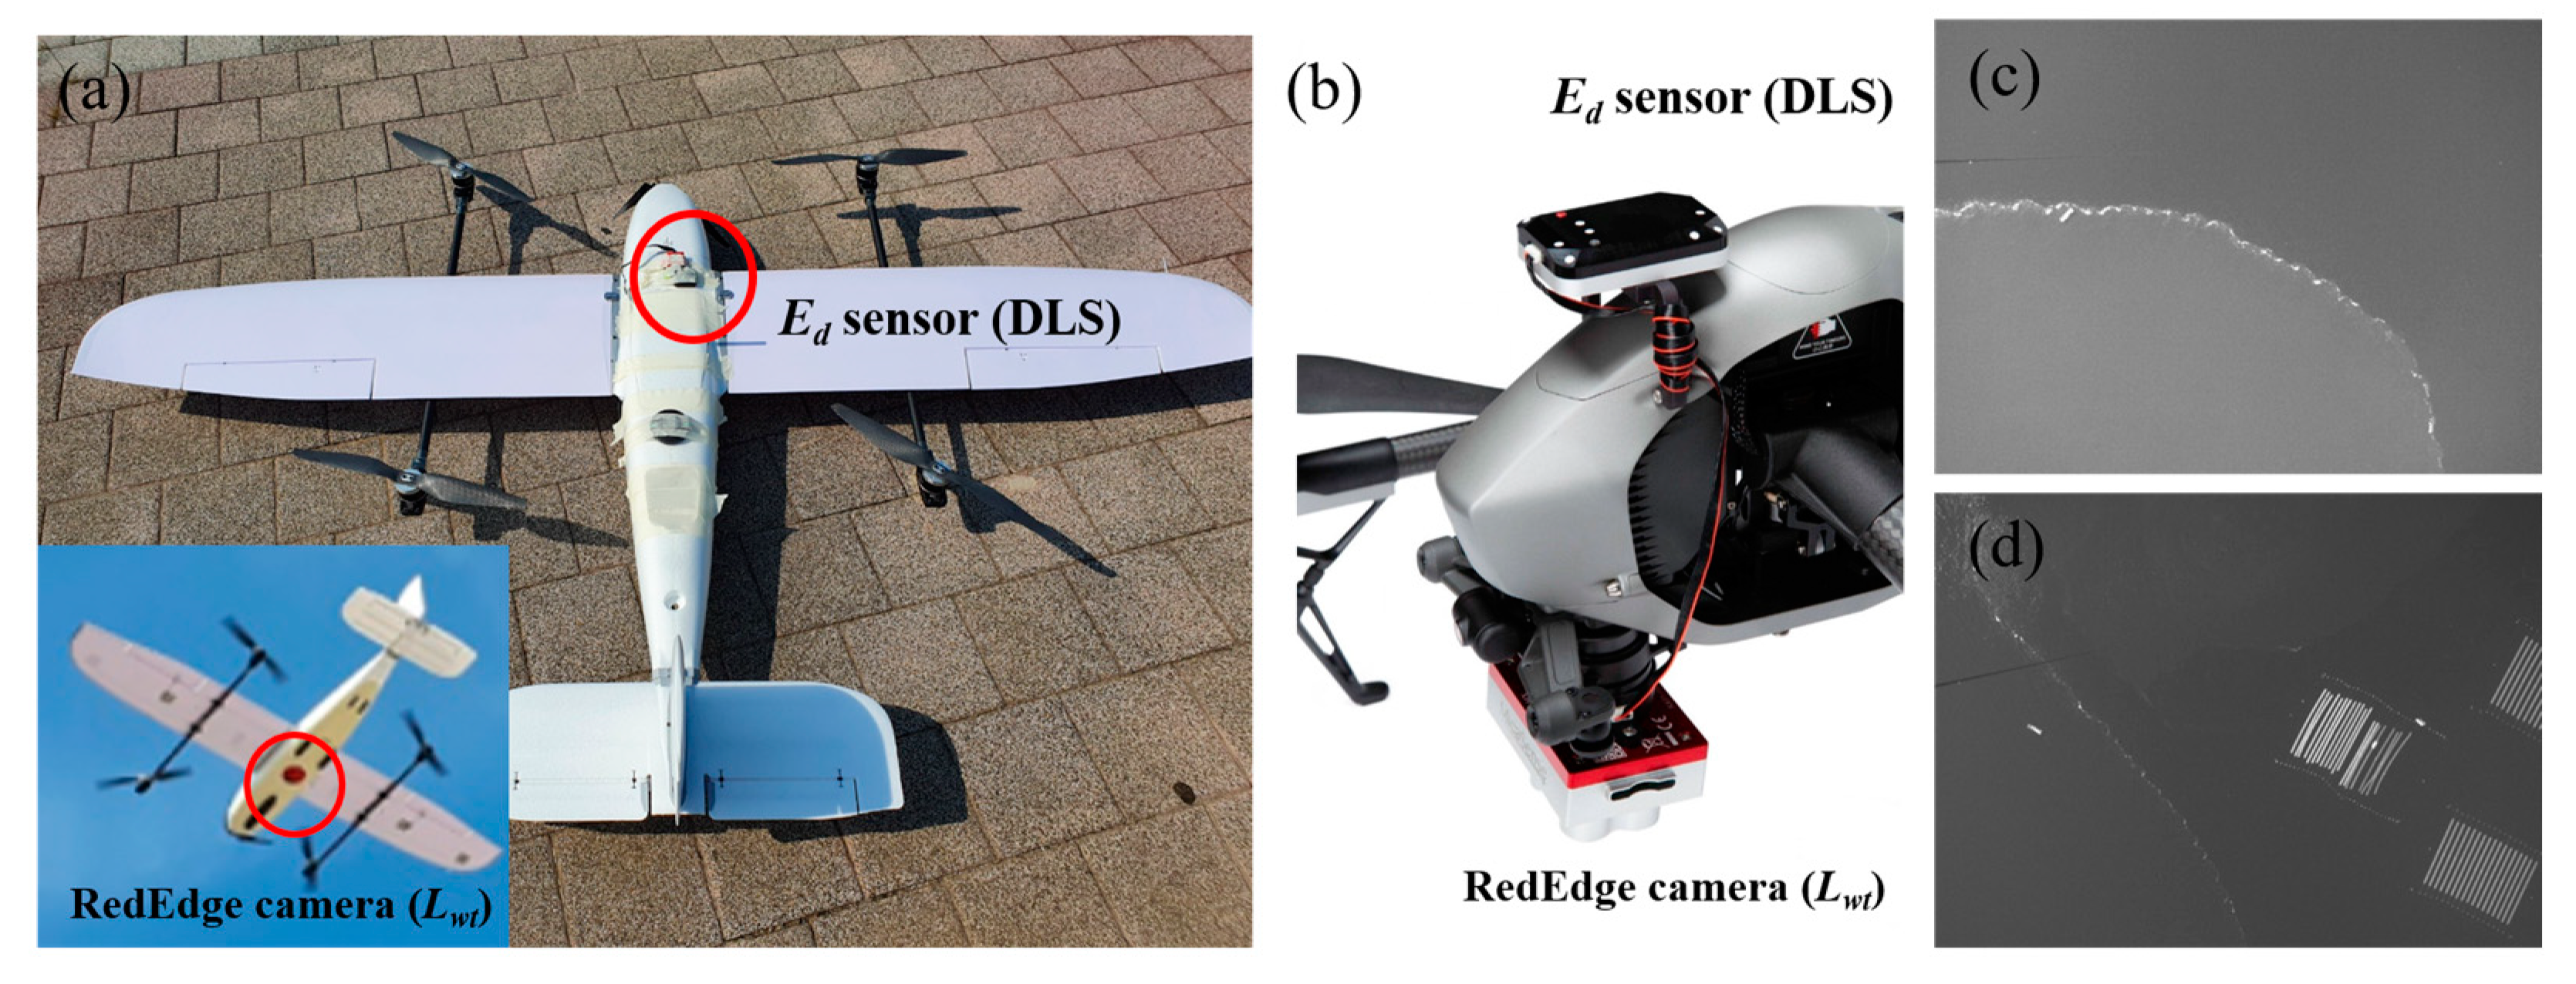
An aerial survey of the water surface was performed using a RedEdge mounted on a UAV. Two UAVs were used: the Foxtech Loong 2160 vertical takeoff and landing (VTOL) UAV (Figure 4a) and the DJI Inspire 2 rotorcraft quadcopter (Figure 4b). RedEdge was mounted at the bottom of each UAV facing the water surface to acquire surface spectral data (Figure 4c,d), and the DLS module for acquiring irradiance was installed on the top frame of the UAV facing the sky.
Although the flight capability of the VTOL depends on weather conditions, on average, it could observe a range of approximately 15 km2 during a flight on a 25–30 km route for 40 min. The average flight altitude was approximately 500 m, and the average GSD was 34 cm/pixel. The VTOL flowed along an automatic flight path based on a preset image overlap rate and flight speed. The observed multispectral image sequences were projected onto the water surface using direct georeferencing and were converted into reflectance and 2D SSC images.
UAVs can acquire mapping data over large areas through automatic flights along preset flight paths. UAV mapping data and SSC estimation using these data enabled the creation of a wide-range SSC map of the water surface. The automatic flight path in the observation area was set to 50% of the vertical and horizontal overlaps between the image strips, which minimized the overlap between images projected through direct georeferencing. Most VTOL and UAV flights are conducted under cloudless, clear-sky conditions.

2.3. Multispectral Image Processing

Figure 5 shows the overall workflow for calculating the multispectral camera-based SSC estimation algorithm and the SSC map. The data acquired from the multispectral cameras installed on ships and UAVs were independently processed after radiometric calibration and image alignment.

2.3.1. Image Preprocessing

A raw RedEdge image was acquired as a 16-bit RAW TIFF file (GeoTIFF) for all five bands. The pixel values of the raw images were saved as digital numbers (1–65536) and converted into absolute spectral radiance values in units of Wm−2 sr−1 nm−1 via radiometric calibration. The RedEdge radiometric calibration model [47] is described below and can be used to calculate the wavelength radiance L:
L λ = V ( x , y ) × a 1 / g × ( P P B L ) / ( t e + a 2 y a 3 t e y )
where L is the wavelength radiance in Wm−2 sr−1 nm−1, V(x,y) is the vignette polynomial function for the pixel position (x,y), a1, a2, and a3 are radiometric calibration coefficients, g is the gain setting of the sensor, P is the normalized raw digital number value, PBL is a normalized black level value, and te is the exposure time of the image. The p-value corresponds to the conversion (normalization) data of the RAW pixel values first observed by RedEdge’s complementary metal oxide semiconductor (CMOS) sensor to a value between 0 and 1. All other variables were recorded in the metadata from the TIFF files. Vignette distortion is a polynomial of the distance from the reference coordinates, as shown below. Each coefficient required for correction is recorded in the spectral image metadata.
V ( x , y ) = 1 / k
k = 1 + k 0 r + k 1 r 2 + k 2 r 3 + k 3 r 4 + k 4 r 5 + k 5 r 6
r = ( x c x ) 2 + ( y c y ) 2
where r is the pixel distance from the center of the vignette to the pixel (x,y). The pixels (x,y) denote the pixel coordinates to be modified. k represents the six vignette correction coefficients and is the set value for camera manufacturing. The number of pixels on the x- and y-axis of the input image corresponds to cx and cy (1280 × 960), respectively.
The center position of the captured image varies depending on the installed position of each lens because RedEdge uses independent lenses to obtain spectral images for each band. This difference must be corrected because it causes a positional deviation for specific objects photographed at the same pixel coordinates for each band. This can be achieved through a 2D affine transformation between images captured using different lenses. The image captured from the lens (band 5) at the center of the RedEdge lenses served as a reference for image alignment, and the images of the other bands were shifted based on the position of the reference image. A few pixels with nonoverlapping edges were removed from the affine-converted images based on the reference image.

2.3.2. Calculating Water Surface Reflectance

When calculating water reflectance using an optical sensor, measuring the radiance reflected from the water body (Lw, retrieved water-leaving radiance) is necessary. The light reflected from the water (Lwt, total radiance leaving the water surface) includes Lw and the surface reflection of the sun and sky from the water surface (light reflected from the seabed can be included if the water depth is shallow). Therefore, methods have been proposed for measuring Lw directly in water using waterproof sensors or observing Lw by placing the sensor in a submerged cylinder [48]. However, because camera-based spectroscopic sensors, such as RedEdge, are designed to operate above the water surface, a method to attenuate the measured Lw reflection on the water surface is appropriate.
According to Mobley [16], the degree of surface reflection changes based on the angle of incidence, and repeated model experiments have confirmed that surface reflection at a specific angle can be minimized. The observation angles that minimized the surface reflection were 40° zenith and 135° azimuth, and the Fresnel reflectance (pf) at these angles was 0.028. Therefore, Lwt and Lsky were observed while maintaining the zenith and azimuth angles of the sensor (Figure 3); Lw was calculated as follows:
L w = L w t ρ f × L s k y
The amount of radiance observed by the optical sensor was affected by the time-varying solar radiance. When acquiring a spectral image using RedEdge, the DLS module measures the downwelling irradiance (Ed) corresponding to the amount of solar radiance; alternatively, Ed can be estimated by taking a calibrated reflectance panel with RedEdge before and after the observation. The normalized reflectance (Rrs) was calculated from the ratio of Lw calculated in Equation (3) to Ed observed using RedEdge:
R r s = L w / E d
Data reliability was verified using the calculated RedEdge Rrs data through comparative analysis with the observed values from the RAMSES sensor. The RAMSES data were installed in the same frame as those of RedEdge, observations were performed for Lwt, Lsky, and Ed, and Rrs was calculated using the same process as that for RedEdge. As RedEdge acquires data in the form of an image (FOV of 47.9°), the average value of 50 × 50 pixels at the center of the sensor was compared with that of the RAMSES data (Figure 6).

2.3.3. Reflectance of UAV Multispectral Images

For multispectral images observed via the UAV-mounted RedEdge, the reflectance was calculated using a procedure different from the optical observation protocol used on the water surface (on a boat). To observe the water surface from the boat, the zenith angle was fixed at 40° in the Lwt direction to minimize the surface reflection, and Lsky was observed by fixing the zenith angle at 40° upward at the same azimuth. Radiation in the sky and water directions was assumed to be reflected and incident at the same location on the water surface. This assumption is applicable because the observation altitude is sufficiently low (near sea level). These observations were performed at the same location, and the sea level was homogeneous within a narrow range. However, as the altitudes of the observation sensors increased, the horizontal position deviation between the incident and reflected surfaces observed by each sensor increased.
In remote sensing using UAVs, installing a multispectral camera on a UAV pointing towards the sea surface and sky while maintaining a zenith angle (40°) can cause severe geometric errors between observations. A UAV flight is limited to an altitude of 500 m in the permitted flight zone (depending on the local aviation safety laws). In this case, the horizontal positions of Lwt and Lsky in the captured image may differ by approximately 840 m. Therefore, a multispectral camera mounted on the UAV must be installed parallel to the horizontal plane to capture the images. Therefore, the UAV reflectivity (RUAV) was calculated based on the ratio of Lw observed using the UAV multispectral camera to the Ed value provided by the DLS.
R U A V = L w t / E d

2.4. Georeferencing on the Water Surface

The RedEdge images obtained from the UAV were converted into RUAV images using radiometric and atmospheric corrections. For spatial analysis of RUAV images, it is necessary to allocate latitude and longitude information to each image pixel through georeferencing. Image georeferencing can provide projections between planes through a spatial matrix calculated using ground reference points located on the observation surface. However, measuring fixed ground reference points on the water surface is not feasible. Therefore, direct georeferencing was used to calculate the rotation matrix using altitude and 3D position information for each aerial photograph. This method can be used to aerially survey fluid surfaces, such as oceans.
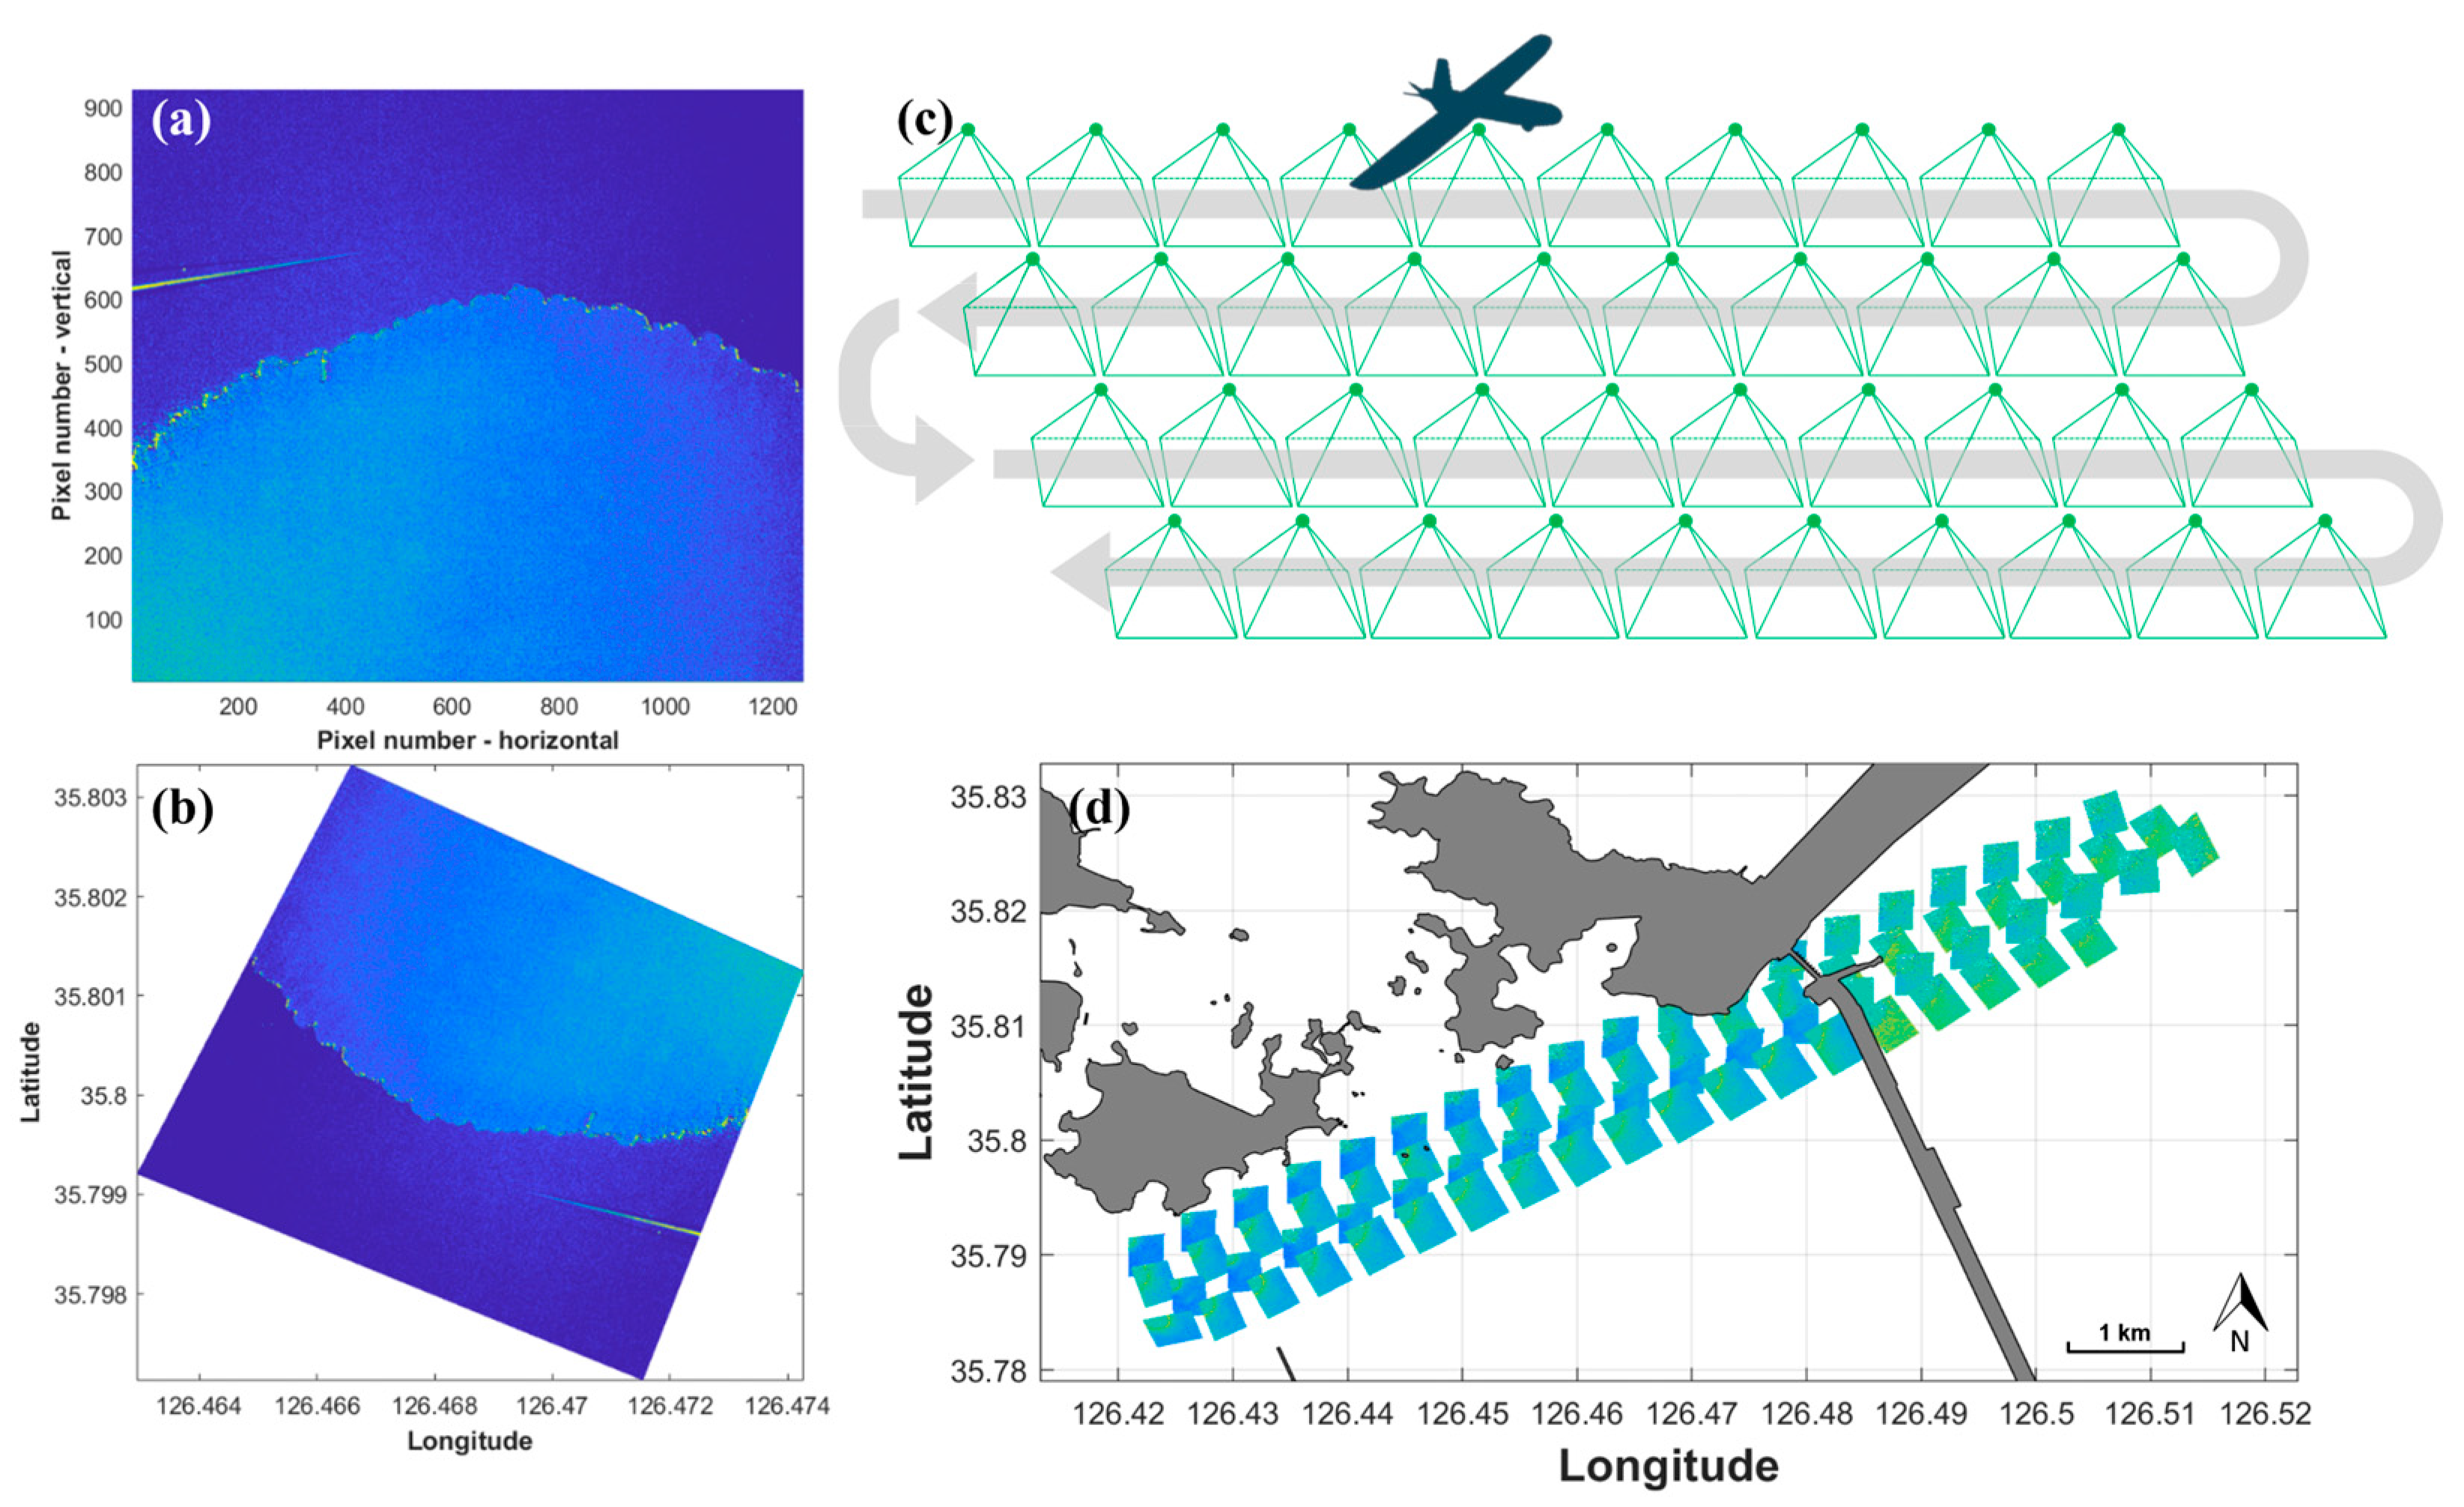
Direct georeferencing was performed by projecting the pixel coordinate system of the observed multispectral image onto the water surface coordinate system (Figure 7). The rotation matrix for the projection between the two coordinate systems was calculated using the geometric information of RedEdge, including the latitude, longitude, altitude, and posture, with internal camera variables, such as the CCD sensor size, focal length, and angle of view. Based on the calculated rotation matrix, multispectral images captured using the UAV were projected directly onto the water surface. Direct georeferencing without ground control points (GCP) cannot calculate the elevation of the projected coordinate system. However, the actual sea surface is rough because of waves. This study ignored the elevation difference caused by wave height within the observation range (width = 500 m), and the sea surface was assumed to be flat. All processes were automated using MATLAB scripts and batched to all the observed datasets.

3. Results

3.1. SSC Estimation and Validation Results

SS in seawater causes the absorption and scattering of light passing through the water column, which can be measured using a spectroscopic sensor. Figure 8 shows the spectral shape of seawater under various SSC conditions measured using RedEdge and RAMSES in the study area. Figure 8a shows that the reflectance of the seawater measured by each sensor increased as the SSC of the seawater increased. In addition, the reflectance increases substantially, particularly in the green (560 nm) and red (668 nm) bands. Thus, it was confirmed that RedEdge could sufficiently measure changes in the reflectance and spectral shape as the SSC of the seawater increased.
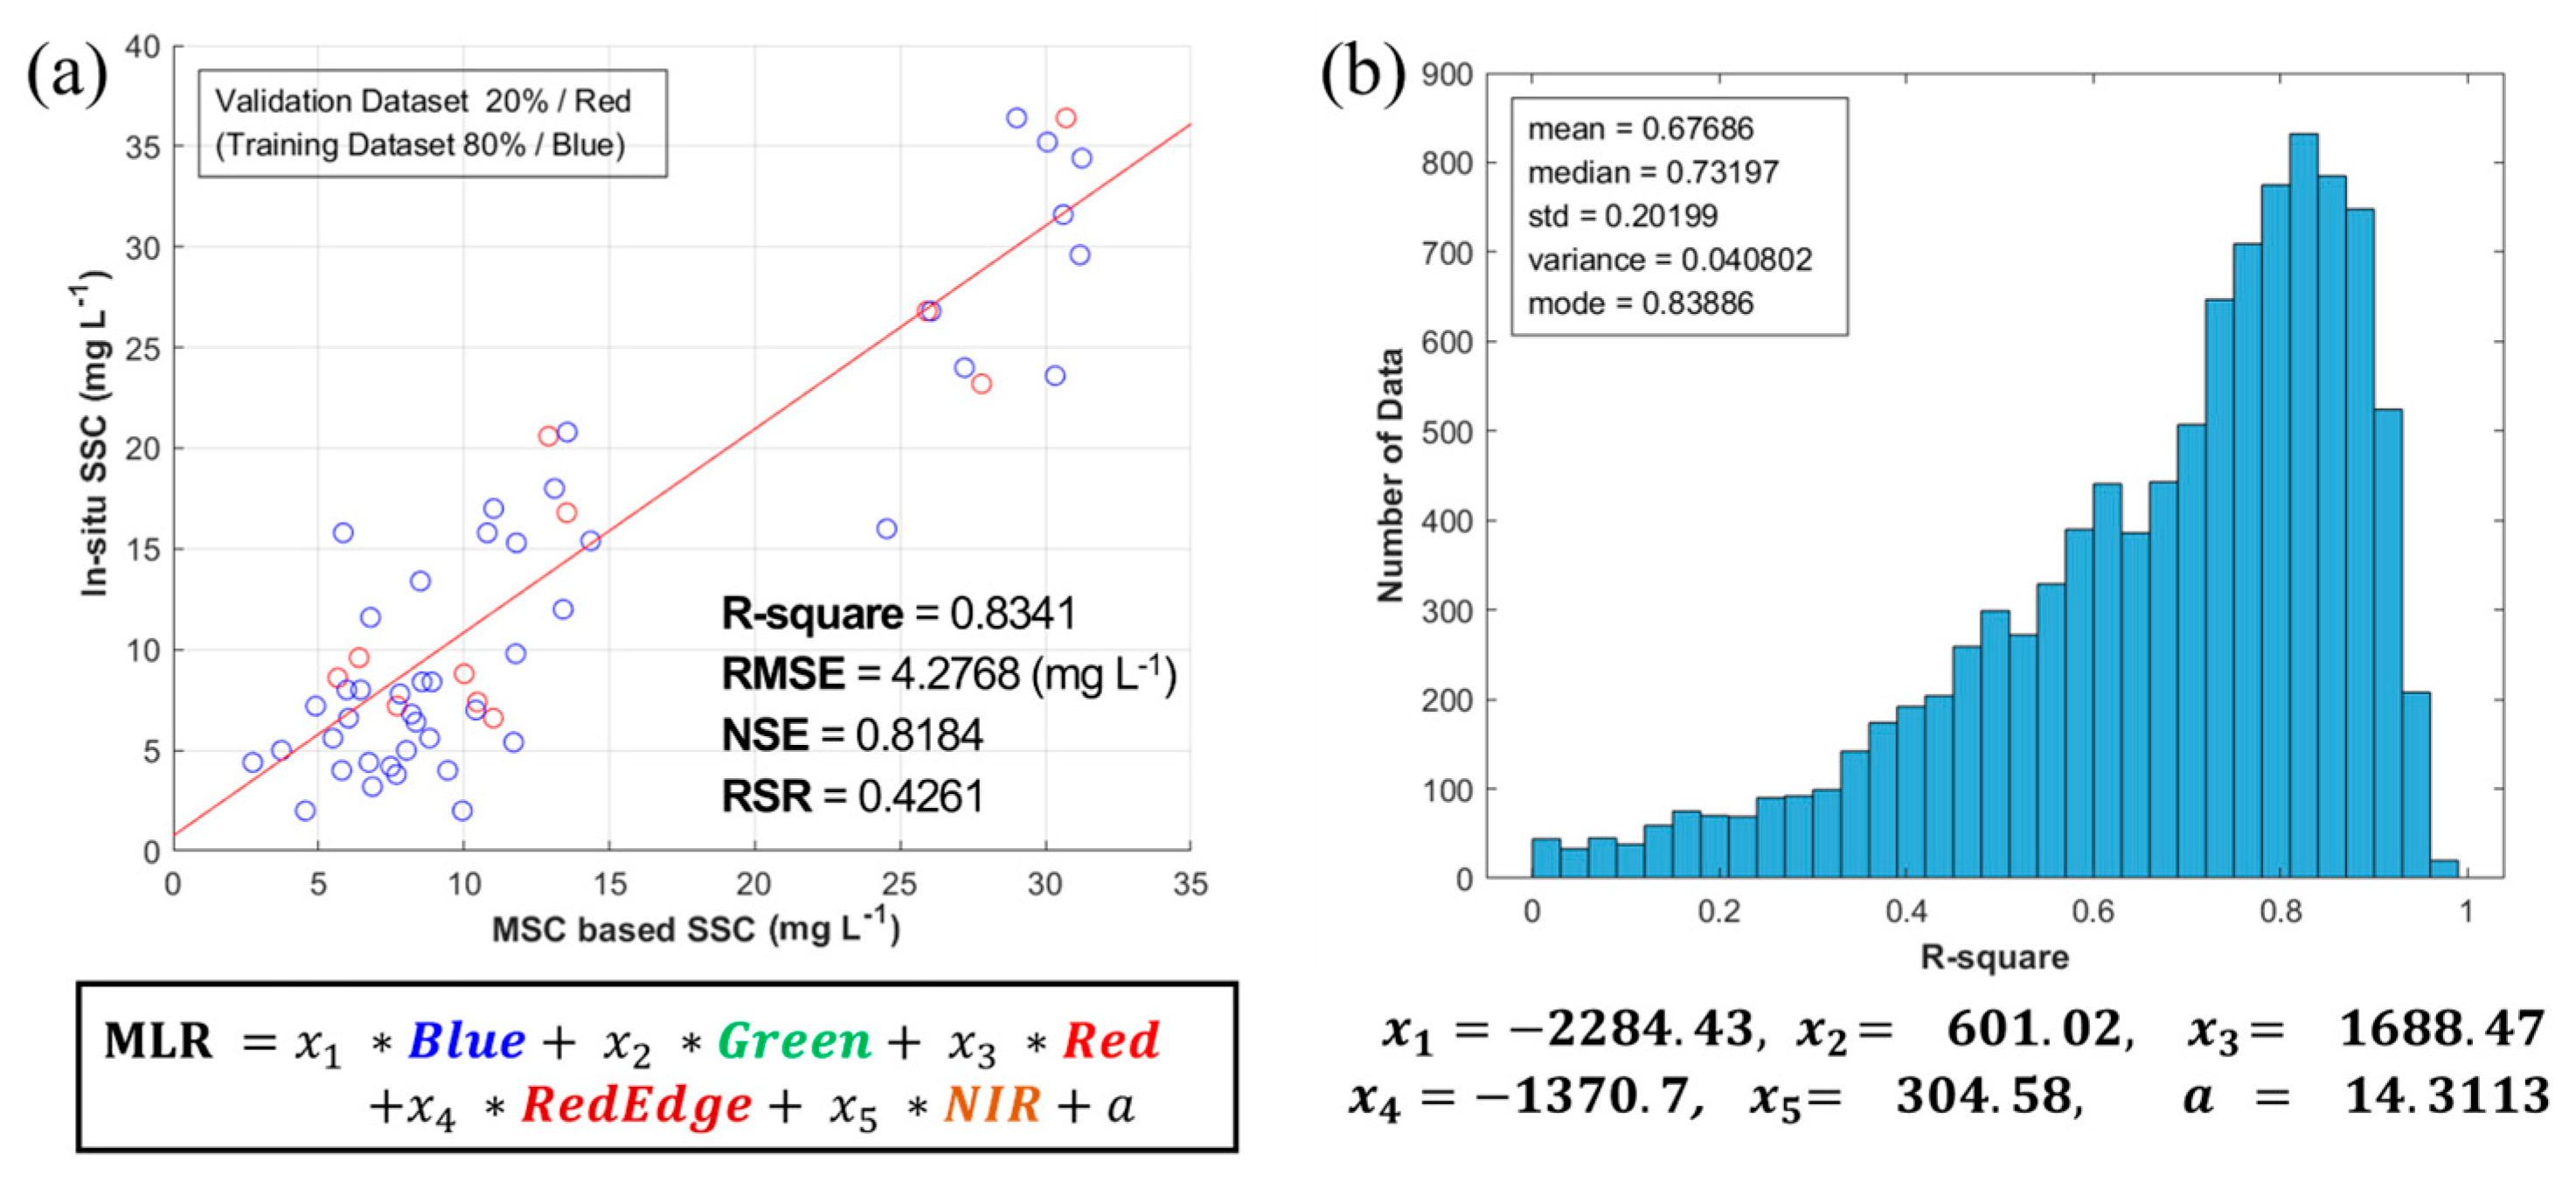
The multispectral images obtained by sampling from the boat were converted into Rrs images using a radiometric correction process and compared with field measurements. To reflect the substantial SSC variability (2.5–36 mg L−1) of seawater in the study area and the influence of various suspended and dissolved substances other than SSC, all five wavelength bands observed through a multispectral camera were used as input data. A multiple linear regression (MLR) model was used to determine the relationship between several independent variables (multispectral images) and the reference target dependent variable (in situ SSC). The partial regression coefficient for each spectral band was estimated using the MLR, and the SSC estimation algorithm was constructed using an appropriate coefficient (Figure 9). The MLR model was trained with 80% of the total dataset, and 20% was used to validate the algorithm. The multispectral-camera-based SSC concentration (SSCmsc) was estimated using an MLR model. As a result of the comparative analysis with in situ SSC, the model showed good performance with R2, root mean square error (RMSE), Nash–Sutcliffe efficiency, and ratios of RMSE to the standard deviation of the observation of 0.83, 4.27, 0.81, and 0.42, respectively. This result shows a higher correlation than the existing Landsat and MODIS-based SS estimation algorithm (R2 = 0.72) performed in Saemangeum, and it also shows accurate estimation results compared to prior studies on SSC estimation using multispectral cameras (R2 = 0.74) and hyperspectral cameras (R2 = 0.72, RMSE = 0.79) mounted on UAVs [2,34,43]. The field observation data used to calculate the SSC algorithm included an area outside the seawall with relatively clear seawater (average 7 mg L−1) and a relatively turbid area inside the seawall (average 27 mg L−1). Despite the extensive SSC range of the in situ data, SSCmsc showed a linear relationship with the in situ SSC data.

3.2. Atmospheric Correction for UAV Multispectral Images

Atmospheric correction must be performed for satellite ocean color remote sensing because the atmospheric layer between the sea surface and the observation sensor is at a considerable distance (250–36,000 km). In the case of UAV observation data, the atmospheric layer between the sensor and target is relatively thin compared with that of satellite remote sensing. UAV observations are typically performed at altitudes below clouds (~1.5 km). Therefore, the need for atmospheric correction of the UAV observational data has been overlooked. However, the effects of light scattering and absorption by water vapor and aerosols in the atmosphere can be significant even at low altitudes [49,50]. The scattering and absorption of the atmosphere have a more significant effect on the signal reflected from the ocean than on land because the strength of the signal reflected from water is only approximately 10% of that on land [51]. Therefore, atmospheric correction must be performed to quantitatively analyze low-altitude remote sensing data from ocean surfaces.
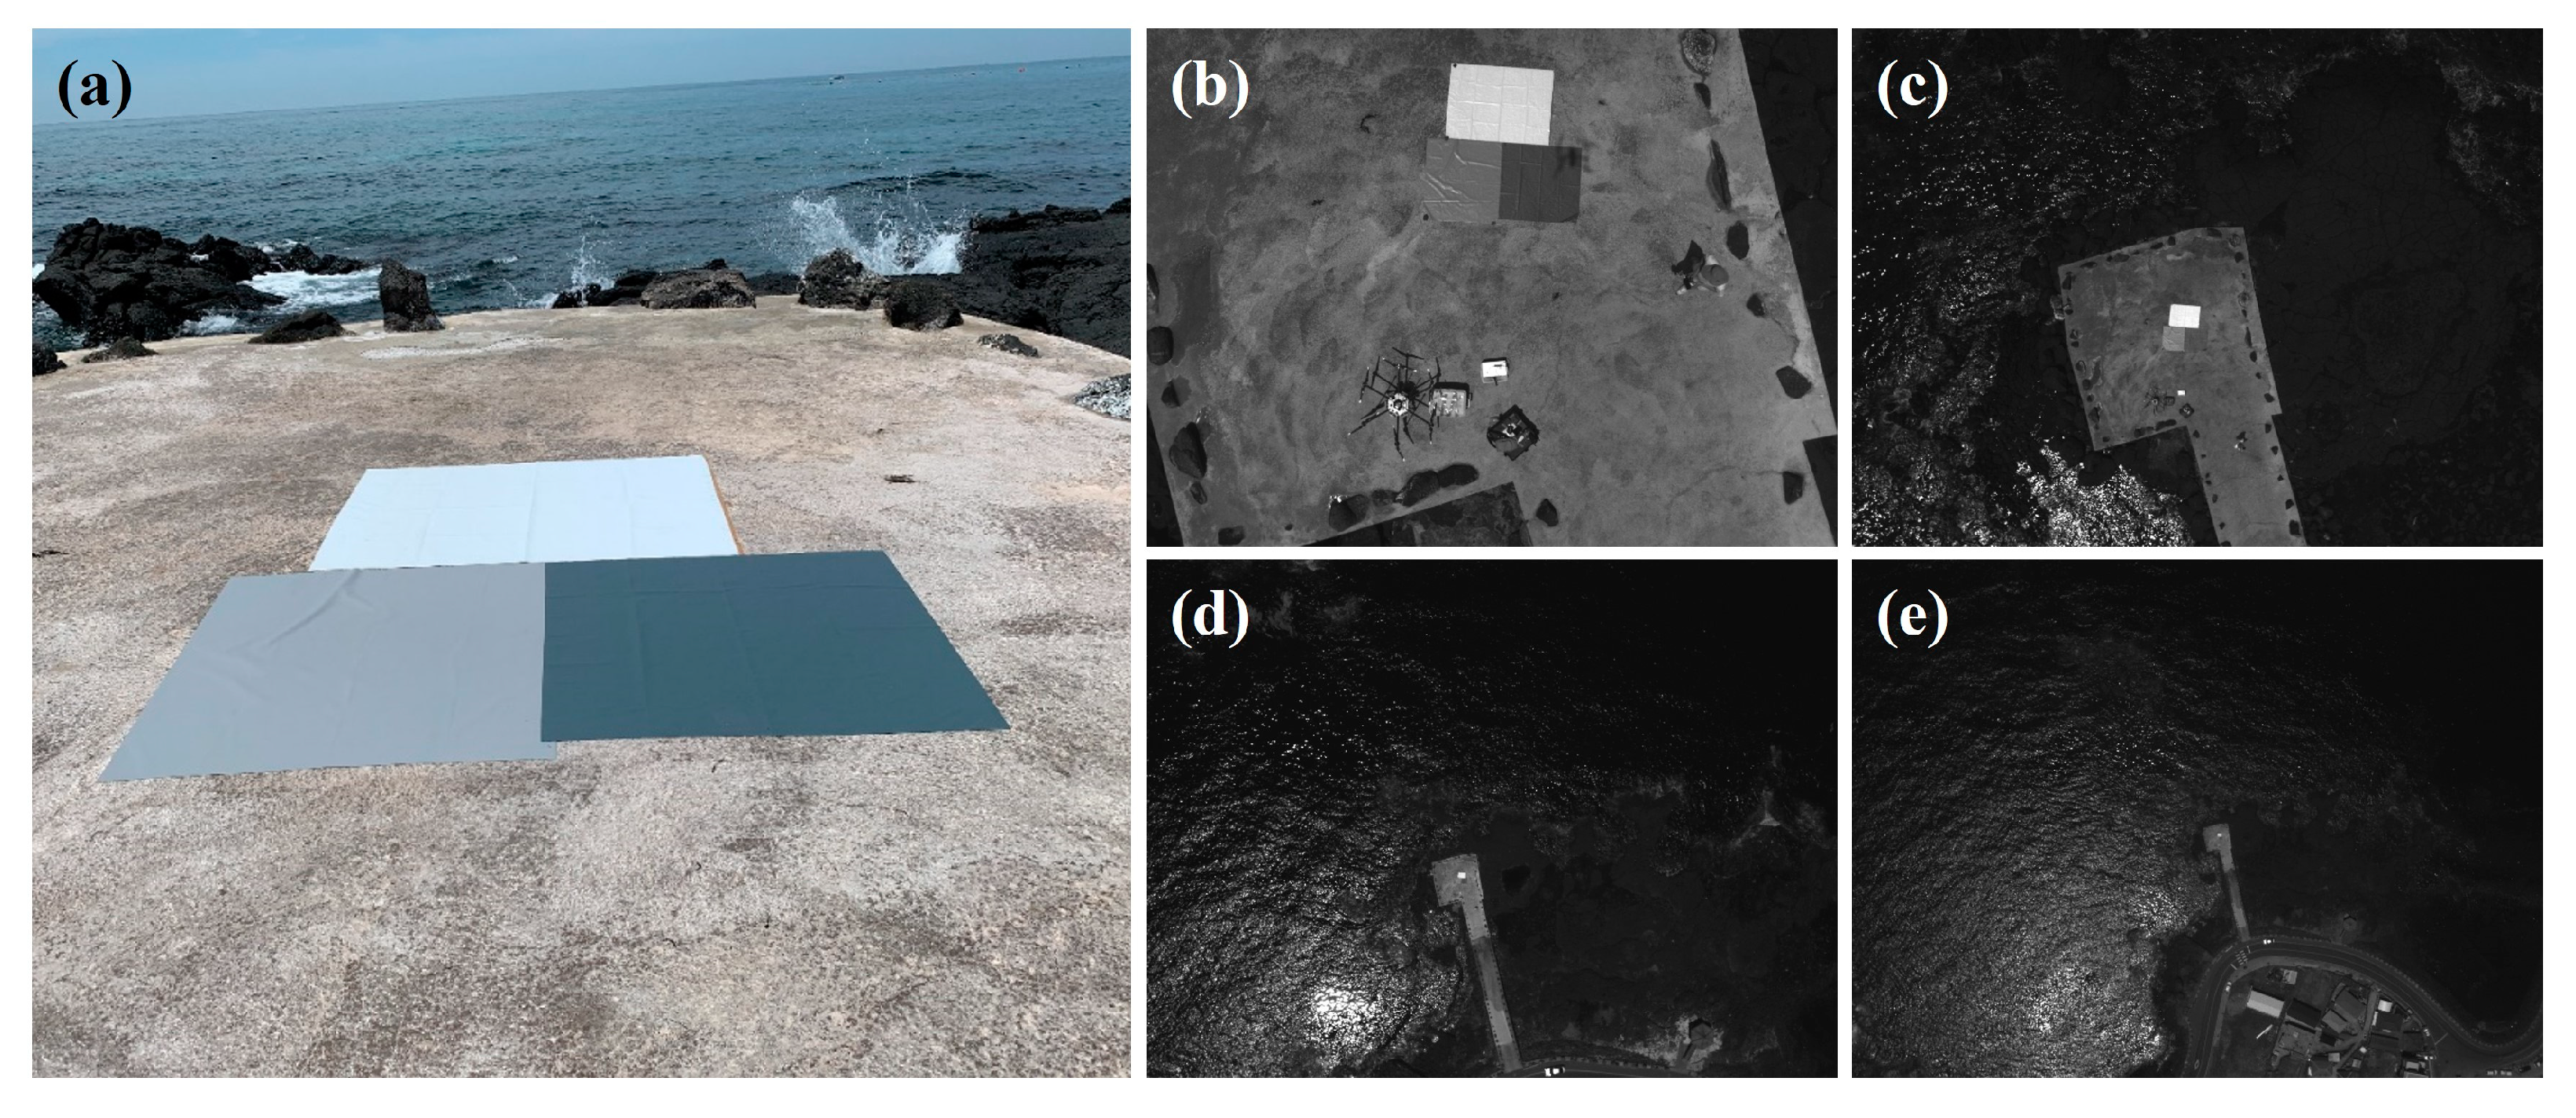
A relative atmospheric correction method using a reference panel was applied to UAV multispectral images. The relative atmospheric correction technique indirectly estimates atmospheric scattering and absorption effects using image information without a numerical analysis of the radiative transfer process [52]. Relative atmospheric correction is suitable for UAV data with high spatial and temporal resolutions because it can be performed without atmospheric information from field observations. Three tarps (1.2 × 1.2 m2) comprising polyvinyl chloride were used for relative atmospheric correction. The tarps were white, gray, and dark gray (Figure 10). Three tarps were installed at the UAV takeoff and landing locations and were continuously photographed using a multispectral camera mounted on the UAV during vertical ascending and descending flights to cruising altitudes of 4–500 m. The UAV ascended and descended at approximately 4 m/s, and the shooting interval of RedEdge was set to 2 s.
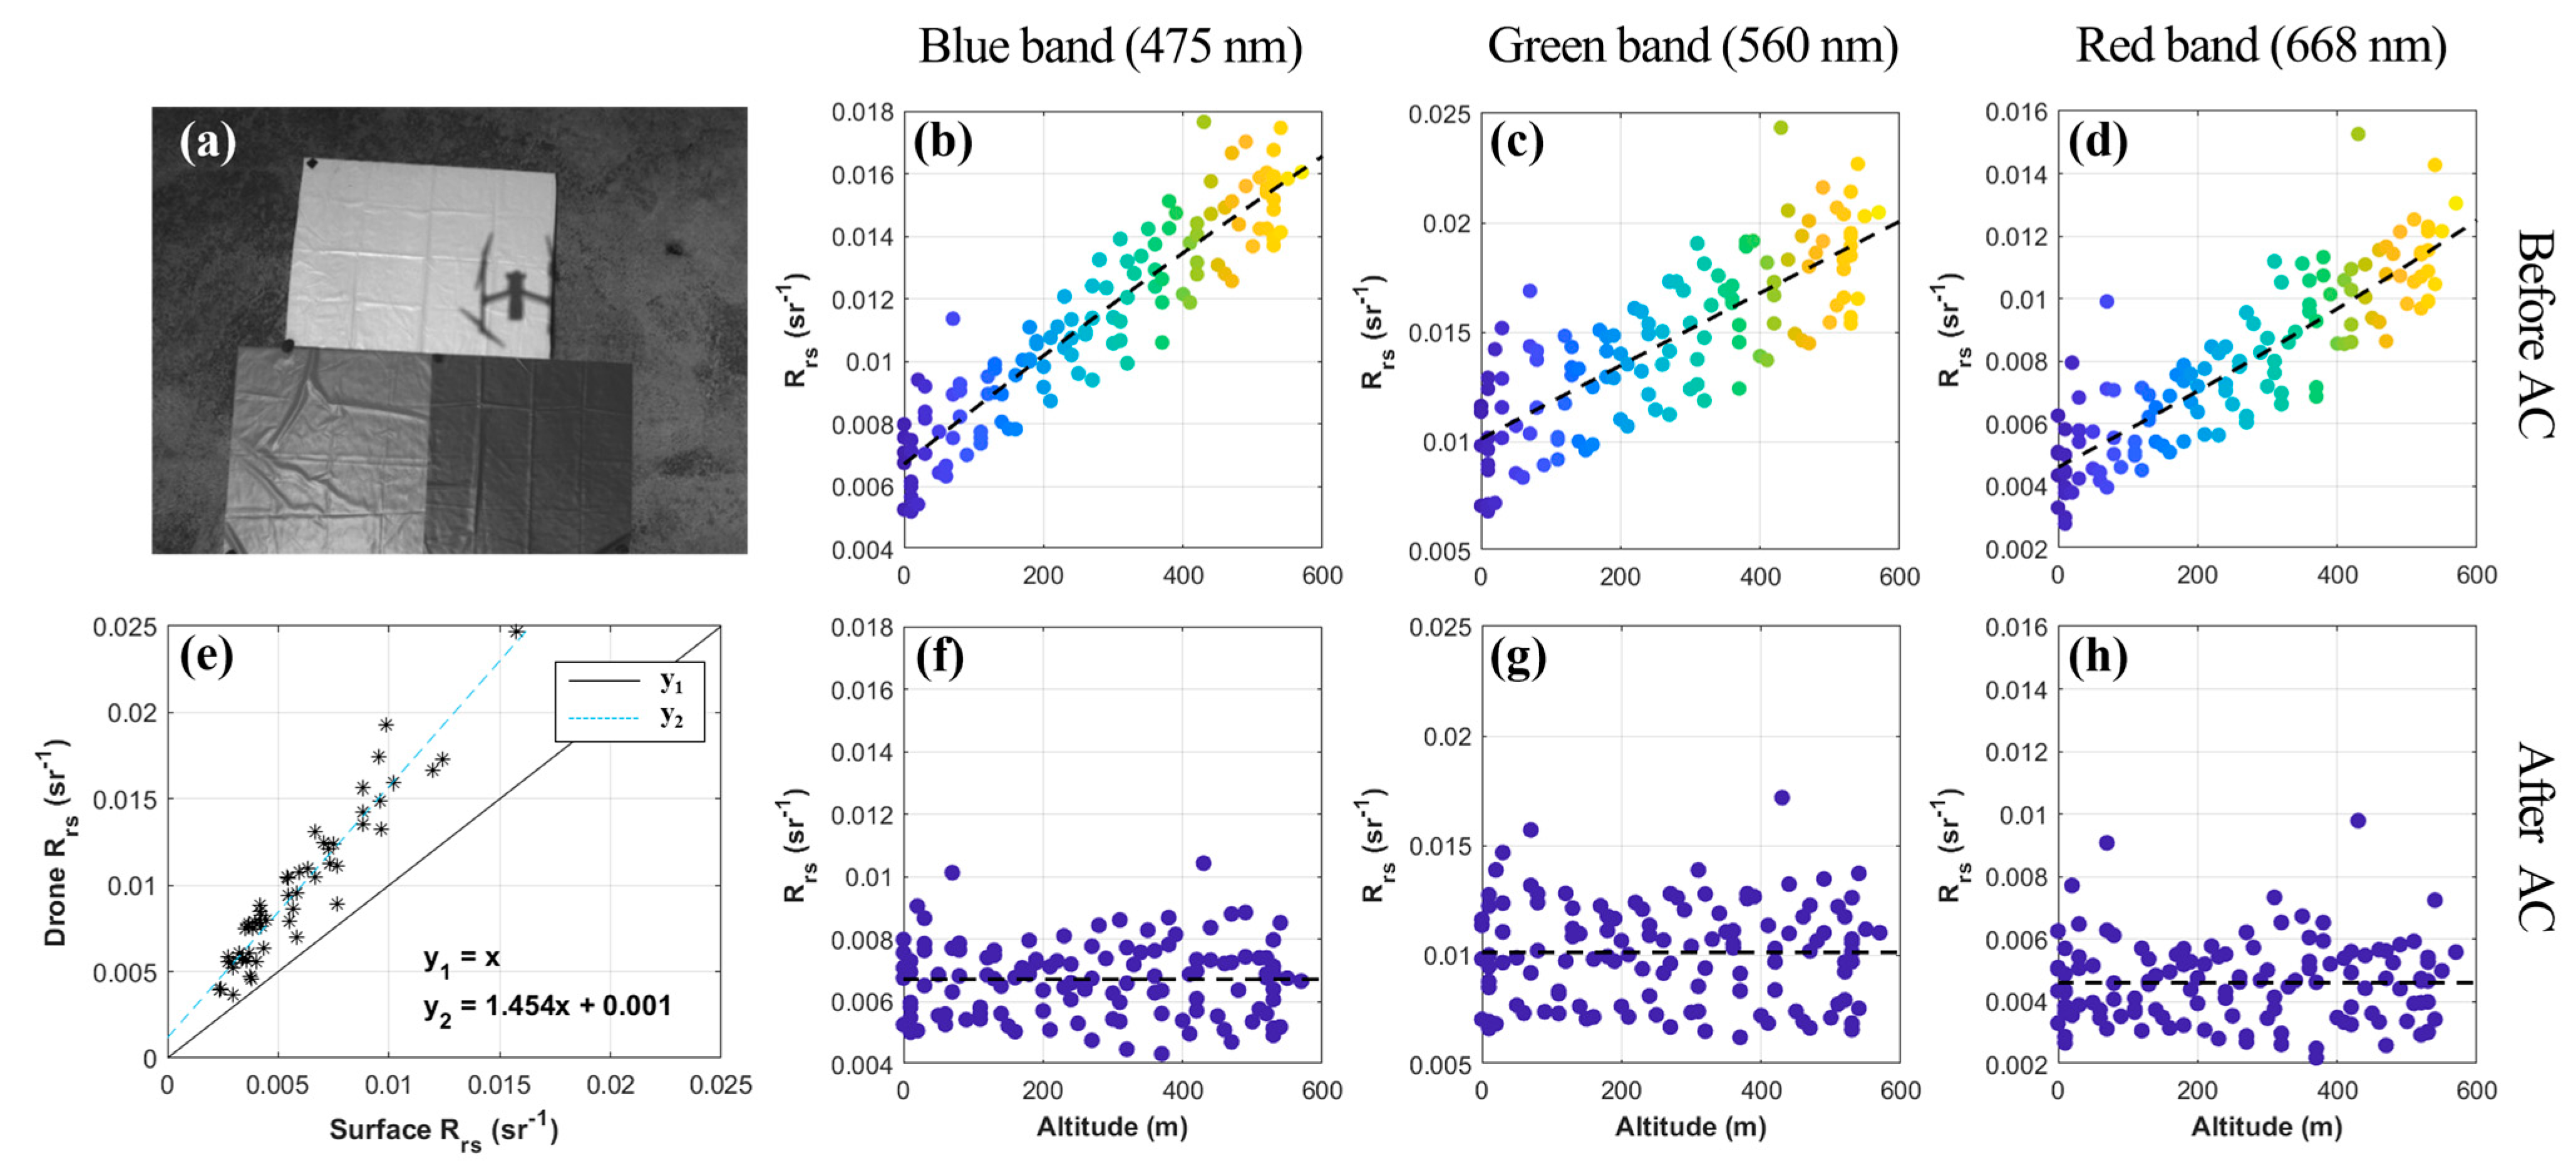
Each tarp area in the images captured by the multispectral camera was extracted through image processing, and the average value of each tarp pixel was set as the representative value and converted into profile data at each altitude (Figure 11a). Because the reflectance of the tarp should not change, the change in the average pixel value of the tarp with increasing altitude can be regarded as an effect of the atmosphere. Tarp observations were performed (at takeoff and landing) for each UAV flight, as defined by the atmospheric conditions of each UAV data sequence. According to various observational data, the change in tarp brightness is linear within the low-altitude range (0–500 m). However, an independent relational expression was calculated for each observation because there were cases where a quadratic curve or an irregular shape appeared depending on the observation time, location, and meteorological conditions (Figure 11b–d). This irregularity in altitude change was caused by the deviation of water vapor with altitude or the presence or absence of sea fog within the low-altitude observation range. Figure 11f–h shows the relative atmospheric correction results for each wavelength band. Although the influence of the atmosphere differed for each wavelength band, the Rrs values between the images observed at the surface altitude and 500 m differed by up to three times. However, most existing UAV-based water quality survey studies do not clearly explain the error factors for atmospheric scattering and absorption [31,32,35]. This difference can be a significant error factor in the SSC calculation process through Rrs. In this study, UAV reflectance data were able to be corrected to water surface level reflectivity without in situ aerosol data through the relative atmospheric correction technique. This enabled more efficient UAV-based water quality detection. UAV data (0–500 m) observed in the study area were corrected to the reference altitude (5 m) level through the altitude-reflectance relationship (Figure 11e) provided by the atmospheric vertical profile information at the time of each observation.

3.3. SSC Mapping through UAVs

The combination of preprocessed UAV multispectral data and SSC estimation algorithm based on field observation data enables monitoring of SSC spatial distribution in a wide range. However, due to the limitations of georeferencing on water surface, existing UAV-based water quality studies have either necessarily included land (rivers and lakes) within the observation range or have only performed qualitative analysis without coordinate referencing [36,46,50]. In this study, it was demonstrated that projection of a UAV’s data sequence on the water surface is possible through direct georeferencing using the IMU and GPS information mounted on the UAV. These results yielded a mosaic image over a large observation area (approximately 6 km2) without land (GCP). Spatially high-resolution (approximately 30 cm) SSC maps provide physical information, such as regional differences in SSC, front formation, and movement of water masses.
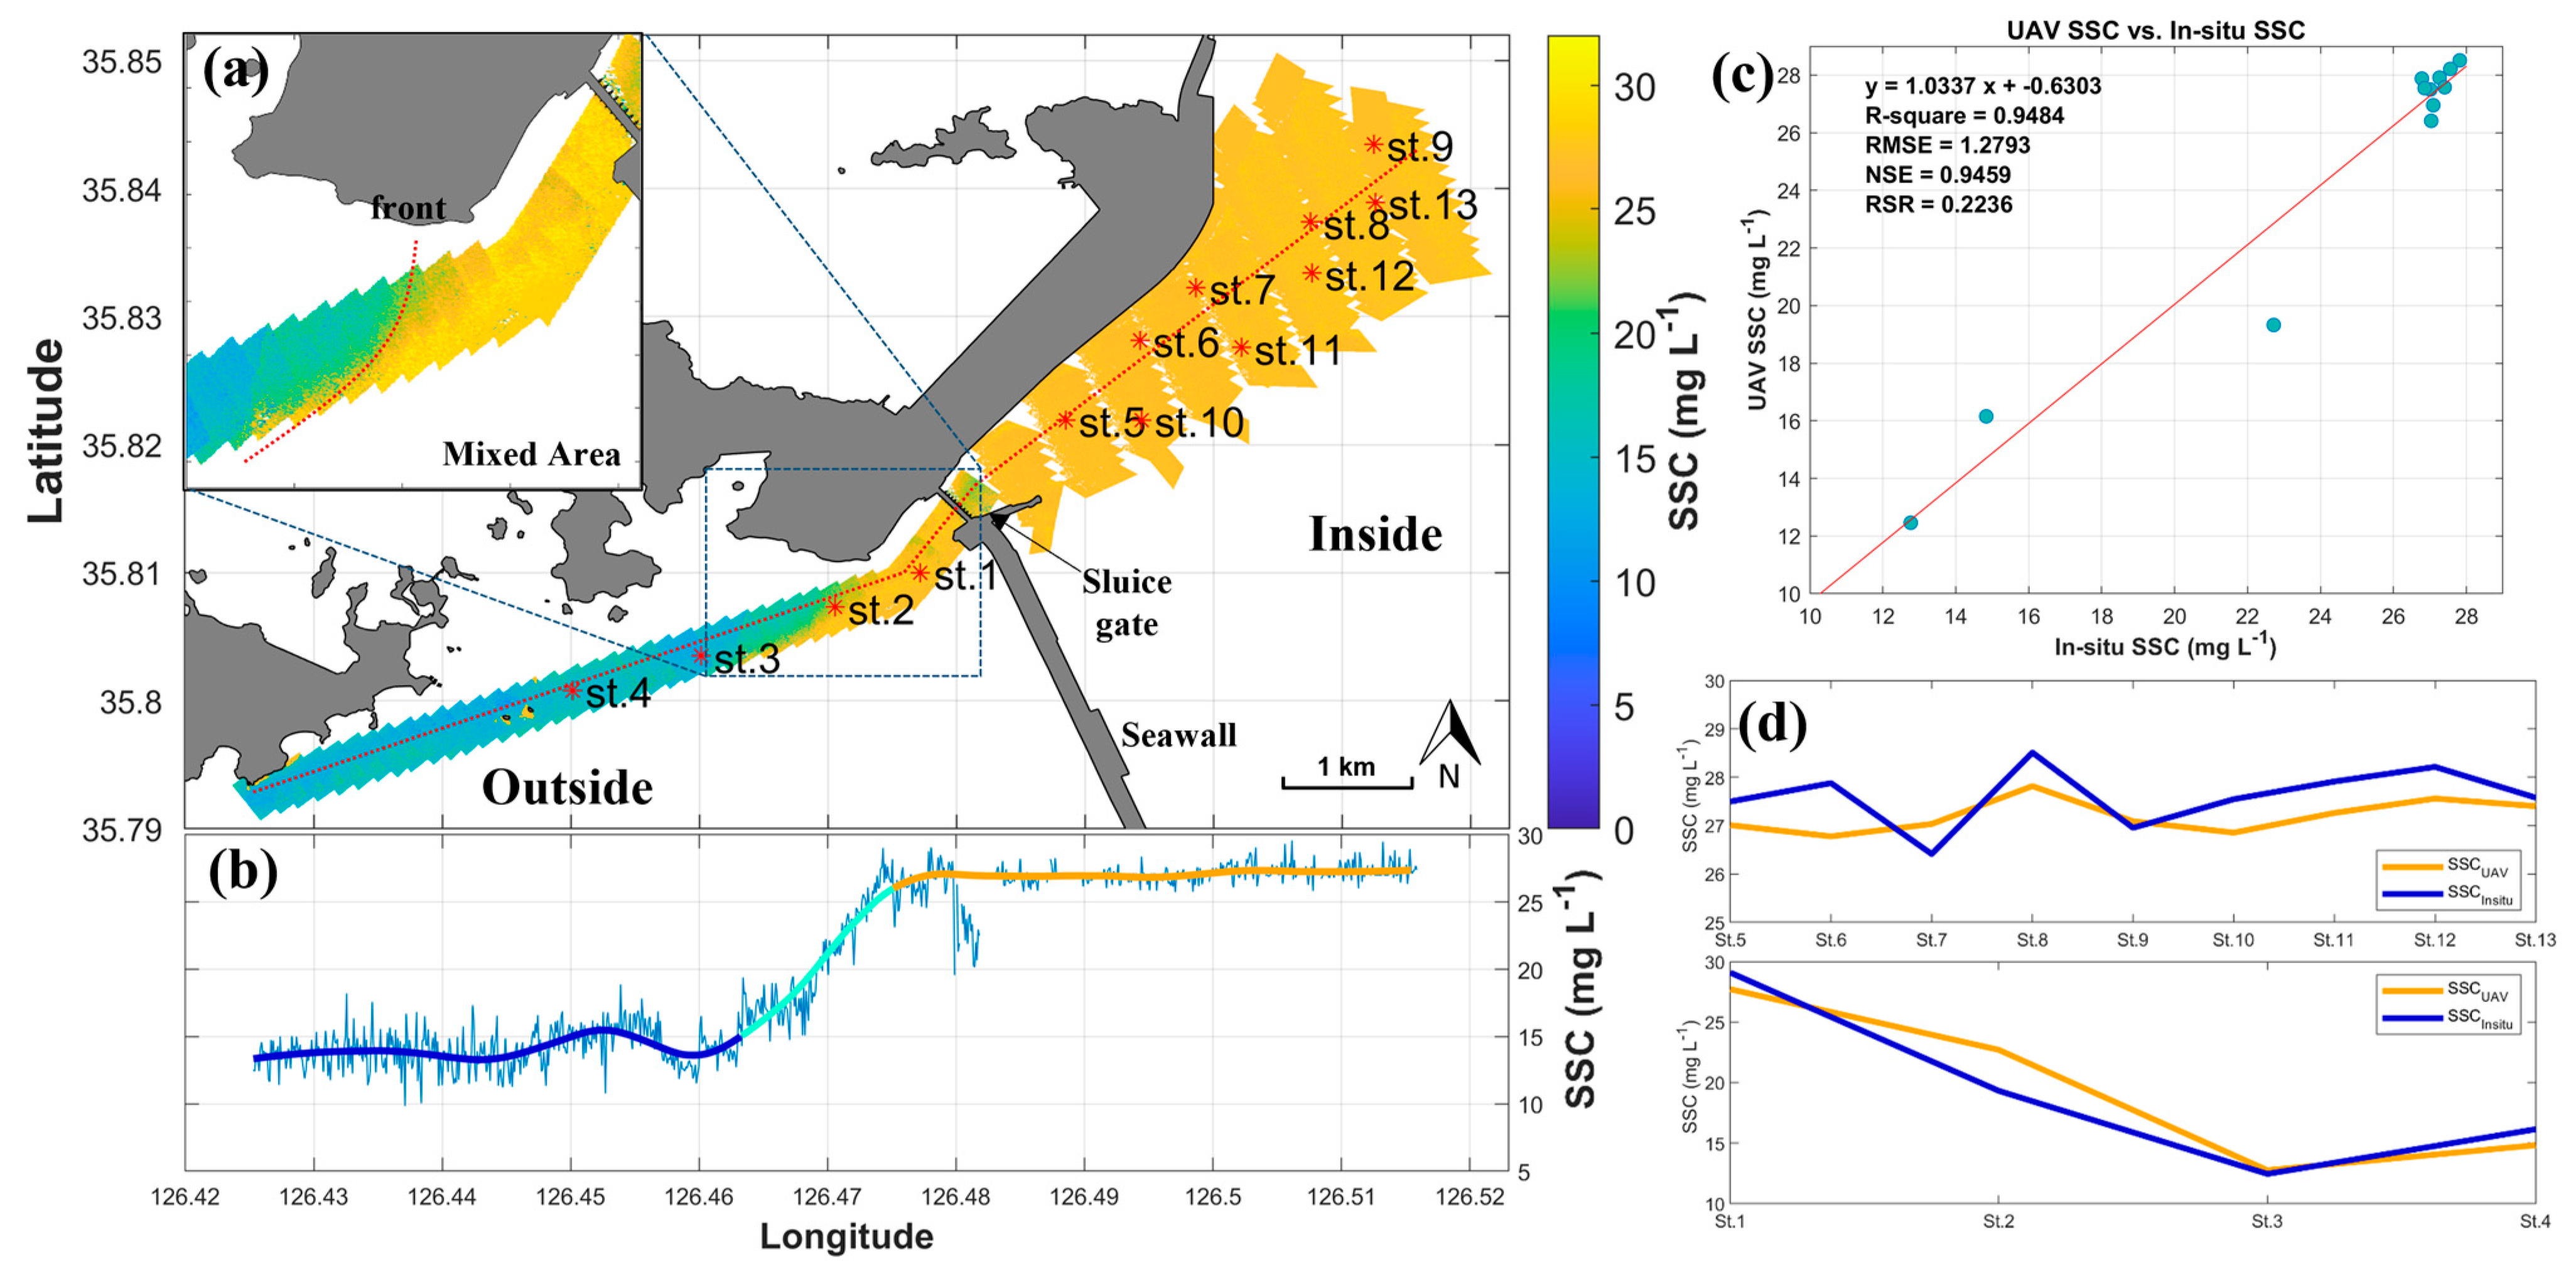
Figure 12a shows the SSC map of the area near the Saemangeum Seawall Sinsi sluice gate generated using 116 UAV multispectral images obtained on 4 August 2020. Each UAV image was obtained at a cruising altitude of approximately 500 m, with a horizontal swath of 460 m. The mean SSC values of the water inside and outside the seawall were approximately 27 and 14 mg L−1, respectively. UAV observation was immediately performed after the Sinsi sluice gate was opened, and the high SSC water was discharged from the inside to the outside of the seawall (Figure 12b). A front was formed at the position where the water masses with different SSCs were in contact, and the SSC changed gradually because of mixing by the vortex. In situ SSC measurements were performed at 13 sampling points within the UAV flight area to verify the UAV-based SSC (SSCUAV). The results of the comparative analysis showed a good correlation with an R2 and RMSE of 0.95 and 1.205 mg L−1, respectively (Figure 12c). Figure 12d shows the cross-sections of the SSC inside and outside the seawall along the stations. The degree of agreement between the in situ SSC and the SSC estimated using the UAV was relatively lower inside than outside the seawall.
Figure 13 shows the spatial distribution change in SSC as the sluice gates were opened and closed. Figure 13a shows the SSC map obtained using the UAV when the sluice gate was closed (3 August 2022). Although the SSC variability of the water inside and outside the seawall may vary depending on tides, seasonal precipitation, and the sluice operating schedule, the SSC in the area inside the seawall was relatively higher than outside due to the continuous fresh water supply. The cross-sectional data for the water inside and outside the seawall (Figure 13b) confirmed that the water had an average SSC difference of approximately 5 mg L−1. When the sluice gate of the seawall opened (16 June 2022), the high-SSC water discharged from the sluice gate spread extensively into the open area (Figure 13c). The UAV map data were obtained after the sluice gate was opened, and it was possible to spatially check the front formed as the discharged water spread on the SSC map. In addition, the cross-sectional data confirmed that the water inside, outside, and mixed areas of the seawall exhibited apparent SSC differences.
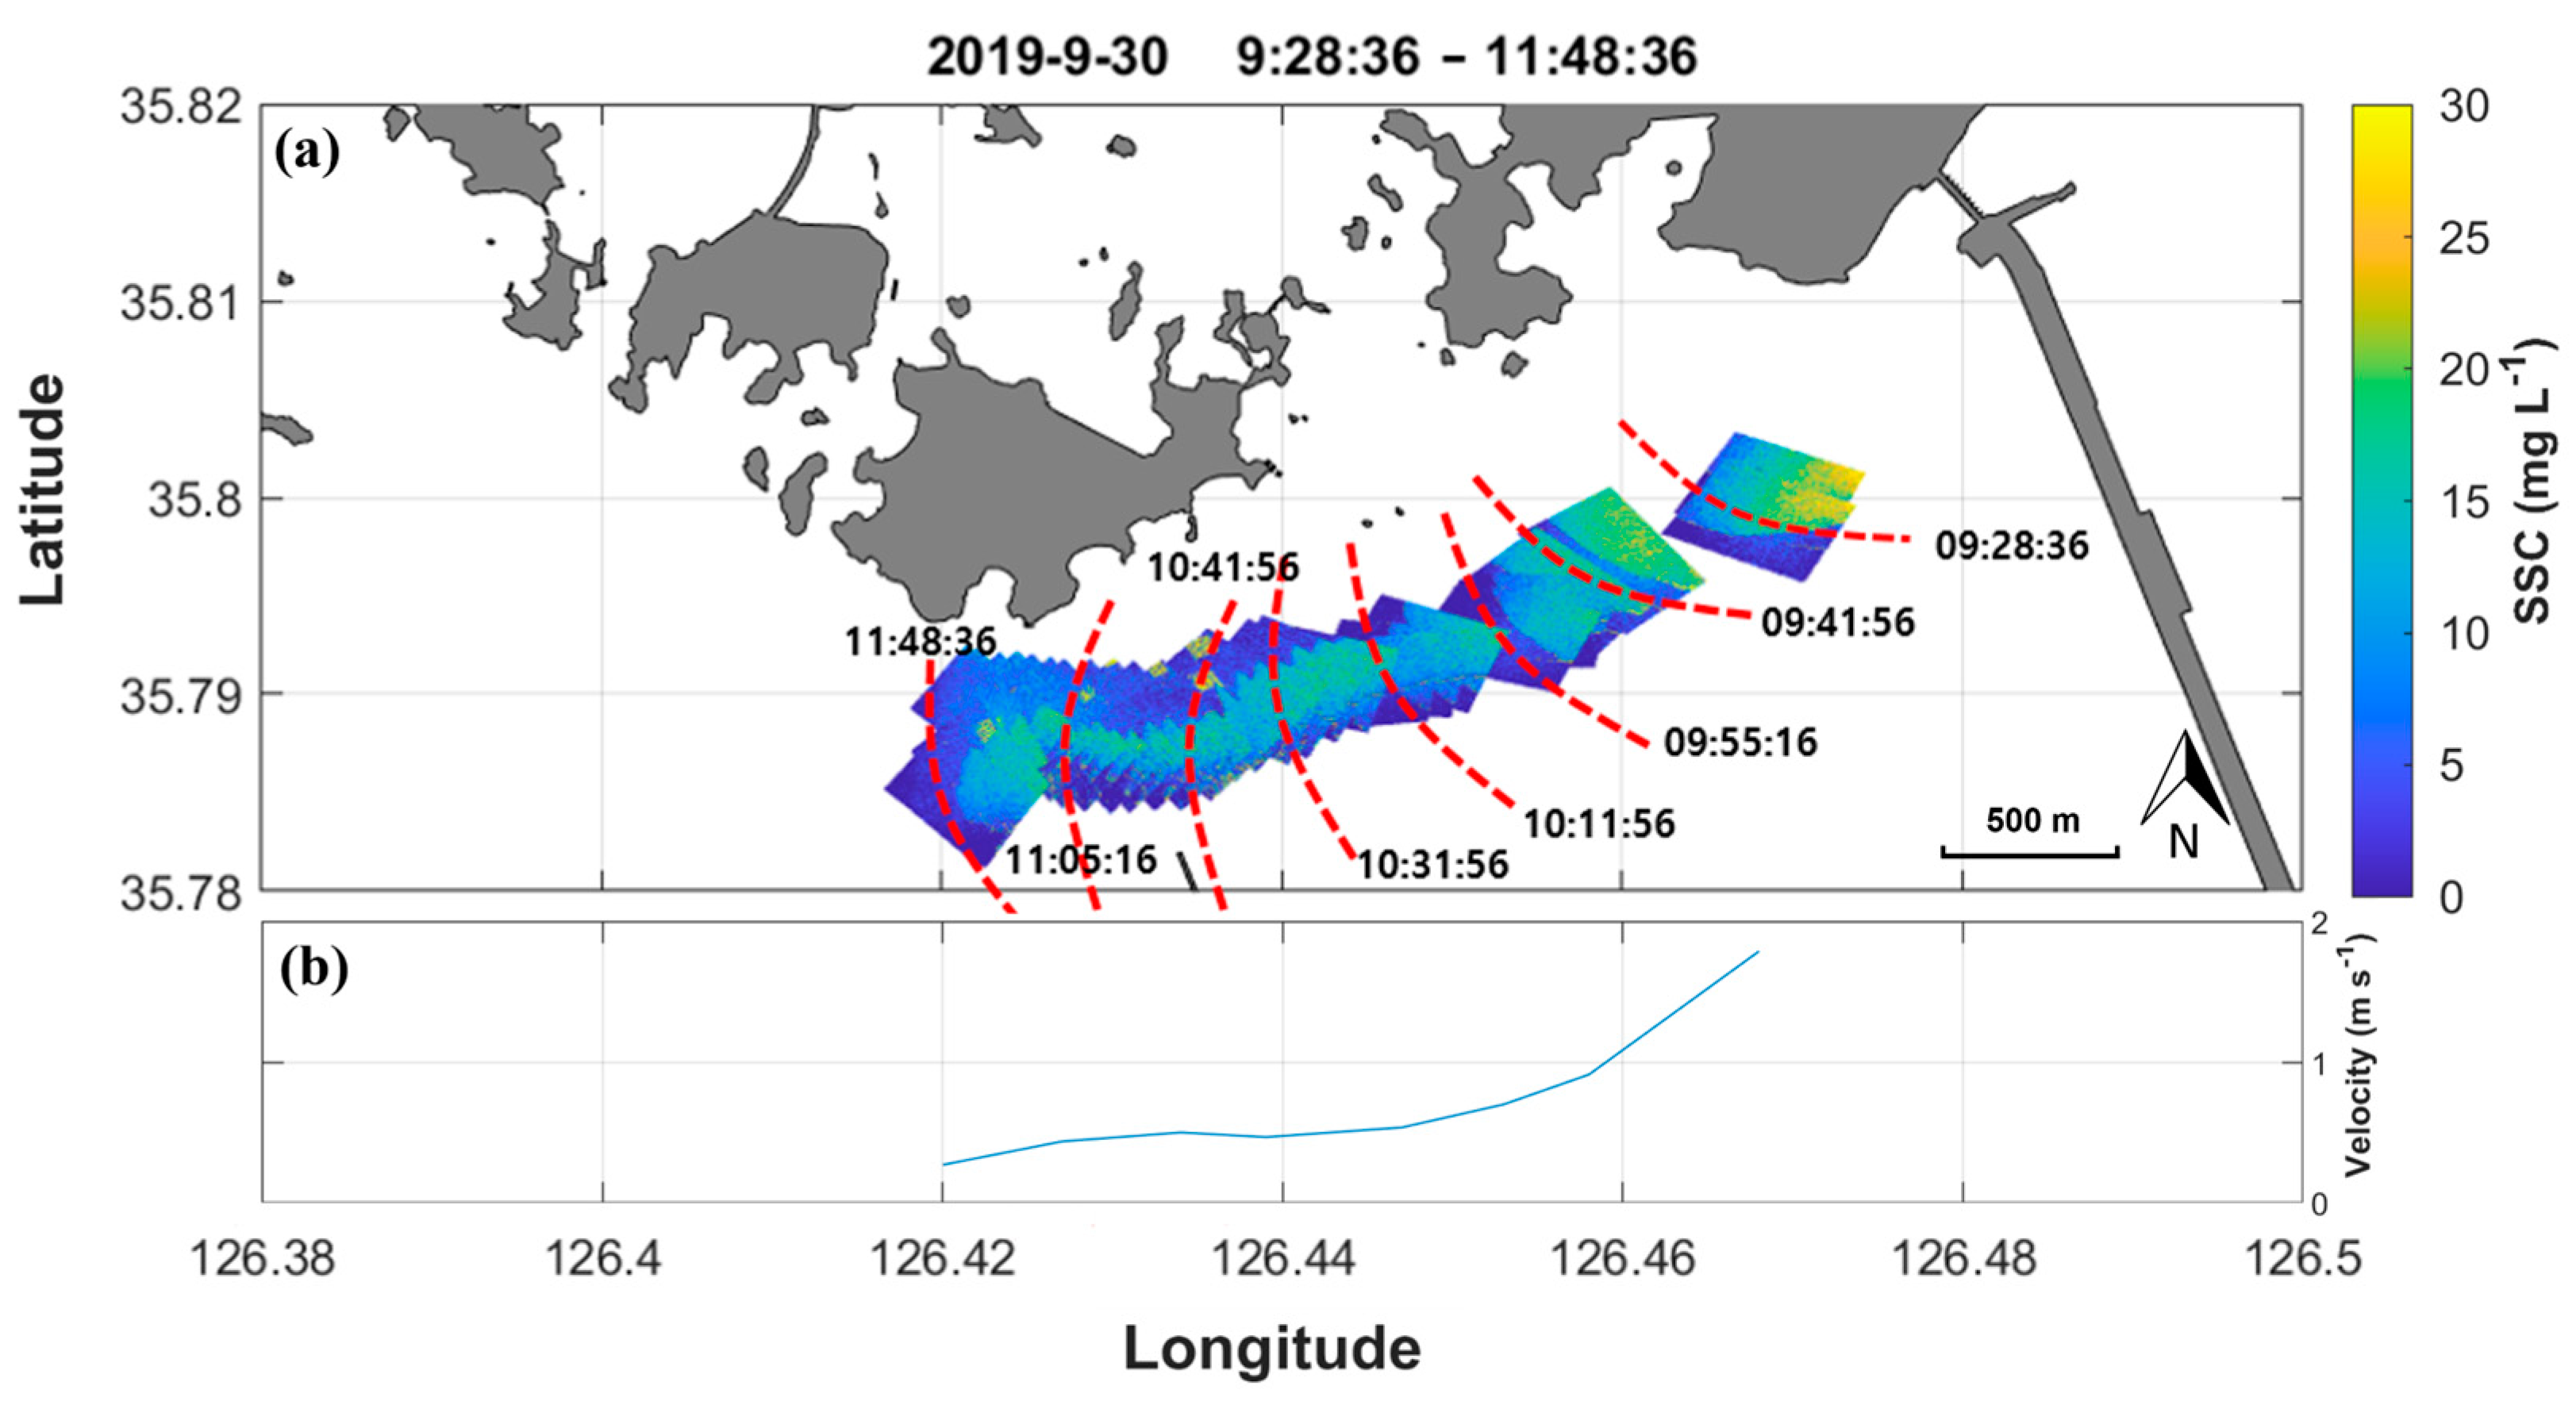
Continuous observation of the SSC front enabled the estimation of the runoff path and velocity of the discharge water. Figure 14a shows an SSC map for 30 September 2019. The UAV image was obtained immediately after the sluice gate was opened, and the front formed by the discharged water containing a high SSC was observed. During the aerial observation, the front moved approximately 5 km, and the average speed was approximately 0.83 m s−1. However, as the discharged water spread as a cone, the velocity at the front decreased with increasing distance from the sluice gate (Figure 14b).

4. Discussion

4.1. Atmospheric Correction

For atmospheric correction of remote sensing data, there is an absolute radiometric correction technique based on the atmospheric radiative transmission model, and representative algorithms include ATCOR4 and FLAASH [49,53]. These algorithms are based on hyperspectral sensor data and use specific spectral information to estimate the amount of water vapor absorption and solar radiance required for atmospheric correction. However, this algorithm can only be applied to hyperspectral sensor data. Moreover, it is unsuitable for atmospheric correction of UAV data because it is only suitable for high-altitude observation data, such as aircraft data. Therefore, UAV data typically use empirical reflectance normalization through a reference panel [54]. This study proposes a simple atmospheric correction of UAV data using a relative atmospheric correction technique. The reflectance deviation according to the elevation of the RedEdge observation image is corrected.
However, a relative atmospheric correction can be used under the assumption that the atmosphere within the survey range of the UAV is homogeneous. Because of the temperature difference between land and sea, changes in meteorological conditions, such as wind direction and water vapor, can occur more quickly in coastal areas than in inland areas. This method uses the average value of the change in reflectance with altitude observed before and after arrival. If the flight time of a UAV is long (>20 min), the vertical distribution of atmospheric water vapor may change. This can lead to gradual errors over time across the entire dataset. In addition, measuring air quality using UAV surveys requires considerable equipment and effort.
The line-scan type spectrometer (Corning microHSI™ 410 SHARK), which cannot capture pictures from a fixed position, had limitations in using relative atmospheric correction techniques. Additionally, it is difficult to adjust a single-point-type spectrometer (AvaSpec-dual spectroradiometer) with a narrow FOV to view the exact tarp location. Therefore, this method is suitable for camera sensors capable of capturing snapshots.

4.2. SSC Algorithm

One hundred sampling data points were used to develop the SSC estimation algorithm. The measured in situ SSC range was 2.5–36. The spatial deviation of SSC was dramatic, according to the opening of the sluice gate. However, water sampling data were acquired in relatively low (2.5–15 mg L−1) and high SSC (25–36 mg L−1) ranges (Figure 9) because the SSC distribution became clearer as seawalls isolated the inland areas due to the characteristics of Saemangeum. When the sluice gate was opened, an SSC of 15–25 mg L−1 existed where the water was mixed. However, onsite observations are limited because strong vortices make it difficult for boats to enter the seawater mixing area. The polarization tendency of the in situ SSC obtained from these results may have affected the algorithm’s performance.
This non-uniformity of the in situ SSC data affected the selection of the multispectral input data used in the SSC algorithm. Remote-sensing SSC and total suspended matter estimation algorithms use red and NIR wavelengths. A single-band algorithm is typically used to estimate turbidity through remote sensing, and the algorithm is corrected using field-observed IOP and reflectance models [13]. When selecting an appropriate wavelength band, the red (620 nm) and long-wavelength (>709 nm) bands were primarily used for SSC estimation at low and high turbidity, respectively. A large spatial SSC concentration gradient was maintained in the study area because of the isolation of the water masses from the seawall. The seawater inside the seawall maintains high chlorophyll and colored dissolved organic matter concentrations because of eutrophication caused by the continuous supply of nutrients from the river water inflow. Therefore, selecting all available multibands as input data rather than a single wavelength band is necessary in such a dynamic environment. Therefore, this study attempts to identify the statistical significance of multiband and field-observation data using MLR.
Artificial neural networks, which are more advanced statistical techniques than MLR, can estimate more detailed relationships between input and result data. Artificial neural network techniques are powerful tools for modeling complex nonlinear relationships between data. The development of an artificial neural network-based SSC estimation algorithm can be attempted when sufficient observational data are available. However, this statistical analysis method does not accurately reflect regional characteristics because it can only estimate trends within the input data. Therefore, it is possible to apply semi-analytical techniques or verify and improve existing algorithms through IOP measurements in the future.
The following additional error factors may exist in the SSC algorithm developed in this study: (1) inaccuracy of the in situ SSC data. (2) Spatiotemporal differences between the water sampling locations and points viewed using a spectral camera. (3) Inaccurate Lsky measurements due to clouds and shadows. (4) Inaccurate Lwt data due to waves and sun glints. Each error factor that arises from the data observations can accumulate and reduce the accuracy of the SSC algorithm. Such data inaccuracies can be minimized by increasing the number of observation sets or by cross-validation.

4.3. Geometry of UAV Observation

Several limitations exist for removing the surface reflection signal of the RedEdge image observed through the UAV. Optical measurements were performed using RedEdge and RAMSES mounted on a boat according to the protocol of Mobley et al. to minimize sun and sky glints [16]. Observations were performed by maintaining the zenith and azimuth angles of each sensor, and the water-leaving radiance of the state with a minimized effect of surface reflection was calculated. However, a multispectral camera mounted on a UAV has limitations when observing Lsky and Lwt (up and down the zenith angle by 40°). If the zenith angle of the camera is maintained at 40° and the altitude of the UAV increases, the deviation in the position difference of the sunlight incident at the point where Lsky and Lwt increase. Furthermore, due to the field of view (47.9°) of the RedEdge camera, the attenuation effect became evident as the atmospheric transmission length increased at the edge of the image. Additionally, because the sensor is installed at the bottom of the UAV, the upper frame and propeller of the UAV can be captured in images taken in the sky direction (Lsky). Therefore, less noise is generated when the sensor faces a fixed nadir direction to understand the 2D spatial distribution of the sea surface. In this study, Lwt was observed by placing the UAV in a fixed nadir direction (Figure 4), and the reflectance (RUAV) was calculated using the ratio of the Ed values provided by DLS.
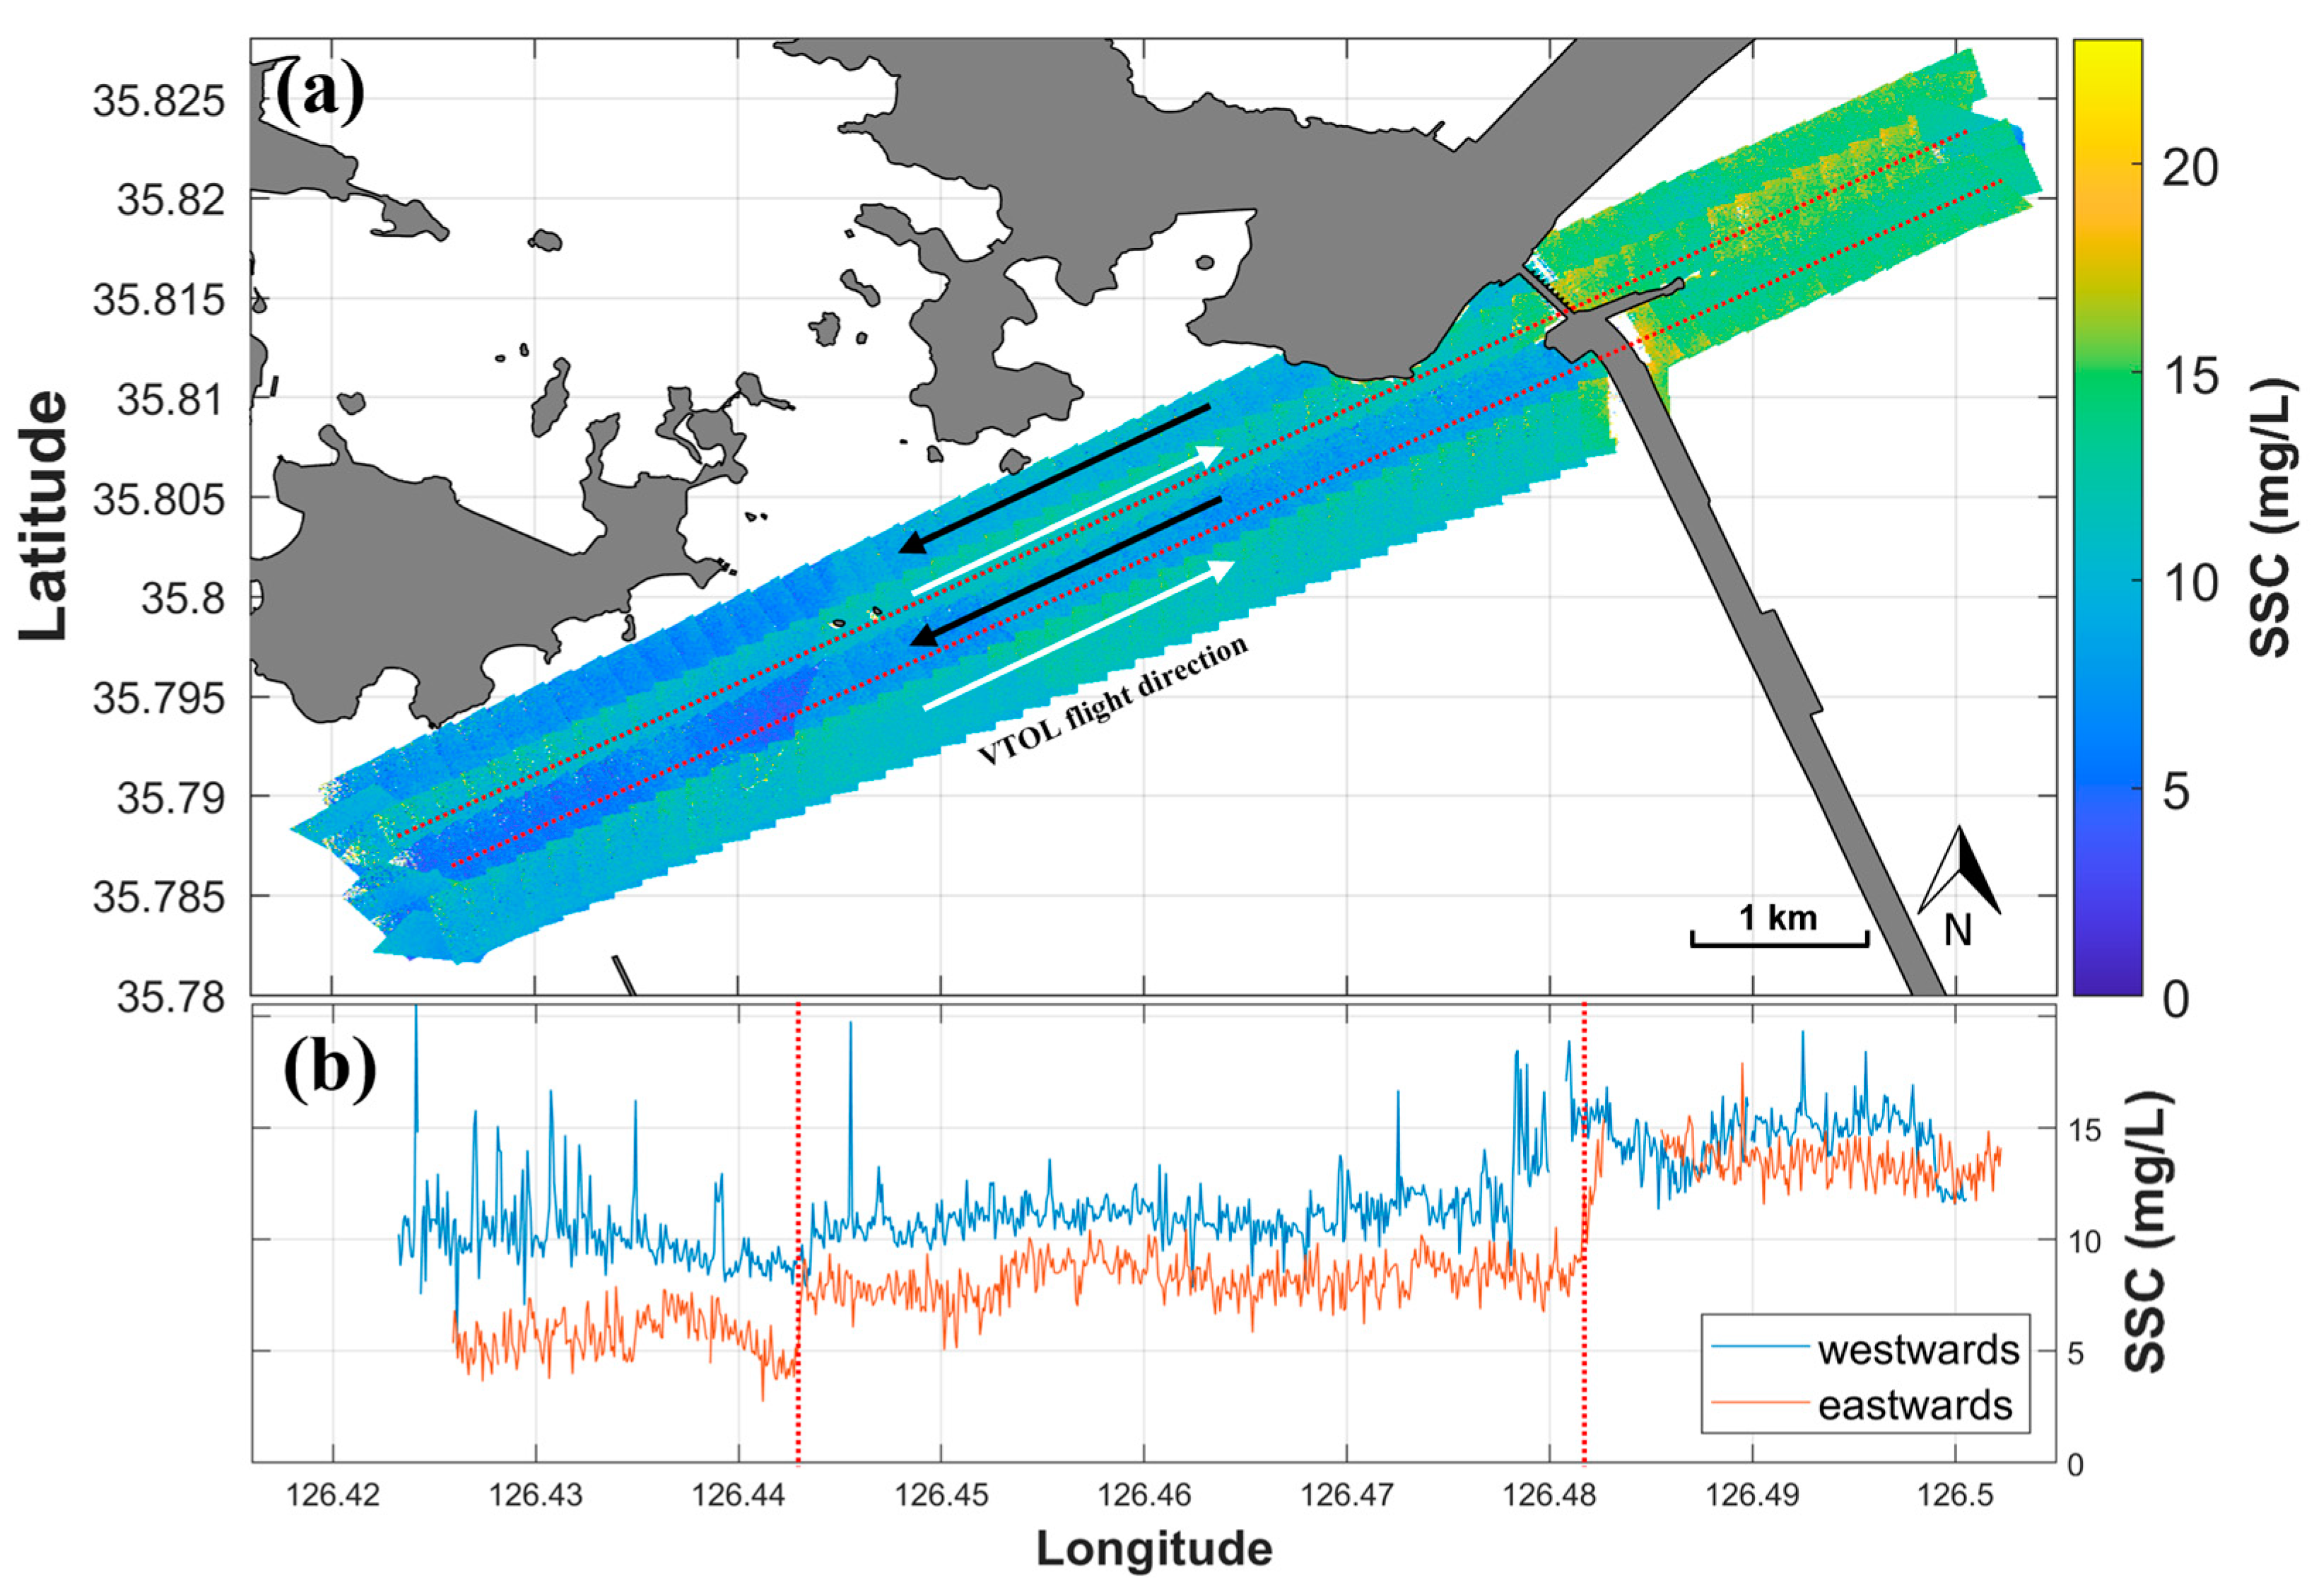
In the case of optical water surface measurements, the noise caused by solar reflection significantly affects the observed data. To minimize this, observations are performed by adjusting the observation time or sensor angle (with the sun facing back). However, solar reflection inevitably occurs because of the wide FOV angle in the case of 2D image data obtained using a camera. Therefore, mapping was performed using only regional data without solar reflections in the captured multispectral images. In addition, in the case of a VTOL UAV, the direction of the sensor changes according to the changes in the flight path because it is fixed and mounted on the aircraft. Accordingly, depending on the flight path, even observational data at the same location can cause a change in the reflectance measured using the sensor. Figure 15 shows the SSC mapping image observed on June 16, 2022, calculated from the data obtained by the VTOL flying along the observation paths of the four lines. As shown in Figure 15a, the SSC deviated for each line according to the flight direction of the VTOL. By extracting and comparing the SSCs of each line, an overall SSC difference of approximately 5 mg L−1 was confirmed. This is because the VTOL observations were conducted at approximately 4 PM; therefore, the low solar elevation angle (43°59′19.95′′) may have increased the deviation of the reflected signal according to the observation direction. In addition, the effect of solar reflection on the data on the western path was more significant due to the solar azimuth (268°43′05.57″). Therefore, in the ocean, because solar reflection significantly influences the observation results, observations should be performed when the solar elevation angle is high, and an appropriate flight path setting according to the solar azimuth is required.
As the UAV flight altitude increased, the GSD of the observation image increased; however, the observation range widened. The UAV flight altitude can be adjusted according to the range of the area of interest and the minimum GSD required to observe the target. Because this study aimed to estimate the SSC in water and monitor its behavior, securing a wide observation range rather than a high image resolution is important. Higher altitudes are proportional to increased scattering and absorption effects of the atmosphere. In this study, the UAV altitude data were corrected for reflectance at the water surface altitude level through a relative atmospheric correction. Images with a high spatial resolution (low altitude and GSD) provide more accurate reflectance; however, the effects of water surface noise, such as waves and glints, may be greater. This can cause large differences in the reflectance between adjacent pixels. As the altitude of the UAV increases, the noise on the water surface tends to merge. However, this remains a problem that needs to be corrected in UAV remote sensing.

4.4. Direct Georeferencing

GPS and IMU information are required when images are captured for direct georeferencing of UAV multispectral images. RedEdge operates using an independent DLS module connected by a cable. The GPS/IMU information recorded in the metadata of the observed video is measured using the DLS module. The IMU compensates for the Ed value incident on the horizontal plane, considering that the posture of the DLS changes during the flight of the UAV. When installing the RedEdge and DLS modules, the IMU and GPS information of the DLS module could be shared and used if the direction and location of each module were the same. In direct georeferencing, the accuracy of the projection result is determined based on the accuracy of the position and posture information obtained from GPS and IMU sensors. Since the RedEdge DLS module uses DGPS-based GPS, it has low accuracy (position error of ±2.5 m) compared to that of precision surveying devices, such as RTK-GPS. However, in remote sensing of the sea surface, the effects of errors are within a sufficiently conceivable range because the observed phenomena are more homogeneously distributed than those on land.
A gimbal can ensure a stable camera position by minimizing the impact of UAV movement. The two-axis gimbal can prevent lateral data loss on the UAV flight path because it maintains constant roll and pitch angles for the camera. This contributes to stable registration between successive aerial photographs projected by direct georeferencing. However, a gimbal is an additional payload for a UAV that can reduce its total flight time. Therefore, gimbals can be a variable option, depending on the purpose and range of observations.

5. Conclusions

Spatial changes in the SSC were monitored along the Saemangeum coast of the Korean Peninsula using a UAV equipped with RedEdge. The overall ocean color remote sensing process using RedEdge is illustrated, and a multispectral image-based SSC estimation algorithm is developed. The following conclusions were drawn for each process:
  • A relative atmospheric correction technique suitable for UAV data can be performed without atmospheric parameters, such as aerosols and water vapor. The change in the reflectance of the tarp with increasing UAV altitude provides integrated information regarding the scattering and reflection effects in the atmosphere. The UAV data were corrected for water surface reflectance using an altitude-reflectance correlation.
  • The homogeneity of the water surface makes the triangulation of aerial images impossible. This describes a considerable challenge in processing UAV-based remote sensing data obtained underwater. To overcome this problem, this study proposes a direct georeferencing method that projects aerial images onto the water surface using posture and location information from UAVs and multispectral cameras. This technology produced a wide range of SSC maps and elucidated the behavior of the discharged water from the sluice gate.
  • A multispectral-based SSC estimation algorithm was developed using MLR to reflect the dynamic SSC changes in the Saemangeum coastal area. The performance of the algorithm showed reasonable results, with an R2 and RMSE of 0.83 and 4.27 mg L−1, respectively. The application of the SSC algorithm to UAV data enables wide-range SSC monitoring.
These results demonstrate the feasibility of using UAVs for high-resolution SSC monitoring in coastal areas. Additionally, it is expected to be applied to various coastal areas and will contribute to the quantification of SSC monitoring and its effects.

Author Contributions

Conceptualization, J.-S.L. and Y.-H.J.; methodology, J.-S.L.; software, J.-S.L.; validation, J.-S.L.; formal analysis, J.-S.L., J.-Y.B., J.S. and J.-S.K.; investigation, J.-S.L. and J.-S.K.; resources, J.-S.L.; data curation, J.-S.L.; writing—original draft preparation, J.-S.L.; writing—review and editing, J.-S.L., J.-Y.B. and Y.-H.J.; visualization, J.-S.L.; supervision, Y.-H.J.; project administration, Y.-H.J.; funding acquisition, Y.-H.J. All authors have read and agreed to the published version of the manuscript.

Funding

This research was part of the project Integrated management of marine environment and ecosystems around Saemangeum, funded by the Ministry of Oceans and Fisheries, Korea (grant number 20140257). This research also supported by Korea Institute of Marine Science & Technology (KIMST) funded by the Ministry of Oceans and Fisheries (RS-2023-00256330, Development of risk managing technology tackling ocean and fisheries crisis around Korean Peninsula by Kuroshio Current).

Data Availability Statement

Data are contained within the article.

Acknowledgments

We thank the Water and Eco-Bio (WEB) Corporation for analyzing water samples collected from the Saemangeum coastal area.

Conflicts of Interest

The authors declare no conflict of interest.

References

  1. Dogliotti, A.I.; Ruddick, K.G.; Nechad, B.; Doxaran, D.; Knaeps, E. A single algorithm to retrieve turbidity from remotely-sensed data in all coastal and estuarine waters. Remote Sens. Environ. 2015, 156, 157–168. [Google Scholar] [CrossRef]
  2. Larson, M.D.; Simic Milas, A.; Vincent, R.K.; Evans, J.E. Multi-depth suspended sediment estimation using high-resolution remote-sensing UAV in Maumee River, Ohio. Int. J. Remote Sens. 2018, 39, 5472–5489. [Google Scholar] [CrossRef]
  3. Vanacker, V. Suspended Sediment Concentration. In Encyclopedia of Snow, Ice and Glaciers; Springer: Dordrecht, The Netherlands, 2014; pp. 1125–1126. [Google Scholar]
  4. Dorji, P.; Fearns, P. A quantitative comparison of total suspended sediment algorithms: A case study of the last decade for MODIS and landsat-based sensors. Remote Sens. 2016, 8, 810. [Google Scholar] [CrossRef]
  5. Pavelsky, T.M.; Smith, L.C. Remote sensing of suspended sediment concentration, flow velocity, and lake recharge in the Peace-Athabasca Delta, Canada. Water Resour. Res. 2009, 45. [Google Scholar] [CrossRef]
  6. Pereira, L.S.; Andes, L.C.; Cox, A.L.; Ghulam, A. Measuring Suspended-Sediment Concentration and Turbidity in the Middle Mississippi and Lower Missouri Rivers Using Landsat Data. JAWRA J. Am. Water Resour. Assoc. 2018, 54, 440–450. [Google Scholar] [CrossRef]
  7. Loperfido, J.V. Sustainability of Water Quality. In Comprehensive Water Quality and Purification; Elsevier: Amsterdam, The Netherlands, 2013; pp. 87–105. [Google Scholar]
  8. Rudorff, N.; Rudorff, C.M.; Kampel, M.; Ortiz, G. Remote sensing monitoring of the impact of a major mining wastewater disaster on the turbidity of the Doce River plume off the eastern Brazilian coast. ISPRS J. Photogramm. Remote Sens. 2018, 145, 349–361. [Google Scholar] [CrossRef]
  9. Burgan, H.I. The short-term and seasonal trend detection of sediment discharges in Turkish rivers. Rocznik Ochrona Środowiska 2022, 24, 214–230. [Google Scholar] [CrossRef]
  10. Dethier, E.N.; Renshaw, C.E.; Magilligan, F.J. Toward improved accuracy of remote sensing approaches for quantifying suspended sediment: Implications for suspended-sediment monitoring. J. Geophys. Res. Earth Surf. 2020, 125, e2019JF005033. [Google Scholar] [CrossRef]
  11. Doxaran, D.; Froidefond, J.M.; Lavender, S.; Castaing, P. Spectral signature of highly turbid waters: Application with SPOT data to quantify suspended particulate matter concentrations. Remote Sens. Environ. 2002, 81, 149–161. [Google Scholar] [CrossRef]
  12. Hossain, A.K.M.; Mathias, C.; Blanton, R. Remote Sensing of Turbidity in the Tennessee River Using Landsat 8 Satellite. Remote Sens. 2021, 13, 3785. [Google Scholar] [CrossRef]
  13. Nechad, B.; Ruddick, K.G.; Park, Y. Calibration and validation of a generic multisensor algorithm for mapping of total sus-pended matter in turbid waters. Remote Sens. Environ. 2010, 114, 854–866. [Google Scholar] [CrossRef]
  14. Van Raaphorst, W.; Philippart, C.J.M.; Smit, J.P.C.; Dijkstra, F.J.; Malschaert, J.F.P. Distribution of suspended particulate matter in the North Sea as inferred from NOAA/AVHRR reflectance images and in situ observations. J. Sea Res. 1998, 39, 197–215. [Google Scholar] [CrossRef]
  15. Morel, A.; Prieur, L. Analysis of variations in ocean color 1. Limnol. Oceanogr. 1977, 22, 709–722. [Google Scholar] [CrossRef]
  16. Mobley, C.D. Estimation of the remote-sensing reflectance from above-surface measurements. Appl. Opt. 1999, 38, 7442–7455. [Google Scholar] [CrossRef] [PubMed]
  17. Min, J.E.; Ryu, J.H.; Lee, S.; Son, S. Monitoring of suspended sediment variation using Landsat and MODIS in the Saemangeum coastal area of Korea. Mar. Pollut. Bull. 2012, 64, 382–390. [Google Scholar] [CrossRef] [PubMed]
  18. Park, E.; Latrubesse, E.M. Modeling suspended sediment distribution patterns of the Amazon River using MODIS data. Remote Sens. Environ. 2014, 147, 232–242. [Google Scholar] [CrossRef]
  19. Wang, J.J.; Lu, X.X. Estimation of suspended sediment concentrations using Terra MODIS: An example from the Lower Yangtze River, China. Sci. Total Environ. 2010, 408, 1131–1138. [Google Scholar] [CrossRef]
  20. Robert, E.; Grippa, M.; Kergoat, L.; Pinet, S.; Gal, L.; Cochonneau, G.; Martinez, J.M. Monitoring water turbidity and surface suspended sediment concentration of the Bagre Reservoir (Burkina Faso) using MODIS and field reflectance data. Int. J. Appl. Earth Obs. Geoinf. 2016, 52, 243–251. [Google Scholar] [CrossRef]
  21. Dorji, P.; Fearns, P.; Broomhall, M. A semi-analytic model for estimating total suspended sediment concentration in turbid coastal waters of northern Western Australia using MODIS-Aqua 250 m data. Remote Sens. 2016, 8, 556. [Google Scholar] [CrossRef]
  22. Wójcik-Długoborska, K.A.; Bialik, R.J. The Glacial Meltwater Turbidity Algorithm (GaMTA): Adaptation of single-band algorithm retrieving turbidity to satellite and UAV dataset from highly glaciated Antarctic region. Reg. Stud. Mar. Sci. 2023, 58, 102798. [Google Scholar] [CrossRef]
  23. Klein, K.P.; Lantuit, H.; Heim, B.; Doxaran, D.; Juhls, B.; Nitze, I.; Søreide, J.E. The Arctic Nearshore Turbidity Algorithm (ANTA)-A multi sensor turbidity algorithm for Arctic nearshore environments. Sci. Remote Sens. 2021, 4, 100036. [Google Scholar] [CrossRef]
  24. Xiao, Y.; Chen, J.; Xu, Y.; Guo, S.; Nie, X.; Guo, Y.; Fu, Y.H. Monitoring of chlorophyll-a and suspended sediment concentrations in optically complex inland rivers using multisource remote sensing measurements. Ecol. Indic. 2023, 155, 111041. [Google Scholar] [CrossRef]
  25. Windle, A.E.; Silsbe, G.M. Evaluation of unoccupied aircraft system (UAS) remote sensing reflectance retrievals for water quality monitoring in coastal waters. Front. Environ. Sci. 2021, 9, 674247. [Google Scholar] [CrossRef]
  26. Du, Y.; Lin, H.; He, S.; Wang, D.; Wang, Y.P.; Zhang, J. Tide-Induced Variability and Mechanisms of Surface Suspended Sediment in the Zhoushan Archipelago along the Southeastern Coast of China Based on GOCI Data. Remote Sens. 2021, 13, 929. [Google Scholar] [CrossRef]
  27. Xu, Y.; Qin, B.; Zhu, G.; Zhang, Y.; Shi, K.; Li, Y.; Shi, Y.; Chen, L. High temporal resolution monitoring of suspended matter changes from GOCI measurements in Lake Taihu. Remote Sens. 2019, 11, 985. [Google Scholar] [CrossRef]
  28. Hu, Y.; Yu, Z.; Zhou, B.; Li, Y.; Yin, S.; He, X.; Peng, X.; Shum, C.K. Tidal-driven variation of suspended sediment in Hangzhou Bay based on GOCI data. Int. J. Appl. Earth Obs. Geoinf. 2019, 82, 101920. [Google Scholar] [CrossRef]
  29. Chau, P.M.; Wang, C.K.; Huang, A.T. The spatial-temporal distribution of GOCI-derived suspended sediment in Taiwan coastal water induced by typhoon Soudelor. Remote Sens. 2021, 13, 194. [Google Scholar] [CrossRef]
  30. Kwon, Y.S.; Pyo, J.; Kwon, Y.H.; Duan, H.; Cho, K.H.; Park, Y. Drone-based hyperspectral remote sensing of cyanobacteria using vertical cumulative pigment concentration in a deep reservoir. Remote Sens. Environ. 2020, 236, 111517. [Google Scholar] [CrossRef]
  31. Shang, S.; Lee, Z.; Lin, G.; Hu, C.; Shi, L.; Zhang, Y.; Li, X.; Wu, J.; Yan, J. Sensing an intense phytoplankton bloom in the western Taiwan Strait from radiometric measurements on a UAV. Remote Sens. Environ. 2017, 198, 85–94. [Google Scholar] [CrossRef]
  32. Baek, J.Y.; Jo, Y.H.; Kim, W.; Lee, J.S.; Jung, D.; Kim, D.W.; Nam, J. A new algorithm to estimate chlorophyll-a concentrations in turbid yellow sea water using a multispectral sensor in a low-altitude remote sensing system. Remote Sens. 2019, 11, 2257. [Google Scholar] [CrossRef]
  33. Cui, M.; Sun, Y.; Huang, C.; Li, M. Water Turbidity Retrieval Based on UAV Hyperspectral Remote Sensing. Water 2022, 14, 128. [Google Scholar] [CrossRef]
  34. McEliece, R.; Hinz, S.; Guarini, J.M.; Coston-Guarini, J. Evaluation of nearshore and offshore water quality assessment using UAV multispectral imagery. Remote Sens. 2020, 12, 2258. [Google Scholar] [CrossRef]
  35. Su, T.C. A study of a matching pixel by pixel (MPP) algorithm to establish an empirical model of water quality mapping, as based on unmanned aerial vehicle (UAV) images. Int. J. Appl. Earth Obs. Geoinf. 2017, 58, 213–224. [Google Scholar] [CrossRef]
  36. Ying, H.; Xia, K.; Huang, X.; Feng, H.; Yang, Y.; Du, X.; Huang, L. Evaluation of water quality based on UAV images and the IMP-MPP algorithm. Ecol. Inform. 2021, 61, 101239. [Google Scholar] [CrossRef]
  37. An, S.M.; Lee, J.H.; Woo, H.J.; Koo, B.J.; Lee, H.G.; Yoo, J.W.; Je, J.G. Benthic environment and macrofaunal community changes during the dike construction in Saemangeum subtidal area, Korea. Ocean Polar Res. 2006, 28, 369–383. [Google Scholar]
  38. Kim, D.; Jo, J.; Kim, B.; Ryu, J.; Choi, K. Influence of dike-induced morphologic and sedimentologic changes on the benthic ecosystem in the sheltered tidal flats, Saemangeum area, west coast of Korea. Environ. Pollut. 2020, 257, 113507. [Google Scholar] [CrossRef]
  39. Kim, D.; Ko, J.; Jo, J.; Ryu, J.; Choi, K. Decoupling natural and man-made impacts on the morphologic and sedimentologic changes in the tidal flats, Saemangeum area, west coast of Korea: Implications for benthic ecosystem stability. Sci. Total Environ. 2022, 807, 151779. [Google Scholar] [CrossRef]
  40. Lee, S.H.; Choi, H.Y.; Son, Y.T.; Kwon, H.K.; Kim, Y.K.; Yang, J.S.; Jeong, H.J.; Kim, J.G. Low-salinity water and circulation in summer around Saemangeum area in the west coast of Korea. Sea-J. Kor. Soc. Ocean. 2003, 8, 138–150. [Google Scholar]
  41. Lee, Y.K.; Ryu, J.H.; Choi, J.K.; Lee, S.; Woo, H.J. Satellite-based observations of unexpected coastal changes due to the Sae-mangeum Dyke construction, Korea. Mar. Pollut. Bull. 2015, 97, 150–159. [Google Scholar] [CrossRef]
  42. Lim, D.I.; Kang, M.R.; Jang, P.G.; Kim, S.Y.; Jung, H.S.; Kang, Y.S.; Kang, Y.S. Water quality characteristics along mid-western coastal area of Korea. Ocean Polar Res. 2008, 30, 379–399. [Google Scholar] [CrossRef]
  43. Min, J.E.; Ahn, Y.H.; Lee, K.S.; Ryu, J.H. Development of Suspended Sediment Algorithm for Landsat TM/ETM+ in Coastal Sea Waters-A Case Study in Saemangeum Area. Korean J. Remote Sens. 2006, 22, 87–99. [Google Scholar]
  44. RedEdge-MX Integration Guide. Available online: https://support.micasense.com/hc/en-us/articles/360011389334-RedEdge-MX-Integration-Guide (accessed on 27 January 2023).
  45. Hyperspectral Radiance and Irradiance Sensors for the UV, VIS or UV/VIS range. Available online: https://www.trios.de/en/ramses.html (accessed on 27 January 2023).
  46. Kim, W.; Roh, S.H.; Moon, Y.; Jung, S. Evaluation of Rededge-M camera for water color observation after Image preprocessing. Journal of the Korean Society of Surveying, Geodesy. Photogramm. Cartogr. 2019, 37, 167–175. [Google Scholar]
  47. Radiometric Calibration Model for MicaSense Sensors. Available online: https://support.micasense.com/hc/en-us/articles/115000351194-Radiometric-Calibration-Model-for-MicaSense-Sensors (accessed on 27 January 2023).
  48. Lee, Z.; Ahn, Y.H.; Mobley, C.; Arnone, R. Removal of surface-reflected light for the measurement of remote-sensing reflec-tance from an above-surface platform. Opt. Express 2010, 18, 26313–26324. [Google Scholar] [CrossRef]
  49. Schläpfer, D.; Popp, C.; Richter, R. Drone data atmospheric correction concept for multi-and hyper-spectral imagery–the droacor model. Int. Arch. Photogramm. Remote Sens. Spat. Inf. Sci. 2020, 43, 473–478. [Google Scholar] [CrossRef]
  50. Yu, X.; Liu, Q.; Liu, X.; Liu, X.; Wang, Y. A physical-based atmospheric correction algorithm of unmanned aerial vehicles images and its utility analysis. Int. J. Remote Sens. 2017, 38, 3101–3112. [Google Scholar] [CrossRef]
  51. Jeong, J.C. Distribution of Surface Temperature and Chlorophyll-a in Lake Soyang using Remote Sensing Techniques. J. Environ. Impact Assess. 2000, 9, 177–183. [Google Scholar]
  52. Minařík, R.; Langhammer, J.; Hanuš, J. Radiometric and atmospheric corrections of multispectral μMCA camera for UAV spectroscopy. Remote Sens. 2019, 11, 2428. [Google Scholar] [CrossRef]
  53. Jeon, E.I.; Kim, K.; Cho, S.; Kim, S. A Comparative Study of Absolute Radiometric Correction Methods for Drone-borne Hyperspectral Imagery. Korean J. Remote Sens. 2019, 35, 203–215. [Google Scholar]
  54. Aasen, H.; Bolten, A. Multi-temporal high-resolution imaging spectroscopy with hyperspectral 2D imagers–From theory to application. Remote Sens. Environ. 2018, 205, 374–389. [Google Scholar] [CrossRef]
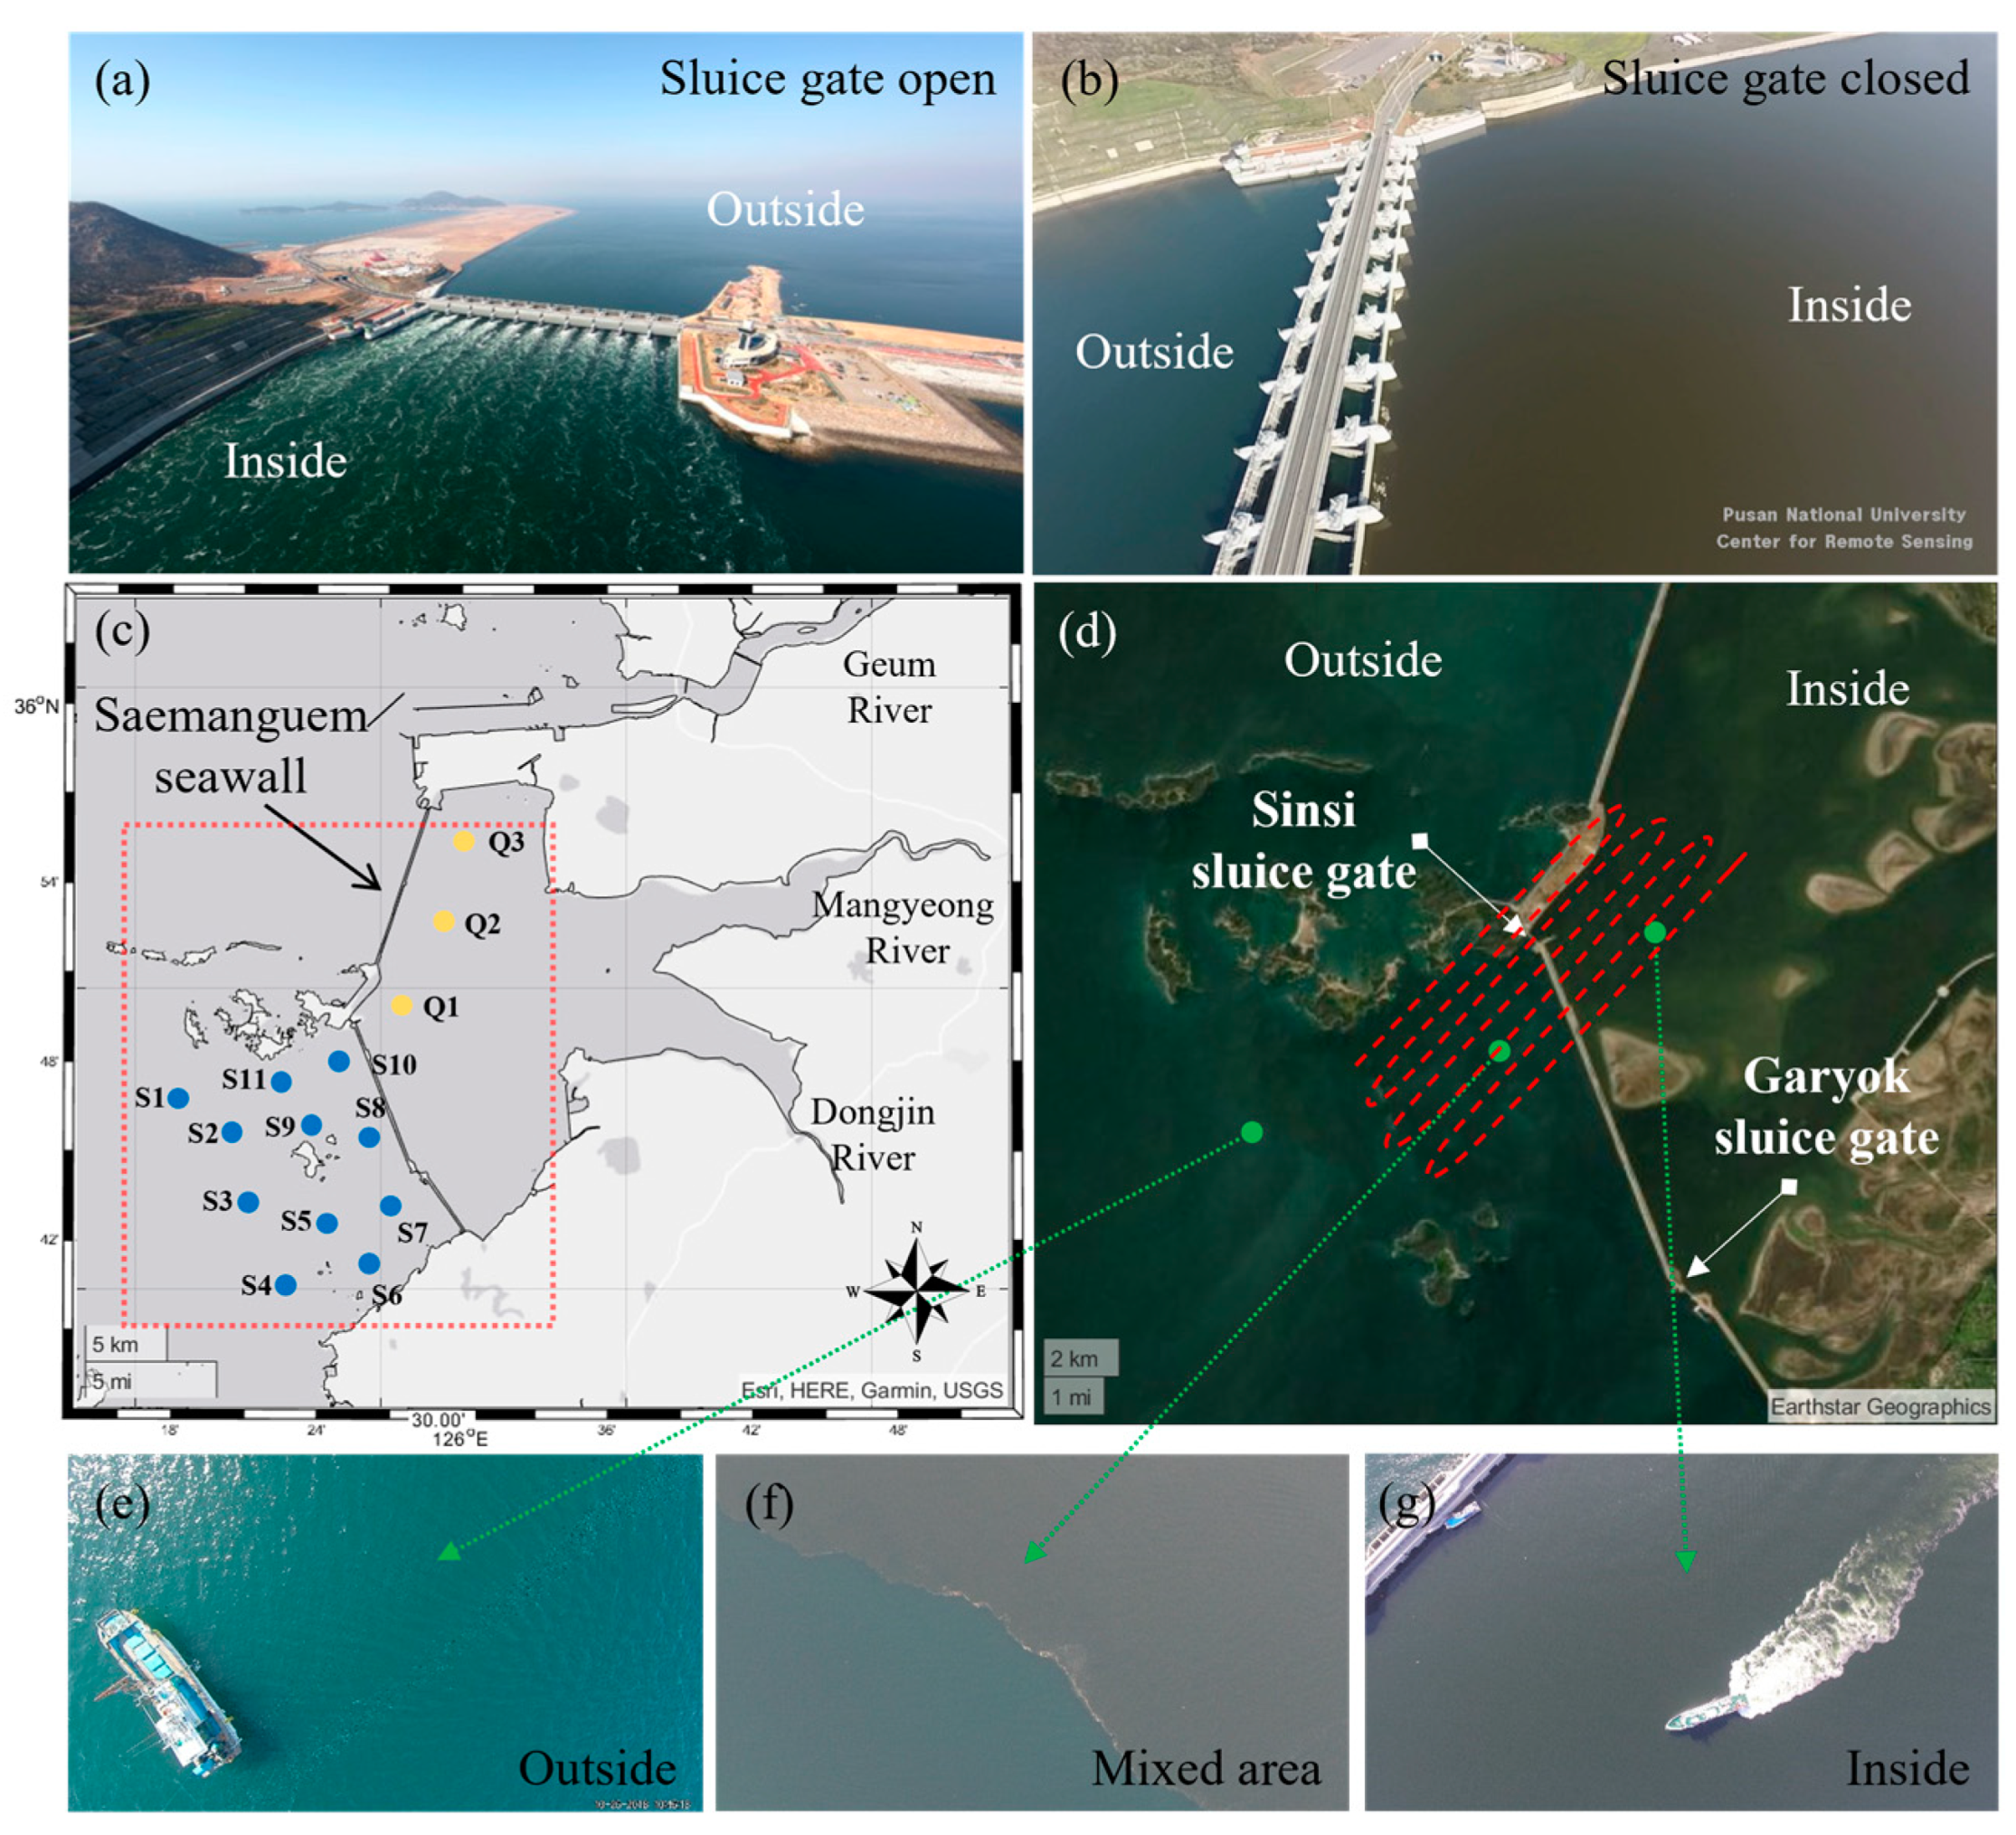
Figure 1. Features of the area surrounding Saemangeum. (a) When the sluice gate of the Saemangeum seawall was opened. (b) When the sluice gate of the Saemangeum seawall is closed. (c) A 33 km seawall completely isolates the water bodies inside and outside the seawall. The blue and yellow symbols represent the in situ sampling stations outside and inside the seawall, respectively. Water sampling and optical observations were performed in parallel at all stations. (d) Flight path of an unmanned aerial vehicle survey (light dotted line) conducted near the Sinsi sluice gate. (e) Outside the seawall. (f) Water mass mixing areas. (g) Inside the seawall.
Remotesensing 15 05540 g001
Figure 2. (a) RedEdge has five lenses that can measure five different wavelengths and can measure downwelling irradiance through the downwelling light sensor module. (b) Filter response of each lens of RedEdge. The central wavelengths of the five bands are 475, 560, 668, 717, and 840 nm.
Remotesensing 15 05540 g002
Figure 3. (a) RedEdge and TriOS RAMSES hyperspectral sensor installed on the side of the boat. Each radiance sensor was installed atop the observation frame, with a zenith angle of 40°. (b,c) Water surface and skyward spectral images captured using the RedEdge. Mean values of the center pixel (orange dotted circle) were compared with the RAMSES spectral shape. (d) The spectral shape of seawater was measured using RedEdge and RAMSES at the same location.
Remotesensing 15 05540 g003
Figure 4. Two UAVs were used in this study. RedEdge cameras and DLS modules were installed on the top and bottom of each UAV. (a) Foxtech Loong 2160 fixed-wing vertical takeoff and landing (VTOL) UAVs were operated on long-distance flights that required wide-range observation. (b) DJI Inspire 2 rotary-wing UAV was used to acquire atmospheric correction data. (c,d) Spectral images of the water surface were observed through the RedEdge mounted on the UAV.
Remotesensing 15 05540 g004
Figure 5. Data processing flow chart for water sampling and multispectral imaging.
Remotesensing 15 05540 g005
Figure 6. Comparative verification using the RAMSES hyperspectral sensor to validate RedEdge performance. Five wavelength bands photographed using RedEdge were compared with those obtained with RAMSES; the relation between each data appeared linear.
Remotesensing 15 05540 g006
Figure 7. Image projection technique on the water surface through direct georeferencing. (a) Raw aerial photos (RedEdge band 1) were obtained through the auto-flight of the unmanned aerial vehicle. (b) Image projection between the camera and ocean surface coordinate systems can be performed through the 3D altitude information and internal information of the camera. (c) Illustration of the automatic flight and strip imaging of the unmanned aerial vehicle. (d) Examples of georeferencing results of aerial images captured at each location.
Remotesensing 15 05540 g007
Figure 8. Changes in spectral characteristics by different suspended sediment concentration (SSC) concentrations in seawater. (a) Spectral graph of SSC concentrations in seawater measured using RedEdge and RAMSES. The peak of the overall reflectance and red edge increased as the SSC concentration increased. (be) Apparent color change of seawater according to SSC concentration.
Remotesensing 15 05540 g008
Figure 9. Suspended sediment concentration estimation algorithm calculated through multiple linear regression. (a) The algorithm was evaluated by setting 80% of the total dataset as the training dataset and 20% as the validation dataset. The R2 and root mean square error (mg L−1) were 0.83 and 4.27, respectively. (b) Histogram of the R2 change in the multiple linear regression model according to the training and validation dataset changes.
Remotesensing 15 05540 g009
Figure 10. (a) A reflectance correction panel (tarp) was installed for relative atmospheric correction of the unmanned aerial vehicle multispectral image. The tarp was constructed of polyvinyl chloride material (1.2 × 1.2 m2) and was installed at the unmanned aerial vehicle takeoff location. (b) A tarp was captured using a multispectral camera at altitudes of 10 m, (c) 100 m, (d) 250 m, and (e) 400 m.
Remotesensing 15 05540 g010
Figure 11. Relative atmospheric correction results of unmanned aerial vehicle multispectral images. (a) The tarp was observed with a multispectral camera. (bd) Changes in reflectivity for each band according to elevation increase. (e) Comparison of reflectance simultaneously observed through multispectral cameras installed on the unmanned aerial vehicle and boat. As the altitude of an unmanned aerial vehicle increases from a fixed location, it causes the observed reflectance to increase relative to the surface level. (fh) Reflectance by altitude after applying the relative atmospheric correction.
Remotesensing 15 05540 g011
Figure 12. (a) Suspended sediment concentration (SSC) map near Sinsi sluice gate observed via a fixed-wing unmanned aerial vehicle (4 August 2020). As the seawall is opened, the high SSC water inside is discharged to the outside. To verify the SSC map, in situ SSC was measured at 13 sampling points (red dots). (b) SSC concentration change graph extracted along the red dotted line. A change in the SSC in the mixing section outside and inside the seawall was confirmed. (c) Correlation between unmanned aerial vehicle-based SSC and in situ SSC. (d) Comparison of SSC analysis results of sampling stations inside and outside the seawall. The orange and blue lines show the estimated SSC and in situ SSC at 13 sampling points, respectively.
Remotesensing 15 05540 g012
Figure 13. (a) SSC mapping image (16 June 2022) captured after the sluice gate was opened. High SSC water was discharged to the outside to form a front. (b) SSC variation along the line (dotted red line in (a)) crossing the observation area. Different SSC characteristics were identified outside the seawall, in the mixing area, and inside the seawall. (c) Suspended sediment concentration (SSC) mapping image captured when the sluice gate was closed (3 August 2022). (d) Crossing line data (dotted red line in (a)) when the seawall is closed. A clear SSC difference between the areas inside and outside the seawall was confirmed.
Remotesensing 15 05540 g013
Figure 14. (a) Suspended sediment concentration front mapping image observed on 30 September 2019. (b) Velocity change in the suspended sediment concentration front (longitudinal direction).
Remotesensing 15 05540 g014
Figure 15. (a) Suspended sediment concentration mapping image observed through an unmanned aerial vehicle on 16 June 2022. (b) Differences in suspended sediment concentration occur depending on the direction along the flight path (white line: eastwards, black line: westwards) of the unmanned aerial vehicle.
Remotesensing 15 05540 g015
Table 1. Field observations and UAV survey data collected during 2018–2020 and statistical characteristics of the overall field observation SSC.
DateNumber of
Observations
Field Observation (on the Ship)UAV Observation
RedEdgeRAMSESWater Sampling (SSC)RedEdge
20 April 201811 sampling pointsOOOO
29 May 201811 sampling pointsOOOO
22 August 201812 sampling pointsOOOO
24 October 201817 sampling pointsOOO-
25 October 201816 sampling pointsOOO-
15 July 201911 sampling pointsO-OO
4 August 202012 sampling pointsOOOO
17 November 20203 sampling pointsOOOO
18 November 20207 sampling pointsOOOO
Statistical Characteristics of Field Observed SSC
SkewnessCoefficient of VariationMinMaxMedianMeanConfidence Intervals
95% (Lower)
Confidence Intervals
95% (Upper)
1.010.742.0236.438.6213.2310.58415.878
Disclaimer/Publisher’s Note: The statements, opinions and data contained in all publications are solely those of the individual author(s) and contributor(s) and not of MDPI and/or the editor(s). MDPI and/or the editor(s) disclaim responsibility for any injury to people or property resulting from any ideas, methods, instructions or products referred to in the content.