

Structural Complexity of Coral Reefs in Guam, Mariana Islands


Abstract
:1. Introduction
2. Materials and Methods
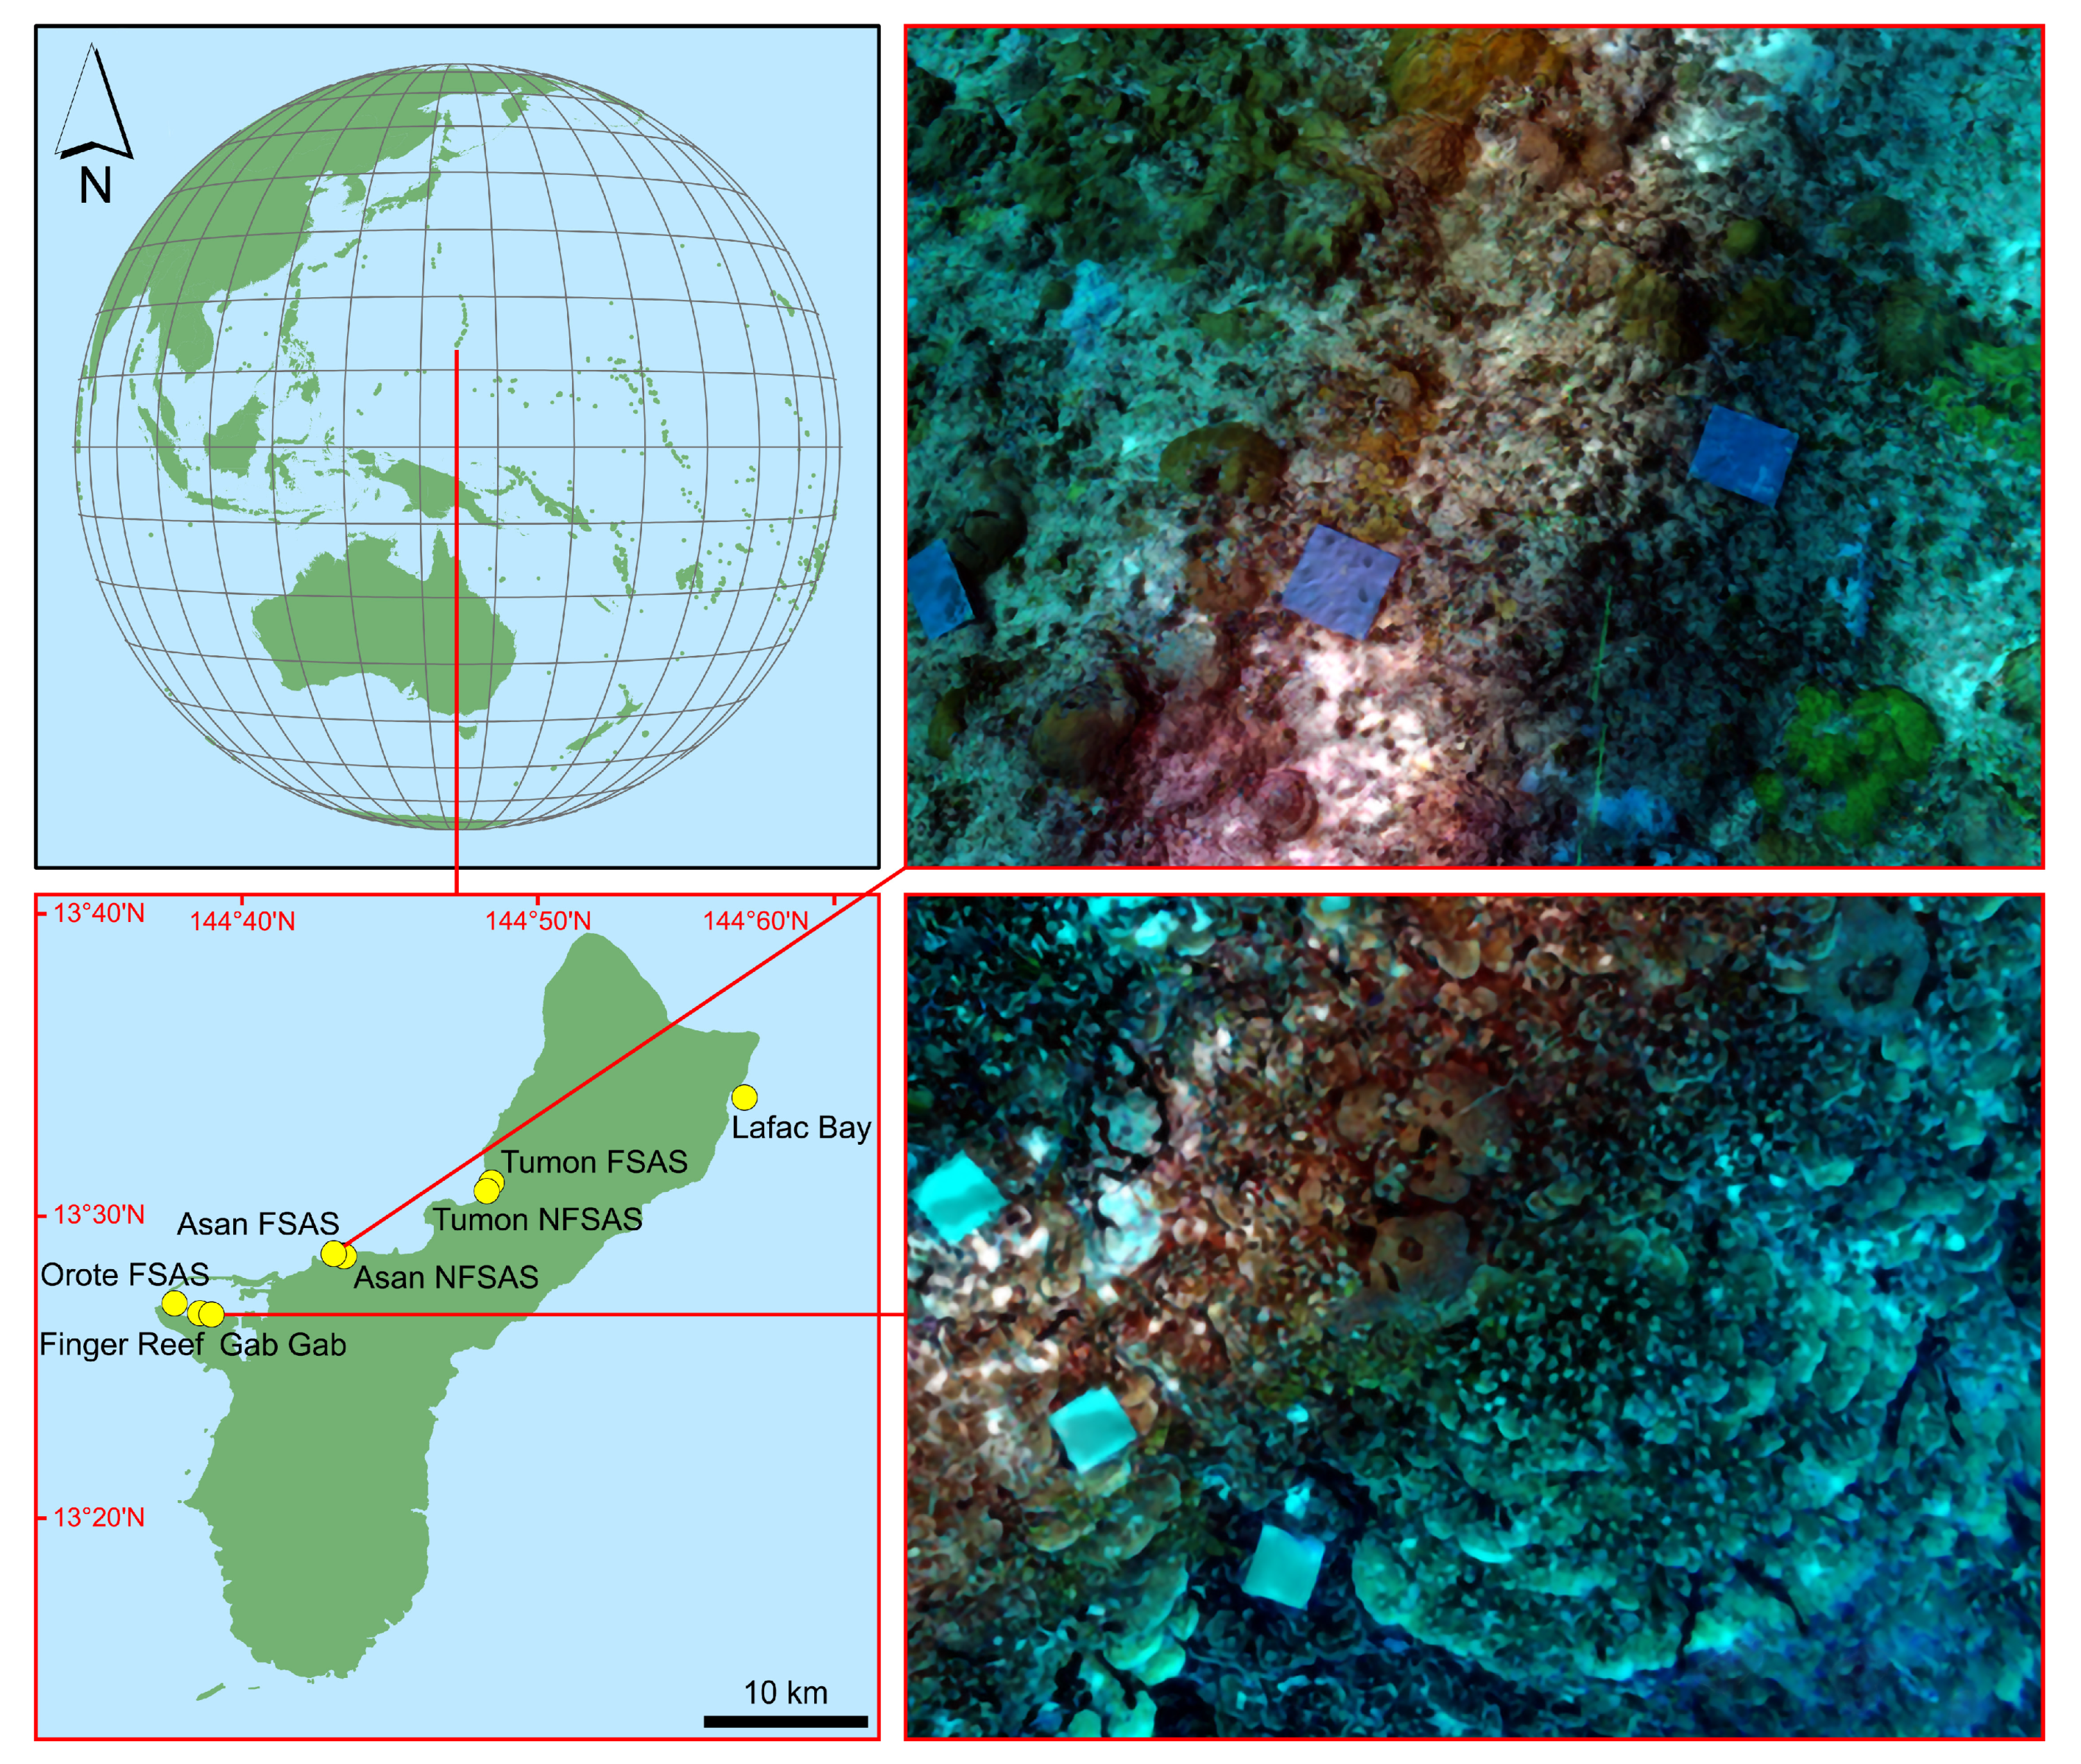
2.1. Study Area
2.2. Structure-from-Motion Photogrammetry
2.3. Data Analysis
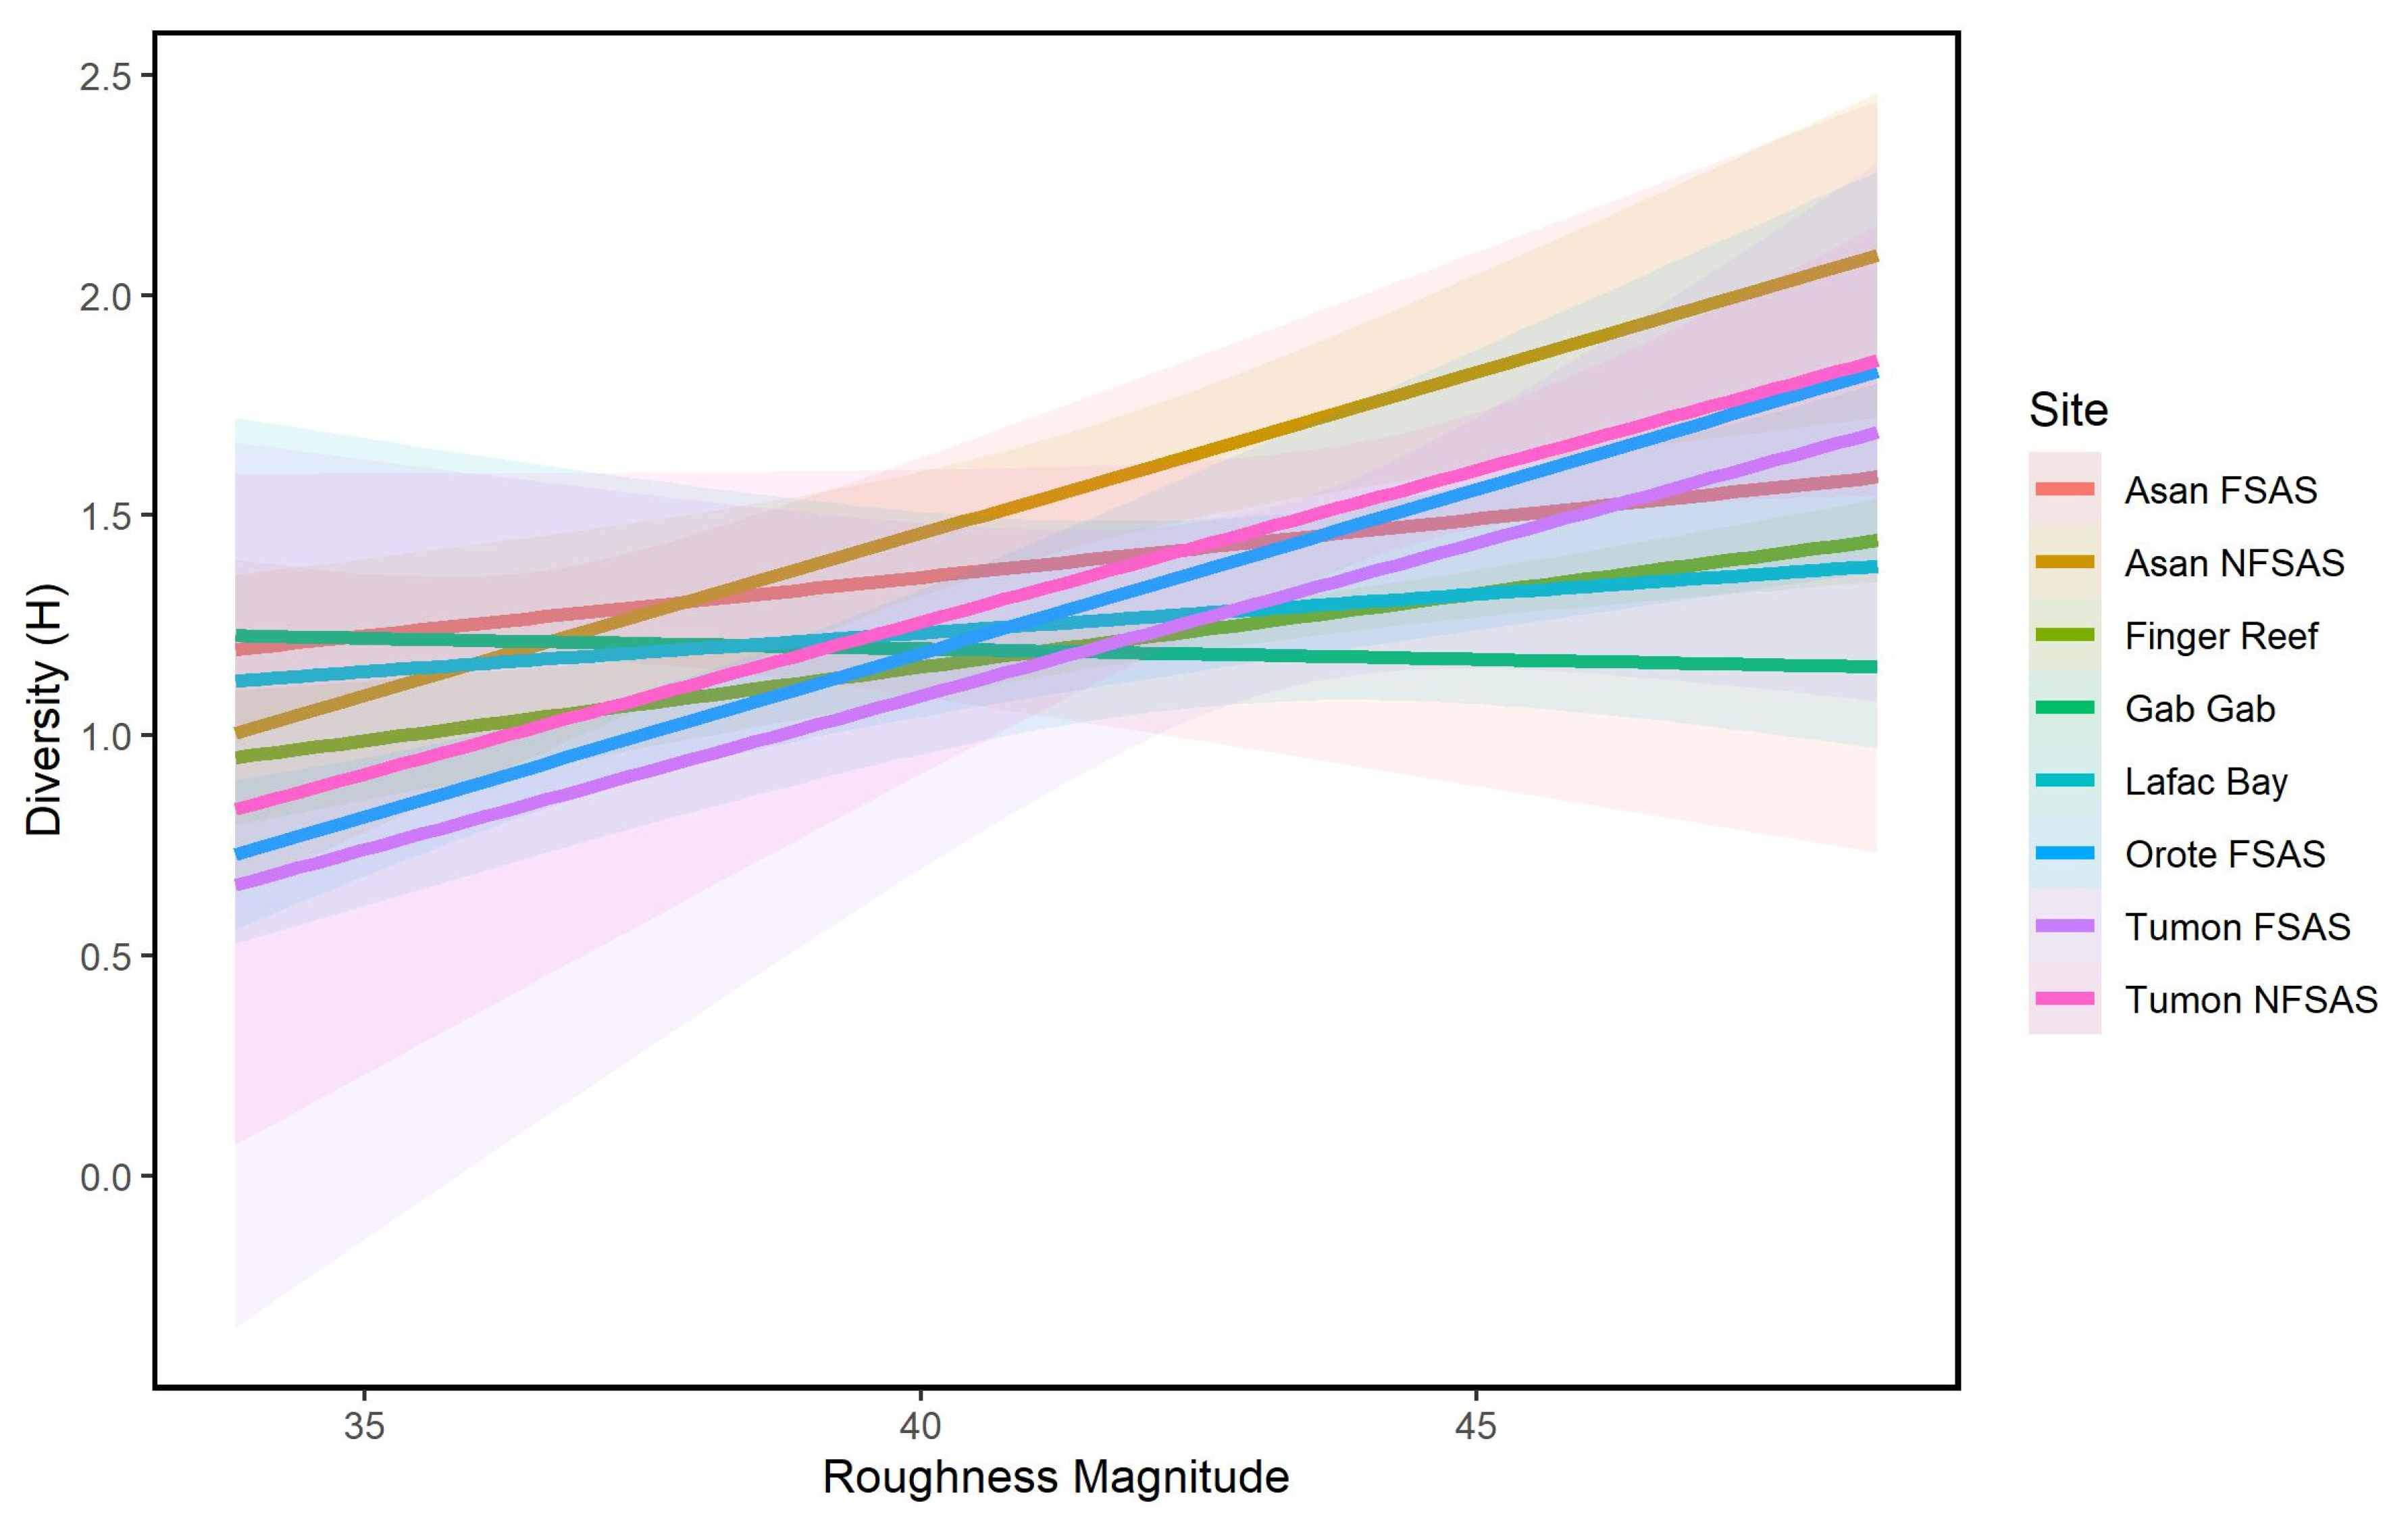
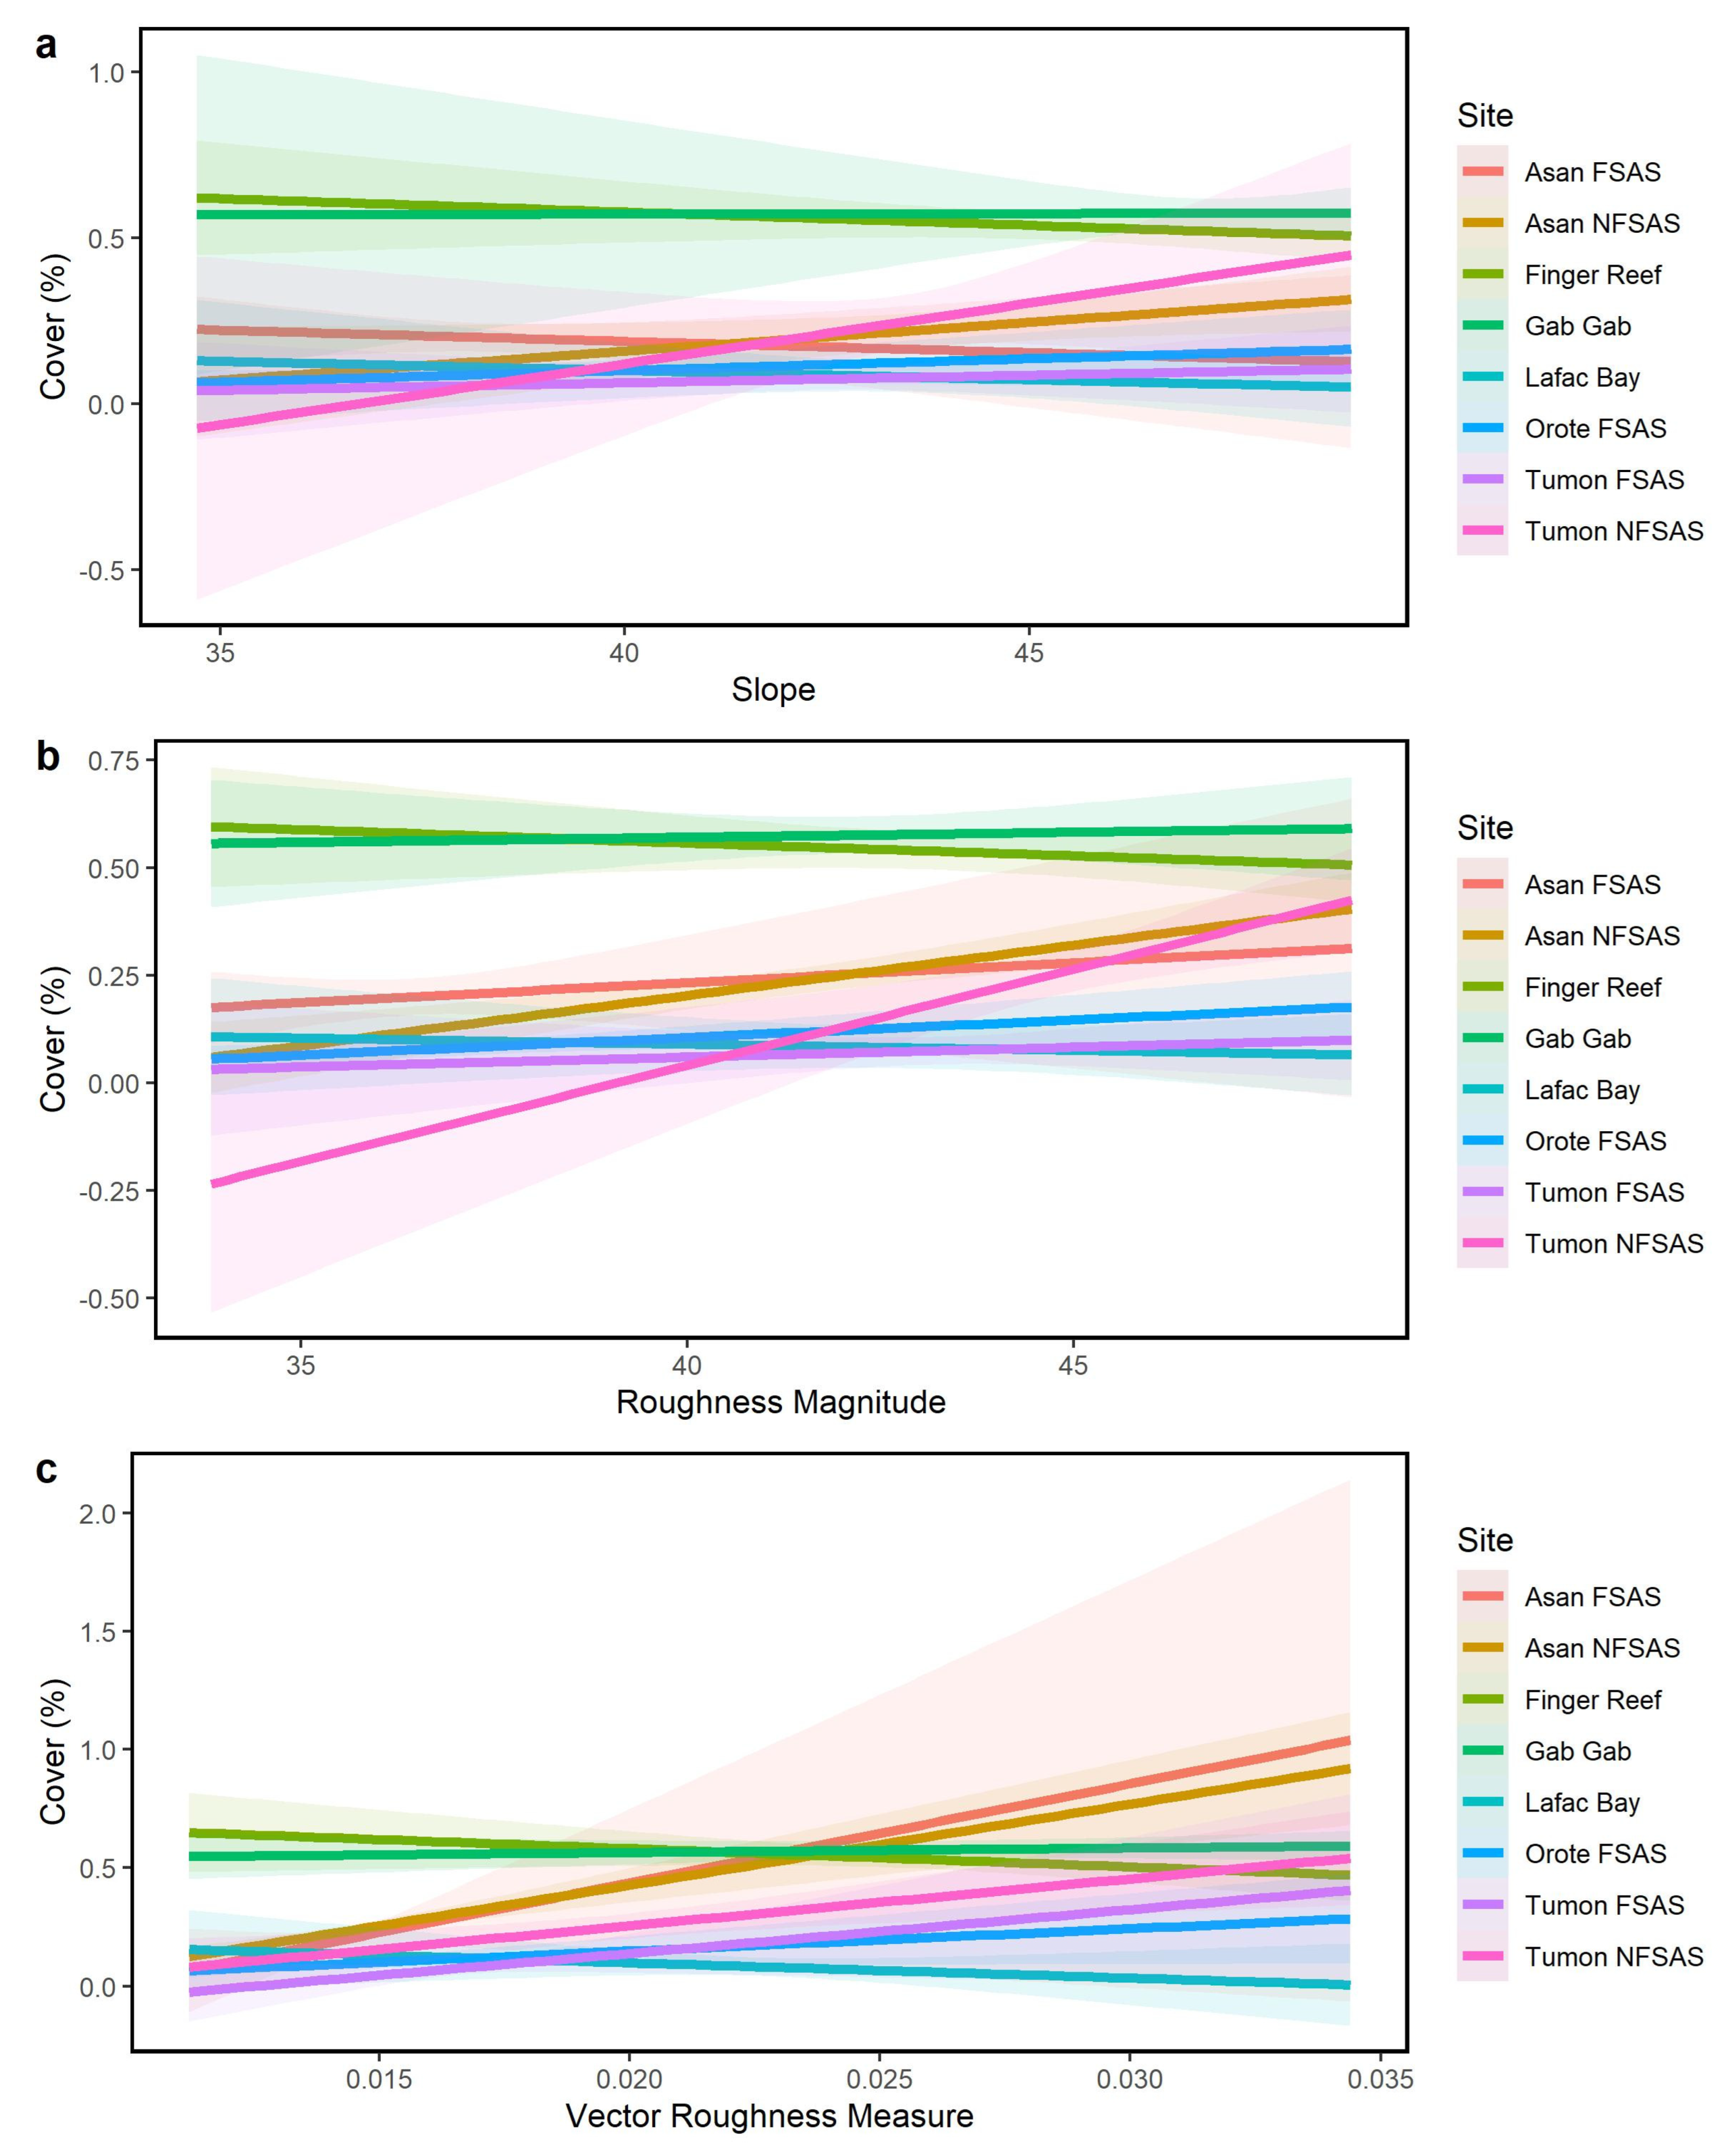
3. Results
4. Discussion
Supplementary Materials
Author Contributions
Funding
Data Availability Statement
Acknowledgments
Conflicts of Interest
References
- Calders, K.; Phinn, S.; Ferrari, R.; Leon, J.; Armston, J.; Asner, G.P.; Disney, M. 3D Imaging Insights into Forests and Coral Reefs. Trends Ecol. Evol. 2019, 35, 6–9. [Google Scholar] [CrossRef]
- Pulido Mantas, T.; Roveta, C.; Calcinai, B.; di Camillo, C.G.; Bambardella, C.; Gregorin, C.; Coppari, M.; Marrocco, T.; Puce, S.; Riccardi, A.; et al. Photogrammetry, from the land to the sea and beyond: A unifying approach to study terrestrial and marine environments. J. Mar. Sci. Eng. 2023, 11, 759. [Google Scholar] [CrossRef]
- McGill, B.J.; Enquist, B.J.; Weiher, E.; Westoby, M. Rebuilding community ecology from functional traits. Trends Ecol. Evol. 2006, 21, 178–185. [Google Scholar] [CrossRef]
- Denis, V.; Ribas-Deulofeu, L.; Sturaro, N.; Kuo, C.-Y.; Chen, C.A. A functional approach to the structural complexity of coral assemblages based on colony morphological features. Sci. Rep. 2017, 7, 9849. [Google Scholar] [CrossRef] [PubMed]
- Graham, M.H. Effects of local deforestation on the diversity and structure of southern California giant kelp forest food webs. Ecosystems 2004, 7, 341–357. [Google Scholar] [CrossRef]
- Ishii, H.T.; Tanabe, S.I.; Hiura, T. Exploring the relationships among canopy structure, stand productivity, and biodiversity of temperate forest ecosystems. For. Sci. 2004, 50, 342–355. [Google Scholar]
- Sleeman, J.; Boggs, G.; Radford, B.; Kendrick, G. Using agent based models to aid reef restoration: Enhancing coral cover and topographic complexity through spatial arrangement of coral transplants. Restor. Ecol. 2005, 13, 685–694. [Google Scholar] [CrossRef]
- McCarthy, O.S.; Smith, J.E.; Petrovic, V.; Sandin, S.A. Identifying the drivers of structural complexity on Hawaiian coral reefs. Mar. Ecol. Prog. Ser. 2022, 702, 71–86. [Google Scholar] [CrossRef]
- Roberts, C.M.; Ormond, R.F.G. Habitat complexity and coral reef fish diversity and abundance on Red Sea fringing reefs. Mar. Ecol. Prog. Ser. 1987, 41, 1–8. [Google Scholar] [CrossRef]
- Graham, N.A.J.; Nash, K.L. The importance of structural complexity in coral reef ecosystems. Coral Reefs 2013, 32, 315–316. [Google Scholar] [CrossRef]
- Darling, E.S.; Graham, N.A.J.; Januchowski-Hartley, F.A.; Nash, K.L.; Pratchett, M.S.; Wilson, S.K. Relationships between structural complexity, coral traits, and reef fish assemblages. Coral Reefs 2017, 36, 561–575. [Google Scholar] [CrossRef]
- Carlot, J.; Rovère, A.; Casella, E.; Harris, D.; Grellet-Muñoz, C.; Chancerelle, Y.; Dormy, E.; Hedouin, L.; Parravicini, V. Community composition predicts photogrammetry-based structural complexity on coral reefs. Coral Reefs 2020, 39, 967–975. [Google Scholar] [CrossRef]
- Wilson, S.K.; Graham, N.A.J.; Polunin, N.V.C. Appraisal of visual assessments of habitat complexity and benthic composition on coral reefs. Mar. Biol. 2007, 151, 1069–1976. [Google Scholar] [CrossRef]
- Kanki, T.; Nakamoto, K.; Hayakawa, J.; Kitagawa, T.; Kawamura, T. A new method for investigating relationships between distribution of sessile organisms and multiple terrain variables by photogrammetry of subtidal bedrocks. Front. Mar. Sci. 2021, 8, 654950. [Google Scholar] [CrossRef]
- Pittman, S.J.; Costa, B.M.; Battista, T.A. Using Lidar bathymetry and boosted regression trees to predict the diversity and abundance of fish and corals. J. Coast. Res. 2009, 10053, 27–38. [Google Scholar] [CrossRef]
- Burns, J.H.R.; Delparte, D.; Kapono, L.; Belt, M.; Gates, R.D.; Takabayashi, M. Assessing the impact of acute disturbances on the structure and composition of a coral community using innovative 3D reconstruction techniques. Methods Oceanogr. 2016, 15–16, 49–59. [Google Scholar] [CrossRef]
- Borland, H.P.; Gilby, B.L.; Henderson, C.J.; Leon, J.X.; Schlacher, T.A.; Connolly, R.M.; Pittman, S.J.; Sheaves, M.; Olds, A.D. The influence of terrain on fish and fisheries: A global synthesis. Fish Fish. 2021, 22, 707–734. [Google Scholar] [CrossRef]
- Bozec, Y.M.; Mumby, P. Synergistic impacts of global warming on the resilience of coral reefs. Philos. Trans. R. Soc. Lond. B Biol. Sci. 2015, 370, 20130267. [Google Scholar] [CrossRef]
- Harris, D.L.; Rovere, A.; Casella, E.; Power, H.; Canavesio, R.; Collin, A.; Pomeroy, A.; Webster, J.M.; Parravicini, V. Coral reef structural complexity provides important coastal protection from waves under rising sea levels. Sci. Adv. 2018, 4, eaao4350. [Google Scholar] [CrossRef]
- Yanovski, R.; Abelson, A. Structural complexity enhancement as a potential coral-reef restoration tool. Ecol. Eng. 2019, 132, 87–93. [Google Scholar] [CrossRef]
- Moberg, F.; Folke, C. Ecological goods and services of coral reef ecosystems. Ecol. Econ. 1999, 29, 215–233. [Google Scholar] [CrossRef]
- Van Beukering, P.; Haider, W.; Longland, M.; Cesar, H.; Sablan, J.; Shjegstad, S.; Beardmore, B.; Liu, Y.; Garces, G.O. The Economic Value of Guam’s Coral Reefs; Technical Report 116; University of Guam Marine Laboratory: Mangilao, Guam, 2007. [Google Scholar]
- Pandolfi, J.M.; Bradbury, R.H.; Sala, E.; Hughes, T.P.; Bjorndal, K.A.; Cooke, R.G.; McArdle, D.; McClenachan, L.; Newman, M.J.H.; Paredes, G.; et al. Global trajectories of the long-term decline of coral reef ecosystems. Science 2003, 301, 955–958. [Google Scholar] [CrossRef] [PubMed]
- Knutson, T.; Camargo, S.J.; Chan, J.C.L.; Emanuel, K.; Ho, C.H.; Kossin, J.; Mohapatra, M.; Satoh, M.; Sugi, M.; Walsh, K.; et al. Tropical cyclones and climate change part II: Projected response to anthropogenic warming. Bull. Am. Meteorol. Soc. 2020, 101, E303–E322. [Google Scholar] [CrossRef]
- Eddy, T.D.; Lam, V.W.Y.; Reygondeau, G.; Cisneros-Montemayor, A.M.; Grer, K.; Palomares, M.L.D.; Bruno, J.F.; Ota, Y.; Cheung, W.W.L. Global decline in capacity of coral reefs to provide ecosystem services. One Earth 2021, 4, 1278–1285. [Google Scholar] [CrossRef]
- Hoegh-Guldberg, O.; Mumby, P.J.; Hooten, A.J.; Steneck, R.S.; Greenfield, P.; Gomez, E.; Harvell, C.D.; Sale, P.F.; Edwards, A.J.; Caldeira, K.; et al. Coral reefs under rapid climate change and ocean acidification. Science 2007, 318, 1737–1742. [Google Scholar] [CrossRef]
- De’ath, G.; Fabricius, K.E.; Sweatman, H.; Puotinen, M. The 27-year decline of coral cover on the Great barrier Reef and its causes. Proc. Natl. Acad. Sci. USA 2012, 109, 17995–17999. [Google Scholar] [CrossRef]
- Bozec, Y.M.; Alvarez-Filip, L.; Mumby, P.J. The dynamics or architectural complexity on coral reefs under climate change. Glob. Change Biol. 2014, 21, 223–235. [Google Scholar] [CrossRef]
- Magel, J.M.T.; Burns, J.H.R.; Gates, R.D.; Baum, J.K. Effects of bleaching-associated mass coral mortality on reef structural complexity across a gradient of local disturbance. Sci. Rep. 2019, 9, 2512. [Google Scholar] [CrossRef]
- Medina-Valmaseda, A.E.; Rodríguez-Martínez, R.E.; Álvarez-Filip, L.; Jordan-Dahlgren, E.; Blanchon, P. The role of geomorphic zonation in long-term changes in coral-community structure on a Caribbean fringing reef. PeerJ 2020, 8, e10103. [Google Scholar] [CrossRef]
- Alvarez-Filip, L.; Dulvy, N.K.; Gill, J.A.; Côté, I.M.; Watkinson, A.R. Flattening of Caribbean coral reefs: Region-wide declines in architectural complexity. Proc. R. Soc. Biol. Sci. 2009, 276, 3019–3025. [Google Scholar] [CrossRef]
- Perry, C.T.; Alvarez-Filip, L.; Graham, N.A.J.; Mumby, P.J.; Wilson, S.K.; Kench, P.S.; Manzello, D.P.; Morgan, K.M.; Slangen, A.B.A.; Thomson, D.P.; et al. Loss of coral reef growth capacity to track future increases in sea level. Nature 2018, 558, 396–400. [Google Scholar] [CrossRef] [PubMed]
- Ferrari, R.; Leon, J.X.; Davies, A.J.; Burns, J.H.R.; Sandin, S.A.; Figueira, W.F.; González-Rivero, M. Editorial: Advances in 3D Habitat Mapping of Marine Ecosystem Ecology and Conservation. Front. Mar. Sci. 2022, 8, 827430. [Google Scholar] [CrossRef]
- McCormick, M. Comparison of field methods for measuring surface topography and their associations with a tropical reef fish assemblage. Mar. Ecol. Prog. Ser. 1994, 112, 87–96. [Google Scholar] [CrossRef]
- Friedman, A.; Pizarro, O.; Williams, S.B.; Johnson-Roberson, M. Multi-scale measures of rugosity, slope and aspect from benthic stereo image reconstructions. PLoS ONE 2012, 7, e50440. [Google Scholar] [CrossRef] [PubMed]
- Leon, J.X.; Roelfsema, C.M.; Saunders, M.I.; Phinn, S.R. Measuring coral reef terrain roughness using ‘Structure-from-motion’ close-range photogrammetry. Geomorphology 2015, 242, 21–28. [Google Scholar] [CrossRef]
- Fukunaga, A.; Burns, J.H.R.; Craig, B.K.; Kosaki, R.K. Integrating three-dimensional benthic habitat characterization techniques into ecological monitoring of coral reefs. J. Mar. Sci. Eng. 2019, 7, 27. [Google Scholar] [CrossRef]
- Lecours, V.; Espriella, M. Can multiscale roughness help computer-assisted identification of coastal habitats in Florida? In Proceedings of the Geomorphometry 2020 Conference, Perugia, Italy, 22–26 June 2020; pp. 111–114. [Google Scholar]
- Pascoe, K.H.; Fukunaga, A.; Kosaki, R.K.; Burns, J.H.R. 3D assessment of a coral reef at Lalo Atoll reveals varying responses of habitat metrics following a catastrophic hurricane. Sci. Rep. 2021, 11, 12050. [Google Scholar] [CrossRef]
- Harris, D.L.; Webster, J.M.; Vila-Concejo, A.; Duce, S.; Leon, J.X.; Hacker, J. Defining multi-scale surface roughness of a coral reef using a high-resolution LiDAR digital elevation model. Geomorphology 2023, 439, 108852. [Google Scholar] [CrossRef]
- Smith, M.W. Roughness in the Earth sciences. Earth Sci. Rev. 2014, 136, 202–225. [Google Scholar] [CrossRef]
- Burns, J.H.R.; Delparte, D.; Gates, R.D.; Takabayashi, M. Integrating structure-from-motion photogrammetry with geospatial software as a novel technique for quantifying 3D ecological characteristics of coral reefs. PeerJ 2015, 3, e1077. [Google Scholar] [CrossRef]
- Kochan, D.P.; Mitchell, M.D.; Zuercher, R.; Harborne, A.R. Winners and losers of reef flattening: An assessment of coral reef fish species and traits. Oikos 2023, e10011. [Google Scholar] [CrossRef]
- Risk, M.J. Fish diversity on a coral reef in the Virgin Islands. Atoll Res. Bull. 1972, 153, 1–6. [Google Scholar] [CrossRef]
- Bayley, D.T.I.; Mogg, A.O.M.; Koldewey, H.; Purvis, A. Capturing complexity: Field-testing the use of ‘structure from motion’ derived virtual models to replicate standard measures of reef physical structure. PeerJ 2019, 7, e6540. [Google Scholar] [CrossRef] [PubMed]
- Olden, J.D.; Lawler, J.L.; LeRoy Poff, N. Machine learning methods without tears: A primer for ecologists. Q. Rev. Biol. 2008, 83, 171–193. [Google Scholar] [CrossRef] [PubMed]
- Ullman, S. The interpretation of structure from motion. Proc. R. Soc. B Biol. Sci. 1979, 203, 405–426. [Google Scholar]
- Westoby, M.J.; Brasington, J.; Glasser, N.F.; Hambrey, M.J.; Reynolds, J.M. ‘Structure-from-Motion’ photogrammetry: A low-cost, effective tool for geoscience applications. Geomorphology 2012, 179, 300–314. [Google Scholar] [CrossRef]
- Couch, C.S.; Oliver, T.A.; Suka, R.; Lamirand, M.; Asbury, M.; Amir, C.; Vargas-Ángel, B.; Winston, M.; Huntington, B.; Lichowski, F.; et al. Comparing coral colony surveys from in-water observations and Structure-from-Motion imagery shows low methodological bias. Front. Mar. Sci. 2021, 8, 647943. [Google Scholar] [CrossRef]
- Urbina-Barreto, I.; Chiroleu, F.; Pinel, R.; Fréchon, L.; Mahamadaly, V.; Elise, S.; Kulbicki, M.; Quod, J.-P.; Dutrieux, E.; Garnier, R.; et al. Quantifying the shelter capacity of coral reefs using photogrammetric 3D modeling: From colonies to reefscapes. Ecol. Indic. 2021, 121, 107151. [Google Scholar] [CrossRef]
- Lange, I.D.; Molina-Hernández, A.; Medellín-Maldonado, F.; Perry, C.T.; Álvarez-Filip, L. Structure-from-motion photogrammetry bemonstrates variability in coral growth within colonies and across habitats. PLoS ONE 2022, 17, e0277546. [Google Scholar] [CrossRef]
- González-Rivero, M.; Harborne, A.R.; Herrera-Reveles, A.; Bozec, Y.-M.; Rogers, A.; Friedman, A.; Ganase, A.; Hoegh-Guldberg, O. Linking fishes to multiple metrics of coral reef structural complexity using three-dimensional technology. Sci. Rep. 2017, 7, 13965. [Google Scholar] [CrossRef]
- Ferrari, R.; Malcolm, H.A.; Byrne, M.; Friedman, A.; Williams, S.B.; Schultz, A.; Jordan, A.R.; Figueira, W.T. Habitat structural complexity metrics improve predictions of fish abundance of distribution. Ecography 2018, 41, 1077–1091. [Google Scholar] [CrossRef]
- Ferrari, R.; Bryson, M.; Bridge, T.; Hustache, J.; Williams, S.B.; Byrne, M.; Figueira, W. Quantifying the response of structural complexity and community composition to environmental change in marine communities. Glob. Chang. Biol. 2015, 22, 1965–1975. [Google Scholar] [CrossRef]
- Roberts, C.M.; McClean, C.J.; Veron, J.E.N.; Hawkins, J.P.; Allen, G.R.; McAllister, D.E.; Mittermeier, C.G.; Schueler, F.W.; Spalding, M.; Wells, F.; et al. Marine biodiversity hotspots and conservation priorities for tropical reefs. Science 2002, 295, 1280–1284. [Google Scholar] [CrossRef]
- Lobban, C.S.; Tsuda, R.T. Revised checklist of benthic marine macroalgae and seagrasses of Guam and Micronesia. Micronesica 2003, 35, 54–99. [Google Scholar]
- Paulay, G. Marine biodiversity of Guam and the Marianas: Overview. Micronesica 2003, 35–36, 3–25. [Google Scholar]
- Randall, R.H. An annotated checklist of hydrozoan and scleractinian corals collected from Guam and other Mariana Islands. Micronesica 2003, 35–36, 121–137. [Google Scholar]
- Mills, M.S.; Deinhart, M.E.; Heagy, M.N.; Schils, T. Small tropical islands as hotspots of crustose calcifying red algal diversity and endemism. Front. Mar. Sci. 2022, 9, 898308. [Google Scholar] [CrossRef]
- Burdick, D.; Brown, V.; Asher, J.; Caballes, C.; Gawel, M.; Goldman, L.; Hall, A.; Kenyon, J.; Leberer, T.; Lundblad, E.; et al. Status of the Coral Reef Ecosystems of Guam; Bureau of Statistics and Plans, Guam Coastal Management Program: Hagåtña, Guam, 2008.
- Reynolds, T.; Burdick, D.; Houk, P.; Raymundo, L. Unprecedented coral bleaching across the Marianas Archipelago. Coral Reefs 2014, 33, 499. [Google Scholar] [CrossRef]
- Raymundo, L.J.; Burdick, D.; Hoot, W.C.; Miller, R.M.; Brown, V.; Reynolds, T.; Gault, J.; Idechong, J.; Fifer, J.; Williams, A. Successive bleaching events cause mass coral mortality in Guam, Micronesia. Coral Reefs 2019, 38, 677–700. [Google Scholar] [CrossRef]
- Schils, T. Branching Lithophyllum coralline algae: Dominant reef builders on herbivory-depressed tropical reefs after high coral mortality. Diversity 2023, 15, 1025. [Google Scholar] [CrossRef]
- Edmunds, P.J.; Schils, T.; Wilson, B. The rising threat of peyssonnelioid algal crusts on coral reefs. Curr. Biol. 2023, 33, 1140–1141. [Google Scholar] [CrossRef] [PubMed]
- Schils, T.; Schupp, P.; Raymundo, L.; Halford, A.; Caballes, C.; DeVillers, A.; Rohde, S. Coral Reef Monitoring Kilo Wharf Extension, Apra Harbor, Guam; Technical Report; University of Guam Marine Laboratory: Mangilao, Guam, 2011. [Google Scholar]
- Schils, T.; Houk, P.; Biggs, J.S.; Donaldson, T.J.; Kense, A.; McLean, M. Marine Resource Survey and Monitoring on Guam; Technical Report; University of Guam Marine Laboratory: Mangilao, Guam, 2015. [Google Scholar]
- González Rivero, M.; Bray, P.; Jonker, M.; Ferrari, R. 3D Habitat Reconstructions of Benthic Communities. Long-Term Monitoring of the Great Barrier Reef. Standard Operational Procedure 12; Australian Institute of Marine Science: Townsville, Australia, 2020; pp. 1–33. [CrossRef]
- Mosbrucker, A.R.; Major, J.J.; Spicer, K.R.; Pitlick, J. Camera system considerations for geomorphic applications of SfM photogrammetry. Earth Surf. Process. Landf. 2016, 42, 969–986. [Google Scholar] [CrossRef]
- Mills, M.S.; Ungermann, M.; Rigot, G.; den Haan, J.; Leon, J.X.; Schils, T. Coral reefs in transition: Temporal photoquadrat analyses and validation of underwater hyperspectral imaging for resource-efficient monitoring. PLoS ONE 2023. accepted subject to revisions. [Google Scholar]
- Mills, M.S.; Ungermann, M.; Rigot, G.; den Haan, J.; Leon, J.X.; Schils, T. Assessment of the utility of underwater hyperspectral imaging for surveying and monitoring coral reef ecosystems. Sci. Rep. 2023. accepted. [Google Scholar] [CrossRef]
- Smith, M.W.; Carrivick, J.L.; Quincey, D.J. Structure from motion photogrammetry in physical geography. Prog. Phys. Geo. 2015, 40, 247–275. [Google Scholar] [CrossRef]
- James, M.R.; Chandler, J.H.; Eltner, A.; Fraser, C.; Miller, P.E.; Mills, J.P.; Noble, T.; Robson, S.; Lane, S.N. Guidelines on the use of structure-from-motion photogrammetry in geomorphic research. Earth Surf. Process. Landf. 2019, 44, 2081–2084. [Google Scholar] [CrossRef]
- Walbridge, S.; Slocum, N.; Pobuda, M.; Wright, D.J. Unified geomorphological analysis workflows with benthic terrain modeler. Geosciences 2018, 8, 94. [Google Scholar] [CrossRef]
- Mayorga-Martínez, M.; Bello-Pineda, J.; Perales-Valdivia, H.; Pérez-España, H.; Heyman, W.D. Characterizing geomorphology of mesophotic coral reef ecosystems in the southwestern Gulf of Mexico: Implications for conservation and management. Front. Mar. Sci. 2021, 8, 639359. [Google Scholar] [CrossRef]
- Espriella, M.C.; Lecours, V.; Camp, E.V.; Lassiter, H.A.; Wilkinson, B.; Frederick, P.C.; Pittman, S.J. Drone lidar-derived surface complexity metrics as indicators of intertidal oyster reef condition. Ecol. Indic. 2023, 150, 110190. [Google Scholar] [CrossRef]
- Lindsay, J.B. Whitebox GAT: A case study in geomorphometric analysis. Comput. Geosci. 2016, 95, 75–84. [Google Scholar] [CrossRef]
- Lindsay, J.B.; Newman, D.R.; Francioni, A. Scale-optimized surface roughness for topographic analysis. Geosciences 2019, 9, 322. [Google Scholar] [CrossRef]
- Jenness, J.S. Calculating landscape surface area from digital elevation models. Wildl. Soc. Bull. 2004, 32, 829–839. [Google Scholar] [CrossRef]
- Dustan, P.; Doherty, O.; Pardede, S. Digital reef rugosity estimated coral reef habitat complexity. PLoS ONE 2013, 8, e57386. [Google Scholar] [CrossRef] [PubMed]
- Wedding, L.M.; Friedlander, A.M.; McGranaghan, M.; Yost, R.S.; Monaco, M.E. Using bathymetric lidar to define nearshore benthic habitat complexity: Implications for management of reef fish assemblages in Hawaii. Remote Sens. Environ. 2008, 11, 4159–4165. [Google Scholar] [CrossRef]
- Sappington, J.M.; Longshore, K.M.; Thompson, D.B. Quantifying landscape ruggedness for animal habitat analysis: A case study using bighorn sheep in the Mojave Desert. J. Wildl. Manag. 2007, 71, 1419–1426. [Google Scholar] [CrossRef]
- Young, M.A.; Iampietro, P.J.; Kvitek, R.G.; Garza, C.D. Multivariate bathymetry-derived generalized linear model accurately predicts rockfish distribution on Cordell Bank, California, USA. Mar. Ecol. Prog. Ser. 2010, 415, 247–261. [Google Scholar] [CrossRef]
- Zevenbergen, L.W.; Thorne, C.R. Quantitative analysis of land surface topography. Earth Surf. Process Landf. 1987, 12, 47–56. [Google Scholar] [CrossRef]
- Shannon, C.E. A mathematical theory of communication. Bell Syst. Tech. J. 1948, 27, 379–423. [Google Scholar] [CrossRef]
- Oksanen, J.; Simpson, G.P.; Blanchet, G.; Kindt, R.; Legendre, P.; Minchin, P.R.; O’Hara, R.B.; Solymos, P.; Stevens, M.H.H.; Szoecs, E.; et al. Vegan: Community Ecology Package. R Package Version 2.6–4. 2022. Available online: https://CRAN.R-project.org/package=vegan (accessed on 26 October 2023).
- Knudby, A.; LeDrew, E. Measuring structural complexity on coral reefs. In Proceedings of the American Academy of Underwater Sciences 26th Symposium, Coral Gables, FL, USA, 9–10 March 2007; Pollock, N.W., Godfrey, J.M., Eds.; AAUS: Dauphin Island, AL, USA, 2007; pp. 181–188. [Google Scholar]
- Blakeway, D.; Hamblin, M.G. Self-generated morphology in lagoon reefs. PeerJ 2015, 3, e935. [Google Scholar] [CrossRef]
- Austin, M.P. Spatial prediction of species distribution: An interface between ecological theory and statistical modelling. Ecol. Model. 2002, 2–3, 101–118. [Google Scholar] [CrossRef]
- Collin, A.; Archambault, P.; Long, B. Predicting species diversity of benthic communities within turbid nearshore using full-waveform bathymetric LiDAR and machine learners. PLoS ONE 2011, 6, e21265. [Google Scholar] [CrossRef]
- Adjeroud, M. Factors influencing spatial patterns on coral reefs around Moorea, French Polynesia. Mar. Ecol. Prog. Ser. 1997, 159, 105–119. [Google Scholar] [CrossRef]
- Davies, P.; Kinsey, D. Holocene reef growth—One Tree Island, Great Barrier Reef. Mar. Geol. 1977, 24, M1–M11. [Google Scholar] [CrossRef]
- Sale, P.F.; Douglas, W.A. Temporal variability in the community structure of fish on coral patch reefs and the relation of community structure to reef structure. Ecology 1984, 65, 409–422. [Google Scholar] [CrossRef]
- Ferreira, S.B.; Burns, J.H.R.; Pascoe, K.H.; Kapono, C.A.; Reyes, A.J.; Fukunaga, A. Prediction of habitat complexity using a trait-based approach on coral reefs in Guam. Sci. Rep. 2023, 13, 11095. [Google Scholar] [CrossRef] [PubMed]
- Goreau, T.F. The ecology of Jamaican coral reefs I. Species composition and zonation. Ecology 1959, 40, 67–90. [Google Scholar] [CrossRef]
- Urbina-Barreto, I.; Garnier, R.; Elise, S.; Pinel, R.; Dumas, P.; Mahamadaly, V.; Facon, M.; Bureau, S.; Piegnon, C.; Quod, J.-P.; et al. Which method for which purpose? A comparison of line intercept transect and underwater photogrammetry methods for coral reef surveys. Front. Mar. Sci. 2021, 8, e636902. [Google Scholar] [CrossRef]
- Matias, M.G.; Underwood, A.J.; Hochuli, D.F.; Coleman, R.A. Independent effects of patch size and structural complexity on diversity of benthic macroinvertebrates. Ecology 2010, 91, 1908–1915. [Google Scholar] [CrossRef]
- Duvall, M.S.; Rosman, J.H.; Hench, J.L. Estimating Geometric Properties of Coral Reef Topography Using Obstacle- and Surface-Based Approaches. J. Geophys. Res. 2020, 125, e2019JC015870. [Google Scholar] [CrossRef]
- Torres-Pulliza, D.; Dornelas, M.A.; Pizarro, O.; Bewley, M.; Blowes, S.A.; Boutros, N.; Brambilla, V.; Chase, T.J.; Frank, G.; Friedman, A.; et al. A geometric basis for surface habitat complexity and biodiversity. Nat. Ecol. Evol. 2020, 4, 1495–1501. [Google Scholar] [CrossRef]
- Fukunaga, A.; Burns, J.H. Metrics of coral reef structural complexity extracted from 3D mesh models and digital elevation models. Remote Sens. 2020, 12, 2676. [Google Scholar] [CrossRef]
- Fukunaga, A.; Burns, J.H.R.; Pascoe, K.H.; Kosaki, R.K. Associations between benthic cover and habitat complexity metrics obtained from 3D reconstruction of coral reefs at different resolutions. Remote Sens. 2020, 12, 1011. [Google Scholar] [CrossRef]
- Dahl, A.L. Surface area in ecological analysis: Quantification of benthic coral-reef algae. Mar. Biol. 1973, 23, 239–249. [Google Scholar] [CrossRef]
- Wulff, J.L. Resistance vs recovery: Morphological strategies of coral reef sponges. Funct. Ecol. 2006, 20, 699–708. [Google Scholar] [CrossRef]


| Terrain Metric | Description and Relevance | References |
|---|---|---|
| Surface/area ratio (rugosity) | The ratio between the surface area (3D) and planar area (2D) of terrain. A long-used terrain metric in ecological reef surveys. The primary metric used to measure ‘coral reef flattening’. | [31,78,79] |
| Slope | The degree of incline (steepness) of a surface. It is measured as the maximum rate of change in elevation between a cell and the eight cells surrounding it. An often-used metric to describe steepness, seafloor complexity, and vertical relief of reefs. | [17,80] |
| Vector ruggedness measure | Quantifies ruggedness as the variation in the 3D orientation of cells within the roving window, effectively capturing slope and aspect (direction of slope) into a single measure. A metric of seafloor complexity that is decoupled from slope or elevation, often allowing it to quantify terrain variation more independently and quantify different features of terrain than many other traditional metrics. | [40,81,82] |
| Roughness magnitude | The first output of MultiscaleRoughness (MR), which determines the maximum roughness value (σmax) for each cell in a raster. Multiscale metrics such as MR mitigate the shortcomings associated with arbitrary scale selection. | [38,40,77] |
| Roughness scale | The second output of MultiscaleRoughness, which determines the filter radius (spatial scale; r) associated with the greatest roughness value that identifies the spatial scale at which σmax is expressed. | [38,40,77] |
| Profile curvature | Curvature evaluated parallel to the slope. It indicates the direction of the maximum slope and can describe the acceleration or deceleration of benthic flow. It can be used to assess the structural dynamics of reefs and measure the structural complexity of coral species. | [39,42,73,83] |
| Planform (plan) curvature | Curvature evaluated perpendicular to the slope. It can be used to describe the convergence or divergence of flow and measure the structural complexity of coral species, ridges, crests, and valleys. | [39,42,73,83] |
| Site | Diversity (H) | Coral Cover (%) | Rugosity | Slope (°) | VRM | Magnitude (σmax) | Scale (r) | Plan Curvature (z Units) | Profile Curvature (z Units) |
|---|---|---|---|---|---|---|---|---|---|
| Asan NFSAS | 1.54 ± 0.12 | 22 ± 3 | 2.51 ± 0.35 | 44 ± 2 | 0.014 ± 0.001 | 41.11 ± 1.42 | 184.70 ± 7.53 | 2482.85 ± 802.93 | 3589.53 ± 1122.11 |
| Asan FSAS | 1.26 ± 0.05 | 20 ± 2 | 1.69 ± 0.06 | 38 ± 1 | 0.014 ± 0.000 | 36.38 ± 0.67 | 184.03 ± 4.46 | 1056.51 ± 204.27 | 1528.26 ± 284.37 |
| Finger Reef | 1.27 ± 0.05 | 54 ± 2 | 2.27 ± 0.10 | 45 ± 1 | 0.025 ± 0.002 | 43.29 ± 1.38 | 145.61 ± 1.57 | 891.74 ± 125.04 | 1335.75 ± 173.00 |
| Gab Gab | 1.19 ± 0.01 | 57 ± 2 | 3.04 ± 0.67 | 47 ± 1 | 0.026 ± 0.004 | 42.08 ± 1.76 | 153.22 ± 11.12 | 2583.70 ± 988.53 | 3541.23 ± 1287.13 |
| Lafac Bay | 1.25 ± 0.07 | 8 ± 1 | 2.81 ± 0.13 | 44 ± 1 | 0.020 ± 0.003 | 38.15 ± 5.01 | 153.84 ± 3.02 | 2981.92 ± 181.20 | 4324.59 ± 187.65 |
| Orote FSAS | 0.99 ± 0.10 | 8 ± 1 | 1.78 ± 0.11 | 38 ± 1 | 0.013 ± 0.001 | 37.33 ± 1.26 | 176.30 ± 1.16 | 1568.27 ± 259.30 | 2225.05 ± 378.13 |
| Tumon NFSAS | 1.58 ± 0.08 | 25 ± 4 | 2.32 ± 0.11 | 43 ± 1 | 0.020 ± 0.002 | 44.60 ± 0.82 | 173.69 ± 4.21 | 1735.55 ± 241.49 | 2663.47 ± 363.15 |
| Tumon FSAS | 1.31 ± 0.11 | 7 ± 2 | 2.32 ± 0.07 | 42 ± 1 | 0.017 ± 0.001 | 43.16 ± 0.89 | 176.47 ± 3.02 | 1654.36 ± 97.20 | 2590.27 ± 132.90 |
Disclaimer/Publisher’s Note: The statements, opinions and data contained in all publications are solely those of the individual author(s) and contributor(s) and not of MDPI and/or the editor(s). MDPI and/or the editor(s) disclaim responsibility for any injury to people or property resulting from any ideas, methods, instructions or products referred to in the content. |
© 2023 by the authors. Licensee MDPI, Basel, Switzerland. This article is an open access article distributed under the terms and conditions of the Creative Commons Attribution (CC BY) license (https://creativecommons.org/licenses/by/4.0/).
Share and Cite
Mills, M.S.; Schils, T.; Olds, A.D.; Leon, J.X. Structural Complexity of Coral Reefs in Guam, Mariana Islands. Remote Sens. 2023, 15, 5558. https://doi.org/10.3390/rs15235558
Mills MS, Schils T, Olds AD, Leon JX. Structural Complexity of Coral Reefs in Guam, Mariana Islands. Remote Sensing. 2023; 15(23):5558. https://doi.org/10.3390/rs15235558
Chicago/Turabian StyleMills, Matthew S., Tom Schils, Andrew D. Olds, and Javier X. Leon. 2023. "Structural Complexity of Coral Reefs in Guam, Mariana Islands" Remote Sensing 15, no. 23: 5558. https://doi.org/10.3390/rs15235558
APA StyleMills, M. S., Schils, T., Olds, A. D., & Leon, J. X. (2023). Structural Complexity of Coral Reefs in Guam, Mariana Islands. Remote Sensing, 15(23), 5558. https://doi.org/10.3390/rs15235558