Article

Research on the Extraction Method Comparison and Spatial-Temporal Pattern Evolution for the Built-Up Area of Hefei Based on Multi-Source Data Fusion

1
College of Civil Engineering, Hefei University of Technology, Hefei 230009, China
2
Key Laboratory of Geospatial Technology for the Middle and Lower Yellow River Regions, Henan University, Ministry of Education, Kaifeng 475004, China
*
Author to whom correspondence should be addressed.
These authors contributed equally to this work.
Remote Sens. 2023, 15(23), 5617; https://doi.org/10.3390/rs15235617
Submission received: 10 October 2023 / Revised: 26 November 2023 / Accepted: 29 November 2023 / Published: 4 December 2023
(This article belongs to the Special Issue Application of Photogrammetry and Remote Sensing in Urban Areas)

Abstract

:
With the development of urban built-up areas, accurately extracting the urban built-up area and spatiotemporal pattern evolution trends could be valuable for understanding urban sprawl and human activities. Considering the coarse spatial resolution of nighttime light (NTL) data and the inaccurate regional boundary reflection on point of interest (POI) data, land surface temperature (LST) data were introduced. A composite index method (LJ–POI–LST) was proposed based on the positive relationship for extracting the boundary and reflecting the spatial-temporal evolution of urban built-up areas involving the NTL, POIs, and LST data from 1993 to 2018 in this paper. This paper yielded the following results: (1) There was a spatial-temporal pattern evolution from north-east to south-west with a primary quadrant orientation of IV, V, and VI in the Hefei urban area from 1993–2018. The medium-speed expansion rate, with an average value of 14.3 km2/a, was much faster than the population growth rate. The elasticity expansion coefficient of urbanization of 1.93 indicated the incongruous growth rate between the urban area and population, leading to an incoordinate and unreasonable development trend in Hefei City. (2) The detailed extraction accuracy for urban and rural junctions, urban forest parks, and other error-prone areas was improved, and the landscape connectivity and fragmentation were optimized according to the LJ–POI–LST composite index based on a high-resolution remote sensing validation image in the internal spatial structure. (3) Compared to the conventional NTL data and the LJ–POI index, the LJ–POI–LST composite index method displayed an extraction accuracy greater than 85%, with a similar statistical and landscape pattern index result. This paper provides a suitable method for the positive relationship among these LST, NTL, and POI data for accurately extracting the boundary and reflecting the spatial-temporal evolution of urban built-up areas by the fusion data.

1. Introduction

The urban boom and rapid population growth have brought a range of advantages and disadvantages. Rapid urbanization has raised living standards, including the need for more infrastructure and investment. Dramatic population growth creates more opportunities for the labor market and business and stimulates domestic demand.
However, unplanned urban expansion has also created various problems, including environmental pollution, traffic congestion, and pressure on water resources [1]. In addition, the continued spread of cities has led to a decline in land-use efficiency, resulting in further expansion and encroachment of built-up areas on surrounding agricultural land [2]. It is not easy to reverse this process once agricultural land becomes urbanized. This can lead to a shortage of urban resources due to overpopulation, reflected in the increasing proportion of people living in slums. The Sustainable Development Goals (SDGs) 11.3.1, which are defined as the ratio of the land consumption rate (LCR) to the population growth rate (PGR), include two aspects of urban expansion and demographic change [3]. Monitoring the growth rate and expansion area is therefore critical where urban space is being developed [4], and planning for future urban development should also be a consideration as the population grows.
Currently, remote sensing visual interpretation is commonly used to estimate urban built-up area expansion, but this method needs to have relevant standards and is prone to misclassification. NTL data have been widely used to analyze human activities, urban expansion monitoring, social and economic factors, and the ecological environment without considering subjective deviation [5,6]. Zhao et al. [7] analyzed the spatial differentiation and morphological characteristics of urban core areas in China at a geomorphological regional scale using DMSP/OLS nighttime imagery data. Small and Elvidge [8] studied the spatiotemporal pattern changes at the global scale, especially in Asia, from 1994 to 2009, through DMSP/OLS data. Gao et al. [9] calculated China’s comprehensive urbanization level and dynamic urbanization trend at different national, provincial, and county scales from 1992 to 2012, based on the DMSP/OLS dataset and the composite luminous index (CNLI) for the urban expansion monitoring [10]. In 2018, Luojia 1-01 was successfully launched at a higher spatial resolution of approximately 130 m and a more comprehensive radiation range, thus enhancing data collection in areas with faint NTL [11]. The urban spatial morphological characteristics and development direction in recent years were determined, and the level of urban expansion in certain areas was accurately constrained according to a long time-series analysis based on NTL [12]. However, NTL’s relatively fixed digital number (DN) value range could lead to a lower estimated light intensity value of a city center, resulting in pixel saturation in images and a more extensive detected built-up area range [13]. Moreover, the results for urban built-up areas extracted based on NTL are limited due to the need for attribute and location information.
POI (point of interest) data expresses the entity abstractions’ attribute information and location information in a virtual geographic space. The impact of low resolution, light saturation, and the transient light noise of NTL can be effectively compensated and eliminated when combined with POI data [14,15]. However, the selection of bandwidth and the accuracy of boundary information extraction are contradictory when estimating the kernel density of POI data, thereby leading to scattered and polyporous distributions. The NTL and POI data can be quickly combined to extract urban built-up areas, effectively improve extraction accuracy, and facilitate spatial structure analysis [16]. Zhang et al. [17] used U-Net to extract and monitor urban built-up areas based on NTL and POI-NTL data. In addition, Dong et al. [18] extracted the boundaries of built-up areas based on the POI core density and impervious surface index, and Wang et al. [19] combined road network and building information with NTL, which was conducive to improving the extraction accuracy for urban built-up areas.
With the continuously improving urban economic development, the expansion of built-up areas can result in urban-regional climate phenomena. The LST can become significantly higher than the surrounding rural areas, resulting in an urban heat island (UHI) effect [20,21,22]. Therefore, the changes in urban built-up areas can lead to spatial pattern evolution in the urban thermal environment. Consequently, urban high-temperature areas can be effectively extracted and divided from the surroundings based on the changes in LST, thereby reflecting the evolution of urban built-up areas. Compared with the extraction of luminous remote sensing data and POI data in urban built-up areas, a relatively mature time series of surface thermal data can be obtained to study the urban expansion process and the intensity of the UHI effect [23,24]. Recently, studies have focused on megacities [25] and eastern coastal areas in mainland China [26], and the expansion patterns of inland cities have received less attention. Driven by various human activities and economic factors, urbanization became a trend in provincial capitals [27].
According to the above research, spatial changes in urban built-up areas are accompanied by spatial structure changes in multi-source remote sensing data, such as variations in the urban thermal environment, population density, POIs, and NTL intensity [28]. The higher LST value of the grid indicates a larger area of impermeable layers with a larger heat capacity, such as buildings and urban infrastructure, accompanied by more obvious modern economic characteristics [29]. The spatial distribution of LST is of great significance for investigating sustainable urban development and structure. It could result in a positive relationship among LST, NTL, and POI data for extracting the boundary and reflecting the spatial-temporal evolution of urban built-up areas from different aspects. This provides the foundation for the fusion of these data for further study on the expansion and spatial distribution of the built-up area. Therefore, extracting built-up areas and analyzing the spatiotemporal evolution is feasible based on combined social factors, thermal environmental conditions, and online geographical point data.
The rapid development of Hefei in recent years has led to a significant expansion of the city’s built-up area, and the increase in the built-up area will lead to a reduction in agricultural land and a shortage of essential services in the future. Additionally, there are few studies on the extraction results and spatiotemporal expansion based on the combined NTL, POI, and LST data. Therefore, Hefei was selected as the area for investigating sustainable urban development and urban-rural planning. This paper proposes a composite index method based on NTL from Luojia 1-01, POI, and LST data (LJ–POI–LST) for extracting the built-up ranges with a threshold method. Then, the extracted ranges are compared with the reference high-resolution images to improve the extraction accuracy further. These results could provide a reference for the development of urban areas.

2. Study Area and Data Preprocessing

2.1. Study Area

Hefei (30°57′–32°32′N, 116°41′–117°58′E) is located in East China, within a subtropical humid monsoon climate zone in a relatively flat terrain area with an average altitude of 20~40 m. Hefei has jurisdiction over four districts (Baohe District, Shushan District, Luyang District, and Yaohai District) and four counties, with one county in command. This city covers a total area of 11,445.1 km2, with a permanent population of approximately 9.37 million. The GDP of Hefei grew from less than 200 billion in 2008 to over one trillion in 2020, reflecting the rapid economic growth. The urbanization process has intensified, reaching a rate of 76.33%, and the urban thermal environment problems are substantial. This paper analyzes the four main urban areas that have developed rapidly in recent years. The geographical location of Hefei City is shown in Figure 1.

2.2. Data Sources

The data sources used in this paper include NTL, POI network big data, LST, the built-up area boundary, and China’s urban statistical yearbook data. The data selection can be divided into two parts, one with spatiotemporally migrated 1993–2018 data for the long-term evolution analysis, and the second part with the data from July to November 2018 fused from multiple sources for the extraction of the built-up area with a more considerable LST difference and motivated human activities. The primary data and preprocessing steps are as follows.
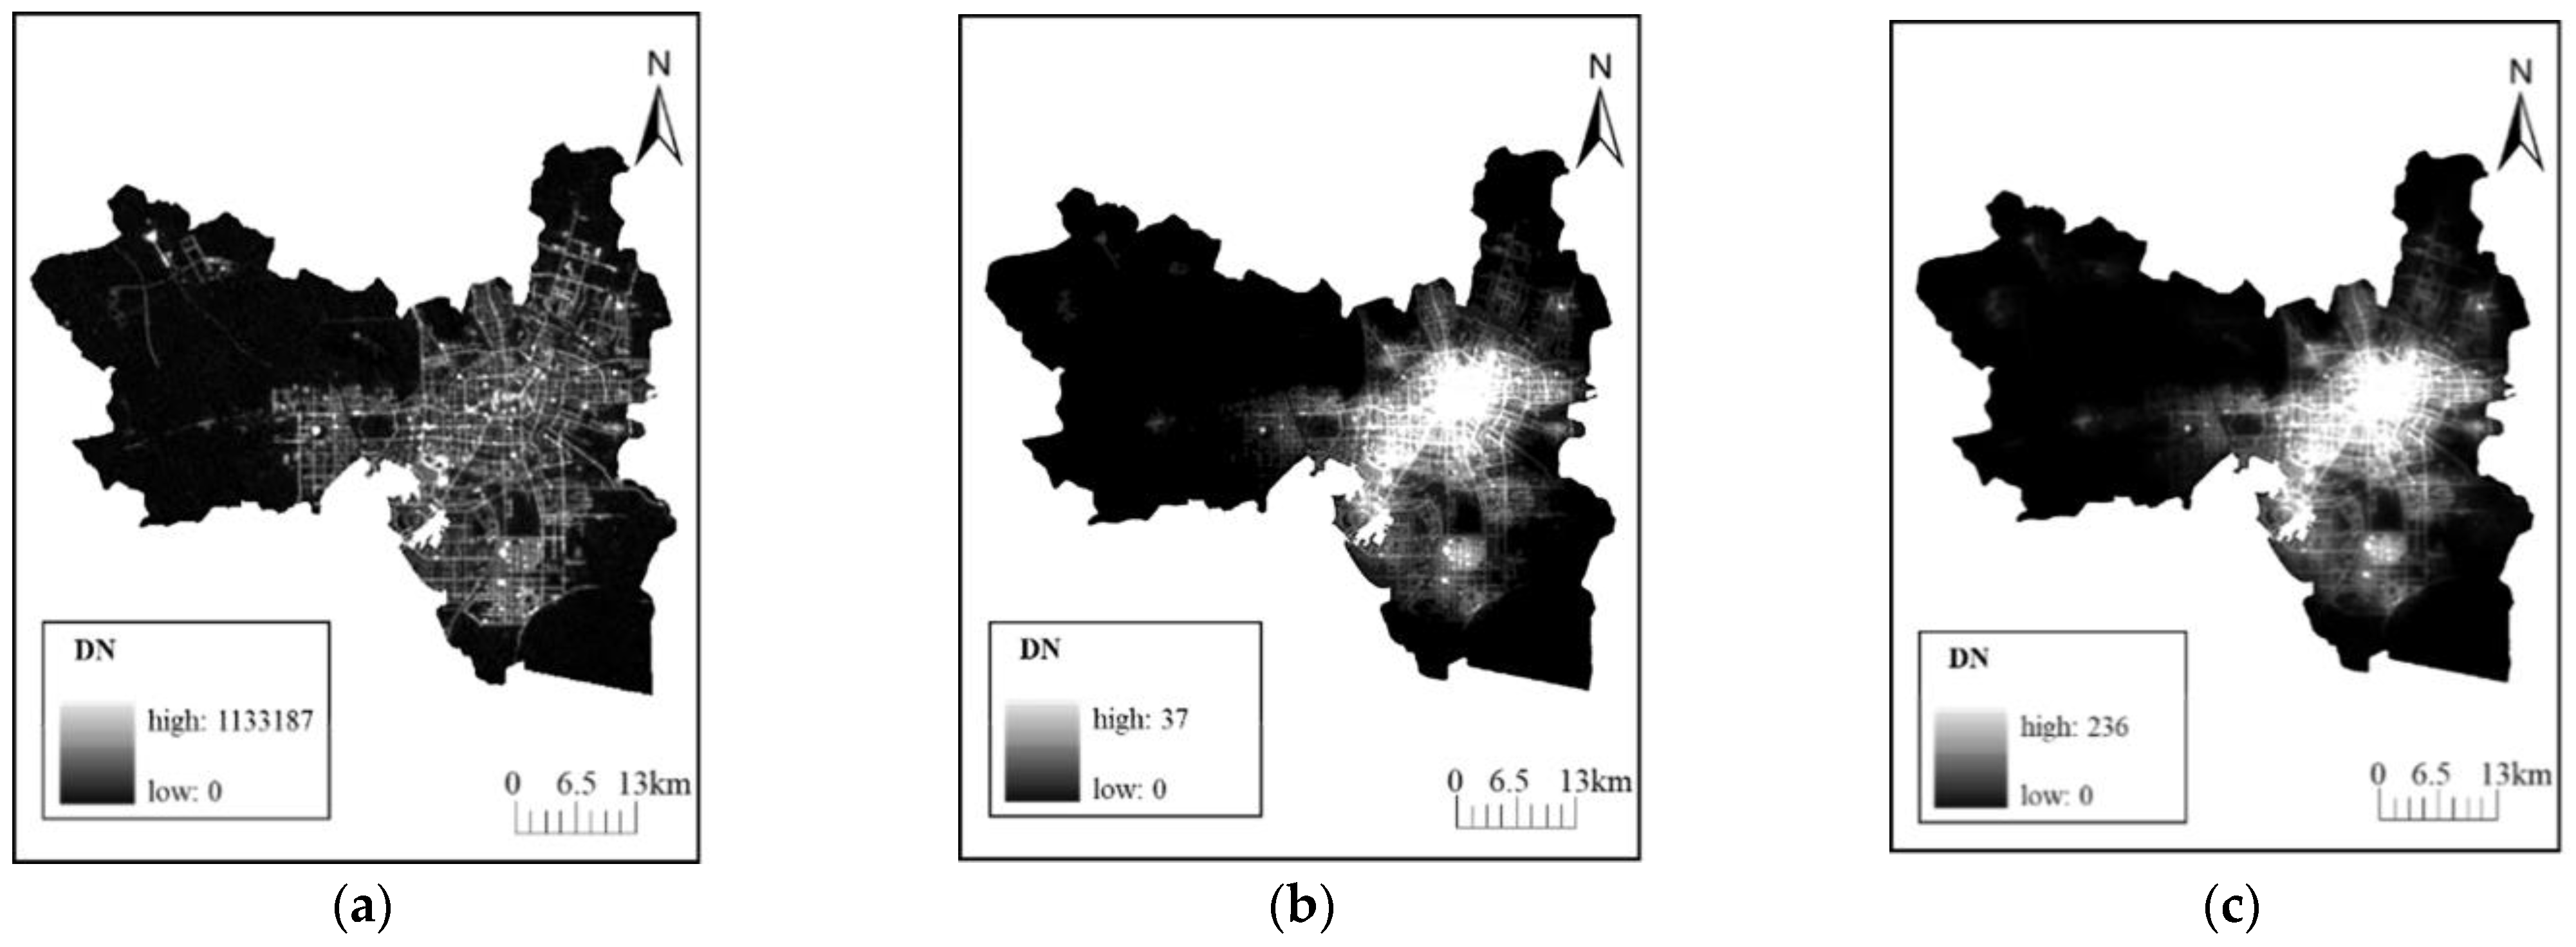
  • NTL imagery. The DMSP/OLS NTL data were downloaded from the National Oceanic and Atmospheric Administration (NOAA) (https://ngdc.noaa.gov, accessed on 13 May 2023) as version 4 of the 1992–2013 global non-radiometrically calibrated averaged light intensity DMSP/OLS nighttime light time series data, in which the image reprojection is Lambertian equal-area projection. The grid is resampled to 1 km × 1 km. The lighting data for the main urban area of Hefei City is obtained by vector cropping. Luojia1-01 data were downloaded from the Hubei Data Application Network, and the spatial resolution was 130 m; this resolution is higher than that of NTL from sources such as DMSP/OLS. Three Loujia1-01 images (dates: 7.15, 7.31, and 9.26, 2018) were selected and averaged for analysis.
  • POI network big data were sourced from the interface provided by the official website of Gaode Map. After data processing, 334,370 POI data points were identified in the main urban area of Hefei based on data from 2018, mainly consisting of 13 categories of data, such as commercial buildings, restaurants, entertainment venues, and residences.
  • The LST was obtained from the Geospatial Data Cloud and is the Landsat 8 OLI/TIRS data for Hefei City in 2018. The spatial resolution of the OLI band is 30 m, and that of the TIRS band is 100 m. After preprocessing radiometric calibration and atmospheric correction, LST was retrieved using a radiant transfer algorithm. Three images (dates: 7.15, 7.31, and 9.17, 2018) were selected and averaged for analysis.
  • The boundary data for the built-up area were from the Hefei City Land Use Data in 2018, provided by the Resource and Environmental Science and Data Center of the China Academy of Sciences. Landsat image data were used as the primary information source and obtained through manual visual interpretation and field investigation.
  • The statistical data for built-up areas in 2018 were obtained from the urban statistical yearbook data of the National Bureau of Statistics, and the boundary data of built-up areas were used as reference data for the image inversion results and as the basis for accuracy evaluation. To avoid the error caused by differences in the image reference system, all data used were projected into the Lambert equal-area projection, and the resolution was unified to 50 m.

2.3. Data Preprocessing

The three kinds of data were preprocessed to improve the accuracy of the results. This paper selects 33 periods of stable light images in the DMSP/OLS dataset for correction. Firstly, Jixi City of Heilongjiang Province is selected as the invariant reference area, F162006 data is selected as the reference dataset, and a quadratic regression equation model is established to perform mutual correction and saturation correction on the data, then intra-annual fusion and inter-annual correction. The image reprojection is Lambert’s equal-area projection with a grid resampling of 1 km × 1 km [10].
The 2018 Luojia1-01 data, which is directly downloaded from the official website, has no similar problem of saturation or data continuity. Since this dataset is the data after the ground system has magnified the brightness data by a factor of 10, it can be converted according to the formula for the radiant brightness of the product provided by the official website, as shown in Formula (1). It can be used for the subsequent study.
L = D N 3 / 2 × 10 10
where L is the radiant luminance value in W/(m2·sr·m) after absolute radiant correction, and DN is the image gray value.
Existing research results were combined with the processed data to build a composite index.
First, when extracting urban built-up areas, scholars have combined Luojia1-01 NTL and POI data to obtain the LJ–POI composite index with an averaging method and analyzed the influence of the two kinds of data on the extraction of built-up areas [30]. Based on this approach, the composite index of LJ–POI–LST is proposed by combining Luojia 1-01 NTL, POI data, and LST data based on the construction method detailed in Section 3.4.
Then, the built-up area of Hefei is extracted with the threshold method based on the Luojia1-01, LJ–POI, and LJ–POI–LST indexes. Then, statistical indicators and landscape indicators are used. The flow chart of the extraction method used in this paper is shown in Figure 2.
The overall flowchart of the data processing procedure in this paper is shown in Figure 3.

3. Methods

3.1. Selection of Urban Expansion Indices

Urban expansion can inevitably lead to an increase in the area of urban built-up areas, and changes in the urban expansion rate affect the built-up area expansion rate. In this paper, the urban expansion and expansion speed indices are used to characterize the evolution of urban expansion over time. The coordinates of the gravity center of built-up areas, the transfer distance of the center coordinates, the compactness, and the fractal dimension are determined to characterize the spatial form of an urban area, and the relevant information and parameters are shown in Table 1.

3.2. Standard Deviation Ellipse (SDE) Analysis

SDE analysis is based on the spatial distribution characteristics of discrete points to determine the directionality of the spatial distribution, spatial morphology, and other characteristics of a research object from a global perspective. Then, the temporal evolution of the spatial pattern of the research object can be assessed, facilitating spatiotemporal and quantitative analyses of the point data’s overall direction and development trend [31]. Moore and McGuire [32] used the SDE method to record the changes in the spatial diffusion of seasonal tornado activities in the United States, and the results indicated that the SDE approach could quantitatively reflect the development of spatial structure better than other methods. Therefore, the SDE method is adopted in this study to analyze the built-up area of Hefei City extracted from NTL over time to reflect the overall development direction of the city. The expressions of the ellipse center coordinates (SDE(x, y)) and rotation angle (θ) are shown in Formulas (2) and (3):
S D E ( x , y ) = i = 1 n ( x i X ) 2 n , i = 1 n ( y i Y ) 2 n
tan θ = i = 1 n x i ¯ 2 i = 1 n y i ¯ 2 + i = 1 n x i ¯ 2 i = 1 n y i ¯ 2 2 + 4 i = 1 n x i ¯ y i ¯ 2 2 i = 1 n x i ¯ y i ¯
where (xi, yi) are the coordinates of the NTL points in the built-up area of Hefei city; (X, Y) is the mean center of the points; n is the total number of points; and xi and yi are the differences between the mean center of the points and the coordinates. In this study, the SDE direction represents the distribution trend. The ellipse coverage area indicates the clustering range, and the ellipse rotation angle indicates the clustering direction. In this paper, the ellipse rotation angle is defined as the angle that coincides with the ellipse’s long axis in clockwise rotation with the north-south axis in the WGS-84 coordinate system, reflecting the evolution characteristics.

3.3. Nuclear Density Analysis Method

Nuclear density analysis [33] reflects the spatial distribution based on the weighted average density of the observed data points in a particular bandwidth region. The weight decreases as the distance from the center point increases until the weight is 0, as shown in Formula (4):
P i = 1 n π R 2 × j = 1 n K j 1 D i j 2 R 2 2
where Pi represents the nuclear density value at point i in the bandwidth region; n represents the number of all POI points j in the bandwidth area; R represents the bandwidth setting value; K represents the weight of POI point j; and Dij represents the distance between point i and POI point j (Dij < R).
The Formula (4) shows that reasonable bandwidth selection is necessary for nuclear density analysis in different situations. Hinneburg and Keim [34] investigated the relationship between bandwidth and the number of density attractors. They found that a certain number of bandwidth intervals make the density attractors stable and reasonable. Wang and Shen [35] compared the extraction results based on kernel density analysis with the urban structure of Nanjing using two NTL images for each of four search radii (i.e., 500 m, 1000 m, 1500 m, and 2000 m). Kuo et al. [36] used 50 m as the bandwidth in POI nuclear density analysis to develop an effective POI/ROI discovery method from Flickr. This paper uses kernel density analysis to establish a distribution density map of POIs and extract the urban built-up area in Hefei. The results are shown in Section 4.3.

3.4. LJ–POI–LST Composite Index

A higher LST value of the grid indicates a larger area of impermeable layers with larger heat capacity, such as buildings and urban infrastructure, accompanied by more obvious modern economic characteristics. According to the references, there is a positive relationship among these three datasets (LST, NTL, and POI) for reflecting the spatial features of the urban built-up areas from different aspects. The geometric averaged method was selected to construct the LJ–POI–LST index to eliminate the effects of unstable NTL, lighting noise, and complicated POI data types, the extreme values, and the magnitude difference among these three types of datasets, and to improve the extraction accuracy of urban built-up areas [29,37,38,39]. In this paper, the weights of three datasets, which reflect the levels of social activity in urban built-up areas, were set to equal values [37]. Therefore, an averaging method was used to construct the LJ–POI–LST composite index. The corresponding expression is shown in Formula (5):
L J i & P O I i & L S T i = L J i × P O I i × L S T i
In the formula, LJi, POIi, and LSTi represent the values of Luojia 1-01 NTL brightness, POI kernel density, and LST at grid i, respectively.

3.5. Built-Up Area Extraction Accuracy Evaluation Index

In extracting the built-up area, Sextract and Preference are set as the extracted and reference built-up areas, respectively. Soverlap is set as the extracted and the reference built-up area’s overlapping area. Statistical Precision and Recall reflect the accuracy and proportion of Soverlap in the reference built-up area, as shown in Formulas (6) and (7):
P r e c i s i o n = S o v e r l a p S e x t r a c t × 100 %
R e c a l l = S o v e r l a p S r e f e r e n c e × 100 %
Because of the relatively large spatial fragmentation of the built-up area obtained by POI [40], it is challenging to extract local details. Therefore, the indicators in the landscape pattern index are further used to reflect the built-up area’s structural composition, spatial configuration, and distribution characteristics. The related indicators and their descriptions are shown in Table 2.

4. Results

4.1. Temporal Evolution Analysis of Urban Expansion

4.1.1. Expansion Indices

The expansion area, expansion rate, and other indices of the six phases of the built-up area of Hefei City are shown in Table 3. In the past three decades, the built-up area of Hefei has expanded significantly from 75 km2 in 1993 to 427 km2 in 2018, an increase of approximately 5.7 times, with an average expansion rate of 14.3 km2/a, considered medium-speed expansion. The overall expansion pattern of the built-up area of Hefei can be roughly divided into two stages. From 1993–2012, the expansion area and expansion rate changes showed a growth trend, and from 2007–2012, the expansion area and expansion rate increased to their largest values, 146 km2 and 29.20 km2/a, respectively, indicating high-speed expansion.
The expansion area and expansion rate began increasing, and from 1997 to 2002, the expansion area and expansion rate were the smallest at 30 km2 and 6 km2/a, respectively, which indicated low-speed expansion; from 2012 to 2018, the expansion area and expansion rate decreased, and the expansion area and expansion rate reached 51 km2 and 8.50 km2/a, respectively, which indicated low-speed expansion. The expansion rate of the built-up area in Hefei City has eased in the last decade.
Compactness (C) represents the degree of compactness and fullness of land space in the built-up area of a city; the more significant the value is, the more compact the spatial form of the city and the more reasonable the layout [41]. As shown in Table 3 and Figure 4, the compactness index of the built-up area of Hefei City from 1993 to 2012 was maintained at approximately 0.6, and the urban area was relatively compact, but the overall compactness continued to decrease. In 2018, it dropped to 0.15, and the urban layout was relatively unreasonable. Thus, the overall pattern needs improvement.
The fractal dimension (D) is a metric that measures the irregularity of complex shapes and reflects the efficiency of the space occupation. It can be employed to depict urban agglomerations’ spatial and morphological features [42,43]. The more considerable value leads to more shape complexity [44]. The fractal dimension was approximately 1.15 from 1993–2012, with a relatively simple city boundary. However, the value increased to 1.58 in 2018, leading to an increasingly complex city boundary.

4.1.2. Urban Sprawl Elasticity Coefficient

The analysis of the different index values of urban expansion in the built-up area of Hefei City from 1993–2018 indicated that the study area has evolved rapidly over time, the built-up area has grown exponentially, and the expansion rate has displayed rapid growth. However, rapid expansion may trigger an unreasonable urban spatial layout. Therefore, the urban sprawl elasticity coefficient is introduced in this paper to study the rationality of the urban spatial layout. The urban sprawl elasticity coefficient reflects the rationality between the growth rate of the urban built-up area and that of the urban population. The China Institute of Urban Planning and Design uses 1.12 as a reasonable value for the elasticity coefficient. The elasticity coefficient of the built-up area of Hefei is shown in Table 4.
The elasticity coefficient of urban expansion was 1.93 from 1993 to 2018, 1.72 times the reasonable value. The built-up area increased from 75 km2 to 427 km2, a 5.7-fold increase. However, the total population increased from 1.08 million to 2.7 million, a 2.5-fold increase. The growth rate of the urban population lagged far behind the growth rate of the urban area in this period.
  • Overall, from the most reasonable value of 1.25 (1.12 times the reasonable value) from 1997–2002 to 5.32 (4.75 times the reasonable value) from 2007–2012. The values of urban expansion elasticity coefficients during 1993–2012 displayed notable volatility, and all values were more significant than the reasonable value, indicating that the urban area expansion rate in Hefei was much greater than the population growth rate.
  • From 2012 to 2018, the value of the urban expansion elasticity coefficient was 0.59. The urban area expansion rate was less than the population growth rate; the area expansion rate will not be harmonious with the population growth rate, and the trend of urban expansion will be unreasonable.

4.2. Spatial Evolution Analysis of Urban Expansion

4.2.1. Spatial Pattern Analysis Based on SDEs

In this paper, the directional trend and concentration degree of NTL are analyzed based on the SDE method to study the spatial evolution of NTL in the built-up area of Hefei City over time. The built-up areas extracted from NTL are transformed into point data for SDE analysis, and the light intensity values are involved in the calculation as weights. The results are shown in Figure 5, where different color ellipses represent the SDEs of NTL for built-up areas in 1993, 1997, 2002, 2007, 2012, and 2018. The overall distribution pattern of NTL in the built-up area shows evolutionary trends from east to west and from north to south, namely, a “east (slightly north)-west (slightly south)” pattern.
The results of the SDE parameters are shown in Table 5. The ellipse distribution area expanded from 38 km2 to 376 km2 from 1993 to 2018, with an average annual growth rate of 12%. The shape changed from a small ellipse in pink to a red circle. The growth rate showed a “decreasing-increasing” trend, with a smallest value of 24% from 1997–2002 and a maximum value of 97% from 2012–2018.
The ellipse azimuth angle continues to change, and the ellipses’ expansion and contraction trends are prominent. The horizontal coverage, after continuous vertical stretching, and the north-south coverage of the whole study area indicate that the primary trend of the evolution of the NTL is in the north-south direction rather than the east-west direction. This indicates that the pulling effect of the Shushan District and the Baohe District on NTL trends has been more potent than other districts in recent years. The result, as mentioned above, can be explained as follows. First, the Shushan District has a rapidly developing government affairs district and a high-tech district, and the Baohe District encompasses the gradually expanding Binhu New District. In contrast, the development of the Luyang District and the Yaohai District, being older districts, has contributed less to NTL changes than that of the Shushan District and the Baohe District.

4.2.2. Analysis of the Changes in the Center of Gravity of the Built-Up Area

The migration of the built-up area center can reflect the direction of urban development. The track of the built-up area center of Hefei City from 1993–2018 is plotted in Figure 6, with an overall southwest direction from the Luyang District to the Shushan District. In terms of the periodic analysis, the center shifted 1.53 km to the southeast from 1993–1997 (pink to blue), the most significant distance observed; from 1997–2002, the center shifted 0.46 km to the southwest (blue to green); from 2002–2007, the center continued to shift 1.12 km in the southwest direction (green to yellow); from 2007–2012, the center shifted back to the northeast by a comparatively small distance of 0.53 km; and from 2012–2018, the center of gravity shifted 1.44 km in the southwest direction (yellow to orange). The rapid development of the Shushan District may be the main reason for the center shift.

4.3. Nuclear Density Analysis Results

To determine the optimal bandwidth for POI analysis in Hefei, bandwidths of 500 m, 1000 m, 1500 m, 2000 m, 3500 m, and 6000 m were chosen in this paper. The results are shown in Figure 7a–f, and the specific latitude and longitude coordinates are shown in Figure 1.
Figure 7 shows that a smaller bandwidth can result in a more discrete, high-value region of nuclear density. There are many high-value centers with prominent regional characteristics. With an increasing bandwidth, high-value areas gradually merged, and the area increased. The global density characteristics are highlighted, and the local details are weakened. Because POI data are used to integrate other multisource data to extract urban built-up areas, the optimal bandwidth is set to 2000 m.

4.4. Boundary Extraction Results

There are considerably different spatial resolutions among the POI, LST, and NTL data. The grid division was performed to resample all these three data points into the exact 500 m resolution. The image results extracted by the three methods are compared in Figure 8. Figure 8a shows that the built-up area can be separated from the surrounding areas with clear boundaries from Luojia 1-01 NTL. The detailed information, including the city’s internal structure (such as road information, e.g., viaducts), is reflected in the apparent fragmentation phenomenon. After fusing POI and LST information in turn, as shown in Figure 8b,c, the brightness value in the urban center area is high, the brightness value in the peripheral area is low, the road details are enhanced, and other types of interference with the built-up area are reduced.
The threshold method is also used to determine the critical value for built-up area extraction. A series of light thresholds are set in advance to extract the urban built-up area, and the extracted area is compared with the built-up area based on ground truth data. The threshold corresponding to the slightest error in the comparison is selected as the optimal threshold, thus improving the light overflow effect [45,46,47]. Therefore, the threshold method is used to extract the built-up area from the image of the built-up area in Figure 8 and compare it to the reference built-up area. The extraction result of the built-up area after removing the independent patches that are too far away from the built-up area is shown in Figure 9, in which the area of built-up regions extracted based on the Luojia 1-01 image, LJ–POI, and LJ–POI–LST index are 430.44 km2, 482.63 km2, and 437.92 km2, respectively. The reference built-up area is 446 km2.
As shown in Figure 9, the urban built-up area obtained from the Luojia 1-01 image contains roads, streets, and other non-built-up areas with apparent internal patch fragmentation. However, issues associated with the excessive internal gaps in the built-up area and the incorrectly classified portions of the built-up area can be solved by the composite indexes of LJ–POI and LJ–POI–LST. The statistical and landscape pattern indicators are performed to quantitatively reveal the fragmentation degree of the extraction results of the built-up area further.

4.5. Comparative Analysis of Statistical Indicators and Landscape Pattern Indicators

According to the statistical classification indicators (as shown in Table 6), the Precision indicators of urban built-up areas extracted with the three methods are all above 80%, among which the Luojia 1-01 extraction results correspond to the lowest precision and recall. The recall of the LJ–POI index method is higher than that of the LJ–POI–LST index method, but the precision trend is the opposite.
Then, the landscape pattern index results of the three methods were calculated. As shown in Table 7, the results based on the composite index LJ–POI and LJ–POI–LST have the following characteristics when compared with the extraction results based on the Luojia 1-01 image:
  • The number of patches decreased significantly, and the edge density decreased from 2.52 to 1.38 and 1.19, respectively, indicating that the built-up area’s separation and fragmentation decreased and the built-up area’s landscape connectivity improved.
  • Landscape fragmentation decreased from 57.54 to 0.07 and 0.43, and the landscape shape index decreased from 13.09 to 7.21 and 6.56, indicating that the multiple-index method can significantly reduce the number of patches and fragmentation. The patch shape in the built-up area also became more regular with the multi-index approach.
Based on Table 7, Figure 9, and a comparison of the extraction results, the following conclusions can be established:
  • The built-up areas extracted by the two composite index methods are relatively consistent, but it is challenging to identify the details on the image. The statistical classification index results in Table 6 are relatively similar, and the recall and precision are more variable. The spatial form of the built-up area of Hefei obtained with the proposed approach is more precise than that based on the direct inversion results.
  • The number of patches, fragmentation degree, edge density, and landscape shape index of the built-up area extracted by LJ–POI–LST all increased compared to the other methods. However, they remain different in the details of the built-up area. There are scattered patches at the junction of the Baohe District and the Shushan District, and the connectivity between the central and western regions of the Shushan District varies in magnitude in Figure 9.
  • Although the LJ–POI–LST composite index method reduces connectivity issues, simplification phenomena such as excessive division of the built-up area boundary and excessive merging of the number of patches are eliminated.

4.6. Comparison of the LJ–POI and LJ–POI–LST Composite Index Methods

Because both statistical and landscape pattern indicators reflect the extraction results from an overall perspective, the analysis of the local details of the extraction results is relatively insufficient. This paper compares the regions with apparent differences in the built-up areas extracted by the two composite indexes with the same regions in high-resolution images to assess the differences between statistical parameters and landscape pattern indicators. The results extracted by the two methods are similar in the central area of the city in the black rectangular areas A, B, and C on the left side of Figure 10. The differences are mainly manifested in the marginal areas, among two main types of differences:
  • The forest ecological areas at the urban boundary, such as Area A in the reference built-up area, include a large portion of Shushan Forest Park, which is not part of the urban built-up area. The built-up area (blue) extracted from the LJ–POI–LST data is much smaller than that extracted from the LJ–POI data (yellow). Similarly, the area corresponding to an eco-agricultural tourism spot in Dawei extracted based on the LJ–POI was wrongly designated as an urban built-up area in Area B. However, this area was not included in the result extracted from the LJ–POI–LST data.
  • The urban-rural fringe areas contain industrial areas and other construction land areas with high populations and abundant socioeconomic activities—however, the surrounding areas have farmland and towns that are not strictly part of the built-up area. For example, the built-up area extracted based on the LJ–POI–LST is better than that on the LJ–POI in Area C.

5. Discussion

5.1. Comparison with Existing Methods

The expansion of the built-up area of Hefei City from 1993 to 2018 was evaluated by extracting features from DMSP/OLS and Luojia 1-01 NTL. The built-up area expansion trend was analyzed using different methods, and the results are as follows:
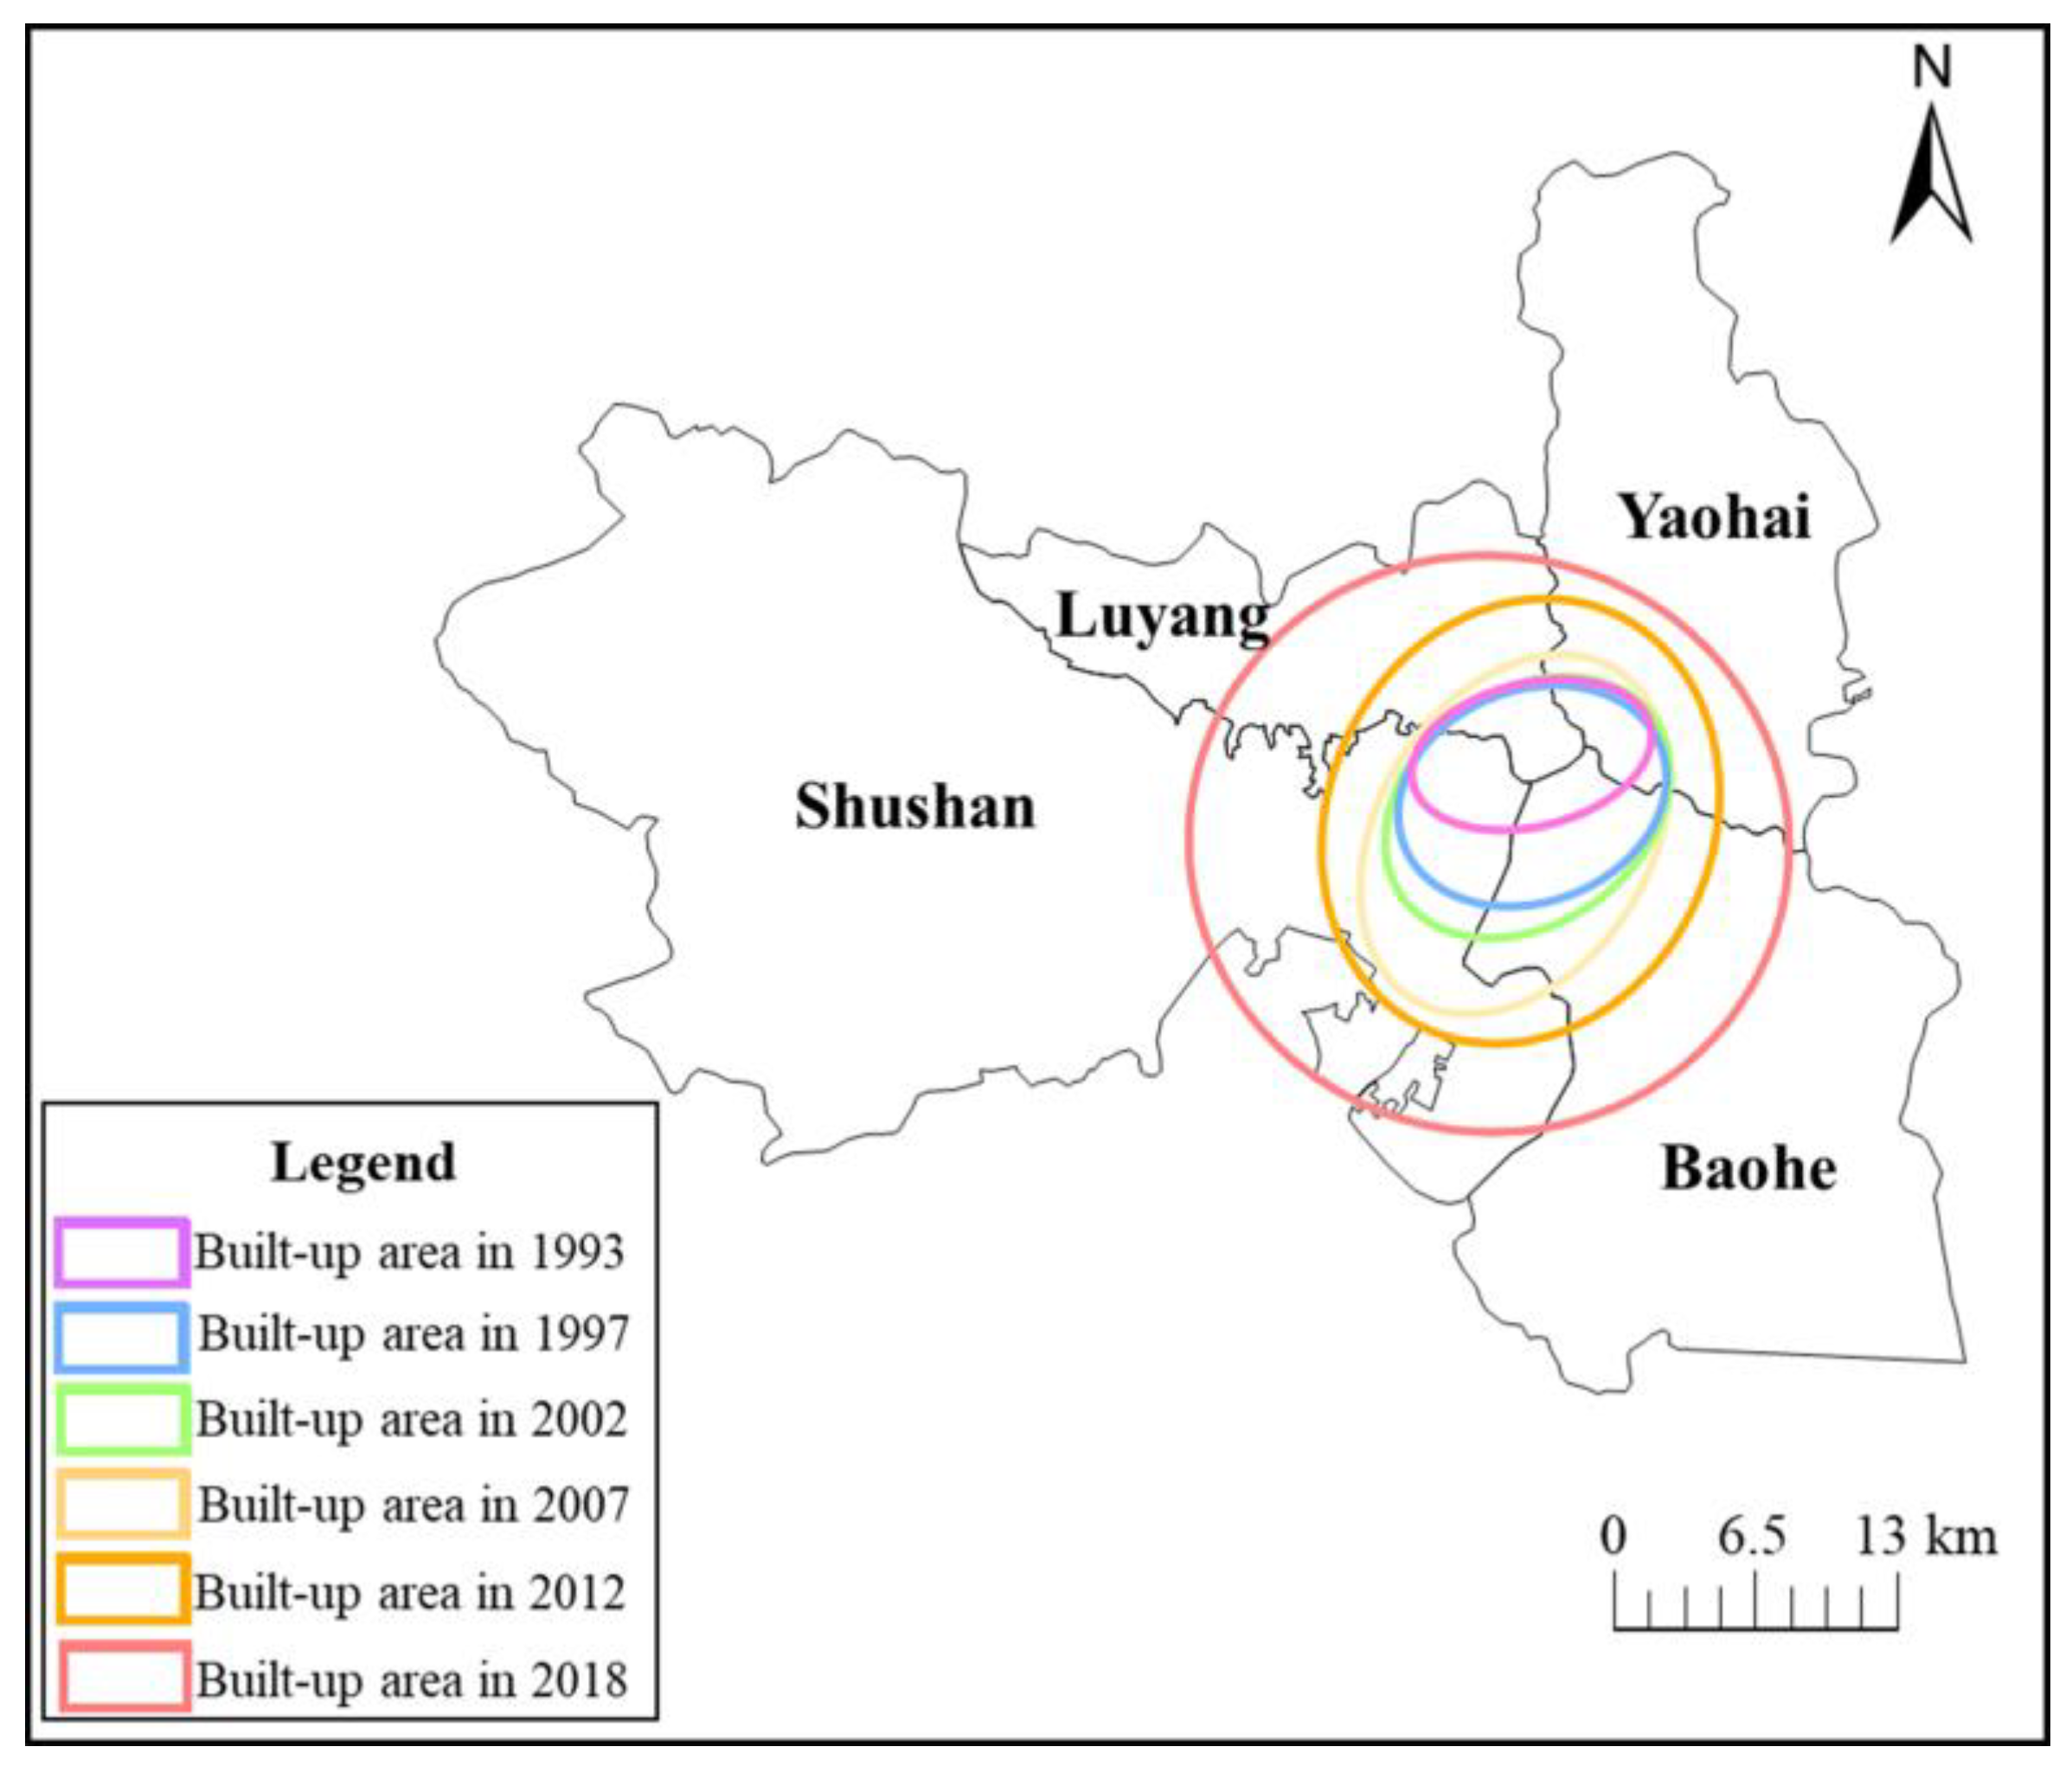
  • The built-up area of Hefei has mainly expanded from the urban center to the periphery, increasing from 75 km2 in 1993 to 427 km2 in 2018 with an approximately 5.7-fold and an average expansion rate of 14.3 km2/a. The medium-speed expansion rate of the urban area in Hefei is much faster than the population growth rate. The incongruous growth rates of the urban area and population lead to an unreasonable urban expansion trend. The built-up area expanded with a total growth rate of 264.58%, leading to a 16.61% decrease in vegetation coverage from 2000 to 2020 [2]. The land surface temperature shows an increment trend in the new town yet a decrement trend in the old town due to the change in vegetation coverage and the degradation of administration centers [48,49].
  • From a spatial perspective, the overall distribution of the built-up area expansion in Hefei City displays an evolutionary “east (slightly north)-west (slightly south)” pattern. The main direction of evolution was north-south rather than east-west. Additionally, the quadrant orientation analysis showed that the main expansion quadrants are IV, V, and V. Therefore, as the two central rapidly developing districts, the eastern part of the Shushan District and the southwestern part of the Baohe District have had the most potent effect on the built-up area expansion in recent years.
In the LJ–POI method, the urban built-up areas are extracted according to NTL images’s brightness value and POI density value without considering the actual surface coverage. It is easy to mistakenly divide urban green parks and eco-agricultural tourism areas into built-up areas. However, with the introduction of LST in the LJ–POI–LST index, LST differences of different underlying surface coverages are considered. The incorrect division of such non-built-up areas can be avoided to a certain extent. Jiang et al. [50] noted that the traditional “urban-suburban” division approach ignores the differences between the three-dimensional structure and the underlying surface of the suburbs, leading to the existence of local climate zones (LCZs).
The accuracy of the extracted details and complexity of urban built-up areas based on the proposed LJ–POI–LST composite index are better than those based on the LJ–POI composite index in the process of extraction and analysis. This result is more consistent with the actual results regarding landscape structure and statistical area, and the proposed approach provides a methodological basis for the subsequent extraction and analysis of the urban spatial structure.

5.2. Limitations and Future Research

For the multisource data, although the proposed LJ–POI–LST composite index method improves upon previous methods, the difference between the extraction results and the actual results in local areas may be due to the spatial resolution and accuracy limitations and the inconsistency of the method. In future studies, other multisource data, such as urban road networks and infrastructure data, could be introduced. In addition to the DMSP-OLS and Luojia-01 data, the NPP-VIIRS, NOAA-20, SDGSAT-1 (with high spatial resolution in the three visible bands (40 m) and the panchromatic band (10 m), and the JL1-3B (spatial resolution 0.92 m) night-time light data can be introduced for further study from 2018 to 2023 [51,52,53]. The higher spatial resolution can provide more accurate boundary extraction and spatial-temporal evolution trends. Additionally, multiple indicators, such as the urban-rural vegetation index difference (ΔEVI), surface albedo difference (ΔWSA), urban mean precipitation (MAP), wind speed (WS), population density (PD), and urban area (UA) [54], and the built-up area extraction based on Sentinel 1 and Sentinel 2, should be integrated to further improve the extraction accuracy of urban built-up areas [55,56]. Moreover, the mechanism analysis could provide the foundation for the weight difference analysis and the quantitative forecasting model based on the LST, NTL, and POI with the index above.
For the urban elements and internal spatial structure, the multi-source data can be used for population estimating, economic analysis, and the similarity of spatial structure in the internal analysis of core city areas. Additionally, the urban structures of urban layout are influenced by multiple factors, which can be categorized into the following types: block, belt, loop, tandem, cluster, and constellation, leading to different spatial distributions. The simple research area of Hefei did not represent different urban structures, and more cities should be selected to verify the method’s feasibility. It could benefit from validating the generalizability and applicability of the method across different urban contexts in future studies [57].
For the analysis and application of urbanization processes, multi-source data can be used for the rapid identification and intelligent analysis of the long-time spatial and temporal evolution pattern of urban agglomeration and the estimation of socioeconomic indicators. For example, they estimate anthropogenic heat flux distribution in the Beijing-Tianjin-Hebei region and construct a global database of anthropogenic heat emissions with high spatial resolution. In light pollution research, the spatial pattern in China has been modeled using multi-source data, and trends in light pollution changes have been monitored [58].

6. Conclusions

This paper proposed the composite index (LJ–POI–LST) for extracting the boundary and reflecting the spatial-temporal evolution of urban built-up areas involving the NTL, POIs, and LST data from 1993 to 2018. The main conclusions of this paper are as follows:
  • The expansion range of the Hefei built-up area from 1993–2018 presented a spatial evolution trend of north-east to south-west with the main quadrant orientations of IV, V, and VI. The medium-speed expansion rate with an average value of 14.3 km2/a and the elasticity coefficient of urbanization of 1.93 indicated an in-coordinate development trend in Hefei City.
  • Compared with the built-up area extracted from the Luojia 1-01 image, that based on the LJ–POI–LST method was notably improved, with an accuracy increase of approximately 85%. The degrees of landscape connectivity and fragmentation for the built-up area were also improved.
  • The proposed LJ–POI–LST composite index method is more accurate and optimal than the NTL image and LJ–POI composite index methods when extracting error-prone areas such as forest parks and urban-rural fringes in the built-up urban areas at a fine scale.
This study analyzes the spatial-temporal pattern evolution of urban expansion in Hefei City based on the LJ–POI–LST composite indexes. This approach is of great practical significance and reference for the development of urban areas and the rational planning of urban spatial layout.

Author Contributions

Conceptualization, J.H. and Z.W.; methodology, J.H. and C.Z.; software, C.C. and L.W.; validation, M.Y. and Y.Z.; formal analysis, C.C.; investigation, J.G.; resources, Z.W. and J.G.; data curation, Z.W. and M.Y.; writing-original draft preparation, L.W.; writing-review and editing, J.H., C.C. and L.W.; visualization, C.C.; supervision, J.H. and Z.W.; project administration, J.H. and C.C.; funding acquisition, J.H., C.Z., J.G. and Y.Z. All authors have read and agreed to the published version of the manuscript.

Funding

This research was funded by the National Natural Science Foundation of China under grant [42171453]; Open Fund of Key Laboratory of Geospatial Technology for the Middle and Lower Yellow River Regions (Henan University), Ministry of Education under Grant [GTYR202209]; Funding from the China Scholarship Council scholarship (No. 202006695009), Fundamental Research Funds for the Central Universities of China (No. JZ2022HGTB0253, JZ2022HGTB0358), and the State Key Laboratory of Geodesy and Earth’s Dynamics, Innovation Academy for Precision Measurement Science and Technology, Chinese Academy of Sciences (No. SKLGED2022-3-7).

Data Availability Statement

The DMSP/OLS nighttime lighting data that supports the findings of this study are openly available in National Oceanic and Atmospheric Administration (NOAA) at https://ngdc.noaa.gov (accessed on 13 May 2023). Luojia1-01 data that supports the findings of this study are openly available in High-Resolution Earth Observation System Hubei Data and Application Network at http://www.hbeos.org.cn (accessed on 13 May 2023). Landsat 8 OLI/TIRS data that supports the findings of this study are openly available in Geospatial Data Cloud at https://www.gscloud.cn (accessed on 13 May 2023). The boundary data that supports the findings of this study are openly available in Resource and Environment Science and Data Center at https://www.resdc.cn (accessed on 13 May 2023). The statistical data that supports the findings of this study are openly available in National Bureau of Statistics at http://www.stats.gov.cn (accessed on 13 May 2023). The image data are openly available in National Platform for Common Geospatial Information Services at https://www.tianditu.gov.cn/?tdsourcetag=s_pcqq_aiomsg (accessed on 13 May 2023).

Conflicts of Interest

The authors declare no conflict of interest.

References

  1. Wang, L.; Li, C.; Ying, Q.; Cheng, X.; Wang, X.; Li, X.; Hu, L.; Liang, L.; Yu, L.; Huang, H.; et al. China’s Urban Expansion from 1990 to 2010 Determined with Satellite Remote Sensing. Chin. Sci. Bull. 2012, 57, 2802–2812. [Google Scholar] [CrossRef]
  2. Geng, J.; Xu, L.; Wang, Y.; Tu, L. Study of Land Cover Change in the City with the Fastest Economic Growth in China (Hefei) from 2000 to 2020 Based on Google Earth Engine Platform. Remote Sens. 2023, 15, 1604. [Google Scholar] [CrossRef]
  3. Wang, Y.; Huang, C.; Feng, Y.; Zhao, M.; Gu, J. Using Earth Observation for Monitoring SDG 11.3.1-Ratio of Land Consumption Rate to Population Growth Rate in Mainland China. Remote Sens. 2020, 12, 357. [Google Scholar] [CrossRef]
  4. Liu, J.; Liu, M.; Tian, H.; Zhuang, D.; Zhang, Z.; Zhang, W.; Tang, X.; Deng, X. Spatial and Temporal Patterns of China’s Cropland during 1990–2000: An Analysis Based on Landsat TM Data. Remote Sens. Environ. 2005, 98, 442–456. [Google Scholar] [CrossRef]
  5. Kou, P.; Tao, Y.; Yunus, A.P.; Xu, Q.; Liu, R.; Jin, Z.; Liang, W.; Xia, Y.; Yuan, S. Quantifying Night-Time Light Change Drivers in China’s Yangtze River Economic Zone. Int. J. Remote Sens. 2023, 1–22. [Google Scholar] [CrossRef]
  6. Li, X.; Levin, N.; Xie, J.; Li, D. Monitoring Hourly Night-Time Light by an Unmanned Aerial Vehicle and Its Implications to Satellite Remote Sensing. Remote Sens. Environ. 2020, 247, 111942. [Google Scholar] [CrossRef]
  7. Zhao, M.; Cheng, W.; Zhou, C.; Li, M.; Wang, N.; Liu, Q. Spatial Differentiation and Morphologic Characteristics of China’s Urban Core Zones Based on Geomorphologic Partition. J. Appl. Remote Sens. 2017, 11, 016041. [Google Scholar] [CrossRef]
  8. Small, C.; Elvidge, C.D. Night on Earth: Mapping Decadal Changes of Anthropogenic Night Light in Asia. Int. J. Appl. Earth Obs. Geoinf. 2013, 22, 40–52. [Google Scholar] [CrossRef]
  9. Gao, B.; Huang, Q.; He, C.; Ma, Q. Dynamics of Urbanization Levels in China from 1992 to 2012: Perspective from DMSP/OLS Nighttime Light Data. Remote Sens. 2015, 7, 1721–1735. [Google Scholar] [CrossRef]
  10. Li, X.; Elvidge, C.; Zhou, Y.; Cao, C.; Warner, T. Remote Sensing of Night-Time Light. Int. J. Remote Sens. 2017, 38, 5855–5859. [Google Scholar] [CrossRef]
  11. Li, X.; Zhao, L.; Li, D.; Xu, H. Mapping Urban Extent Using Luojia 1-01 Nighttime Light Imagery. Sensors 2018, 18, 3665. [Google Scholar] [CrossRef]
  12. Zhai, W.; Han, B.; Cheng, C. Evaluation of Luojia 1-01 Nighttime Light Imagery for Built-Up Urban Area Extraction: A Case Study of 16 Cities in China. IEEE Geosci. Remote Sens. Lett. 2020, 17, 1802–1806. [Google Scholar] [CrossRef]
  13. Wu, J.; He, S.; Peng, J.; Li, W.; Zhong, X. Intercalibration of DMSP-OLS Night-Time Light Data by the Invariant Region Method. Int. J. Remote Sens. 2013, 34, 7356–7368. [Google Scholar] [CrossRef]
  14. Zhang, J.; Yuan, X.; Tan, X.; Zhang, X. Delineation of the Urban-Rural Boundary through Data Fusion: Applications to Improve Urban and Rural Environments and Promote Intensive and Healthy Urban Development. Int. J. Environ. Res. Public Health 2021, 18, 7180. [Google Scholar] [CrossRef] [PubMed]
  15. Liu, J.; Deng, Y.; Wang, Y.; Huang, H.; Du, Q.; Ren, F. Urban Nighttime Leisure Space Mapping with Nighttime Light Images and POI Data. Remote Sens. 2020, 12, 541. [Google Scholar] [CrossRef]
  16. He, X.; Zhou, C.; Zhang, J.; Yuan, X. Using Wavelet Transforms to Fuse Nighttime Light Data and POI Big Data to Extract Urban Built-Up Areas. Remote Sens. 2020, 12, 3887. [Google Scholar] [CrossRef]
  17. Zhang, J.; Zhang, X.; Tan, X.; Yuan, X. A New Approach to Monitoring Urban Built-Up Areas in Kunming and Yuxi from 2012 to 2021: Promoting Healthy Urban Development and Efficient Governance. Int. J. Environ. Res. Public Health 2022, 19, 12198. [Google Scholar] [CrossRef] [PubMed]
  18. Dong, Q.; Qu, S.; Qin, J.; Yi, D.; Liu, Y.; Zhang, J. A Method to Identify Urban Fringe Area Based on the Industry Density of POI. ISPRS Int. J. Geo-Inf. 2022, 11, 128. [Google Scholar] [CrossRef]
  19. Wang, M.; Song, Y.; Wang, F.; Meng, Z. Boundary Extraction of Urban Built-Up Area Based on Luminance Value Correction of NTL Image. IEEE J. Sel. Top. Appl. Earth Obs. Remote Sens. 2021, 14, 7466–7477. [Google Scholar] [CrossRef]
  20. Zoran, M.A. Analysis of “Urban Heat Island” Effect by Remote Sensing Satellite Data; Ehlers, M., Michel, U., Eds.; SPIE Remote Sensing: Florence, Italy,, 2007; p. 674910. [Google Scholar]
  21. Climate Change and Cities: First Assessment Report of the Urban Climate Change Research Network; Rosenzweig, C.; Solecki, W.D.; Hammer, S.A.; Mehrotra, S. (Eds.) Cambridge University Press: Cambridge, UK, 2011. [Google Scholar]
  22. Fang, G.; Yang, J.; Zheng, L. Temporal and Spatial Analysis of SuZhou Urban Heat Island Effect. Adv. Mater. Res. 2012, 610–613, 3632–3635. [Google Scholar] [CrossRef]
  23. Kim, H.H. Urban Heat Island. Int. J. Remote Sens. 1992, 13, 2319–2336. [Google Scholar] [CrossRef]
  24. Debbage, N.; Shepherd, J.M. The Urban Heat Island Effect and City Contiguity. Comput. Environ. Urban Syst. 2015, 54, 181–194. [Google Scholar] [CrossRef]
  25. Tian, G.; Jiang, J.; Yang, Z.; Zhang, Y. The Urban Growth, Size Distribution and Spatio-Temporal Dynamic Pattern of the Yangtze River Delta Megalopolitan Region, China. Ecol. Model. 2011, 222, 865–878. [Google Scholar] [CrossRef]
  26. Liu, F.; Zhang, Z.; Shi, L.; Zhao, X.; Xu, J.; Yi, L.; Liu, B.; Wen, Q.; Hu, S.; Wang, X.; et al. Urban Expansion in China and Its Spatial-Temporal Differences over the Past Four Decades. J. Geogr. Sci. 2016, 26, 1477–1496. [Google Scholar] [CrossRef]
  27. Aslam, R.W.; Shu, H.; Yaseen, A. Monitoring the Population Change and Urban Growth of Four Major Pakistan Cities through Spatial Analysis of Open Source Data. Ann. GIS 2023, 29, 355–367. [Google Scholar] [CrossRef]
  28. Zhang, J.; Zhang, X.; Tan, X.; Yuan, X. Extraction of Urban Built-Up Area Based on Deep Learning and Multi-Sources Data Fusion—The Application of an Emerging Technology in Urban Planning. Land 2022, 11, 1212. [Google Scholar] [CrossRef]
  29. Jun, Z.; Xiao-Die, Y.; Han, L. The Extraction of Urban Built-Up Areas by Integrating Night-Time Light and POI Data—A Case Study of Kunming, China. IEEE Access 2021, 9, 22417–22429. [Google Scholar] [CrossRef]
  30. He, X.; Zhang, Z.; Yang, Z. Extraction of Urban Built-up Area Based on the Fusion of Night-Time Light Data and Point of Interest Data. R. Soc. Open Sci. 2021, 8, 210838. [Google Scholar] [CrossRef]
  31. Scott, L.M.; Janikas, M.V. Handbook of Applied Spatial Analysis; Springer Nature: Berlin/Heidelberg, Germany, 2010. [Google Scholar]
  32. Moore, T.W.; McGuire, M.P. Using the Standard Deviational Ellipse to Document Changes to the Spatial Dispersion of Seasonal Tornado Activity in the United States. NPJ Clim. Atmos. Sci. 2019, 2, 21. [Google Scholar] [CrossRef]
  33. Silverman, B.W. Density Estimation for Statistics and Data Analysis; Routledge: New York, NY, USA, 2017; ISBN 978-1-315-14091-9. [Google Scholar]
  34. Hinneburg, A.; Keim, D.A. An Efficient Approach to Clustering in Large Multimedia Databases with Noise. In Proceedings of the Knowledge Discovery and Datamining (KDD’98), New York, NY, USA, 27–31 August 1998; pp. 58–65. [Google Scholar]
  35. Wang, Y.; Shen, Z. Comparing Luojia 1-01 and VIIRS Nighttime Light Data in Detecting Urban Spatial Structure Using a Threshold-Based Kernel Density Estimation. Remote Sens. 2021, 13, 1574. [Google Scholar] [CrossRef]
  36. Kuo, C.-L.; Chan, T.-C.; Fan, I.-C.; Zipf, A. Efficient Method for POI/ROI Discovery Using Flickr Geotagged Photos. ISPRS Int. J. Geo-Inf. 2018, 7, 121. [Google Scholar] [CrossRef]
  37. Fei, L.I.; Qingwu, Y.A.N.; Yajing, Z.O.U.; Baoli, L.I.U. Extraction Accuracy of Urban Built-up Area Based on Nighttime Light Data and POI: A Case Study of Luojia 1-01 and NPP/VIIRS Nighttime Light Images. Geomat. Inf. Sci. Wuhan Univ. 2021, 46, 825–835. [Google Scholar] [CrossRef]
  38. Zhang, Y.; Zheng, F.; Liu, Y.; Liu, Y.; Hu, H.; Xu, P. Extracting Urban Built-up Area Based on Impervious Surface Area and POI Data. Sci. Geogr. Sin. 2022, 42, 506–514. [Google Scholar] [CrossRef]
  39. Xu, Z.; Gao, X. A novel method for identifying the boundary of urban built-up areas with POI data. Acta Geogr. Sin. 2016, 71, 928–939. [Google Scholar] [CrossRef]
  40. Yu, J.; Meng, Y.; Zhou, S.; Zeng, H.; Li, M.; Chen, Z.; Nie, Y. Research on Spatial Delineation Method of Urban-Rural Fringe Combining POI and Nighttime Light Data—Taking Wuhan City as an Example. Int. J. Environ. Res. Public Health 2023, 20, 4395. [Google Scholar] [CrossRef] [PubMed]
  41. Zhou, G.; Wu, D.; Zhou, X.; Zhu, Q. Coordination Analysis between the Development of Urban Built-Up Areas and Urban Environmental Factors through Remote Sensing of Nighttime Lights: A Case Study in Nanjing, China. Remote Sens. 2023, 15, 3279. [Google Scholar] [CrossRef]
  42. Zhang, J.; Bai, L.; Yang, M. Spatial and Temporal Evolution of Yinchuan Urban Expansion in the Last 30 Years. Res. Soil Water Conserv. 2019, 26, 359–365. [Google Scholar] [CrossRef]
  43. Sun, M.; Shang, G.; Zhang, X.; Yan, Z.; Gao, Y.; Zhang, C.; Liu, Y. Analysis of the Space-Time Transformation of Urban Structure in Beijing-Tianjin-Hebei Using NPP-VIIRS Night-Time Light Data. Int. J. Remote Sens. 2023, 1–20. [Google Scholar] [CrossRef]
  44. Chen, Y. The Solutions to the Uncertainty Problem of Urban Fractal Dimension Calculation. Entropy 2019, 21, 453. [Google Scholar] [CrossRef]
  45. Li, X.; Song, Y.; Liu, H.; Hou, X. Extraction of Urban Built-Up Areas Using Nighttime Light (NTL) and Multi-Source Data: A Case Study in Dalian City, China. Land 2023, 12, 495. [Google Scholar] [CrossRef]
  46. Henderson, M.; Yeh, E.T.; Gong, P.; Elvidge, C.; Baugh, K. Validation of Urban Boundaries Derived from Global Night-Time Satellite Imagery. Int. J. Remote Sens. 2003, 24, 595–609. [Google Scholar] [CrossRef]
  47. Wei, Y.; Liu, H.; Song, W.; Yu, B.; Xiu, C. Normalization of Time Series DMSP-OLS Nighttime Light Images for Urban Growth Analysis with Pseudo Invariant Features. Landsc. Urban Plan. 2014, 128, 1–13. [Google Scholar] [CrossRef]
  48. Li, Q.; Wu, Q.; Zhou, H.; Zhang, B.; Li, J.; Lin, L. Hefei Built-Up Area Extraction Based on Landsat8 Data and “Luojia No. 1” Luminous Data. J. Anhui Norm. Univ. Nat. Sci. Nat. Sci. 2021, 44, 354–361. [Google Scholar] [CrossRef]
  49. Shi, B.; Tu, L.; Jiang, L.; Zhang, J.; Geng, J. A Quantitative Study of a Directional Heat Island in Hefei, China Based on Multi-Source Data. Sensors 2023, 23, 3041. [Google Scholar] [CrossRef] [PubMed]
  50. Jiang, S.; Zhan, W.; Yang, J.; Liu, Z.; Huang, F.; Lai, J.; Li, J.; Hong, F.; Huang, Y.; Chen, J.; et al. Urban Heat Island Studies Based on Local Climate Zones: A Systematic Overview. Acta Geogr. Sin. 2020, 75, 1860–1878. [Google Scholar] [CrossRef]
  51. Yu, B.; Chen, F.; Ye, C.; Li, Z.; Dong, Y.; Wang, N.; Wang, L. Temporal Expansion of the Nighttime Light Images of SDGSAT-1 Satellite in Illuminating Ground Object Extraction by Joint Observation of NPP-VIIRS and Sentinel-2A Image. Remote Sens. Environ. 2023, 295, 113691. [Google Scholar] [CrossRef]
  52. Guo, B.; Hu, D.; Zheng, Q. Potentiality of SDGSAT-1 Glimmer Imagery to Investigate the Spatial Variability in Nighttime Lights. Int. J. Appl. Earth Obs. Geoinf. 2023, 119, 103313. [Google Scholar] [CrossRef]
  53. Zheng, Q.; Weng, Q.; Huang, L.; Wang, K.; Deng, J.; Jiang, R.; Ye, Z.; Gan, M. A New Source of Multi-Spectral High Spatial Resolution Night-Time Light Imagery-JL1-3B. Remote Sens. Environ. Interdiscip. J. 2018, 215, 300–312. [Google Scholar] [CrossRef]
  54. Si, M.; Li, Z.-L.; Tang, B.-H.; Liu, X.; Nerry, F. Spatial Heterogeneity of Driving Factors-Induced Impacts for Global Long-Term Surface Urban Heat Island. Int. J. Remote Sens. 2023, 1–21. [Google Scholar] [CrossRef]
  55. Pesaresi, M.; Corbane, C.; Julea, A.; Florczyk, A.J.; Syrris, V.; Soille, P. Assessment of the Added-Value of Sentinel-2 for Detecting Built-up Areas. Remote Sens. 2016, 8, 299. [Google Scholar] [CrossRef]
  56. Melchiorri, M.; Kemper, T. Establishing an Operational and Continuous Monitoring of Global Built-Up Surfaces with the Copernicus Global Human Settlement Layer. In Proceedings of the 2023 Joint Urban Remote Sensing Event (JURSE), Heraklion, Greece, 17–19 May 2023; p. 4. [Google Scholar]
  57. Wang, C.; Yu, B.; Chen, Z.; Liu, Y.; Song, W.; Li, X.; Yang, C.; Small, C.; Shu, S.; Wu, J. Evolution of Urban Spatial Clusters in China: A Graph-Based Method Using Nighttime Light Data. Ann. Assoc. Am. Geogr. 2022, 112, 56–77. [Google Scholar] [CrossRef]
  58. Yu, B.; Wang, C.; Gong, W.; Chen, Z.; Shi, K.; Wu, B.; Hong, Y.; Li, Q.; Wu, J. Nighttime light remote sensing and urban studies: Data, methods, applications, and prospects. J. Remote Sens. 2021, 25, 342–364. [Google Scholar] [CrossRef]
Figure 1. The geographical location and boundary of (a) the People’s Republic of China; (b) Anhui Province; (c) Hefei City; (d) built-up area of Hefei. The image data are available on the National Platform for Common Geospatial Information Services at https://www.tianditu.gov.cn/?tdsourcetag=s_pcqq_aiomsg, accessed on 13 November 2023.
Remotesensing 15 05617 g001
Figure 2. The process of the built-up area extraction method involved integrating NTL, LST, and POI data.
Remotesensing 15 05617 g002
Figure 3. The flowchart of this research.
Remotesensing 15 05617 g003
Figure 4. Compactness and fractal dimension of the Hefei built-up area.
Remotesensing 15 05617 g004
Figure 5. SDE distribution in the Hefei built-up area.
Remotesensing 15 05617 g005
Figure 6. Center of gravity migration map of the Hefei built-up area. (pink: 1993; blue: 1997; green: 2002; yellow: 2007 & 2012 (overlap); orange: 2018).
Remotesensing 15 05617 g006
Figure 7. Results of kernel density analysis with different bandwidths; (a) Bandwidth of 500 m; (b) Bandwidth of 1000 m; (c) Bandwidth of 1500 m; (d) Bandwidth of 2000 m; (e) Bandwidth of 3500 m; (f) Bandwidth of 6000 m.
Remotesensing 15 05617 g007
Figure 8. The built-up area images were extracted by different methods; (a) Luojia 1-01 NTL images; (b) LJ–POI composite index; (c) LJ–POI–LST composite index.
Remotesensing 15 05617 g008
Figure 9. Comparison of extraction results of built-up areas in Hefei City; (a) Luojia 1-01; (b) LJ–POI; (c) LJ–POI–LST.
Remotesensing 15 05617 g009
Figure 10. Comparison of high-resolution image extraction results. ((A) The Shushan Forest Park, which does not belong to urban built-up areas; (B) The eco-agricultural tourism spot in Dawei; (C) The urban-rural fringe areas in Yaohai).
Remotesensing 15 05617 g010
Table 1. Urban expansion indices.
Characteristic IndexFormulaDescription
Expansion area (M) M = M e n d - M i n i t i a l Mend and Minitial are the built-up areas at the end and initial stages of the study period.
Expansion rate (v) v = M e n d - M i n i t i a l T T is the period; the expansion intensity is classified according to the magnitude of v: high speed (>20), fast speed (15–20), medium speed (10–15), and low speed (<10).
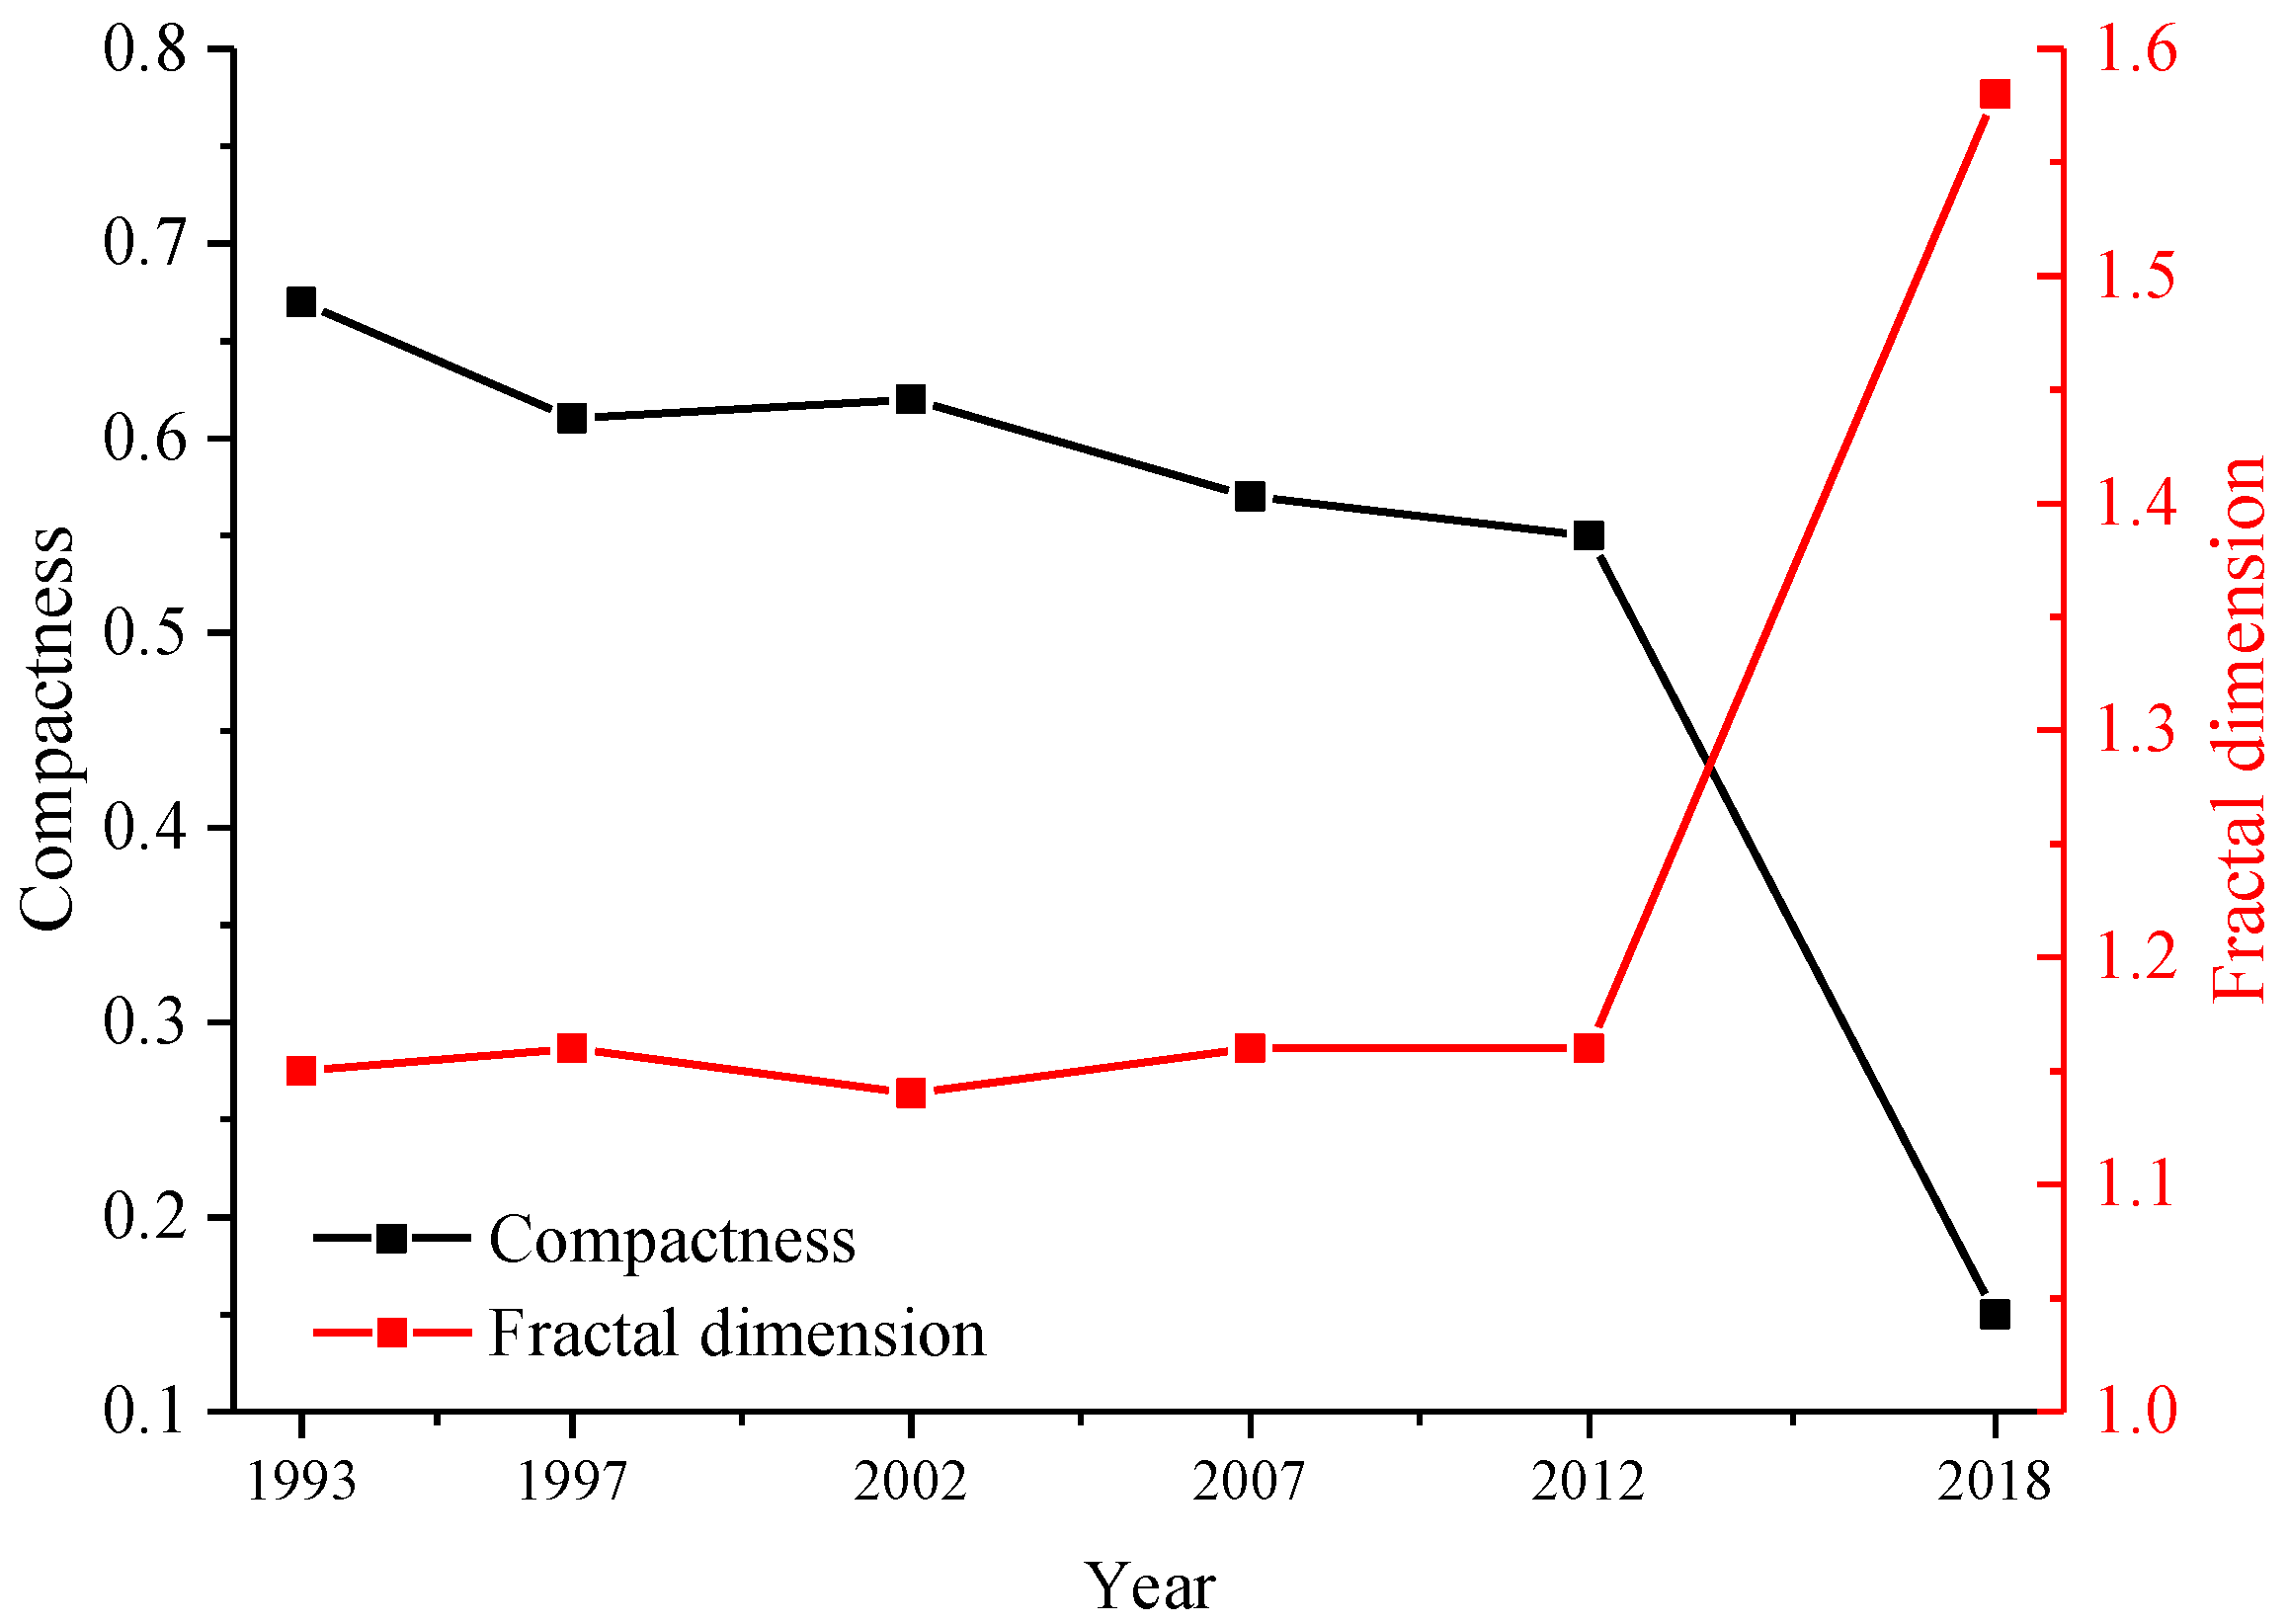
Compactness (C) C = 2 π U i P Ui is the urban built-up area in year i (km2); P is the perimeter of the urban built-up area contour (km).
Fractal dimension (D) D = 2 I n ( 0.25 × P ) I n U i
Centre of gravity of the built-up area
(xi, yi)
x i = t = 1 n ( M i t × x t ) t = 1 n M i t , y i = t = 1 n ( M i t × y t ) t = 1 n M i t Mit is the area of the tth patch in year i; n is the number of patches; (xt, yt) is the coordinates of the gravity center.
Transfer distance of the center of gravity coordinates (d) d = ( x 1 x 2 ) 2 + ( y 1 y 2 ) 2 (x1, y1) and (x2, y2) are the coordinates of the gravity center before and after the transfer.
Sprawl elasticity coefficient (Ri) R i = A i P i Ai is the average annual growth rate of the urban built-up area; Pi is the average annual growth rate of the urban population.
Table 2. Landscape pattern characteristic indices.
Characteristic IndexFormulaDescription
Number of patches
(NP)
N P = i = 1 n n i NP refers to the number of patches contained in the built-up area’s extraction results, reflecting the extraction results’ separation and fragmentation.
Landscape fragmentation (LF) L F = N P S Represents the degree of fragmentation of the built-up area and the complexity of its spatial structure. S is the total area of the built-up area; the larger the value of LF is, the higher the degree of fragmentation.
Edge density
(ED)
E D = P S P is the total perimeter of the boundary of the built-up area; the smaller the ED value is, the better the connectivity inside the built-up area.
Landscape shape index (LSI) L S I = 0.25 P S The more irregular the shape boundary of a patch in the extraction results of a built-up area with a more considerable LSI value.
Table 3. Hefei built-up area expansion indices.
TimeBuilt-Up Area/km2CompactnessFractal DimensionExpansion Area/km2Expansion Rate/km2/aExpansion Intensity
1993750.671.15
4511.25 (mediate)0.15
19971200.611.16
306.00 (low)0.05
20021500.621.14
8016.00 (speediness)0.11
20072300.571.16
14629.20 (high)0.13
20123760.551.16
518.50 (low)0.02
20184270.151.58
Table 4. Elasticity coefficient of urban expansion in Hefei in different periods.
TimeAnnual Growth Rate of the Urban Area (%)Average Annual Growth Rate of the Urban Population (%)Elasticity Coefficient of Urban Expansion
1993–199712.473.094.04
1997–20024.563.661.25
2002–20078.926.281.42
2007–201210.331.945.32
2012–20182.143.630.59
1993–20187.203.731.93
Table 5. Spatial and variation parameters of SDEs in Hefei City.
TimeArea/km2Areal CoordinatesSpatial Growth Rate/%Spatial VariationDistance of Center of GravityDirection of Gravity Shift
199338(124.179°E, 35.956°N)66expand1.53southeast
199763(124.178°E, 35.943°N)
24expand0.46southwest
200278(124.176°E, 35.939°N)
47expand1.12southwest
2007115(124.169°E, 35.930°N)
66expand0.53northeast
2012191(124.172°E, 35.935°N)
97expand1.44southwest
2018376(124.159°E, 35.928°N)
Table 6. Comparison of statistical classification index results.
IndexLuojia 1-01 ImageLJ–POI LJ–POI–LST
Precision (%)84.0883.1486.40
Recall (%)81.6287.6985.32
Table 7. Comparison of landscape pattern index results.
Composite IndexNPLFEDLSI
Luojia 1-01 image2476657.542.5213.09
LJ–POI 350.071.196.56
LJ–POI–LST1920.431.387.21
Disclaimer/Publisher’s Note: The statements, opinions and data contained in all publications are solely those of the individual author(s) and contributor(s) and not of MDPI and/or the editor(s). MDPI and/or the editor(s) disclaim responsibility for any injury to people or property resulting from any ideas, methods, instructions or products referred to in the content.

