Article

Decoding the Dynamics of Climate Change Impact: Temporal Patterns of Surface Warming and Melting on the Nivlisen Ice Shelf, Dronning Maud Land, East Antarctica

by
Geetha Priya Murugesan
1,*,
Raghavendra Koppuram Ramesh Babu
1,
Mahesh Baineni
1,
Rakshita Chidananda
1,
Dhanush Satish
1,
Sivaranjani Sivalingam
1,
Deva Jefflin Aruldhas
1,
Krishna Venkatesh
1,
Narendra Kumar Muniswamy
1 and
Alvarinho Joaozinho Luis
2
1
Centre for Incubation Innovation Research and Consultancy (CIIRC), Jyothy Institute of Technology, Bengaluru 560082, Karnataka, India
2
National Centre for Polar and Ocean Research, Ministry of Earth Sciences, Vasco-da-Gama 403804, Goa, India
*
Author to whom correspondence should be addressed.
Remote Sens. 2023, 15(24), 5676; https://doi.org/10.3390/rs15245676
Submission received: 27 September 2023 / Revised: 28 November 2023 / Accepted: 5 December 2023 / Published: 8 December 2023

Abstract

:
This study analyzes the dynamics of surface melting in Antarctica, which are crucial for understanding glacier and ice sheet behavior and monitoring polar climate change. Specifically, we focus on the Nivlisen ice shelf in East Antarctica, examining melt ponds, supra glacial lakes (SGLs), seasonal surface melt extent, and surface ice flow velocity. Spatial and temporal analysis is based on Landsat and Sentinel-1 data from the austral summers of 2000 to 2023. Between 2000 and 2014, melt ponds and SGLs on the ice shelf covered roughly 1 km2. However, from 2015 to 2023, surface melting increased consistently, leading to more extensive melt ponds and SGLs. Significant SGL depths were observed in 2016, 2017, 2019, and 2020, with 2008, 2016, and 2020 showing the highest volumes and progressive SGL area growth. We also examined the relationship between seasonal surface melt extent and ice flow velocity. Validation efforts involved ground truth data from a melt pond in central Dronning Maud Land (cDML) during the 2022–2023 austral summer, along with model-based results. The observed increase in melt pond depth and volume may significantly impact ice shelf stability, potentially accelerating ice flow and ice shelf destabilization. Continuous monitoring is essential for accurately assessing climate change’s ongoing impact on Antarctic ice shelves.

Graphical Abstract

1. Introduction

Ice shelves play a crucial role in regulating the ice flow from Antarctica to the ocean, making them significant features in the polar regions [1,2]. However, the increasing surface melting on Antarctic ice shelves due to climate change has led to a greater loss in ice [1,2]. Rising temperatures and changing precipitation patterns are responsible for the escalated ice melting and loss [3]. Efficient subglacial drainage mechanisms are essential for maintaining uninterrupted ice flow and the calving process of ice shelves, making their preservation a major concern [4,5,6]. Recent measurements indicate a rise in surface melting across the Antarctic continent, further highlighting the impact of environmental changes [7,8,9,10]. These changes have far-reaching consequences, affecting the meridional temperature gradient, sea level rise, atmospheric conditions, ocean biogeochemical dynamics, and other factors [11].
Understanding the consequences of melting on ice shelves is crucial for comprehending Antarctica’s contribution to rising sea levels [12,13,14,15]. Surface albedo, weather patterns like heat waves and extreme events, and other factors significantly influence the amount of surface melt, which exhibits significant year-to-year variability [9,16,17]. Even minor changes in ice shelves can have significant global effects on sea level rise and climate patterns [7]. Prolonged and intense surface melting can give rise to melt ponds and supraglacial lakes (SGLs), contributing to ice shelf instability [18,19,20]. Meltwater accumulates in depressions, leading to the formation of SGLs [21,22]. While these lakes are transient, they vary in size, depth, and spatial distribution. Some SGLs can extend for several kilometers and reach depths of several meters. Analyzing variations in the volume and area of circular or linear surface water bodies helps us better understand meltwater dynamics [2]. SGLs typically undergo cycles of formation and drainage, with most lakes reabsorbing or emptying during the austral summer [23]. However, some SGLs drain through crevasses, moulins, melt channels, or other drainage features, potentially impacting the underlying ice dynamics [2,5,24,25].
The presence of melt ponds and SGLs reduces the surface reflectivity (albedo) of glaciers, resulting in increased solar energy absorption and enhanced surface melting [26,27]. This process further destabilizes ice shelves by warming the surrounding ice column [28,29]. SGL characteristics, including size, depth, distribution, and atmospheric variables like temperature and radiation, play a complex role in the relationship between SGL development, surface albedo, and ice shelf dynamics [30,31]. The presence and behavior of SGLs have significant implications for ice shelf stability and their impact on inland ice flow [25,30,32].
The formation of SGLs in Antarctica can occur through various mechanisms, such as the accumulation of meltwater on ice sheets or glaciers, leading to the development of ponds or lakes. The lower albedo of these water bodies increases solar radiation absorption, accelerating surface melting [8,13,17,30,33,34,35]. This localized increase in surface melting contributes to greater meltwater production and the expansion of lakes [36,37]. Additionally, glacial lakes facilitate the flow of meltwater to the ice shelf’s base, causing accelerated melting and compromising the shelf’s structural integrity, potentially leading to collapse [38]. Understanding the interactions between SGLs, surface albedo, and ice shelf dynamics is vital for comprehending ice shelf behavior and stability under changing environmental conditions [39].
In this study, we utilize microwave synthetic-aperture radar (SAR) and optical data to estimate various parameters of the Nivlisen Ice Shelf (NIS) on the east coast of Antarctica, including surface melt extent, SGL characteristics (depth, area, volume), and surface ice flow velocity. While optical data can underestimate the true extent of meltwater due to limited availability of cloud-free imagery, field measurements using pressure sensors validate pond depth estimates obtained from UAV multispectral data. The findings of this research provide valuable insights into the vulnerability of the NIS to climate change, contributing to our understanding of surface melting, melt ponds and SGLs, and the increasing meltwater, with implications for future sea level rise predictions. The objective of this study is to conduct a comprehensive technical analysis of the dynamics of the Nivlisen Ice Shelf (NIS) in East Antarctica. Using satellite data from the Landsat and Sentinel-1 datasets, the analysis will be conducted at both the spatial and temporal scales. The primary goals are to estimate surface melt extent, determine various parameters related to SGLs (area, length, volume, depth), analyze ice shelf velocity, and assess the influence of surface melt on seasonal ice velocity patterns. Field measurements utilizing pressure sensors to monitor meltwater levels are employed for empirical verification of the results.

2. Materials and Methods

2.1. Study Area

Antarctica, renowned for its vast ice sheets, encompasses approximately 98% of the landmass in the Antarctic region. Within East Antarctica, a significant territory known as Dronning Maud Land sprawls across more than 2.7 × 10⁶ km2. Research findings revealed that Dronning Maud Land experiences an annual mean temperature as low as −40.9 °C, accompanied by an annual mean wind speed of 4.31 m/s [40]. Also, analyzing the atmospheric dynamics during extreme precipitation events identified unusual variations in meteorological parameters, including temperature and wind patterns [41]. This expansive region boasts a coastline stretching approximately 2000 km, characterized by immense ice shelves. The degree of surface ice loss serves as a critical determinant in assessing the extent of melting on these ice shelves [7,15,30,35,42,43]. The selection of Nivlisen Ice Shelf (NIS) for this study stems from the recent surge in melt ponds and supraglacial lakes (SGLs) observed within the ice shelf region. Moreover, NIS experiences significant melting throughout the austral summer (November, December, January, and February), resulting in the formation of SGLs. These phenomena render the ice shelf increasingly susceptible to hydrofracturing [13,14,18,44,45,46,47], making it a pivotal area for investigating the processes and causes leading to ice loss on the Antarctic ice shelf [48]. Figure 1 illustrates the expansive nature of NIS, covering an area of approximately 7600 km2 and extending around 80 km north to south and 130 km east to west into the Lazarev Sea [2]. Situated within the center of Dronning Maud Land (cDML) at coordinates 70.3 S and 11.3 E, NIS possesses ice thickness ranging from 150 to 700 m. The Vigrid and Lazarev ice shelves flank NIS, while the Potsdam Glacier feeds it from the southeast, contributing an average ice thickness of 1000 m. In the southeastern corner of the ice shelf, the exposed ice moves at an average speed of 80 m per year due to katabatic winds [49]. The southern part of NIS encompasses the Schirmacheroasen, an ice-free region with lakes, ponds, and a maximum elevation of 250 m above sea level [50]. During the austral summer months (November to February), surface melting occurs, resulting in the creation of melt ponds and SGLs across various regions of NIS, including its north, west, and southern sectors. Since 2016, there has been a notable evolution in meltwater ponding attributed to rising temperatures. As a consequence, NIS is experiencing accelerated melting, making it a strategically significant location for investigating the dynamics and factors influencing ice loss on the Antarctic ice shelf [51].

2.2. Data Used

The present study reveals various parameters that influence the dynamics of NIS that include melt pond statistics, seasonal surface melt, and surface ice flow velocity. For assessing seasonal variations in melt ponds and supraglacial lakes (SGLs), satellite-based multispectral datasets were used. Landsat-7, Landsat-8, and Landsat-9 satellites provided data during the austral summer with minimal cloud cover. Landsat-7, launched in 1999, has eight spectral bands and a 15–30 m resolution. Landsat-8, launched in 2013, offers 11 spectral bands and a 15–100 m resolution. Landsat-9, launched in 2021, shares the same capabilities. Synthetic-aperture radar (SAR) data were obtained from the Alaska Satellite Facility. Sentinel-1 SAR data, part of the Copernicus Earth monitoring program, were used for surface melt and velocity estimations. Sentinel-1A and Sentinel-1B, launched in 2014 and 2016, respectively, provide high-resolution images with a revisit period of 6 days. The data utilized include Sentinel-1 Level-1 Interferometric Wide (IW) Swath Ground Range Detected (GRD) (20.4 m × 22.5 m, 20.3 m × 22.6 m, 20.5 m × 22.6 m) and Single Look Complex (SLC) (5 m × 20 m) products. These data sources contribute to understanding surface melt and velocity over the Nivlisen Ice Shelf (NIS). Supplementary Tables S1 and S2 provide the specific datasets used.
The analysis of melt pond statistics has been carried out for the years 2000 to 2023; however, surface melt and ice flow velocity are limited to the austral summers of 2019–2023 due to data constraints. The MEaSUREs Program of NASA provides ice motion data from 1996 to 2016 on an annual scale, while the Sentinel-1 data are available from 2014 onwards. However, suitable InSAR pairs for ice surface displacement/velocity analysis were not found for the austral summers from 2014 to 2019. Similarly, suitable InSAR pairs from the ERS, ALOS PALSAR, and RADARSAT satellites were limited or unavailable for the period from 2000 to 2014 in the study area.

2.3. Methodology

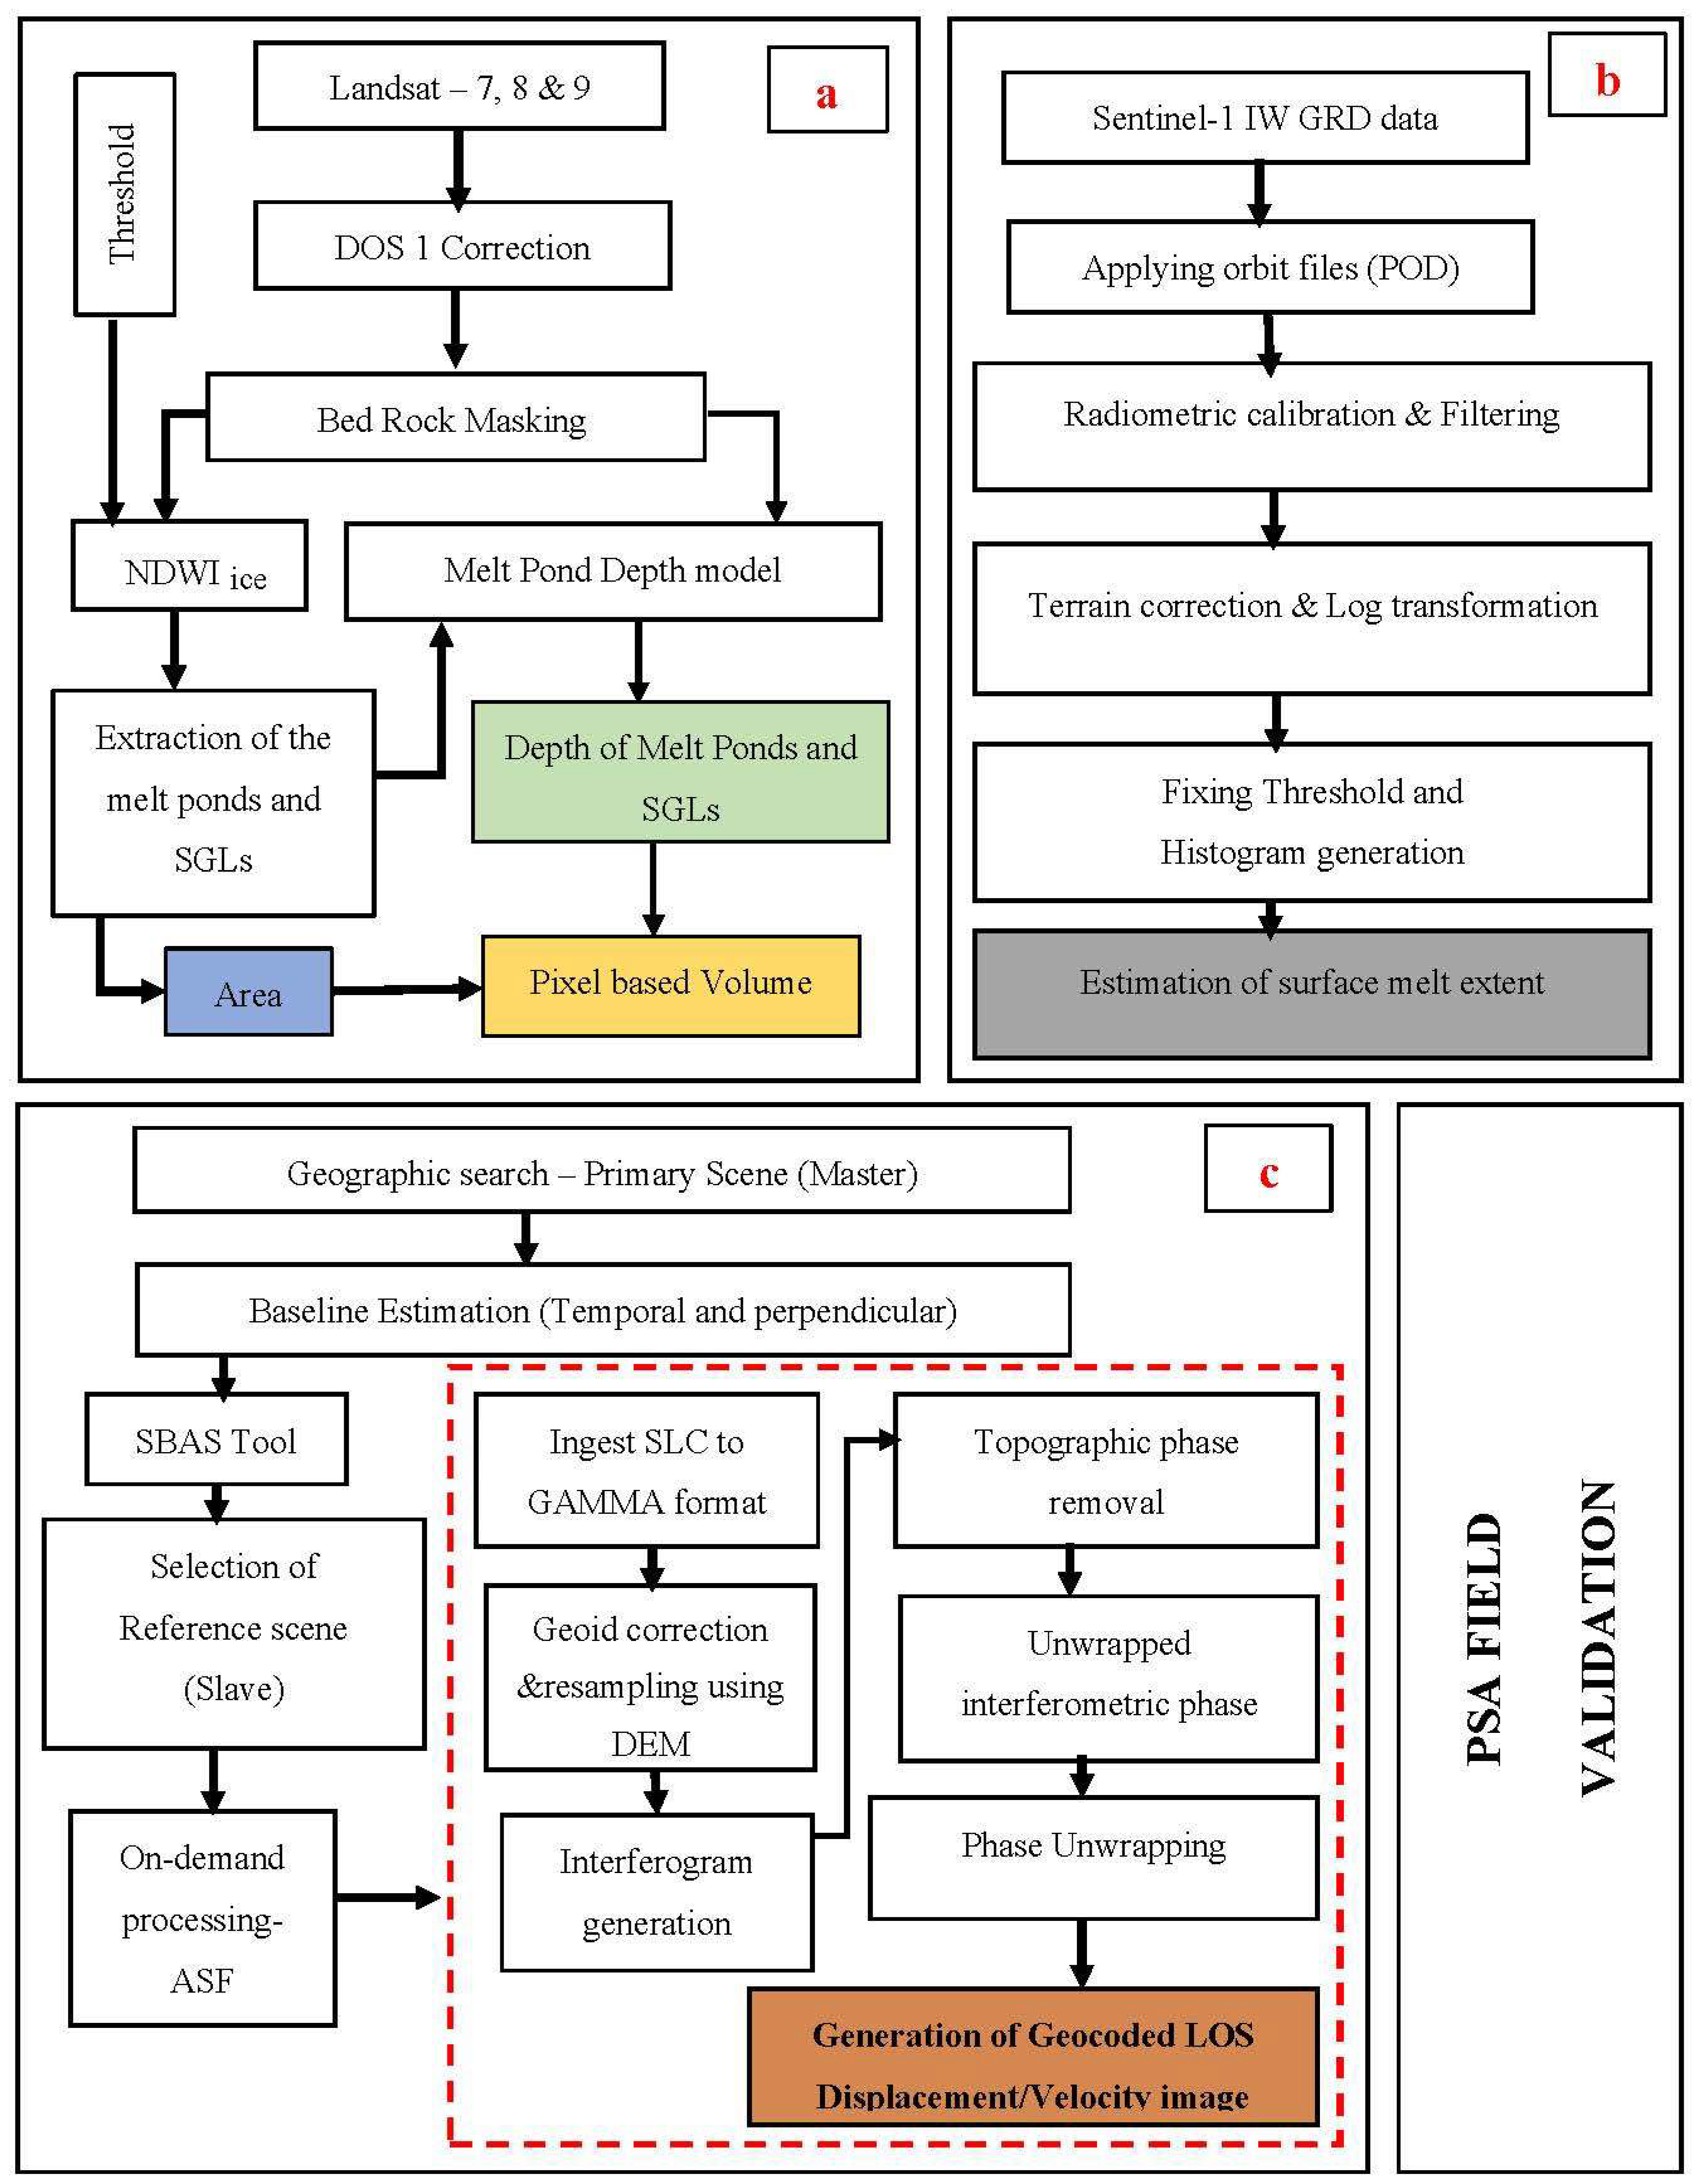
Figure 2 depicts the comprehensive process flow utilized to capture the seasonal patterns and variations in surface melt, specifically in the form of melt ponds and supraglacial lakes (SGLs) over the NIS region. The methodology incorporates an InSAR (interferometric synthetic-aperture radar)-based displacement estimation technique.

2.3.1. Melt Pond Depth Model

The satellite data collected are initially in digital number (DN) format, which needs to be converted to top of atmosphere (TOA) reflectance. Equations (1) and (2) are employed for the visible bands (red and blue) to achieve this conversion. The TOA reflectance is corrected for the sun’s angle, taking into account the sun’s zenith and elevation angles. Bedrock masking is applied to the TOA blue and red bands.
ρ = M R f Q C a l   + A R f
ρ = ρ cos θ S Z = ρ cos θ S E
where QCal is the visible band in DN format, ρ′ is the TOA reflectance without correction for the sun’s angle, MRf is a multiplicative rescaling factor (band specific), ARf is an additive rescaling factor (band specific), ρ is TOA reflectance with correction for the sun’s angle, θSZ is the sun’s zenith angle, and θSE is the sun’s elevation angle.
The modified Normalized Difference Water Index for icy locations ( N D W I I C E ) is then calculated using the blue and red visible bands to map the melt ponds and SGLs over the ice shelf (Equation (3)). The N D W I I C E accentuates the spectral differences between unfrozen water and relatively arid snow/ice surfaces. A threshold value of 0.25 is used to identify the melt ponds and SGLs, which is adjusted by 0.01 based on the amount of water visible in the false-color composite. The areas of the melt ponds and SGLs are calculated using the vectorized raster [2,30].
N D W I I C E = B L U E R e f R E D R e f B L U E R e f + R E D R e f
where B L U E R e f is the blue visible band reflectance and R E D R e f is the red visible band reflectance.
To estimate the depth ( L d ) of the melt ponds and SGLs, a multispectral-data-based melt pond depth (MPD) model (Equation (4)) is utilized [5,12,32,52,53]. The model is based on the radiative transfer principle, simulating the interaction of light with different components such as the water column, underlying aquatic bottom, and surrounding environment. The depth calculation relies on the rate of light attenuation in water, determined by the absorption and scattering properties of the water. Additionally, knowledge of the lake bottom’s albedo, which affects the reflected light, is essential for accurate depth estimation. The proportion of dissolved and suspended materials impacts the reflectance of optically deep water, potentially affecting the depth estimation.
L d = ln L b r R ln R L d R α
where L b r is the peripheral reflectance of the lake, R is the reflectance of optically deep water, R L d is the reflectance of the water body, and α is the attenuation constant. The Lbr was calculated for each melt pond/SGL in every scene by averaging a two-pixel buffer. The mean variation between using R = 0 (i.e., reflectance from open ocean water) and using the R values obtained from the lakes in the scenarios was less than 10%. As a result, the R value was considered to be nil for all scenes.
A pixel-based approach was used to estimate the depth of the melt ponds and SGLs on the ice shelf, following the methodology in Section 2.3.1 (Figure 2). By analyzing individual pixel values and incorporating the MPD model’s depth profile, more accurate volume estimation was achieved, overcoming the limitations of conventional methods and ensuring the reliability of the results. The study encompassed austral summers from 2000 to 2023, focusing on the peak melt period. The results were analyzed in conjunction with weather data obtained from the Meteostat database for the study area, specifically weather station No. 89512 (the temperature trend from 2000 to 2023 is depicted in Supplementary Figure S1).

2.3.2. Estimation of Surface Melt Extent

The surface melt extent over NIS involves processing the Sentinel-1 synthetic-aperture radar (SAR) data using the SNAP algorithm. The data are calibrated to obtain backscatter values (σ0) [54], followed by speckle noise reduction and correction for geometric distortions and topographic variations. The calibrated data are then transformed into decibels, and the extent of surface melt is determined by thresholding the resulting histogram. This process, outlined in Jewell Lund et al. (2022), generates a binary image that delineates the area of interest [55].

2.3.3. Estimation of Surface Ice Flow Velocity

The Alaska Satellite Facility (ASF) provides access to on-demand services (https://hyp3-docs.asf.alaska.edu/using/vertex/ (accessed on 1 April 2023)) for generating SAR interferometry products from Sentinel-1 data. By selecting reference and secondary scenes through a geographic search in Alaska Vertex, interferograms are constructed. The baseline tool ensures coherent phase measurements by identifying data with reasonable perpendicular baseline values for InSAR processing. SBAS utilizes a large number of interferograms with short baselines and high temporal resolution. Pre- and post-processing steps involve data import, geoid correction, burst estimation, mosaicking, unwrapping, and phase unwrapping using SNAPHU. The final output includes geocoded velocity information [56].

2.3.4. Pressure Sensor Assembly (PSA) for Field Data

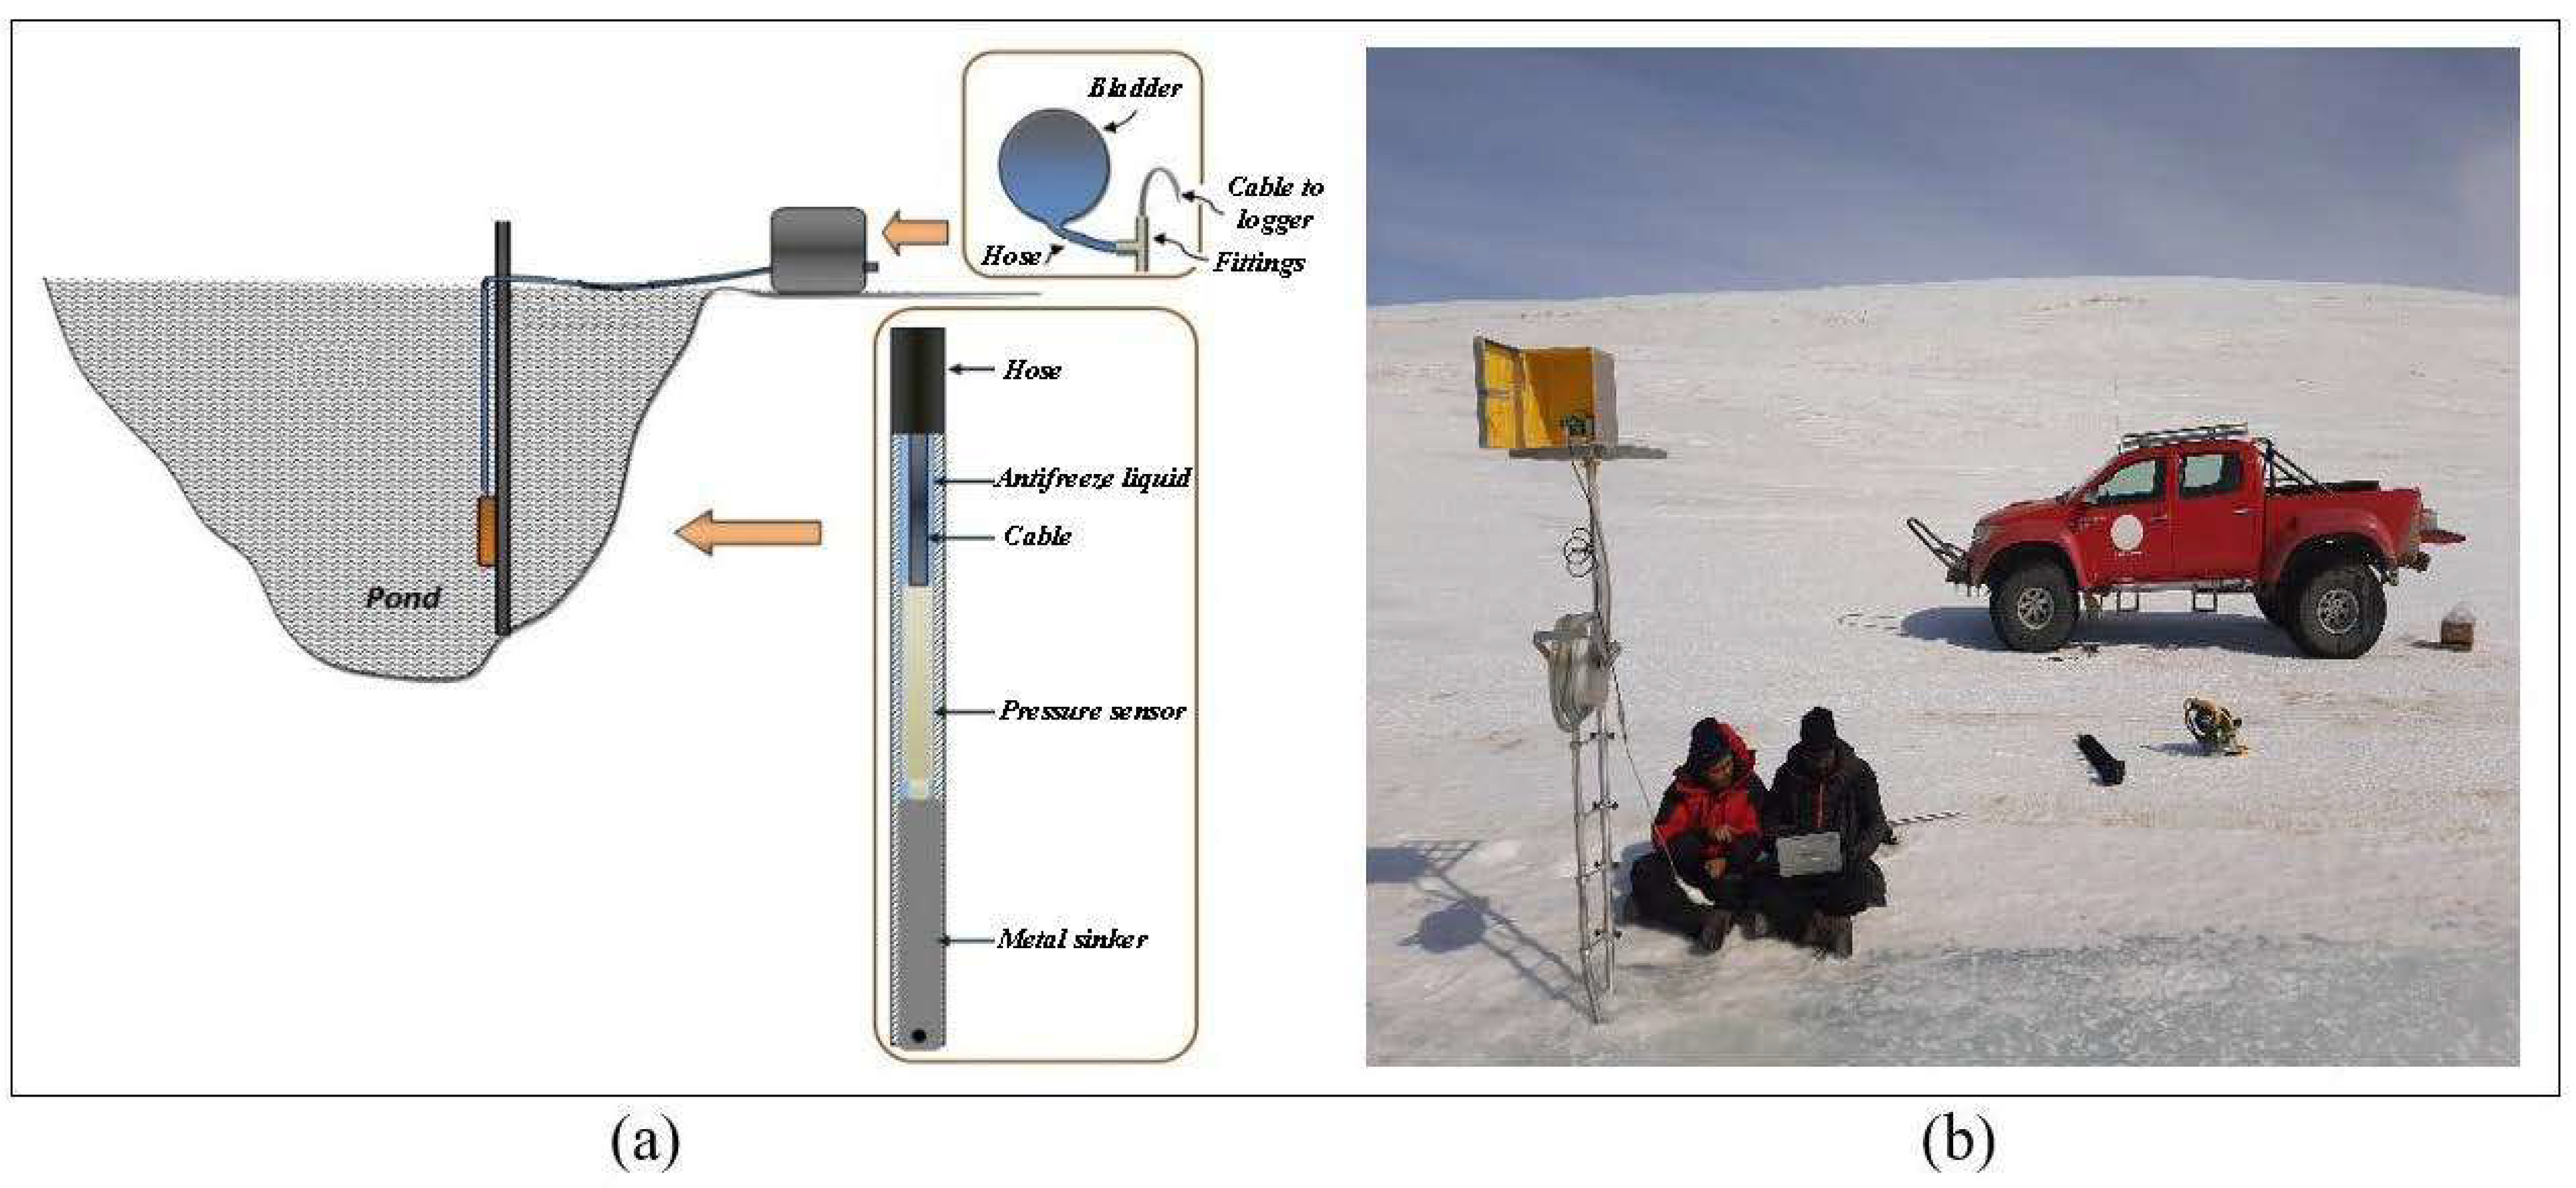
The PSA’s current design is given in a schematic representation in Figure 3. An armored silicon hose of 26 mm diameter with a total length of 10 m that houses a pressure sensor is used. The pressure sensor is attached to a 23 cm long, slightly larger than 26 mm iron rod that is inserted with silicone sealant and connected with hose clamps in the bottom half of the hose. The rod serves as both a waterproof closure and a dead weight. A T-junction is fitted at the top end of the hose to allow the logger cable exiting the closed PSA system to link the pressure sensor to the logger. The other T-junction branch connects to a 2 L expansion rubber bladder. The bladder is generally half full to enable volume variations in the antifreeze (for example, due to sun heating) without causing pressure buildup in the assembly. The hose is filled with an antifreeze solution (ethylene glycol with water in the proportion 50:50) and the PSA was mounted on a 5 m long pole erected in the pond/lake area with the help of a Teflon pulley and guides. The pulley arrangement is made to ensure that the pressure sensor slides down as the melting progresses and remains in contact with the pond ice floor/bottom bed surface over which the meltwater is ponding. The setup was installed by drilling up to 3 m into the frozen pond (location) with a Jiffy ice auger (4G four stroke) and extenders by late November 2022, before melting. The sensor used was a DCX-22 data logger which is a versatile device designed for measuring water level, water pressure, and temperature. The sealed gauge variant delivers the highest level of accuracy and is well suited for submersion applications. With an extended battery life, the DCX-22 data logger can record data for up to 10 years, capturing measurements at hourly intervals.

3. Results

3.1. Melt Ponds and SGLs

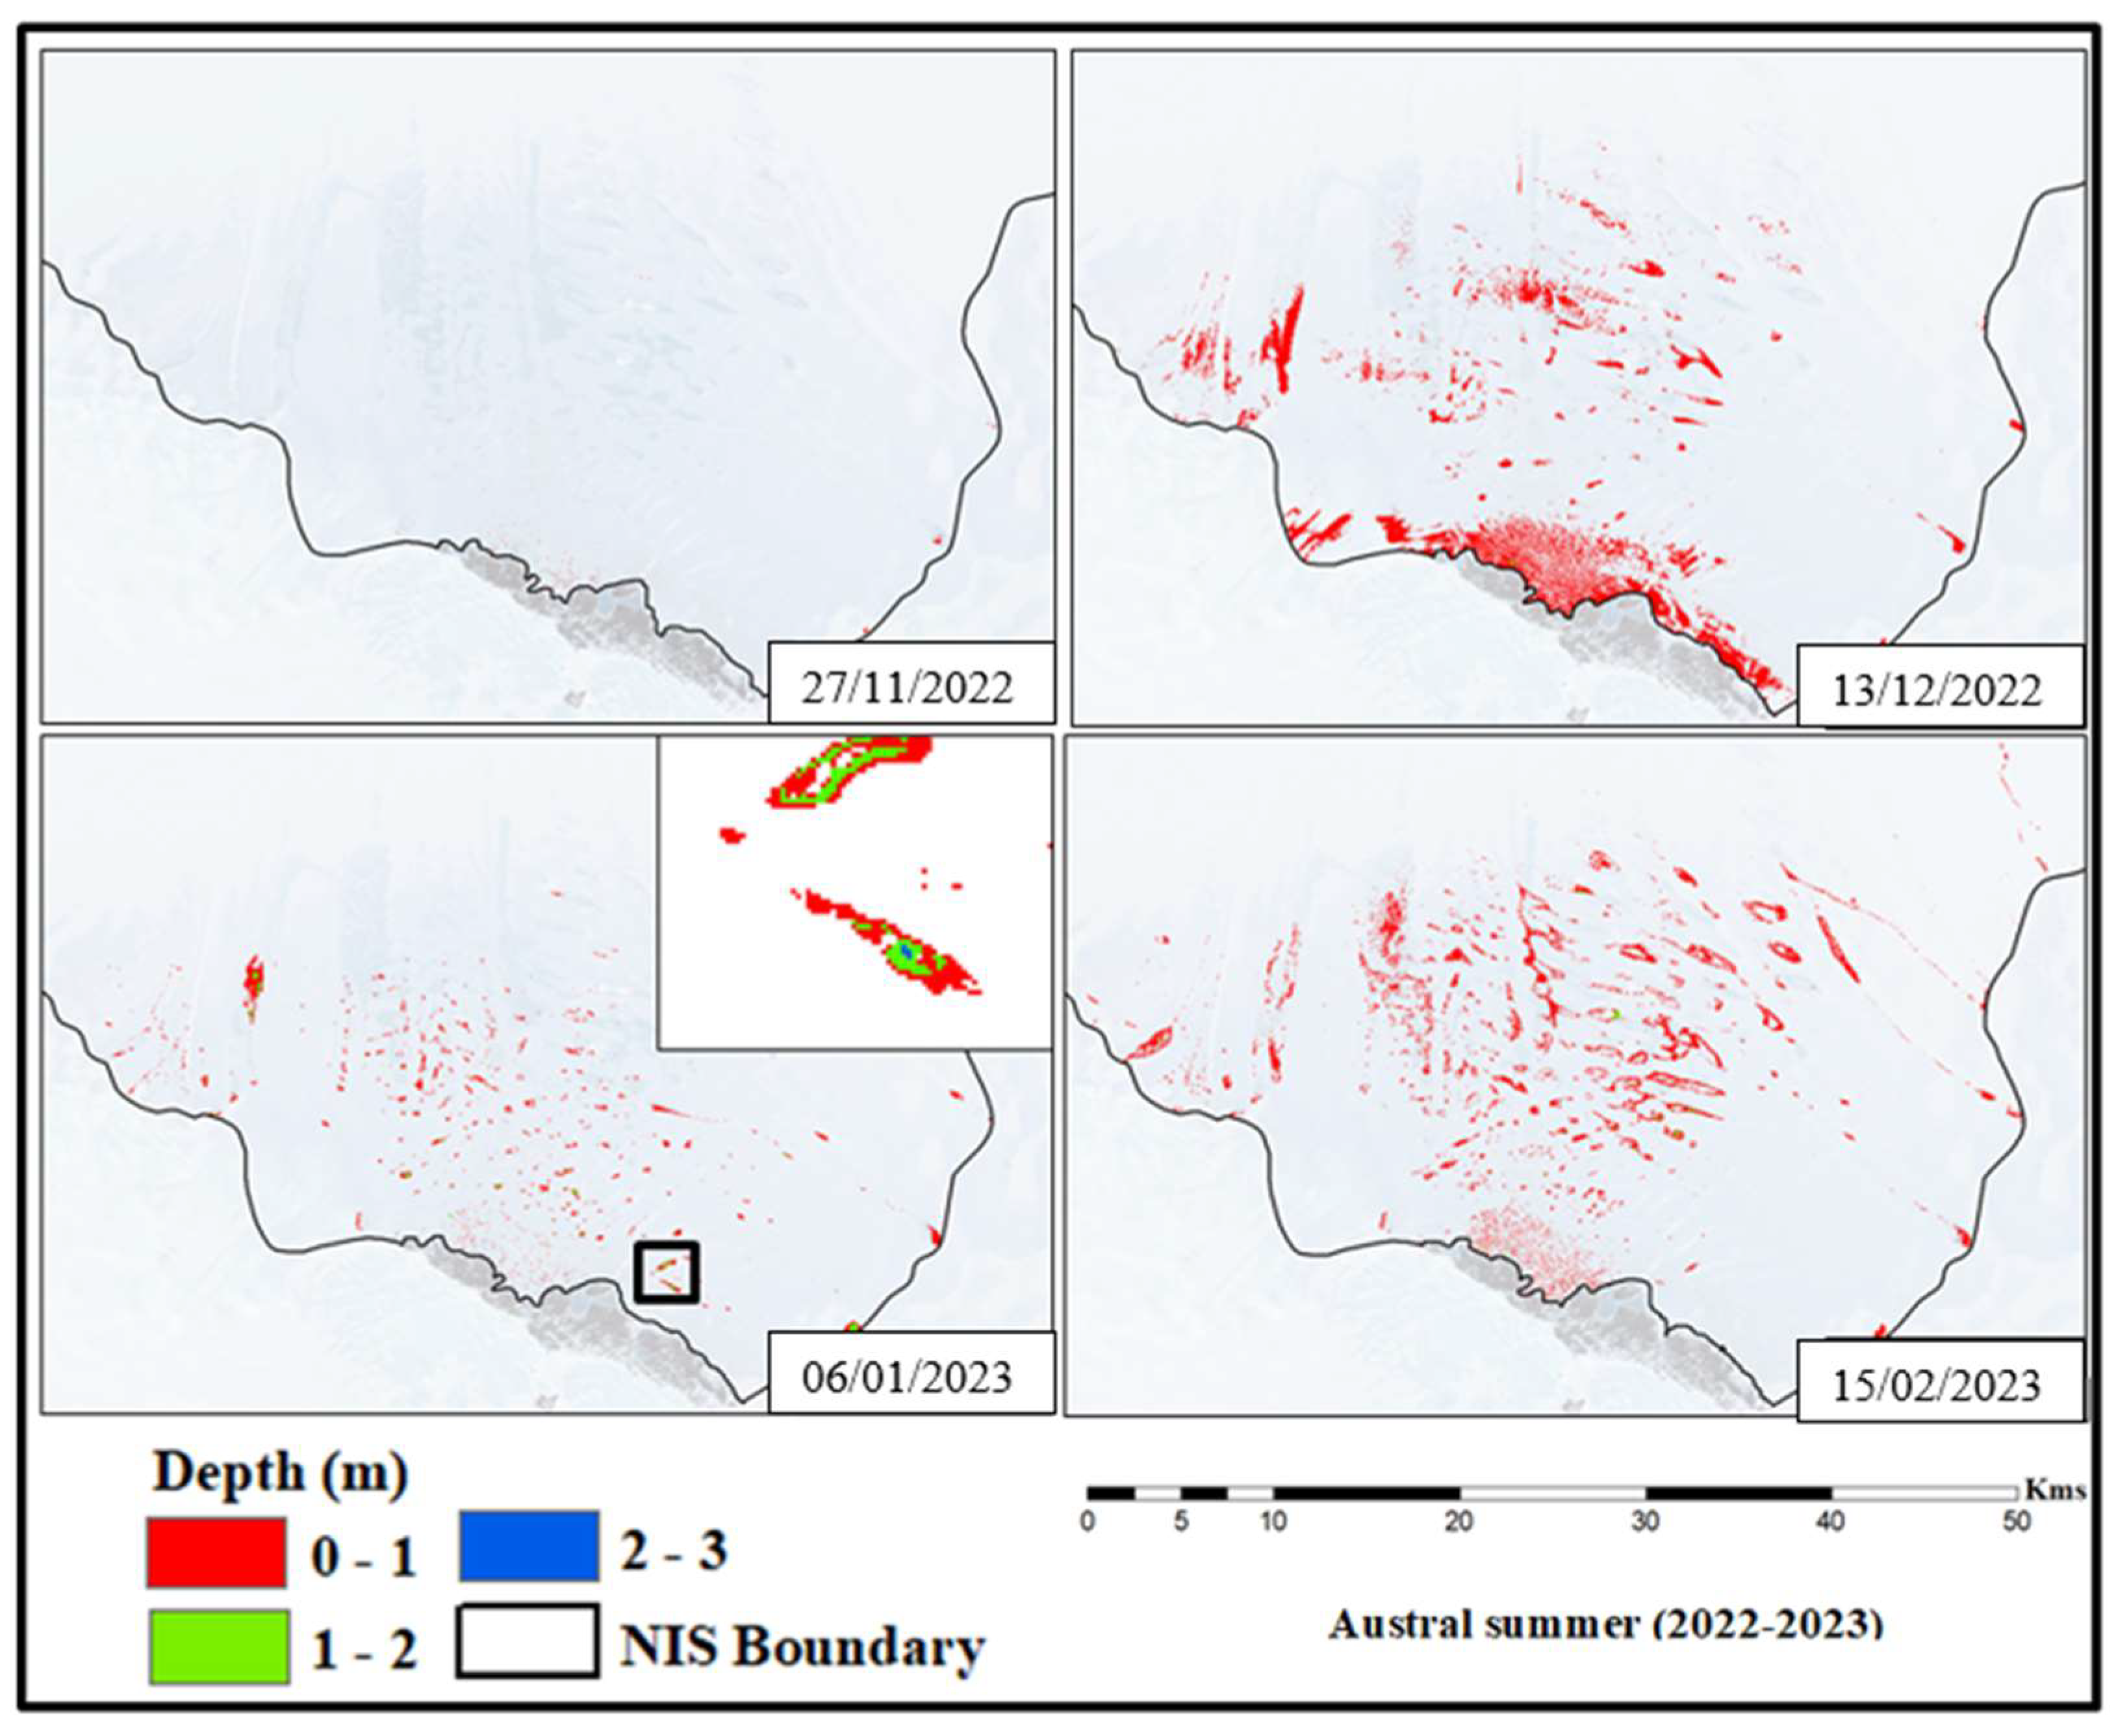
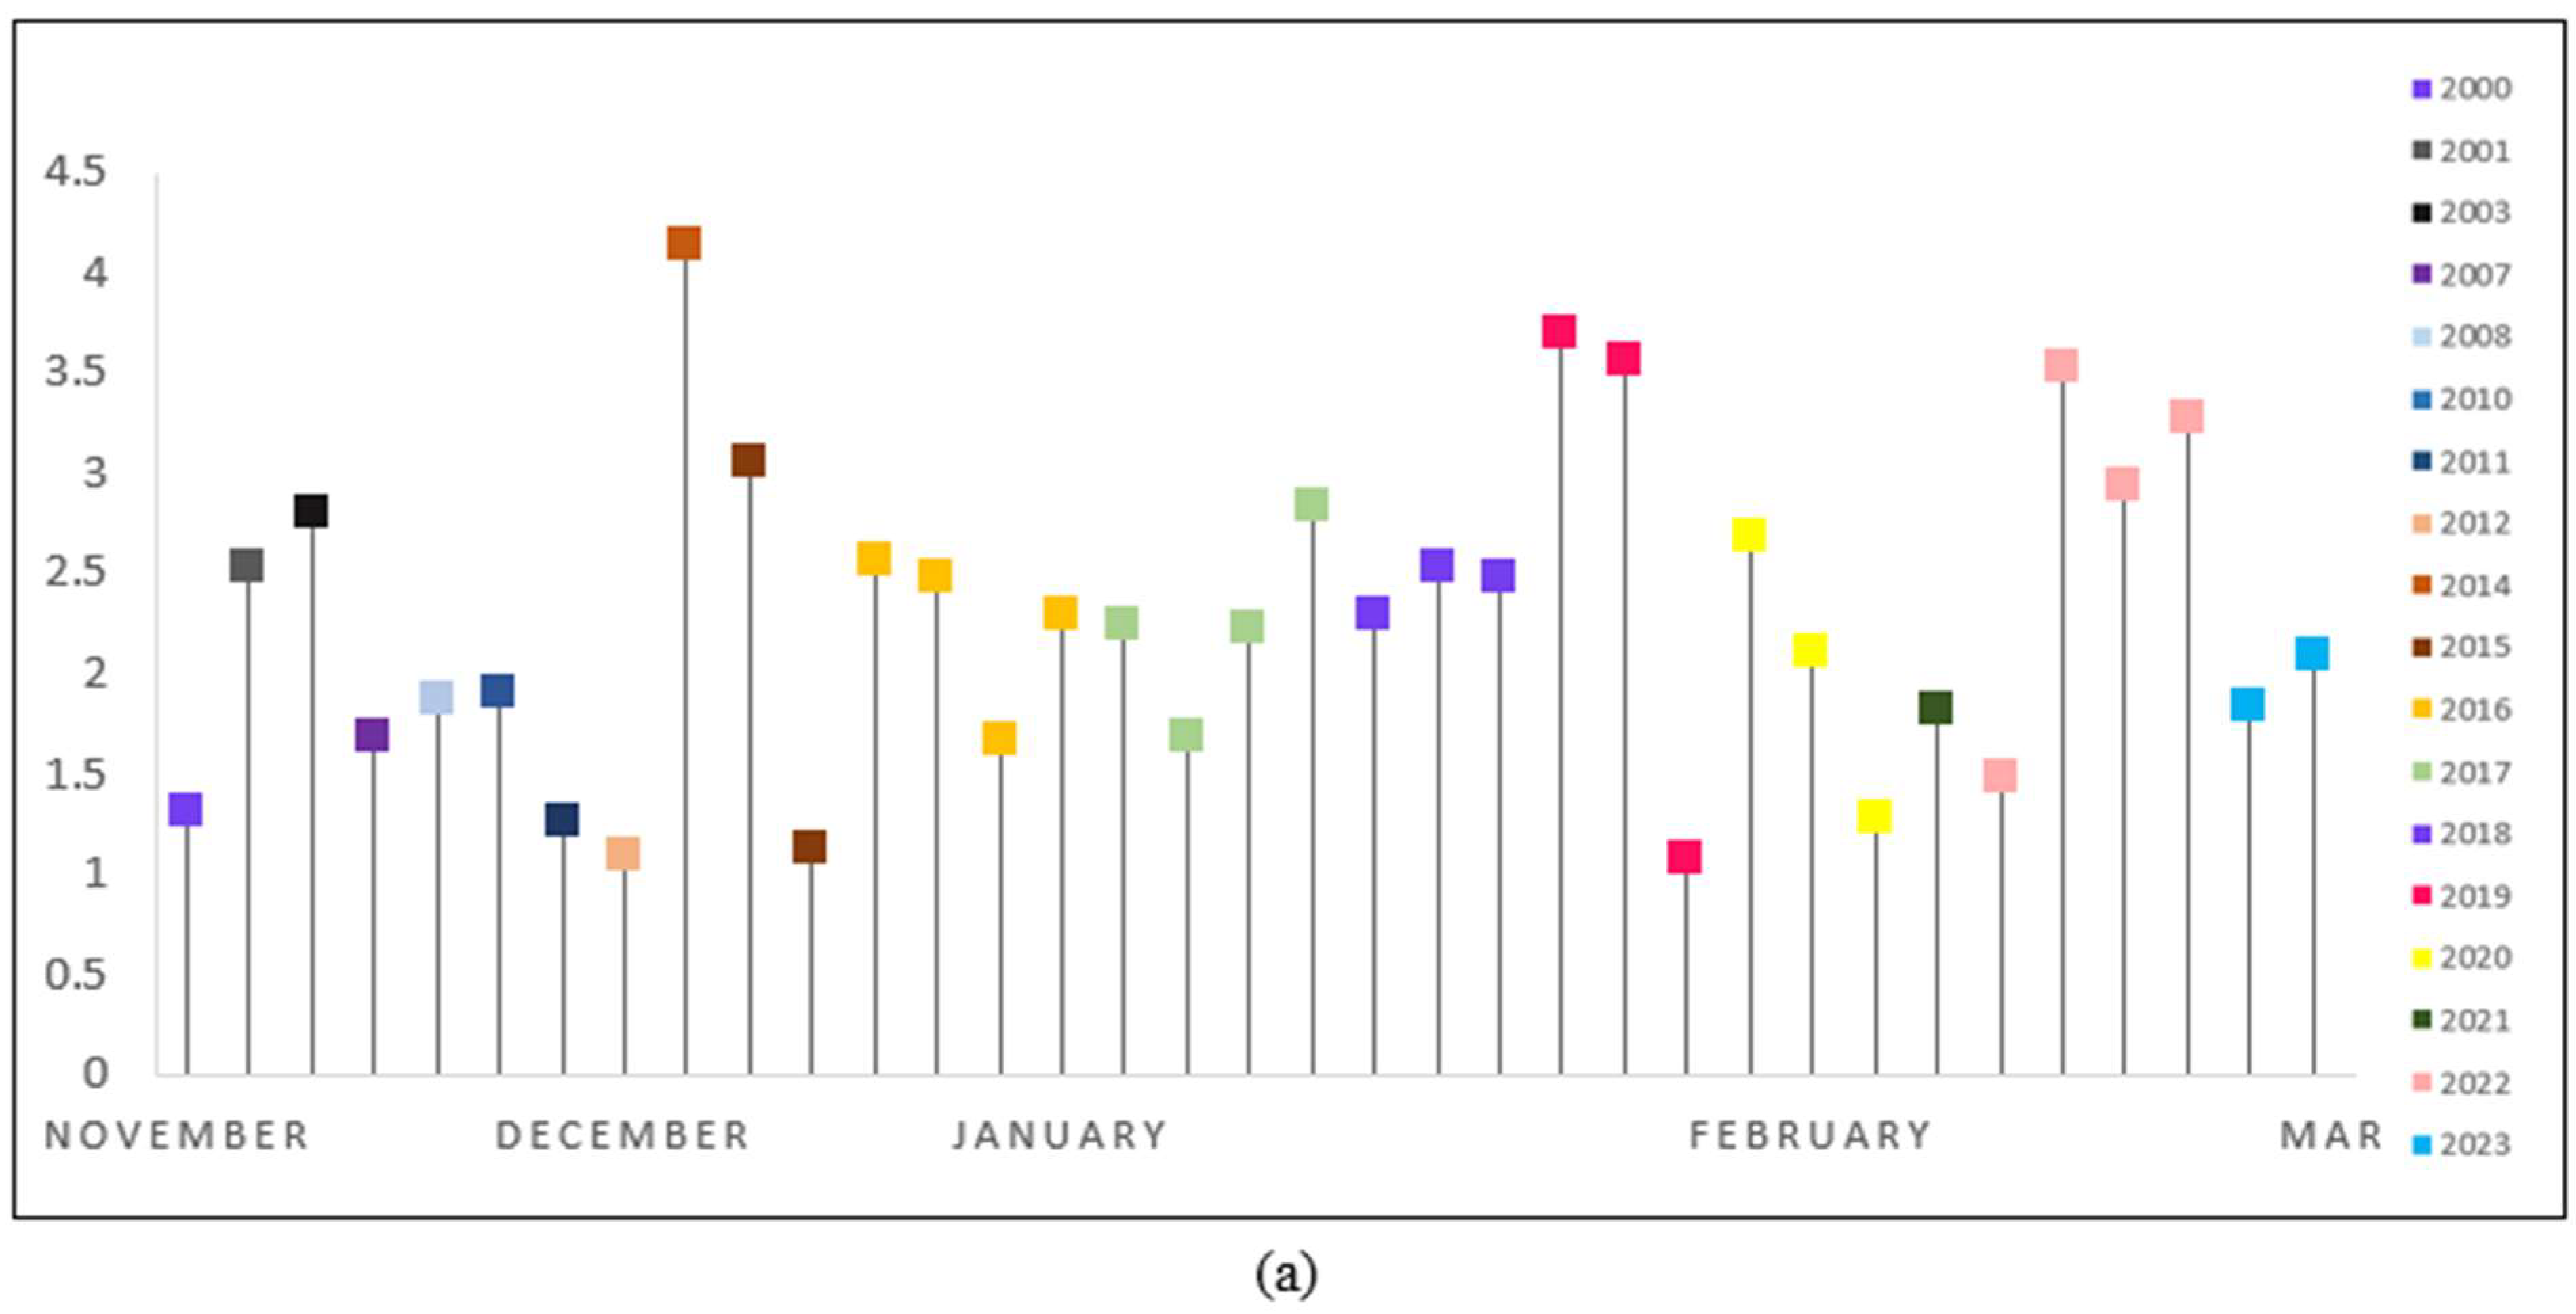
The analysis revealed a relatively low total area of melt ponds and SGLs (<1 km2) in November and December from 2000 to 2014 (Supplementary Figure S2). However, a significant increase in meltwater volume was observed in January and February, representing the peak meltwater volume of the season. A consistent pattern of melting and increased formation of melt ponds and SGLs was observed during the November to February period from 2015 to 2023, as given in Supplementary Figures S3–S9 and Figure 4 and Figure 5. These findings provide insights into the seasonal variability in meltwater accumulation and the timing and magnitude of peak meltwater volume in the study area. The distribution of melt ponds and SGLs showed clustering, with a higher concentration observed in the southern grounding zone. Conversely, the central part of the ice shelf exhibited minimal melt ponds and SGLs due to lower surface melt rates.
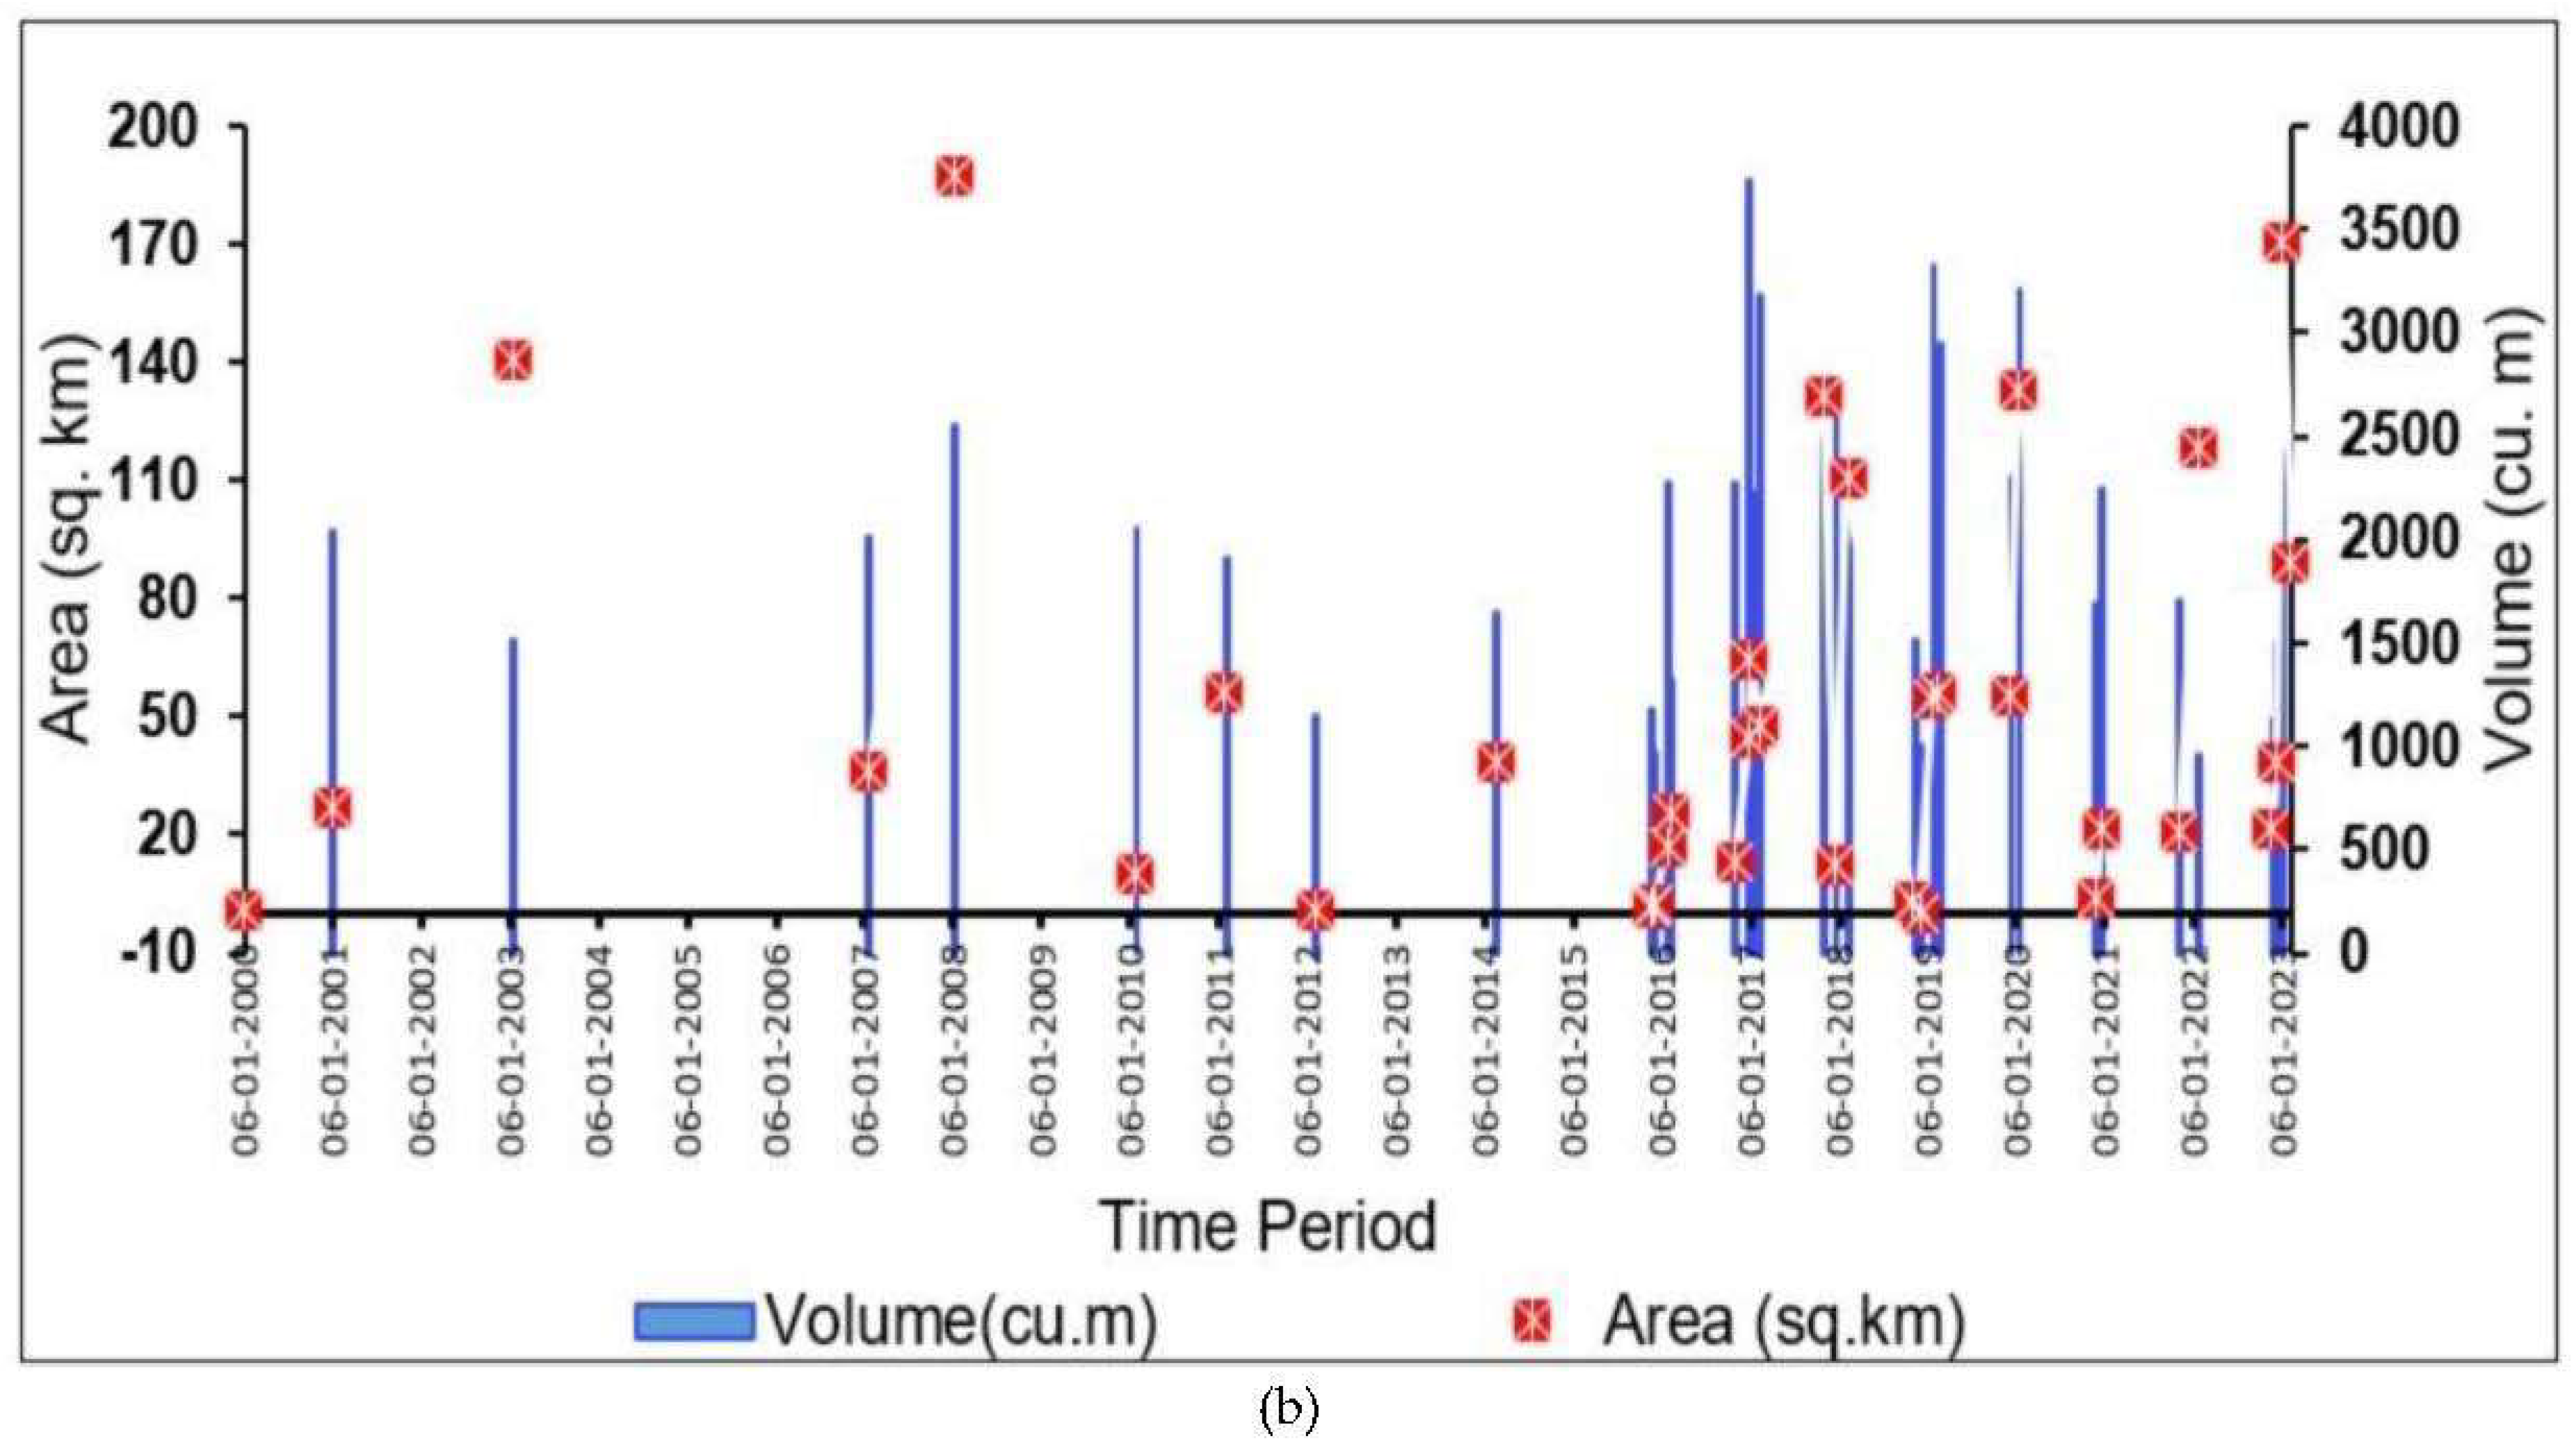
A detailed examination of the melt ponds and supraglacial lakes (SGLs) over the course of the years 2000 to 2023 in the NIS, East Antarctica, reveals intriguing patterns. In the early years, there was a general decrease in the maximum depth and volume, coupled with an increase in the covered area. Noteworthy increases occurred in 2007 and 2010, possibly linked to elevated temperatures. The peak values were documented in 2008, marking a notable anomaly. Subsequent years (2015–2020) displayed a variable landscape, with the highest recorded depth and volume in 2016, showcasing the dynamic nature of these features. The austral summer of 2016 to 2017 witnessed a pronounced peak in depth and volume, attributed to higher temperatures. From 2018 to 2020, consistently higher values were observed, indicative of fluctuating temperatures during the peak melt season. The austral summers from 2020 to 2023 depicted significant increases in the maximum depth, area, and volume, with fluctuations attributed to temperature variations, as well as the impact of drainage mechanisms, fissures, and canals causing reductions. This comprehensive research data underscores the complex interplay of environmental factors shaping the evolving state of melt ponds and SGLs in Antarctica over the studied period.

3.2. Seasonal Surface Melt Extent

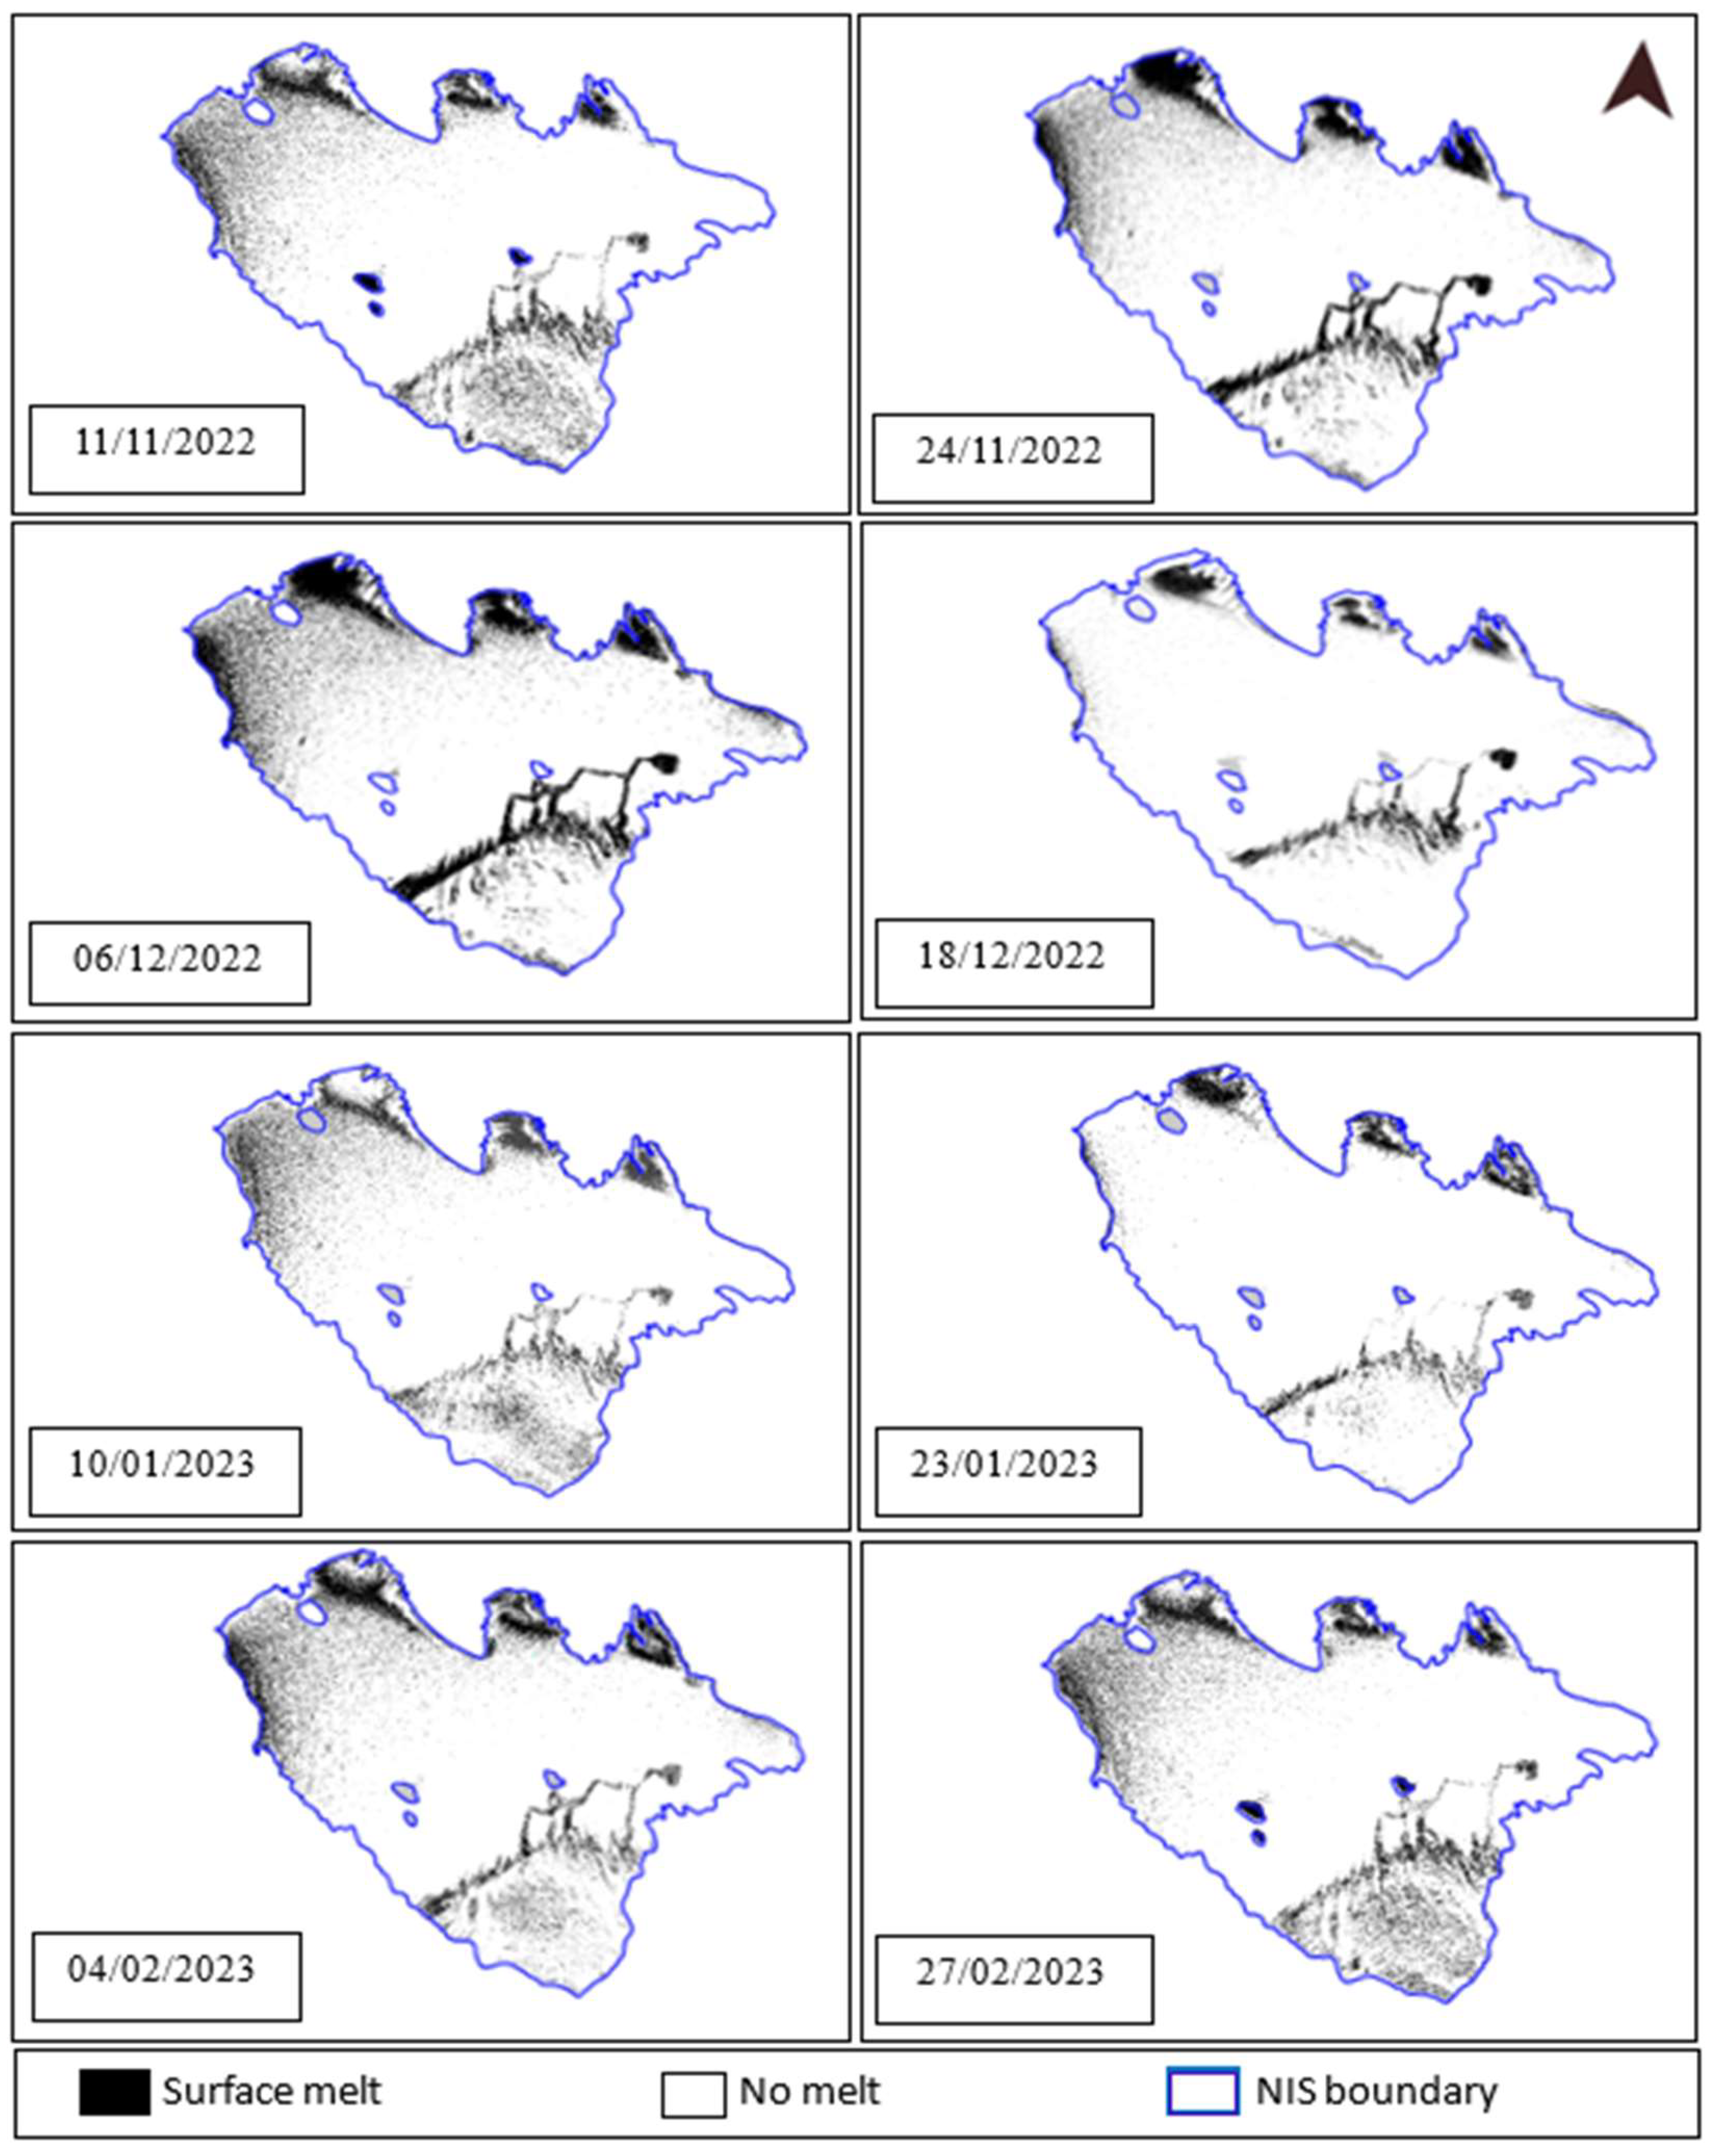
The spatio-temporal surface melt extent (SME) map, estimated for austral summers from 2019 to 2023 (Figure 6 and Figure 7), shows melt detected in the northwest and southern parts of the shelf, while the center remains dry with a recurring pattern in surface melt extent (SME). The observed fluctuations discern strong linkages with several influencing factors such as temperature, precipitation, albedo, katabatic wind, and other specific local conditions (Supplementary Figures S10–S13). The SME in the region demonstrates a strong association with temperature fluctuations. The data reveal a consistent pattern where higher temperatures are associated with increased SME, while colder temperatures lead to reduced melt extent. Notably, the peak melt season, occurring in January, is closely linked to a rise in average temperatures.
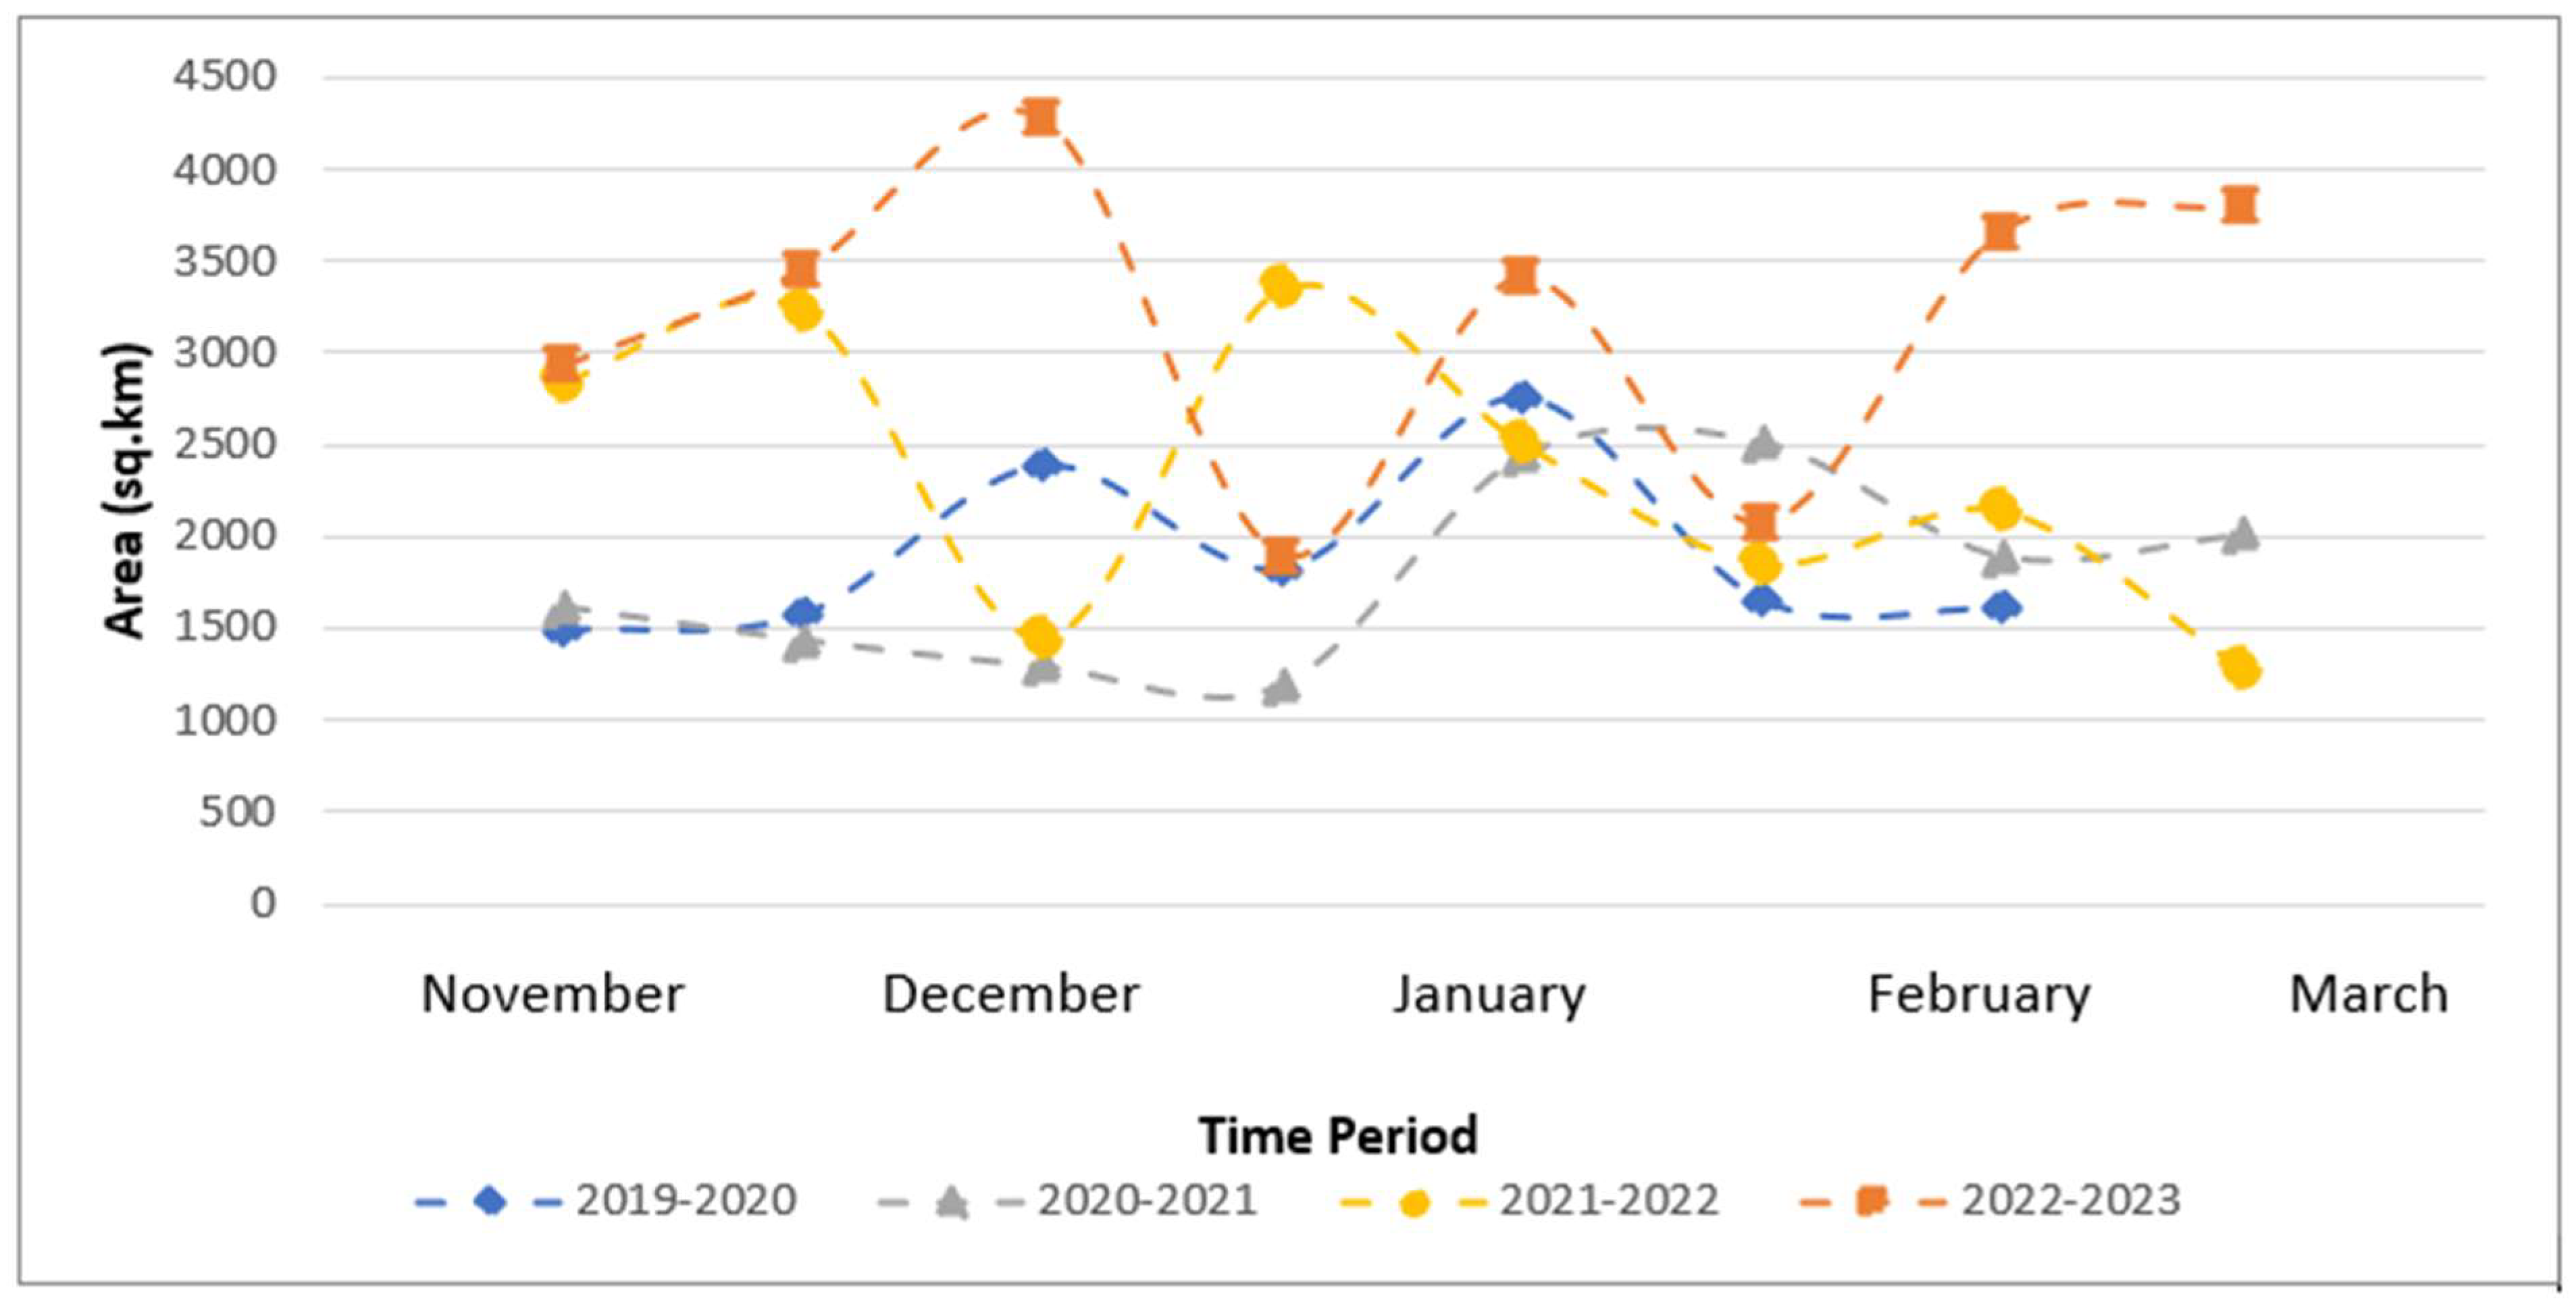
From the temporal pattern analysis, it can be seen that each austral summer witnesses a notable surge in surface melting during November. The extent varies, but this month consistently experiences high surface melting. December shows mixed patterns, with fluctuations in surface melt extent. Factors such as freezing winds, wind chill variations, and precipitation contribute to the observed variability. January tends to be the peak melt season, marked by an expanded surface melt area. This consistent trend suggests that, regardless of variations, January consistently exhibits increased surface melting. February experiences fluctuations in surface melt extent. Notable increases, potentially influenced by higher temperatures, decreased precipitation, and the albedo effect [40,41], are observed, but this month also displays variability across the studied years. The austral summer of 2022–2023 contributed to the peak surface melting extent area. November 2022 records a substantial increase in surface melting, covering an average area of 3187 km2, a marked rise compared to previous Novembers. Additionally, February 2023 shows an increase in surface melt, reaching an average area of 3725 km2, similar to patterns observed in February 2020 and potentially influenced by the albedo effect [40,41]. The spatial distribution remains consistent, emphasizing the dynamic nature of surface melt extent influenced by multiple factors.

3.3. Seasonal Surface Ice Flow Velocity

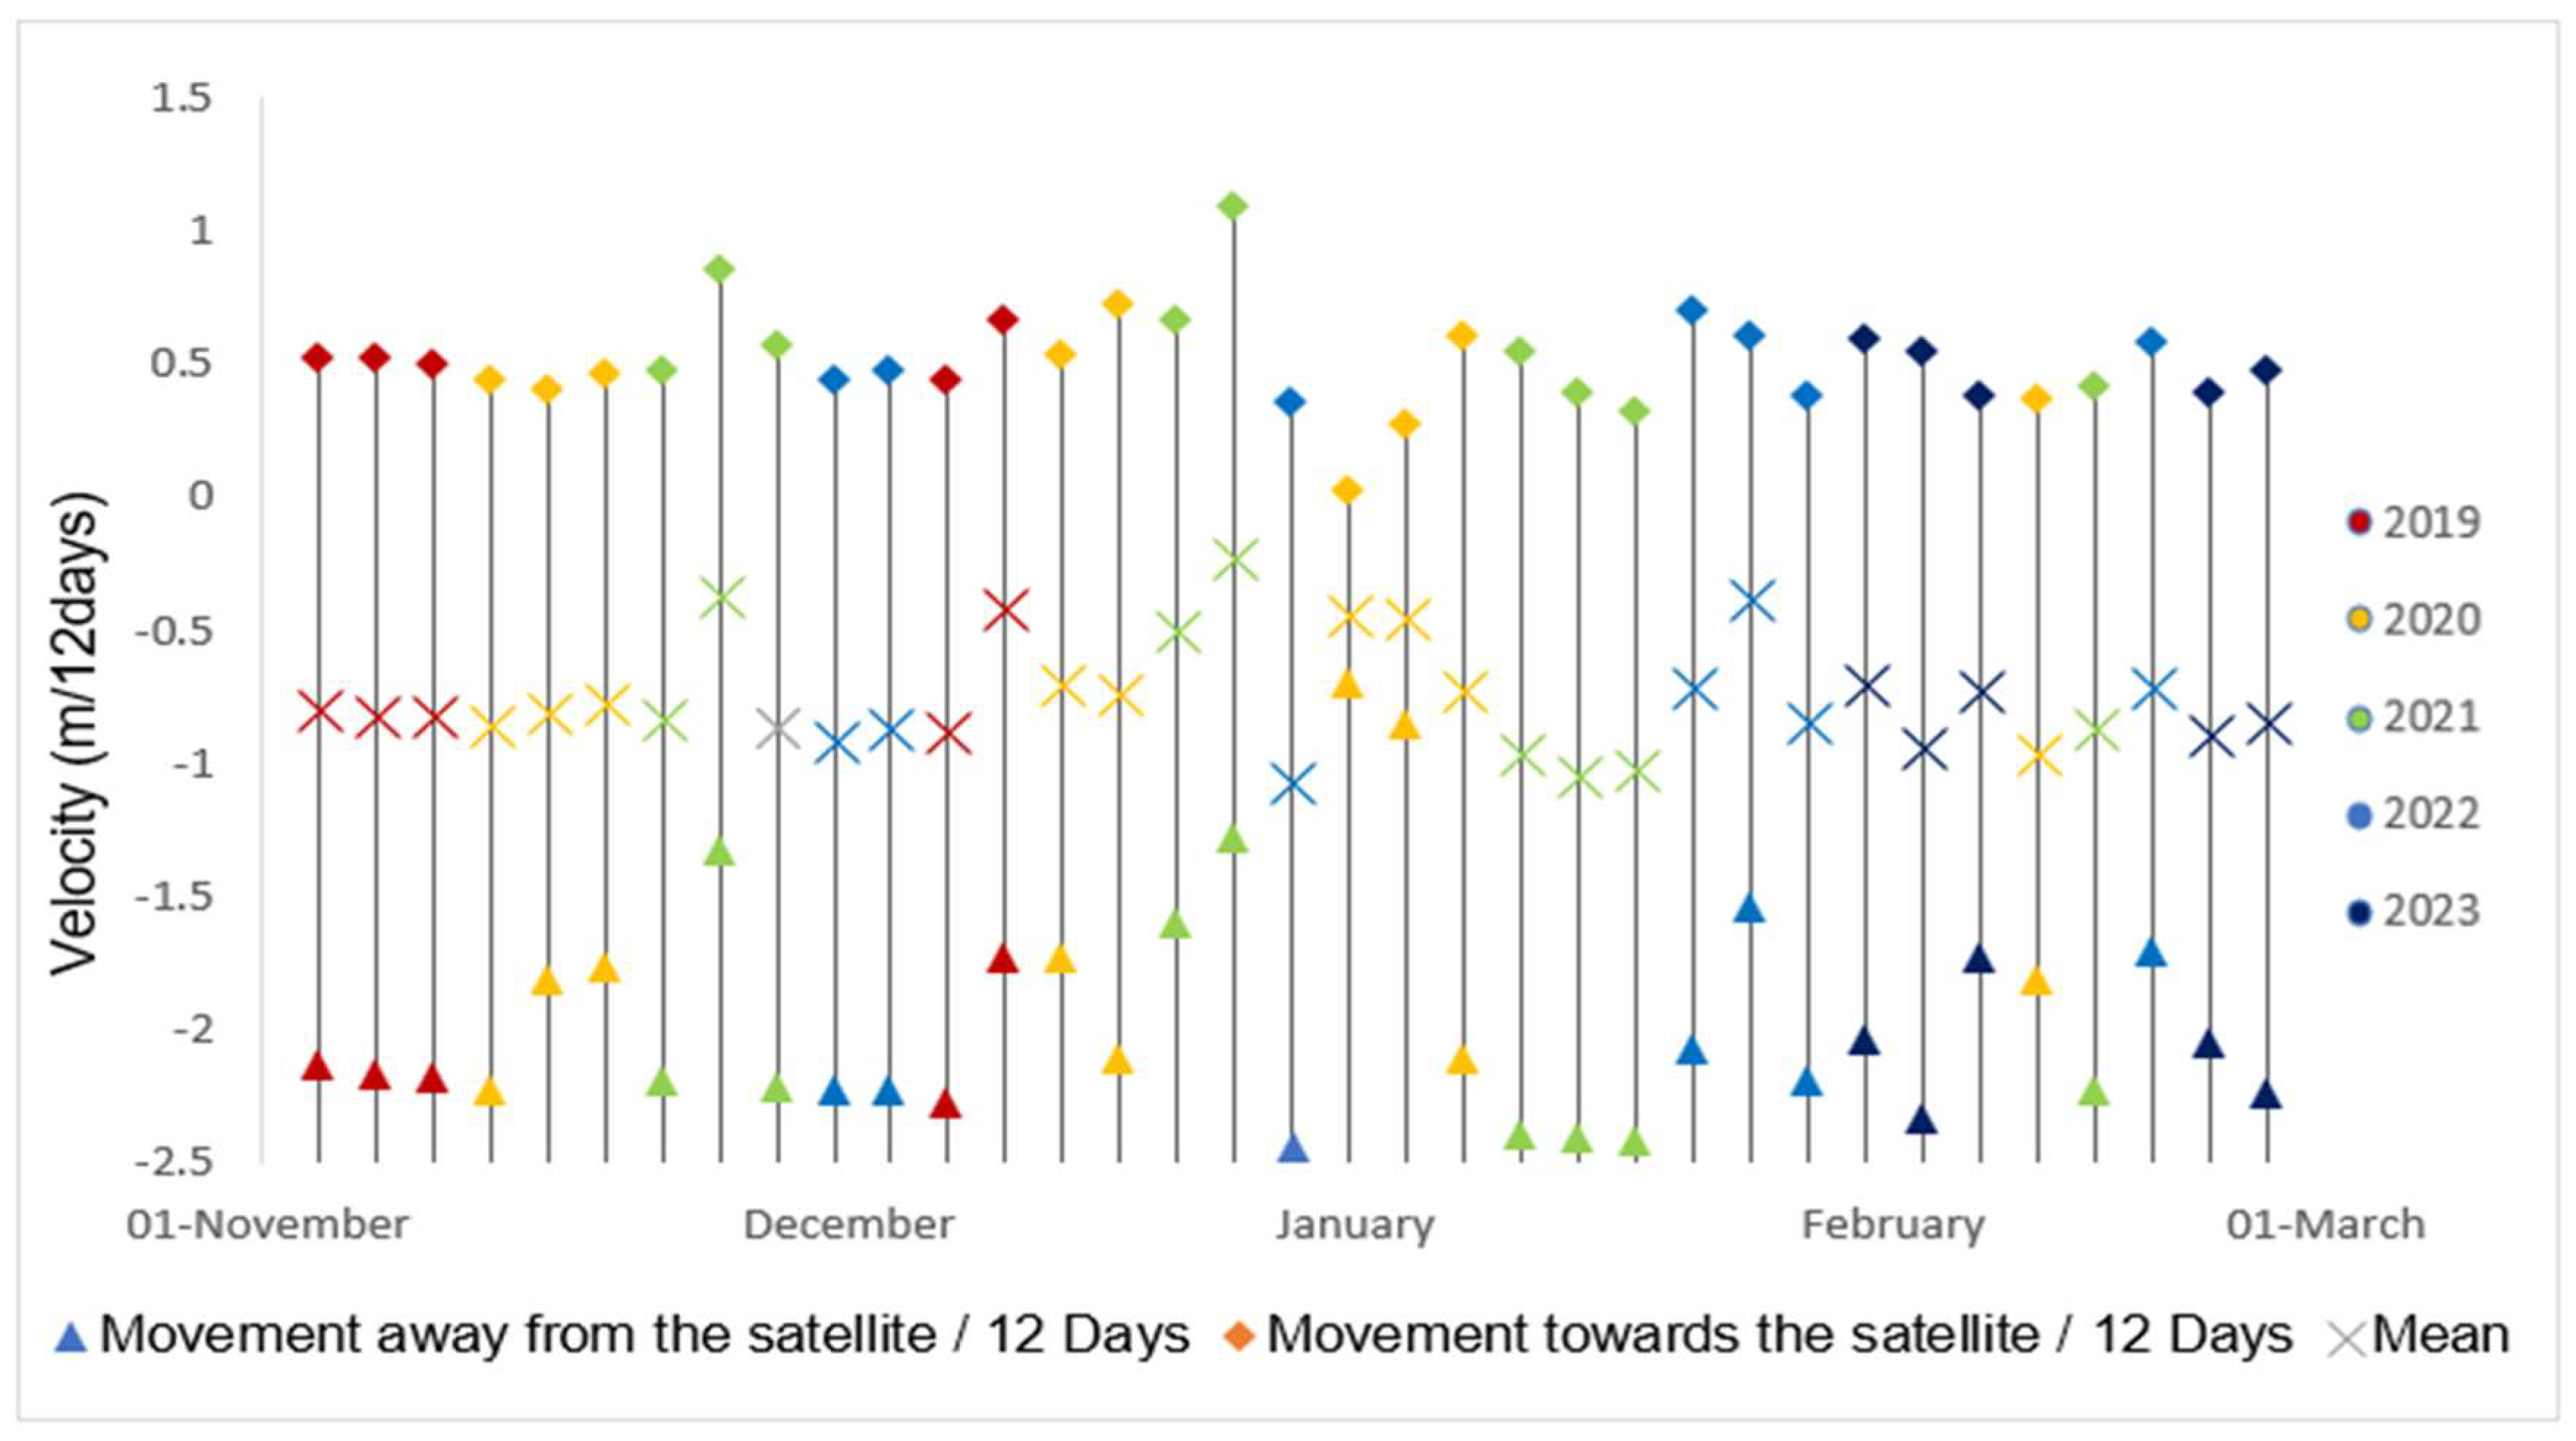
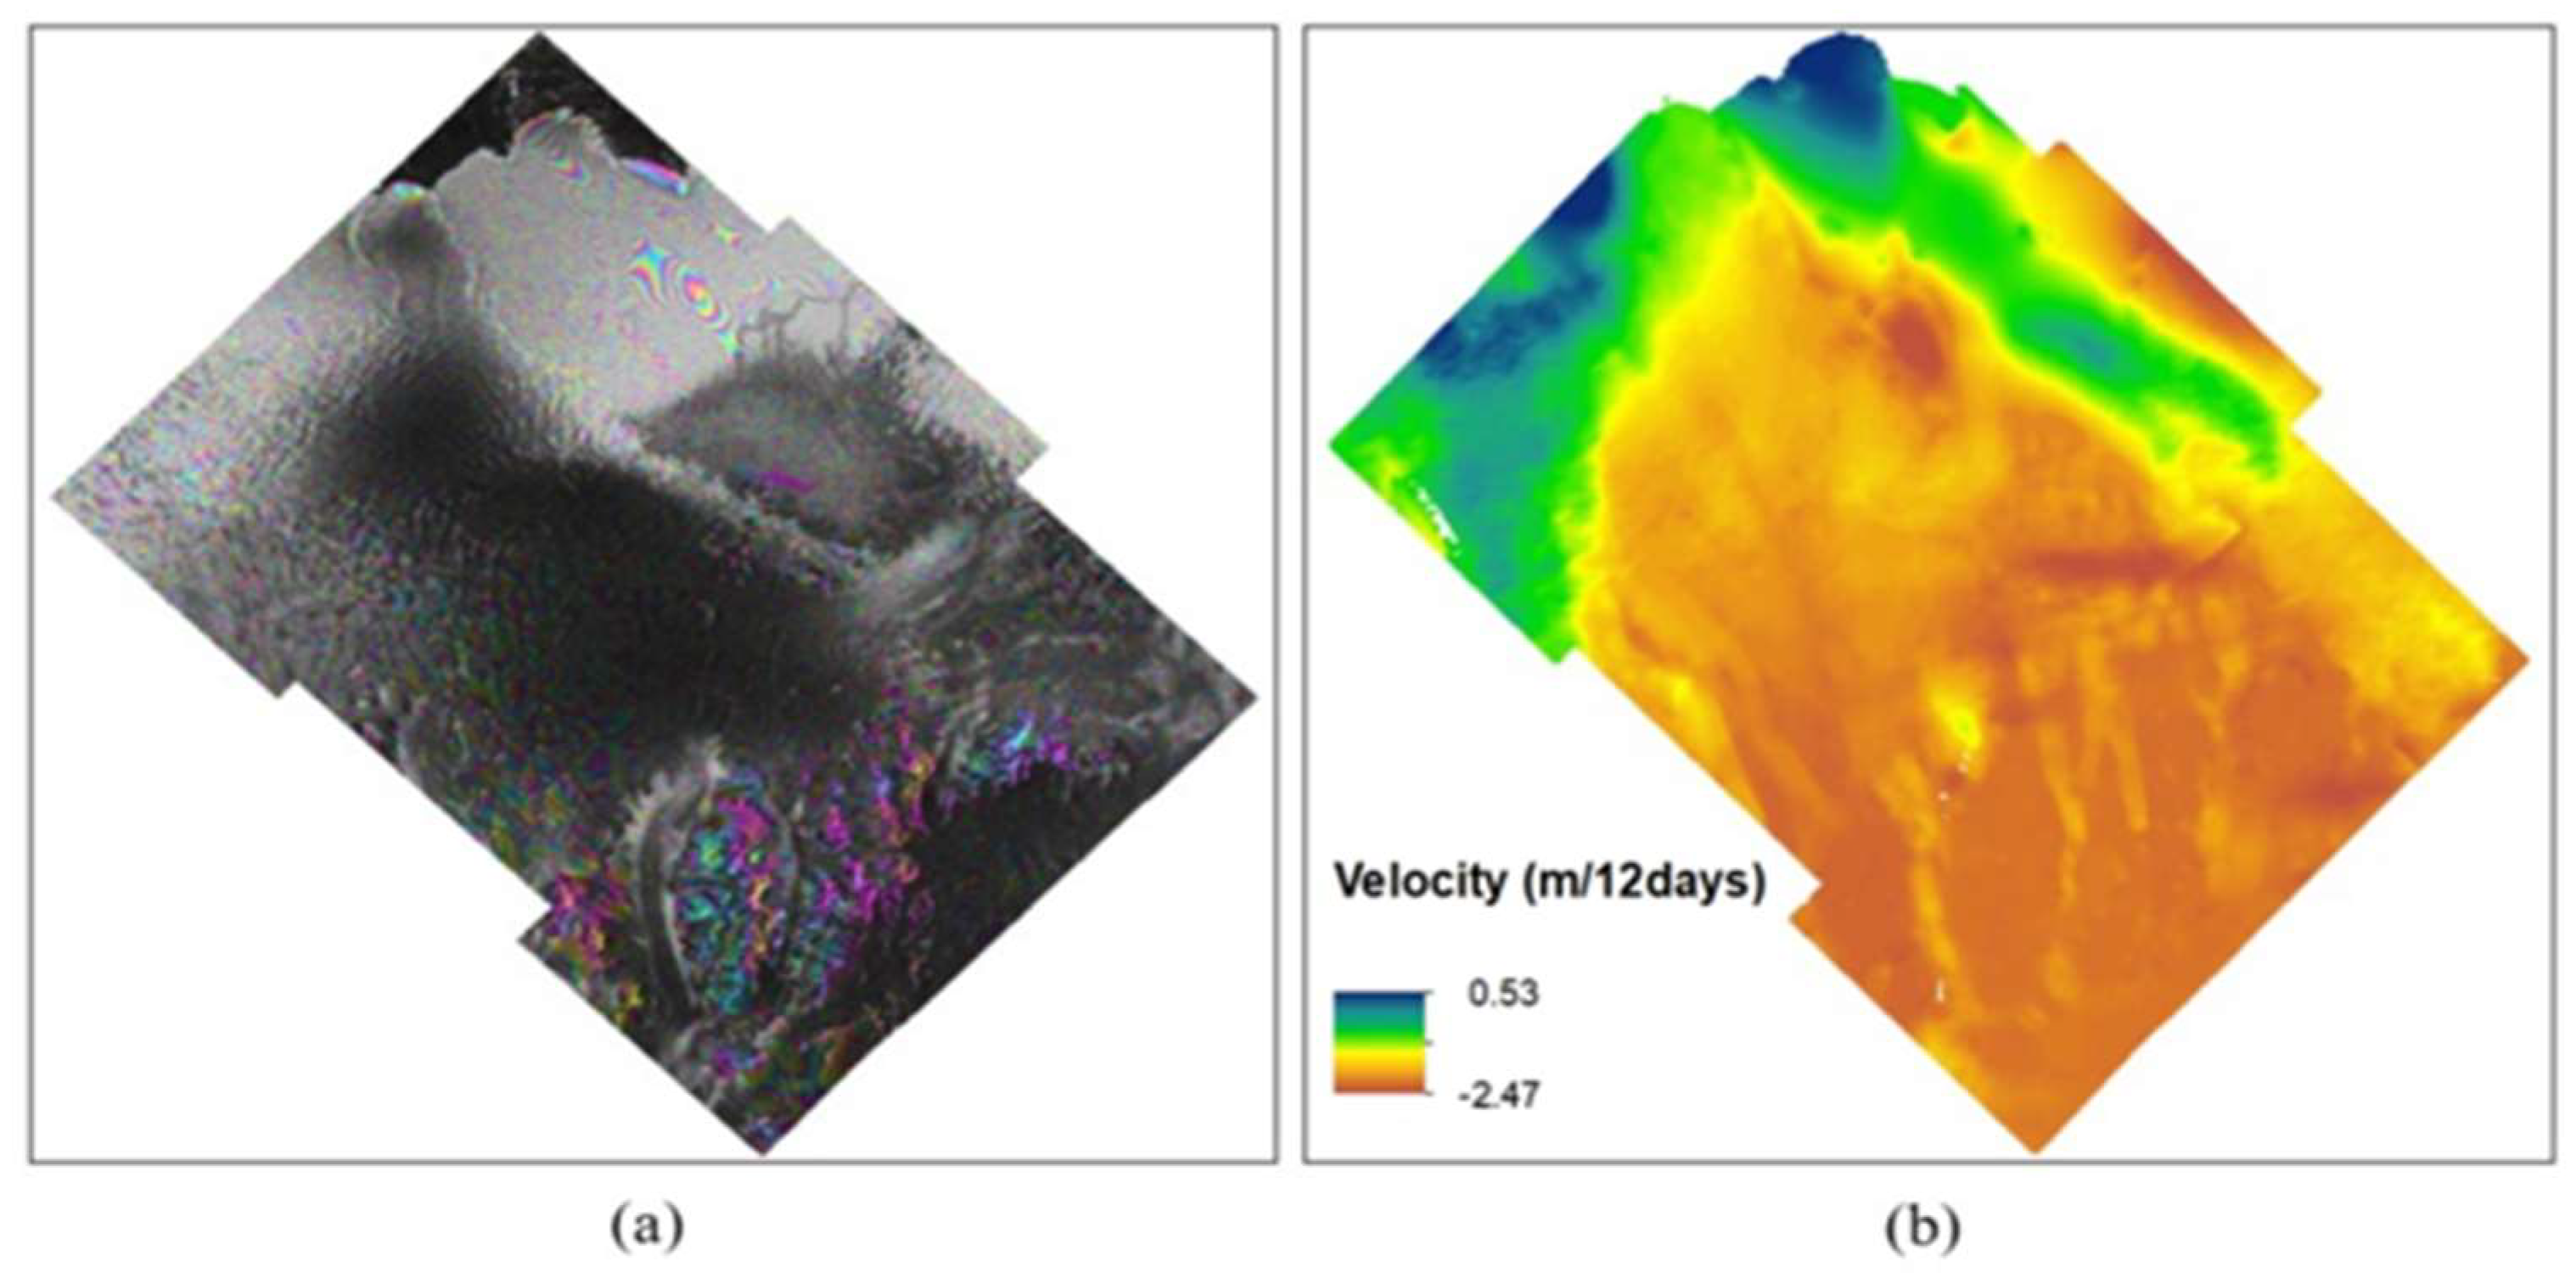
Seasonal surface ice flow velocity measurements collected during the austral summers of 2019–2023 are shown in Figure 8. Figure 9 displays the unwrapped phase and velocity map for 10 January and 22 January 2023 as an illustrative example. Over the course of the austral summers from 2019 to 2023, the ice velocity data reveal significant events that shaped the dynamics of the ice movement. The overall trend in ice velocity across the austral summers of 2019–2023 indicates dynamic and subtle patterns. Across all years, there is a consistent surge in ice velocity during mid-November, with values ranging from 2.13 to 2.23 m/12 days. This surge sets the initial pace for the ice dynamics during the austral summer. December exhibits varied patterns, with some years showing a decline in velocity, such as in 2019 and 2021, while others display temporary recoveries or fluctuations. This suggests a degree of instability and responsiveness to environmental conditions. January consistently emerges as the month with the highest ice velocities, reaching values like 2.11 to 2.41 m/12 days. This peak aligns with the peak melt season, indicating a potential correlation between increased velocity and melting dynamics. February displays fluctuations in velocity, with some years showing decreases from January levels, while others exhibit variations. The patterns in February underscore the complex relationship between ice dynamics and the later stages of the austral summer. There is a notable decline in velocity observed in the austral summer of 2021–2022, where both mean and maximum velocities show a decreasing trend. This decline suggests potential shifts in environmental conditions or ice shelf stability. Throughout the years, there is consistent variability in velocity values, emphasizing the dynamic nature of ice movement. The fluctuations and shifts in velocity indicate the responsiveness of the ice shelf to external factors. The analysis highlights a connection between surface melt and ice velocity. Higher maximum and mean velocity values consistently occur in January, coinciding with significant surface melting. December, with its fluctuations, suggests a period of instability and the onset of melting. The recurring observation of peak velocities in January across all years suggests the significance of this month in terms of ice dynamics and melting processes.

3.4. Influence of Seasonal Surface Melt on Surface Ice Flow Velocity

Surface ice flow velocity and surface melt are important parameters for understanding ice sheet dynamics and climate change impacts. Examining their relationship (Supplementary Figure S14) provides valuable insights into the interplay between ice dynamics and surface melt processes in Antarctica. Analyzing data and trends can reveal correlations and deepen our understanding of the region’s dynamics during austral summers.
In November 2019, the surface melt area increased to 1531 km2, and the velocity rose from 2.13 m/12 days to 2.18 m/12 days, indicating a positive correlation between surface melt and velocity. However, in December 2019, while the surface melt area expanded to 2102 km2, the velocity declined to 1.72 m/12 days, suggesting a possible decoupling. January 2020 showed a slight increase in both the surface melt area (2202 km2) and velocity (2.11 m/12 days), partially restoring the positive relationship. February 2020 exhibited significant increases, with a surface melt area of 3086 km2 and a peak velocity of 2.11 m/12 days. Overall, surface melt and velocity are positively correlated, indicating a feedback mechanism between them during the austral summer of 2019–2020.
In November 2020, the velocity decreased from 2.23 m/12 days to 1.81 m/12 days, while the surface melt area remained similar at 1519 km2, suggesting an inverse correlation. In December 2020, both the surface melt area and velocity fell to around 1239 km2 and 1.73 m/12 days, respectively, indicating a potential positive association. In January 2021, an increase in velocity to 2.41 m/12 days led to a significant rise in surface melt (2474 km2) during the peak melt season. However, in February 2021, both surface melt (1947 km2) and velocity (2.23 m/12 days) decreased, showing a weaker link.
In November 2021, the surface melt area increased to 1618 km2 while the velocity decreased to 1.33 m/12 days, suggesting an inverse correlation. By December 2021, the surface melt expanded to around 2392 km2, accompanied by a slight velocity increase to 2.22 m/12 days. In January 2022, the surface melt area decreased to 2177 km2, possibly influenced by precipitation and fluctuating velocity. In February 2022, the surface melt area further declined to 1702 km2, and the velocity remained erratic. This analysis indicates a complex interaction between surface melt and velocity during the 2021–2022 austral summer, influenced by temperature, precipitation, and other factors.
In November 2022, the velocity remained constant at 2.23 m/12 days while the surface melt area rose to 3187 km2, indicating a potential positive correlation. However, in December 2022, despite a decrease in surface melt area to 3083 km2, the velocity also decreased, suggesting a weakening association. In January 2023, the surface melt area further decreased to 2735 km2, while the velocity fluctuated, highlighting the complex relationship. A subsequent increase in both surface melt area (3725 km2) and velocity in February 2023 may signify the restoration of a positive link. The analysis predicts a dynamic interaction between surface melt and velocity during the 2022–2023 austral summer, influenced by temperature, precipitation, and wind patterns.
The analysis of ice flow dynamics in both melt and non-melt regions of the Nivlisen Ice Shelf (NIS) using profiles R1–R4 provides valuable insights into the behavior of this critical Antarctic region during the austral summers from 2019 to 2023. Four linear profiles (R1, R2, R3, and R4) were selected manually based on visual interpretation, spanning the NIS with a length of 30 km each (Figure 10). R1 and R2 represent the melt regions of the ice shelf, while R3 and R4 represent the non-melt regions. Profile R1, situated in the northwest melt region of NIS, exhibited varying ice flow patterns during the minimum and maximum surface melt extent (SME) periods (Supplementary Figure S15). Notably, during the austral summer of 2020–2021, there was a substantial increase in velocity, indicating a significant response to melting processes. This suggests a close relationship between surface melting and ice flow dynamics in this region. However, this correlation was not consistently observed in other years, with varying velocity patterns during different melt seasons. Beyond a 10 km distance, the velocity showed an upward trend, possibly due to the topography of an ice rise/rumple feature that supported ice flow. Profile R2, located at the grounding line above the Schirmacheroasen in the southern melt region, showed relatively consistent velocity patterns across the examined years, with average and maximum ice flow rates of around 1 m/12 days and 1.4 m/12 days, respectively (Supplementary Figure S16). However, the austral summer of 2021–2022 saw a significant decrease in velocity, indicating a potential impact of melt ponds near the grounding line on ice flow dynamics. As the distance increased from the grounding line, the ice flow gradually declined, likely due to reduced melting or the absence of water bodies. Beyond 15 km, linear water bodies were observed, which corresponded with reduced ice flow, suggesting limited meltwater availability in those areas. Profiles R3 and R4, representing the non-melt regions of the NIS, exhibited relatively stable velocity patterns throughout the examined austral summer periods (Supplementary Figure S17). The consistent velocities observed during the austral summers of 2019–2020, 2020–2021, and 2022–2023 indicate minimal variation in ice flow in these regions. While there was a slight increase in the maximum velocity during the austral summer of 2021–2022, the average velocity remained relatively constant, suggesting a stable ice flow with limited fluctuations. The gradual increase in velocity with distance in both R3 and R4 indicates a decreasing slope towards the ocean, influencing ice flow dynamics in these non-melt regions. The analysis of these profiles highlights the complex interplay between surface melting, topography, and ice flow dynamics in the Nivlisen Ice Shelf. It underscores the need for a comprehensive understanding of these factors to predict and assess the behavior of Antarctic ice shelves in response to changing environmental conditions.

3.5. Field-Based Melt Pond Depth and Surface Ice Flow Velocity

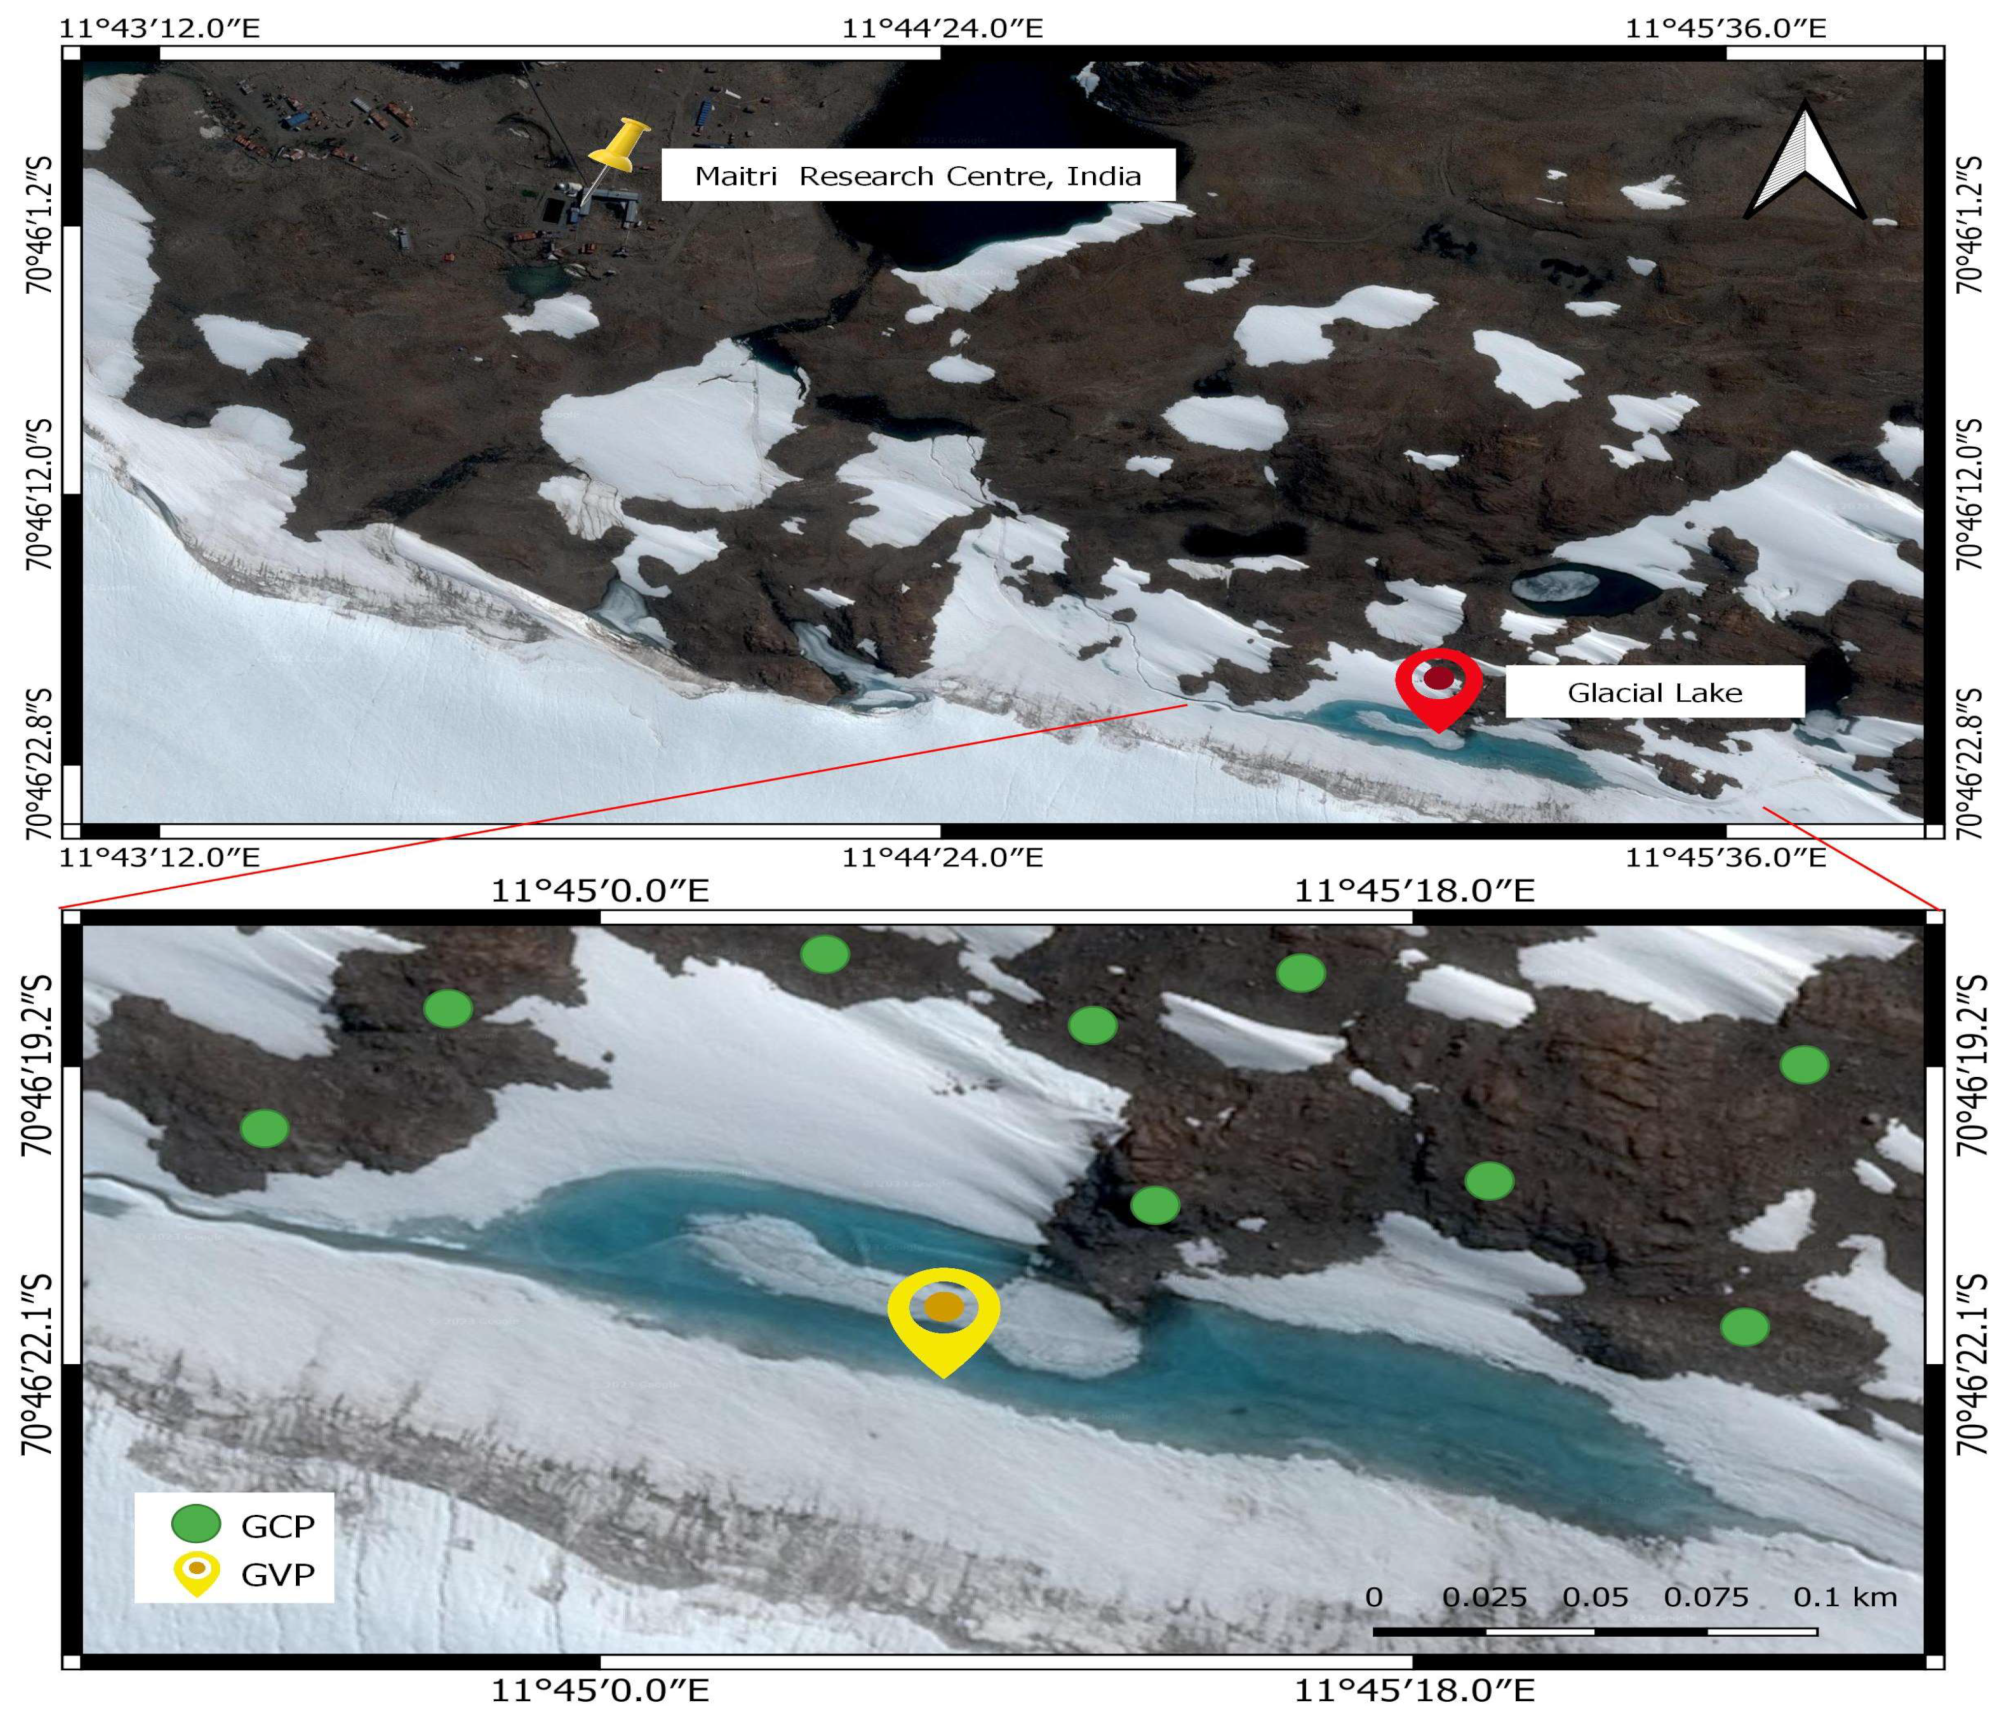
The fieldwork was conducted during the austral summer period of 2022–2023 as a part of the 42nd Indian scientific expedition to Antarctica. During the fieldwork, a melt pond (Figure 11 shows GCPs (ground control points), and the GVP (ground validation point)) was considered near the Maitri, Indian research base (due to logistical feasibility) located at (11°45′6.786″E, 70°46′22.475″S) in Dronning Maud Land, East Antarctica, for installation of a pressure sensor assembly (PSA) [57]. Due to the unavailability of cloud-free satellite-based optical data over the selected melt pond, an unmanned aerial survey was carried out over the selected melt pond using a P4 multispectral sensor. Details about the pressure sensor and UAV sensor used are given in Supplementary Table S3. A radiative transfer model was employed to estimate the depth of the melt pond using multispectral data collected from the UAV [58]. The estimated depth profile is presented in Figure 12. The model-based results were compared with measurements obtained through PSA and manual measurements. The comparison is summarized in Table 1. Variations in the recorded depths of the melt ponds arise from uncertainties and the discrepancy in timing between the measurements and aerial surveys conducted at various intervals throughout the observation day. Figure 12 illustrates the regression analysis conducted to compare the field-based depth measurements with the model-based results. The Pearson’s correlation coefficient of 0.9 indicates a strong linear positive correlation between the two datasets. The comparison was performed by calculating the root-mean-square error (RMSE) between the physical in situ measurements obtained at the field points and the results derived from the model.
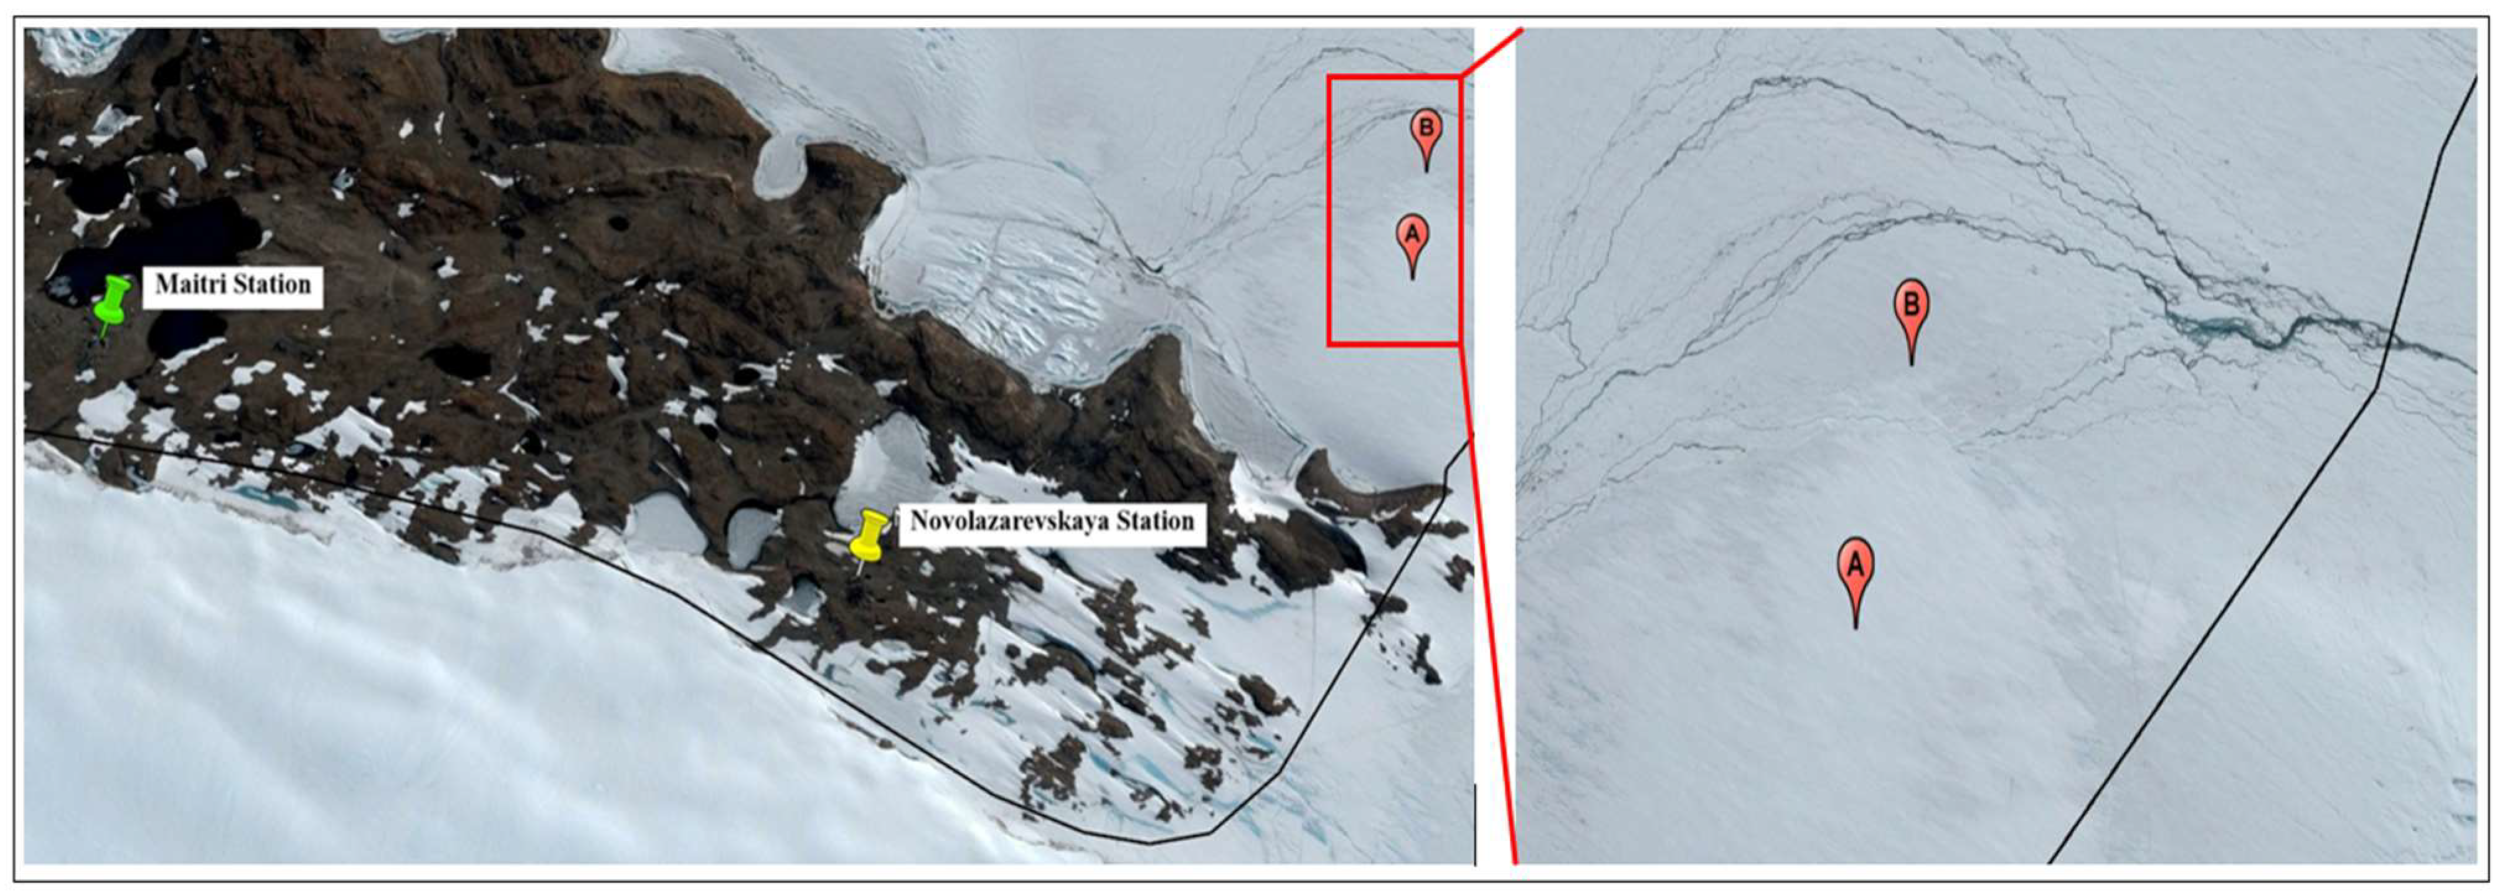
Similarly, field validation of the ice flow was conducted using SP80 Spectra Precision GNSS receivers with two ground control points (GCPs) established near the grounding line of the NIS from 29 December 2022 to 10 January 2023, with a 12-day interval (Figure 13). This data collection timeframe was synchronized with the Sentinel-1 satellite data acquisition. The obtained velocity values from both the GNSS and DInSAR processes for the NIS are presented in Supplementary Figure S21. It is important to note that uncertainties exist, and discrepancies in the measured velocity are observed due to the different nature of the measurements. The GNSS-based velocity provides a 3D measurement, while the DInSAR-based measurement is in the line-of-sight (LOS) direction. These differences, along with uncertainties, contribute to the observed variations in the measured velocity.

4. Discussion

The dynamics of melt ponds and supraglacial lakes (SGLs) in the NIS, East Antarctica, as detailed in this study covering the austral summers from 2000 to 2023, offer a comprehensive view of the intricate relationship between temperature fluctuations and the characteristics of these ice features. The study revealed intriguing patterns over the years. In the early 2000s, there were variations in the depth, area, and volume of the melt ponds and SGLs, with 2003 showing a decrease in depth and volume but an increase in the area covered [2,30]. This complexity continued into the late 2000s when 2008 marked a peak in depth, area, and volume, possibly influenced by higher temperatures. From 2015 to 2020, significant fluctuations were observed in the maximum depth, area, and volume of these ice features [5,12,32,52,53]. Notably, 2016 stood out, with the highest recorded depth and volume, highlighting the strong correlation with temperature variations [12,32]. The following years also demonstrated a relationship between elevated temperatures and increased depth and volume. The austral summers from 2020 to 2023 showed further insights into this dynamic interplay. Higher values of depth, area, and volume were noted in 2020–2021 due to elevated temperatures, but drainage mechanisms began to play a role in reducing these values by 2021–2022. Finally, in 2022–2023, while higher values were observed initially, a subsequent temperature drop and drainage mechanisms led to a decrease in these parameters. These findings align with the predictions of the IPCC report (March 2022) and [1] for increasing surface meltwater coverage and volume on Antarctic ice shelves due to rising temperatures. The NIS experienced its peak supraglacial lake volumes in 2016 and 2019, measuring 3736 m3 and 3329 m3, respectively. During the austral summer of 2019, a remarkable surface melt rate of 308 km2 per 12 days was observed. Additionally, an independent study also noted a peak in the volume of supraglacial lakes on the Amery ice shelf in 2019 [32]. The uncertainty in volume (V) estimation has been approximated to be ±0.85 m3 for a non-uniform-shaped melt pond, typically obtained by integrating the depth (h) of the pond over its entire surface area (A) with respect to the spatial coordinates (x,y). However, the specific form of h(x,y) (depth of melt pond as a function of (x,y)) would depend on the data and the modeling techniques used to estimate the melt pond depth in practice.
This study on seasonal surface melt and surface ice flow velocity variations of the NIS in East Antarctica, focusing on the austral summers from 2019 to 2023, provides valuable insights into the complex dynamics of this region. However, it is important to acknowledge the data constraints that posed a significant challenge in the study. While this provides a valuable snapshot of recent conditions, a longer-term perspective would have been beneficial for understanding historical trends and assessing whether the observed patterns are part of natural variability or indicative of long-term changes. The analysis of surface melt during the austral summers of 2019–2020, 2020–2021, 2021–2022, and 2022–2023 demonstrates distinct patterns and trends. The surface melt areas varied across the different years, with some years exhibiting higher melt extents compared to others. The influence of temperature fluctuations and precipitation on surface melt is evident, as they contribute to both the expansion and reduction of melt areas [56]. Additionally, external factors such as freezing winds [9] and the albedo effect can influence the extent of surface melting. The observations in surface ice flow velocity highlight the variations during different austral summer periods. Higher maximum and mean velocity values consistently occur in January during the austral summers from 2019 to 2023, indicating significant melting. December exhibits greater velocity fluctuations, suggesting instability and the onset of melting. In terms of ice dynamics, the average ice flow velocity on Nivlisen during the austral summer was calculated at 1.5 m per 12 days, while a separate investigation indicated that the NIS exhibited a higher ice flow velocity of 2.6 m per 12 days [49]. However, it is essential to recognize that the velocity of the ice shelf can exhibit variations attributable to multiple factors, including ice thickness and the presence of supraglacial lakes, as demonstrated by another study [59].
Understanding the connection between velocity and surface melting is crucial for ice shelf dynamics and stability [4]. The present study reveals that different austral summer periods resulted in different relationships between surface melt and surface ice flow velocity. While certain favorable correlations (such as in November 2019 and February 2023) were identified, there were also instances of weak correlation or dissociation (such as in December 2019 and January 2021). The observed fluctuations may be influenced by additional elements such as wind patterns, precipitation, and specific local conditions. The analysis and interpretation of the links might be impacted by data gaps and the frequency of data collection. Additionally, incorporating field observations and measurements taken on the ground has improved the analysis’s precision and dependability. In regions adjacent to the NIS that are considered stable (Schirmacheroasen), a buffer of three pixels (equivalent to approximately 90 m) was applied to compare the velocities in ice and ice-free zones. Utilizing nearly 200 samples, the root-mean-square deviation (RMSD) was found to be approximately 0.05 m/12 days.
The present study analyzed the surface melt of the NIS, which is 130 m wide and 80 m long [2] with a large number of melt ponds and SGLs. The parameters studied were highly dynamic and varied in temporal and spatial evolution [54]. The depth estimation over the NIS was limited only to the spatial extent from 70.3823°S, 10.3667°E to 76.7242°S, 12.8838°E. This study is confined to the surface melt in the form of melt ponds and SGLs during the period from 2000 to 2023. Various factors such as (a) large or small debris slumps, (b) ice calving, (c) katabatic wind effect, (d) pond floor collapse, (e) subaqueous melt, (f) structural collapse, and (g) variations in water storage caused by a changing balance between water filling (melting) and drainage (discharge) are not considered in detecting the changes in pond/lake water level. Considering Antarctica’s dynamic nature, characterized by swift transformations, distinct austral summer periods led to varying connections between surface melting and displacement, making it difficult to formulate an equation to reflect the interaction between seasonal surface melt and surface ice flow velocity, and to consider the effects of temperature, precipitation, and wind speed in the equation. Upcoming research endeavors, which will take into account a thorough analysis and interpretation of the connections affected by data gaps and the frequency of data collection, will systematically unveil the underlying mechanisms driving the melting process in the study area.

5. Conclusions

A comprehensive analysis was conducted on the NIS, East Antarctica, focusing on the parameters of supraglacial lakes (SGLs), seasonal surface melt extent, and surface ice flow velocity. Monitoring meltwater is crucial to evaluate the potential destabilization of ice shelves. Relative to the year 2000, the depth, area, and volume of SGLs in the NIS have increased. Over the years from January 2003 to January 2023, the depth and volume of melt ponds grew by a factor of 1.5, while the area increased by a factor of 1.2. While SGL development is limited in the middle of the ice shelf, surface lakes are frequently observed in its interior regions. These cyclic variations in total lake area lead to fluctuations in meltwater volume during the melt season. Limited data enabled the prediction and analysis of seasonal surface melts and surface ice flow velocity fluctuations in the NIS, with a focus on the austral summers of 2019–2023. The findings of this study provide essential data for assessing the sensitivity of NIS to climate change and making future projections on sea level rise, particularly regarding surface melting, melt ponds/SGLs, and their impact on ice flow velocity. The impact of meltwater on an ice shelf depends on its quantity, distribution, and the overall state and stability of the ice shelf. With climate change leading to unprecedented polar ice melting, scientists and policymakers are increasingly concerned about the effects of meltwater on ice shelves. It is anticipated that SGL coverage and volume will significantly increase under enhanced atmospheric warming, particularly in ice-shelf regions susceptible to hydrofracture. In our future work, we plan to delve deeper into this area of research, exploring additional variables and conducting more extensive experiments to gain a more comprehensive understanding of the phenomena under investigation.

Supplementary Materials

The following supporting information can be downloaded at: https://www.mdpi.com/article/10.3390/rs15245676/s1, Figure S1: (a) The average temperature for the austral summers of 2000 to 2014 (b) The average temperature for the austral summers of 2014 to 2023 (c) The maximum temperature for the austral summers of 2000 to 2014 (d) The maximum temperature for the austral summers of 2014 to 2023; Figure S2: Model-based melt pond depth at peak melting in the austral summers of 2000–2014; Figure S3: Model-based melt pond depth model for the austral summer of 2015–2016; Figure S4: Model-based melt pond depth for the austral summer of 2016–2017; Figure S5: Model-based melt pond depth model for the austral summer of 2017–2018; Figure S6: Model-based melt pond depth model for the austral summer of 2018–2019; Figure S7: Model-based melt pond depth for the austral summer of 2019–2020; Figure S8: Model-based melt pond depth for the austral summer of 2020–2021; Figure S9: Model-based melt pond depth for the austral summer of 2021–2022; Figure S10: The surface melt extent (SME) map over NIS for the austral summer 2019–2020; Figure S11: The surface melt extent (SME) map over NIS for the austral summer 2020–2021; Figure S12: The surface melt extent (SME) map over NIS for the austral summer 2021–2022; Figure S13: Precipitation (mm) for the four austral summers considered for SME (2019–2020, 2020–2021, 2021–2022, and 2022–2023); Figure S14: SME versus the surface ice flow velocity for the austral summers 2019–2023; Figure S15: Profile R1 drawn over a melt region during (a) minimum surface melt and (b) maximum surface melt periods during austral summers of 2019–2023; Figure S16: Profile R2 drawn over a melt region during (a) minimum surface melt and (b) maximum surface melt periods during austral summers of 2019–2023; Figure S17: Profile R3 & R4 drawn over the non-melt regions during austral summers of 2019–2023 (a) R3 in minimum surface melt period, and (b) R3 in maximum surface melt period (c) R4 in minimum surface melt period, and (d) R4 in maximum surface melt period; Figure S18: The UAV survey over the glacial lake with P4 multispectral sensor; Figure S19: Average pressure and temperature obtained from the pressure sensor installed on the selected glacial lake/melt pond for 25 days during the austral summer 2022–2023; Figure S20: (a) Manual measurement of the depth over selected melt pond at different locations (b) The PSA setup installed at the site with the GVP i.e., location of the setup (using printed white crosses); Figure S20: The velocity (m/12 days) recorded using GNSS and DInSAR at the GCP points point A and B during the period of 29 December 2022 to 10 January 2023; Table S1: Details about the sensor used for field validation i.e., pressure sensor for depth estimation (equivalent water level) and a multispectral sensor for estimating the depth over the melt pond using MPD model; Table S2: Data used for estimating the surface melt extent and surface ice flow velocity over the Nivlisen ice shelf for the austral summer (November to February) of 2019–2020, 2020–2021, 2021–2022, and 2022–2023; Table S3: Data used for estimating the Depth of Melt Ponds and SGLs for the Austral summer (NDJF) of the years 2000–2023 (path 165–166 and row 110) and due to cloud cover, there were data gaps for the years 2002, 2004, 2005, 2006, 2009, and 2013 [60].

Author Contributions

Conceptualization, G.P.M.; data curation, R.K.R.B., M.B., R.C., D.S., S.S. and D.J.A.; formal analysis, A.J.L.; investigation, G.P.M.; methodology, G.P.M., R.K.R.B., M.B., R.C., D.S. and D.J.A.; project administration, G.P.M. and K.V.; resources, N.K.M.; software, R.K.R.B., M.B., R.C., D.S. and D.J.A.; supervision, G.P.M. and K.V.; validation, G.P.M.; writing—original draft, G.P.M. and S.S. All authors have read and agreed to the published version of the manuscript.

Funding

This research was funded by the National Centre for Polar and Ocean Research, Ministry of Earth Sciences, Govt. of India under the Indian Scientific Expedition to Antarctica (ISEA) with project code 42-AMOS/OR-06(2) to undertake this research alongside funding support rendered by Prazim Trading and Investment Company Private Limited (PTICL/CIIRC dt 31/03/2023), Bengaluru, MM Forgings (MMF/CIIRC dt 08/07/2022), Chennai and Tata Steel (TS/CIIRC dt 19/12/2022), Kolkata. The APC was funded by CIIRC, Jyothy Institute of Technology, Bengaluru.

Data Availability Statement

The data that support the findings of this study are available from the corresponding author upon request.

Acknowledgments

The authors gratefully acknowledge the support rendered by Jyothy Industries, Rational Technologies and CIIRC, Jyothy Institute of Technology, Bengaluru.

Conflicts of Interest

The authors declare no conflict of interest.

References

  1. Bell, R.E.; Chu, W.; Kingslake, J.; Das, I.; Tedesco, M.; Tinto, K.J.; Zappa, C.J.; Frezzotti, M.; Boghosian, A.; Lee, W.S. Antarctic ice shelf potentially stabilized by export of meltwater in surface river. Nature 2017, 544, 344–348. [Google Scholar] [CrossRef] [PubMed]
  2. Dell, R.; Arnold, N.; Willis, I.; Banwell, A.; Williamson, A.; Pritchard, H.; Orr, A. Lateral meltwater transfer across an Antarctic ice shelf. Cryosphere 2020, 14, 2313–2330. [Google Scholar] [CrossRef]
  3. Arthur, J.F.; Stokes, C.R.; Jamieson, S.S.R.; Carr, J.R.; Leeson, A.A. Distribution and seasonal evolution of supraglacial lakes on Shackleton Ice Shelf, East Antarctica. Cryosphere 2020, 14, 4103–4120. [Google Scholar] [CrossRef]
  4. Tuckett, P.A.; Ely, J.C.; Sole, A.J.; Lea, J.M.; Livingstone, S.J.; Jones, J.M.; van Wessem, J.M. Automated mapping of the seasonal evolution of surface meltwater and its links to climate on the Amery Ice Shelf, Antarctica. Cryosphere 2021, 15, 5785–5804. [Google Scholar] [CrossRef]
  5. Sneed, W.A.; Hamilton, G.S. Evolution of melt pond volume on the surface of the Greenland Ice Sheet. Geophys. Res. Lett. 2007, 34, 4–7. [Google Scholar] [CrossRef]
  6. Stevens, L.A.; Behn, M.D.; McGuire, J.J.; Das, S.B.; Joughin, I.; Herring, T.; Shean, D.E.; King, M.A. Greenland supraglacial lake drainages triggered by hydrologically induced basal slip. Nature 2015, 522, 73–76. [Google Scholar] [CrossRef] [PubMed]
  7. Husman, S.d.R.; Hu, Z.; Wouters, B.; Munneke, P.K.; Veldhuijsen, S.; Lhermitte, S. Remote Sensing of Surface Melt on Antarctica: Opportunities and Challenges. IEEE J. Sel. Top. Appl. Earth Obs. Remote Sens. 2022, 16, 2462–2480. [Google Scholar] [CrossRef]
  8. Luis, A.J.; Alam, M.; Jawak, S.D. Spatiotemporal change analysis for snowmelt over the Antarctic ice shelves using scatterometers. Front. Remote Sens. 2022, 3, 953733. [Google Scholar] [CrossRef]
  9. Saunderson, D.; Mackintosh, A.; McCormack, F.; Jones, R.S.; Picard, G. Surface melt on the Shackleton Ice Shelf, East Antarctica (2003–2021). Cryosphere 2022, 16, 4553–4569. [Google Scholar] [CrossRef]
  10. Patricio-valerio, L.; Shaw, J.; Gonzalez, F. Contemporary Remote Sensing Tools for Integrated Assessment and Conservation Planning of Ice-free Antarctica. arXiv 2022. preprint. [Google Scholar]
  11. Rintoul, S.R. The global influence of localized dynamics in the Southern Ocean. Nature 2018, 558, 209–218. [Google Scholar] [CrossRef] [PubMed]
  12. Geetha, P.M.; Deva, J.A.R.; Alvarinho, J.L.; Bahuguna, I. Estimation of surface melt induced melt pond depths over Amery Ice Shelf, East Antarctica using Multispectral and ICESat-2 data. Disaster Adv. 2022, 15, 1–8. [Google Scholar] [CrossRef]
  13. Jakobs, C.L.; Reijmer, C.H.; Smeets, C.J.P.P.; Trusel, L.D.; van de Berg, W.J.; Broeke, M.R.v.D.; van Wessem, J.M. A benchmark dataset of in situ Antarctic surface melt rates and energy balance. J. Glaciol. 2020, 66, 291–302. [Google Scholar] [CrossRef]
  14. Baumhoer, C.A.; Dietz, A.J.; Dech, S.; Kuenzer, C. Remote Sensing of Antarctic Glacier and Ice-Shelf Front Dynamics—A Review. Remote Sens. 2018, 10, 1445. [Google Scholar] [CrossRef]
  15. Ghiz, M.L.; Scott, R.C.; Vogelmann, A.M.; Lenaerts, J.T.M.; Lazzara, M.; Lubin, D. Energetics of surface melt in West Antarctica. Cryosphere 2021, 15, 3459–3494. [Google Scholar] [CrossRef]
  16. Mortimer, C.A.; Sharp, M.; Wouters, B. Glacier surface temperatures in the Canadian High Arctic, 2000–15. J. Glaciol. 2016, 62, 963–975. [Google Scholar] [CrossRef]
  17. Hall, D.K.; Nghiem, S.V.; Schaaf, C.B.; DiGirolamo, N.E.; Neumann, G. Evaluation of surface and near-surface melt characteristics on the Greenland ice sheet using MODIS and QuikSCAT data. J. Geophys. Res. Earth Surf. 2009, 114, 1–13. [Google Scholar] [CrossRef]
  18. Liang, D.; Guo, H.; Zhang, L.; Cheng, Y.; Zhu, Q.; Liu, X. Time-series snowmelt detection over the Antarctic using Sentinel-1 SAR images on Google Earth Engine. Remote Sens. Environ. 2021, 256, 112318. [Google Scholar] [CrossRef]
  19. Colosio, P.; Tedesco, M.; Ranzi, R.; Fettweis, X. Surface melting over the Greenland ice sheet derived from enhanced resolution passive microwave brightness temperatures (1979–2019). Cryosphere 2021, 15, 2623–2646. [Google Scholar] [CrossRef]
  20. König, M.; Oppelt, N. A linear model to derive melt pond depth on Arctic sea ice from hyperspectral data. Cryosphere 2020, 14, 2567–2579. [Google Scholar] [CrossRef]
  21. Dell, R.L.; Banwell, A.F.; Willis, I.C. Erratum: Supervised classification of slush and ponded water on Antarctic ice shelves using Landsat 8 imagery. J. Glaciol. 2022, 68, 401–414. [Google Scholar] [CrossRef]
  22. Moussavi, M.; Pope, A.; Halberstadt, A.R.W.; Trusel, L.D.; Cioffi, L.; Abdalati, W. Antarctic Supraglacial Lake Detection Using Landsat 8 and Sentinel-2 Imagery: Towards Continental Generation of Lake Volumes. Remote Sens. 2020, 12, 134. [Google Scholar] [CrossRef]
  23. Hawes, I.; Safi, K.; Sorrell, B.; Webster-Brown, J.; Arscott, D. Summer–winter transitions in Antarctic ponds I: The physical environment. Antarct. Sci. 2011, 23, 235–242. [Google Scholar] [CrossRef]
  24. Leppäranta, M.; Luttinen, A.; Arvola, L. Physics and geochemistry of lakes in Vestfjella, Dronning Maud Land. Antarct. Sci. 2020, 32, 29–42. [Google Scholar] [CrossRef]
  25. Liu, C.; Hu, R.; Wang, Y.; Lin, H.; Zeng, H.; Wu, D.; Liu, Z.; Dai, Y.; Song, X.; Shao, C. Monitoring water level and volume changes of lakes and reservoirs in the Yellow River Basin using ICESat-2 laser altimetry and Google Earth Engine. J. Hydro-Environ. Res. 2022, 44, 53–64. [Google Scholar] [CrossRef]
  26. Lombardi, D.; Gorodetskaya, I.; Barruol, G.; Camelbeeck, T. Thermally induced icequakes detected on blue ice areas of the East Antarctic ice sheet. Ann. Glaciol. 2019, 60, 45–56. [Google Scholar] [CrossRef]
  27. Jakobs, C.L.; Reijmer, C.H.; Broeke, M.R.v.D.; van de Berg, W.J.; van Wessem, J.M. Spatial Variability of the Snowmelt-Albedo Feedback in Antarctica. J. Geophys. Res. Earth Surf. 2021, 126, e2020JF005696. [Google Scholar] [CrossRef]
  28. Kargel, J.S.; Leonard, G.J.; Bishop, M.P.; Kääb, A.; Raup, B.H. Global Land Ice Measurements from Space; Springer: Dordrecht, The Netherlands, 2014. [Google Scholar] [CrossRef]
  29. Fricker, H.A.; Arndt, P.; Brunt, K.M.; Datta, R.T.; Fair, Z.; Jasinski, M.F.; Kingslake, J.; Magruder, L.A.; Moussavi, M.; Pope, A.; et al. ICESat-2 Meltwater Depth Estimates: Application to Surface Melt on Amery Ice Shelf, East Antarctica. Geophys. Res. Lett. 2021, 48, e2020GL090550. [Google Scholar] [CrossRef]
  30. Arthur, J.F.; Stokes, C.; Jamieson, S.S.; Carr, J.R.; Leeson, A.A. Recent understanding of Antarctic supraglacial lakes using satellite remote sensing. Prog. Phys. Geogr. Earth Environ. 2020, 44, 837–869. [Google Scholar] [CrossRef]
  31. Buzzard, S.C.; Feltham, D.L.; Flocco, D. A Mathematical Model of Melt Lake Development on an Ice Shelf. J. Adv. Model. Earth Syst. 2018, 10, 262–283. [Google Scholar] [CrossRef]
  32. Arthur, J.F.; Stokes, C.R.; Jamieson, S.S.R.; Carr, J.R.; Leeson, A.A.; Verjans, V. Large interannual variability in supraglacial lakes around East Antarctica. Nat. Commun. 2022, 13, 1711. [Google Scholar] [CrossRef] [PubMed]
  33. Halas, P.; Mouginot, J.; de Fleurian, B.; Langebroek, P.M. Impact of seasonal fluctuations of ice velocity on decadal trends observed in Southwest Greenland. Remote Sens. Environ. 2023, 285, 113419. [Google Scholar] [CrossRef]
  34. Lampkin, D.J.; Karmoskay, C.C. Surface melt magnitude retrieval over Ross Ice Shelf, Antarctica using coupled MODIS near-IR and thermal satellite measurements. Cryosphere Discuss. 2009, 3, 1069–1107. [Google Scholar] [CrossRef]
  35. Alley, K. Studies of Antarctic Ice Shelf Stability: Surface Melting, Basal Melting, and Ice Flow Dynamics. Ph.D. Thesis, University of Colorado, Boulder, CO, USA, 2017. [Google Scholar]
  36. Mahagaonkar, A.; Moholdt, G.; Schuler, T.V. Recent Evolution of Supraglacial Lakes on ice shelves in Dronning, Maud Land, East Antarctica. Cryosphere Discuss. 2023, 1–28. [Google Scholar] [CrossRef]
  37. Dirscherl, M.; Dietz, A.J.; Kneisel, C.; Kuenzer, C. Automated Mapping of Antarctic Supraglacial Lakes Using a Machine Learning Approach. Remote Sens. 2020, 12, 1203. [Google Scholar] [CrossRef]
  38. Izeboud, M.; Lhermitte, S. Damage detection on antarctic ice shelves using the normalised radon transform. Remote Sens. Environ. 2023, 284, 113359. [Google Scholar] [CrossRef]
  39. Gardner, A.S.; Sharp, M.J. A review of snow and ice albedo and the development of a new physically based broadband albedo parameterization. J. Geophys. Res. Earth Surf. 2010, 115, 1–15. [Google Scholar] [CrossRef]
  40. Hirsch, N.; Zuhr, A.; Münch, T.; Hörhold, M.; Freitag, J.; Dallmayr, R.; Laepple, T. Stratigraphic noise and its potential drivers across the plateau of Dronning Maud Land, East Antarctica. Cryosphere 2023, 17, 4207–4221. [Google Scholar] [CrossRef]
  41. Simon, S.; Turner, J.; Thamban, M. Spatiotemporal variability of extreme precipitation events and associated atmospheric processes over Dronning Maud Land, East Antarctica. Authorea Prepr. 2023. preprint. [Google Scholar]
  42. Vaňková, I.; Cook, S.; Winberry, J.P.; Nicholls, K.W.; Galton-Fenzi, B.K. Deriving Melt Rates at a Complex Ice Shelf Base Using In Situ Radar: Application to Totten Ice Shelf. Geophys. Res. Lett. 2021, 48, GL092692. [Google Scholar] [CrossRef]
  43. Bell, R.E.; Banwell, A.F.; Trusel, L.D.; Kingslake, J. Antarctic surface hydrology and impacts on ice-sheet mass balance. Nat. Clim. Change 2018, 8, 1044–1052. [Google Scholar] [CrossRef]
  44. Cook, A.J.; Vaughan, D.G. Overview of areal changes of the ice shelves on the Antarctic Peninsula over the past 50 years. Cryosphere 2010, 4, 77–98. [Google Scholar] [CrossRef]
  45. Aoki, S.; Takahashi, T.; Yamazaki, K.; Hirano, D.; Ono, K.; Kusahara, K.; Tamura, T.; Williams, G.D. Warm surface waters increase Antarctic ice shelf melt and delay dense water formation. Commun. Earth Environ. 2022, 3, 142. [Google Scholar] [CrossRef]
  46. Kingslake, J.; Ely, J.C.; Das, I.; Bell, R.E. Widespread movement of meltwater onto and across Antarctic ice shelves. Nature 2017, 544, 349–352. [Google Scholar] [CrossRef]
  47. Trusel, L.D.; Pan, Z.; Moussavi, M. Repeated Tidally Induced Hydrofracture of a Supraglacial Lake at the Amery Ice Shelf Grounding Zone. Geophys. Res. Lett. 2022, 49, e2021GL095661. [Google Scholar] [CrossRef]
  48. Trusel, L.D.; Frey, K.E.; Das, S.B. Antarctic surface melting dynamics: Enhanced perspectives from radar scatterometer data. J. Geophys. Res. Atmos. 2012, 117, JF002126. [Google Scholar] [CrossRef]
  49. Rignot, E.; Mouginot, J.; Scheuchl, B. Ice Flow of the Antarctic Ice Sheet. Science 2011, 333, 1427–1430. [Google Scholar] [CrossRef] [PubMed]
  50. Lindbäck, K.; Moholdt, G.; Nicholls, K.W.; Hattermann, T.; Pratap, B.; Thamban, M.; Matsuoka, K. Spatial and temporal variations in basal melting at Nivlisen ice shelf, East Antarctica, derived from phase-sensitive radars. Cryosphere 2019, 13, 2579–2595. [Google Scholar] [CrossRef]
  51. Alley, K.; Scambos, T.; Miller, J.; Long, D.; MacFerrin, M. Quantifying vulnerability of Antarctic ice shelves to hydrofracture using microwave scattering properties. Remote Sens. Environ. 2018, 210, 297–306. [Google Scholar] [CrossRef]
  52. Philpot, W.D. Bathymetric mapping with passive multispectral imagery. Appl. Opt. 1989, 28, 1569–1578. [Google Scholar] [CrossRef]
  53. Pope, A.; Scambos, T.A.; Moussavi, M.; Tedesco, M.; Willis, M.; Shean, D.; Grigsby, S. Estimating supraglacial lake depth in West Greenland using Landsat 8 and comparison with other multispectral methods. Cryosphere 2016, 10, 15–27. [Google Scholar] [CrossRef]
  54. Zhu, Q.; Guo, H.; Zhang, L.; Liang, D.; Liu, X.; Zhou, H.; Gou, Y. High-resolution spatio-temporal analysis of snowmelt over Antarctic Peninsula ice shelves from 2015 to 2021 using SAR images. Int. J. Digit. Earth 2023, 16, 825–846. [Google Scholar] [CrossRef]
  55. Lund, J.; Forster, R.R.; Deeb, E.J.; Liston, G.E.; Skiles, S.M.; Marshall, H.-P. Interpreting Sentinel-1 SAR Backscatter Signals of Snowpack Surface Melt/Freeze, Warming, and Ripening, through Field Measurements and Physically-Based SnowModel. Remote Sens. 2022, 14, 4002. [Google Scholar] [CrossRef]
  56. Sivalingam, S.; Murugesan, G.P.; Dhulipala, K.; Kulkarni, A.V.; Devaraj, S. Temporal fluctuations of siachen glacier velocity: A repeat pass sar interferometry based approach. Geocarto Int. 2022, 37, 4888–4910. [Google Scholar] [CrossRef]
  57. Fausto, R.S.; Van As, D.; Ahlstrøm, A.P.; Citterio, M. Assessing the accuracy of Greenland ice sheet ice ablation measurements by pressure transducer. J. Glaciol. 2012, 58, 1144–1150. [Google Scholar] [CrossRef]
  58. Qiao, G.; Yuan, X.; Florinsky, I.; Popov, S.; He, Y.; Li, H. Topography reconstruction and evolution analysis of outlet glacier using data from unmanned aerial vehicles in Antarctica. Int. J. Appl. Earth Obs. Geoinf. 2023, 117, 103186. [Google Scholar] [CrossRef]
  59. Tuckett, P.A.; Ely, J.C.; Sole, A.J.; Livingstone, S.J.; Davison, B.J.; van Wessem, J.M.; Howard, J. Rapid accelerations of Antarctic Peninsula outlet glaciers driven by surface melt. Nat. Commun. 2019, 10, 4311. [Google Scholar] [CrossRef]
  60. Leitner, J.F.; Perteneder, F.; Liu, C.; Rendl, C.; Haller, M. Kolibri–Tiny and fast gestures for large pen-based surfaces. In Proceedings of the CHI ’13: Proceedings of the SIGCHI Conference on Human Factors in Computing Systems, Paris, France, 27 April–2 May 2013; pp. 1789–1798. [Google Scholar] [CrossRef]
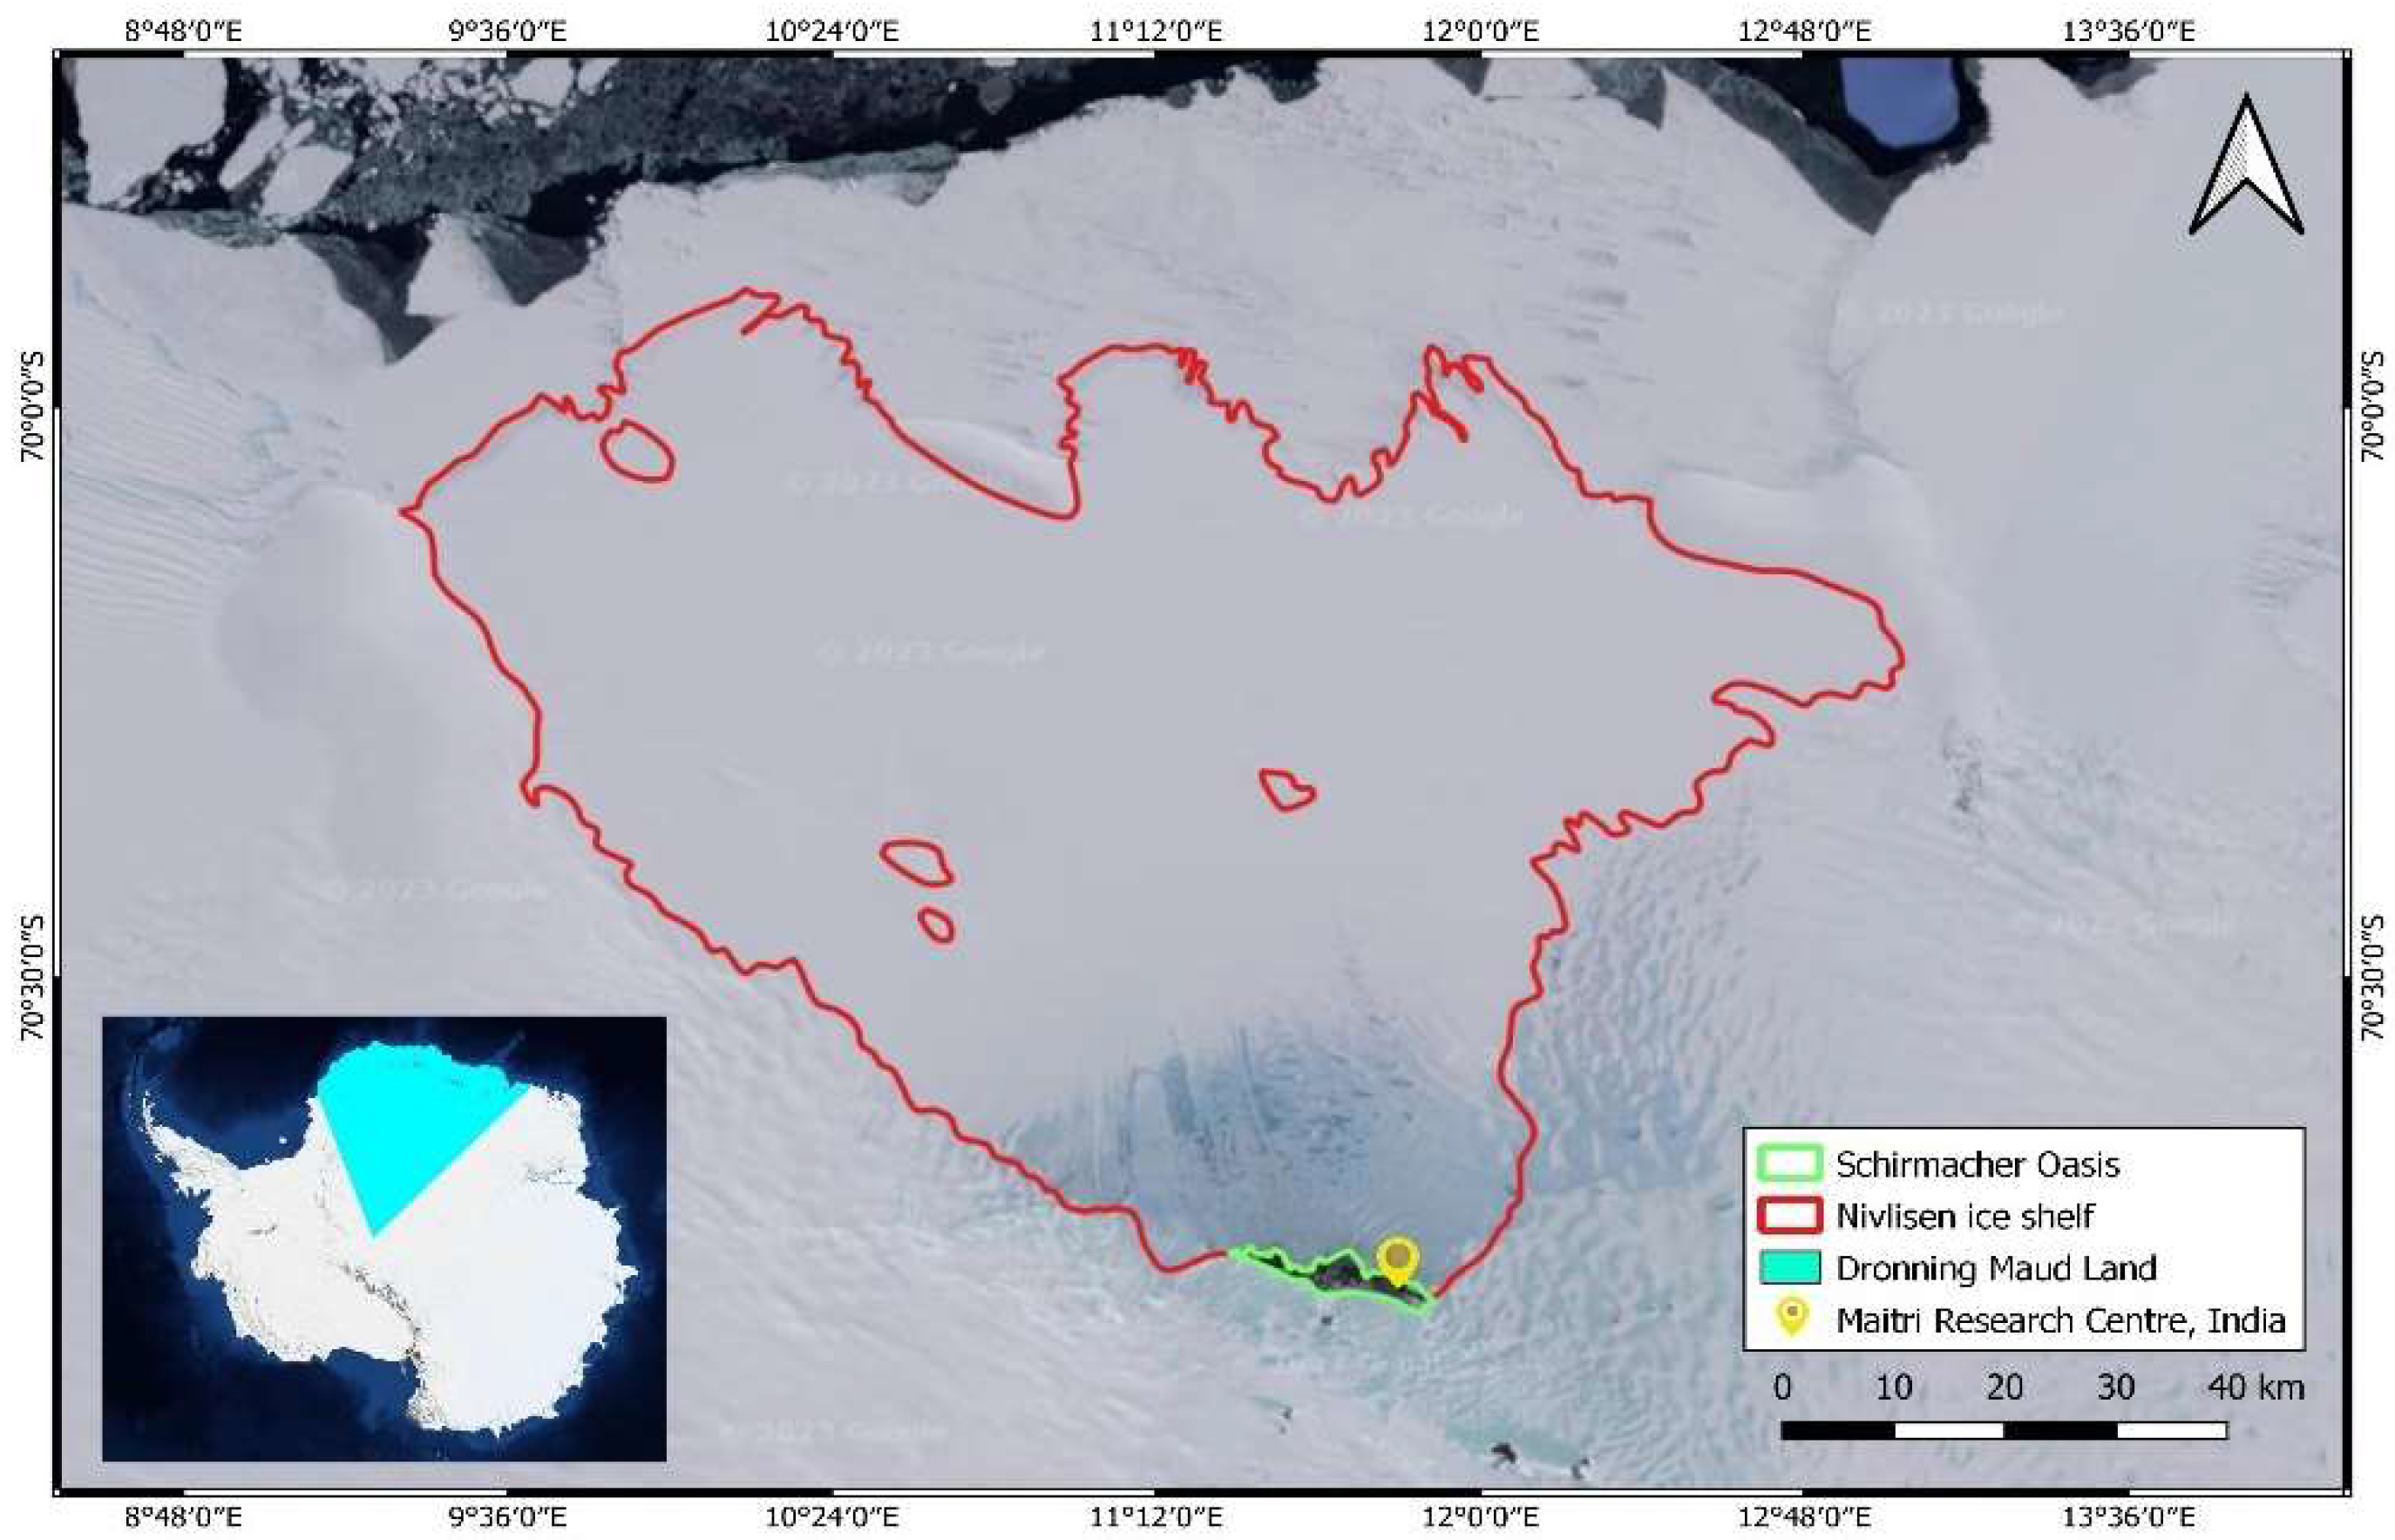
Figure 1. Study area on East Antarctica consisting of Nivlisen Ice Shelf, central Dronning Maud Land, located at 70.3°S, 11.3°E with a 2000 km coastline encompassing large ice shelves with the coordinate reference system “WGS84 Antarctic polar stereographic”.
Remotesensing 15 05676 g001
Figure 2. Process flow: estimation of surface melt extent (a), depth of melt ponds and supraglacial lakes using melt pond depth model, area and volume (b), and ice flow velocity using (c).
Remotesensing 15 05676 g002
Figure 3. (a) Schematic representation of the pressure sensor assembly installation over the melt pond situated near Maitri station. (b) The bladder box on the T-junction is fitted at the top end of the hose to allow the logger cable to exit the closed PSA system and the other T-junction’s branch connects to a 2 L rubber expansion bladder.
Remotesensing 15 05676 g003
Figure 4. Sample of model-based melt pond depth estimates for the austral summer of 2022–2023.
Remotesensing 15 05676 g004
Figure 5. (a) Maximum depth during austral summers of 2000–2023. (b) Area and volume during austral summers of 2000–2023.
Remotesensing 15 05676 g005aRemotesensing 15 05676 g005b
Figure 6. The surface melt extent (SME) map over NIS for the austral summer 2022–2023.
Remotesensing 15 05676 g006
Figure 7. The surface melt extent (SME) over NIS for the austral summers 2019–2020, 2020–2021, 2021–2022, and 2022–2023.
Remotesensing 15 05676 g007
Figure 8. The velocity obtained for 12-day time periods during the months of austral summers considered for the study.
Remotesensing 15 05676 g008
Figure 9. (a) The unwrapped phase and (b) surface ice flow velocity map obtained during 10 January 2023 (master) and 22 January 2023 (slave) over Dronning Maud Land (negative values indicate movement in the direction away from the satellite along the radar’s line of sight, while positive values indicate movement towards the satellite along the radar’s line of sight).
Remotesensing 15 05676 g009
Figure 10. The four 30 km long profiles R1, R2, R3, and R4 drawn over NIS in the melt and nonmelt regions (background image is surface ice flow velocity map estimated during January 2023).
Remotesensing 15 05676 g010
Figure 11. Validation site: glacial lake/melt pond selected near the Maitri, Indian research station located in Dronning Maud Land, East Antarctica.
Remotesensing 15 05676 g011
Figure 12. (a) An aerial view of the selected melt pond, the RGB image of the lake obtained from P4 multispectral sensor. (b) The view of the lake during the peak melting period, on 20 December 2022. (c) The model-based melt pond depth derived from the UAV survey on 20 December 2022. (d) Correlation analysis of the measured values.
Remotesensing 15 05676 g012
Figure 13. Location of two ground control points (A and B) near the grounding line of the NIS during the period of 29 December 2022 to 10 January 2023, with a 12-day interval.
Remotesensing 15 05676 g013
Table 1. Depth values obtained from the pressure sensor and melt pond depth model for 20 December 2022.
ParameterFinding
Date of validation/UAV survey data20 December 2022
Model-based depth at GVP0.75 ± 0.2 m
PSA-based depth at GVP0.92 ± 0.03 m
RMSE at GVP0.17
Disclaimer/Publisher’s Note: The statements, opinions and data contained in all publications are solely those of the individual author(s) and contributor(s) and not of MDPI and/or the editor(s). MDPI and/or the editor(s) disclaim responsibility for any injury to people or property resulting from any ideas, methods, instructions or products referred to in the content.