Technical Note

Exploring Self-Supervised Learning for Multi-Modal Remote Sensing Pre-Training via Asymmetric Attention Fusion

1
The School of Electronic Information and Electrical Engineering, Shanghai Jiao Tong University, Shanghai 200240, China
2
The S-Lab, Nanyang Technological University, Singapore 639798, Singapore
*
Author to whom correspondence should be addressed.
Remote Sens. 2023, 15(24), 5682; https://doi.org/10.3390/rs15245682
Submission received: 14 October 2023 / Revised: 30 November 2023 / Accepted: 6 December 2023 / Published: 10 December 2023
(This article belongs to the Section AI Remote Sensing)

Abstract

:
Self-supervised learning (SSL) has significantly bridged the gap between supervised and unsupervised learning in computer vision tasks and shown impressive success in the field of remote sensing (RS). However, these methods have primarily focused on single-modal RS data, which may have limitations in capturing the diversity of information in complex scenes. In this paper, we propose the Asymmetric Attention Fusion (AAF) framework to explore the potential of multi-modal representation learning compared to two simpler fusion methods: early fusion and late fusion. Given that data from active sensors (e.g., digital surface models and light detection and ranging) is often noisier and less informative than optical images, the AAF is designed with an asymmetric attention mechanism within a two-stream encoder, applied at each encoder stage. Additionally, we introduce a Transfer Gate module to select more informative features from the fused representations, enhancing performance in downstream tasks. Our comparative analyses on the ISPRS Potsdam datasets, focusing on scene classification and segmentation tasks, demonstrate significant performance enhancements with AAF compared to baseline methods. The proposed approach achieves an improvement of over 7% in all metrics compared to randomly initialized methods for both tasks. Furthermore, when compared to early fusion and late fusion methods, AAF consistently outperforms in achieving superior improvements. These results underscore the effectiveness of AAF in leveraging the strengths of multi-modal RS data for SSL, opening doors for more sophisticated and nuanced RS analysis.

1. Introduction

Automated geospatial analysis and Earth observation hold increasing significance in various applications, including urban planning [1], forest monitoring [2], agricultural management [3], disaster prevention [4], and tackling climate change [5]. The continuous development of remote sensing (RS) image equipment and technology has resulted in a vast amount of RS data being generated daily, encompassing diverse modalities and systems. However, a considerable percentage of raw satellite RS images lack high-quality labels, limiting their potential contribution to advancements. Furthermore, different modalities of RS images, such as DSM and optical, possess complementary characteristics, which can enhance remote sensing tasks like scene classification and segmentation. Nevertheless, effectively utilizing unlabeled images and seamlessly integrating multi-modal remote sensing data are two significant challenges that have garnered substantial attention in the RS community.
Self-supervised learning (SSL) methods like Moco [6], SimClr [7], SwAV [8], BYOL [9], and Simsiam [10] have achieved success in computer vision by generating task-agnostic representations from unlabeled data, improving the performance of supervised learning. Recently, The RS community has also begun adopting SSL as a valuable approach. SeCo [11] highlights the value of seasonal changes in generating richer semantic content compared to artificial transformations. Kumar et al. [12] utilize the alignment of images captured at different time points to create positive pairs for temporal contrastive learning. Furthermore, the incorporation of geo-location plays a crucial role in designing pre-text tasks. Similarly, GeoKR [13] also leverages geographical knowledge for SSL learning. However, these methods primarily focus on single-modal SSL, while RS data comprises vast multi-modal data with strong inter-modal complementarity.
Recently works [14,15,16,17,18] demonstrate the benefits of fusing multi-modal RS data in various tasks. However, these advanced fusion methods primarily rely on supervised learning, which faces limitations due to the scarcity of high-quality labels. Very recently, Some studies have started focusing on self-supervised multi-modal learning. Chen et al. [19] propose the combined utilization of contrastive loss at both image-level and pixel-level to enhance the suitability of multi-modal fusion models for segmentation tasks. In addition, Furthermore, the Nearest Neighbor-Based Contrastive Learning (NNCNet) approach [20] exploits semantic relationships among nearby regions to address the heterogeneous gap induced by inconsistent distribution of multisource data. The Spatial-Spectral Masked Auto-Encoder (SS-MAE) [21] has been introduced for HSI and LiDAR/SAR data joint classification, fully leveraging spatial and spectral representations. However, these approaches primarily focus on pixel-level classification tasks, using relatively lightweight network architectures with fewer parameters. However, these approaches primarily focus on pixel-level classification tasks and use lightweight network architectures. Thus, they may not fully address the challenges of comprehensive image understanding in multi-modal remote sensing. Scheibenreif et al. [22] propose training SSL models using satellite imagery captured by various sensors at the same location as positive image pairs, while images from different sensors and locations serve as negative samples. However, this design creates independent encoders for the two modalities, limiting information interaction.
Moreover, in remote sensing, a noticeable difference exists between images from active sensors, which tend to be noisier, and those from passive sensors, which are generally more informative. To account for this, we introduce the Asymmetric Attention Fusion (AAF) module, which strategically fuses modalities at each layer asymmetrically, allowing for a more nuanced integration of information. The AAF module dynamically adjusts to the informativeness of each modality, enhancing representation learning by capitalizing on the strengths and mitigating the weaknesses of individual modalities. Figure 1 illustrates the three fusion strategies for better SSL learning: Early Fusion (EF) fuses information at the beginning, Late Fusion (LF) fuses multi-modal features in the last stage, and our proposed Asymmetric Attention Fusion (AAF). Additionally, to facilitate downstream task adaptation, we design a Transfer Gate module that employs attention mechanisms to refine the selection of informative features, improving overall performance.
In summary, our proposed framework aims to efficiently merge diverse RS data modalities, including optical and DSM, to learn more robust feature representations. We introduce the AAF module, which enables dynamic fusion of modalities, leveraging their respective strengths. Furthermore, we develop a Transfer Gate module that selects the most useful information for improved performance in downstream tasks. Through experiments, We show that the latent knowledge derived through SSL can achieve remarkable improvements over supervised baselines when fine-tuned with only 1% labeled data. Our proposed method achieves the best performance across different SSL frameworks, such as MocoV2 and Simsiam, in both scene classification and segmentation tasks.

2. Related Work

2.1. Self-Supervised Learning

As shown in Table 1, self-supervised learning (SSL) has made significant advancements in the field of computer vision. SSL involves learning task-agnostic representations from data without human annotations, allowing for pre-trained weights that can be transferred to downstream tasks. Three commonly seen SSL methods are introduced as follows:
Pre-text tasks. These methods leverage inherent properties of training data. Examples include recovering the input under some corruption, e.g., colorization [23], as well as generating pseudo-labels by patch orderings [24], tracking [25], rotation prediction [26].
Augmentation-invariance. These methods define the inputs as two carefully designed augmentations of one image and encourage the network to learn the invariance between the inputs in different conditions. Methods like MocoV1 [6], MocoV2 [27], MocoV3 [28] and SimClr [7] are based on contrastive learning, which pushes positive pairs close and negative pairs away. Methods like BYOL [9], SwAV [8] and SimSiam [10] rely only on positive pairs by a teacher-student architecture.
Masked image modeling (MIM). These methods mask a portion of the input sequence and train models to predict the missing content. MAE [29] develop an asymmetric encoder-decoder architecture to reconstruct the original image from the latent representation and mask tokens. Beit [30], Peco [31] and DINO [32] carefully design labels of the masked image patch to finish MIM training.
SSL in remote sensing. The success of SSL did attract much attention within the RS community. SSL techniques have been adapted to learn meaningful representations of RS images. Inpainting pretext task is applied to train an encoder and decoder network with different satellite datasets [33]. SauMoCo [34] successfully applies Moco [6] to RS data. Some works [11,12,13] combine pretext task and Augmentation-invariance in a multi-task framework. They exploit the information inherent in RSI to improve the performance of existing SSL methods. Examples include considering seasonal changes [11], utilizing localization information as well as exploiting the spatio-temporal structure of RS data [12], extracting geographical knowledge as additional supervision [13]. The above methods still adhere to natural image concepts. There are numerous other types RS images, such as hyper-spectral images and synthetic aperture radar (SAR) images. Chen et al. [35] and Li et al. [36] explored the potential of SSL in the hyper-spectral images processing tasks.
Current SSL methods in remote sensing focus on learning generic representations that often fail to capture the domain-specific nuances, such as the multi-dimensional nature of remote sensing data and the diverse conditions under which it is acquired. And a direct transfer to downstream tasks without adaptation can lead to suboptimal performance due to the gap between the self-supervised learning setup and the targeted applications. Moreover, they primarily address single-modal remote sensing data, overlooking the significant benefits of multi-modal fusion in remote sensing tasks. These shortcomings necessitate a method that can bridge the gap and fully exploit the richness of multi-modal data.

2.2. Multi-Modal Learning

Multi-modal learning refers to learning between different modalities. Remote sensors can be categorized into two classes [37,38,39]: passive ones, e.g., optical images and active ones, e.g., synthetic aperture radar (SAR), light detection and ranging (LiDAR). These sensors enable us to obtain various complementary information of the same object. Driven by the recent advances in deep learning, many algorithms are designed to take advantage of the complementary information in multi-modal RS data. ResUNet-a [40] directly concatenate the RGB and depth images in the data level before feeding into models. In contrast, FuseNet [41] adopts a two-stream encoder to obtain the features from each modality individually and then concatenate them as the input of the decoder. Recently, TWINNS [18] fuse Sentinel-1 and Sentinel-2 time series data in land-cover mapping. CMFNet [42] exploits cross-attention and cross-modal. Although these methods achieve convincing results, they treat different modalities equally in the fusion. In fact, the importance of different modalities is different. In addition, these fully supervised approach requires numerous labels, which often needs huge computation costs.
To address these problems, unsupervised multi-modal representation learning has attracted more attention. Amarsaikhan et al. [43] use PCA to enhance the features extracted from SAR-optical images for the urban land-cover maps. Jie et al. [44] fuse SAR and multi-spectral images by a deep bimodal autoencoder to improve the performance of classification. Very recently, Chen et al. [19] jointly use image-level and pixel-level contrastive loss to train a self-supervised SAR-optical data fusion network for semantic segmentation task. Wang et al. [45] explores self-supervised vision transformers for joint SAR-optical representation learning, showcasing the use of vision transformers with self-supervised learning for efficient multi-modal data fusion. Scheibenreif et al. [22] demonstrates the application of self-supervised vision transformers for land-cover segmentation and classification, highlighting the potential of transformer models in the remote sensing domain when pre-trained on large-scale unlabeled datasets. Scheibenreif et al. [22] compare two multi-modal fusion methods, including early fusion and late fusion. As for early fusion, they concatenate across channel dimensions at the data input stage. And late fusion is to concatenate features derived from Sentinel-1/2 inputs with distinct encoders. However, for these methods, features about different modalities do not interact in encoders, which cannot fully explore the fused multi-modal representation power.

3. Methodology

As illustrated in Figure 2. We first train a SSL model with unlabeled RS data and then transfer it to specific downstream tasks. In the SSL training stage, we adopt the framework similar to [7,9,10,27], which encourages the representation invariant to augmentations. We redesign the view generation and backbone to enable the framework adaptable to multi-modal fusion. When transferring to the specific downstream tasks, we propose a Transfer Gate module to select more appropriate multi-modal features to enter the downstream task head. We will detail these in the following.

3.1. View Generation

As shown in Figure 2, given a pair of images, X p (image generated by passive sensors, e.g., RGB images) and X a (image generated by active sensors, e.g., DSM images), we produce multiple positive pairs. Let T be a set of commonly used artificial augmentations. As for optical images (we choose R, G and B channels), the augmentations are the same as MocoV2 [27], including random resized crop, color jittering, random grayscale, gaussian blurring, random horizontal Flipping. As for images generated by active sensors, we remove color jittering and random grayscale. In addition, the images of the two modalities share the same augmentation parameters. Hence, we can obtain four images after augmentation: X p 1 = T 1 ( w 1 , X p ) , X a 1 = T 1 ( w 1 , X a ) , x p 2 = T 2 ( w 2 , X p ) and x a 2 = T 2 ( w 2 , X p ) .

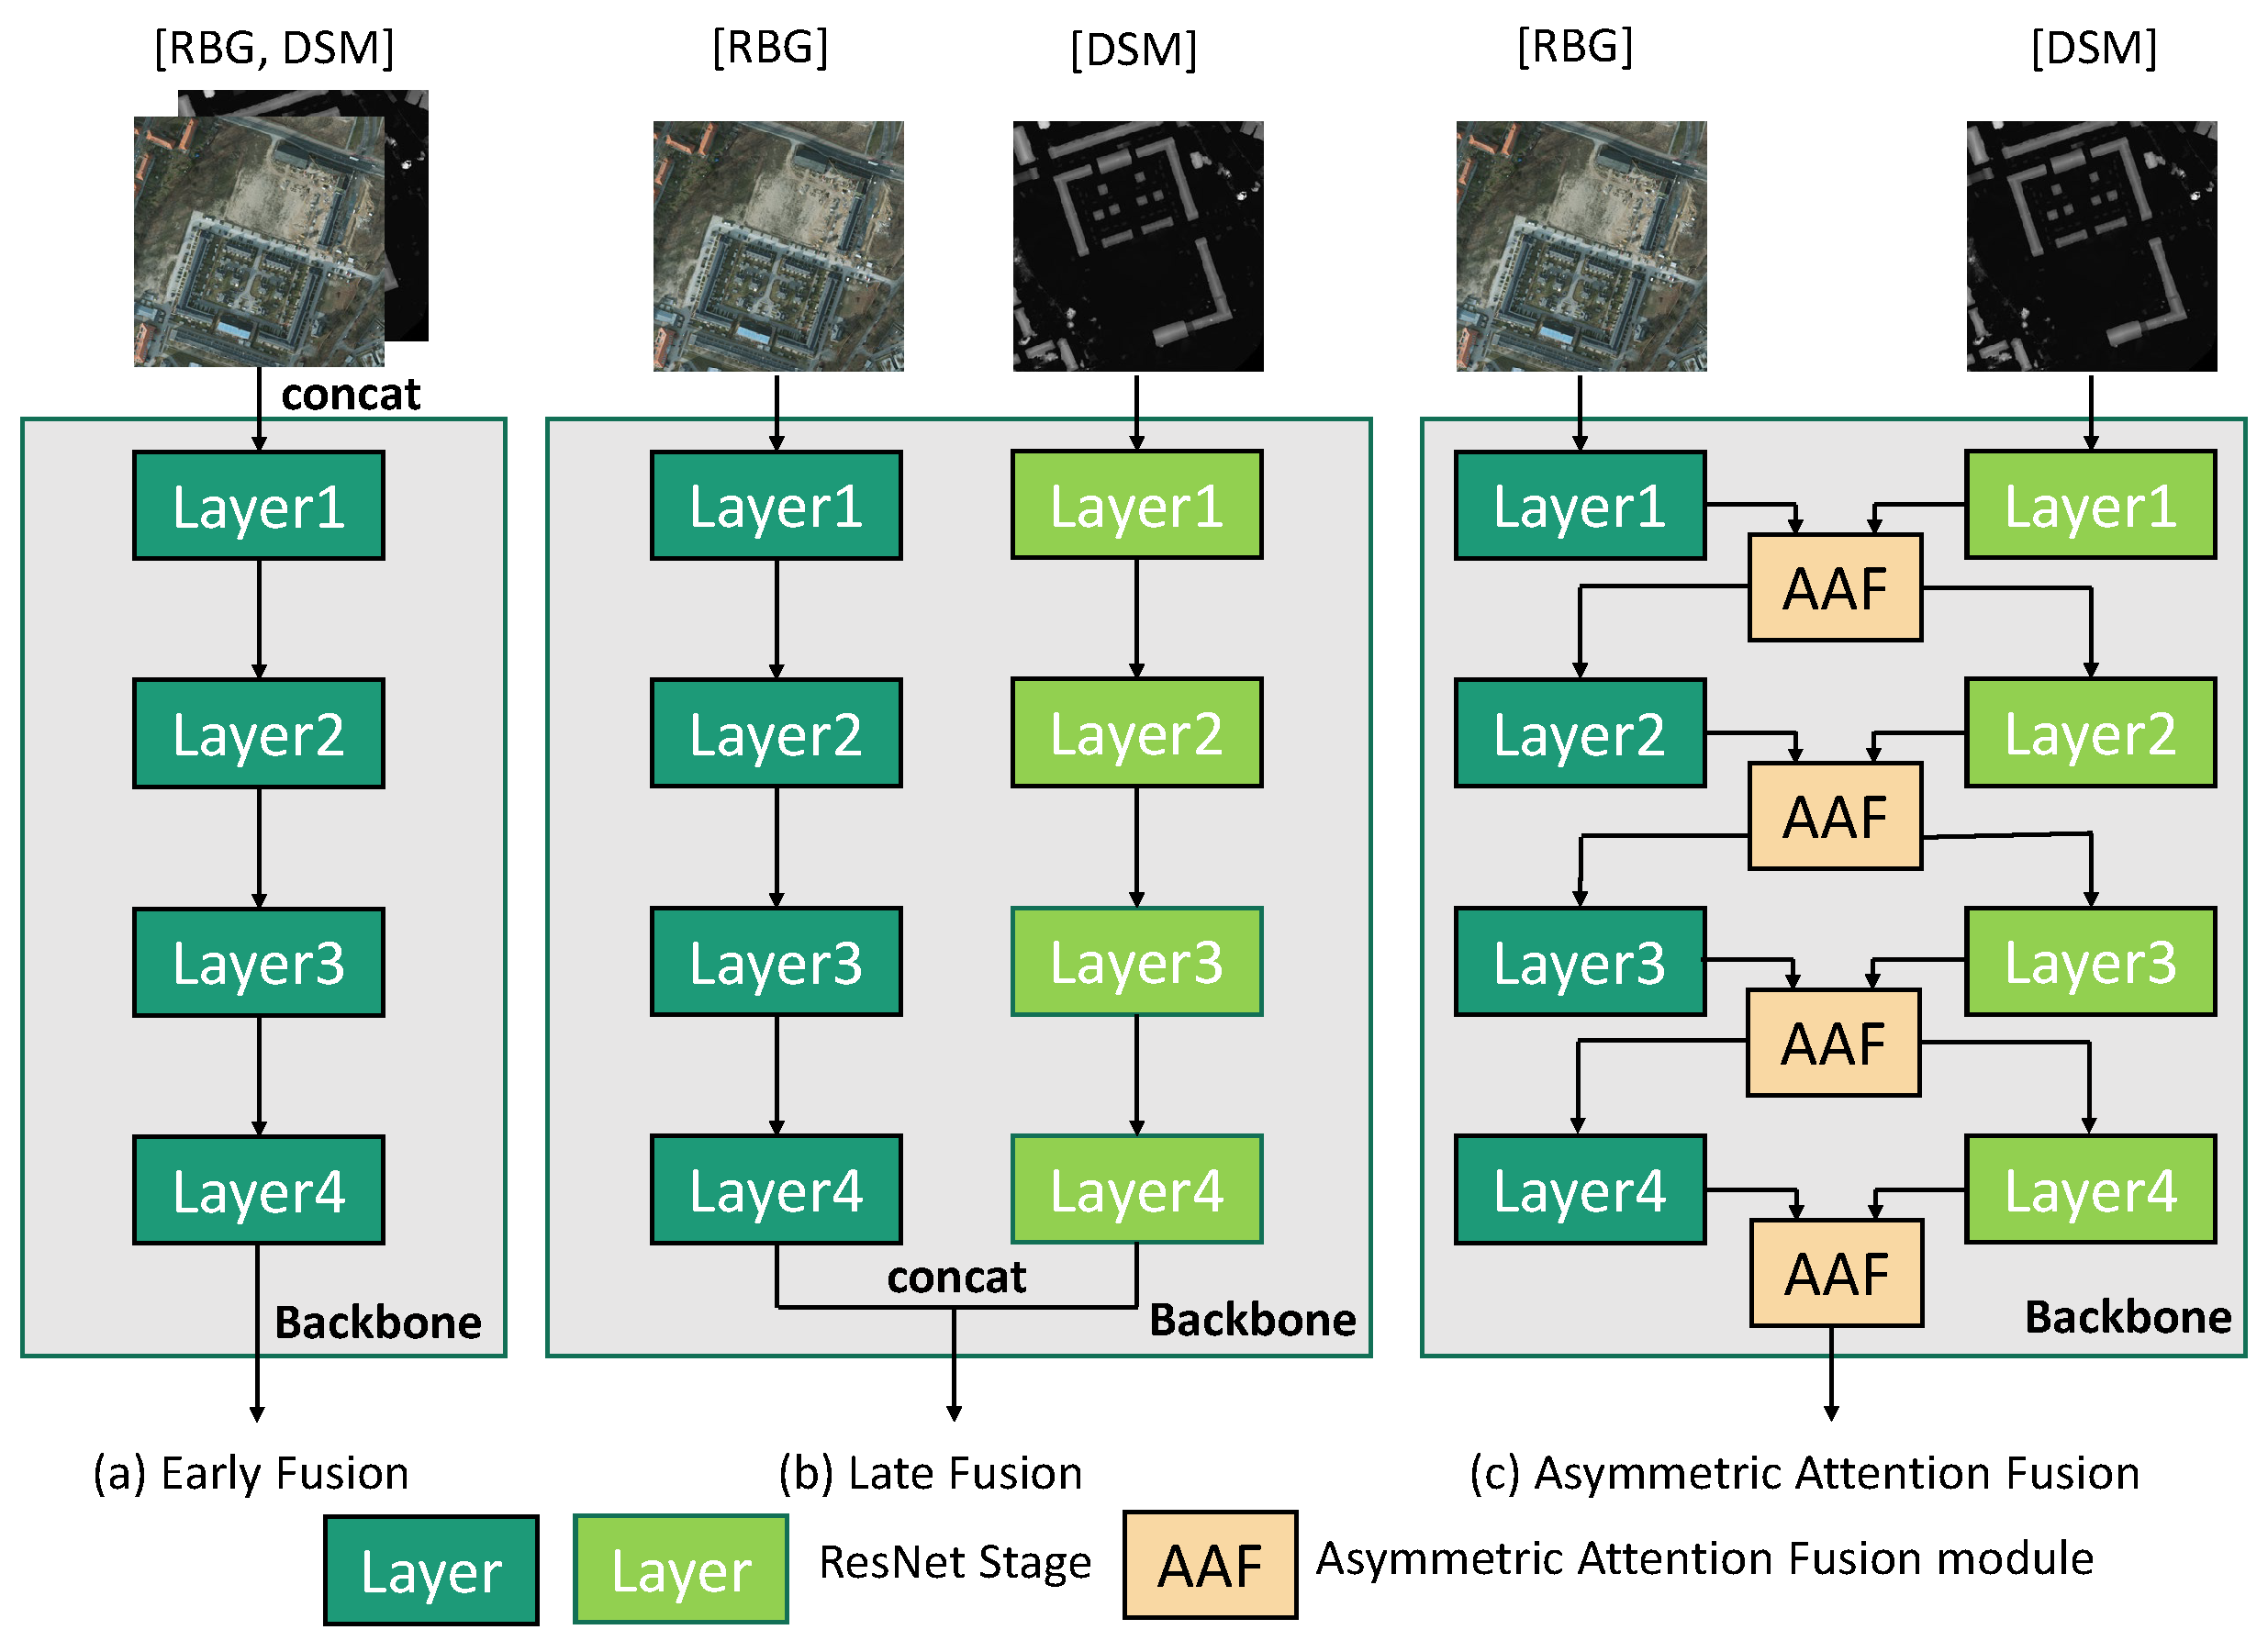
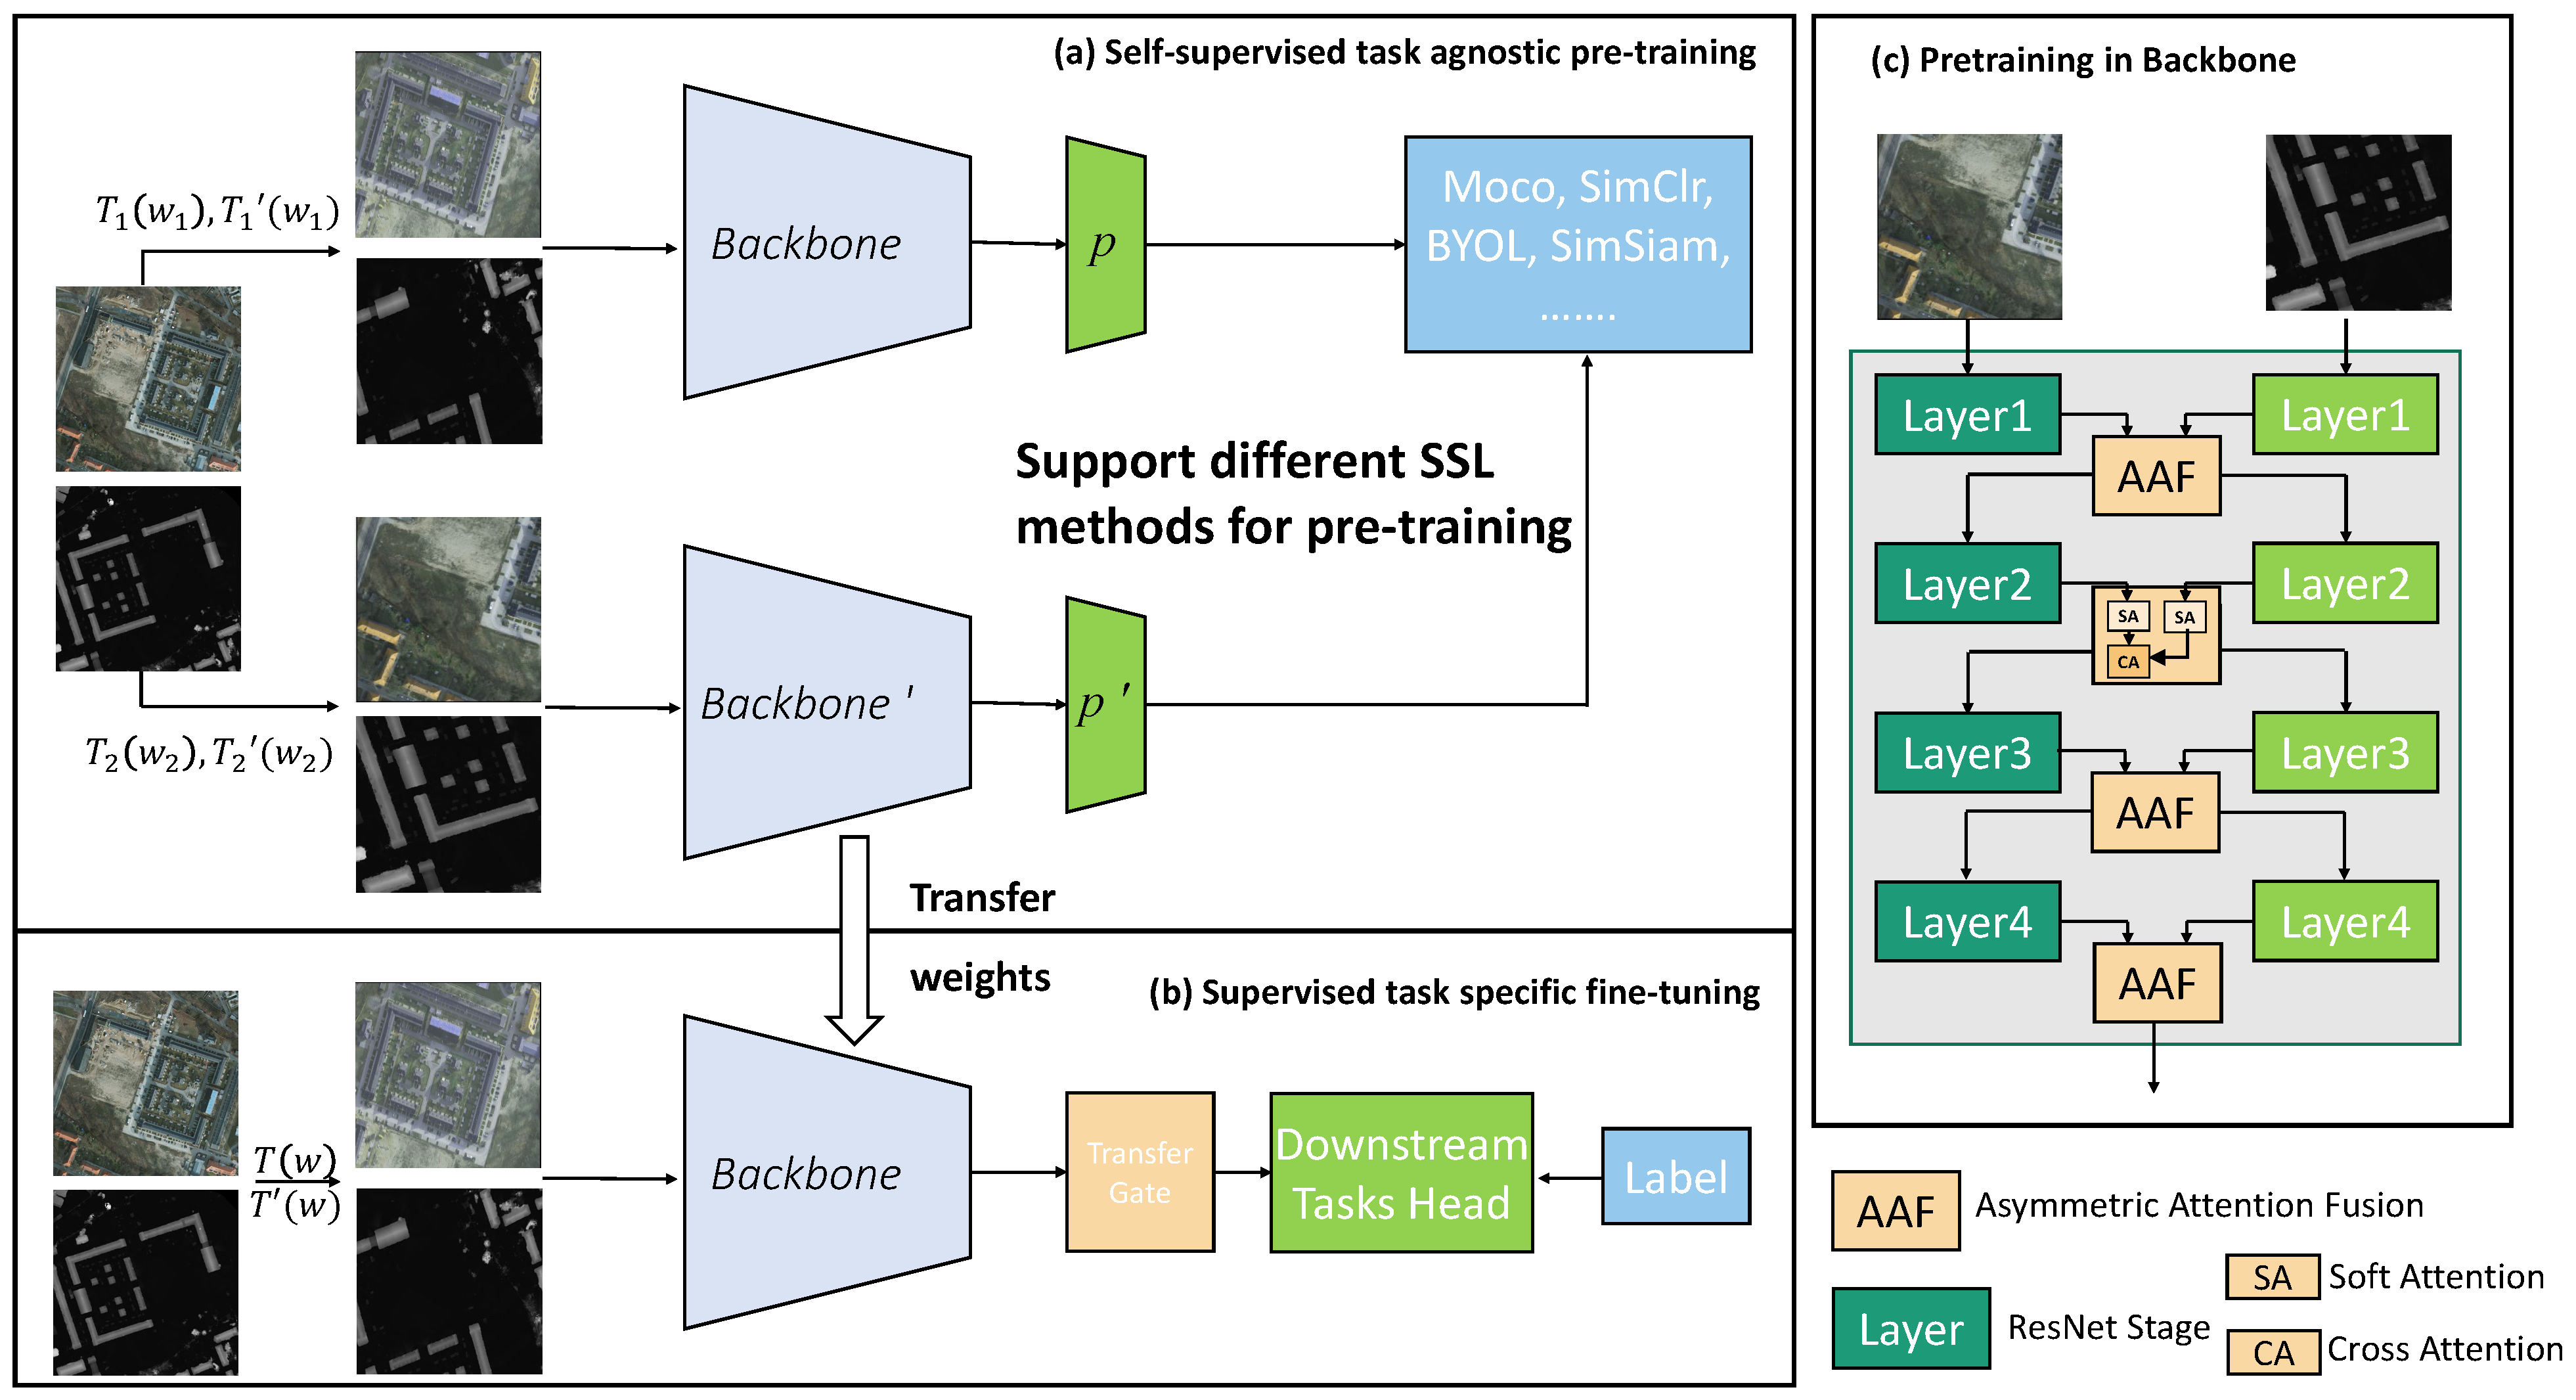
3.2. Backbone for Multi-Modal Fusion

The design of the backbone network is the key to multi-modal fusion. As illustrated in Figure 1, we explore three types of backbone structures, which are based on ResNet50 [46] consisting of four residual layers. EF and LF are two common multi-modal fusion strategies. EF directly stacks the data of two modalities before the backbone so that we only use one branch for EF. LF stacks the output embedding of the two branches, which have the same structure but not share parameters. However, we argue that there is insufficient interaction between the different modalities in these two fusion strategies. Moreover, the images generated by active sensors are usually noisier and less informative than those generated by passive sensors so that these two modalities should not be treated the same. Thus, we propose an AAF module to fuse modalities information at each layer in an asymmetric way. Next, we will detail the AAF module.
As shown in Figure 3, the AAF module has two units: a soft attention (SA) unit and a cross attention (CA) unit. The former unit helps to focus on the important regions of the inputs, while the latter fuse two modal information.
Soft Attention: This unit softly weights the input feature map X p (or X a ) at each spatial location. Taking X p R C × H × W as the input, the attention-enhanced feature can be obtained as follows:
U ¯ p = s o f t m a x ( C o n v ( w p , X p ) ) V p
where C o n v is a 1 × 1 convolution layer and w p R 1 × 1 × C is the corresponding weight. Softmax is applied to obtain a soft attention map. ⊙ indicates the element-wise multiplication. U ¯ p R C × H × W is the output of the soft attention. Similarly, given X a , we can obtain U ¯ a by Equation (1).
Cross Attention: To transfer active branch features U ¯ a , we use a multi-modal bilinear in a non-local manner to find the affinity between U ¯ p and U ¯ a :
R = U ¯ a T W U ¯ p
where W R C × C is a trainable weight matrix. S R ( W H ) × ( W H ) is the affinity matrix which can effectively capture pairwise relationships between U ¯ p and U ¯ a . Considering the huge number of parameters and the risk of over-fitting, W can be approximately factorized into two low-rank matrices M R C × C d and N R C × C d , where d ( d > 1 ) is a reduction ratio. Then, Equation (2) can be rewritten as:
R = U ¯ a T M N T U ¯ p = ( M T U ¯ a ) T ( N T U ¯ p )
This operation means to applying channel-wise feature transformations to U ¯ p and U ¯ a , which can be achieved by a 1 × 1 convolution layer. Thus, the number of parameters can be reduced by 2 d times. Then we apply the Softmax to normalize R to obtain the attention map R m :
R m = s o f t m a x ( R )
Then we can obtain the fused features Y p R C × H × W :
Y p = U ¯ p R m
Similar to the blocks in ResNet [46], we extend the AAF module into a deeper network, which contains L AAF layers in depth.

3.3. Transfer Gate Module

When fine-tuning the model applied to downstream tasks, we argue that it may not be the best choice to directly feed information of the two modalities obtained by the backbone network directly into the task-specific head. We design a Transfer Gate module based on attention mechanisms to better select meaningful information from the fused features, which consists of three attention mechanisms shown in Figure 4. Considering Convolution operations to extract informative features by blending cross-channel and spatial information together, channel attention and spatial attention are adopted at the local level. And then, the scale attention is applied to re-calibrate features at global level.
Given a fused feature X R 2 C × H × W as input, the overall attention process can be written as follows:
V = F c ( X ) Z = F s ( V ) U = F g ( Z )
Y = X + U
where F c , F s and F g in Equation (6) are channel attention, spatial attention and scale attention, respectively. Similar to [46], we get the final feature Y by using identity mapping in Equation (7) to avoid losing important information on the regions with attention values close to 0.
Specifically, channel attention F c can be formulated as:
X m = σ ( M L P ( M P ( X ) ) + M L P ( A P ( X ) ) )
V = X m X
where σ , M P and A P denote the sigmoid function, max pool and average pool, respectively. Note that the MLP is a shared network composed of multi-layer perception with one hidden layer in a s q u e e z e and e x c i t a t i o n manner: f c ( 2 C 16 ) R e L U f c ( 2 C ) followed [47,48]. X m R 1 × H × W denotes channel attention map and ⊗ indicates element-wise multiplication. V R 2 C × H × W denotes channel-wise attentive feature.
Spatial attention F s can be formulated as:
V m = σ ( C o n v ( [ M P ( V ) , A P ( V ) ] ) )
Z = V m V
where σ also denotes the sigmoid function. M P and A P denote max pool and average pool across the channel. Those are then concatenated and convolved by a standard convolution layer. V m R 2 C × 1 × 1 denotes spatial attention map and Y R 2 C × H × W denotes spatial-wise attentive feature.
As for scale attention at global level F g is similar to F s . It shares the same s q u e e z e layer but modifies the e x c i t a t i o n layer: f c ( 2 C 16 ) R e L U f c ( 1 ) . Thus, we can obtain the global scale attentive Y R 2 C × H × W .

3.4. Loss Function

We adopt the use of contrastive SSL for pre-training of multi-modal frameworks on remote sensing data. It is worth noting that our method can be easily extended to other forms, e.g., distillation method in [9]. Different from single-modal SSL learning, the backbone of AAF is two branches, and we can get three outputs: Y a , Y p and [ Y a , Y p ] . Y a and Y p are the output of passive branch and active branch, respectively. [ Y a , Y p ] means concatenate Y a and Y p . Given Y a , the contrastive loss is defined as:
L a i , j = log exp ( s i m ( Y a i , Y a j ) / τ ) k = 1 2 N exp ( s i m ( Y a i , Y a k ) / τ )
where Y a i and Y a j are representations of a positive pair. Y a k are negative representations. s i m ( · , · ) is the dot product. τ is the temperature parameter. Similarly, given Y p and [ Y a , Y p ] , we can obtain L p i , j and L [ a , p ] i , j by Equation (12). We empirically find that using only L a i , j has the best performance, which is discussed in the ablation experiments.

4. Experimental Results

In this study, we evaluate the learned representations on two downstream tasks: scene classification and segmentation tasks based on The International Society for Photogrammetry and Remote Sensing (ISPRS) Potsdam dataset.

4.1. Datasets Description

We use the well-known ISPRS Potsdam dataset, comprised of 38 patches with 6000 × 6000 pixels. Each patch contains a true orthophoto and a DSM, which is incorporating near-infrared, red, green, and blue channels. In our experiments, we solely utilize the red, green, and blue channels. The dataset comprises annotations for six classes, namely: low vegetation, trees, buildings, impervious surfaces, cars, and others. 24 patches are cropped, generating 13,284 images sized at 256 × 256 pixels, which comprise SSL training set. For evaluating the performance of SSL, 1% of the SSL training set is chosen as the downstream task training set. Furthermore, fourteen patches are cropped, generating 8064 images sized at 256 × 256 pixels, which comprise the testing set. Table 2 provides additional information regarding the Potsdam dataset. The ISPRS Potsdam dataset is labeled at pixel level. We also give an image-level label to each cropped image by checking whether the image contains pixels of the corresponding category.

4.2. Evaluation Metrics

To validate the efficacy of the proposed framework, specific downstream tasks such as scene classification and segmentation are chosen for evaluating the performance of SSL in this paper. As for the scene segmentation task, we use overall accuracy ( O A ), mean intersection over union ( m I o U ), and kappa coefficient (K) as evaluation metrics. In general, higher values of these three indices mean better performance of the model. They can be defined as follows:
O A = N c N
m I o U = 1 C i = 1 C N c i N r i + N c i N c i
K = O A P e 1 P e
where N c and N are the number of pixel samples classified correctly and the number of total pixel samples, respectively. N c i , N r i and N p i are the numbers of classified correctly pixel samples, real pixel samples and predicted pixel samples for ith class, respectively. C is the total number of categories. P e is the hypothetical probability of chance agreement, which can be formulated by:
P e = N r 1 × N p 1 + + N r i × N p i + + N r C × N p C N × N ,
As for scene classification task, we use average accuracy ( A A ) as evaluation metrics. In general, higher values of A A mean better performance of the model. It can be defined as:
A A = 1 C i = 1 C N c i N i ,
where N c i and N i are the numbers of classified correctly image sample and total image samples for ith class, respectively. C is the total number of categories.

4.3. Experimental Settings

(1) Pre-training Setting: Our implementation of the framework is based on MocoV2 [27]. The projection head employed consists of a two-layer MLP that projects the representation onto a latent space of dimensionality 128. We utilize stochastic gradient descent (SGD) to optimize the training process. Additionally, we adopt a cosine decay learning rate schedule with a initial learning rate (lr) of 0.03. The training phase spans 200 epochs using batchsizes 256. For efficient execution, the model is implemented on mmselfsup [49] using four V100 GPUs.
(2) Scene Segmentation Setting: We employ FCN [50] to assess the effectiveness of the pre-trained representations for the scene segmentation task. Following the backbone, we incorporate two additional convolutions of size 3 × 3 , featuring 256 channels along with batch BN and ReLU. Subsequently, a 1 × 1 convolution is applied to yield pixel-wise predictions. The model is trained for 45 epochs with batchsizes 16. We utilize SGD for optimization. The initial lr is set at 0.003 and is reduced by a factor of 0.1 after the 30th and 40th epochs.
(3) Scene Classification Setting: we employ a standard classification model to assess the effectiveness of the pre-trained representations for the scene classification task. A fully connected layer follows the backbone. We fine-tune all weights, including the backbone and fully connected layer. The model is trained for 200 epochs using batchsizes 254. We utilize SGD for optimization. The initial lr is set at 0.003 and is reduced by a factor of 0.1 after the 120th and 160th epochs.

4.4. Main Results

We perform extensive experiments to evaluate the performance of the proposed framework on two different downstream tasks based on the ISPRS Potsdam dataset, including scene classification and segmentation. For each task, we investigated five different data settings: solely RGBmodality, only DSM modality, early fusion by concatenating across channel dimension at the input of model, late fusion by concatenating future maps obtained from a two-branch backbone before the final classification layer or decoder layer and AAF by enabling two modalities of information to interact at each stage of the backbone with an asymmetric attention module. For each data setting, we compare training from scratch and loading pre-trained weight of SSL for specific downstream tasks.
Table 3 provides a detailed comparison of various, including the class-by-class Intersection over Union ( I o U ), m I o U , O A and K, on the testing set for each method when fine-tuned with 138 (%1 of SSL training set) samples for scene segmentation task. According to the results, when the networks are initialized randomly, we observe that the model with RGB data performs better than the model with DSM data, e.g., 10.61% in terms of the m I o U index. We observe similar results when the networks is trained with SSL pre-trained weights. This validates our motivation of the proposed AAF. DSM data is less informative and noisier compared with RGB data. Moreover, for segmentation task, objects in the images need to have clear and accurate boundaries, while boundaries of objects in DSM data are generally more ambiguous. Thus, we take DSM data as an auxiliary modality. We further observe that the fusion of RGB and DSM in three different ways surpasses the performance of using either modality alone. This holds true for both random baseline evaluation and SSL pre-trained evaluation. Notably, our proposed AAF method, when combined with SSL pre-training weights, achieves the highest performance, boasting an increase of over 2% in mean Intersection over Union ( m I o U ) compared to the performance of EF and LF fusion methods. In addition to quantitative assessment, we also conducted a visual comparison of the predicted land-cover maps generated by various methods. Figure 5 showcases six examples, presenting the predicted land-cover maps derived from different methods alongside their corresponding ground truth. It is evident that the difficulty of segmenting different modal data varies across different scenarios. As depicted in the third row of Figure 5, using only DSM modality information results in misclassifying the “others” category as “impervious surfaces”. However, when relying solely on RGB modality information, the model demonstrates better segmentation accuracy. Conversely, as shown in the fifth row of Figure 5, using only DSM modality information performs well in identifying the “buildings” category, while using only RGB modality information leads to numerous misclassifications due to the complexity of the scene. Additionally, the integration of information from both modalities in the proposed model yields superior predictions compared to models that solely rely on single modality information. Furthermore, the proposed AAF strategy, as compared to the other two fusion strategies (EF and LF), proves to be more effective.
Table 4 shows the main results of multi-label scene classification tasks for different methods when fine-tuned with 138 (%1 of SSL training set) samples. The models are evaluated in terms of a c c u r a c y and A A metrics. It is apparent that the model utilizing RGB data achieves better performance with respect to both a c c u r a c y and A A measures compared to the DSM model. This is consistent with the observation in the segmentation task, where we found that the DSM data is less informative and noisier compared with RGB data. The fusion of RGB and DSM modalities surpasses the use of any single modality, highlighting the complementary information that DSM data offers to improve classification performance. Notably, our proposed AAF method achieves the highest performance among all fusion strategies, emphasizing the effectiveness of the AAF module. Moreover, we find that the SSL pre-trained models significantly outperform the random baseline models, suggesting the potential advantages of utilizing self-supervised pre-training for enhancing multi-label scene classification performance.

4.5. Ablation Studies

Comparison of Different SSL pre-trained Methods. In Table 5, we compare our proposed method with another SSL framework Simsiam. Compared with MocoV2, Simsiam is based on distillation loss with an asymmetric structure, which does not use contrastive loss and has no negative pairs. As one can see, our proposed AAF method achieves consistent improvements compared with EF and LF. And MocoV2 shows better performance than Simsiam for both scene segmentation and classification tasks.
Table 6 presents a comparative analysis between our proposed AAF method and two recent state-of-the-art approaches, DINO-MM [45] and SSLTransformerRS [22]. DINO-MM utilizes a Vision Transformer Small (ViT-S) as its backbone and employs a DINO-based teacher-student network for training, adopting an early fusion strategy akin to our Early Fusion (EF) method. More details can be found in [45] and the codes (https://github.com/zhu-xlab/DINO-MM, accessed on 1 June 2022) are openly available. On the other hand, SSLTransformerRS is built upon a Swin Transformer Tiny backbone and is trained using contrastive learning, implementing a late fusion approach similar to our Late Fusion (LF). More details can be found in [22] and the codes (https://github.com/HSG-AIML/SSLTransformerRS, accessed on 28 April 2022) are openly available. The results showcased in the table clearly indicate that our AAF method significantly outperforms both DINO-MM and SSLTransformerRS across scene segmentation and classification tasks. These findings highlight the superior capability of AAF in effectively leveraging multi-modal data, not only surpassing conventional approaches but also outstripping recent advancements embodied by DINO-MM and SSLTransformerRS.
The effect of the Transfer Gate module. In Table 7, we perform ablation studies to verify the validity of the Transfer Gate module. The Transfer Gate module achieves consistent improvements for both scene segmentation and classification tasks across different SSL pre-training methods.
Ablation on loss in AAF on scene segmentation task: Since AAF is a two-branch framework, we can obtain two embeddings from the backbone. L [ a , p ] correspond to concatenating the output of the two-branches. L p and L a corresponds to only using the output of passive branch (with RGB data) or active branch (with DSM data). In Table 8, We can observe that we obtain the best performance with only L [ a , p ] and comparable results with only L p . However, when we combine L a , the performance of the model degrades. We hypothesize that DSM data is easier to overfit during SSL pre-training. Therefore, we empirically apply only L a , p in our experiments.
Ablation on combining attention methods on scene segmentation task. The experimental The results from the Table 9 on combining attention methods in the Transfer Gate module reveal a clear trend: the sequential combination of channel, spatial, and scale attentions yields the best performance, as evidenced by the highest scores in m I o U , O A , and K. This indicates that each attention type contributes uniquely to feature refinement, with their sequential application allowing for more nuanced feature extraction. In contrast, the parallel arrangement shows a slight decline in metrics, suggesting that independent processing of these attentions might not capture interdependencies as effectively. These insights validate the effectiveness of our sequential attention strategy in enhancing multi-modal remote sensing data analysis.

5. Conclusions

In this paper, we have delved into multi-modal representation learning in remote sensing through a novel self-supervised learning framework. The proposed Asymmetric Attention Fusion (AAF) module excels by performing data fusion at various encoder stages in an asymmetric manner, crucially allowing the module to weigh the contributions of different modalities based on their informativeness. This method emphasizes the importance of more informative modalities like optical imagery, while not allowing less informative modalities to detract from the model’s performance. The Transfer Gate module further refines this process with a trio of attention mechanisms, honing in on the most salient features for enhanced task-specific performance. The empirical outcomes from our experimentation validate the AAF module’s superior efficacy in comparison to other self-supervised methods, as it consistently outperforms them across multiple performance metrics in scene classification and segmentation tasks. Our findings highlight the potential of asymmetric attention in handling the diverse and complementary nature of multi-modal data, marking a significant step forward in remote sensing technology and laying groundwork for future advancements.

Author Contributions

Conceptualization, G.X. and X.J.; methodology, G.X. and Z.Z.; writing—original draft preparation, G.X., X.J. and X.L. (Xiangtai Li); writing—review and editing, G.X., X.J. and X.L. (Xiangtai Li); visualization, G.X. and Z.Z.; supervision, X.J. and X.L. (Xingzhao Liu). All authors have read and agreed to the published version of the manuscript.

Funding

This work was supported by the National Natural Science Foundation of China under Grants 61971279 and 62022054.

Data Availability Statement

Publicly available datasets were analyzed in this study. This data can be found here: https://www.isprs.org/education/benchmarks/UrbanSemLab/2d-sem-label-potsdam.aspx.

Conflicts of Interest

The authors declare no conflict of interest. The funders had no role in the design of the study; in the collection, analyses, or interpretation of data; in the writing of the manuscript; or in the decision to publish the results.

References

  1. Wellmann, T.; Lausch, A.; Andersson, E.; Knapp, S.; Cortinovis, C.; Jache, J.; Scheuer, S.; Kremer, P.; Mascarenhas, A.; Kraemer, R.; et al. Remote sensing in urban planning: Contributions towards ecologically sound policies? Landsc. Urban Plan. 2020, 204, 103921. [Google Scholar] [CrossRef]
  2. Lehmann, E.A.; Caccetta, P.; Lowell, K.; Mitchell, A.; Zhou, Z.S.; Held, A.; Milne, T.; Tapley, I. SAR and optical remote sensing: Assessment of complementarity and interoperability in the context of a large-scale operational forest monitoring system. Remote Sens. Environ. 2015, 156, 335–348. [Google Scholar] [CrossRef]
  3. Huang, Y.; Chen, Z.X.; Tao, Y.; Huang, X.Z.; Gu, X.F. Agricultural remote sensing big data: Management and applications. J. Integr. Agric. 2018, 17, 1915–1931. [Google Scholar] [CrossRef]
  4. Schumann, G.J.; Brakenridge, G.R.; Kettner, A.J.; Kashif, R.; Niebuhr, E. Assisting flood disaster response with earth observation data and products: A critical assessment. Remote Sens. 2018, 10, 1230. [Google Scholar] [CrossRef]
  5. Rolnick, D.; Donti, P.L.; Kaack, L.H.; Kochanski, K.; Lacoste, A.; Sankaran, K.; Ross, A.S.; Milojevic-Dupont, N.; Jaques, N.; Waldman-Brown, A.; et al. Tackling climate change with machine learning. ACM Comput. Surv. (CSUR) 2022, 55, 1–96. [Google Scholar] [CrossRef]
  6. He, K.; Fan, H.; Wu, Y.; Xie, S.; Girshick, R. Momentum contrast for unsupervised visual representation learning. In Proceedings of the IEEE/CVF Conference on Computer Vision and Pattern Recognition, Seattle, WA, USA, 14–19 June 2020; pp. 9729–9738. [Google Scholar]
  7. Chen, T.; Kornblith, S.; Norouzi, M.; Hinton, G. A simple framework for contrastive learning of visual representations. In Proceedings of the International Conference on Machine Learning, PMLR, Virtual Event, 13–18 July 2020; pp. 1597–1607. [Google Scholar]
  8. Caron, M.; Misra, I.; Mairal, J.; Goyal, P.; Bojanowski, P.; Joulin, A. Unsupervised learning of visual features by contrasting cluster assignments. Adv. Neural Inf. Process. Syst. 2020, 33, 9912–9924. [Google Scholar]
  9. Grill, J.B.; Strub, F.; Altché, F.; Tallec, C.; Richemond, P.; Buchatskaya, E.; Doersch, C.; Avila Pires, B.; Guo, Z.; Gheshlaghi Azar, M.; et al. Bootstrap your own latent-a new approach to self-supervised learning. Adv. Neural Inf. Process. Syst. 2020, 33, 21271–21284. [Google Scholar]
  10. Chen, X.; He, K. Exploring simple siamese representation learning. In Proceedings of the IEEE/CVF Conference on Computer Vision and Pattern Recognition, Nashville, TN, USA, 19–25 June 2021; pp. 15750–15758. [Google Scholar]
  11. Manas, O.; Lacoste, A.; Giró-i Nieto, X.; Vazquez, D.; Rodriguez, P. Seasonal contrast: Unsupervised pre-training from uncurated remote sensing data. In Proceedings of the IEEE/CVF International Conference on Computer Vision, Montreal, BC, Canada, 11–17 October 2021; pp. 9414–9423. [Google Scholar]
  12. Ayush, K.; Uzkent, B.; Meng, C.; Tanmay, K.; Burke, M.; Lobell, D.; Ermon, S. Geography-aware self-supervised learning. In Proceedings of the IEEE/CVF International Conference on Computer Vision, Montreal, BC, Canada, 11–17 October 2021; pp. 10181–10190. [Google Scholar]
  13. Li, W.; Chen, K.; Chen, H.; Shi, Z. Geographical knowledge-driven representation learning for remote sensing images. IEEE Trans. Geosci. Remote Sens. 2021, 60, 1–16. [Google Scholar] [CrossRef]
  14. Audebert, N.; Le Saux, B.; Lefèvre, S. Beyond RGB: Very high resolution urban remote sensing with multimodal deep networks. ISPRS J. Photogramm. Remote Sens. 2018, 140, 20–32. [Google Scholar] [CrossRef]
  15. Jiang, X.; Li, G.; Liu, Y.; Zhang, X.P.; He, Y. Change detection in heterogeneous optical and SAR remote sensing images via deep homogeneous feature fusion. IEEE J. Sel. Top. Appl. Earth Obs. Remote Sens. 2020, 13, 1551–1566. [Google Scholar] [CrossRef]
  16. Bermudez, J.; Happ, P.; Oliveira, D.; Feitosa, R. Sar to Optical Image Synthesis for Cloud Removal with Generative Adversarial Networks. ISPRS Ann. Photogramm. Remote Sens. Spat. Inf. Sci. 2018, 4, 5–11. [Google Scholar] [CrossRef]
  17. Gbodjo, Y.J.E.; Montet, O.; Ienco, D.; Gaetano, R.; Dupuy, S. Multisensor land cover classification with sparsely annotated data based on convolutional neural networks and self-distillation. IEEE J. Sel. Top. Appl. Earth Obs. Remote Sens. 2021, 14, 11485–11499. [Google Scholar] [CrossRef]
  18. Ienco, D.; Interdonato, R.; Gaetano, R.; Minh, D.H.T. Combining Sentinel-1 and Sentinel-2 Satellite Image Time Series for land cover mapping via a multi-source deep learning architecture. ISPRS J. Photogramm. Remote Sens. 2019, 158, 11–22. [Google Scholar] [CrossRef]
  19. Chen, Y.; Bruzzone, L. Self-supervised SAR-optical Data Fusion and Land-cover Mapping using Sentinel-1/-2 Images. arXiv 2021, arXiv:2103.05543. [Google Scholar]
  20. Wang, M.; Gao, F.; Dong, J.; Li, H.C.; Du, Q. Nearest Neighbor-Based Contrastive Learning for Hyperspectral and LiDAR Data Classification. IEEE Trans. Geosci. Remote Sens. 2023, 61, 1–16. [Google Scholar] [CrossRef]
  21. Lin, J.; Gao, F.; Shi, X.; Dong, J.; Du, Q. SS-MAE: Spatial-Spectral Masked Auto-Encoder for Multi-Source Remote Sensing Image Classification. arXiv 2023, arXiv:2311.04442. [Google Scholar]
  22. Scheibenreif, L.; Hanna, J.; Mommert, M.; Borth, D. Self-supervised vision transformers for land-cover segmentation and classification. In Proceedings of the IEEE/CVF Conference on Computer Vision and Pattern Recognition, New Orleans, LA, USA, 18–24 June 2022; pp. 1422–1431. [Google Scholar]
  23. Zhang, R.; Isola, P.; Efros, A.A. Colorful image colorization. In Proceedings of the Computer Vision–ECCV 2016: 14th European Conference, Amsterdam, The Netherlands, 11–14 October 2016; Proceedings, Part III 14. Springer: Amsterdam, The Netherlands, 2016; pp. 649–666. [Google Scholar]
  24. Doersch, C.; Gupta, A.; Efros, A.A. Unsupervised visual representation learning by context prediction. In Proceedings of the IEEE International Conference on Computer Vision, Santiago, Chile, 7–13 December 2015; pp. 1422–1430. [Google Scholar]
  25. Wang, X.; Gupta, A. Unsupervised learning of visual representations using videos. In Proceedings of the IEEE International Conference on Computer Vision, Santiago, Chile, 7–13 December 2015; pp. 2794–2802. [Google Scholar]
  26. Gidaris, S.; Singh, P.; Komodakis, N. Unsupervised representation learning by predicting image rotations. arXiv 2018, arXiv:1803.07728. [Google Scholar]
  27. Chen, X.; Fan, H.; Girshick, R.; He, K. Improved baselines with momentum contrastive learning. arXiv 2020, arXiv:2003.04297. [Google Scholar]
  28. Chen, X.; Xie, S.; He, K. An empirical study of training self-supervised vision transformers. In Proceedings of the IEEE/CVF International Conference on Computer Vision, Montreal, BC, Canada, 11–17 October 2021; pp. 9640–9649. [Google Scholar]
  29. He, K.; Chen, X.; Xie, S.; Li, Y.; Dollár, P.; Girshick, R. Masked autoencoders are scalable vision learners. In Proceedings of the IEEE/CVF Conference on Computer Vision and Pattern Recognition, New Orleans, LA, USA, 18–24 June 2022; pp. 16000–16009. [Google Scholar]
  30. Bao, H.; Dong, L.; Piao, S.; Wei, F. Beit: Bert pre-training of image transformers. arXiv 2021, arXiv:2106.08254. [Google Scholar]
  31. Dong, X.; Bao, J.; Zhang, T.; Chen, D.; Zhang, W.; Yuan, L.; Chen, D.; Wen, F.; Yu, N. Peco: Perceptual codebook for bert pre-training of vision transformers. arXiv 2021, arXiv:2111.12710. [Google Scholar] [CrossRef]
  32. Caron, M.; Touvron, H.; Misra, I.; Jégou, H.; Mairal, J.; Bojanowski, P.; Joulin, A. Emerging properties in self-supervised vision transformers. In Proceedings of the IEEE/CVF International Conference on Computer Vision, Montreal, BC, Canada, 11–17 October 2021; pp. 9650–9660. [Google Scholar]
  33. Tao, C.; Qi, J.; Lu, W.; Wang, H.; Li, H. Remote sensing image scene classification with self-supervised paradigm under limited labeled samples. IEEE Geosci. Remote Sens. Lett. 2020, 19, 1–5. [Google Scholar] [CrossRef]
  34. Kang, J.; Fernandez-Beltran, R.; Duan, P.; Liu, S.; Plaza, A.J. Deep unsupervised embedding for remotely sensed images based on spatially augmented momentum contrast. IEEE Trans. Geosci. Remote Sens. 2020, 59, 2598–2610. [Google Scholar] [CrossRef]
  35. Chen, W.; Zheng, X.; Lu, X. Hyperspectral image super-resolution with self-supervised spectral-spatial residual network. Remote Sens. 2021, 13, 1260. [Google Scholar] [CrossRef]
  36. Li, K.; Qin, Y.; Ling, Q.; Wang, Y.; Lin, Z.; An, W. Self-supervised deep subspace clustering for hyperspectral images with adaptive self-expressive coefficient matrix initialization. IEEE J. Sel. Top. Appl. Earth Obs. Remote Sens. 2021, 14, 3215–3227. [Google Scholar] [CrossRef]
  37. Chen, L.; Jiang, X.; Li, Z.; Liu, X.; Zhou, Z. Feature-Enhanced Speckle Reduction via Low-Rank and Space-Angle Continuity for Circular SAR Target Recognition. IEEE Trans. Geosci. Remote Sens. 2020, 58, 7734–7752. [Google Scholar] [CrossRef]
  38. Schmitt, M.; Zhu, X.X. Data fusion and remote sensing: An ever-growing relationship. IEEE Geosci. Remote Sens. Mag. 2016, 4, 6–23. [Google Scholar] [CrossRef]
  39. Ghamisi, P.; Rasti, B.; Yokoya, N.; Wang, Q.; Hofle, B.; Bruzzone, L.; Bovolo, F.; Chi, M.; Anders, K.; Gloaguen, R.; et al. Multisource and multitemporal data fusion in remote sensing: A comprehensive review of the state of the art. IEEE Geosci. Remote Sens. Mag. 2019, 7, 6–39. [Google Scholar] [CrossRef]
  40. Diakogiannis, F.I.; Waldner, F.; Caccetta, P.; Wu, C. ResUNet-a: A deep learning framework for semantic segmentation of remotely sensed data. ISPRS J. Photogramm. Remote Sens. 2020, 162, 94–114. [Google Scholar] [CrossRef]
  41. Hazirbas, C.; Ma, L.; Domokos, C.; Cremers, D. Fusenet: Incorporating depth into semantic segmentation via fusion-based cnn architecture. In Proceedings of the Computer Vision–ACCV 2016: 13th Asian Conference on Computer Vision, Taipei, Taiwan, 20–24 November 2016; Revised Selected Papers, Part I 13. Springer: Amsterdam, The Netherlands, 2017; pp. 213–228. [Google Scholar]
  42. Ma, X.; Zhang, X.; Pun, M.O. A crossmodal multiscale fusion network for semantic segmentation of remote sensing data. IEEE J. Sel. Top. Appl. Earth Obs. Remote Sens. 2022, 15, 3463–3474. [Google Scholar] [CrossRef]
  43. Amarsaikhan, D.; Blotevogel, H.; Van Genderen, J.; Ganzorig, M.; Gantuya, R.; Nergui, B. Fusing high-resolution SAR and optical imagery for improved urban land cover study and classification. Int. J. Image Data Fusion 2010, 1, 83–97. [Google Scholar] [CrossRef]
  44. Geng, J.; Wang, H.; Fan, J.; Ma, X. Classification of fusing SAR and multispectral image via deep bimodal autoencoders. In Proceedings of the 2017 IEEE International Geoscience and Remote Sensing Symposium (IGARSS), Fort Worth, TX, USA, 23–28 July 2017; pp. 823–826. [Google Scholar]
  45. Wang, Y.; Albrecht, C.M.; Zhu, X.X. Self-supervised vision transformers for joint SAR-optical representation learning. In Proceedings of the IGARSS 2022–2022 IEEE International Geoscience and Remote Sensing Symposium, Kuala Lumpur, Malaysia, 17–22 July 2022; pp. 139–142. [Google Scholar]
  46. He, K.; Zhang, X.; Ren, S.; Sun, J. Deep residual learning for image recognition. In Proceedings of the IEEE Conference on Computer Vision and Pattern Recognition, Las Vegas, NV, USA, 27–30 June 2016; pp. 770–778. [Google Scholar]
  47. Hu, J.; Shen, L.; Sun, G. Squeeze-and-excitation networks. In Proceedings of the IEEE Conference on Computer Vision and Pattern Recognition, Salt Lake City, UT, USA, 18–22 June 2018; pp. 7132–7141. [Google Scholar]
  48. Woo, S.; Park, J.; Lee, J.Y.; Kweon, I.S. Cbam: Convolutional block attention module. In Proceedings of the European Conference on Computer Vision (ECCV), Munich, Germany, 8–14 September 2018; pp. 3–19. [Google Scholar]
  49. Contributors. MMSelfSup: Openmmlab Self-Supervised Learning Toolbox and Benchmark. 2021. Available online: https://github.com/open-mmlab/mmselfsup (accessed on 16 June 2020).
  50. Long, J.; Shelhamer, E.; Darrell, T. Fully convolutional networks for semantic segmentation. In Proceedings of the IEEE Conference on Computer Vision and Pattern Recognition, Boston, MA, USA, 7–12 June 2015; pp. 3431–3440. [Google Scholar]
Figure 1. Comparison of three fusion approaches in SSL for remote sensing. (a) Early fusion: directly stacking the data before the backbone. (b) Late fusion: Stacking the output of the backbone. (c) Our proposed Asymmetric Attention Fusion (AAF): fusing at each stage of the backbone in an asymmetric way. The layers 1 to 4 in the model correspond to the four different stages in the ResNet architecture.
Remotesensing 15 05682 g001
Figure 2. Our proposed AAF SSL pretraining framework: (a,c) The self-supervised training is aimed at obtaining a backbone that can extract meaningful features with unlabeled remote sensing data and then fine-tune them with a few labels for downstream tasks. The Transfer Gate module is designed to select more appropriate multi-modal features to enter the downstream task head. (b) transfer pre-trained modal into down-stream tasks.
Remotesensing 15 05682 g002
Figure 3. Computational graph of the AAF module. ⊗ indicate matrix multiplication operations.
Remotesensing 15 05682 g003
Figure 4. Computational graph of the Transfer Gate module consists of three attention mechanisms: (1) channel attention, (2) spatial attention and (3) scale attention. ⊗, ⊕ and Ⓒ indicate element-wise multiplication, element-wise addition and concatenation, respectively.
Remotesensing 15 05682 g004
Figure 5. Visualization of scene segmentation maps by different considered methods.
Remotesensing 15 05682 g005
Table 1. Self-supervised learning methods.
CategoryRepresentative MethodsDescription
Pre-text Taskscolorization [23], patch orderings [24], tracking [25], rotation prediction [26] et al.Tasks designed to learn by predicting some defined properties or transformations of the input data.
Augmentation-InvarianceMocoV1 [6], MocoV2 [27], MocoV3 [28], SimClr [7], BYOL [9], SwAV [8], SimSiam [10] et al.Techniques that learn robust features by encouraging consistency between differently augmented views of the same image.
Masked Image Modeling (MIM)MAE [29], Beit [30], Peco [31], DINO [32] et al.Methods where parts of the input images are masked and the model is trained to predict the masked content.
SSL in RSIn-painting [33], SauMoCo [34], seasonal changes [11], geographical knowledge [12,13] et al.SSL approaches adapted for RS, addressing the specific challenges and characteristics of RS imagery.
Table 2. Description of the ISPRS Potsdam dataset used in our experiment.
DatasetGround ResolutionCrop SizeSSL Training SetSL Training SetSL Testing Set
Potsdam0.05 m256 × 25613,8241381500
Table 3. Results for segmentation downstream task. RGB and DSM models are individually trained using data exclusively from either the passive sensor or active sensor without data fusion. EF performs two modal data fusion at the input of model. LF performs two modal data fusion after a two-stream backbone. AAF fuses two modal data with an asymmetric attention fusion module at each stage of the backbone. Random baseline corresponds to training the segmentation downstream task model from scratch. SSL pre-trained corresponds to fine-tuning the pre-trained SSL model for the segmentation downstream task. Per-class I o U , m I o U , O A and K are reported. The bold items denote the optimal values in the rows.
Random BaselineSSL Pre-Trained
RGBDSMEFLFAAFRGBDSMEFLFAAF
low vege.38.1312.7743.0142.7442.6152.4718.651.4655.2463.21
trees57.7443.2267.1164.3165.8368.7544.3462.2469.8172.44
buildings23.5920.6431.0736.0734.1835.9736.3649.4851.6252.23
imperv.56.8072.6475.8480.3780.1173.4379.0362.9983.8283.87
cars14.170.1015.6316.4214.2210.563.1621.9626.6529.46
others35.6013.0026.4530.5142.2042.4313.6752.8157.1856.59
mIoU (%)37.6727.0643.1945.0746.5247.1132.5350.1657.3959.63
OA (%)59.7655.8466.1667.5970.2669.3959.3471.0478.2979.08
K (%)48.2040.0256.1258.5261.4160.3545.4862.5171.8172.78
Table 4. Results for multi-label scene classification task. RGB and DSM models are individually trained using data exclusively from either the passive sensor or active sensor without data fusion. EF performs two modal data fusion at the input of model. LF performs two modal data fusion after a two-stream backbone. AAF fuses two modal data with an asymmetric attention fusion module at each stage of the backbone. Random baseline corresponds to training the classification downstream task model from scratch. SSL pre-trained corresponds to fine-tuning the pre-trained SSL model for the classification downstream task. Per-class a c c u r a c y , and A A are reported. The bold items denote the optimal values in the rows.
Random BaselineSSL Pre-Trained
RGBDSMEFLFAAFRGBDSMEFLFAAF
low vege.67.7566.7167.6367.3068.3575.3666.3875.8276.9779.54
trees83.4980.5281.3380.1984.1282.1782.4985.6585.9986.14
buildings61.4261.4866.1863.7865.7265.5665.7173.1971.9672.13
imperv.74.8462.2772.9469.9371.3278.2676.6781.4979.4485.65
cars47.5847.2650.7455.6755.1355.3151.7956.0660.6261.63
others71.9872.1571.9771.9572.8471.0970.8973.0275.0776.13
AA (%)67.8465.0168.4768.1469.5871.2968.9974.2175.0176.87
Table 5. Comparison of different SSL pre-trained methods on both scene segmentation and classification tasks. The bold items indicate the optimal values in the column for each task.
MethodsTaskRGBDSMEFLateAAF
Rand.seg.37.6727.0643.1945.0746.52
Simsiam47.3327.9643.4052.6554.98
MocoV247.1132.5350.1657.3959.63
rand.cls.67.8465.0168.4768.1469.58
Simsiam71.8067.2371.0072.1073.30
MocoV271.2968.9974.2175.0176.87
Table 6. Comparison with the state-of-the-art methods on both scene segmentation and classification tasks. The bold items indicate the optimal values in the column for each task.
MethodsTaskmIoU (%)OA (%)K (%)AA (%)
DINO-MMseg.54.5174.3767.54-
SSLTransformerRS57.5076.5070.42-
AAF59.6379.0872.78-
DINO-MMcls.---72.82
SSLTransformerRS---74.75
AAF---76.87
Table 7. The effect of the Transfer Gate module. The bold items indicate the optimal values in the column for each task.
MethodsTaskGatemIoU (%)OA (%)K (%)AA (%)
Simsiamseg.w/o54.0373.8266.15-
w/54.9874.3666.91-
cls.w/o---72.92
w/---74.30
MocoV2seg.w/o57.4377.2670.51-
w/59.6379.0872.78-
cls.w/o---75.21
w/---76.87
w/o” stands for without the Transfer Gate module. “w/” signifies with the Transfer Gate module included.
Table 8. Ablation on loss in AAF on scene segmentation task. The bold items indicate the optimal values in the column. ✓ indicates the use of the corresponding loss.
L [ a , p ] L p L a mIoU (%)OA (%)K (%)
59.6379.0872.78
59.0678.5672.10
57.8277.1370.34
57.2276.8269.91
Table 9. Ablation on combining attention methods on scene segmentation task. The bold items indicate the optimal values in the column.
Attention MethodsmIoU (%)OA (%)K (%)
None57.4377.2670.51
Channel58.5378.0671.41
Channel + Spatial59.1378.5672.41
Channel + Spatial + Scale59.6379.0872.78
Channel & Spatial & Scale59.1378.6872.18
“+” represents the sequential combination of attention methods. “&” represents the parallel combination of attention methods.
Disclaimer/Publisher’s Note: The statements, opinions and data contained in all publications are solely those of the individual author(s) and contributor(s) and not of MDPI and/or the editor(s). MDPI and/or the editor(s) disclaim responsibility for any injury to people or property resulting from any ideas, methods, instructions or products referred to in the content.

