1. Introduction
It is widely recognized that forest drought and wildfires are increasing occurrences due to global climate change. In this scenario, monitoring forest conditions in relation to precipitation and drought stress becomes a crucial tool. In fact, monitoring and early detection can inform management schedules and activities to lessen the risks associated with rising temperatures. Widening the range and scope of forest monitoring systems is important because of the crucial role that forests play as a form of carbon storage, as an economic resource, and as a habitat to ensure the world’s biodiversity. Because of the increasing threats posed by climate change and the key role that the carbon cycle plays in this, it is of growing importance to monitor the Earth’s forests and understand the relationships and correlations among factors in this complex ecosystem. Forests cover approximately 31% of the planet’s surface—4.06 billion hectares (FAO, 2020). They account for approximately 72% of the Earth’s terrestrial carbon storage, meaning that vegetation biomass is a larger global store of carbon than the atmosphere.
Vegetation surface water content (VSW) is a parameter that can anticipate the spread and severity of forest loss due to drought stress or the spread of wildfires. The value of satellite and airborne remote sensing stands out because it produces datasets over large spatial extents at relatively low costs. Therefore, the detection of VSW with remote sensing instruments can provide forest managers with timely and spatially relevant information about the risk status of their areas of authority in a cost-effective manner.
Optical sensors have historically been the chosen remote-sensing tool in forestry, and there are many examples of the successful retrieval of vegetation surface water (VSW) being achieved with optical remote sensing [
1]. Numerous established and validated methodologies have been employed, garnering widespread acceptance due to their robustness and reliability, such as the retrieval of VSW using spectral reflectance [
2,
3], vegetation water indices [
4,
5], and radiative transfer models [
6,
7]. Despite this, in certain areas of the world (e.g., tropics, polar regions), optical sensors prove ineffective due to prevailing and persistent cloud cover or daylight restrictions.
Synthetic aperture radar (SAR) provides an alternative that can penetrate clouds independent of daylight and weather conditions. SAR systems exhibit a side-looking imaging geometry and operate on a pulsed radar mounted on a moving platform. The radar system emits high-power electromagnetic pulses and sequentially captures the echoes of the backscattered signal [
8]. The transmitted pulse interacts with the Earth’s surface, and only a fraction of it is backscattered to the receiving antenna. The amplitude and phase of the backscattered signal are dependent on the physical characteristics (such as geometry and roughness) and electrical properties (such as dielectric permittivity) of the imaged object. Depending on the frequency band, significant penetration may occur, necessitating the modelling of imaged objects and media as volumes (e.g., vegetation, ice and snow, dry soil). Radar systems employing longer wavelengths lead to increased electromagnetic pulse penetration in media. [
9]. As such, wavelength is a parameter that will dictate the perceivable properties of the imaged object. The chosen wavelength affects what the radar will detect, and is thus selected based on the goal of the study. Within the microwave portion of the electromagnetic spectrum, the wavelength bands range from 0.8 cm λ, for the Ka band, to 100 cm λ for the P band (λ is the symbol indicating wavelength). A list of microwave bands that were most used by the radar community is presented in
Table 1. Wavelength is the primary factor affecting the penetration ability of the radar: longer wavelengths mean greater penetration through soil, snowpack or forest canopy [
10].
In addition, polarization modes are selected based on availability and requirements. Radar signal is polarized, which means the vibrations in the vector of radiation are confined to one plane [
12]. There are four main types of controlled polarization:
HH: horizontal transmit, horizontal receive.
HV: horizontal transmit, vertical receive.
VV: vertical transmit, vertical receive.
VH: vertical transmit, horizontal receive.
The nature of the imaged object will dictate the choice of polarization. Furthermore, the characteristics of the object influence the radar signal. Roughness is a relative concept, but as a rule of thumb it can be described as the height variation (in the order of centimetres) within the targeted object relative to the wavelength [
12]. A smooth surface (i.e., open water) reflects the radar signal away from the radar and thus will appear dark, while a rough surface will appear bright because the signal will be scattered in different directions. Volume scattering refers to the scattering of radar energy within a volume, that is, a target surface that consists of multiple volumes (i.e., vegetation, snowpack). Geometry affects the returned signal in a similar way to roughness but at a larger scale. For example, urban areas produce a very bright image because of the flat and perpendicular (to the ground) geometry of the buildings, causing the ‘double-bounce’ effect [
12]. The dielectric constant—also known as relative permittivity—is a measure of the electric properties of the object. This is a measure of the permittivity and conductivity of the object, and is highly affected by the moisture content. In dry conditions, most natural materials have a dielectric constant between 3 and 8 (in the microwave region), but as water has a dielectric constant of 80, the presence of moisture in the targeted object greatly influences this parameter. As a result, a change in moisture content provokes a significant increase in radar reflectivity [
10].
SAR has long been employed in silvicultural studies, and there is a large record of the successful application of SAR in monitoring forest change and biomass [
13,
14,
15,
16,
17,
18,
19,
20]. The continuous technological advances and increasing number of available sensors [
11] have resulted in the emergence of new approaches to forest monitoring. The launch of ESA’s Sentinel-1 satellites in 2014, along with its free data policy, facilitated research on the topic. In fact, C-band SAR—Sentinel-1′s—data are particularly suitable for forest canopy studies as the wavelength penetrates the vegetation volume [
8,
21]. The interest in improving SAR-based methods as complementary datasets over consistently cloudy regions is continuously growing, despite instances of optical-based analysis providing far greater accuracy than radar-based methods [
22]. Ruiz-Ramos et al. (2020) [
19] developed an approach to map forest structural changes: this method utilizes a dense series of Sentinel-1 C-band satellite images to achieve continuous and near-real-time monitoring, with an overall accuracy of 77%. Bouvet et al. (2018) [
15] introduced a new deforestation indicator based on the distinctive geometric artifact that manifests as a shadow along the border of deforested areas, achieving a detection rate of more than 95%, also using Sentinel-1 C-band data. Dual polarization C-band data proved effective in quantifying the biomass of complex sub-tropical forests [
20]. While many studies focused on the detection of forest degradation and deforestation, the literature on the influence that environmental factors such as Vegetation Surface Water (VSW) exert on SAR signals is very limited. The influence of vegetation surface water (VSW) content on the backscatter coefficient (σ
0) from forests was investigated by Rignot et al. (1994) [
23], who concluded that, in taiga forest ecosystems, the variation in C-band backscatter is explained by the changes in the dielectric properties of the forest canopy and forest floor, induced by seasonal patterns of precipitation and freezing. Similarly, the effect on the SAR backscatter of moisture-driven changes in the dielectric properties of forests were analyzed by de Jong et al. (2000), who [
24] studied the C-band backscatter acquired by the ERS1 and ERS2 satellites and found that the backscatter of a closed, broadleaf forest can show an observed change of 0.7 dB and 2.5 dB when dry or wet. Interestingly, conifer-dominated plots of temperate forest showed a more evident backscatter increase in the presence of VSW compared to deciduous plots in Vaca and van der Tol (2018) [
25], who found that the backscatter of a Douglas fir canopy is ~1.5 dB and ~1 dB higher than when the canopy is dry at C-band VH and VV polarization, respectively. Cross-polarization backscatter observation yielded a higher coefficient in the study Doblas et al. (2020) [
26] as well, who also utilised Sentinel-1 C-band data, in this case in the Amazonian tropical forest. These four studies represent the most relevant documentation of attempts to quantify the impact of naturally occurring VSW on microwave backscatter within forested environments. In contrast, the literature on microwave detection of the dielectric properties of vegetation and how moisture affects them, in relation to crop species and irrigation, is vast [
27,
28,
29,
30,
31,
32,
33]. In light of this gap in silvicultural research, the authors believe there is a need to expand our collective understanding of the impact of VSW on forest canopies due to the growing importance of monitoring forest health and resilience to drought.
This study investigated the change in the C-band backscatter of a temperate coniferous forest on days in which precipitation occurred. Our objectives were: (1) to investigate whether it was possible to detect VSW over conifer-dominated plots of forest plantations (i.e., detecting changes in dielectric properties); (2) to investigate whether single-polarization or dual-polarization C-band signal is more sensitive to VSW.
2. Methods
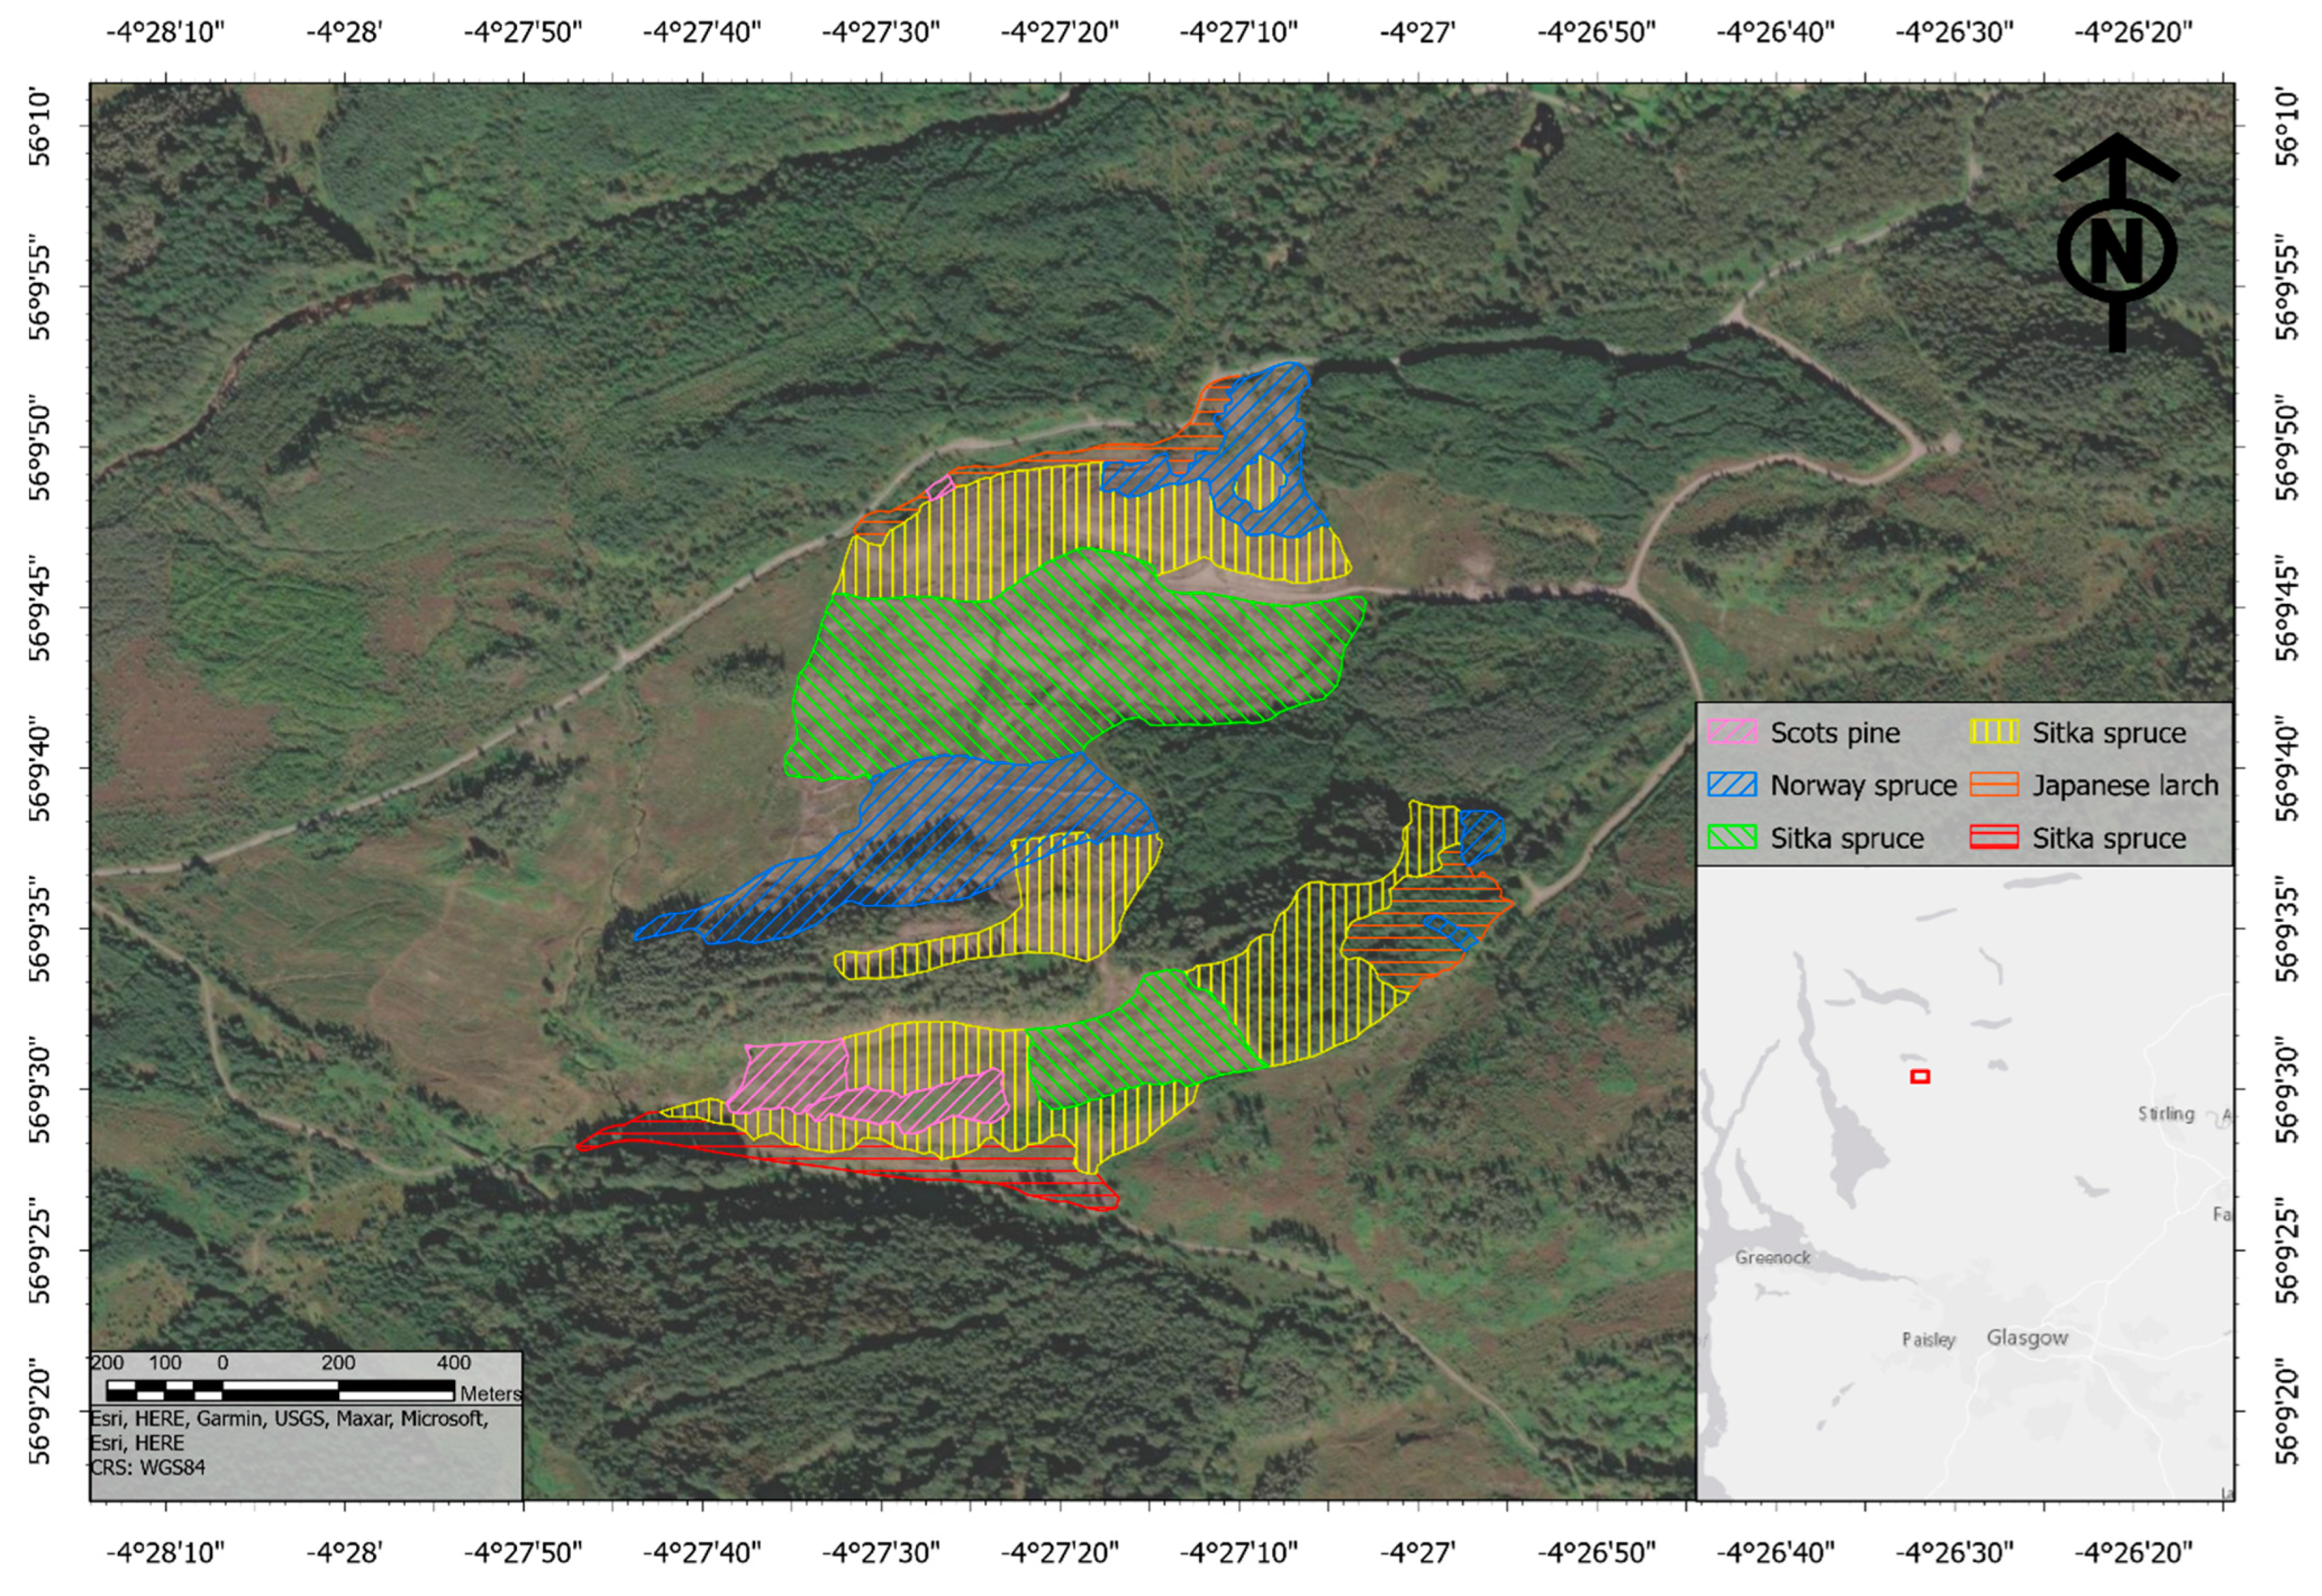
The area of study is part of the Queen Elizabeth Forest Park near Aberfoyle, central Scotland. This area is strictly managed as a logging concession, so regular logging operations take place in the area.
2.1. Forestry Data
The data on the observed plantation plots, depicted in
Figure 1, were provided by ‘Forest Research—Aberfoyle District management and planning team’, which collected and shared its measurement on dominant species (more than 20%) and top height of canopy (Crown Copyright, courtesy Forestry Commission (2020), licensed under the Open Government Licence—
https://www.forestresearch.gov.uk/ (accessed on 10 October 2019). A summary of the details of the plots can be seen in
Table 2.
Each group was divided into two or three different polygons by the original sampling authorities based on felling regime, year of plantation, and other variables which are not relevant to this study and hence will not be further looked at. An extensive record of rainfall—in millimetres per day—was obtained courtesy of the Scottish Environmental Protection Agency (SEPA), which owns and monitors weather stations across the country—for this project, data collected from the High Corrie station, located 3.8 km from the centre of the area of interest, were utilized (contains SEPA data © Scottish Environment Protection Agency and database right [2020], all rights reserved). The temperature data—in degrees Celsius—were provided by the Met Office (© Crown Copyright [2020]. Information provided by the National Meteorological Library and Archive—Met Office, Exeter, UK), and was collected from a weather station at Gartocharn Portnellan Farm, 18.6 km from the location of the plots.
2.2. SAR Data
The SAR data were obtained through the Google Earth Engine platform (GEE) available at:
https://earthengine.google.com/ (accessed on 15 October 2019). This contains open-source data from ESA for the C-band SAR Sentinel-1 mission. The characteristics of the dataset acquired for the purpose of this study are defined by the acquisition mode, in this case, IW_GRD_HR: Interferometric Wide Swath GRD High Resolution. This entails a 16-bit dual polarization product with a 10 × 10 m ground spatial resolution, and a mean incidence angle of 38.3° over the study area (ESA 2016). The preprocessing steps applied by Google Earth Engine include thermal noise removal, radiometric calibration, terrain correction, and conversion of the backscatter intensities to a logarithmic scale, i.e., decibels. Subsequently, the data are projected by GEE to a common grid to ensure pixel alignment or co-registration. We used both VV and VH polarizations, filtering the imagery to include ascending orbits only. This is to avoid changes being introduced by the looking angle, as occurs when ascending and descending passes are combined. To extract the backscatter time series for an individual sample from the in situ information, a buffer of 30 m radius is applied to each location. The pixels that fall within this buffered area are then averaged. Since this procedure is implemented, no speckle filtering was deemed to be necessary. All data—rainfall, temperature, backscatter, and canopy details—covered the period between 1 January 2017 and 25 September 2019. Across this time, the datapoints were collected every 6 days as per the Sentinel-1 repeat cycle.
2.3. Statistical Analysis
The collated data were imported into RStudio 4.3.0 for sorting and analysis. For each forest group, the average of the backscatter of all pixels was calculated per each day. Although rainfall and temperature observations were made daily, every sixth datapoint was extracted and included in the data frame to match the Sentinel-1 acquisition cycle.
It was decided to firstly apply a multiple regression analysis to the data set, followed by a generalised linear model (GLM). In the analysis, the (sigma nought) σ0 intensity values were included as the response variables, and rainfall was included as a predictor. Moreover, due to the intuitive correlation between rainfall and daily surface temperature, temperature values were also included as a predictor. A collinearity test between these two variables was then performed to assess the fit of the models. Finally, the tree plot data, including top height and dominant species (Scots pine, Norway spruce, Sitka spruce, Japanese larch), were also considered as predictors when conducting the analysis but were only included in the attempts to conduct a multiple regression analysis. In the case of the GLM, the variable of rainfall was converted to binary, with 0 meaning no rain was recorded that day, and 1 meaning any amount of rainfall was recorded that day.
Subsequently, using R package [
34], we built a random forest model (RF). K-fold cross-validation was implemented in the model with a K value of 5- to prevent overfitting. It was decided to include the RF model in case our assumption of linearity was not met. The independent variables in the RF are rain (mm), temperature (°C), average height (m), and dominant species. The RF model allowed for us to build a data frame of observed and predicted values, the agreement of which was then examined with Pearson’s product-moment correlation test (significance at
p-value < 0.05).
4. Discussion
The first objective of this study was to investigate whether it is possible to detect the change in permittivity triggered by the VSW of conifer-dominated forest plots with Sentinel-1 data. Our methodology revealed that VSW does modulate backscatter in these conditions; however, that modulation is not affected by the cumulative amounts of water that occurred due to precipitation. We propose two reasons for this: (1) it is known that heavy rain can disturb the backscatter [
35,
36]; (2) foliage, unlike soil, is a relatively dry environment because wind, the movement of branches and temperature eliminate the water quite rapidly [
37,
38]; therefore, the excess water in the canopy is eliminated at higher rates than can be detected. It is suspected that the choice of wavelength has an impact on the poor results when considering the accumulated rainfall. The C-band signal does not have a great penetrative ability in in forest canopies as it reaches saturation much faster than longer wavelengths [
39,
40]. We suspect that as rainwater accumulates below the canopy, it escapes the radar signal.
The GLM results in
Table 5 report an increase of 0.35 dB in VV backscatter, and of 0.45 dB in VH backscatter, on days with reported rainfall events. This is in alignment with a previous study by Vaca and Van der Tol (2018) [
25]. They used the same data product employed in this paper and found that the backscatter of a wet Douglas fir canopy is ~1.5 dB and ~1 dB higher than the backscatter when the canopy is dry at VH and VV polarizations, respectively. Their study also looked at beech stands and found that the rainfall effect was not detectable on beech-dominated plots. This suggests that our detection of backscatter increases in the presence of VSW may have been facilitated by the characteristics of the forest plots. In fact, coniferous species, such as those observed in this research, have a stronger tendency to produce higher backscatter when wet compared to deciduous species [
25], possibly due to the greater rain-storage capacity of needles [
41]. Additionally, the time series variations in the power of volume scattering due to the foliage growth and the drop in the case of deciduous tree species is much higher than the variation due to the autumn needle drop in the case of conifers [
16]. This was confirmed in a study [
42] considering a mixed forest in Northern Switzerland, where a time series analysis was conducted with Sentinel-1 C-band backscatter in VV and VH polarization. Their results supported this concept, illustrating that the seasonal signatures of the spruce-dominated forest plots were less pronounced and more gradual than their deciduous counterparts. The summary of the backscatter values of the dataset hereby used (reported in
Table 3) coincides with the values reported in Rüetschi and colleagues’ study [
42], validating the present values. This minor seasonal variation in conifers is assumed to have benefitted this research, since the radar data range across two years and hence span multiple seasons. Consequently, the approximately constant appearance of conifers might have led to a more uniform radar signal, which allowed for a more accurate deduction of the effects of surface water. While we recognize the effect that seasonal variations may have had on the quality of the data, it is notable that this research did not present a timeseries evaluation of the backscatter. The reason for this is that the aim of this study was to detect the
relative variation at the pixel level triggered by changes in dielectric properties due to VSW. The potential influence that seasonality can have on the signal is present in all the images; therefore, accounting for this goes beyond the scope of this study.
Species variation is treated in a similar fashion. As highlighted by the scatter plots in
Figure 6,
Figure 7,
Figure 8 and
Figure 9, the dominant species clearly dictates the zonation of the backscatter values across the full range. The coefficient tables confirm this as well, suggesting that each tree species might have an identifiable backscatter signature. This aligns with the findings of Udali et al. (2021) [
43], who evaluated the capacity of C-band SAR backscatter to accurately perform tree species classification. They found that coniferous tree species were more suitable for classification, as they showed larger differences in backscatter between each other than deciduous species. It is significant that our analysis confirms Sentinel-1′s use in tree classification and, while it offers a direction for future research, species classification was beyond the scope of this research. Similarly to seasonality, dominant species affected each image equally; therefore, they would not affect the observability of relative variation.
The results of this study report that the presence of surface water on vegetation due to the occurrence of rainfall triggers an increase in radar backscatter of ±0.45 dB in VH, and ±0.35 dB in VV, suggesting that cross-channels are better suited to forestry studies. This outcome is in agreement with existing research. In fact, higher sensitivity to precipitation-induced backscatter increases in VH polarization was also noted in tropical forests by Doblas et al. (2020) [
26], and VH performed better in the study of Vaca and Van der Tol as well [
25].
The authors propose that our results are highly influenced by the canopy characteristics, both at a high level, e.g., tropical versus temperate forest, and at species level. Seasonality and forest properties such as age and height also have an impact on backscattering properties. A limitation of this research is the lack of consideration of forest biomass, which also affects backscatter [
8]. Future research can improve on this study by aggregating VSW detection with forest above-ground biomass evaluation, potentially incorporating longer wavelengths as they have, at times, proved to be better-suited to biomass estimation [
39]. Nevertheless, this research inserts itself in a growing archive of empirical proof that surface water content in forest vegetation causes a quantifiable increase in co-polarised and cross-polarised SAR backscatter.


 ,
, 


