Abstract
With the development of human society, the balance between the minimum ecological instream flow requirement (MEIFR), which is an essential part of the ecological water demand in arid areas, and anthropogenic water depletion has received increasing attention. However, due to the lack of hydrological station data and river information on arid basins, previous researchers usually considered only the individual ecological water demand of rivers, lakes, or oases. To address this issue, a new method that combines river hydraulic parameters and the wet circumference obtained by an unmanned aerial vehicle (UAV) and remote sensing hydrological station (RSHS) technologies was applied to obtain the MEIFR and, then, systematically and quantitatively explore the balance from the perspective of the entire basin of Aiding Lake from 1990 to 2022, which is the lowest point of Chinese terrestrial territory. The results showed the following: (1) since 1990, the discharge of the seven rivers in the study area increased by 1–6%, and the MEIFR of these rivers increased by 15–100%; both quantities decreased by 3–5% from the upper to the lower reaches of the basin; (2) the surface area and water level of Aiding Lake decreased by 5% and 14%, respectively, but the MEIFR first decreased by 25% from 1990 to 2013 and, then, increased by 66.7% from 2013 to 2022; and (3) from 2011 to 2022, the MEIFR and anthropogenic water depletion exhibited a balance. Against the background of climate change, this research revealed that the MEIFR of the rivers in the Aiding Lake Basin have shown an upward trend over the past 30 years and quantitatively determined the above balance relationship and the period of its occurrence. This study supplied a method that could provide guidance for water resource management by decision-makers at a global level, thus helping achieve the sustainable development goals (SDGs).
1. Introduction
What is the ecological water demand (EWD)? Researchers have considered this question for a long time and proposed unique perspectives on determining the conception of the EWD since the 1980s. Petts [1] suggested combining fish growth and riverside environmental maintenance to determine EWD. Bovee and Gleick [2,3] proposed incorporating benthic communities based on previous research. Some researchers considered the concept of minimum ecological instream flow requirement (MEIFR) which is the minimum flow needed to maintain the basic instream ecological functions [4,5,6,7]. The MEIFR is a vital part of the ecological water demand, and its relationship with anthropogenic water depletion is receiving increasing attention due to the associated threshold value, which considerably influences the water environment. The occurrence of a balance between the MEIFR and anthropogenic water depletion is an essential scientific question.
In arid areas, the MEIFR should be prioritized due to ecosystem fragility, for which protection is critical. Global studies on the MEIFR in arid areas have mainly focused on river channels, lakes, and salt lakes, as well as the terrestrial ecological and environmental water demands, such as oases, to determine the balance between the MEIFR and anthropogenic water depletion [6,8,9]. One model was built to evaluate the MEIFR conditions in the arid western regions of the United States, an ecological flow evaluation model has also been constructed, and some researchers have provided quantitative indicators for the MEIFR at the regional scale [6,8,9]. All these studies showed that calculating the MEIFR in arid areas is the key point to exploring the balance between the MEIFR and anthropogenic water depletion; they also suggest that under favorable MEIFR conditions, surface water resources can be fully utilized.
MEIFR calculation methods mainly include hydrological, modeling, vegetation-based, hydraulic, and statistical methods. Hydrological methods include the Tennant method and river flow increment method, which can be used to roughly estimate the MEIFR, but the results are not very accurate [10,11]. Modeling methods can systematically determine MEIFR determination from water resource management and hydrological cycle perspectives; these methods include water resource management, hydroclimatic, hydroclimatic coupling, water condition regulation, and system dynamics models [12,13,14,15,16]. Ecological methods include the MPDI monitoring vegetation method and arid zone vegetation method, which use vegetation parameters to estimate the demand, representing an improvement over previous approaches [17]. The main hydraulic method is the wet-circumferential method [5]. Statistical methods include iterative methods and big data-based prediction models [18,19].
However, studies on MEIFR calculation and determination of the balance in inland arid areas from the upper to the lower reaches of rivers and from desert to oasis areas in the river basin are insufficient, leading to results on small spatial scales that lack applicability across entire basin areas. Moreover, most methods involve the use of data obtained based on models and corresponding hydrological calculation methods that do not exhibit high precision and accuracy. In addition, studies on the strategic allocation of the MEIFR and human economic and water demands do not include long-term comparisons, so there is a lack of exploration regarding the balance between the above quantities. Therefore, it is essential to solve these deficiencies of previous research systematically and reasonably. In addition, we must determine the balance between the MEIFR and anthropogenic water depletion and its occurrence period on the basis of comprehensive and extensive MEIFR data.
To accurately estimate the MEIFR and systematically and quantitatively explore the balance between the MEIFR and water use in arid areas at the scale of the entire basin, we must use a method that is suitable for small- and medium-sized rivers with scarce hydrological data. Remote sensing technology has been widely applied in monitoring and acquiring river hydrological parameters due to its advantages, such as rapid data acquisition, spatial richness, and temporal extensibility [20]. Moreover, low-altitude unmanned aerial vehicle (UAV) technology can improve the deficiency of the collection of hydrological parameters for small- and medium-sized rivers and their poor spatial resolution via satellite remote sensing technology [21]. Yang et al. and Lou et al. [22,23] proposed an effective river flow monitoring technique, namely, the remote sensing hydrological station (RSHS) technique.
In this research, we combined UAV remote sensing technology with traditional hydraulic methods to calculate the MEIFR in arid areas and determined the balance period for anthropogenic water depletion. The main objectives of this research include the following: (1) retrieval of the river discharge over the past 32 years via remote sensing data; (2) calculation of the MEIFR of the whole basin via a new method combined with a hydrological model and UAV remote sensing technology; and (3) determination of the MEIFR balance point of the basin based on extensive data.
2. Materials and Methods
2.1. Study Area
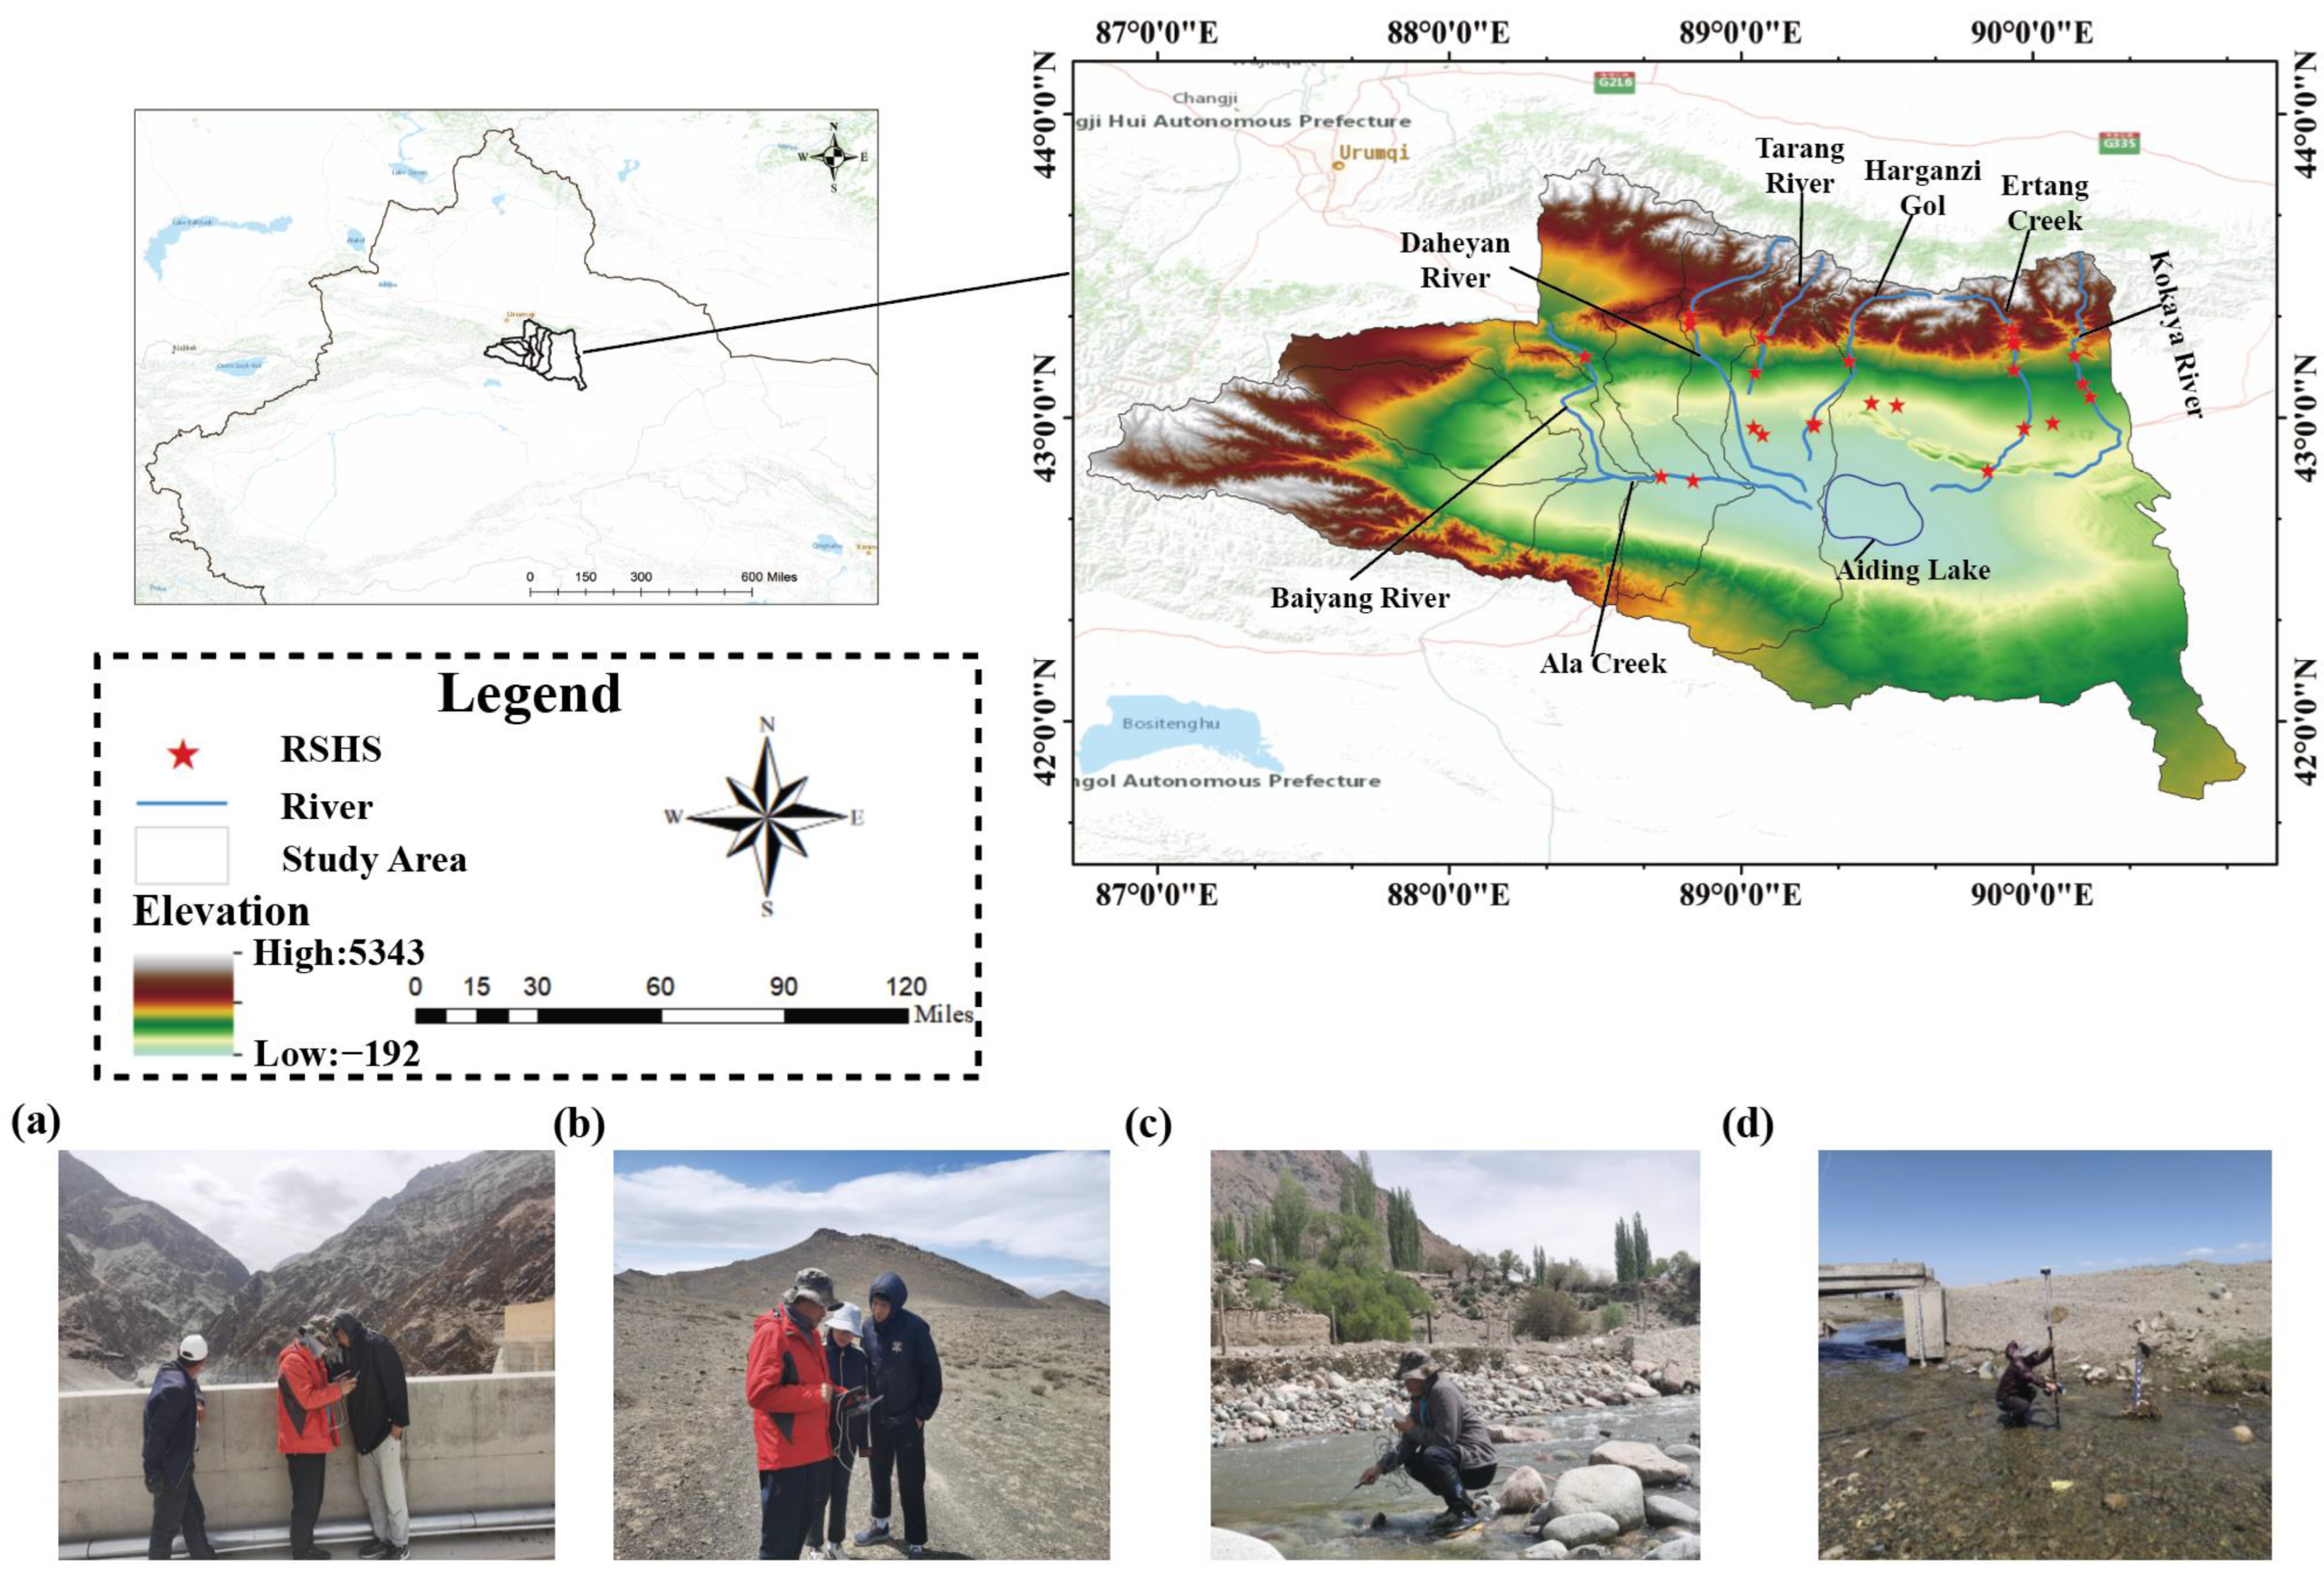
The Turpan Basin as the study area, which is located in the inland arid basin of Xinjiang Province in Northwest China, was selected as the study area (Figure 1). This basin experiences a unique warm temperate arid desert climate. Moreover, Aiding Lake is the lowest point of mainland China. The geographical co-ordinates of Aiding Lake range from approximately 89°10′–89°40′E and 42°32′–42°43′N, and the basin of Aiding Lake is a typical closed inland lake basin, with an area of approximately 43,417 km2.

Figure 1.
Overview of the research area, the location of river sections on the Aiding Lake Basin and rivers and the in situ river cross-sectional surveys include (a,b) UAV monitoring survey of river sections; (c) measurement of the water velocity in river channels by using a cup-type current meter; and (d) river channel slope measurement using real-time kinematic (RTK) technology.
The annual average precipitation in this area is 16.4 mm, with an uneven distribution and significant seasonal differences. The precipitation is low and mostly intermittent. The surface water resources in the research area mainly include rivers, lakes, and snowcapped mountains. The rivers in the Aiding Lake Basin originate from the mountains in the north and the Tianshan Mountains in the west. In these high mountains, snow and glaciers exist year-round. There are seven major rivers in the Aiding Lake Basin, namely, the Baiyang River, Ala Creek, Harganzi Gol, Tarang River, Daheyan River, Kokaya River, and Ertang Creek (Figure 1). They form an important part of the surface water supply of Aiding Lake, and originate from the snowcapped mountains in the northern part of Turpan Basin.
In recent years, the population of the Aiding Lake Basin in Turpan has exhibited an increasing trend, with a significant increase in the domestic water use, while the cultivated land area in the ecological zone of Aiding Lake has rapidly increased. Agriculture is a major source of social and economic water use in Aiding Lake, while industrial water consumption has also increased with the development of human society, representing the second largest source of water use.
2.2. Datasets
Three types of data, including remote sensing data, in situ survey data, and statistical data, were used in this research (Table 1). Four types of satellite and UAV images were used as data sources. Combined with field-observed hydraulic parameters, a three-dimensional digital river cross-section model was established to obtain long-term river flow data. A DJI Mavic Air 2 UAV, which provides data with a high spatial resolution (5 cm × 5 cm), was applied to collect land surface information of 25 small- and medium-sized inland river sections in the Aiding Lake Basin. With the help of UAV image processing software Pix4D mapper v4.5.6, high-precision images were obtained based on image synthesis, point cloud refinement and spatial information calibration were conducted, and a centimeter-level digital surface model (DSM) and a digital orthophoto map (DOM) were generated. Moreover, position and elevation data for the digital river cross-section model were collected in the field. Open and freely available satellite images, including Sentinel-2, Landsat-8, Landsat-7, and Landsat-5 series images, were used as data sources to determine the river body width on a monthly scale from 1990 to 2022. With the use of the Google Earth engine (GEE, https://earthengine.google.com/) on the cloud platform, we effectively completed image projection, image stitching, cutting, and radiation correction calibration, and we used the green and near-infrared bands to calculate the normalized difference water index (NDWI).

Table 1.
Datasets sources.
The in situ survey data included the velocity and water depth of each section. The velocity was measured by a rotating element current meter, and the water depth was measured by a deep smart sonar. Finally, the hydraulic parameters of the channel sections of these rivers were determined, including the discharge and wet circumference. We retrieved historical statistical data of the hydrological discharge from relevant departments and the Xinjiang Statistical Yearbook.
2.3. Methods
2.3.1. Remote Sensing Hydrological Station Technology for River Discharge Calculation
To obtain river discharge data for the study area, we adopted the remote sensing hydrological station (RSHS) technique [24,25] to monitor the discharge and conduct inversion for the 7 main rivers in the Aiding Lake Basin. The main technical aspects were three-dimensional modeling of low-altitude remote sensing data, field data acquisition, remote sensing flow estimation, and hydrological model simulation analysis based on hydrology, hydraulics, and quantitative remote sensing [25,26]. A remote sensing flow estimation system was established in the interactive data language development environment, coupled with an ecohydrological model system, and a model establishment method was constructed suitable for medium and small rivers in areas lacking hydrological data [26]. The specific operation process was as follows:
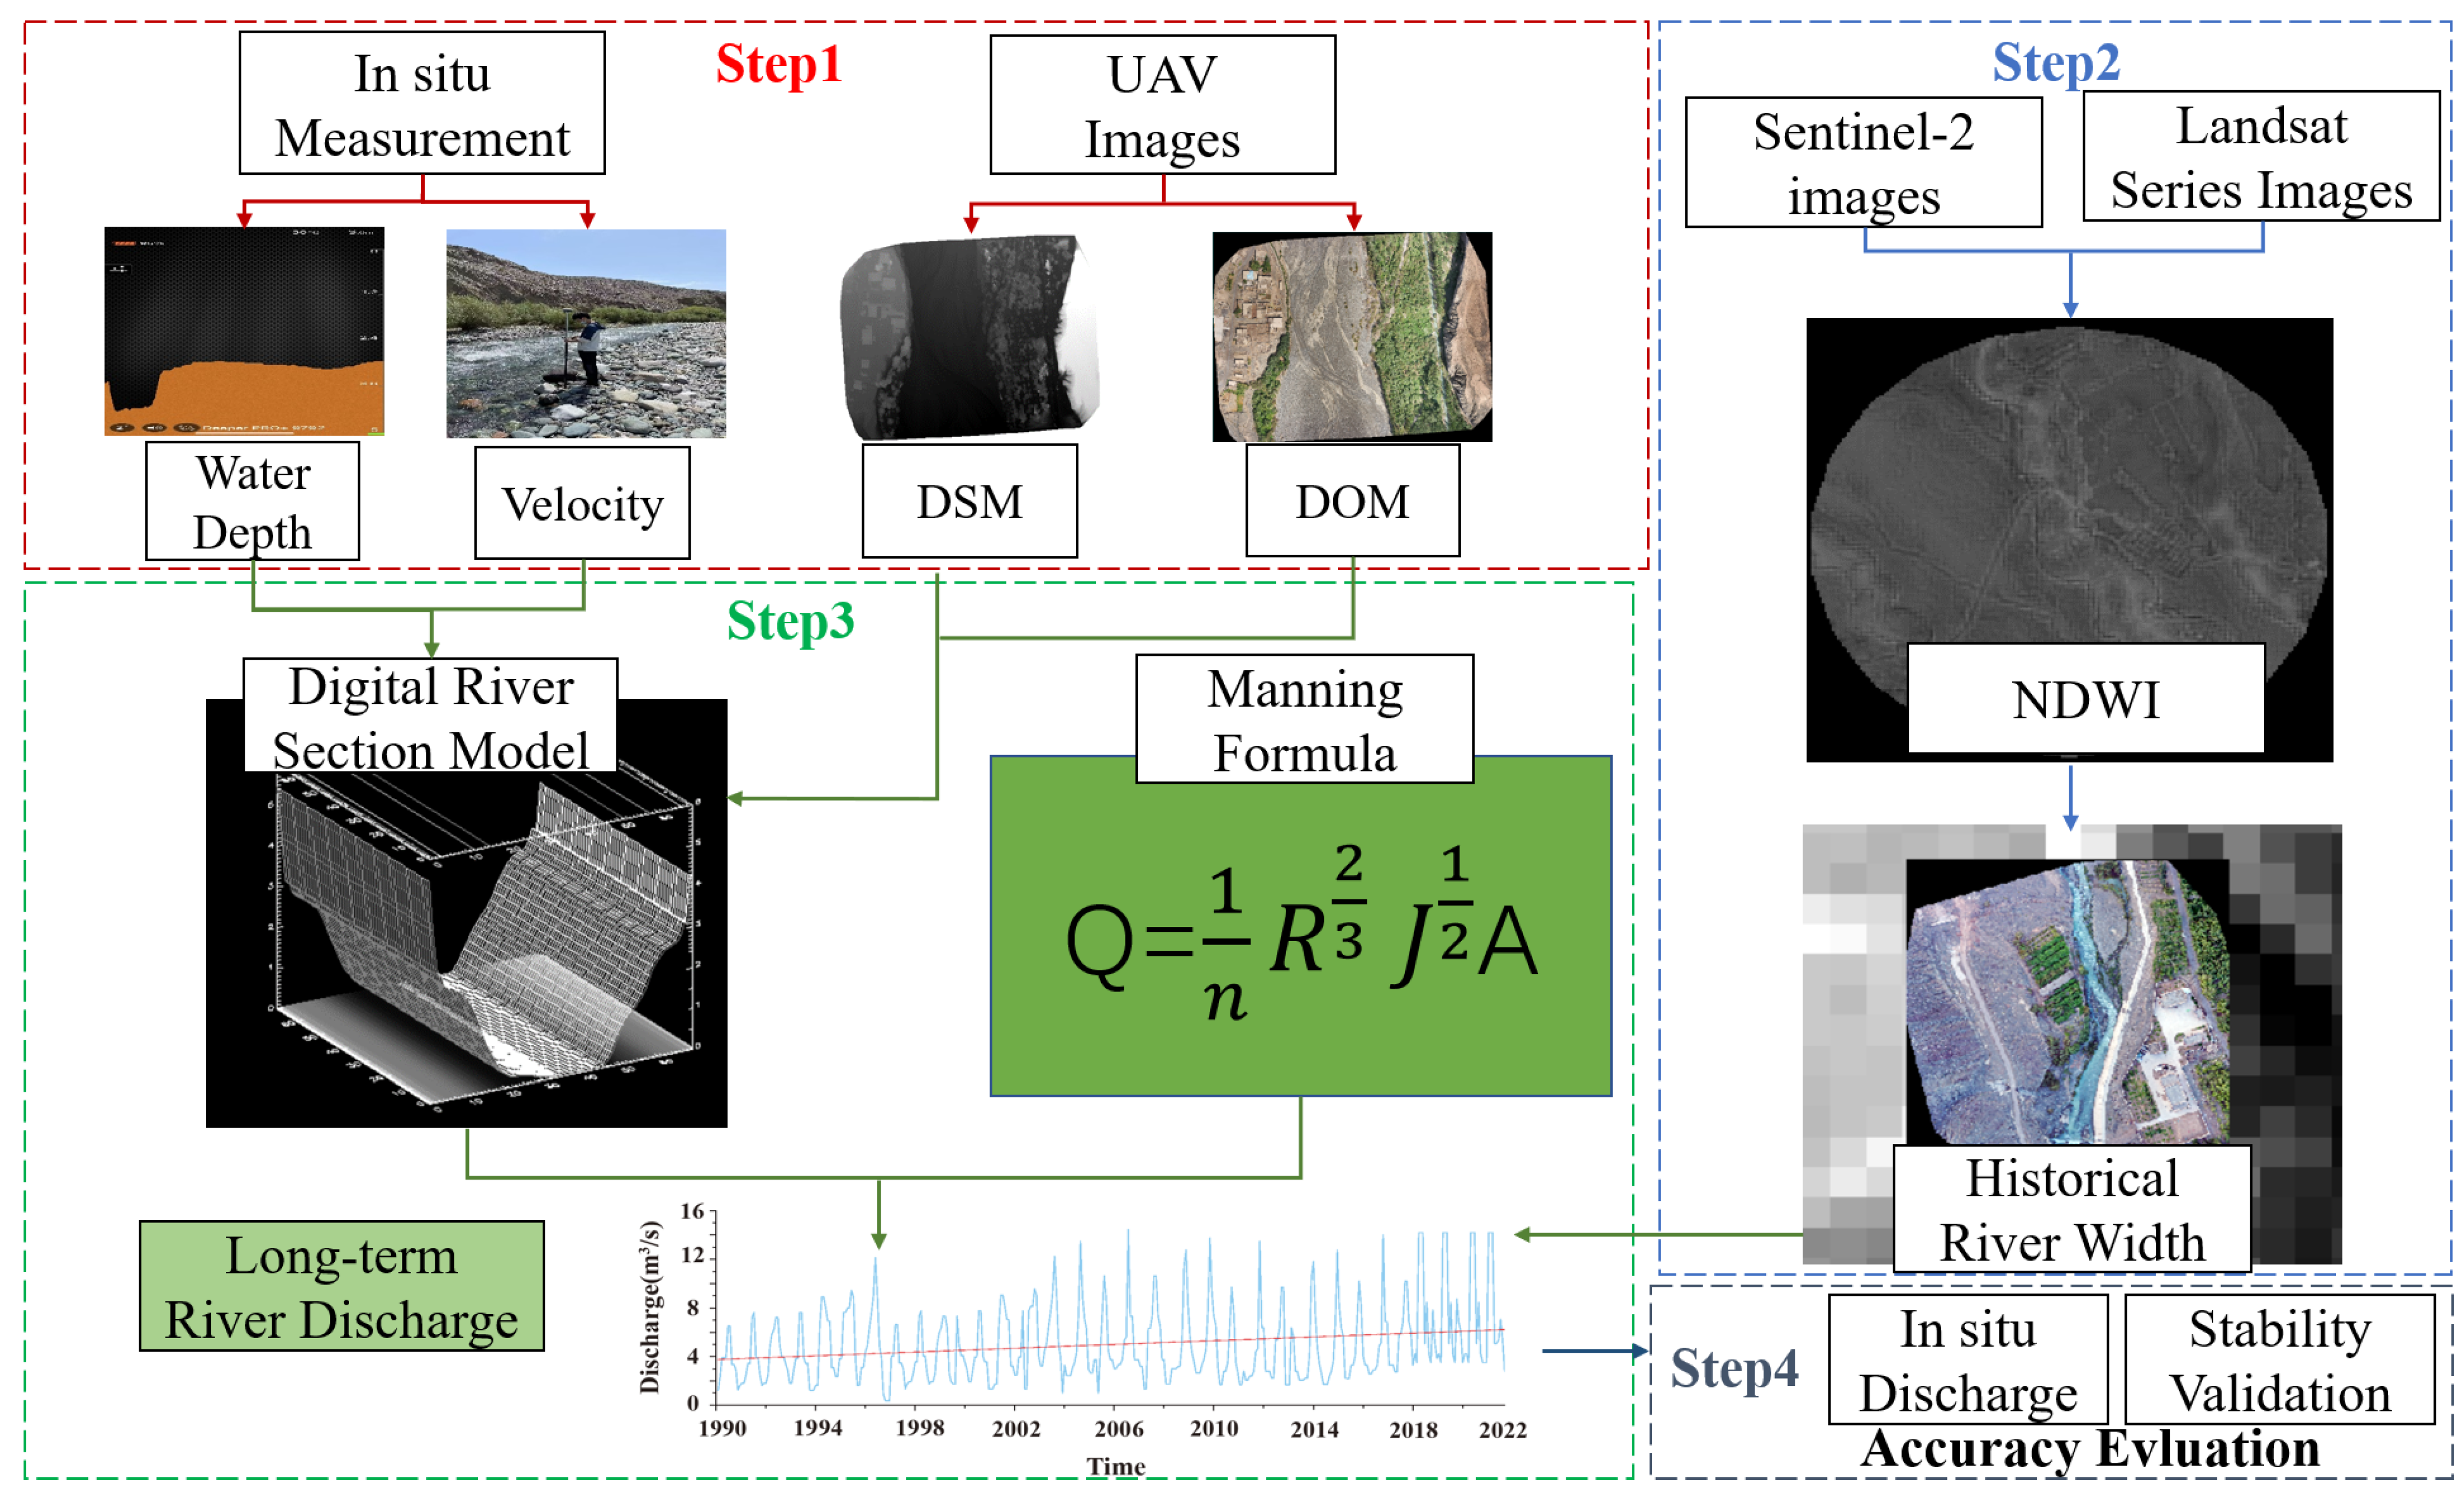
① A series of UAV observations and field investigations were conducted in the target river sections to obtain high-precision UAV images and measurement values of relevant hydraulic parameters, such as the water depth and velocity [27] (Figure 2 (Step 1)).

Figure 2.
Diagram of the remote sensing hydrological station technique used to calculate the river discharge in this study.
② Pix4d software was used to process the obtained UAV images and to generate digital orthophoto maps (DOMs) and digital surface models (DSMs). These were combined with the measured elevation model (DEM) data [27] to establish a digital river section model (Figure 2 (Step 3)).
③ The normalized difference water index was calculated by using satellite remote sensing images with a 10 m spatial resolution, and the principal period of the flow sequence was determined based on remote sensing images with a long time span [28]. When the channel width was smaller than 10 m, the subpixel decomposition method was employed (Figure 2 (Steps 2 and 3)).
④ Since the topography of the selected river section does greatly vary, there exists a one-to-one correspondence between the river discharge and river width [28]. According to the determined long time series surface width, the digital channel model was used to calculate the water depth, water level, flow area [29], wet circumference, and hydraulic radius corresponding to the surface width [29], and the velocity and discharge were then calculated according to the Manning Equation (1), the Chezy formula (2), and the flow formula (3) [26] (Figure 2 (Step 3)), as follows:
where V is the flow velocity, m/s; k is a conversion factor, m1/3/s, which is set to 1 in this study; n is the roughness coefficient; R is the hydraulic radius, m; J is the hydraulic gradient; A is the river cross-sectional area, m2, which is determined by the river surface width and river depth; L is the wet perimeter, m, which refers to the circumference of the contact area between the fluid and channel section; and Q is the river discharge, m3/s.
⑤ The final step was accuracy evaluation, including in situ discharge adjustment and stability validation. The Xinjiang Hydrological Statistical Yearbook (Table 1) was used to complete these steps.
2.3.2. A New Method to Calculate the MEIFR
Although the wet-circumferential method is a widely used method to calculate the MEIFR of rivers, it is difficult to establish the wet circumference–discharge relationship conveniently in areas lacking data [30,31].
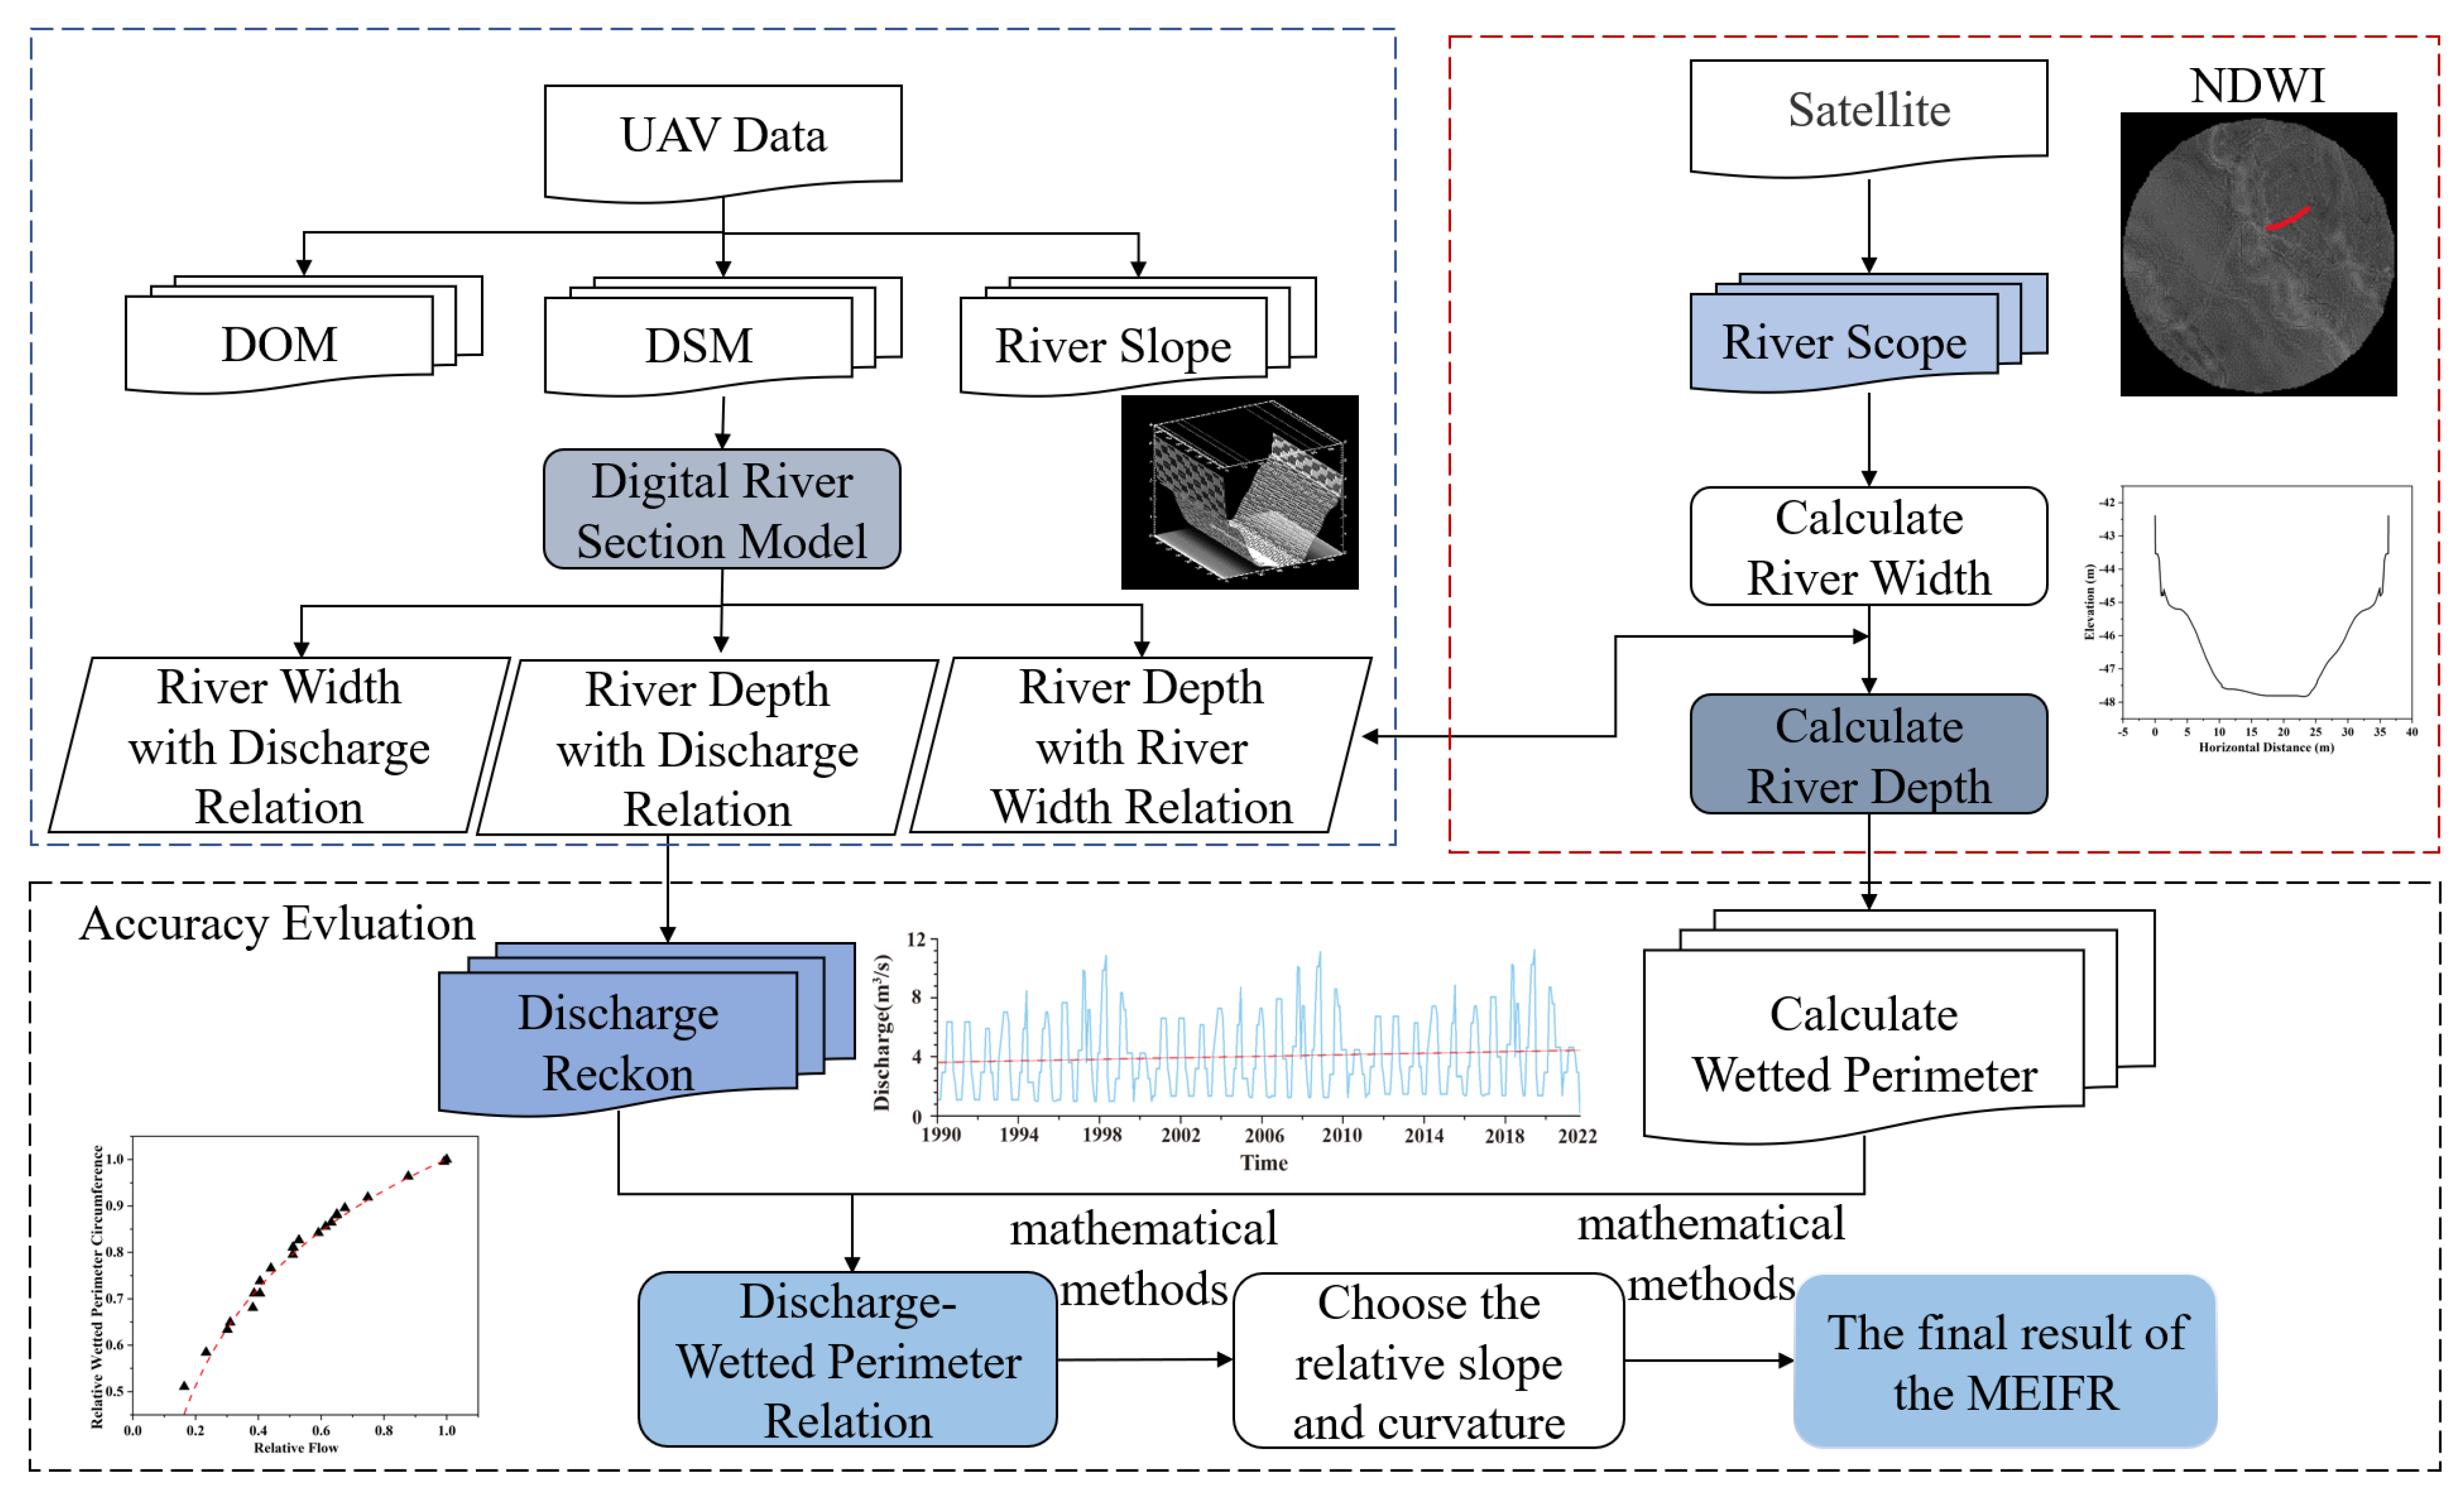
In this study, a new method to calculate the MEIFR was established. Here, the channel size was determined by using UAV telemetry and field measurements, and the channel hydraulic parameters were determined by applying the RSHS technique combined with the measured section data to establish the wet circumference–flow relationship curve. The ecological river flow was determined according to the critical point of the curve. Finally, the MEIFR was calculated with a relatively high accuracy. The specific steps of the wet-circumferential method can be explained as follows:
① A large river cross-section was generated. A UAV was used to obtain aerial photographs of the study area for determining image data. After initialization processing, point cloud refinement, and texture processing, a digital surface model (DSM) and a digital orthophoto map (DOM) were generated. Then, the ArcGIS spatial analysis tool was used to extract river elevation data and determine the river cross-section.
② The hydraulic parameters of the seven main rivers in the Aiding Lake Basin and Aiding Lake were determined. To construct the wet circumference–discharge relationship, the hydraulic slope, roughness, channel width, and other parameters were obtained. To determine these parameters, it was necessary to analyse the DOM, the DSM images, and the remote sensing data. Then, the above hydraulic parameters were calculated by using the RSHS technique. Generally, the smaller the slope value determined by the slope method, the lower the obtained MEIFR value. In this study, according to the actual characteristics of the northwestern arid area, the slope and curvature methods were selected to determine the optimal solution for the wet-circumferential method.
③ The MEIFR was obtained. With the use of the wet cycle as a habitat index for aquatic organisms, the habitat environment of organisms can be guaranteed, and the normal ecological functions of rivers can be achieved as long as the flow velocity meets the critical point, which suggests that the slope of the wet perimeter–discharge curve is 0.39. Therefore, in this research, the wet circumference–flow relationship curve was established. The MEIFR of the river was determined according to the critical point of the curve. The critical point can be determined by mathematical methods. The proposed method combining UAVs and the remote sensing hydrological station technique can be used to calculate the MEIFR in areas lacking data. Therefore, we could finally determine the MEIFR as Figure 3.
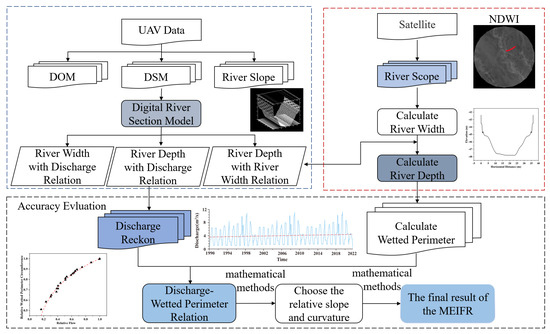
Figure 3.
Flow chart of the wet circumferential method obtained by an unmanned aerial vehicle (UAV), remote sensing hydrological station (RSHS) technologies, and mathematical methods for calculating the MEIFR.
3. Results
3.1. Variation in the River Discharge over the Past 32 Years
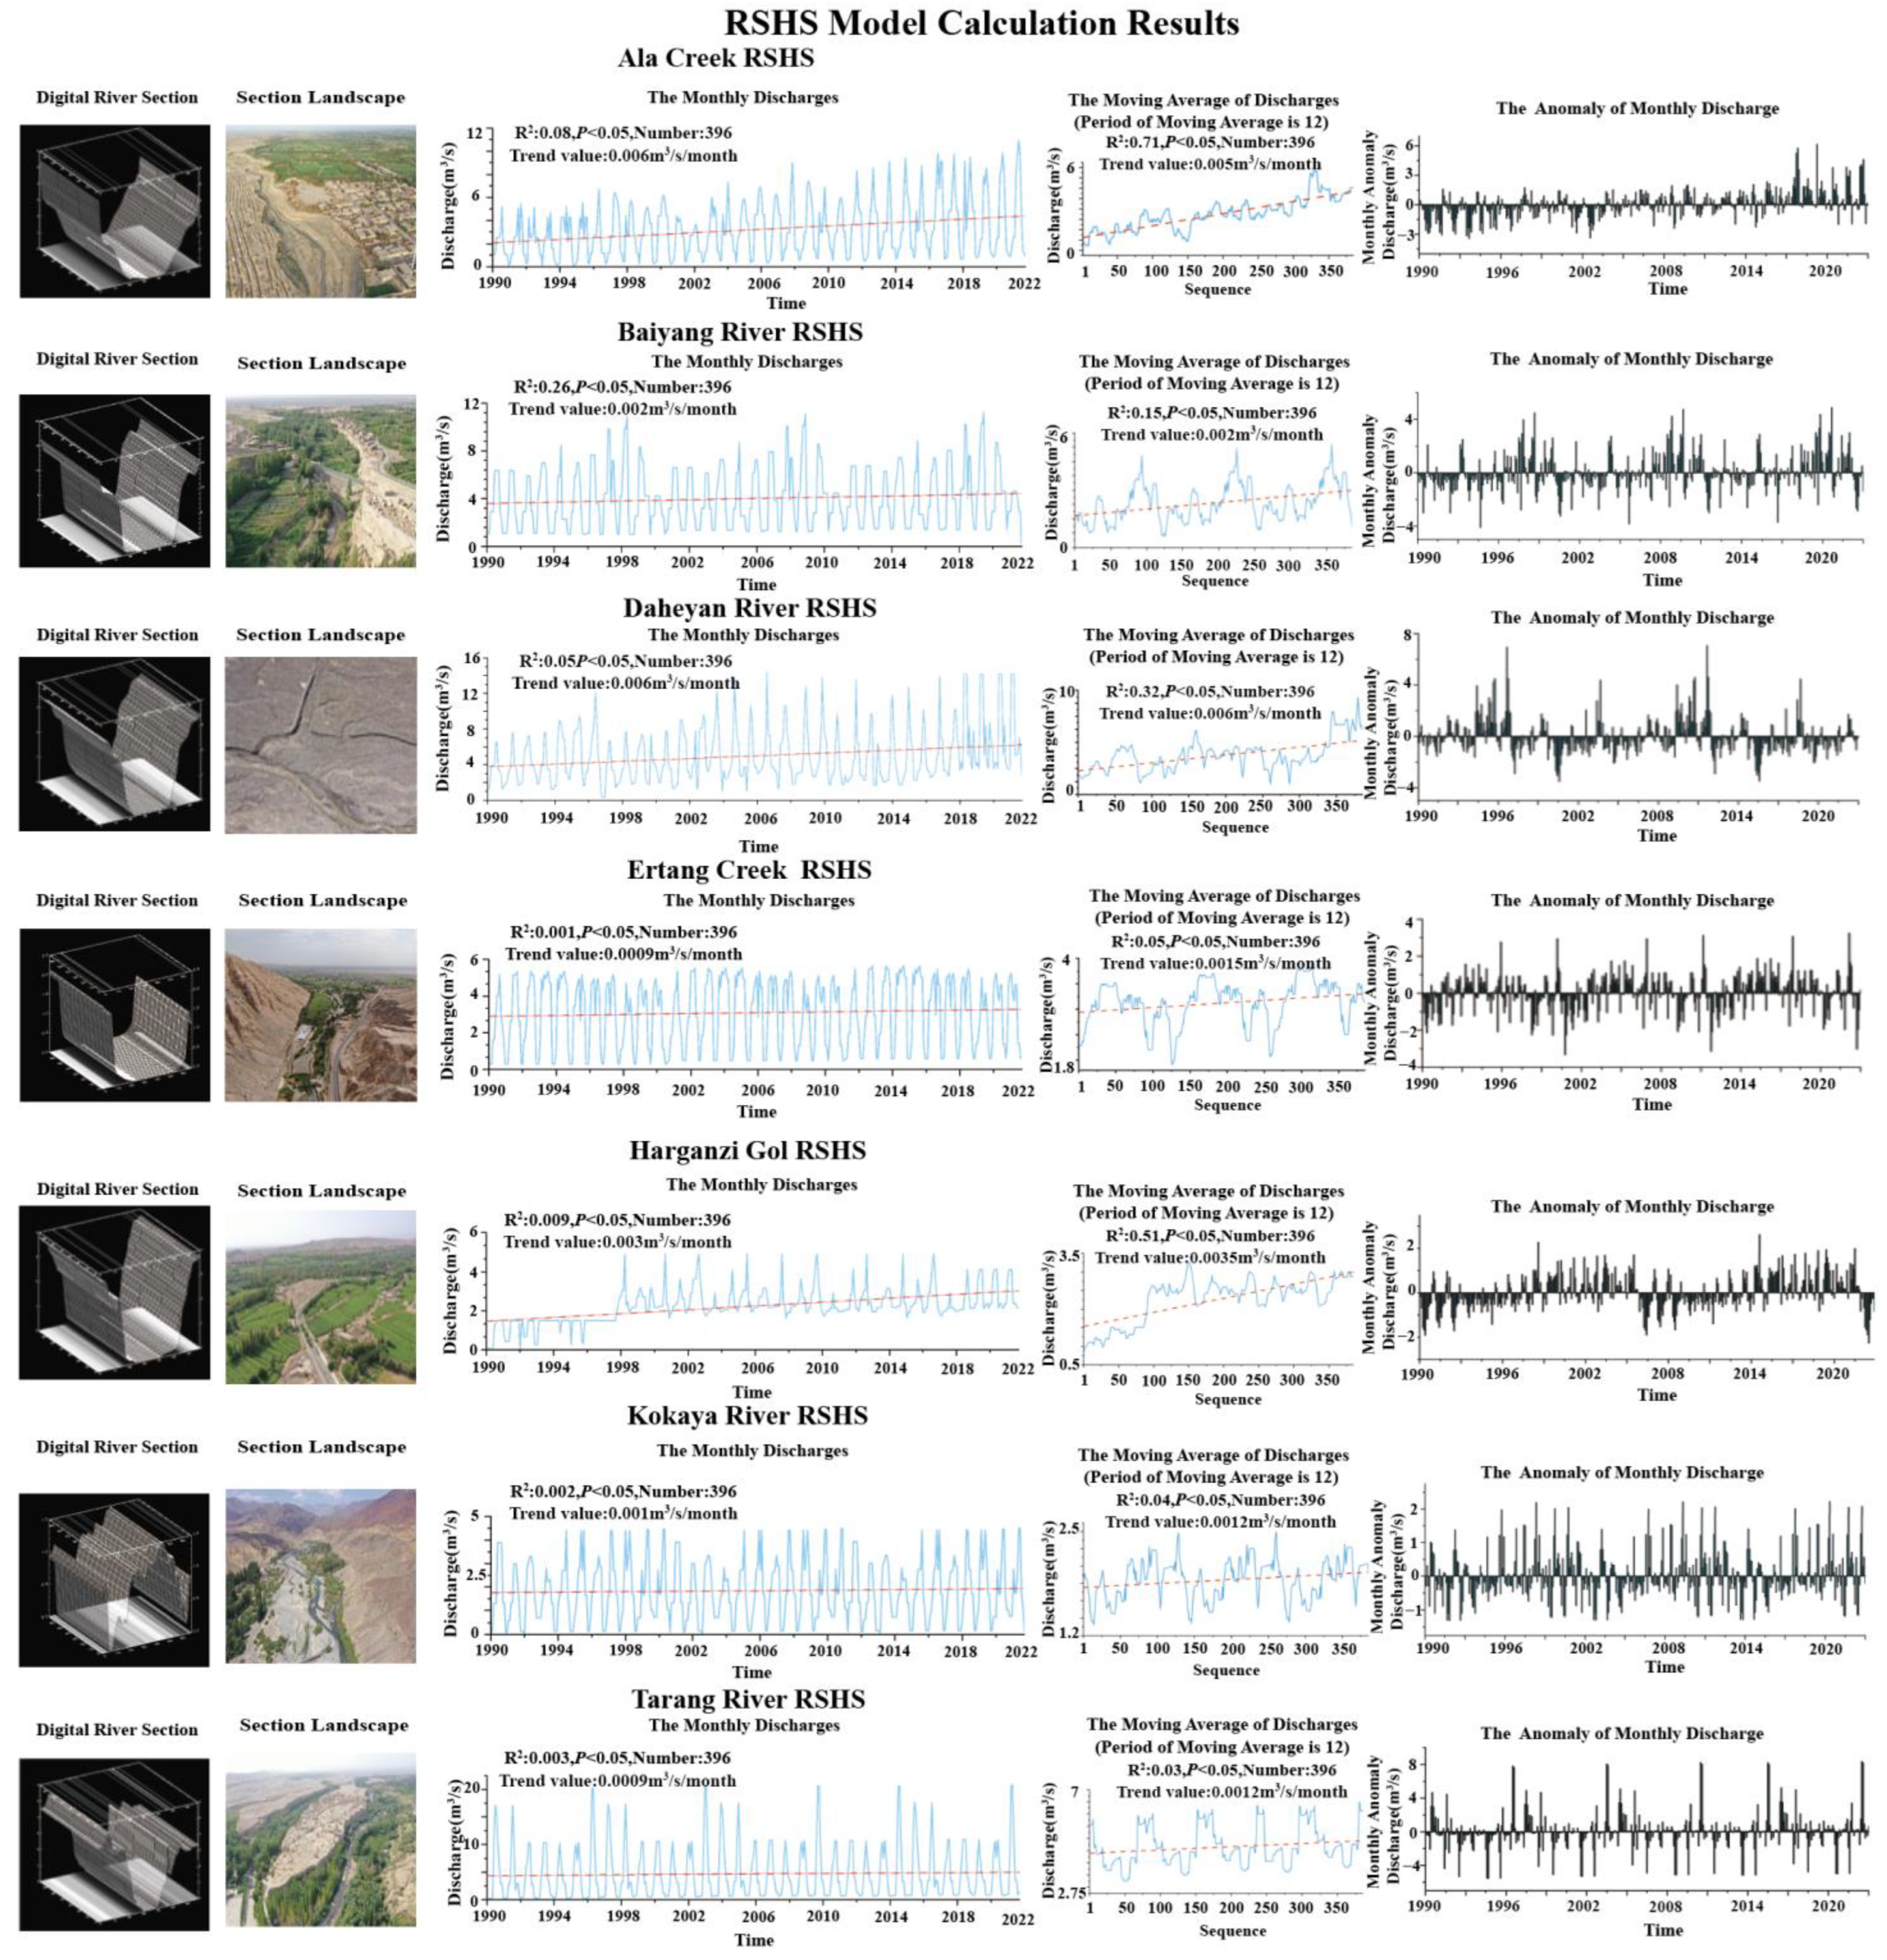
The discharge of the 7 major rivers in the Aiding Lake Basin has changed over the past 32 years (Figure 4). Each digital river section and each section landscape corresponds to the monthly discharge. Notably, the flow rate monitored at the remote sensing hydrological stations, as fitted by the digital channel model, increased by approximately 1–5%; some channel models even revealed an increase of 6%, and the discharge of the 7 rivers showed a decreasing trend from the upper to the lower reaches of the basin, decreasing by approximately 3–5%. The monthly average discharge of the 7 rivers from 1990–2022 was recorded 396 times by the RSHS technique, showing obvious increasing trends. We conducted linear fitting of the flow of the 7 rivers by using the digital channel model and obtained relevant statistical parameters, including the R2 value, monthly trend changing rate, and p value. The R2 was used to evaluate the fitting degree of the linear regression models. Regarding the Ala Creek, the Daheyan River, and the Harganzi Gol River, the trend change rate values were 0.006 m3/s/month, 0.006 m3/s/month, and 0.003 m3/s/month, respectively. The discharge of these rivers increased faster than that of the other rivers. Regarding the 4 other rivers, namely, the Baiyang River, the Ertang Creek, the Kokaya River, and the Tarang River, the increasing trend was gradual, and the change rate values of the trend lines were 0.002 m3/s/month, 0.0009 m3/s/month, 0.001 m3/s/month, and 0.0009 m3/s/month, respectively. The discharge of these 4 rivers slowly increased over the past 32 years.
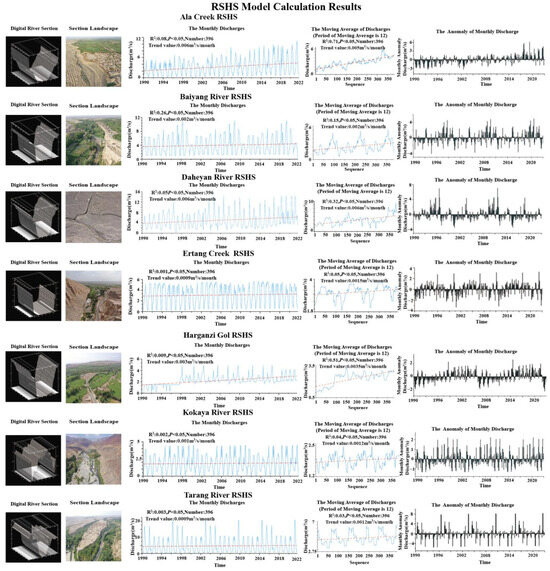
Figure 4.
Digital river channels, remote sensing hydrological stations, and simulated monthly discharge variation of the 7 major rivers in the Aiding Lake Basin and the moving average of the monthly discharge. R2 is used to evaluate the fitting degree of the linear regression models, the p value is used to evaluate whether a statistically significant linear fitting trend can be obtained, and Num denotes the number of monitoring frequencies.
Moreover, in this study, we calculated the moving average of the monthly discharge fitted by the digital channel model to explore the variation trend of the monthly average discharge (Figure 4). The values of R2 and p-values in the moving average of the monthly discharge were different from the monthly discharge. In addition, the specific p-values and R2 values of all rivers were indicated on the right side of Figure 4. Spatially, the increasing trends of the rivers located in the eastern part of the study area, such as Ala Creek and Daheyan River, were more pronounced than those of the rivers located in the western part of the study area, such as Ertang Creek and Kokaya River. The discharge of the 7 rivers from west to east generally increased, with the monthly average flow discharge of the Tarang River reaching the highest value, even reaching 20 m3/s. At the same time, the monthly average flow discharge of the Daheyan River reached 16 m3/s. However, the discharge of the western rivers was lower than that of the eastern rivers. The monthly average flow discharge of the Kokaya River was the lowest, even reaching 0.01 m3/s. Moreover, the discharge of the 7 rivers in Aiding Lake Basin showed increasing trends in the winter of each year from 1990 to 2022. And we calculated the monthly climatology first (average for each month about 1990–2022), then we calculated the monthly anomaly by subtracting climatology from the original monthly data on the right side of Figure 4.
3.2. Increasing MEIFR of the Piedmont Rivers
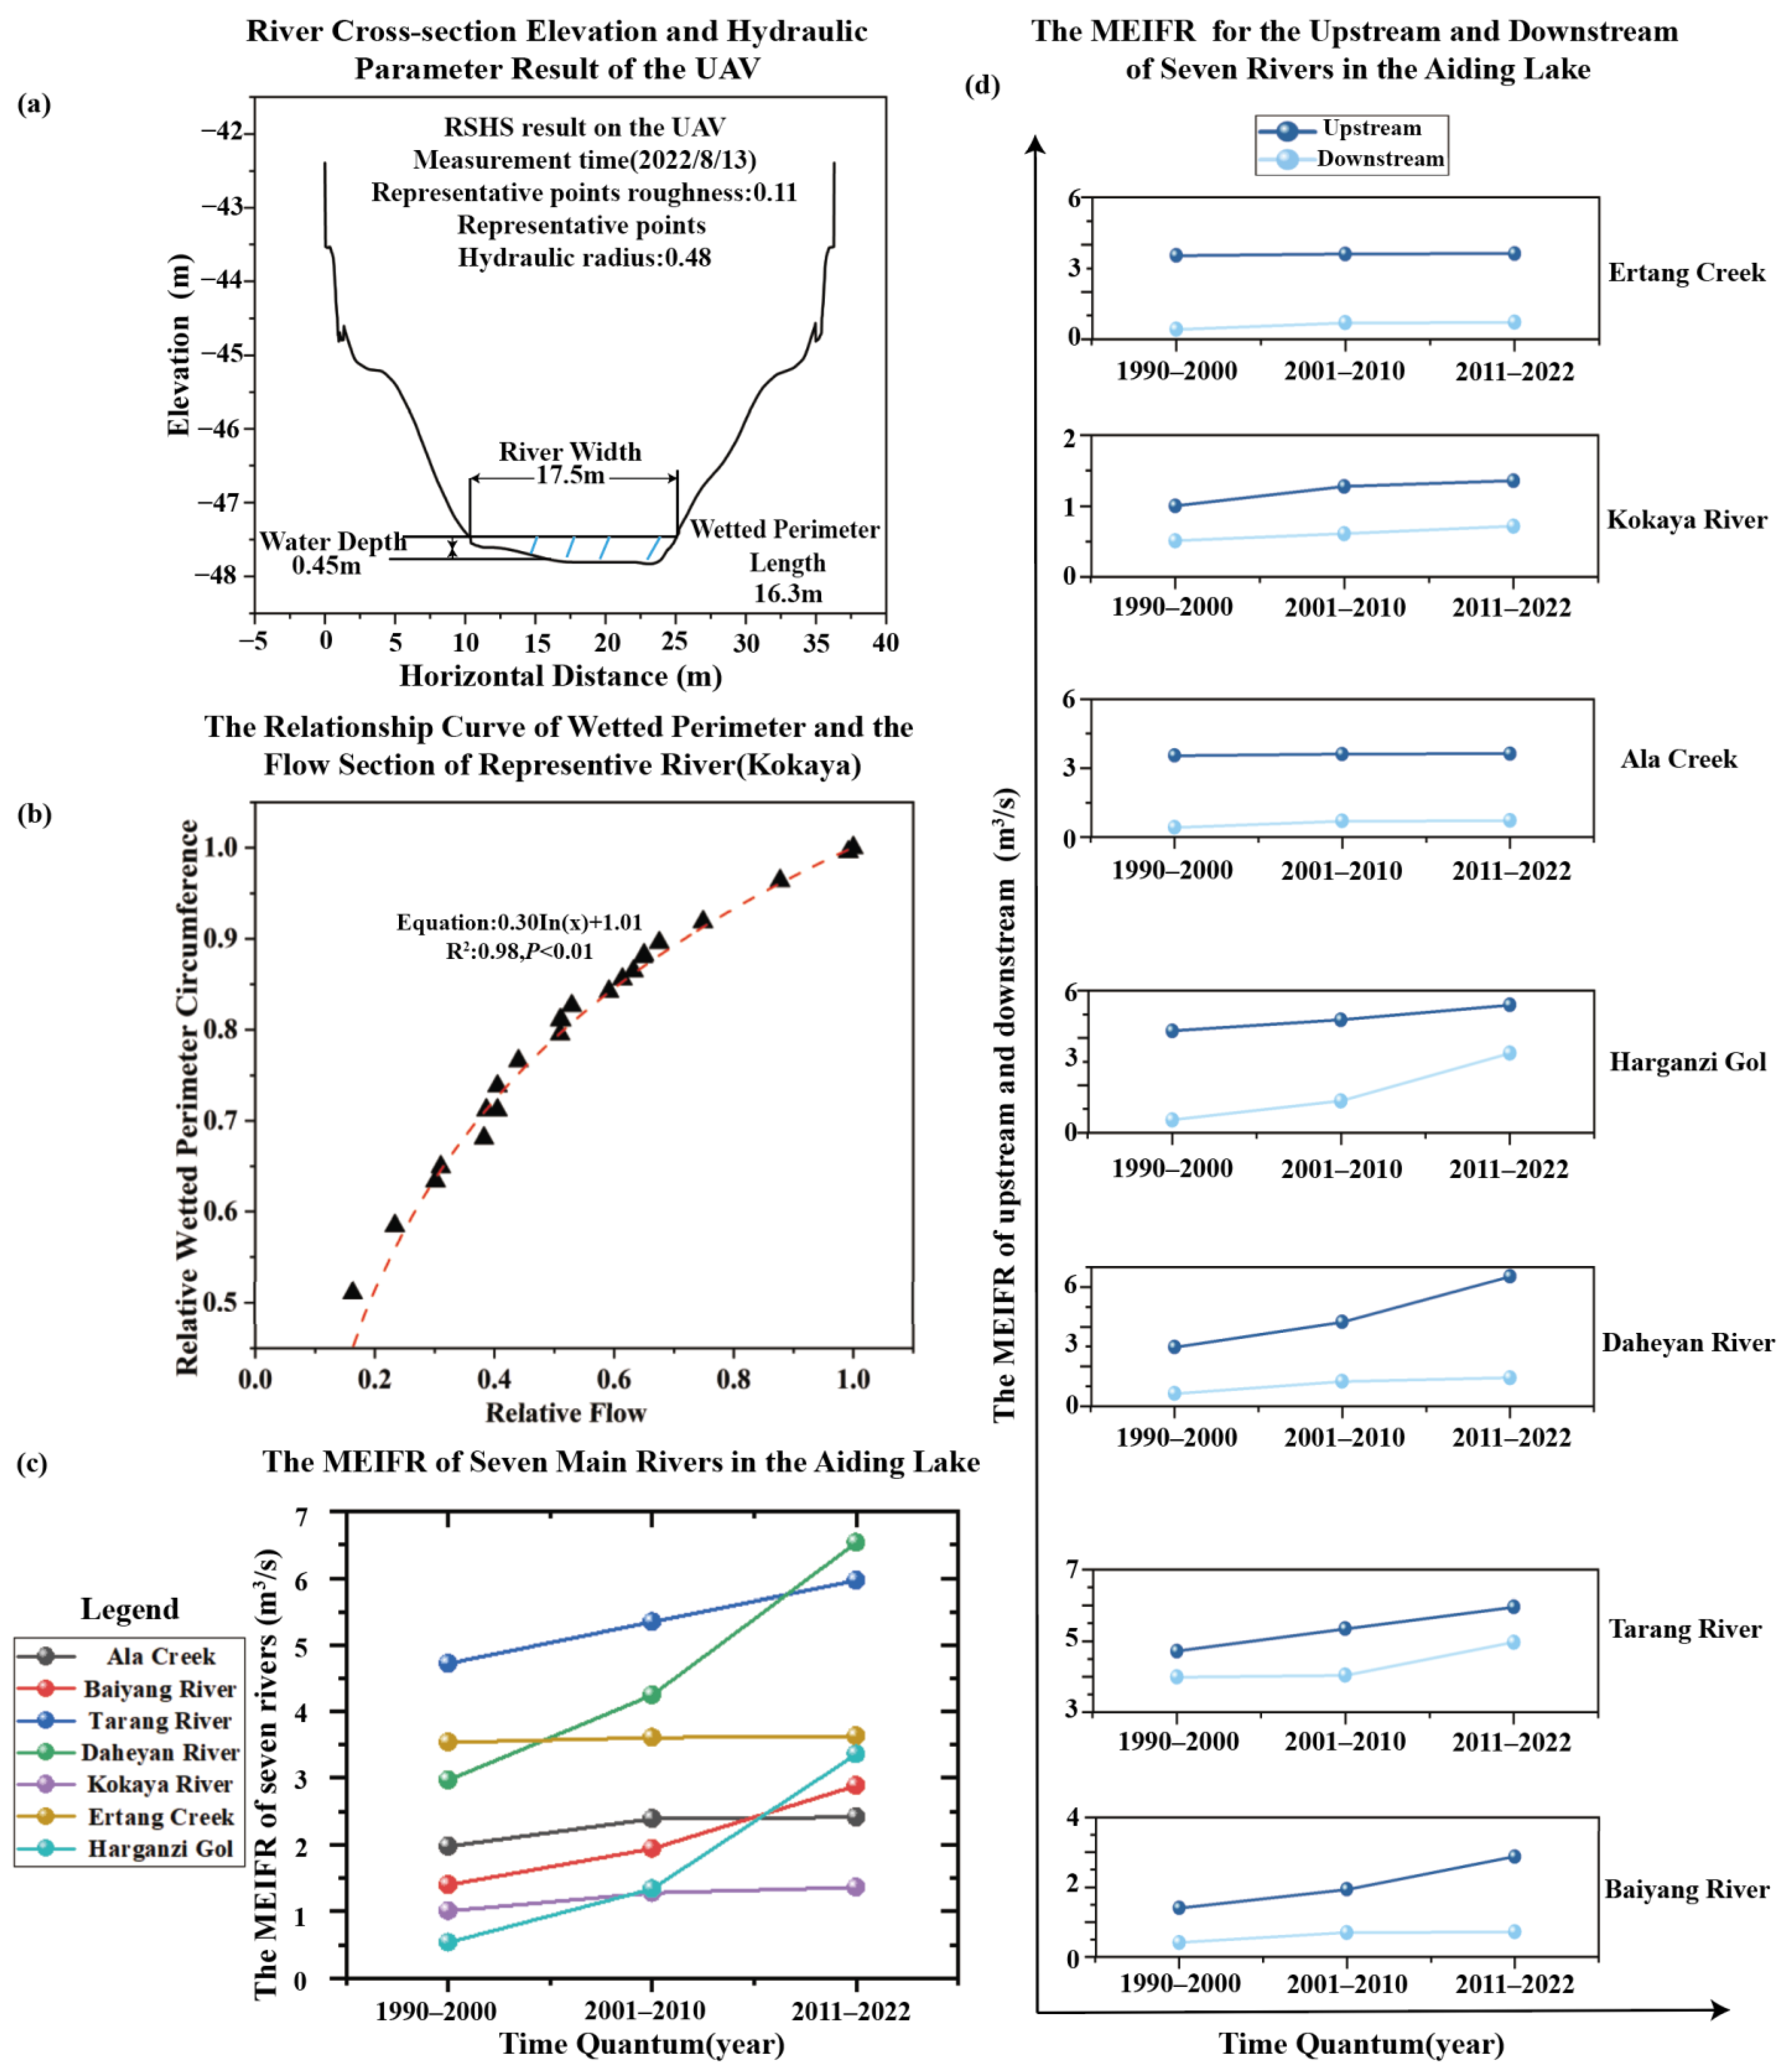
The channel section hydraulic parameters were obtained with the RSHS technique, and the hydraulic parameters of the Kokaya River channel section are shown in Figure 5a. The roughness of the section was 0.11, the hydraulic radius was 0.48, the river width of the section was 17.5 m, the water depth of the section was 0.45 m, and the wet circumference was 16.3 m. According to the discharge results and the wet-circumferential parameters determined by the RSHS technique, a logarithmic curve was obtained, and the R2 was 0.98 (Figure 5b). This curve shows the relative flow, which is the ratio of the annual average discharge and the maximum annual discharge, and the dependent variable is the relative wetted perimeter, which is the ratio of the annual average wetted perimeter and the maximum annual wetted perimeter. The equation of this comparison curve is a logarithmic function. The MEIFR of the 7 major rivers in Aiding Lake also showed a gradual rising trend over time, as shown in Figure 5c. In addition, from the upper to the lower reaches of the basin, the 7 rivers showed a decreasing discharge trend (Figure 5d. The MEIFR of the seven major rivers increased by 15–100%, and from the upper to the lower reaches of the basin, both quantities decreased by approximately 5%. The MEIFR of Daheyan River increased the most over the past 32 years, increasing by approximately 100%. The values of the rivers in the west, such as Daheyan River and Harganzi Gol River, increased more than those of the rivers in the east, such as Kokaya River and Ertang Creek. Overall, the trend changing values decreased from west to east.
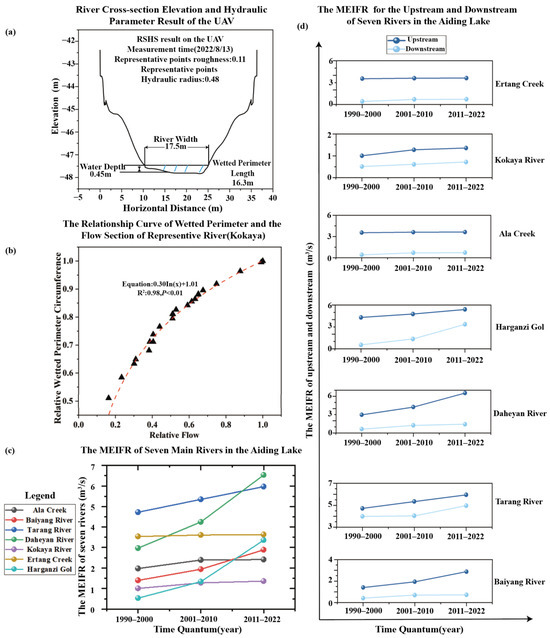
Figure 5.
The information of MEIFR in the whole Aiding Lake Basin. (a) River cross-section information by UAV; (b) the relationship curve of the wetted perimeter; (c) the MEIFR of the 7 major rivers in Aiding Lake; and (d) the MEIFR for the upstream and downstream of the 7 rivers in Aiding Lake.
3.3. MEIFR in the Oasis Area of This Basin
The temporal change trends of the oasis MEIFR of the 7 main rivers in the Aiding Lake Basin showed a rise from 1990 to 2022 (Figure 6). The oasis MEIFR also showed a gradual rising trend. Combined with the obtained remote sensing images and relevant literature, the ecological status of the oasis zones in the study area was determined, which was better than that during the other two periods from 1990–2010. The MEIFR of the Tokson County Oasis 3 was the highest among the Tokson County Oasis 1, 2, and 3 zones near Ala Creek. Conversely, the MEIFR of Turpan Oasis Marginal Zone 2, which contains artificial channels, was the lowest among Turpan Oasis Marginal Zones 1, 2, 3, 4, and 5. The MEIFR of Turpan Oasis Marginal Zone 3 increased the most, by approximately 130%, and the MEIFR of Turpan Oasis Marginal Zone 4 increased the least, by approximately 1%.
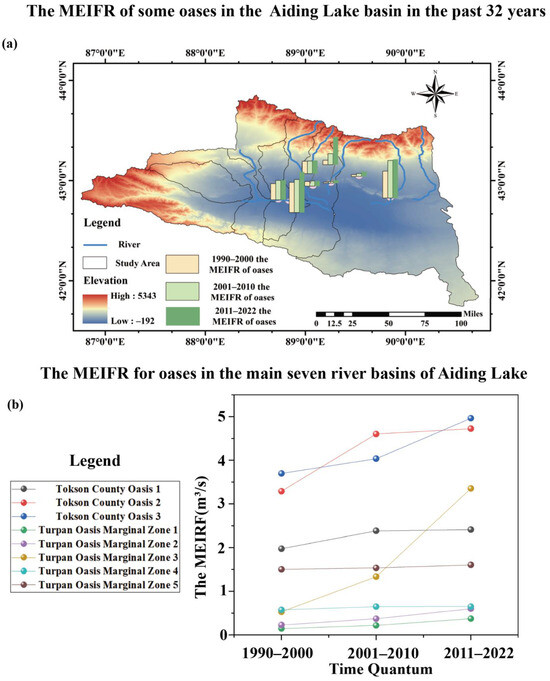
Figure 6.
Oasis MEIFR of the 7 main rivers in the Aiding Lake Basin. (a,b) The MEIFR for oases in the main seven river basins of the Aiding Lake.
Therefore, the initial increasing trend and subsequent decreasing trend agree with the actual situation. According to the proposed method, the MEIFR of the oasis in Tokson was significantly higher than that at the other oasis locations. Moreover, the geographical characteristics indicated that the other oasis locations in the study area are close to the Mountain of Flames Basin, with high surface temperatures and high evaporation rates. As a result, there is relatively little water available in the nearby oases. Subsequently, the closer the oasis is to the Flame Mountain, the lower the MEIFR.
3.4. Variation in the MEIFR of Lake Aiding over the Past 32 Years
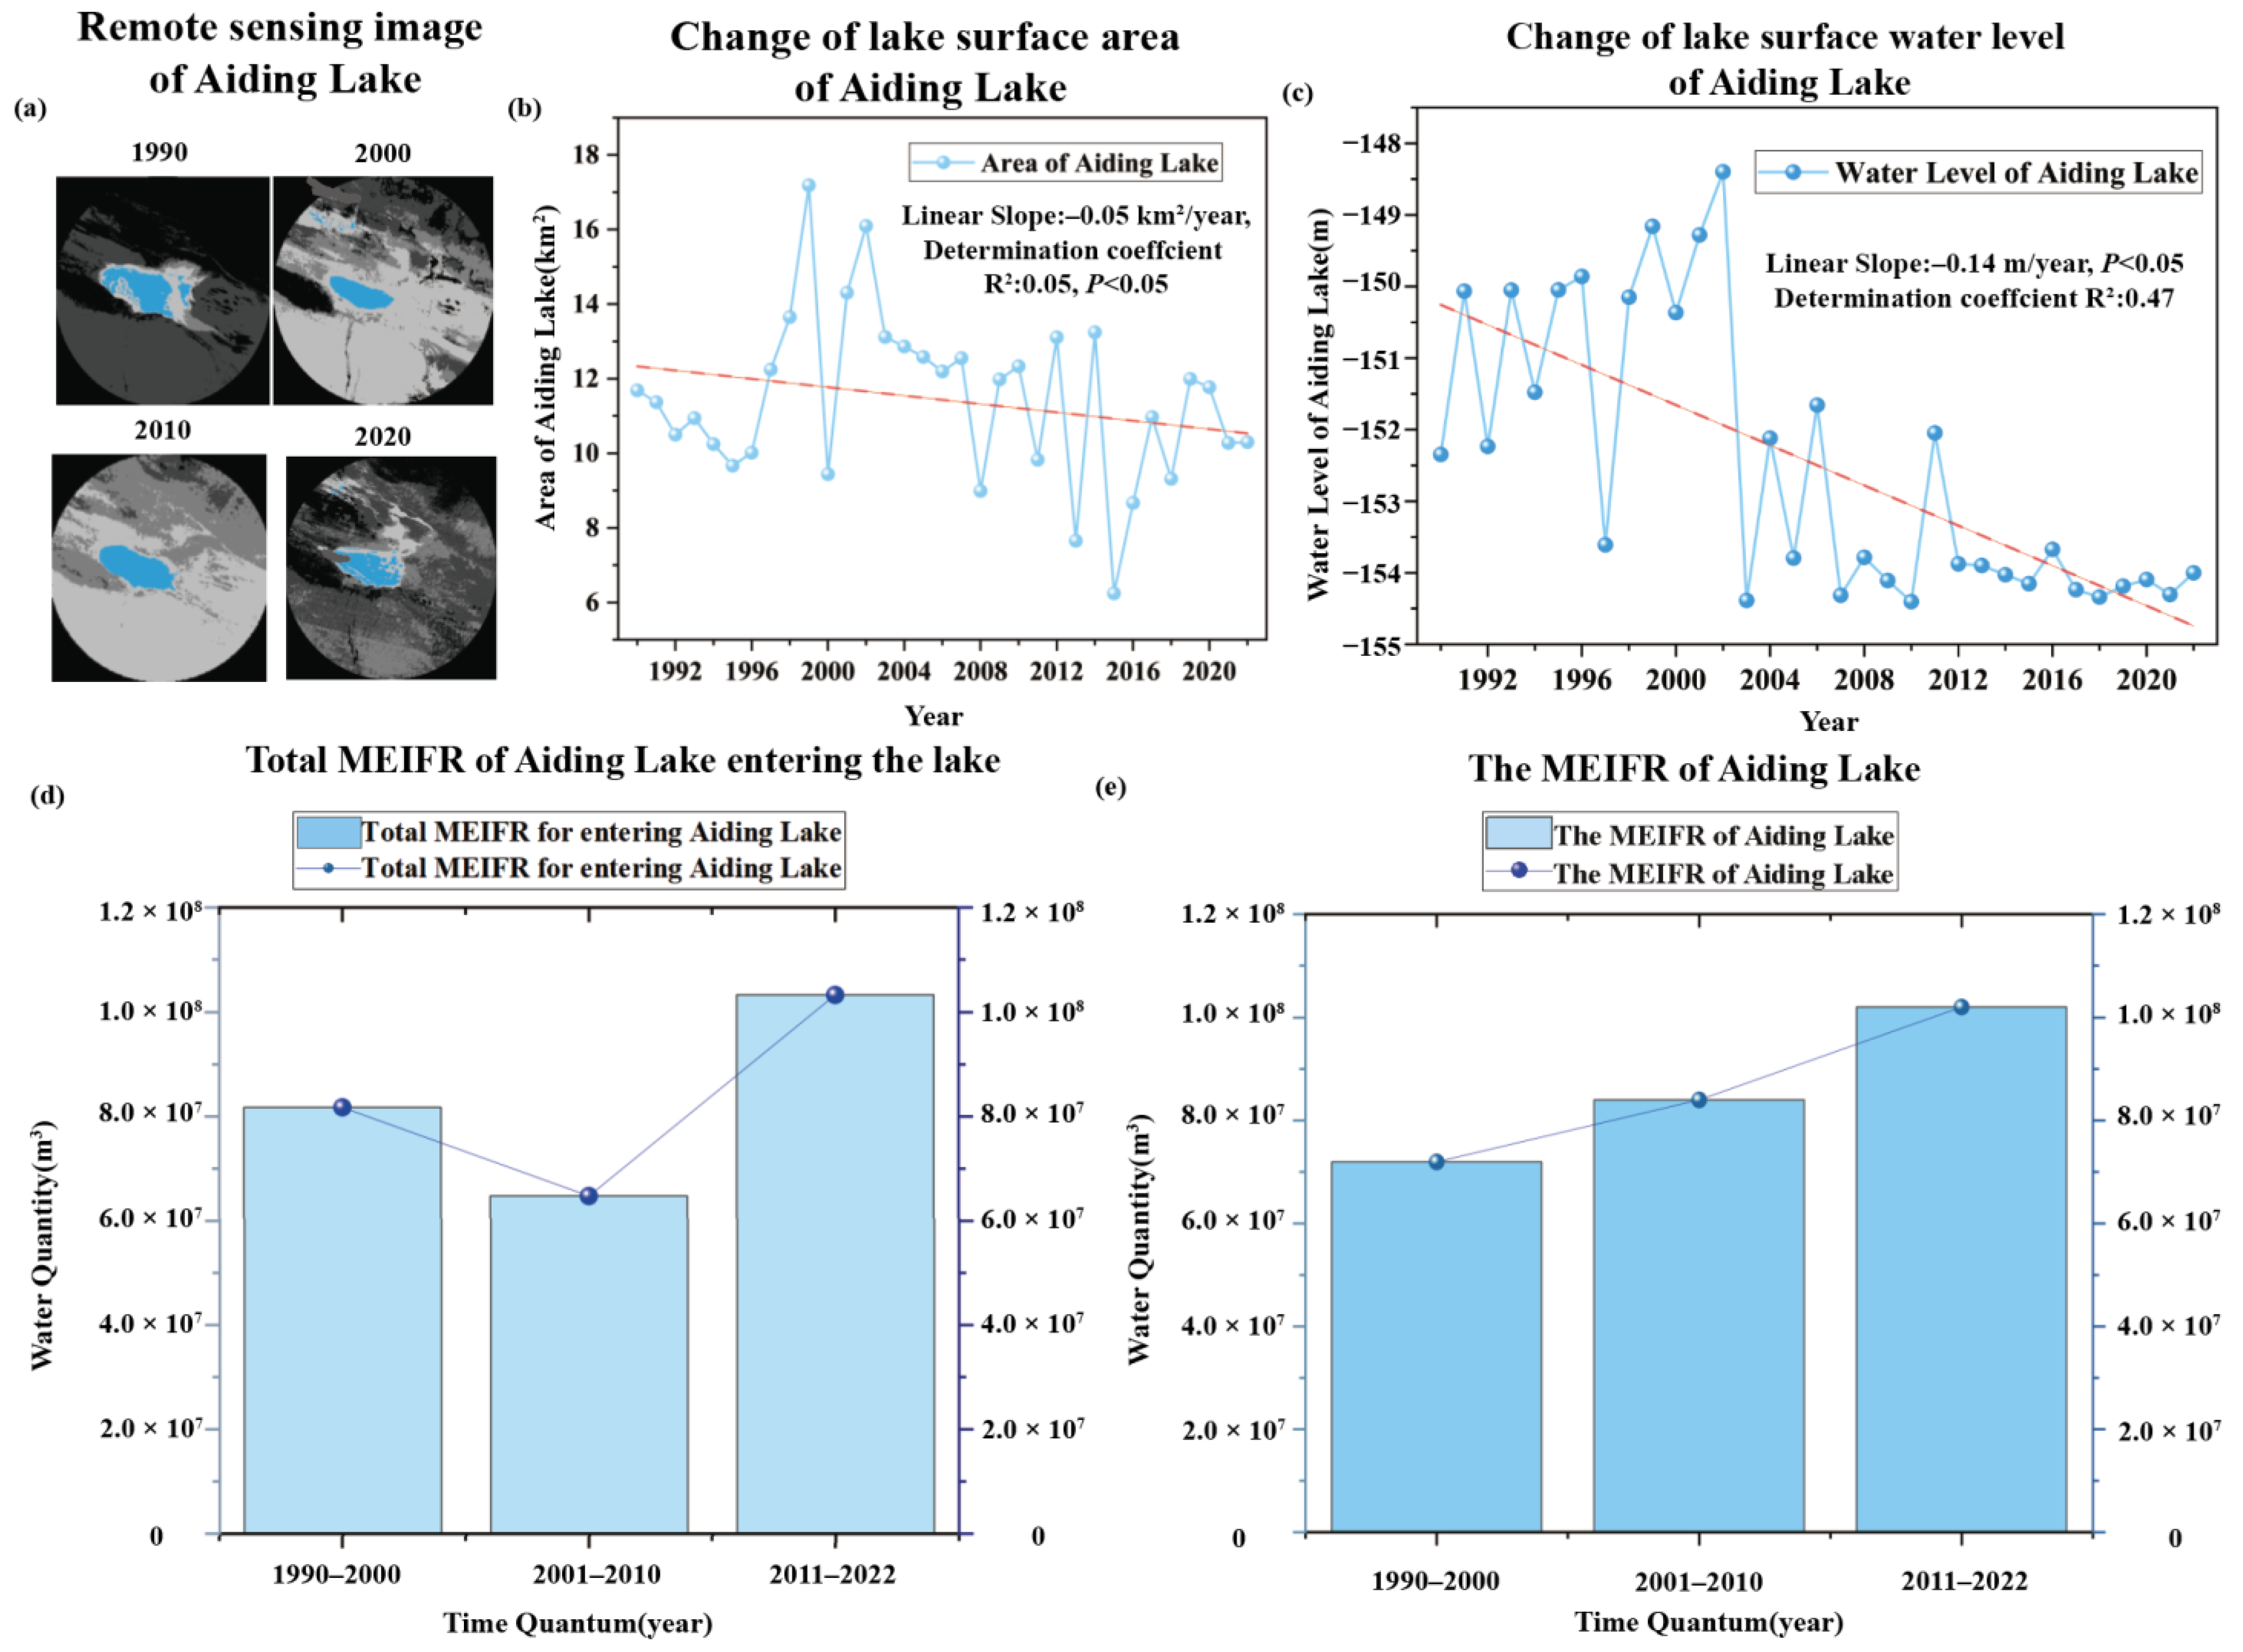
The water surface area and water level of Aiding Lake showed downward trends from 1990 to 2022 (Figure 7a–c). With the continuous intensification of climate change and human activities, the surface area of Aiding Lake continued to decline during the early 21st century and reached its lowest value in approximately 2013. Over the 10-year period from 2013 to 2022, Aiding Lake again showed a gradual rising trend. However, since 1990, the water level of Aiding Lake has exhibited a trend of first rising and then falling. According to remote sensing image interpretation, the water level of Aiding Lake reached its lowest point ever in approximately 2010. From 2010 to 2022, the lake indicated an upward trend. R2 is the coefficient of determination of the fitted linear regression models, and the linear slope is the change rate value of the fitted linear curve. The R2 of the change in the lake surface water level of Aiding Lake was 0.47. The linear slope of the curve of the change in the lake surface area of Aiding Lake was the same as the change rate value of the linear fitting curve, which reached −0.05 km2/year. The linear slope of the curve of the change in the lake surface level of Aiding Lake was −0.14 m/year. Finally, the total minimum ecological instream flow requirement of Aiding Lake showed an increasing trend from 1990 to 2022 (Figure 7d). The results showed that since 1990, the MEIFR of the lake has declined, which is consistent with the relationship between the lake water level and the lake surface area, showing a downward trend. Moreover, using the proposed method, we revealed that the MEIFR of Aiding Lake first decreased by 25% from 1990 to 2013 and then increased by 66.7% from 2013 to 2022 (Figure 7e).

Figure 7.
Changes in water level, area, and MEIFR of Aiding Lake. (a) Remote sensing image of Aiding Lake; (b) change in the lake surface area of Aiding Lake; (c) change in the lake surface water level of Aiding Lake; (d) total MEIFR of Aiding Lake entering the lake; and (e) MEIFR of Aiding Lake. In this figure, R2 is the coefficient of determination of the fitted linear regression models, the linear slope is the change rate value of the fitted linear curve, and the p value is used to evaluate whether a statistically significant linear fitting trend can be obtained.
3.5. Temporal and Spatial Evolution of the MEIFR Balance in the Piedmont Zone
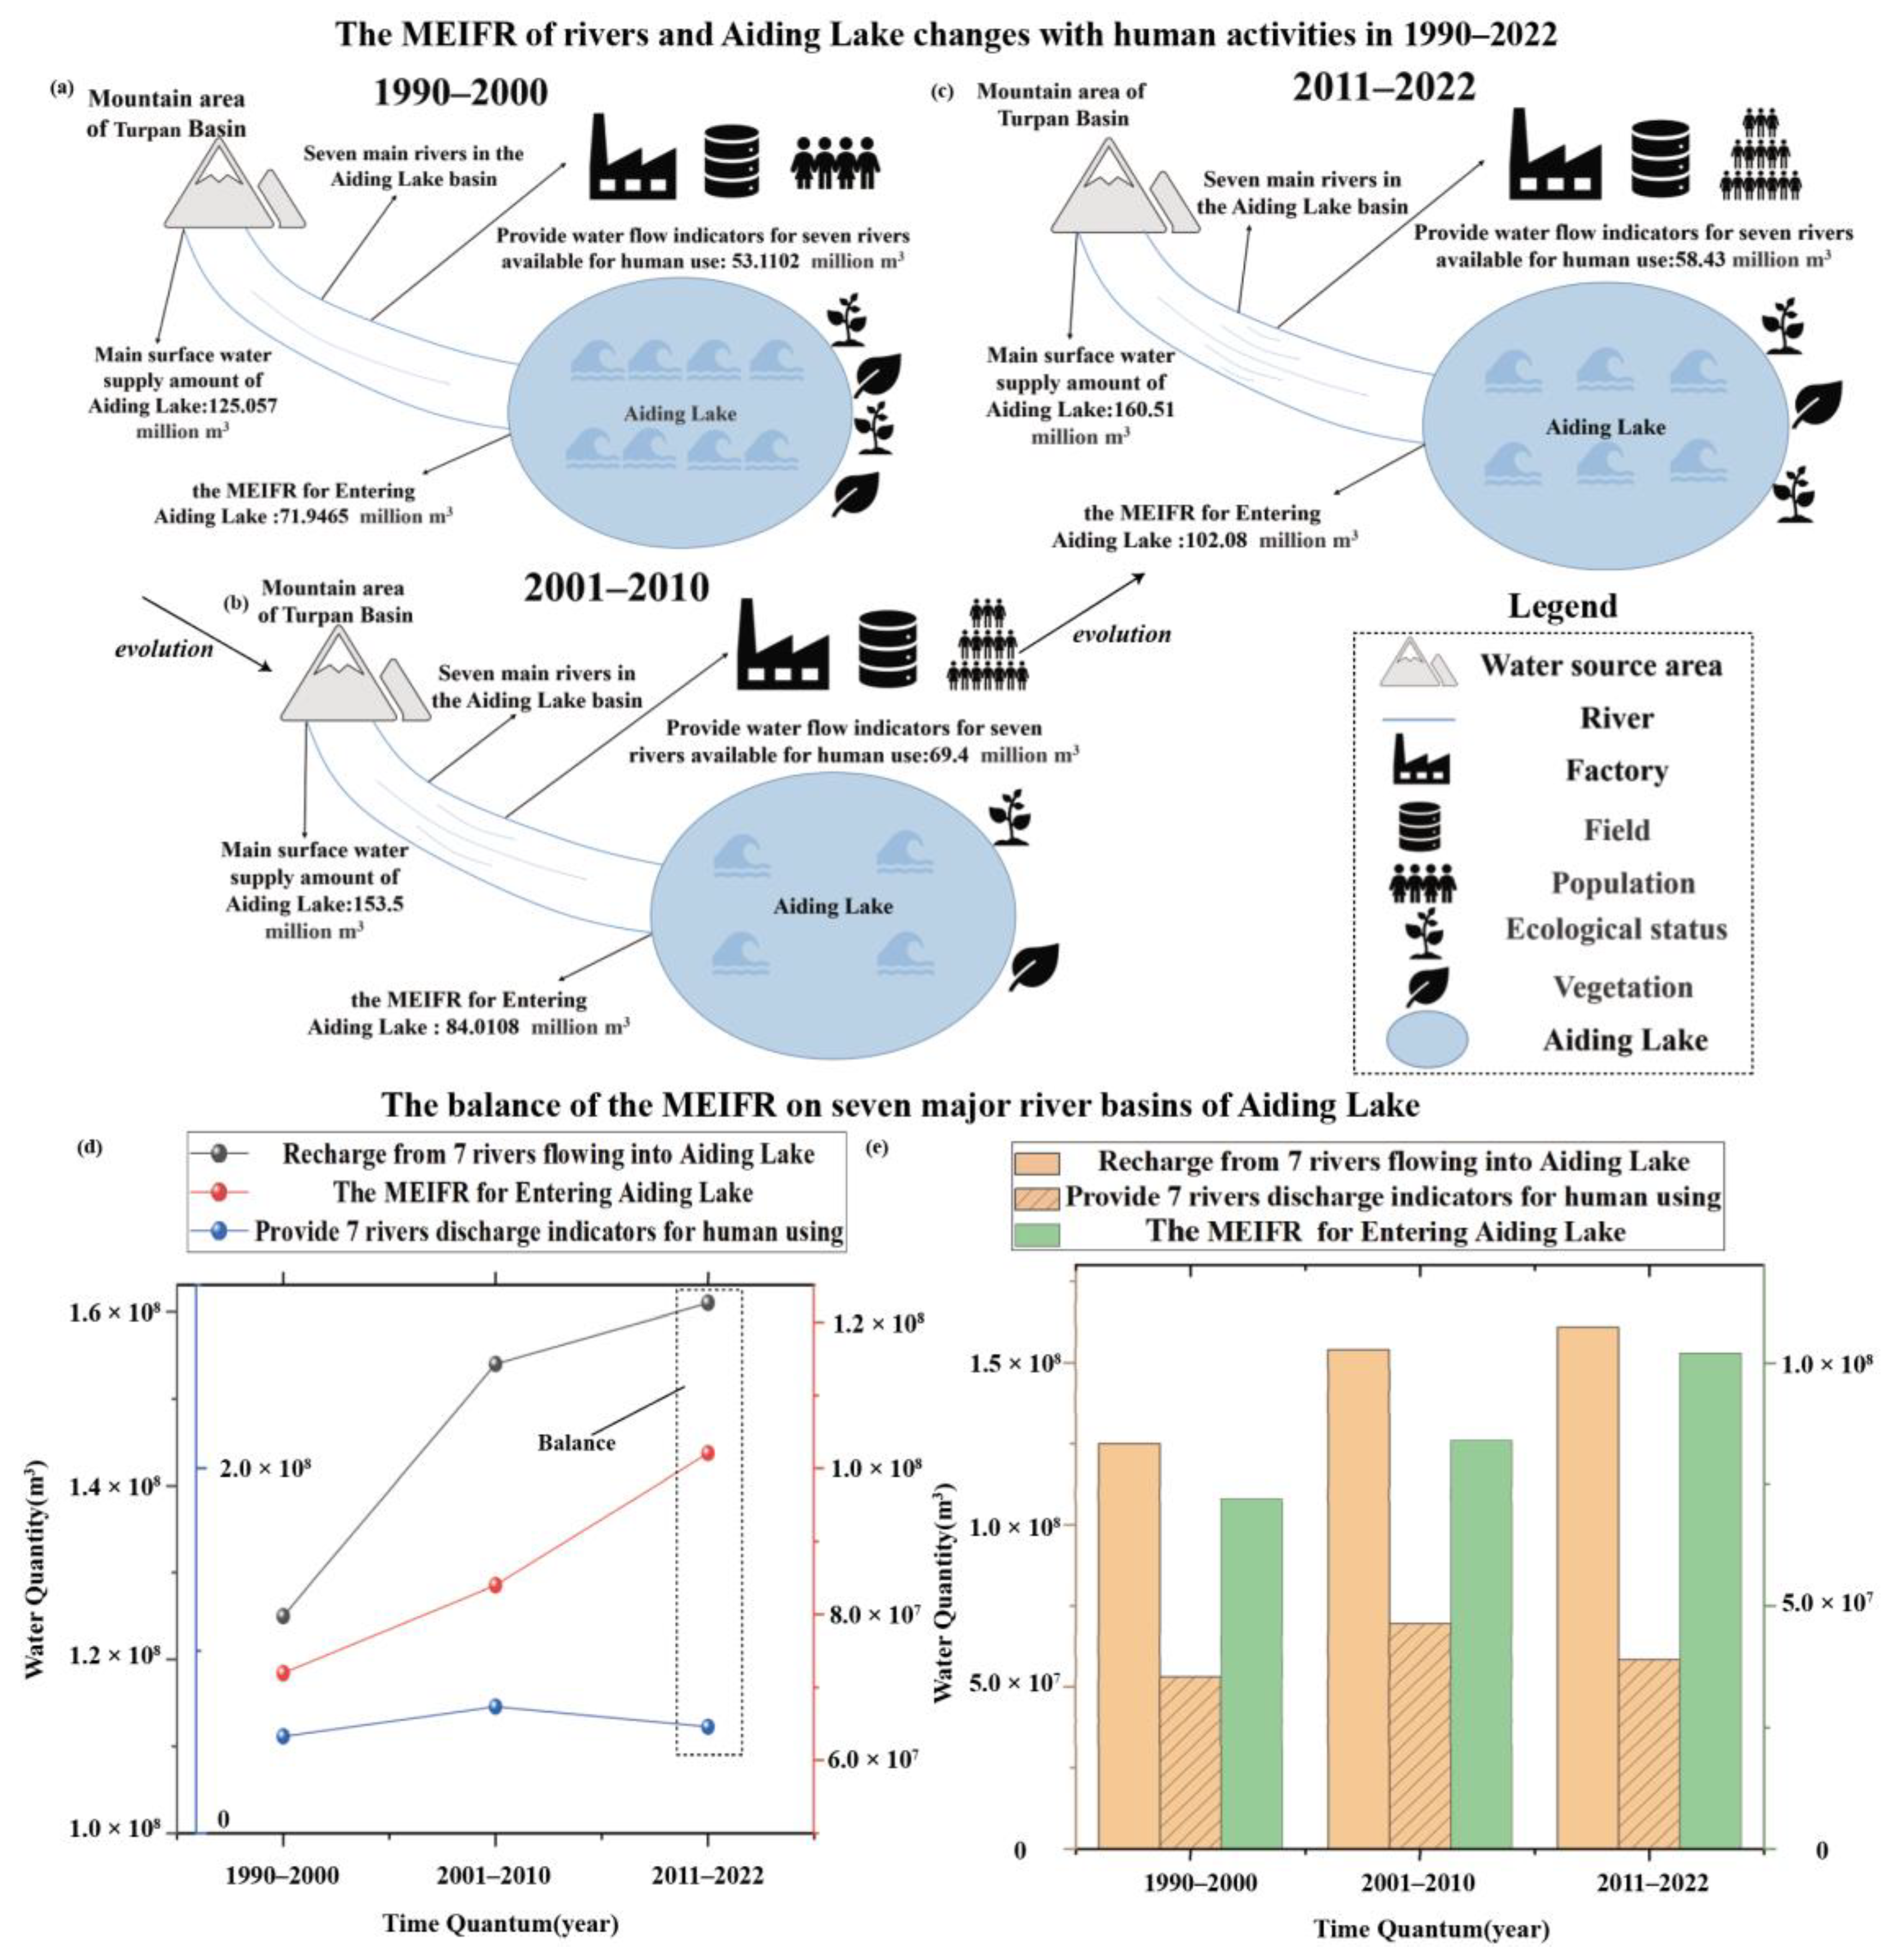
To analyze the above-mentioned balance in this study, we divided the study period into three periods of approximately one decade each: 1990–2000, 2001–2010, and 2011–2022. The reason for this division is that the ecological conditions remained nearly the same during each period. These parts approximately capture the dynamic changes in the balance between the MEIFR and anthropogenic water depletion, including the ecological conditions of Aiding Lake and MEIFR of the whole basin (Figure 8a–c). The inflow discharge of the 7 major rivers in the Aiding Lake Basin reached 0.13 billion cubic meters from 1990–2000, 0.15 billion cubic meters from 2001–2010, and 0.16 million cubic meters from 2011–2022. The MEIFR of Aiding Lake reached 71.95 million cubic meters from 1990–2000, 84.01 million cubic meters from 2001–2010, and 0.10 billion cubic meters from 2011–2022. These findings indicate that the available water for humans provided by the 7 major rivers in the Aiding Lake Basin reached 53.11 million cubic meters from 1990–2000, 69.50 million cubic meters from 2001–2010, and 58.43 million cubic meters from 2011–2022 (Figure 8d,e). All the results showed an increasing trend in the arid region over the past 32 years.

Figure 8.
The MEIFR balance of the 7 major river in the Aiding Lake Basin: (a–c) show the changes in the MEIFR of the rivers and Aiding Lake with human activities from 1990–2022; (d,e) show the balance of the MEIFR of the 7 major rivers in the Aiding Lake Basin.
Here, the NDWI was used to describe the ecological quality of the Aiding Lake Basin. From 2011–2022 the NDWI was higher than that during the other two periods, but the human consumption of water provided by the 7 rivers was not the highest. From 1990–2000 and 2001–2010, the replenishment of the 7 rivers flowing into Aiding Lake was the highest, which fully reflects the objective of this paper, namely, a balanced and harmonious relationship among humans, water, and ecology. Therefore, we identified a balance between the MEIFR and anthropogenic water depletion from 2011–2022. During this period, although the human consumption of water provided by the 7 rivers varied between those from 1990–2000 and 2001–2010, the amount of replenishment of Aiding Lake was the highest among the three periods. (Figure 8d,e).
4. Discussion
4.1. Driving Factors of the Ecological Flow Changes in the Whole Piedmont Area
In this research, the piedmont MEIFR in the Turpan region of Xinjiang showed a gradual rising trend. The primary driving factor of this trend is climate change in this region [32]. Since the 1990s, the temperature in the Turpan–Hami Basin of Xinjiang, China, has gradually increased. According to the data statistics of the past 32 years, the climate-induced precipitation increase in the arid areas has been a warm and wet process. The temperature change in arid areas has been mainly reflected in the winter data [32]. This situation reasonably explains the findings in Section 3.1. Throughout the entire glacier and snow region of the mountains in Xinjiang, glaciers have retreated by 15% to 30% over the past 32 years, and glaciers are the main source of water resources in arid areas [33,34]. The discharge of the seven major rivers in Aiding Lake in the study area has shown a gradual rising trend over the 32-year period. Therefore, the increase in precipitation and snowmelt runoff of glacier meltwater will inevitably lead to an increase in river discharge in the Aiding Lake Basin, which further explains the increase in the MEIFR for maintaining the river ecology (Figure 5). Moreover, the MEIFR of the Tarang River has been higher than that of the other rivers (Figure 5d). The satellite remote sensing images revealed that the discharge of this river in the oasis zone of the basin area has been markedly higher than that of the other six rivers, thus, the MEIFR has been higher.
Another driving factor is human activity, such as the development of industry and agriculture, both of which disrupt the balance between nature and humans in the oasis zones [35]. With the increase in population and human production levels in arid and semiarid areas and increases in oasis areas, water consumption has increased. Many pollutants have been discharged into the surface water system, causing tensions related to water supplies and deterioration of the water environment; these situations have seriously restricted sustainable economic development in arid and semiarid areas [36,37]. Extensive use of river water flooding has led to an increase in the groundwater level in the oasis zones in the Aiding Lake Basin, intense surface evaporation, salt accumulation, and serious secondary salinization of soil, further influencing the ecological flow of river channels [6]. Consequently, the MEIFR of the river channels has slowly decreased from the upper reaches to the lower reaches (Figure 5d). Chinese and international studies have shown that human activities considerably affect the ecosystem processes in arid and semiarid areas of Xinjiang, providing further indications that human activities have a direct impact on the ecological flow conditions of the rivers in the Aiding Lake Basin. Chen et al. [38] used the Mann–Kendall mutation test, the cumulative anomaly method, the ordered clustering method, and the double cumulative curve method to calculate the contribution rate. They concluded that human activities are the second factor affecting runoff change of the inland rivers in the Xinjiang arid area. Although the anthropogenic water depletion has increased, the river discharge has slowly increased because of climate change.
4.2. Explanation of the Balance and Maintenance Method
The MEIFR of Aiding Lake decreased by 25% from 1990 to 2013, as indicated in Section 3.4 (Figure 7e). Once the human consumption of water provided by the seven main rivers within the lake basin exceeded the above-mentioned indicators during this period (Figure 8d,e), the lake ecology was threatened. After 2013, the local government adopted various water-saving control measures and strictly adhered to the three water red lines. With the implementation of the national strictest water resource management system and widespread application of water-saving irrigation technology, remarkable results have been achieved in the conservation and utilization of water resources in arid areas, with increasing water-saving irrigation areas and significant improvements in the agricultural water efficiency. Thus, the oasis MEIFR also increased after 2013, as discussed in Section 3.3. The decrease in the Aiding Lake surface area was controlled, the lake area of Aiding Lake showed a trend of gradual expansion, and the lake ecology was greatly improved, with a balance period after 2013, as noted in Section 3.3. Wang et al. [6] used a water resource allocation model and determined that the MEIFR of Aiding Lake is 83 million cubic meters. This result is similar to our research findings, because both studies are based on a large number of data to calculate the MEIFR. Dickson et al. [8] found that the balance between the MEIFR and anthropogenic water depletion occurred after the implementation of government regulations. This conclusion agrees with our results, because both studies are based on an analysis from a basin wide perspective. Some researchers have obtained different results because diversion by river sluices and storage in reservoirs built for agricultural development have altered the annual variation in river runoff [39,40].
In arid area, increases in demand levels often lead to excessive use of water resources. The overuse of water resources seriously affects local economic development and plays a crucial role in accelerating ecological degradation. The unbalanced utilization of water resources, inadequate water-saving measures, and ineffective strategic allocation of facilities result in a large amount of water resource waste. Therefore, the efficient utilization of water resources must be fully implemented. To achieve a dynamic balance in the human–water–ecology relationship in arid areas, water consumption related to social and economic purposes must be reduced to align with the MEIFR used for ecosystem maintenance [35]. Government regulations can reduce water demands and help maintain a suitable balance between water resource protection and rational utilization and industrial, commercial, and agricultural development [41]. Moreover, researchers, based on the ecological flow regime model, have established comprehensive and complex management targets for reservoir operations that support the downstream aquatic ecosystem and provide decision-makers with the optimal trade-off between human needs and ecological flow regime maintenance [8,37,42,43,44]. For example, Dickson et al. [8] built models to evaluate ecological flow in the arid western regions of the United States to determine ecological protected areas, thus providing valuable information for decision-makers. These researchers showed that only moderate economic development and population growth and a combination of efficient water-saving methods and interregional water transfer can maintain the dynamic balance of the human–water–ecology relationship in arid and semiarid areas.
4.3. Advantages and Disadvantage of This Research
In this research, we combined unmanned aerial vehicle (UAV) remote sensing and satellite remote sensing technologies with traditional hydraulic methods to solve the problem of quantitatively calculating the MEIFR of rivers from upstream to downstream in arid areas. On this basis, we quantified the specific indicators of the balance relationship. However, the limitation of this research is that we only considered the MEIFR. The ecological water demand of the entire watershed was not considered, while the ecological water demand outside the river channels across the entire watershed is also needed. Moreover, the satellite remote sensing data in this study exhibited a slightly reduced resolution due to the influence of clouds. Therefore, this new method can be applied globally to rivers that lack measured hydrological data and the weather of the area is cloudless in global. So, this new method is particularly applicable to the arid areas in global. In future work, to overcome these shortcomings, ground monitoring stations should be established to eliminate the impact of clouds and explore the ecological water demand outside the river channels in arid areas.
This research could also facilitate the achievement of part of Item 6 of the sustainable development goals. SDG 6 pertains to clean water and sanitation, suggesting that clean, accessible water for all is an essential part of the world we want to live in. Moreover, maintenance of the dynamic balance of the human–water–ecology relationship in arid areas is part of the SDGs. Studies have shown that the sustainable development of water resources and economic society cannot be guaranteed if rapid economic and population growth is pursued regardless of the bearing capacity of water resources [45,46,47]. Therefore, in regard to our research, maintenance of the dynamic balance of the human–water–ecology relationship in arid areas is very important and essential.
5. Conclusions
In this study, we proposed a novel wet-circumferential method for calculating the MEIFR in inland arid areas from the perspective of the entire basin and found the balance occurrence time. Moreover, we provided indicators of the water consumption index for human use. The results showed that the MEIFR of the seven rivers increased by 15–100% from 1990 to 2022, the MEIFR of Aiding Lake decreased by 25% from 1990 to 2013 and then increased by 66.7% from 2013 to 2022, and the MEIFR balance occurred from 2011 to 2022. During this period, the ecological conditions of Aiding Lake were significantly improved and the available water for humans provided by the seven rivers in the Aiding Lake Basin reached the second largest value among the three periods. Finally, the proposed method could be globally promoted to provide guidance for water resource management by decision-makers and help attain the SDGs.
Author Contributions
Conceptualization, S.Y. and H.L. (Hezhen Lou); data curation, J.L. and H.L. (Hao Li); formal analysis, J.L. and Y.D.; funding acquisition, H.L. (Hezhen Lou); investigation, B.Z., H.W. and Z.P.; methodology, S.Y. and H.L. (Hezhen Lou); project administration, J.D. and J.Z.; supervision, H.L. (Hezhen Lou); validation, S.Y.; visualization, J.L.; writing—original draft, J.L.; writing—review and editing, H.L. (Hezhen Lou). All authors have read and agreed to the published version of the manuscript.
Funding
This research was funded by the Third Comprehensive Scientific Investigation in Xinjiang (grant number SQ2021xkk02400). The authors thank the National Natural Science Foundation of China (grant number U1812401), the Tianshan Innovative Team Project (number 2022TSYCTD0001), the Beijing Natural Science Foundation (number 8234071), the Special Project for Innovation and Development from the China Meteorological Administration (number CXFZ2023J041), and the National Key Research and Development Project (number 2022YFF130201).
Data Availability Statement
No new data were created or analyzed in this study. Data sharing is not applicable to this article.
Conflicts of Interest
The authors declare no conflict of interest.
Abbreviations
| MEIFR | minimum ecological instream flow requirement; |
| EWD | ecological water demand; |
| UAV | unmanned aerial vehicle; |
| RSHS | remote sensing hydrological station; |
| RTK | real-time kinematic; |
| DSM | digital surface model; |
| DOM | digital orthographic model; |
| GEE | Google Earth engine; |
| NDWI | normalized difference water index; |
| SDGs | sustainable development goals. |
References
- Petts, G. Water Quality Characteristics of Regulated Rivers. Prog. Phys. Geogr. 1986, 10, 492–516. [Google Scholar] [CrossRef]
- Bovee, K. Development and Evaluation of Habitat Suitability Criteria for Use in the Instream Flow Incremental Methodology; USDI Fish and Wildlife Service: Washington, DC, USA, 1986.
- Gleick, P. Water in crisis: Paths to sustainable water use. Ecol. Appl. 1998, 8, 571–579. [Google Scholar] [CrossRef]
- Wang, X.; Zhang, Y.; Liu, C. A theoretical discussion of ecological and environmental water requirements of river course. J. Nat. Resour. 2003, 18, 240–246. [Google Scholar] [CrossRef]
- Liu, S.; Mo, X.; Xia, J.; Liu, C.; Lin, Z.; Men, B.; Ji, L. Uncertainty Analysis in Estimating the Minimum Ecological Instream Flow Requirements via Wetted Perimeter Method: Curvature Technique or Slope Technique. Acta Geogr. Sin. 2006, 61, 273–281. [Google Scholar] [CrossRef]
- Yang, Z.; Xie, X.; Wang, H.; He, H. The Protection of lake in arid region-oriented idea for water resources allocation case of Aiding Lake Watershed. Water Resour. Hydropower Eng. 2017, 48, 31–35. [Google Scholar] [CrossRef]
- Guo, W.; Hong, F.; Wang, B.; Yuan, W.; Wang, G.; Cheng, S.; Wang, H. Evolution and attribution of ecological flow in the Xiangjiang River basin since 1961. Environmental Science and Pollution Res. Int. 2023, 30, 104388–104407. [Google Scholar] [CrossRef]
- Dickson, B.; Albano, C.; McRae, B.; Anderson, J.; Theobald, D.; Zachmann, L.; Sisk, T.; Dombeck, M. Informing Strategic Efforts to Expand and Connect Protected Areas Using a Model of Ecological Flow, with Application to the Western United States. Conserv. Lett. 2017, 10, 564–571. [Google Scholar] [CrossRef]
- Arthington, A.; Naiman, R.; McClain, M.; Nilsson, C. Preserving the biodiversity and ecological services of rivers: New challenges and research opportunities. Freshw. Biol. 2010, 55, 1–16. [Google Scholar] [CrossRef]
- Tennant, D. Instream Flow Regimens for Fish, Wildlife, Recreation and Related Environmental Resources. Fisheries 1976, 1, 6–10. [Google Scholar] [CrossRef]
- Stalnaker, C.; Lamb, B.; Henriksen, J. The Instream Flow Incremental Methodology: A Primer for IFIM; Biological Report; Department of Interior National Biological Service: Denver, CO, USA, 1995; Volume 29.
- Karim, K.; Gubbels, E.; Goulter, I. Review Of Determination Of Instream Flow Requirements With Special Application To Australia1. J. Am. Water Resour. Assoc. 1995, 31, 199–209. [Google Scholar] [CrossRef]
- Roderick, M.; Sun, F.; Wang, Y.; Shen, Y. Attribution of satellite-observed vegetation trends in a hyper-arid region of the Heihe River basin, Western China. Hydrol. Earth Syst. Sci. 2014, 11, 3499–3509. [Google Scholar] [CrossRef]
- Nie, Y.; Guo, Y.; Tan, Y.; Huang, W.; Liu, X. Operation optimization of ecological water conveyance in Aksu River Basin based on ecological restoration. Arid. Land Geogr. 2022, 45, 325–332. [Google Scholar] [CrossRef]
- Liang, S.; Xu, T.; Zhang, H. Regulation model of ecological water demand based on hydrological regime analysis in sluice-controlled river. J. Environ. Prot. Ecol. 2021, 22, 2023–2032. [Google Scholar] [CrossRef]
- Aman, R.; Fang, C. System Dynamics and Scenario Simulation of Water Resources Carrying Capacity in Xinjiang. Environ. Sci. Technol. 2020, 43, 205–215. [Google Scholar] [CrossRef]
- Jiapaer, G.; Chen, X.; Bao, A.M. A comparison of methods for estimating fractional vegetation cover in arid regions. Agric. For. Meteorol. 2011, 151, 1698–1710. [Google Scholar] [CrossRef]
- Zhao, L. Prediction model of ecological environmental water demand based on big data analysis. Environ. Technol. Innov. 2020, 21, 101–196. [Google Scholar] [CrossRef]
- Yan, D.; Wang, H.; Wang, F.; Tang, Y. Frame of research work on ecological water demand and key topics. J. Hydraul. Eng. 2007, 38, 267–273. [Google Scholar] [CrossRef]
- Bishop, C.A.; Liu, J.G.; Mason, P.J. Hyperspectral remote sensing for mineral exploration in Pulang, Yunnan Province, China. Int. J. Remote Sens. 2011, 32, 2409–2426. [Google Scholar] [CrossRef]
- Garambois, P.; Monnier, J. Inferrence of effective river properties from remotely sensed observations of water surface. Adv. Water Resour. 2015, 79, 103–120. [Google Scholar] [CrossRef]
- Yang, S.; Pan, Z.; Lou, H.; Li, C.; Zhang, J.; Zhang, Y.; Yin, Y.; Gong, J.; Luo, Y.; Zhi, M.; et al. Reconstruction of the water cycle process reveals the 600-year evolution of the human-water relationship in Tunpu, China. J. Hydrol. 2023, 617, 128927. [Google Scholar] [CrossRef]
- Lou, H.; Yang, S.; Shi, X.; Zhang, J.; Pan, Z.; Li, C.; Zhang, Y.; Zhou, B.; Li, H.; Shi, Y.; et al. Whether the enhanced terrestrial vegetation carbon sink affect the water resources in the middle-low latitude karst areas of China? J. Hydrol. 2023, 620, 129510. [Google Scholar] [CrossRef]
- Lewin, J.; Gibbard, R. Quaternary river terraces in England: Forms, sediments and processes. Geomorphology 2010, 120, 293–311. [Google Scholar] [CrossRef]
- Zhang, X.; Jiao, Z.; Zhao, C.; Qu, Y.; Liu, Q.; Zhang, H.; Tong, Y.; Wang, C.; Li, S.; Guo, J.; et al. Review of Land Surface Albedo: Variance Characteristics, Climate Effect and Management Strategy. Remote Sens. 2022, 14, 1382. [Google Scholar] [CrossRef]
- Lou, H.; Zhang, Y.; Yang, S.; Wang, X.; Pan, Z.; Luo, Y. A New Method for Long-Term River Discharge Estimation of Small- and Medium-Scale Rivers by Using Multisource Remote Sensing and RSHS: Application and Validation. Remote Sens. 2022, 14, 1798. [Google Scholar] [CrossRef]
- Pan, Z.; Yang, S.; Lou, H.; Li, C.; Zhang, J.; Zhang, Y.; Luo, Y.; Li, X. Perspectives of human–water co-evolution of blue–green water resources in subtropical areas. Hydrol. Process. 2023, 37, e14818. [Google Scholar] [CrossRef]
- Lou, H.; Li, H.; Yang, S.; Wang, X.; Pan, Z.; Zhang, Y.; Zhou, B.; Zhang, J.; Zhang, X. River discharge recovery lag in the small and medium-sized rivers occurred in response to climate change and human activities. J. Hydrol. 2023, 620, 129453. [Google Scholar] [CrossRef]
- Pan, Z.; Yang, S.; Ren, X.; Lou, H.; Zhou, B.; Wang, H.; Zhang, Y.; Li, H.; Li, J.; Dai, Y. GEE can prominently reduce uncertainties from input data and parameters of the remote sensing-driven distributed hydrological model. Sci. Total Environ. 2023, 870, 161852. [Google Scholar] [CrossRef]
- Taniguchi-Quan, K.; Irving, K.; Stein, E.; Poresky, A.; Wildman, R.A., Jr.; Aprahamian, A.; Rivers, C.; Sharp, G.; Yarnell, S.; Feldman, J. Developing Ecological Flow Needs in a Highly Altered Region: Application of California Environmental Flows Framework in Southern California, USA. Front. Environ. Sci. 2022, 10, 787631. [Google Scholar] [CrossRef]
- Jiang, X.; Pi, H.; Zhou, R.; Huang, X. Study on Calculating Ecological Water Demand of Rivers Using Wetted Perimeter Method Based on Unmanned Aerial Vehicle Telemetry Technology. China Rural. Water Hydropower 2022, 486, 62–68. [Google Scholar] [CrossRef]
- Wang, Y.; Qin, D. Influence of climate change and human activity on water resources in arid region of Northwest China: An overview. Adv. Clim. Chang. Res. 2017, 8, 268–278. [Google Scholar] [CrossRef]
- Wang, Y.; Zhou, B.; Qin, D.; Wu, J.; Gao, R.; Song, L. Changes in Mean and Extreme Temperature and Precipitation over the Arid Region of Northwestern China: Observation and Projection. Adv. Atmos. Sci. 2017, 34, 289–305. [Google Scholar] [CrossRef]
- Yao, X.; Zhang, M.; Zhang, Y.; Wang, J.; Xiao, H. New insights into climate transition in northwest China. Arid. Land Geogr. 2022, 45, 671–683. [Google Scholar] [CrossRef]
- Nhassengo, O.; Somura, H.; Wolfe, J. Environmental flow sustainability in the Lower Limpopo River Basin, Mozambique. J. Hydrol.-Reg. Stud. 2021, 36, 14. [Google Scholar] [CrossRef]
- Diaz-Caravantes, R.; Zuniga-Teran, A.; Martin, F.; Bernabeu, M.; Stoker, P.; Scott, C. Urban water security: A comparative study of cities in the arid Americas. Environ. Urban. 2020, 32, 275–294. [Google Scholar] [CrossRef]
- Yarnell, S.; Willis, A.; Obester, A.; Peek, R.; Lusardi, R.; Zimmerman, J.; Grantham, T.; Stein, E. Corrigendum: Functional Flows in Groundwater-Influenced Streams: Application of the California Environmental Flows Framework to Determine Ecological Flow Needs. Front. Environ. Sci. 2022, 10, 1097–1098. [Google Scholar] [CrossRef]
- Chen, F.; Wang, Y.; Wu, Z.; Feng, P. Impacts of Climate Change and Human Activities on Runoff of Continental River in Arid Areas Taking Kensiwate Hydrological Station in Xinjiang Manas River Basin as an Example. Arid. Zone Res. 2015, 32, 692–697. [Google Scholar] [CrossRef]
- Huang, F.; Ochoa, C.; Chen, X.; Cheng, Q.; Zhang, D. An entropy-based investigation into the impact of ecological water diversion on land cover complexity of restored oasis in arid inland river basins. Ecol. Eng. 2020, 151, 2012–2024. [Google Scholar] [CrossRef]
- Ren, K.; Huang, S.; Huang, Q.; Wang, H.; Leng, G.; Cheng, L.; Fang, W.; Li, P. A nature-based reservoir optimization model for resolving the conflict in human water demand and riverine ecosystem protection. J. Clean. Prod. 2019, 231, 406–418. [Google Scholar] [CrossRef]
- Suen, J.; Eheart, J. Reservoir management to balance ecosystem and human needs: Incorporating the paradigm of the ecological flow regime. Water Resour. Res. 2006, 42, 34171–34179. [Google Scholar] [CrossRef]
- Parivar, P.; Quanrud, D.; Sotoudeh, A.; Abolhasani, M. Evaluation of urban ecological sustainability in arid lands (case study: Yazd-Iran). Environ. Dev. Sustain. 2021, 23, 2797–2826. [Google Scholar] [CrossRef]
- Miranda, R.; Hermoso, V.; Hassall, C. Ecological quality and conservation status of inland waters. Inland Waters 2019, 9, 275–277. [Google Scholar] [CrossRef]
- Cai, X.; Rosegrant, M. Optional water development strategies for the Yellow River Basin: Balancing agricultural and ecological water demands. Water Resour. Res. 2004, 40, 11. [Google Scholar] [CrossRef]
- Aman, R.; Fang, C.; Zhao, R. Research on the Water Resources Carrying Capacity and Spatial-Temporal Characteristics in Xinjiang. Resour. Environ. Yangtze Basin 2020, 29, 1576–1585. [Google Scholar] [CrossRef]
- Fang, K.; Xu, A.; He, J.; Fang, C.; Liu, Q. Integrated assessment and division management of sustainable development in the Belt and Road countries. Chin. Sci. Bull. Chin. 2021, 66, 2441–2454. [Google Scholar] [CrossRef]
- Yue, L.; Qi, S.; Li, J. Research on Ecological Restoration Technology in Arid or Semi-arid Areas from the Perspective of the Belt and Road Initiative. J. Resour. Ecol. 2022, 13, 964–976. [Google Scholar] [CrossRef]
Disclaimer/Publisher’s Note: The statements, opinions, and data contained in all publications are solely those of the individual author(s) and contributor(s), and not of MDPI and/or the editor(s). MDPI and/or the editor(s) disclaim responsibility for any injury to people or property resulting from any ideas, methods, instructions, or products referred to in the content. |

Disclaimer/Publisher’s Note: The statements, opinions and data contained in all publications are solely those of the individual author(s) and contributor(s) and not of MDPI and/or the editor(s). MDPI and/or the editor(s) disclaim responsibility for any injury to people or property resulting from any ideas, methods, instructions or products referred to in the content. |
© 2023 by the authors. Licensee MDPI, Basel, Switzerland. This article is an open access article distributed under the terms and conditions of the Creative Commons Attribution (CC BY) license (https://creativecommons.org/licenses/by/4.0/).