Article

Water Area Variation and River–Lake Interactions in the Poyang Lake from 1977–2021

1
Regional Soil and Water Conservation and Environmental Effects Research Department, Institute of Soil and Water Conservation, Northwest A&F University, Xianyang 712100, China
2
Institute of Soil and Water Conservation, Chinese Academy of Sciences and Ministry of Water Resources, Xianyang 712100, China
*
Author to whom correspondence should be addressed.
Remote Sens. 2023, 15(3), 600; https://doi.org/10.3390/rs15030600
Submission received: 9 December 2022 / Revised: 13 January 2023 / Accepted: 14 January 2023 / Published: 19 January 2023

Abstract

:
Lakes are an important part of the Earth’s surface. Poyang Lake is China’s largest freshwater lake with complex hydrological relationships and unique rhythmic changes. There is no systematic understanding of the relationship between lake watershed area and river–lake connectivity. In this study, using remote sensing imagery, hydrological data, meteorological data, and land use surveys, we investigated changes in the Poyang Lake water area from 1977–2021. In addition, we examined the relationship between the lake water area and potential impact factors and analyzed the influence of river–lake interactions on the lake water area. The results showed that the water area of Poyang Lake decreased during the study period. River runoff and sediment load changes in the Poyang Lake basin are the main factors affecting the lake water area. Additionally, the Three Gorges Dam water impoundment situated in the upper reaches of the Yangtze River weakened and eliminated the block and reverse flow of the Yangtze River into the Poyang Lake, causing the water area to decrease toward the end of the flood season in 2005 and in the dry season in 2003. Changes in the lakebed elevation caused by sedimentation and anthropogenic activities have also accelerated the shrinkage of the water area. Overall, the results of this study indicate that variations in the river–lake interactions are the primary cause of the significant changes observed in the Poyang Lake water area in the last five decades.

Graphical Abstract

1. Introduction

Lakes are natural reservoirs formed by the collection of stagnant water in surface depressions. The broad expanse of water and slow currents that are characteristic of lakes play an important role in Earth’s hydrologic cycle [1]. In addition, lakes provide water to surrounding areas and influence river flow regulation and groundwater levels. The ecosystems formed by lakes also provide an essential living habitat for a range of organisms. Therefore, it is essential to maintain a stable state of lakes to ensure ecological balance [2,3,4]. In recent years, global warming and frequent human activity have substantially impacted major lakes and their surrounding environments worldwide. Several scholars have analyzed the characteristics of global lake changes and have confirmed that changes to the lake area affect the overlying atmosphere and lake–air interactions, impacting the regional climate [5,6,7,8]. As a result of these impacts and the important role that lakes play in ecosystems and regional climate change stability, there is an urgent need to understand lake changes, which are occurring relatively quickly.
Lake Poyang, the largest freshwater fluvial lake in China, is located in China’s most important economic development region, the middle-lower Yangtze Plain (Figure 1). As the largest lake connected to the Yangtze River, Poyang Lake is an alternately inflow–outflow lake with complex hydrological relationships and unique rhythmic changes [9]. In the flood season, Poyang Lake is a lake landscape when the Poyang Basin and Yangtze River flow combine creating the lake. In the dry season, Poyang Lake is a river landscape, Poyang Basin runoff flows through the lake berth into the Yangtze River [10]. Hydrological monitoring revealed that the interval between the flood and dry season has decreased, seasonal drought events have intensified, and floods have occurred more frequently in the last 22 years [11,12,13]. Dramatic changes in the lake’s hydrological cycle have had negative environmental effects [14]. Several scholars have recommended the construction of a dam at the estuary of Poyang Lake to artificially regulate the interaction between the Yangtze River and Poyang Lake and decrease the severity of disaster events [15]. However, there is a lot of debate about this idea. Opponents contend that climate change and human activity have a significant impact on the Poyang Lake basin and that erecting dams would further worsen the effects of the broken hydrological connection [16,17,18]. Therefore, having a comprehensive grasp of the changes and their causes of Poyang Lake is necessary. Monitoring lake water areas help us more intuitively understand the true condition of lakes, especially big lake systems. Earlier, the detection of water areas relied on field measurements or grid method for estimation, which had low accuracy and large errors [19]. With the development of remote sensing technology, it is possible to acquire images of the study area by remote sensing satellites, interpret the spectral information of the images on the computer, and the outline of the waters will be automatically extracted from the images to obtain the size of the water body area. Furthermore, the extraction results meet the accuracy requirements and are highly efficient [20].
The water area of Poyang Lake interacts with the environment, and as the water level and area of the lake increase, it will make the local temperature and the near-surface atmosphere stable [21]. Due to the significant seasonality of the lake’s inundation area, the lake water area is extremely variable, coupled with the impoundment of the Three Gorges Dam in the upper reaches of the Yangtze River in 2003, which affects the river–lake connection relationship of Poyang Lake, the change of lake water body area is more complicated [22,23,24]. It has been found that the area of lake water bodies has been reduced in recent years [25], but there is no systematic understanding of the influence mechanism between the lake water area and the river–lake connectivity. In this study, historical images of Poyang Lake from the last 40 years were used to extract water area data for flood and dry seasons. Combined with basin hydrology, meteorology, and land use data and using statistical methods, the impact of climate change and anthropogenic activities on the hydrological relationship of the Poyang Lake were studied. Based on this research, we expected to reveal the importance of the hydrological connectivity of connected lakes and provide a theoretical basis for water resource management of connected lakes.

2. Study Area and Data
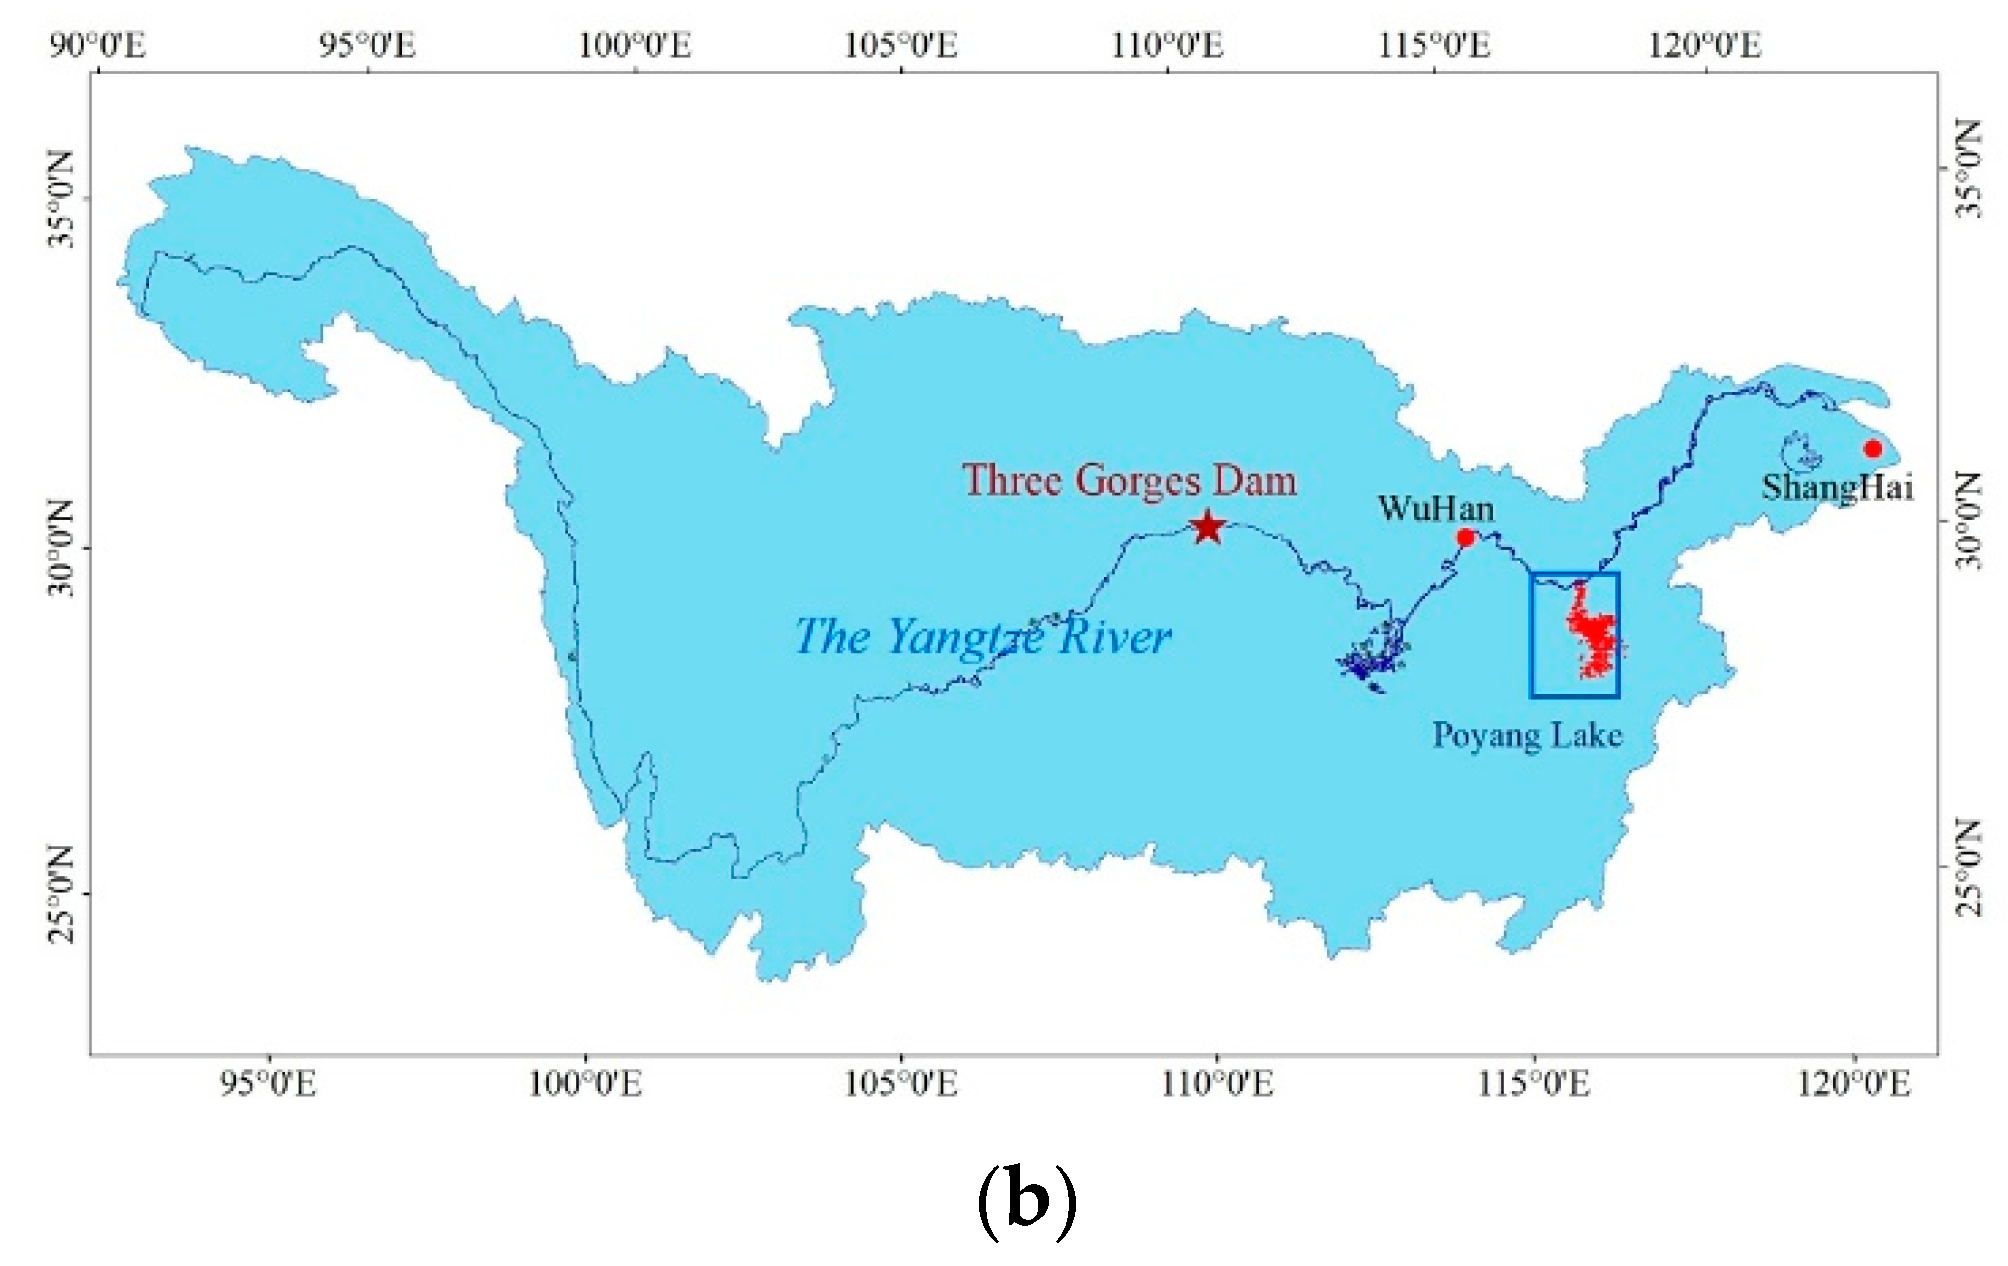
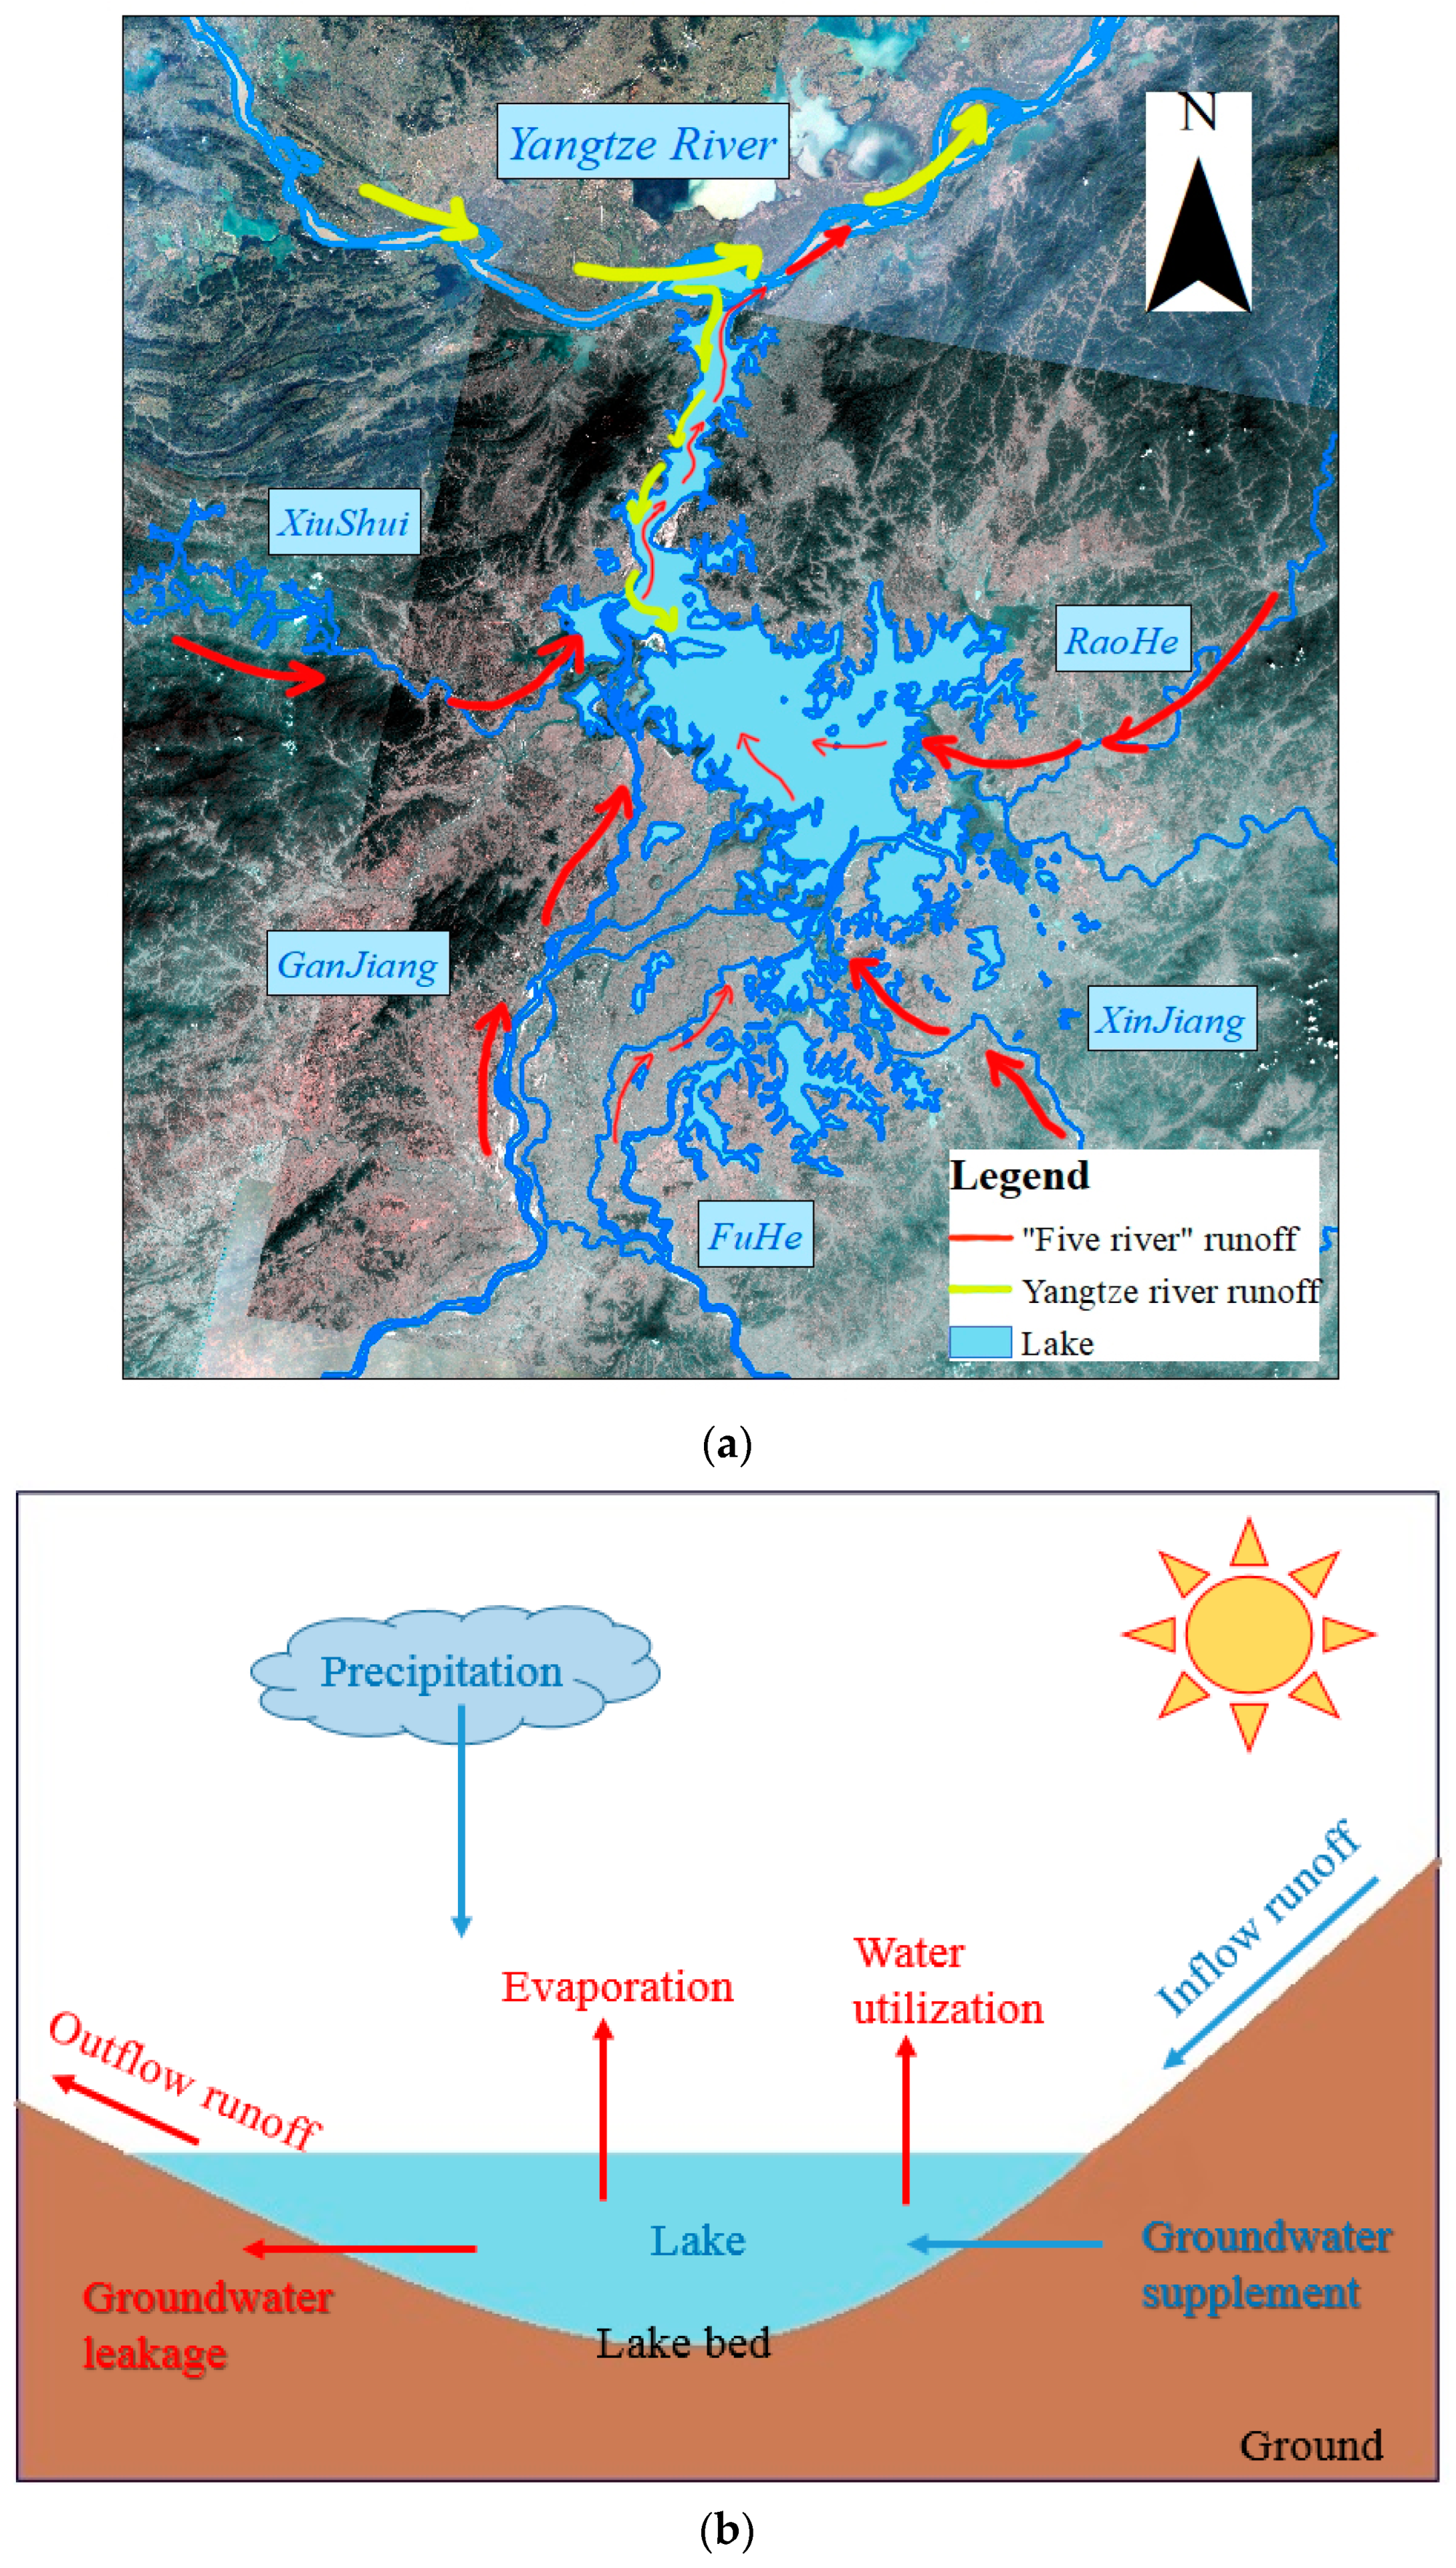
2.1. Study Area

We considered a portion of the Poyang Lake basin as the study area, which occurs on the south bank of the middle Yangtze Proper and connects with the Yangtze River (28°22′–29°45′N and 115°47′–116°45′E); the basin covers an area of 162,225 km2. The Poyang Lake basin is characterized by five rivers, namely the Ganjiang, Fuhe, Xinjiang, Raohe, and Xiushui Rivers; these rivers flow into Poyang Lake. Upon inflow storage, the lake water flows into the Yangtze River via the estuary of the lake, which in turn receives the Yangtze River runoff.
The Poyang Lake basin is characterized by a subtropical monsoon climate, with intense solar radiation. The average annual temperature is 11.7 degrees Celsius. The average annual precipitation is 551.6 mm, with 70% of the precipitation occurring in summer (July–September). Due to the highly variable precipitation in the basin, the seasonal variation of runoff into the lake of the five major rivers is substantial, with the precipitation received during this period accounting for 75% of the annual precipitation. During the dry season, from November–February, the area of the lake shrinks and part of the lakebed remains bare.

2.2. Data Collection

Remote sensing images were obtained for the Poyang Lake basin from the Landsat series (MSS, TM, ETM+, OLI) for the 1977–2021 period (Figure 2) and downloaded from the United States Geological Survey website (https://earthexplorer.usgs.gov/ (accessed on 20 February 2022)). Remote sensing images will have cloud distribution, which will impact the extraction of image information. Therefore, we select images with less than 30% cloud coverage and appropriate extraction effect for high-quality images for analysis. Overall, a total of 328 images were selected for the flood period (June to September) and the dry period (November to February) from 1977 to 2021 by excluding missing data from 1980, 1982, 1985, 1994, and 2009. In addition, historical high-resolution satellite images of the Poyang Lake obtained by the US Department of Defense (13 December 1967) were compared with earlier periods characterized by less anthropogenic disturbance. The image was downloaded from the fifth generation of Key-Hole spy satellites, the first generation of U.S. photo intelligence satellites, and the image was taken in December 1967. The satellite acquired the photos from space and sent the film back to Earth for processing and analysis, and the CIA (Central Intelligence Agency) processed the film for publication. The spatial resolution of the image used was 1.8 m.
We selected river runoff, river sediment, and land use in the watershed to represent the impact of human activities. Precipitation and pan evaporation in the basin are chosen to represent the influence of climate. The runoff and sediment load data were obtained from the Hydrological Information Yearbook published by the Ministry of Water Resources and Electricity of the People’s Republic of China. The measured annual runoff data and annual sediment load data from six hydrological stations of “Wuhe” and “Hukou” in the Poyang Lake basin were selected. Among them, “inflow” is the total runoff of “five rivers” in the basin. The “net outflow” is the sum of runoff from “Five Rivers” minus the runoff from “Hukou Station” (Figure 1) (runoff data distribution period: 1977–2020; sediment load data distribution period: 1980–2020). The precipitation and pan evaporation data of the Poyang Lake basin from 1977–2020 were obtained from 23 meteorological stations with actual measurements (Figure 1), and the data were downloaded from the China Meteorological Data Website (http://data.cma.cn/ (accessed on 11 September 2021)) [26]. Data from 23 sites were averaged for analysis. Finally, land use data for the Poyang Lake basin were obtained from the China National Land Use Database and classified using a secondary classification system for the following years: 1980, 1995, 2000, 2005, 2010, 2015, and 2020. All measured data used in this study were verified and rated as good quality.

3. Methods

3.1. Extraction Method of Water Area

The multi-band pixel value comparison method was used to extract water information and calculate the water area. In addition, the spectral characteristics of the water images were used to set thresholds, extract lake water data, and calculate the mean area of the annual flood and dry seasons. The image information is pre-processed before extraction. Atmospheric correction and radiation correction are performed on the ENVI software platform to reduce the errors of image spectral information. After pre-processing, we extract the spectral feature values of the lake water bodies by manually visually ticking the water bodies of the lake. The spectral features of the water body image are set as thresholds, and the image is spectrally analyzed to extract the area of the lake water. The result was consistent with the pixel values of adjacent pixels. After manual visual verification, the extracted water data were deemed accurate.

3.2. Statistical Analysis

The Mann–Kendall mutation test was used to detect the change point year of data and the Mann–Kendall trend method was used to identify temporal trends in the data series. The Mann–Kendall test is a widely used method for nonparametric statistical analysis. Its characteristic advantage is that the data samples do not need to obey any specific distribution pattern and are not disturbed by a few outliers. In addition, the test is commonly used to predict long-term trends in meteorological time series data such as temperature, precipitation, and runoff [27,28,29]. In this paper, correlation analysis and principal component analysis were also performed on the relationship between lake area and influencing factors such as net lake outflow, sediment load, rainfall, and temperature [30,31]. Principal component analysis (PCA) was used to identify the significant components or factors that explained most of the variance of the system [32,33]. PCA has the great advantage of reducing the number of variables used to explain hydrological behavior and retaining only those principal components that explain the most significant part of the variance of the data. It has been applied to hydrology [34]. Finally, the cross-tabulation matrix and change in terms of the percent of the landscape were used to assess the total change of land categories [35]. The results of the image comparisons revealed the characteristics and influencing mechanisms of water area change in the Poyang Lake basin.

4. Results

4.1. Trends and Change Point of Lake Water Area

From 1977–2021, the water area during the flood season displayed a significant downward trend (MK trend test Z = −1.67, passing the 95% test), with an annual decrease rate of –9.14 km2 (Figure 3). The largest lake area recorded for this period was 4662.05 km2 in 1998, and the smallest was 2139.37 km2 in 2006. The MK mutation test showed that the change point year was 2005.
In the dry season of the 1977–2021 period, the lake water area showed a notable downward trend (MK test Z = −3.09, passing the 99% test), with a decrease rate of −17.52 km2/a. The largest area recorded was 3202.91 km2 in 1997 and the smallest area was 775.41 km2 in 2019. In addition, the MK mutation test showed that the change point year was 2003, post which, the declining rate of the water area increased (Figure 3).

4.2. Analysis of Lake Water Area Impact Factor

The Poyang Lake is a classical river-connected drain lake. Figure 4 indicates the complex hydrological relationships that exist in this lake. The hydrological factors considered in this study were runoff, precipitation, pan evaporation, and water utilization. Groundwater was not considered, as the complexity of the exchange relationship of this resource is beyond the scope of this research. In the analysis, inflow and net outflow were used to express the influence of runoff, with net outflow indicating the total runoff of the rivers into the lake minus the runoff from the lake estuary. Selected sediment loads were analyzed to investigate variations in the lakebed, and land use was studied to investigate water utilization.

4.2.1. Changes in the Lake Flow

Figure 5 indicates the increasing trend characterizing the annual inflow of Poyang Lake from 1977–2020. However, the MK trend test indicated that the increasing trend was insignificant (Z = 1.10). In addition, the MK mutation test showed that the change point was in 1992 and 2003. Pearson’s linear correlation coefficient analysis was used to test the relationship between lake area and inflow of water, and the coefficient was 0.38 in the flood season and 0.08 in the dry season, and the correlation coefficient in the flood season passed the 99% significance test.
Figure 6 also indicates a net increasing trend for the annual net outflow of Poyang Lake from 1977–2020. The MK trend test confirmed that the increasing trend was lower than the inflow runoff (correlation coefficient = 0.54). In addition, the MK mutation test revealed that the change point was insignificant, and the results of Pearson’s analysis revealed correlation coefficients of 0.09 and 0.48 for lake area and outflow in the dry and flood seasons.

4.2.2. Changes in the Poyang Lake Sediment Load

From 1980–2020, the total sediment load received from the five major rivers into the Poyang Lake showed a significant downward trend (Figure 7), with a decrease rate of −33.5 × 10⁴ t/a (MK trend test Z = −1.67, >95%); however, the change point was not significant. Pearson analysis was used to determine the correlation between the annual sediment load and lake water area in the flood and dry seasons. The results revealed coefficients of 0.29 and 0.26 in the flood and dry seasons, respectively, with both coefficients being significant at the 95% confidence level. These results demonstrate a close association between the lake area and lake sediment load.

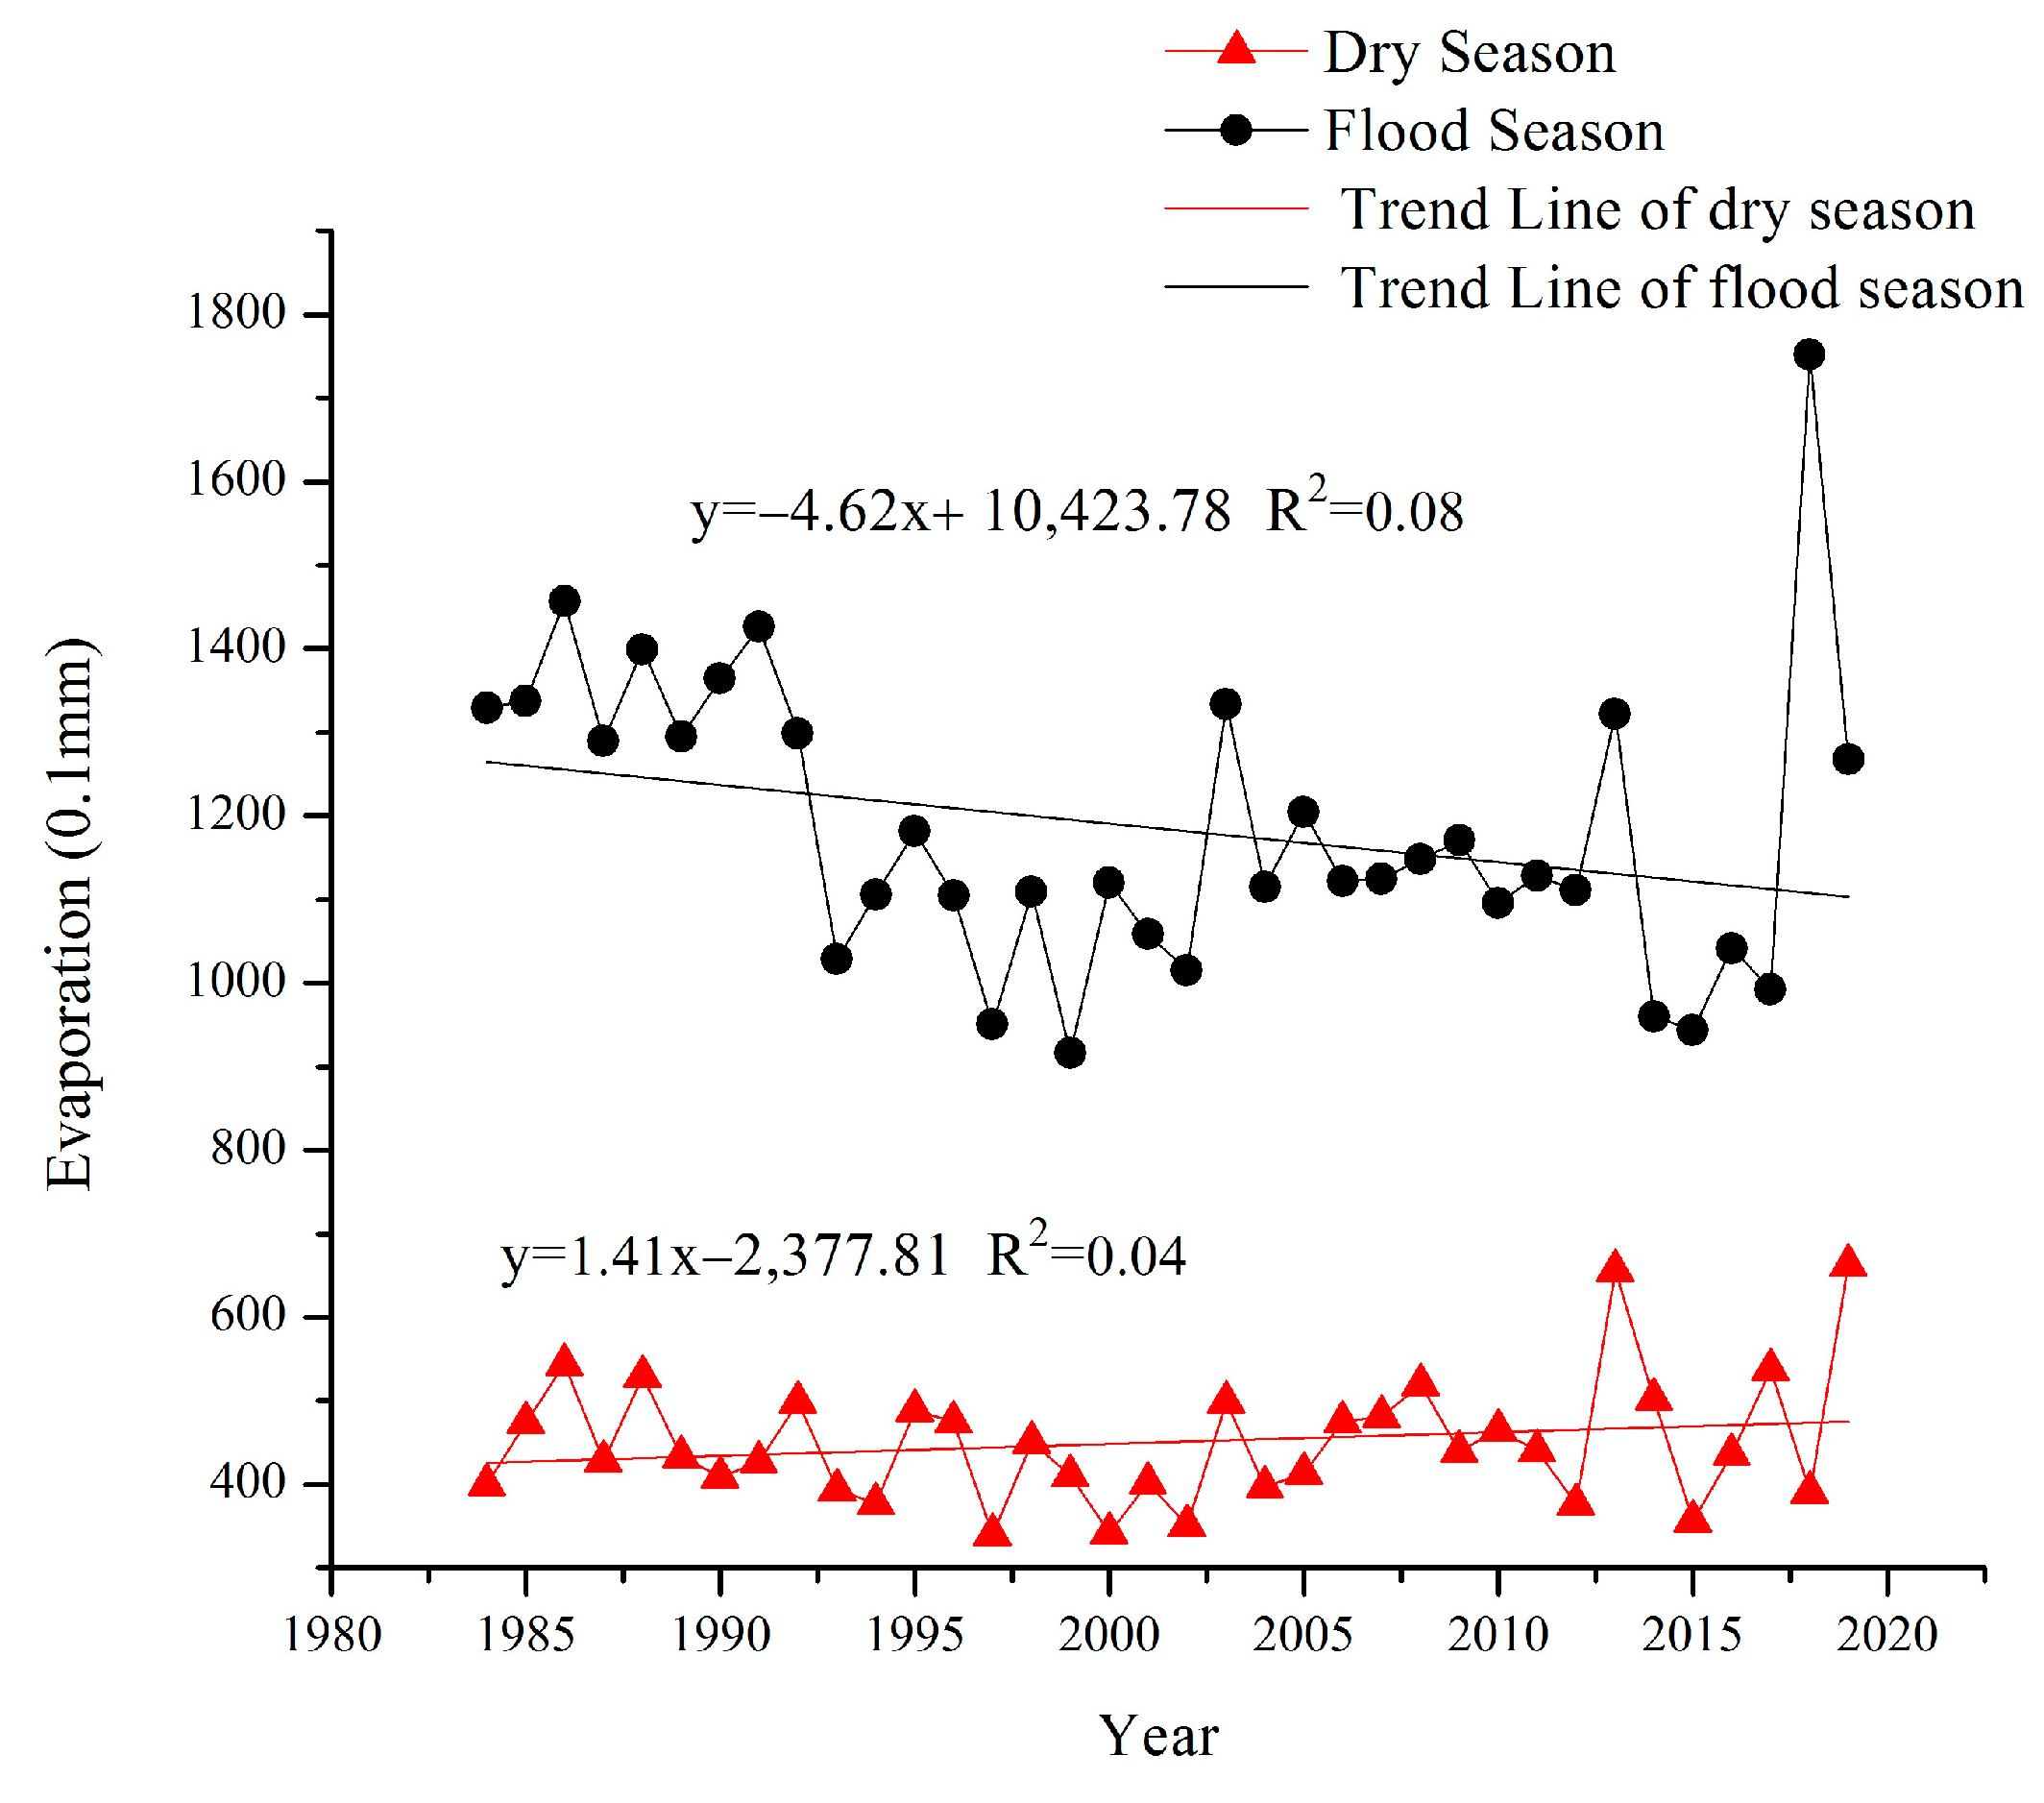
4.2.3. Changes in the Pan Evaporation and Precipitation in the Poyang Lake

From 1977–2020, the pan evaporation rate during the dry season showed an insignificant increasing trend (Z = 0.56), whereas pan evaporation during the flood season showed a significant downward trend (Z = −2.14), with a decrease rate of 4.62 × 10⁻¹ mm/a and change point in 1992. In addition, the Pearson analysis test indicated no correlation between pan evaporation and lake area. The correlation coefficients were 0.11 and 0.06 in the dry and flood seasons, respectively (Figure 8).
From 1977–2020, the flood season precipitation was characterized by an insignificant downward trend (Z = −0.41), whereas dry season precipitation significantly increased (Z = 2.48) (Figure 9). The correlation coefficient of flood season precipitation and area was 0.31 at a 99% confidence level. In the dry season, the correlation coefficient was insignificant.

4.2.4. Results of Principal Component Analysis

The PCA extracted 2 main factors affecting the area of the lake water area, and the results reflect that the area of lake water bodies during the flood and dry periods is mainly affected by runoff and sediment load (Table 1).

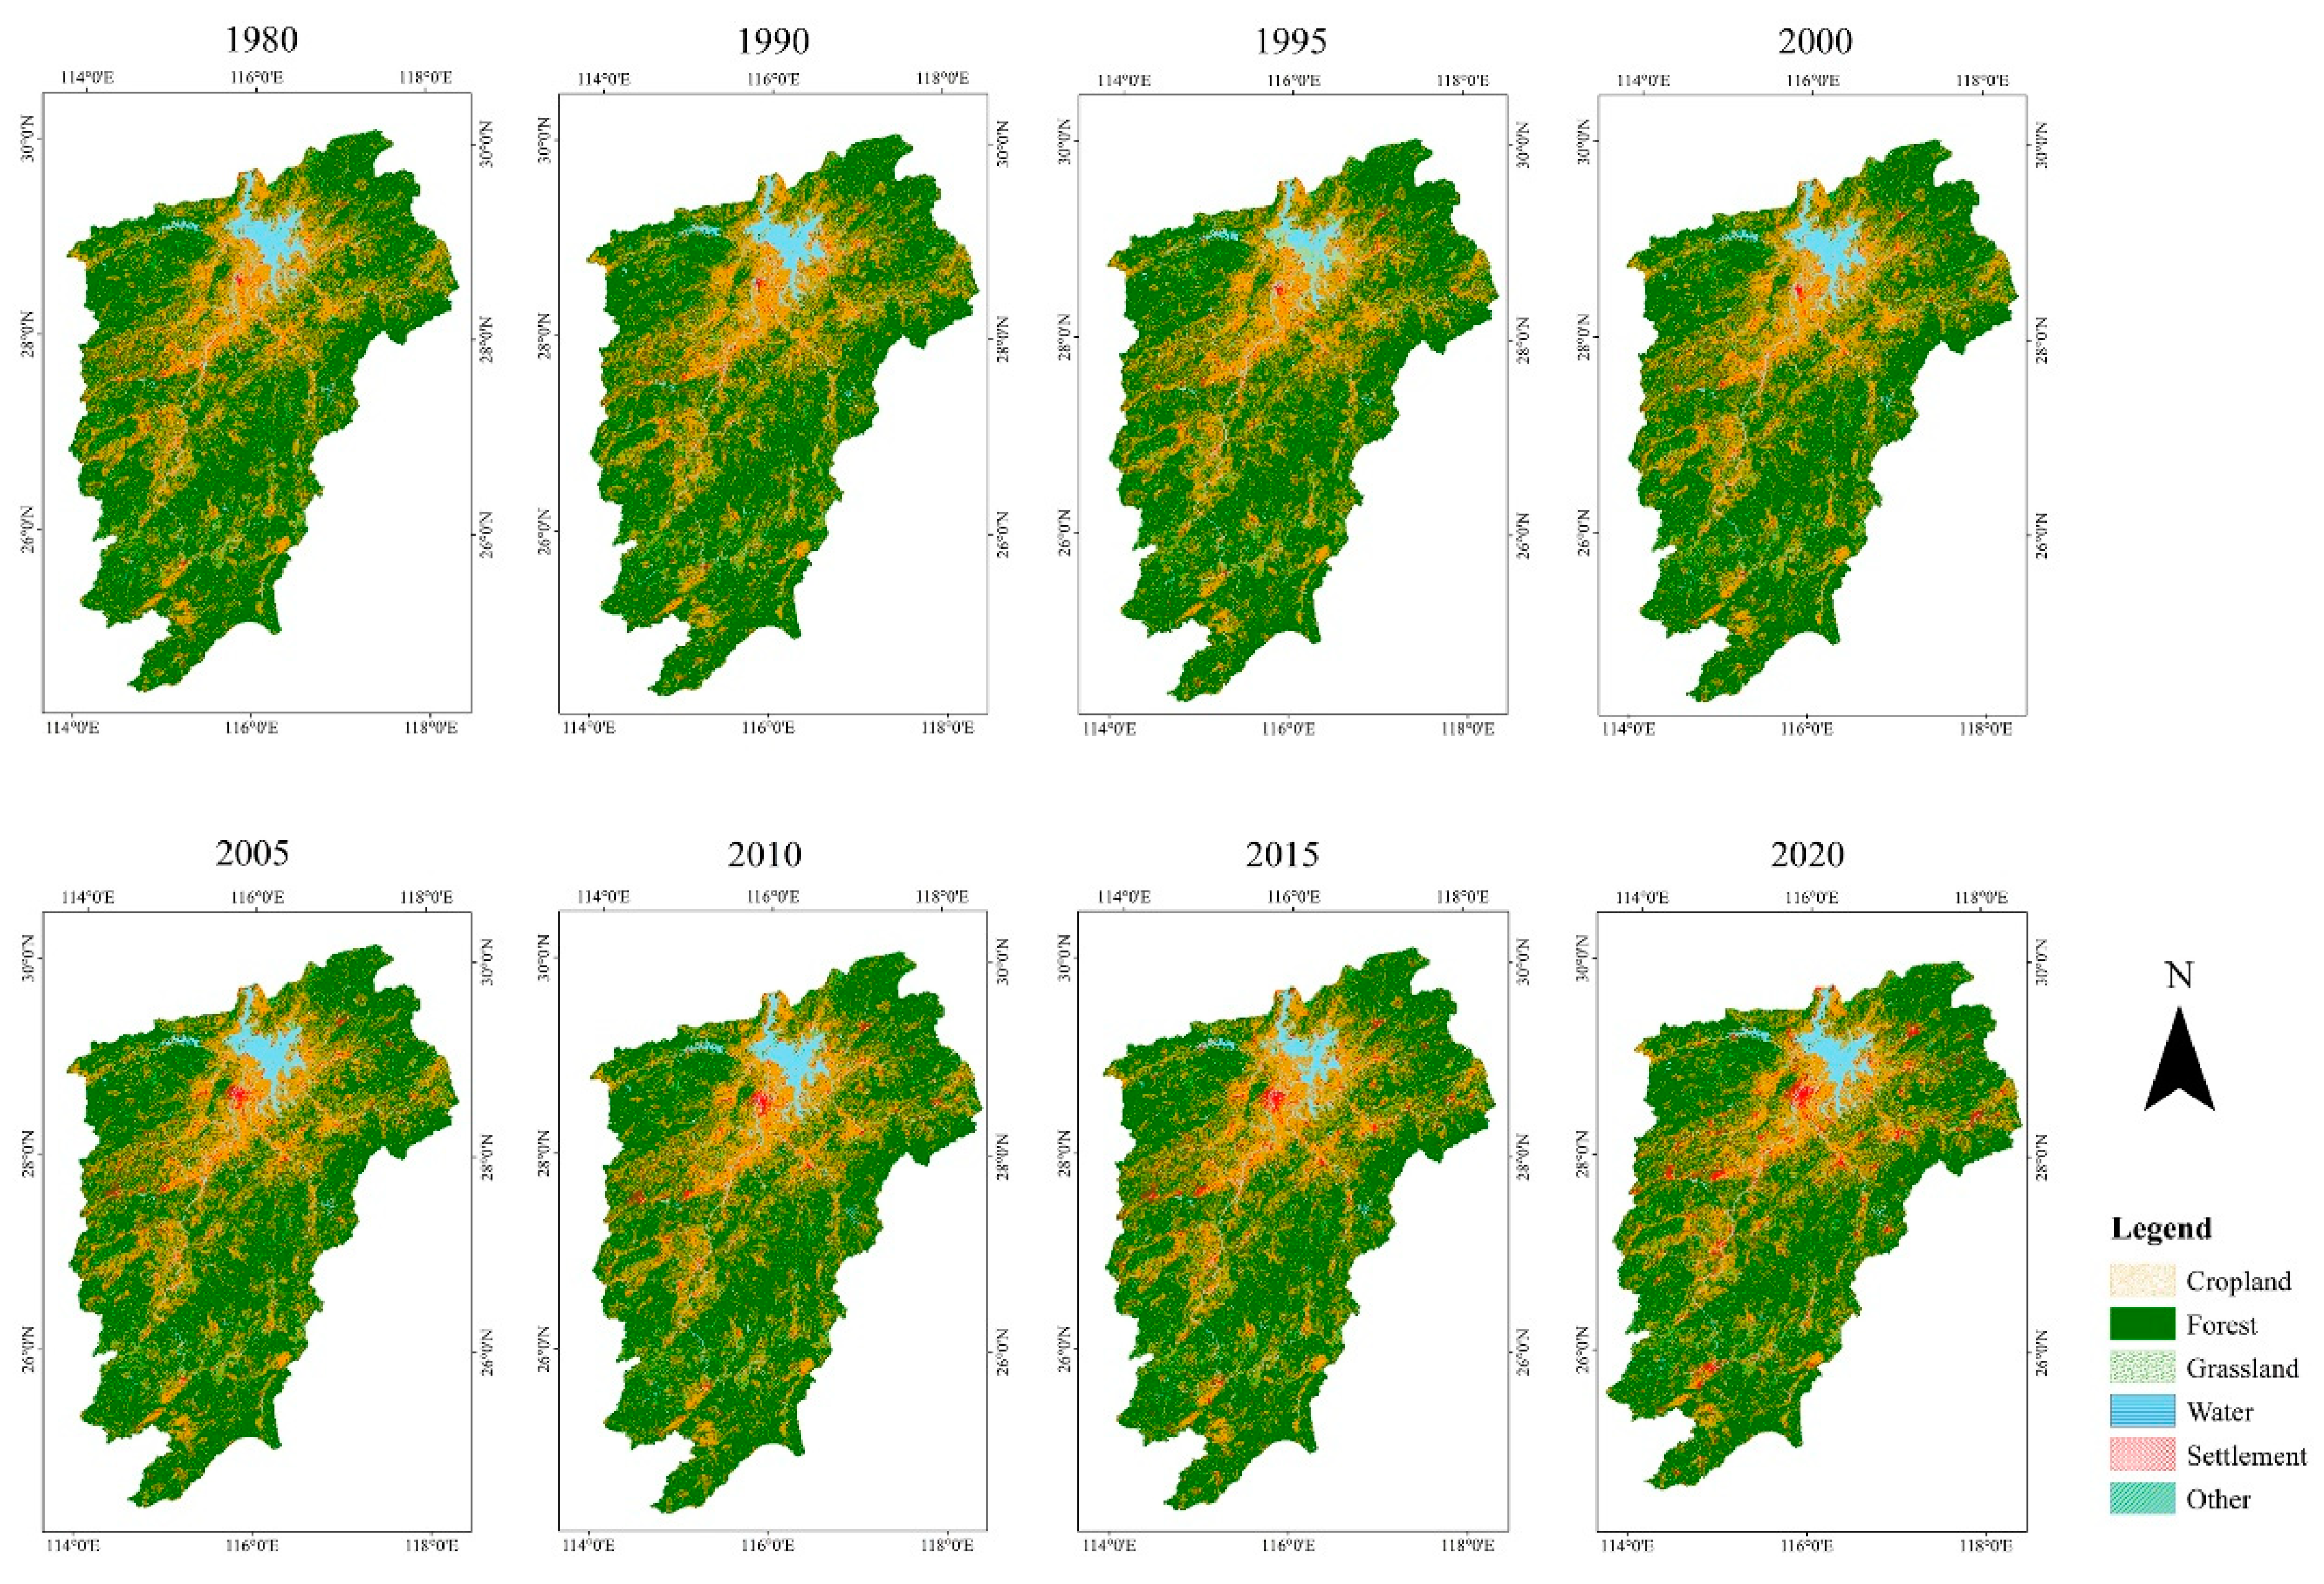
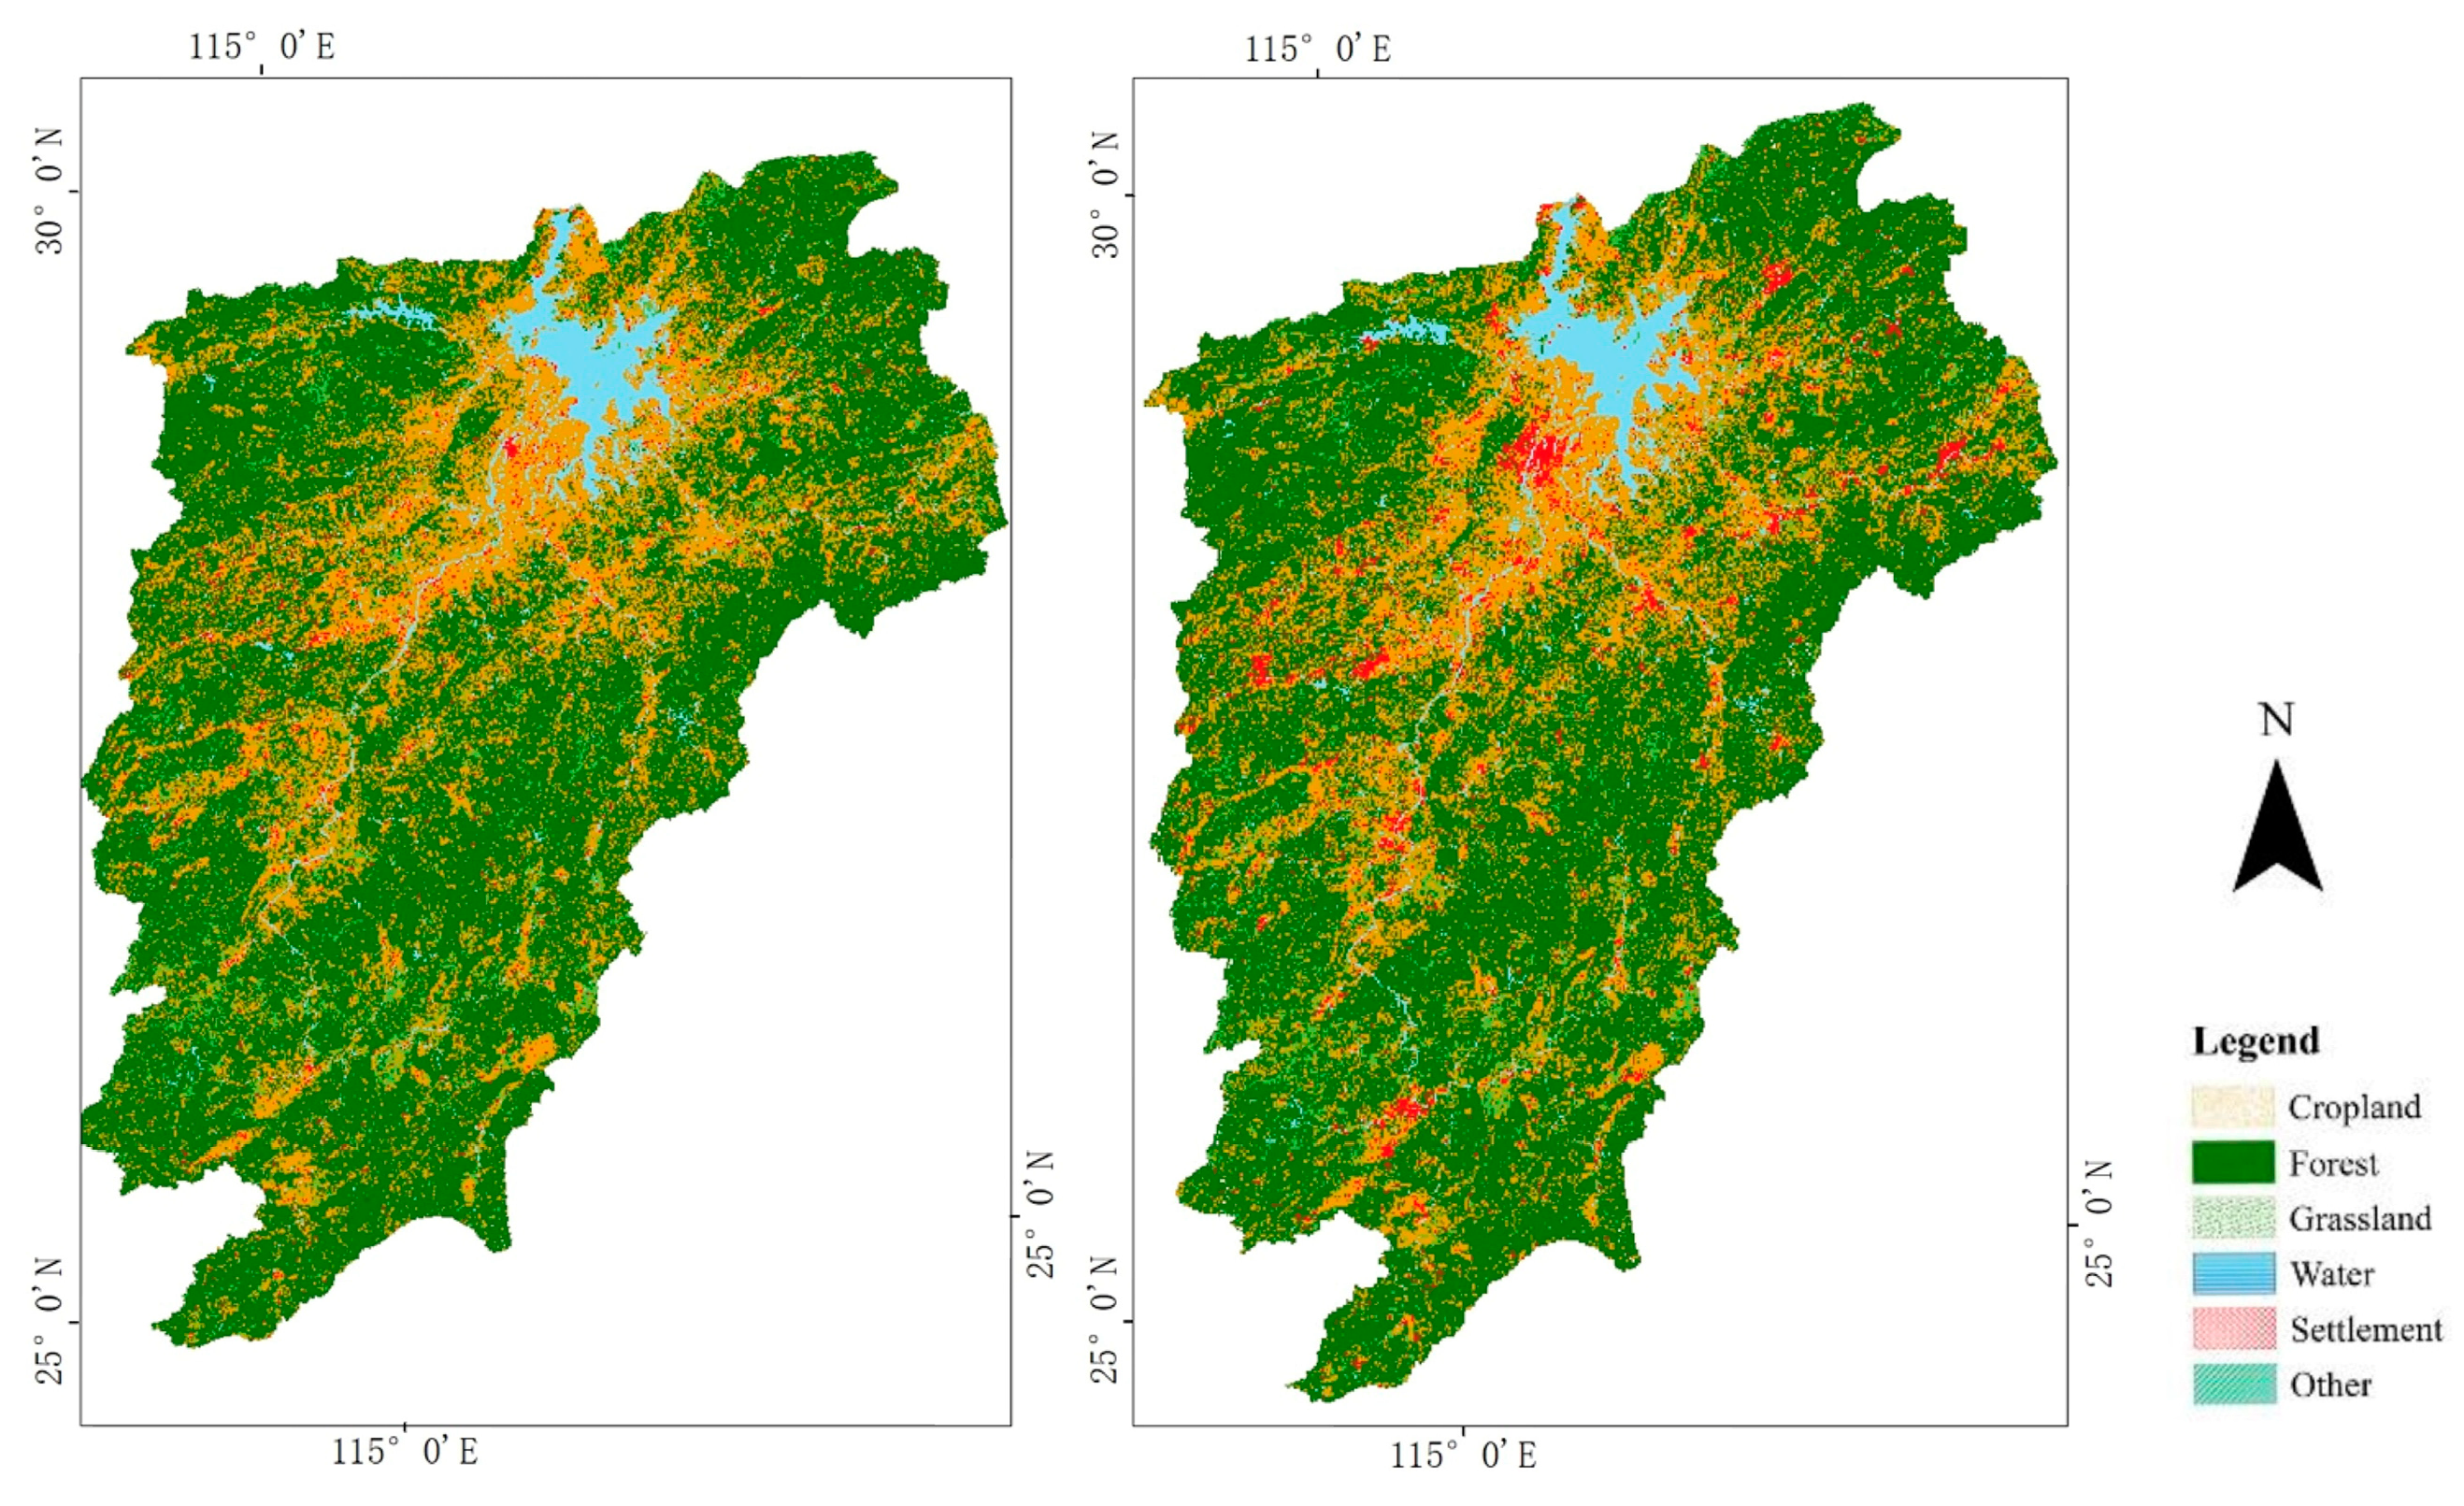
4.2.5. Land Use Changes in the Poyang Lake

The transfer matrix was used to calculate the transfer amount of different land features from 1980–2020 and showed clear changes in the different regions. Primarily, we determined that changes in land features in Poyang Lake mainly occurred after 2000, while the amount of land surface conversion in the early stage was not noticeable. “Swap change” means a transformation of land use from its original state to other features. After 2000, the most significant land use changes included an increase in the area of croplands and water, a decrease in the area of forest and grasslands, and a 1.53% expansion in the settlement area (Table 2).
Figure 10 and Figure 11 show a comparison of the images, indicating that the urban area expanded significantly after 2000. In addition, the transfer matrix analysis verified an apparent conversion relationship between settlement and cropland, and a substantial conversion relationship between the “water” and “other” land use categories was also observed (Table 3). Moreover, compared with the 1980s image, the “other” land use category in the Ganjiang river estuary was replaced by “cropland”, and “settlement” was replaced with “cropland” in the year 2020. The significant increase in the “settlement” and “cropland” categories indicates an increase in former water area utilization in the basin.

5. Discussion

Poyang Lake is a classical river-connected drain lake characterized by complex hydrological relationships. Due to its connection with the Yangtze River, changes in the Yangtze River runoff impact the water exchange in the lake estuary, leading to different influence mechanisms of lake area change in the Poyang Lake [20].

5.1. Influence Mechanism of Lake Water Area Change in Flood Season

The prophase analysis revealed a significant correlation between lake area and flow in the flood season. Numerous studies have also confirmed that during the flood season, the Poyang Lake water area is affected by runoff from the five major rivers in the Poyang Basin as well as the Yangtze River. This runoff is exchanged and interplayed at the lake estuary [10,21,23]. The interaction between the Yangtze River and Poyang Lake can be divided into three stages:
  • The Poyang Lake basin’s dominant inflow period is from December–March, whereby runoff into the Poyang Lake basin increases and the lake water level rises.
  • The river–lake interaction period is from April–August when the mainstream of the Yangtze River begins to rise and the water level in Poyang Lake is also high. The high water level of the Yangtze River causes a blocking effect on the outflows from the Poyang Basin. Runoff from the Poyang Basin cannot flow out, resulting in flood stagnation in the lake and water area expansion.
  • The Yangtze River runoff dominant period is from September–November, wherein, influenced by the upstream Yangtze River, runoff from the Yangtze River increases and the water level rises. The runoff from the Yangtze River flows into the Poyang Lake through the estuary.
Poyang Lake maintains a high water area, even at the end of the flood season in the years 1983, 2020, and 2021 (Figure 12a). Combined with hydrological records, it was determined that the mainstream of the Yangtze River experienced flood events in September. In 2020, record floods occurred in the Yangtze River Basin, and this resulted in record-breaking water levels in Poyang Lake [36,37]. Figure 12b shows that the average water area in September in 2011 and 2019 was ~1255.40 km2; however, the hydrological records show that the lowest net outflow was recorded in 2018. Of note, serious drought events occurred simultaneously in the Poyang Lake basin and Yangtze River Basin. Drought events in the Poyang Lake basin result in a decrease in the flow of the five major rivers [11,38]. Moreover, droughts lead to a lowered water level in the Yangtze River, eliminating the block or reverse flow from the Yangtze River into Poyang Lake, thus reducing the water area. It should be noted that during the flood season, changes in the water area are closely related to changes in the river–lake interaction.

5.2. Influence Mechanism of Lake Water Area Change in Dry Season

In the dry season, pan evaporation and sediment load significantly correlated with the lake area. Furthermore, the PCA results show that evaporation is positive in the wet season and negative in the dry season. Comparing annual images of the region in the dry season indicates that changes in the water area are concentrated in the Ganjiang river estuary and Poyang Lake estuary (Figure 13). In 1991, 2004, 2006, 2010, 2013, 2017, 2019, and 2021, the water area at the estuary of the Ganjiang River decreased. In 1991, 2006, 2004, 2006, 2010, 2013, 2019, and 2021, the water area at the Poyang Lake estuary decreased and, consequently, the lakebed was visible. Overall, the dry season resulted in a significant decreasing trend in the sediment load of the five major areas during these years. From 1980–1990, the high sediment load of these rivers caused higher sedimentation in the river estuary, and this siltation phenomenon was primarily evident in the Ganjiang river estuary. However, several studies have indicated that the elevation of the lake estuary decreased significantly during this period and this decrease was related to the factors such as continuous sand mining and current scouring. Apart from lake currents, the wind is an important form of natural disturbance in driving sediment load; attributed to the geographical location, Poyang Lake experiences notable wind impacts [39,40,41].
The MK mutation test confirmed that the change point year was 2003. The average water area was 2300 km2 in the early dry season of the 1990s; however, after 2003, the average water area decreased to 1500 km2. Further, sediment load and temperature did not alter drastically during these periods. Meanwhile, some scholars found that after 2000 the changing stage of annual lake level variations is evident, and the average onset time of the lake dry season has advanced [42]. There is an obvious synchronization between area change and water level change during the dry season, some studies have confirmed the relationship between water level and area during the dry season [43]. Several researchers have suggested that the Three Gorges Dam (TGD) water impoundment in 2003 significantly exacerbated the water level and runoff decline from late September to November, weakening the Yangtze River’s blocking effect on outflows of the Poyang Lake through the estuary [44,45,46]. Changes in the Yangtze River runoff impact the interrelationship between the Yangtze River and Poyang Lake, disturbing the hydrological processes in the lake.
Given the above discussion, an apparent linkage between the sediment load of the five major rivers and the change in the water area during the dry season is evident. In addition, it is likely that the TGD water impoundment affected the river–lake interaction, eventually leading to the premature flow of water from the Poyang Lake into the Yangtze River. This would have resulted in decreases in the lake area at the end of the flood season, with changes in the lakebed topography also causing the water to flow more rapidly into the Yangtze River.

5.3. Implications for Water Management in the Poyang Lake

The rhythmic variation of Poyang Lake waters is the natural fluctuation of hydrology, and it affects the quality and quantity of biological habitats in the Poyang Lake basin. Some studies show that the wetland produced by Poyang Lake during the flood to dry period is an important habitat for millions of overwintering waterfowl species. The early reduction in water area during the dry season has severely affected the main food source and habitat conditions for migratory birds [47]. Therefore, it is ecologically important to maintain the hydrological rhythm of Poyang Lake stably. Although building a dam at the mouth of the lake can directly regulate the water volume of Poyang Lake and change the water area of the lake, it will break the free interaction between the lake and Yangtze River, affect the connectivity between the habitats in the basin, and intensify the habitat loss and fragmentation. This is highly not recommended. Influenced by the river–lake connection, the changes of Poyang Lake are easily affected by the runoff of the Yangtze River main stream, and the previous study has confirmed that the Three Gorges storage project of the Yangtze River main stream has influenced the natural fluctuation of hydrology in Poyang Lake. Therefore, water resources management can take advantage of the connected relationship between rivers and lakes to maintain the hydrological rhythm of Poyang Lake by artificially managing the water level of the Yangtze River. Some scholars recommended that the minimum water level should be maintained above 12 m in the low-water period to ensure that minimum connectivity is obtained. The water level should be above 16 m and kept stable in the peak migration period (July–November), to ensure the quality of the migratory habitat [48].

6. Conclusions

Based on a comparative analysis of the water area of Poyang Lake in the past 42 years, the following conclusions can be drawn:
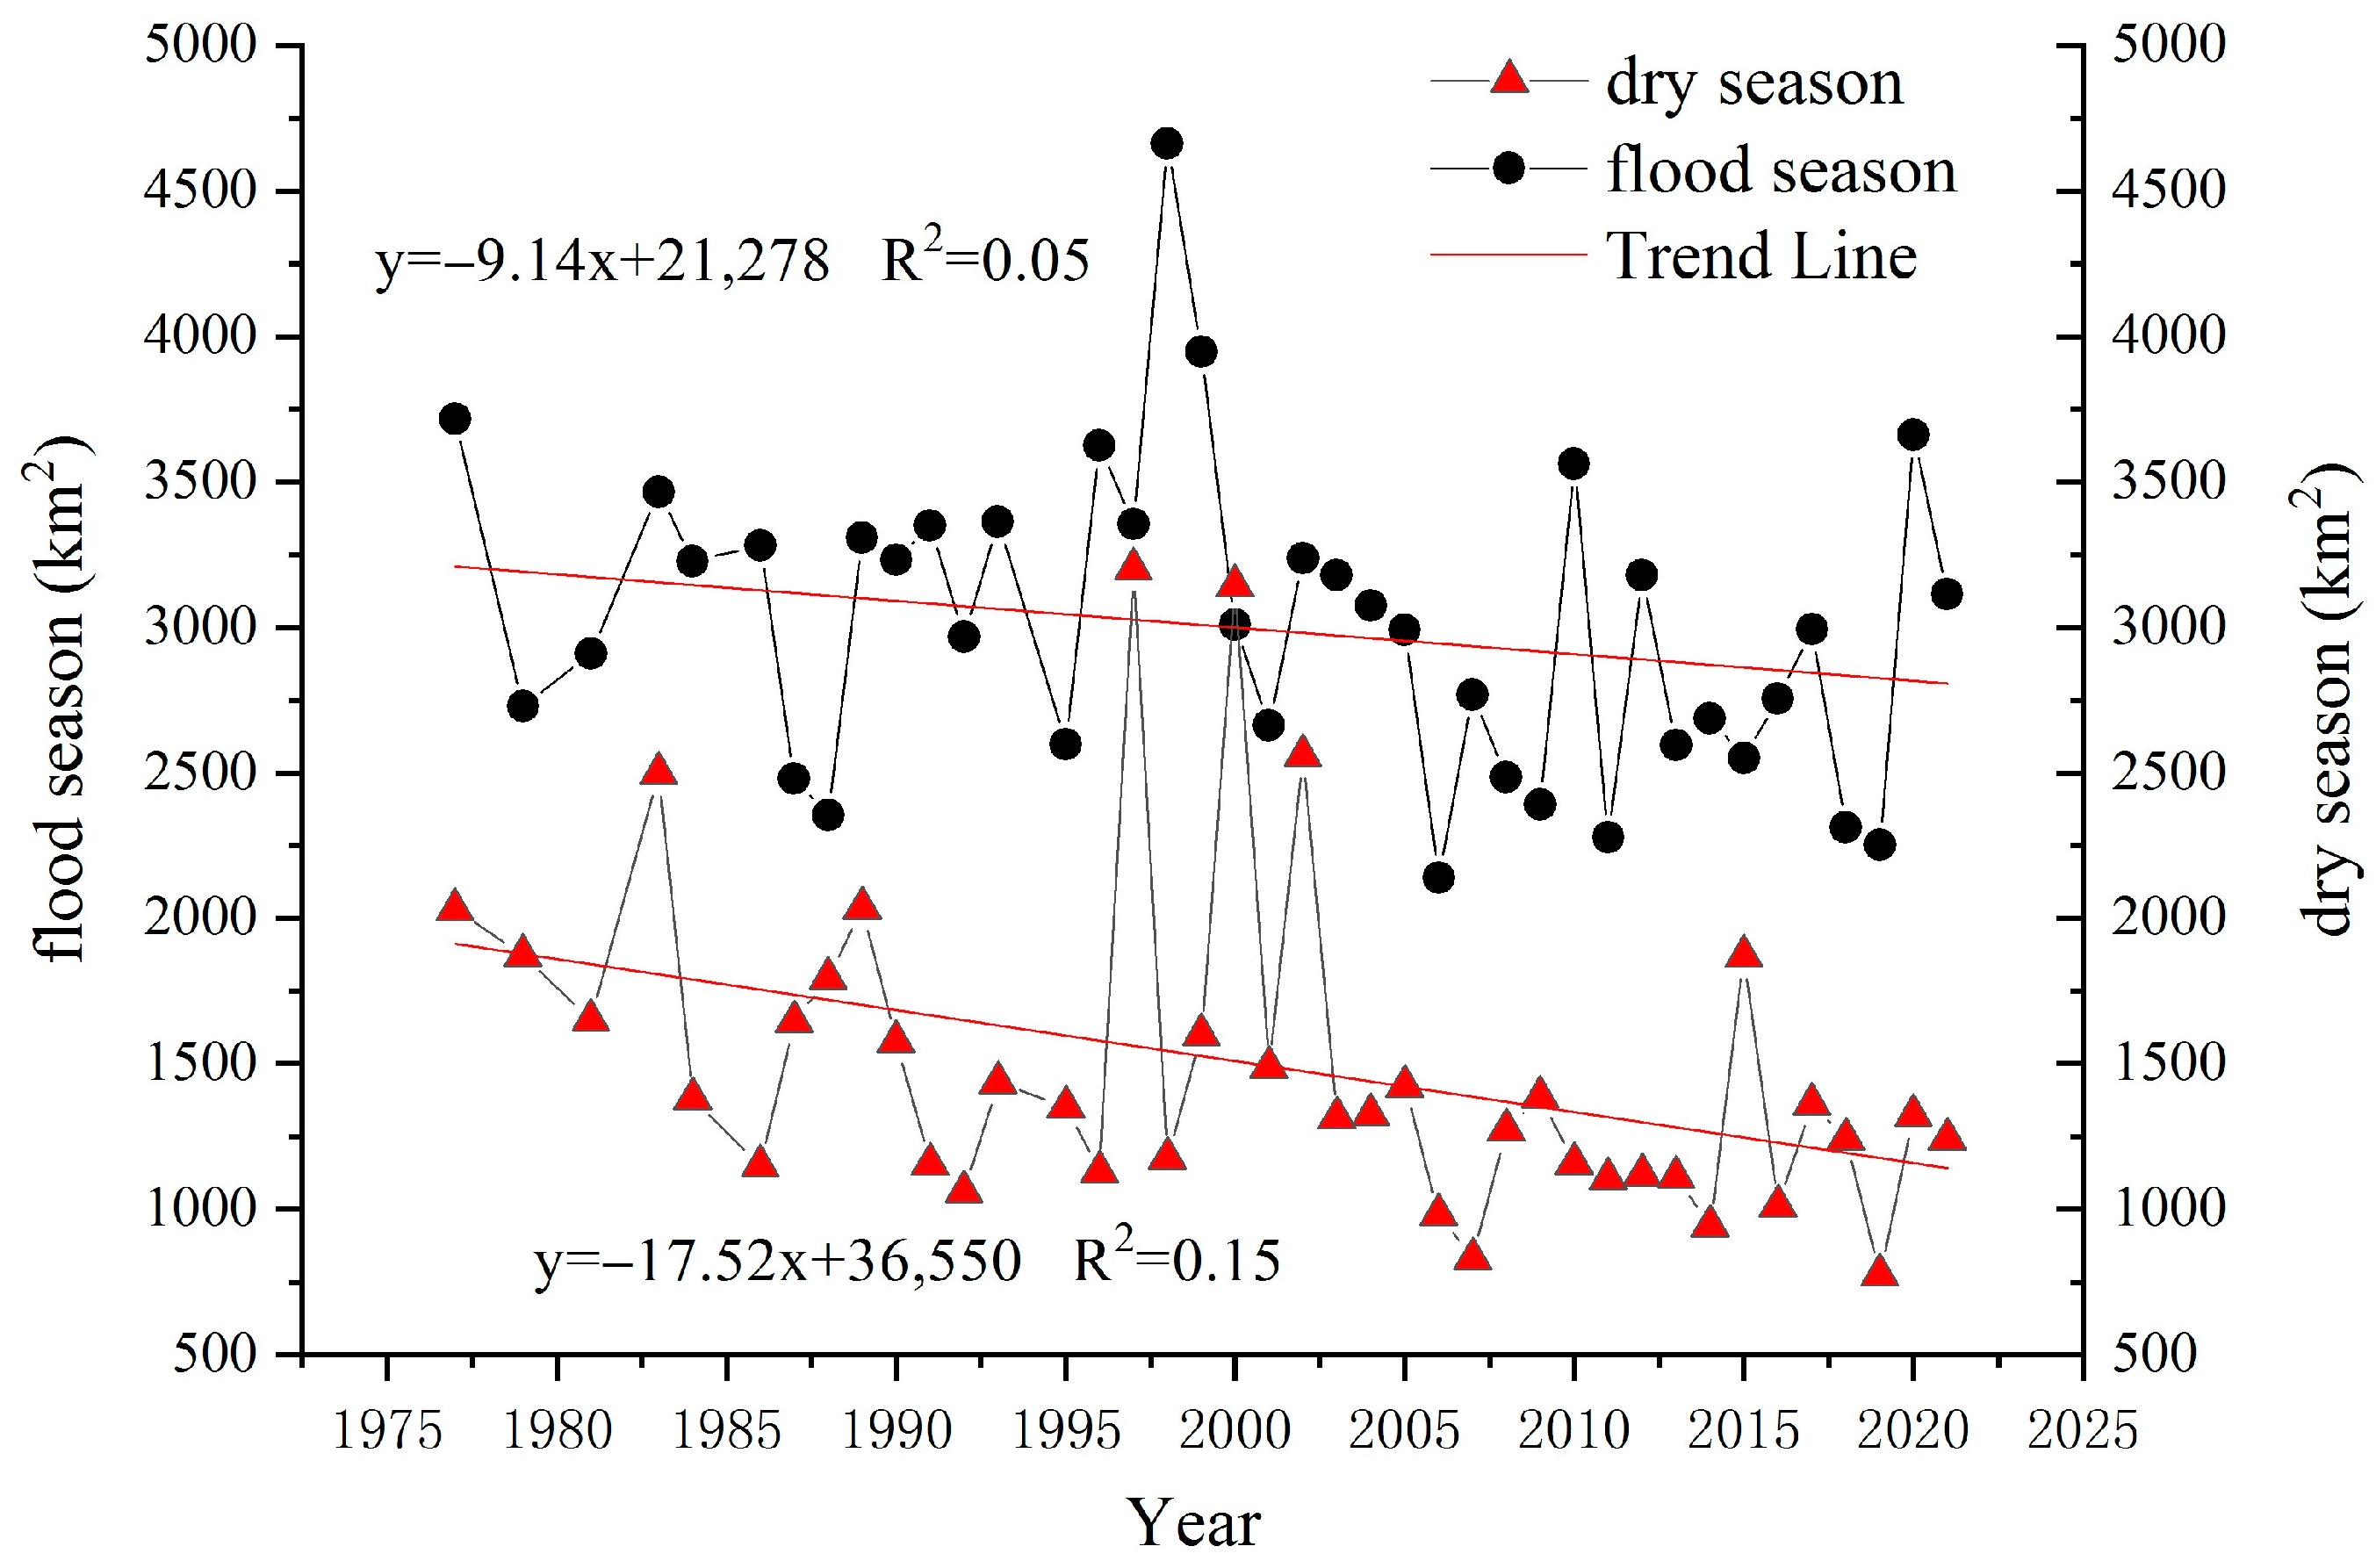
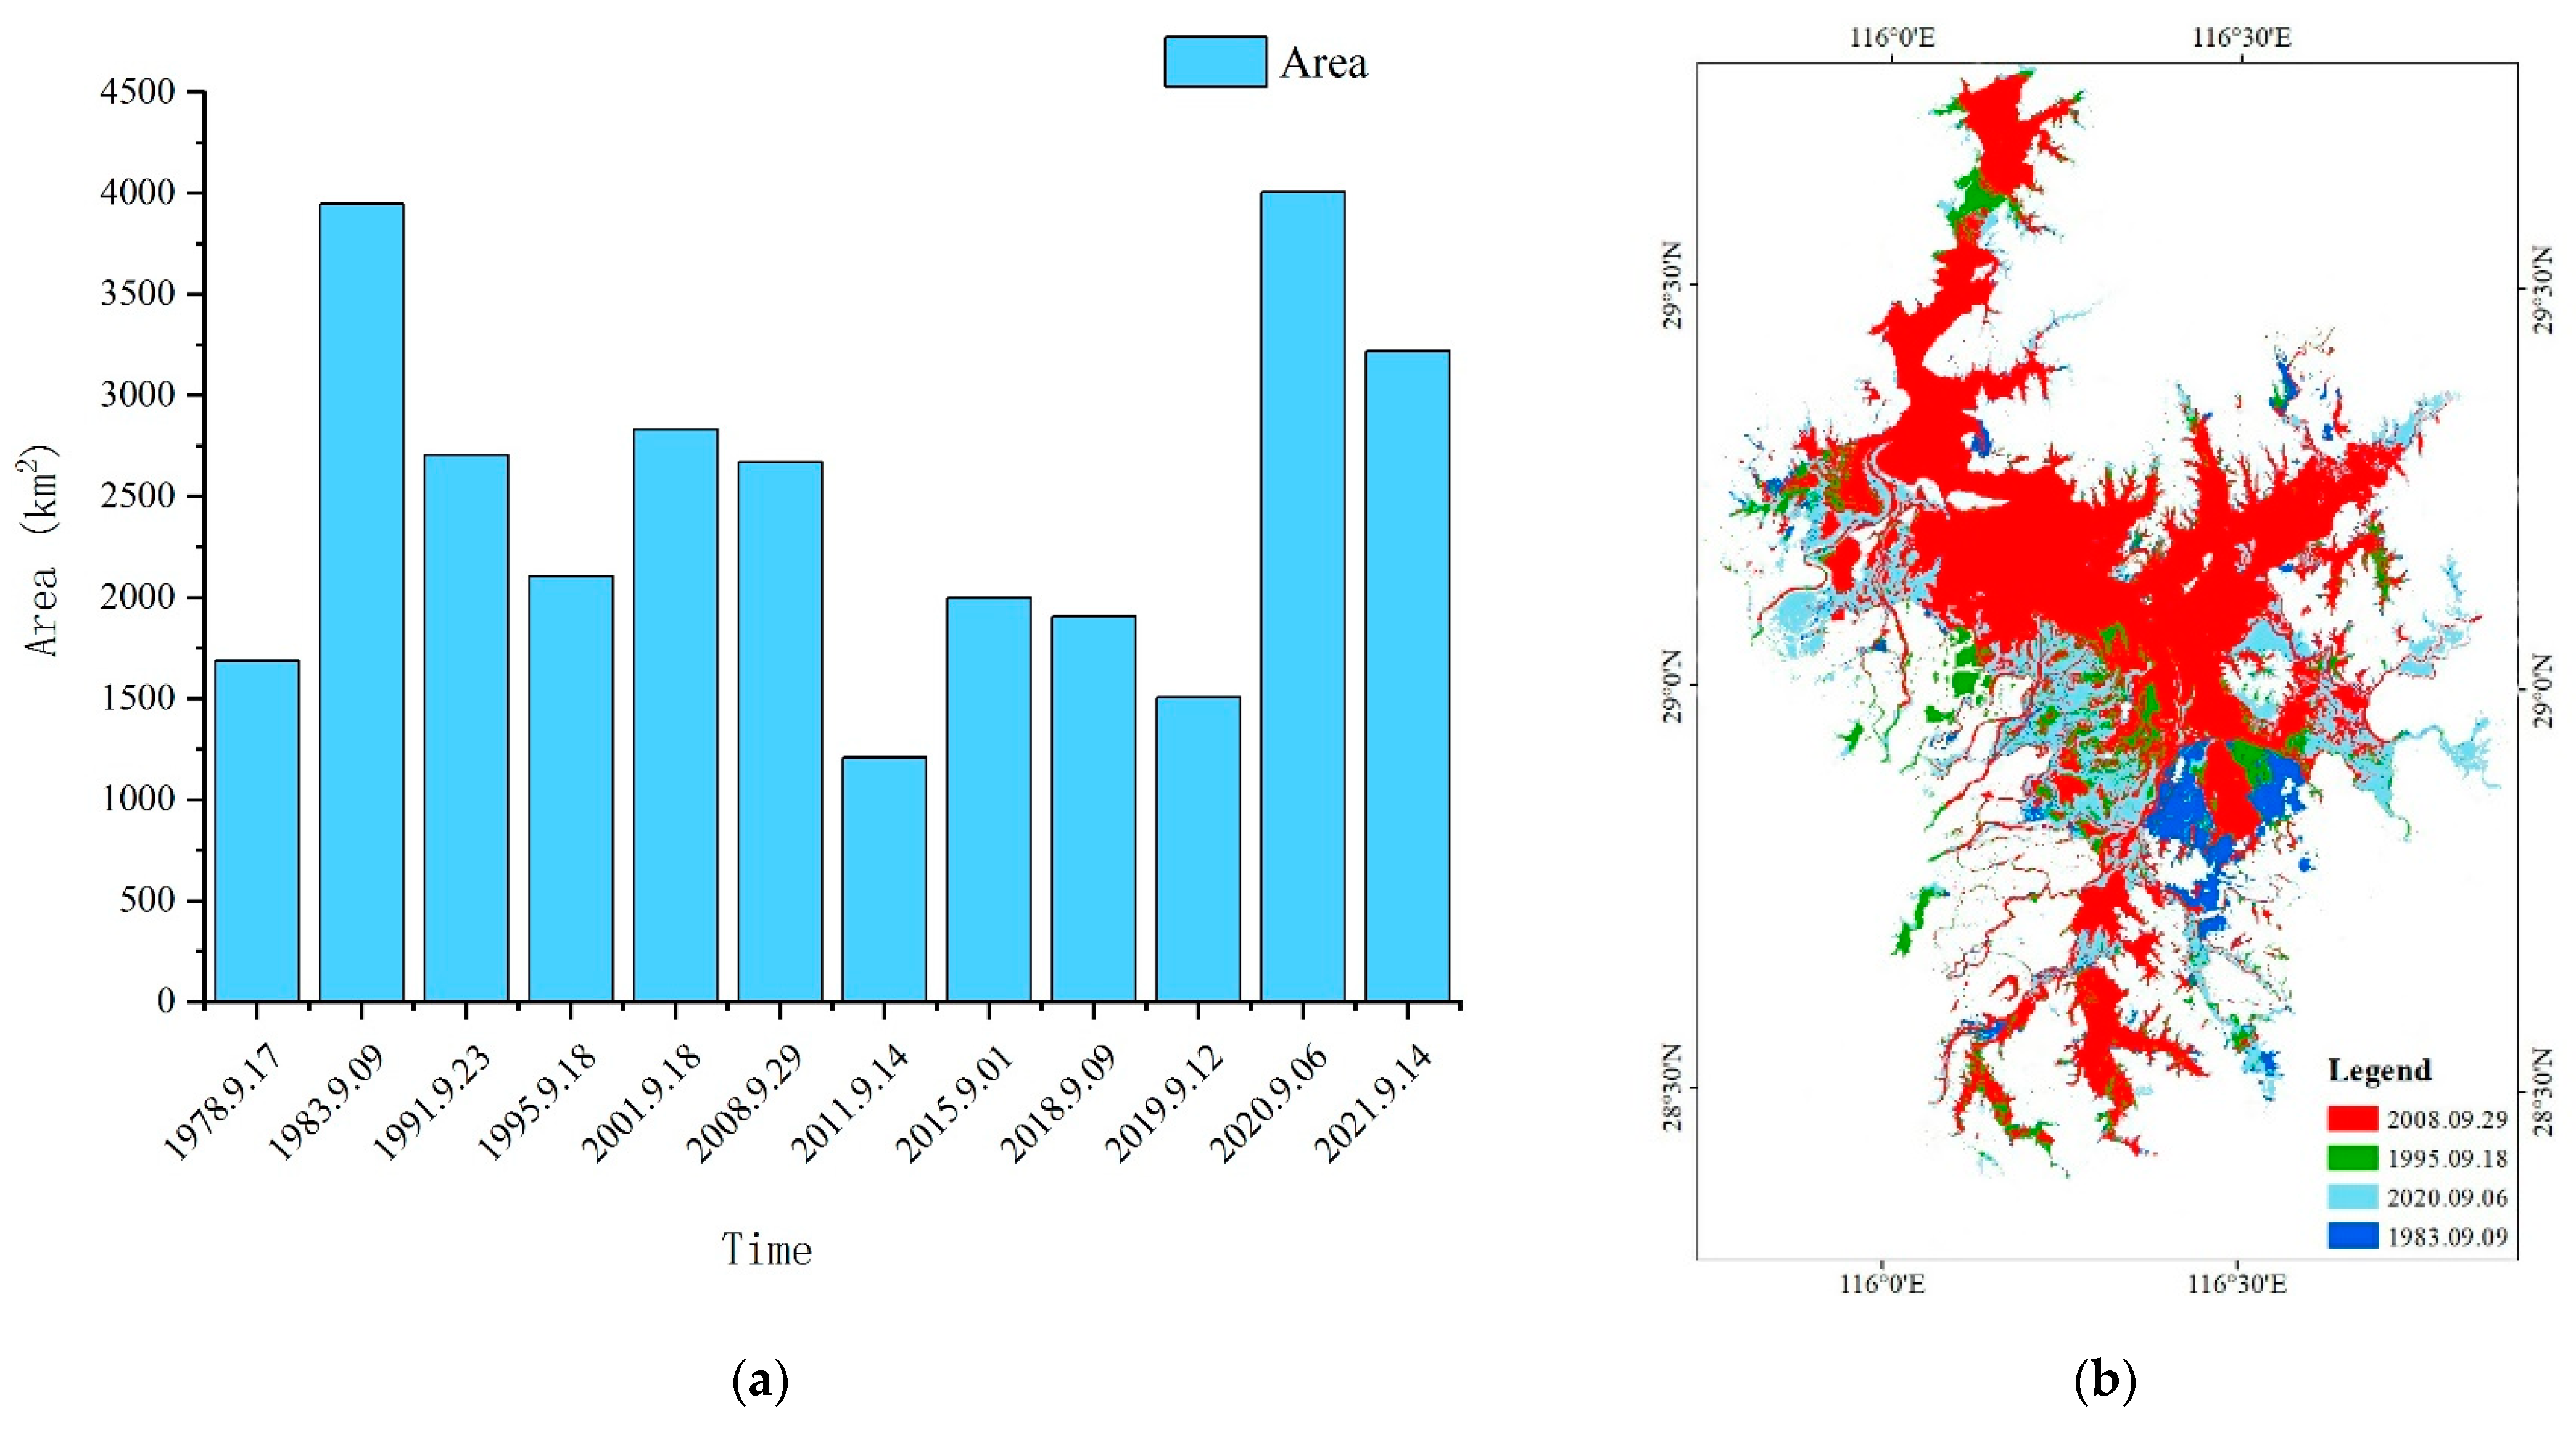
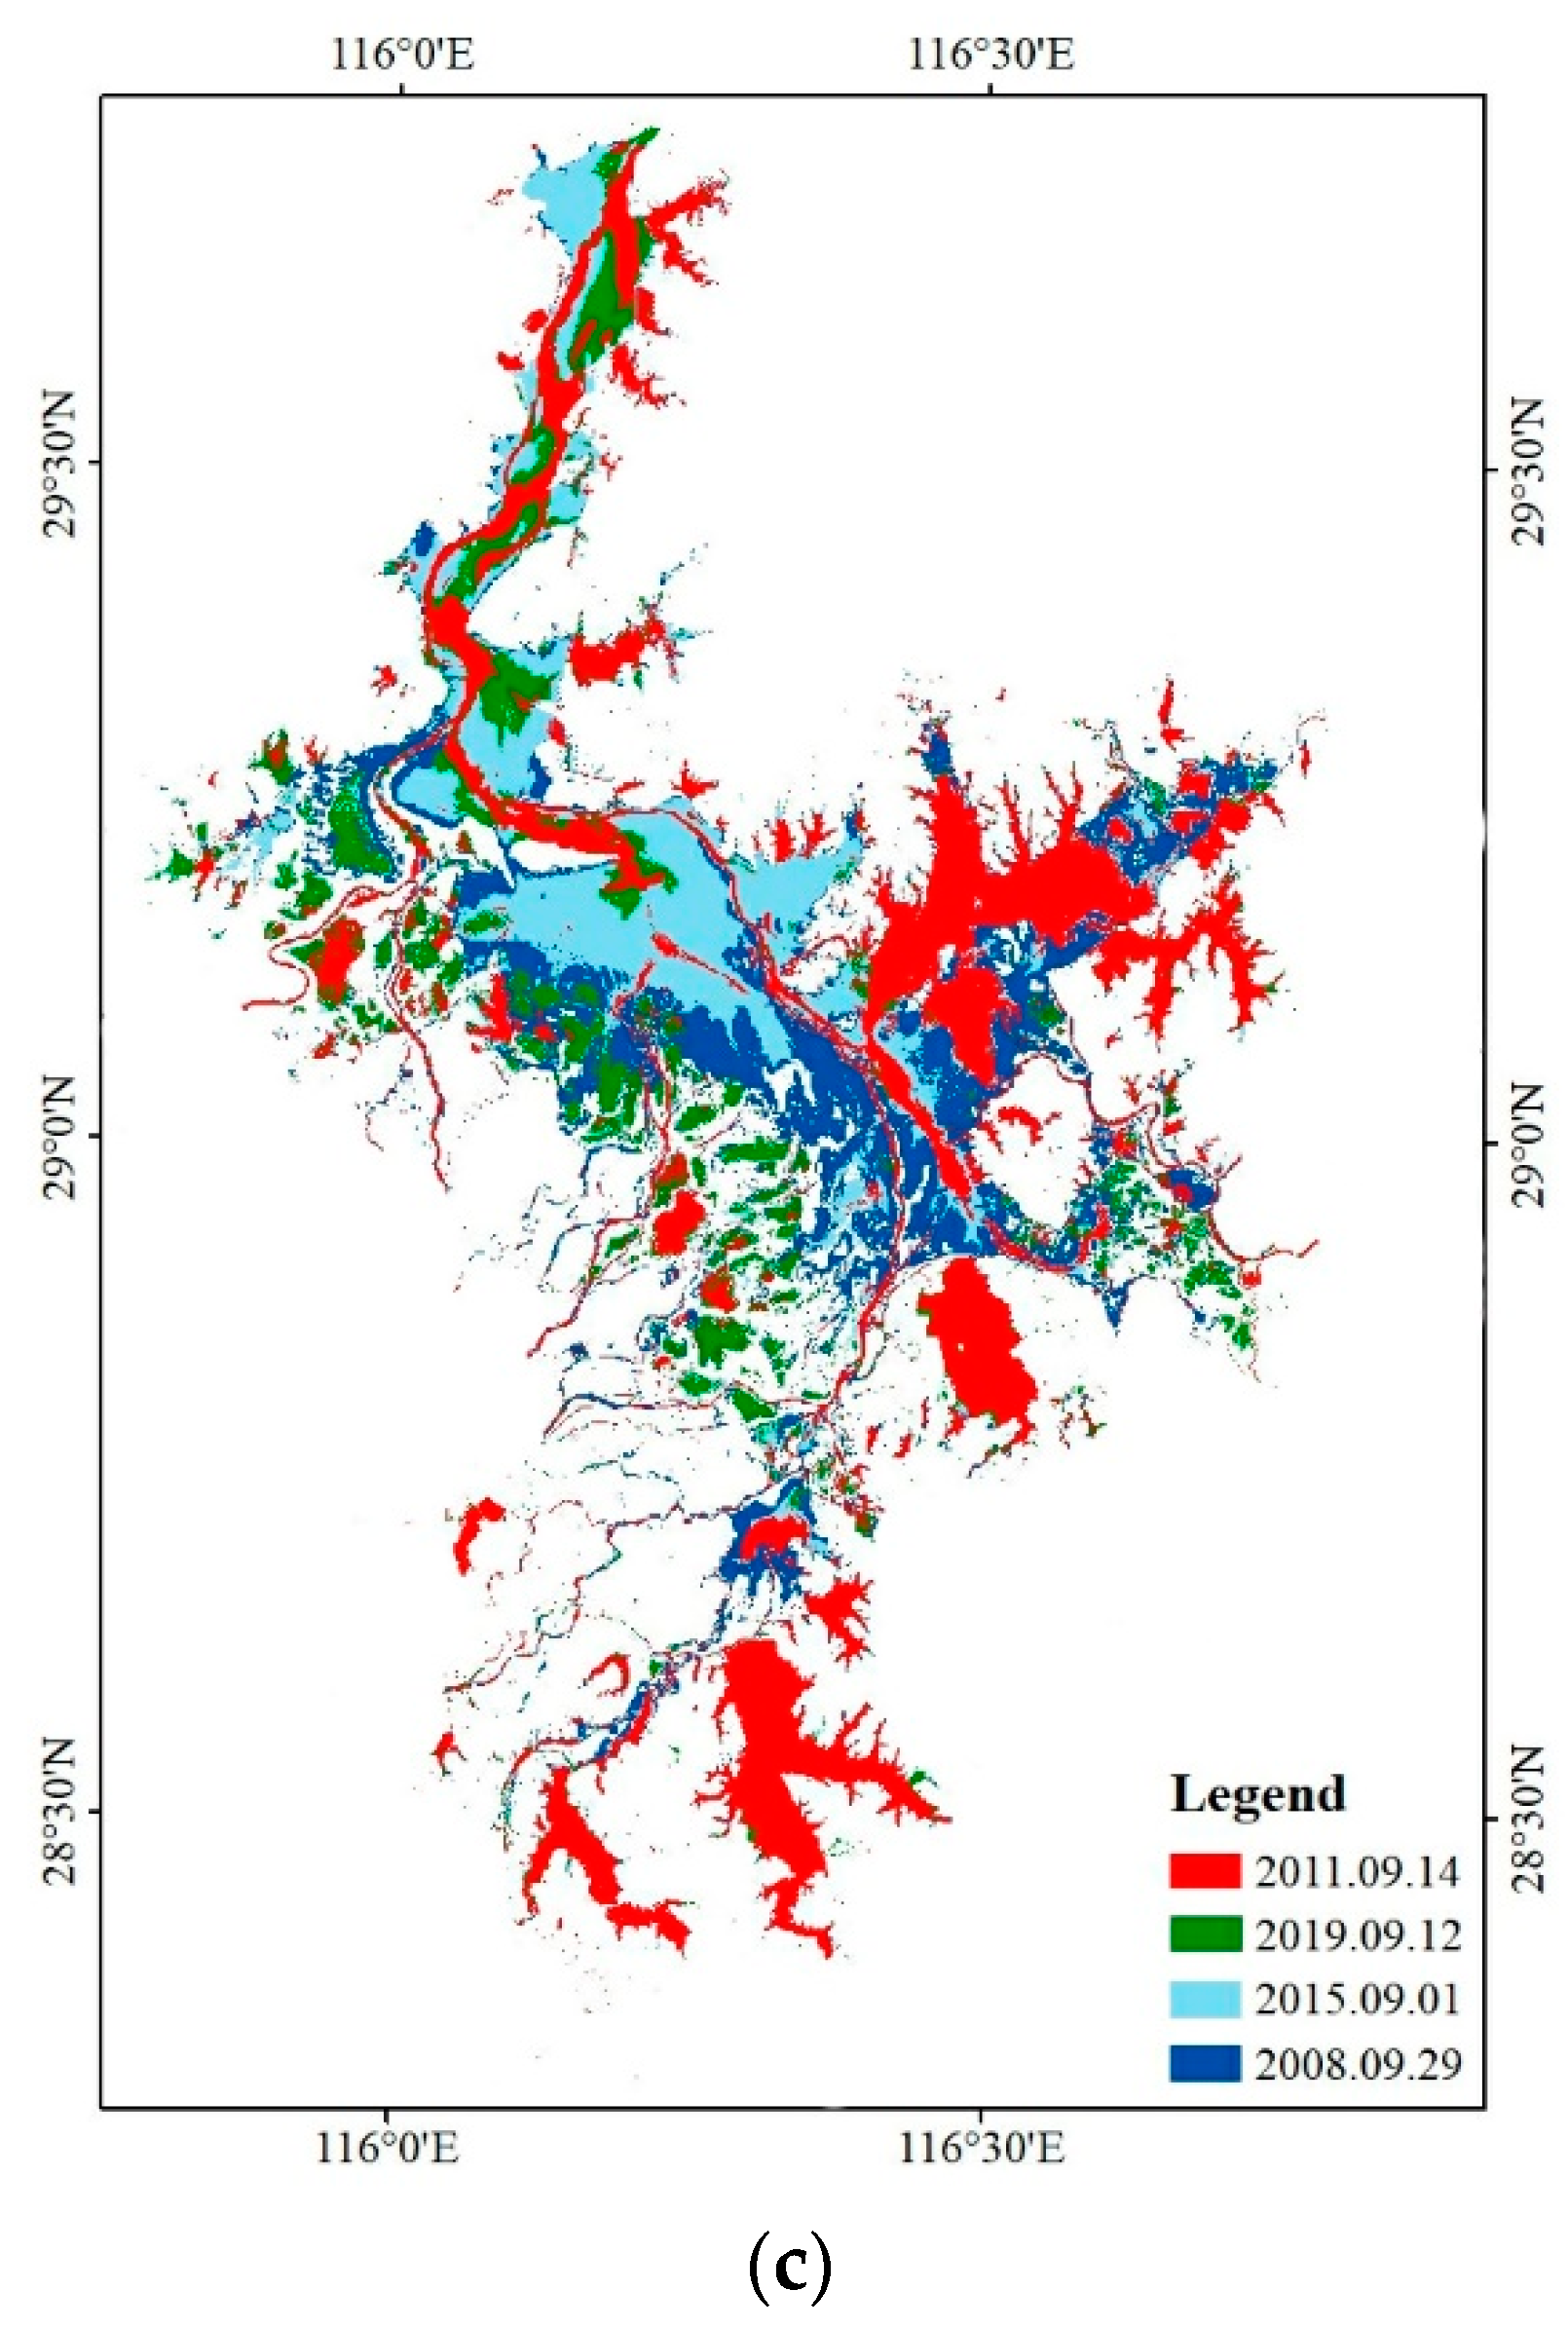
  • During the flood seasons of the study period, the lake water area showed a significant decreasing trend, with an average annual size decrease of −9.14 km2. In the dry season, the lake water area showed a significant downward trend, measuring a decrease rate of −17.52 km2/a. In addition, it was determined that the change point years of the flood season and dry season water areas were 2005 and 2003, respectively.
  • Lake runoff, sediment load, and precipitation significantly correlate with the flood season water area. In the dry season, the sediment load significantly correlates with the water area.
  • The analysis of satellite imagery confirmed a direct correlation between the change in the water area and the change in the net outflow of the lake in the flood season, and the net outflow is affected by the river–lake interactions. The Poyang Lake is a classical river-connected drain lake. Flood or drought events in the mainstream of the Yangtze River will affect the blocking or reversing of the Yangtze River on the Poyang Lake estuary, impacting the net outflow of the lake and altering the water area.
  • In the dry season, the sediment load deposition at the elevation of the estuarine entrance lakebed was raised, especially at the Ganjiang river estuary, affecting the water’s body shape. However, after 2000, the TGD water impoundment operation on the upper Yangtze River affected the runoff of the lower reaches of the Yangtze River at the end of the flood season. This impacted the river–lake interaction and decreased the area of Poyang Lake.
Overall, the results indicate that the variation in the Poyang Lake water area is affected by the runoff of the Poyang Lake basin as well as the runoff from the Yangtze River and the sediment load in the Poyang Lake basin. Although our findings contributed significantly to our knowledge of the hydrological dynamics of the Poyang Basin, the effects of groundwater were not considered here, which can be accounted for as a limitation of this study. Therefore, water resource utilization in the Poyang Lake basin needs to consider the changes in the lake basin and the runoff outside the basin in future studies.

Author Contributions

B.T. performed the data analyses and wrote the manuscript; P.G. helped perform the analysis with constructive discussions; X.M. contributed to the conception of the study; G.Z. provided reference for research methods. All authors have read and agreed to the published version of the manuscript.

Funding

This research was funded by The National Natural Science Foundation of China, (U2243211).

Data Availability Statement

The data that support the findings of this study are available in the United States Geological Survey at [https://earthexplorer.usgs.gov/ (accessed on 20 February 2022)].

Conflicts of Interest

It should be understood that none of the authors have any financial or scientific conflict of interest with regard to the research described in this manuscript.

References

  1. Zhang, Q.; Liu, Y.; Yao, J.; Lai, X.; Li, X.; Wu, G.; Huang, Q.; Sun, Z.; Li, Y.; Tan, Z.; et al. Lake Hydrology in China: Advances and Prospects. J. Lake Sci. 2020, 32, 1360–1379. [Google Scholar] [CrossRef]
  2. Vaheddoost, B.; Aksoy, H. Interaction of Groundwater with Lake Urmia in Iran. Hydrol. Process. 2018, 32, 3283–3295. [Google Scholar] [CrossRef]
  3. Rosenberry, D.O.; Lewandowski, J.; Meinikmann, K.; Nützmann, G. Groundwater–the Disregarded Component in Lake Water and Nutrient Budgets. Part 1: Effects of Groundwater on Hydrology. Hydrol. Process. 2015, 29, 2895–2921. [Google Scholar] [CrossRef]
  4. Lima-Quispe, N.; Escobar, M.; Wickel, A.J.; von Kaenel, M.; Purkey, D. Untangling the Effects of Climate Variability and Irrigation Management on Water Levels in Lakes Titicaca and Poopó. J. Hydrol. Reg. Stud. 2021, 37, 100927. [Google Scholar] [CrossRef]
  5. Huang, A.; Liu, X.; Peng, W.; Dong, F.; Ma, B.; Li, J.; Wang, W. Spatiotemporal Characteristics, Influencing Factors and Evolution Laws of Water Exchange Capacity of Poyang Lake. J. Hydrol. 2022, 609, 127717. [Google Scholar] [CrossRef]
  6. Zhang, G.; Yao, T.; Xie, H.; Yang, K.; Zhu, L.; Shum, C.K.; Bolch, T.; Yi, S.; Allen, S.; Jiang, L.; et al. Response of Tibetan Plateau Lakes to Climate Change: Trends, Patterns, and Mechanisms. Earth-Sci. Rev. 2020, 208, 103269. [Google Scholar] [CrossRef]
  7. Zhang, Y.; Xie, C.; Wu, T.; Zhao, L.; Pang, Q.; Wu, J.; Yang, G.; Wang, W.; Zhu, X.; Wu, X.; et al. Permafrost Degradation Is Accelerating beneath the Bottom of Yanhu Lake in the Hoh Xil, Qinghai-Tibet Plateau. Sci. Total Environ. 2022, 838, 156045. [Google Scholar] [CrossRef]
  8. Woolway, R.I.; Verburg, P.; Merchant, C.J.; Lenters, J.D.; Hamilton, D.P.; Brookes, J.; Kelly, S.; Hook, S.; Laas, A.; Pierson, D.; et al. Latitude and Lake Size Are Important Predictors of Over-Lake Atmospheric Stability. Geophys. Res. Lett. 2017, 44, 8875–8883. [Google Scholar] [CrossRef] [Green Version]
  9. Li, H.; Luo, Z.; Xu, Y.; Zhu, S.; Chen, X.; Geng, X.; Xiao, L.; Wan, W.; Cui, Y. A Remote Sensing-Based Area Dataset for Approximately 40 Years That Reveals the Hydrological Asynchrony of Lake Chad Based on Google Earth Engine. J. Hydrol. 2021, 603, 126934. [Google Scholar] [CrossRef]
  10. Hu, Q.; Feng, S.; Guo, H.; Chen, G.; Jiang, T. Interactions of the Yangtze River Flow and Hydrologic Processes of the Poyang Lake, China. J. Hydrol. 2007, 347, 90–100. [Google Scholar] [CrossRef]
  11. Wang, R.; Li, X.; Xue, C.; Zhang, D. Spatio-temporal variations of the drought-flood abrupt alternation events in the Lake Poyang Basin from 1960 to 2012. J. Lake Sci. 2020, 32, 207–222. [Google Scholar] [CrossRef] [Green Version]
  12. Liu, W.; Zhu, S.; Huang, Y.; Wan, Y.; Wu, B.; Liu, L. Spatiotemporal Variations of Drought and Their Teleconnections with Large-Scale Climate Indices over the Poyang Lake Basin, China. Sustainability 2020, 12, 3526. [Google Scholar] [CrossRef]
  13. Lai, X.; Jiang, J.; Yang, G.; Lu, X.X. Should the Three Gorges Dam Be Blamed for the Extremely Low Water Levels in the Middle-Lower Yangtze River? Hydrol. Process. 2014, 28, 150–160. [Google Scholar] [CrossRef]
  14. Zhang, Q.; Ye, X.; Werner, A.D.; Li, Y.; Yao, J.; Li, X.; Xu, C. An Investigation of Enhanced Recessions in Poyang Lake: Comparison of Yangtze River and Local Catchment Impacts. J. Hydrol. 2014, 517, 425–434. [Google Scholar] [CrossRef] [Green Version]
  15. Yao, J.; Gao, J.; Yu, X.; Zhang, Q. Impacts of a Proposed Water Control Project on the Inundation Regime in China’s Largest Freshwater Lake (Poyang Lake): Quantification and Ecological Implications. J. Hydrol. Reg. Stud. 2022, 40, 101024. [Google Scholar] [CrossRef]
  16. Meng, J.-N.; Fang, H.; Huang, L.; He, G.; Liu, X.; Xu, C.; Wu, X.; Scavia, D. Multidimensional Ecosystem Assessment of Poyang Lake under Anthropogenic Influences. Ecol. Model. 2022, 473, 110134. [Google Scholar] [CrossRef]
  17. Lei, X.; Gao, L.; Wei, J.; Ma, M.; Xu, L.; Fan, H.; Li, X.; Gao, J.; Dang, H.; Chen, X.; et al. Contributions of Climate Change and Human Activities to Runoff Variations in the Poyang Lake Basin of China. Phys. Chem. Earth Parts A/B/C 2021, 123, 103019. [Google Scholar] [CrossRef]
  18. Sene, K.J. Effect of Variations in Net Basin Supply on Lake Levels and Outflows. Hydrol. Process. 1998, 12, 559–573. [Google Scholar] [CrossRef]
  19. Palmer, S.C.J.; Kutser, T.; Hunter, P.D. Remote Sensing of Inland Waters: Challenges, Progress and Future Directions. Remote Sens. Environ. 2015, 157, 1–8. [Google Scholar] [CrossRef] [Green Version]
  20. Arabi, B.; Salama, M.S.; Pitarch, J.; Verhoef, W. Integration of In-Situ and Multi-Sensor Satellite Observations for Long-Term Water Quality Monitoring in Coastal Areas. Remote Sens. Environ. 2020, 239, 111632. [Google Scholar] [CrossRef]
  21. Zan, Y.; Gao, Y.; Jiang, Y.; Pan, Y.; Li, X.; Su, P. The Effects of Lake Level and Area Changes of Poyang Lake on the Local Weather. Atmosphere 2022, 13, 1490. [Google Scholar] [CrossRef]
  22. Wang, Z. Variation of Lake-River-Aquifer Interactions Induced by Human Activity and Climatic Condition in Poyang Lake Basin, China. J. Hydrol. 2021, 595, 126058. [Google Scholar] [CrossRef]
  23. Li, Y.; Zhang, Q.; Werner, A.D.; Yao, J.; Ye, X. The Influence of River-to-Lake Backflow on the Hydrodynamics of a Large Floodplain Lake System (Poyang Lake, China): Influence of River Backflow on the Hydrodynamics of a Floodplain Lake. Hydrol. Process. 2017, 31, 117–132. [Google Scholar] [CrossRef]
  24. Min, Q.; Zhan, L. Characteristics of Low-Water Level Changes in Lake Poyang during 1952–2011. J. Lake Sci. 2012, 24, 675–678. [Google Scholar] [CrossRef] [Green Version]
  25. Liu, H.; Zheng, L.; Jiang, L.; Liao, M. Forty-Year Water Body Changes in Poyang Lake and the Ecological Impacts Based on Landsat and HJ-1 A/B Observations. J. Hydrol. 2020, 589, 125161. [Google Scholar] [CrossRef]
  26. Zhang, D.; Hong, H.; Zhang, Q.; Nie, R. Effects of Climatic Variation on Pan-Evaporation in the Poyang Lake Basin, China. Clim. Res. 2014, 61, 29–40. [Google Scholar] [CrossRef]
  27. Gocic, M.; Trajkovic, S. Analysis of Changes in Meteorological Variables Using Mann-Kendall and Sen’s Slope Estimator Statistical Tests in Serbia. Glob. Planet. Chang. 2013, 100, 172–182. [Google Scholar] [CrossRef]
  28. Nyikadzino, B.; Chitakira, M.; Muchuru, S. Rainfall and Runoff Trend Analysis in the Limpopo River Basin Using the Mann Kendall Statistic. Phys. Chem. Earth Parts A/B/C 2020, 117, 102870. [Google Scholar] [CrossRef]
  29. Hamed, K.H. Exact Distribution of the Mann–Kendall Trend Test Statistic for Persistent Data. J. Hydrol. 2009, 365, 86–94. [Google Scholar] [CrossRef]
  30. Mann, H. Non-Parametric Test Against Trend. Econometrica 1945, 13, 245–259. [Google Scholar] [CrossRef]
  31. Kendall, M.G. Rank Correlation Method. Biometrika 1957, 44, 298. [Google Scholar] [CrossRef]
  32. Ouyang, Y.; Nkedi-Kizza, P.; Wu, Q.T.; Shinde, D.; Huang, C.H. Assessment of Seasonal Variations in Surface Water Quality. Water Res. 2006, 40, 3800–3810. [Google Scholar] [CrossRef] [PubMed]
  33. Olsen, R.L.; Chappell, R.W.; Loftis, J.C. Water Quality Sample Collection, Data Treatment and Results Presentation for Principal Components Analysis–Literature Review and Illinois River Watershed Case Study. Water Res. 2012, 46, 3110–3122. [Google Scholar] [CrossRef]
  34. Betancur, S.B.; Gastmans, D.; Vásquez, K.V.; Santarosa, L.V.; dos Santos, V.; Kirchheim, R.E. Hydrological Responses in Equatorial Watersheds Indicated by Principal Components Analysis (PCA)–Study Case in Atrato River Basin (Colombia). RBRH 2020, 25, e45. [Google Scholar] [CrossRef]
  35. Pontius, R.G.; Shusas, E.; McEachern, M. Detecting Important Categorical Land Changes While Accounting for Persistence. Agric. Ecosyst. Environ. 2004, 101, 251–268. [Google Scholar] [CrossRef]
  36. Li, X.; Zhang, Q.; Xu, C.-Y.; Ye, X. The Changing Patterns of Floods in Poyang Lake, China: Characteristics and Explanations. Nat. Hazards 2015, 76, 651–666. [Google Scholar] [CrossRef]
  37. Shankman, D.; Keim, B.D.; Song, J. Flood Frequency in China’s Poyang Lake Region: Trends and Teleconnections. Int. J. Clim. 2006, 26, 1255–1266. [Google Scholar] [CrossRef] [Green Version]
  38. Ye, X. Changes of Extreme Precipitation and Possible Influence of ENSO Events in a Humid Basin in China. Atmosphere 2021, 12, 1522. [Google Scholar] [CrossRef]
  39. Wang, H.; Kaisam, J.P.; Liang, D.; Deng, Y.; Shen, Y. Wind Impacts on Suspended Sediment Transport in the Largest Freshwater Lake of China. Hydrol. Res. 2020, 51, 815–832. [Google Scholar] [CrossRef]
  40. Lai, X.; Shankman, D.; Huber, C.; Yesou, H.; Huang, Q.; Jiang, J. Sand Mining and Increasing Poyang Lake’s Discharge Ability: A Reassessment of Causes for Lake Decline in China. J. Hydrol. 2014, 519, 1698–1706. [Google Scholar] [CrossRef]
  41. Yao, J.; Li, Y.; Li, M.; Zhang, Q. The Influence of Bathymetry Changes on Low Water Level of Lake Poyang. J. Lake Sci. 2017, 29, 955–964. [Google Scholar] [CrossRef] [Green Version]
  42. Ye, X.; Li, Y.; Li, X.; Zhang, Q. Factors Influencing Water Level Changes in China’s Largest Freshwater Lake, Poyang Lake, in the Past 50 Years. Water Int. 2014, 39, 983–999. [Google Scholar] [CrossRef]
  43. Li, M.; Zhang, Q.; Li, Y.; Yao, J.; Tan, Z. Inter-Annual Variations of Poyang Lake Area during Dry Seasons: Characteristics and Implications. Hydrol. Res. 2016, 47, 40–50. [Google Scholar] [CrossRef] [Green Version]
  44. Chen, M.; Fan, S.; Deng, J.; Wang, X. Impact of the Three Gorges Dam on Regulation and Storage Capacity of Poyang Lake. J. Landsc. Res. 2020, 12, 50–55. [Google Scholar]
  45. Huang, S.; Xia, J.; Zeng, S.; Wang, Y.; She, D. Effect of Three Gorges Dam on Poyang Lake Water Level at Daily Scale Based on Machine Learning. J. Geogr. Sci. 2021, 31, 1598–1614. [Google Scholar] [CrossRef]
  46. You, H.; Xu, L.; Jiang, J.; Wang, X.; Huang, Q.; Liu, G. The Effects of Water Level Fluctuations on the Wetland Landscape and Waterfowl Habitat of Poyang Lake. Fresenius Environ. Bull. 2014, 23, 1650–1661. [Google Scholar]
  47. Hu, B.; Zou, L.; Qi, S.; Yin, Q.; Luo, J.; Zuo, L.; Meng, Y. Evaluating the Vulnerability of Siberian Crane Habitats and the Influences of Water Level Intervals in Poyang Lake Wetland, China. Remote Sens. 2022, 14, 2774. [Google Scholar] [CrossRef]
  48. Li, H.; Zhang, H.; Yu, L.; Cao, K.; Wang, D.; Duan, X.; Ding, F.; Mao, Z.; Wang, K.; Liu, S.; et al. Managing Water Level for Large Migratory Fish at the Poyang Lake Outlet: Implications Based on Habitat Suitability and Connectivity. Water 2022, 14, 2076. [Google Scholar] [CrossRef]
Figure 1. (a) Study area distribution in the Poyang Lake basin. (b) Location of Poyang Lake in the Yangtze River Basin.
Remotesensing 15 00600 g001aRemotesensing 15 00600 g001b
Figure 2. Remote sensing temporal data distribution.
Remotesensing 15 00600 g002
Figure 3. Characteristics of water area variation in the Poyang Lake during 1977–2021.
Remotesensing 15 00600 g003
Figure 4. (a) Hydrological relationship diagram of the Poyang Lake. (b) Schematic diagram of the hydrological cycle of the lake.
Remotesensing 15 00600 g004
Figure 5. Characteristics of inflow in Poyang Lake during 1977–2020.
Remotesensing 15 00600 g005
Figure 6. Characteristics of net outflow in the Poyang Lake during 1977–2020.
Remotesensing 15 00600 g006
Figure 7. Sum of the annual sediment load in the Poyang Lake estuary during 1980–2020.
Remotesensing 15 00600 g007
Figure 8. Sum of the seasonal evaporation in Poyang Lake during 1977–2020.
Remotesensing 15 00600 g008
Figure 9. Total of the seasonal precipitation in Poyang Lake during 1977–2020.
Remotesensing 15 00600 g009
Figure 10. Characteristics of land use in the Poyang Lake basin during 1980–2020.
Remotesensing 15 00600 g010
Figure 11. Comparison of land use of Poyang Lake basin from 1980 to 2020.
Remotesensing 15 00600 g011
Figure 12. Comparison of lake water area at the end of flood season: (a) description of lake water area at the end of the flood season; (b) comparison of lake water area extraction results at the end of flood season. (c) Comparison of lake water area extraction results at the end of flood season.
Remotesensing 15 00600 g012aRemotesensing 15 00600 g012b
Figure 13. Comparison of lake water area during the early dry season: (a) description of lake water area at the end of the dry season; (b) comparison of lake water area extraction results at the end of dry season. (c) Comparison of lake water area extraction results at the end of dry season.
Remotesensing 15 00600 g013
Table 1. Component matrix.
Flood Season
VariableFactor1Factor2
Inflow0.86−0.02
Net outflow0.850.03
Sediment0.83−0.02
Precipitation−0.550.77
Evaporation0.580.72
Dry Season
VariableFactor1Factor2
Net outflow0.880.03
Inflow0.770.56
Sediment0.720.03
Evaporation−0.480.47
Precipitation−0.290.82
Table 2. Land use change information of 1980–2020 (%).
GainLossTotal
Change
SwapAbsolute Value
of Net Change
1980–2000Cropland0.400.490.890.810.08
Forest0.430.510.941.02−0.08
Grassland0.290.240.530.58−0.04
Other0.130.100.230.26−0.03
Settlement0.140.000.140.000.14
Water0.270.320.600.65−0.05
2000–2020Cropland12.0412.7724.8124.090.73
Forest11.8252.9464.7665.58−0.81
Grassland3.003.476.476.49−0.02
Other0.140.540.670.420.25
Settlement2.780.763.552.021.53
Water2.083.065.144.890.25
Table 3. Land transfer matrix of 1980–2020 (%).
Relative Difference (Increase)2020
CroplandForestGrasslandOtherSettlementWater
1980Cropland0.000.070.04−0.431.260.08
Forest−0.100.000.01−0.94−0.55−0.31
Grassland0.260.380.00−0.60−0.25−0.45
Other−0.44−0.93−0.600.00−0.5210.79
Settlement2.36−0.48−0.130.380.00−0.04
Water0.44−0.58−0.3517.870.250.00
Relative Difference (Reduced)2020
CroplandForestGrasslandOtherSettlementWater
1980Cropland0.00−0.150.18−0.502.240.28
Forest0.060.000.39−0.94−0.22−0.57
Grassland0.10−0.020.00−0.69−0.05−0.16
Other−0.53−0.95−0.610.00−0.4117.93
Settlement1.54−0.68−0.24−0.060.000.50
Water0.87−0.56−0.0221.121.390.00
Disclaimer/Publisher’s Note: The statements, opinions and data contained in all publications are solely those of the individual author(s) and contributor(s) and not of MDPI and/or the editor(s). MDPI and/or the editor(s) disclaim responsibility for any injury to people or property resulting from any ideas, methods, instructions or products referred to in the content.

