Article

Spatiotemporal Characteristics and Hazard Assessments of Maize (Zea mays L.) Drought and Waterlogging: A Case Study in Songliao Plain of China

1
School of Environment, Northeast Normal University, Changchun 130024, China
2
State Environmental Protection Key Laboratory of Wetland Ecology and Vegetation Restoration, Northeast Normal University, Changchun 130024, China
3
Key Laboratory for Vegetation Ecology, Ministry of Education, Changchun 130024, China
*
Author to whom correspondence should be addressed.
Remote Sens. 2023, 15(3), 665; https://doi.org/10.3390/rs15030665
Submission received: 24 October 2022 / Revised: 5 January 2023 / Accepted: 20 January 2023 / Published: 22 January 2023
(This article belongs to the Section Remote Sensing in Geology, Geomorphology and Hydrology)

Abstract

:
The Songliao Plain is the largest maize (Zea mays L.) cropland area in China and, thus, is most influenced by water stress. To mitigate the adverse impact of water stress on maize yield and quality, various agricultural irrigation strategies have been implemented. Based on land surface temperature and an enhanced vegetation index, this study constructed the temperature vegetation dryness index (TVDI) and combined the Hurst index and Sen trend to analyze the spatiotemporal characteristics of drought and waterlogging. From the correlation between TVDI and gross primary productivity, the weight coefficients of different growth cycles of maize were derived to determine the drought and waterlogging stresses on maize in Songliao Plain for 2000–2020. The drought hazard on the western side of Songliao Plain was high in the west and low in the east, whereas the waterlogging hazard was high in the east. Waterlogging likely persisted according to the spatiotemporal trends and patterns of drought and waterlogging. During the second growth cycle, maize was most severely affected by water stress. There was a spatial heterogeneity in the severity of the hazards and the stress degree of maize. For the reason that precipitation in the study area was concentrated between mid-late July and early August, maize was susceptible to drought stress during the first two growth stages. Irrigation concentrated in the early and middle stages of maize growth and development in the western part of the Songliao Plain reduced the drought stress-induced damage. Spatiotemporally-detected drought and waterlogging couplings and hazards for maize in the Songliao Plain for 2000–2020 provide actionable insights into the prevention and mitigation of such disasters and the implementation of water-saving irrigation practices at the regional scale.

1. Introduction

The Intergovernmental Panel on Climate Change (IPCC) Sixth Assessment Report (AR6) pointed out the intensity and frequency of human-induced extreme weather events will continue to increase, such as agricultural droughts and extreme precipitation [1]. The increased risks and spatiotemporally changing impacts of these extreme events, such as disasters, outbreaks, and stresses, seriously threaten the stability of agricultural yield and quality. As a largely agricultural country, China is most likely to face greater threats to food security. Maize (Zea mays L.) is the most common grain crop in the country. Since 1978, the sown area and yield of maize in China have risen. Maize has become the largest grain crop in China since 2007 [2]. Northeast China, in particular the Songliao Plain, is the main maize-producing area, which accounts for 16% and 18% of the national total cropland area and yield of maize, respectively [3,4,5]. Meteorological and hydrological extremes directly affect the growth, development, and yield of crops, in particular, maize. Their adverse impacts, such as a decline in yield, directly threaten regional and national food security [6,7,8,9]. Affected by the temperate monsoon, drought and waterlogging hazards occur frequently in the Songliao Plain [10,11]. Therefore, it is necessary to quantify the impacts and risks of water stress on maize yield in this region in order to improve the prevention and mitigation capacity of multi-scale agricultural policies to ensure food security [12].
Previous studies have mainly focused on a single disaster [13,14,15,16]. In recent years, awareness has risen so as to focus on the multiple risks and impacts of extreme weather events in maize croplands [17]. By applying the Copula function to analyze drought, high temperatures, and yield fluctuation, it was concluded that their interaction impact on yield decline was nonlinear [18]. Haqiqi et al. [19] estimated the combined effects of extremely high temperatures and drought according to a regression model built by Roberts et al. [20] and concluded that the compound dry-heat impact was more harmful than a single disaster impact. Wu et al. constructed a composite dry-heat amplitude index (DHMI) and found that composite dry-heat events occurred severely in the northeast and southwest of China [21]. Some studies have used crop models to simulate temporal changes in maize yield under different drought and cold-injury conditions [22] and studied the spatiotemporally varying effects of different degrees of drought and waterlogging on maize yield [7]. However, the spatiotemporally changing couplings and hazards of drought and waterlogging for maize remain understudied and poorly elucidated. The occurrence of drought and waterlogging is different from the compound events of high temperatures and drought since drought and waterlogging would not occur at the same time. Therefore, the focus and challenge of this study were to identify the spatiotemporally different interactions (coupling types) of drought and waterlogging, explore their impacts on maize yield, assess their hazards, and provide the basis for their prevention and mitigation on a regional scale.
In studies on crop water stress, precipitation data over extended time series are frequently used to analyze the characteristics of agricultural drought and waterlogging [23,24,25]. However, precipitation is only the cause of drought and waterlogging events and is not the quantitative measure of water-stressed crops. Based on only the meteorological data, it is difficult to quantify whether or not and the extent to which crops are affected by water stress. Vegetation indices can help to quantify the status of crop growth, development, health, and stress. In contrast to station-derived meteorological data or single proximal sensor-based data, remote sensing-based drought or vegetation indices exhibit a coarse-to-fine spatiotemporal resolution [26,27].
Depending on what processes to address or respond to, drought indices can be divided into the following three categories: meteorological drought indices, which respond to water availability; agricultural drought indices, which respond to water supply and demand; and vegetation morphology indices, which respond to water stress. Each drought index has its own (dis)advantages [28]. The most common drought indices are the standardized precipitation index (SPI) [29], the standardized precipitation evapotranspiration index (SPEI) [24], the palmer drought severity index (PDSI) [30,31,32], the crop water deficit index (CWDI) [33], and the temperature vegetation dryness index (TVDI) [34,35,36]. The standardized precipitation index is a common meteorological drought index that indicates anomalous changes in precipitation over a given time scale [37,38]. The calculation of SPI is simpler than that of SPEI. The standardized precipitation evapotranspiration index is another common drought index and is calculated based on the Thornthwaite and Penman-Monteith equations [39,40,41]. The Thornthwaite equation is simpler; however, in some studies, the Penman-Monteith equation is considered more advantageous as it incorporates more drought indicators [42,43]. Standardized precipitation index and SPEI are estimated from meteorological data, and their accuracy is influenced by the spatial density of the meteorological stations. Drought indices based on meteorological data have the advantage of long timescales and are, thus, useful for studying the evolution of long-term droughts. The crop water deficit index considers the two factors of crop water demand and precipitation, reflecting agricultural drought to some extent [33]. Crop water demand often needs to be measured by field tests; therefore, it is better to use this index in combination with field tests. The palmer drought severity index is based on the soil water balance, taking into account multiple processes, such as precipitation, evapotranspiration, runoff, and crops, and has good spatiotemporal comparability. Since the PDSI calculation is complex, many studies have chosen to use the PDSI values provided by the National Oceanic and Atmospheric Administration (NOAA) and the National Climatic Data Center (NCDC) [44,45,46]. Drought-related vegetation morphological indices include the normalized difference vegetation index (NDVI), the leaf area index (LAI), and the enhanced vegetation index (EVI) [28]. The normalized difference vegetation index is easily saturated in areas with high vegetation coverage; therefore, many studies choose EVI or LAI over NDVI to describe vegetation status under water stress [47].
When crops are subjected to drought or waterlogging stress, their canopy temperature changes. Han et al. used thermal imaging of the canopy to explore the impact of water stress on maize. The temperature-vegetation dryness index combines the canopy temperature and vegetation index to assess the response of crops to water stress [48]. Wan et al. were the first to establish a conceptual model based on TVDI and net primary production (NPP) and estimate the relationship between water stress and maize yield [49,50]. The crop water deficit index is also based on evapotranspiration to express the extent of crop water stress; however, the spatial resolution of CWDI data is not high due to the impact of meteorological stations. A study about drought in the Mekong River basin found TVDI to more accurately describe precipitation- and soil-water-related stress than CWDI [51]. A comparison of different drought indices indicated that TVDI performed well to accurately monitor drought in mainland China [51]. Not only can TVDI be used to retrieve soil moisture from remote sensing data, but it can also be used as an index to quantify the response of crops to drought and waterlogging [36,52,53,54].
To explore the hazards of agrometeorological and hydrological extremes on crops, it is important to select appropriate indices to identify their intensity and frequency. Drought and waterlogging indices are mainly divided into single- and multi-factor indices. The single-factor index has strong explanatory power for stresses caused by certain factors, whereas the multi-factor index can better reflect the response of crops to stress. According to the conceptual model constructed by Wan et al. [49], this study also explored the correlation between gross primary production (GPP) and TVDI in maize croplands under water stress, thus determining the hazard coefficient under different water stress conditions as well as exploring the impact of different coupling modes of drought and waterlogging on maize. This study mainly focused on: (1) exploring the coupling types of drought and waterlogging as well as their spatiotemporal trends based on TVDI in the Songliao Plain for 2000–2020; (2) obtaining the spatiotemporal patterns of drought and waterlogging in the maize croplands; and (3) assessing their hazards. The results of the hazard assessment were validated against the fluctuations in maize yield. To describe the relationship between the extreme event scenario and climate variability, we correlated SPI and TVDI and estimated the explanatory power of TVDI for a drought on multiple temporal scales.

2. Study Area and Data
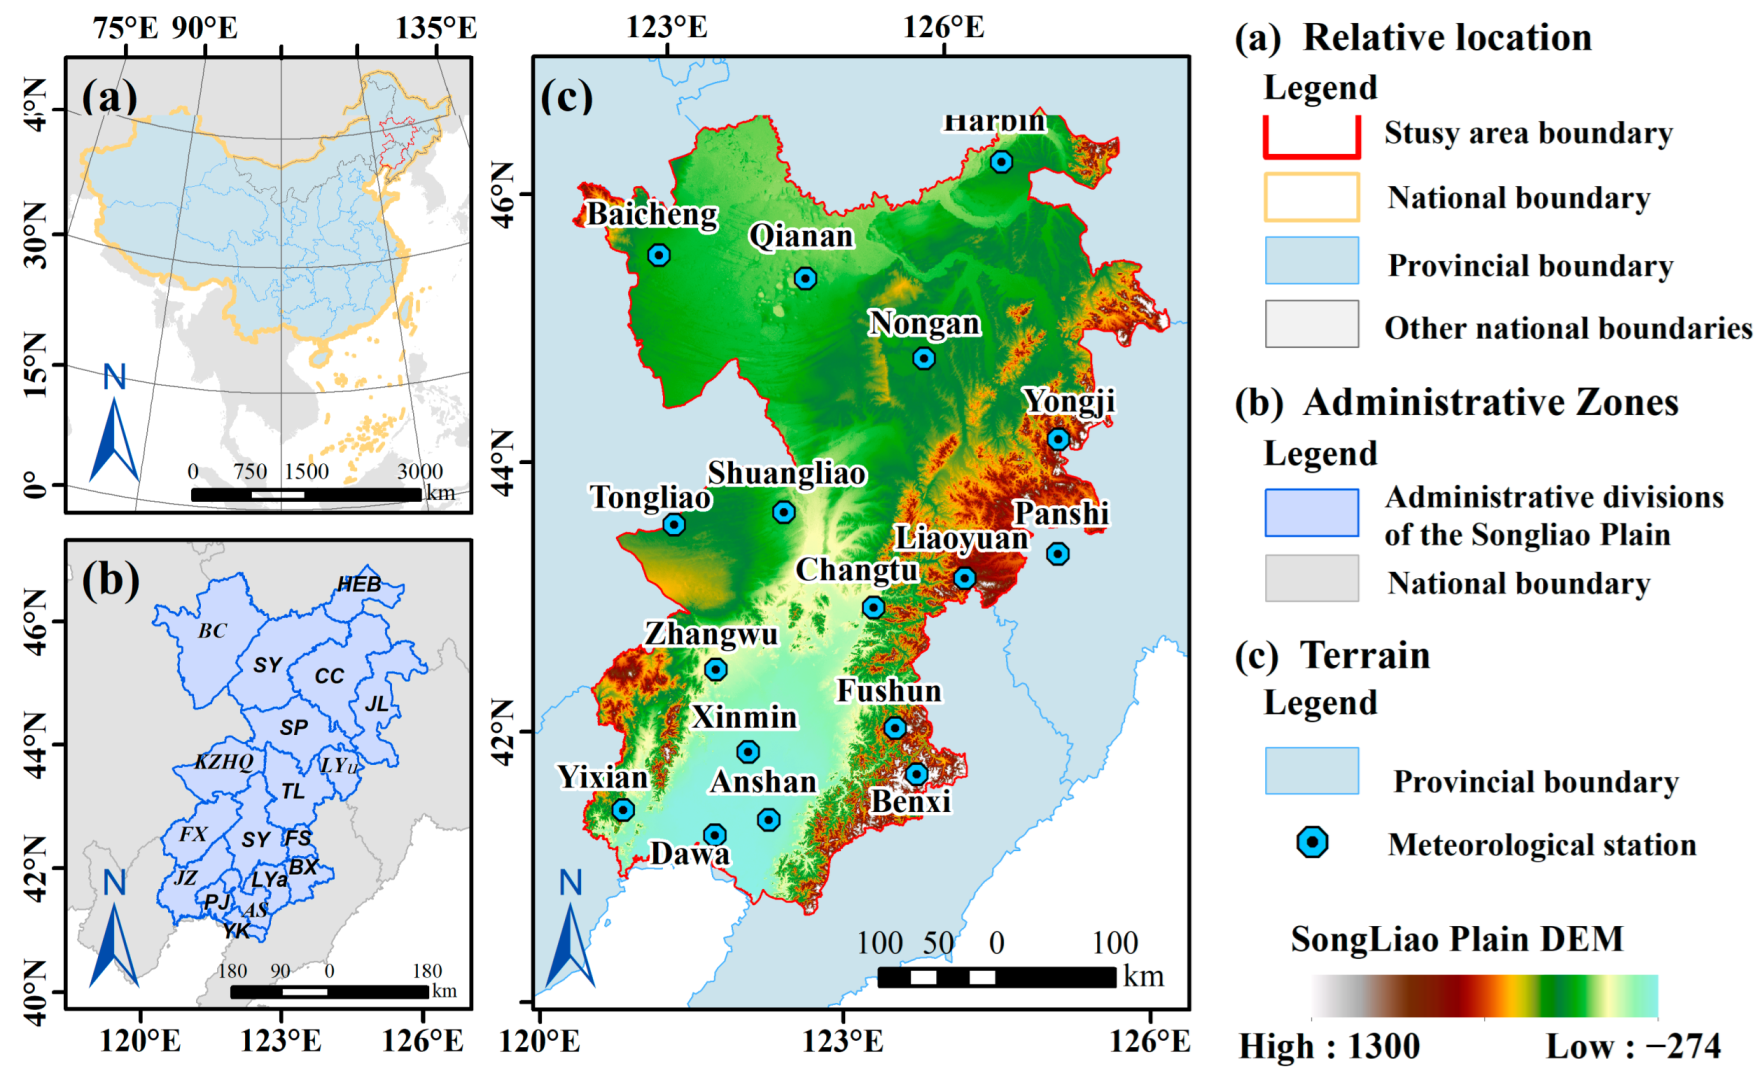
2.1. Study Area

Located in northeast China, the Songliao Plain is the main maize-producing area in China (Figure 1a). The study area is north of Harbin in the Heilongjiang province, south of Panjin in the Liaoning province, west of Tongliao province, and east of Jilin province, including 18 cities in the four provinces (Figure 1b). Maize accounts for more than 70% of the grain cropland area in the Songliao Plain. Located between the middle and high latitudes of the Northern Hemisphere, the study area is characterized by a temperate monsoon climate exhibiting four distinct seasons compounded with rain and heat in the same season. Its agricultural production is most severely affected by drought and waterlogging.

2.2. Data and Processing

A description of the data used for this study is shown in the table below (Table 1).

2.2.1. Satellite Remote Sensing Data

In this study, the surface reflectance data of MOD09A1 obtained from the Moderate Resolution Imaging Spectroradiometer (MODIS) sensor on the NASA Terra satellite were used. The temporal resolution of the data was eight days, and the spatial resolution was 250 m. We used MOD09A1 data to calculate EVI and resampled the spatial resolution to 500 m for the TVDI calculation.
We used the 1-km seamless surface temperature dataset from China [55]. This data product was obtained by fusing the bright temperature data of AMSR2 with MODIS NDVI and slope data of the Shuttle Radar Topography Mission (SRTM) [56,57]. We resampled the spatial resolution to 500 m for TVDI calculation. This dataset contained land surface temperature (LST) data for 2002–2020. Therefore, MOD11A2 data were selected to supplement LST data for 2000–2001.
The GPP dataset used in this study was obtained from Zheng et al. [58]. Its temporal resolution was eight days, and the spatial resolution was 0.05°. The GPP dataset was resampled to 500 m to calculate the response of maize yield to water stress. As the dataset covers 1982–2017, GPP data for 2018–2020 were missing. Therefore, this study used MODIS17A2HGF data for 2018–2020 to fill the gap in the GPP dataset. The temporal resolution of the MOD17A2HGF data was eight days, and the spatial resolution was 500 m. All MODIS data were obtained from the National Aeronautics and NASA (https://ladsweb.modaps.eosdis.nasa.gov/ (accessed on 10 May 2022)).

2.2.2. Maize Planting Mapping Data

The data for the 1 km maize-planting division in China are from Luo et al. [59] and the classification map of China’s main crops [60]. We could accurately assess the biomass change of maize under water stress by using maize-planting area data and removing the impact of non-crop areas from the assessment. These data provide a 1 km-grid dataset of cropland areas for the three main crops. We used maps of the maize-planting areas for 2000–2015 for this dataset.

2.2.3. Disaster Data and Yield Data

Disaster data were obtained from the China Waterlogging and Drought Disaster Bulletin issued by the Ministry of Water Resources of China (http://www.mwr.gov.cn/ (accessed on 23 May 2022)) and the China Meteorological Disaster Yearbook published by the China Meteorological Administration [61,62,63].
Maize yield and area data were obtained from the Jilin Statistical Yearbook (http://tjj.jl.gov.cn/tjsj/tjnj/ (accessed on 20 May 2022)), Liaoning Statistical Yearbook (https://tjj.ln.gov.cn/tjj/tjxx/xxcx/tjnj/ (accessed on 20 May 2022)), and Heilongjiang Statistical Yearbook (http://tjj.hlj.gov.cn/tjjnianjian/ (accessed on 20 May 2022)).

2.2.4. Meteorological Data

Meteorological data used in this study were obtained from the China Meteorological Data Network (https://data.cma.cn/ (accessed on 20 May 2022)). The problem data was replaced by the data from the surrounding meteorological stations. The data mainly include daily precipitation data from 17 meteorological stations in the Songliao Plain (Table S2). This data was used to analyze the temporal distribution of precipitation in the study area from April to October and to calculate the SPI.

3. Method

3.1. Estimation of TVDI

As proposed by Sandholt et al. [35], TVDI was constructed in this study from LST and EVI to estimate the degree of drought and waterlogging stress (Figure 2). In the calculation formula of TVDI, ranging from 0 to 1, LST is the LST value of a single pixel, LSTmin is the minimum LST value, and LSTmax is the maximum LST value. Thus, the dry edge equation and wet edge equation were calculated. A higher TVDI value points to drought areas, whereas a TDVI closer to zero indicates a waterlogged area [54,64,65]. As presented in Table 2, 0 ≤ TVDI ≤ 0.4 is defined as a waterlogging event, whereas 0.6 < TVDI ≤ 1 is defined as a drought event [49,66,67,68,69].
TVDI = LST     LST min LST max     LST min ,
LST max = a 1 + b 1   ×   EVI i
LST min = a 2 + b 2   ×   EVI i

3.2. Hazard Assessments

The hazards of the meteorological extremes (disasters) mainly refer to the abnormal degrees of extreme events, determined by the intensity and frequency of meteorological hazard factors [70]. To characterize the intensity and frequency of the meteorological disasters of drought and waterlogging, TVDI was used. The hazard assessment indicators were constructed as follows:
H = TVDI M   ×   TVDI F
where H is the hazard of the causal factor; TVDIM is the variability degree of the causal factor; and TVDIF is the frequency of hazard occurrence.

3.2.1. Calculation of Drought and Waterlogging Intensities

To quantify the intensity of drought and waterlogging events, the cumulative values of TVDI at an 8-day resolution were used as follows:
TVDI DM = p = 1 q TVDI Dp
TVDI WM = p = 1 q TVDI Wp ,
where TVDIDM is the causal intensity of drought; p is the number of drought occurrences per month; q is the number of drought occurrences per month; and TVDIDp is the TVDI value for each month of drought; TVDIWM is the causal intensity of waterlogging; p is the number of waterlogging occurrences per month; q is the number of waterlogging occurrences per month; and TVDIWp is the TVDI value for each waterlogging month. The minimum counting interval for this study was eight days, with a monthly cycle.

3.2.2. Calculation of Drought and Waterlogging Frequencies

The hazard frequency was obtained by calculating the probability of a hazard occurring over a long time-series dataset, where drought and waterlogging were separately calculated to obtain the occurrence probability of drought and waterlogging, as follows:
TVDI DF = i = 1 n N Di k ,
TVDI WF = i = 1 n N Wi k ,
where n is 21, the number of years for the period of 2000–2020; NDi and NWi are the counts of drought or waterlogging occurrence in each pixel, with 1 if there is a drought or waterlogging and with 0 if there is no event; and k is the total number of images.

3.2.3. Construction of Total Hazard Index for Entire Growth Period

In this study, the growth cycle of maize was divided into three stages: early productivity (April–May), mid-productivity (June–July), and late productivity (August–September). The hazards of the three growth cycles were calculated in the process of calculating the hazards of drought and waterlogging. As the different extremes exhibit different effects on each growth cycle of maize, this study correlated TVDI and GPP in order to determine the hazard weight of each growth period. The total hazard was estimated as follows:
H = W 1 R 1 + W 2 R 2 + W 3 R 3 ,
The hazards for each growth period were calculated as follows:
H i = TVDI DM _ i   ×   TVDI DF _ i + TVDI WM _ i   ×   TVDI WF _ i ,
where Hi is the hazard for each productivity period; TVDIDM_i is the drought intensity in the ith productivity period; TVDIWM_i is the waterlogging intensity in the ith productivity period; TVDIDF_i is the drought frequency in the ith productivity period; and TVDIWF_i is the waterlogging frequency in the ith productivity period.

3.2.4. Calculation of Weighting Factors

According to the conceptual model of water stress in maize based on NPP and TVDI proposed by Wan et al. [49] and the correlation between GPP and TVDI, this study constructed the weight coefficients of the drought and waterlogging hazards on maize at the different growth stages. The Pearson’s correlation coefficient (Equation (11)) of TVDI and GPP was calculated to determine the hazard weights of the different water stresses. As shown in Figure 3, the conceptual model proposed by Wan et al. [49] theoretically showed a parabolic relationship between vegetation status and the intensity of water stress. The worse the drought or waterlogging is, the worse the vegetation status is. According to this theory, vegetation is more severely affected as drought stress rises, and the severity of drought stress is negatively correlated with the health state of the vegetation. However, the reduction in waterlogging stress alleviates the waterlogging status of vegetation and, thus, is positively correlated with the vegetation status. In this study, the positive correlation coefficient between TVDI and GPP was defined as the waterlogging stress hazard weight, whereas the negative correlation coefficient was defined as the drought stress hazard weight, which was divided into five grades, as shown in Table 3.
ρ i = j = 1 n ( x j x ¯ ) ( y j y ¯ ) j = 1 n ( x j x ¯ ) 2 j = 1 n ( y j y ¯ ) 2 ,

3.3. Theil-Sen Median Trend Analysis and Mann-Kendall Test

The Theil–Sen median trend analysis combined with the Mann–Kendall test can detect the long-term trend and significance of the time-series data. This method is often used for long time-series analysis of vegetation data [71,72] and is robust to non-parametric statistical distributions, which can mitigate the impact of outliers on results [73,74].
Slop TVDI = Median ( TVDI j     TVDI i j     i ) ,   1     i     j     27
This study employed the Theil Sen Median trend analysis to discuss the annual trend of TVDI and identify water stress in the maize croplands. A positive trend (slope > 0) was defined as a drought trend, and a negative trend (slope < 0) was defined as a waterlogging trend. The Mann–Kendall test was used to analyze the significance of the trends. Given the level of significance (α) when | Z |   >   u 1 α / 2 , there was a significant change in the level of the sequence. In this study, α = 0.01 was adopted for TVDI with a very significant trend, while α = 0.05 was used for TVDI with a significant trend.

3.4. Hurst Index

The Hurst index was initially used in hydrological data mining to characterize the persistence or long-term correlation of time-series data [75]. The Hurst index is often used for the analysis of long-time series [76,77,78]. Varying between [0, 1], Hurst = 0.5 indicates randomly distributed time series data and that the trend cannot be determined as the future trend is independent of the present. Hurst > 0.5 indicates that the future trend is strongly correlated with the present, as well as the strong possibility of continuing to maintain the present trend; the closer it was to 1, the stronger the positive persistence of its sequence was. Hurst < 0.5 indicates that the future trend is opposite to the present trend. The closer the value was to 0, the stronger the anti-persistence of the sequence was. The Hurst index is often calculated through R/S analysis, that is, rescaled range analysis, where the ratio of range to standard deviation is defined as R/S.
According to the principle of its algorithm, this study used 27 TVDI data points every year to calculate the Hurst index (less than 27 in 2000 and 2001 due to data quality) and explored the continuous annual trends of drought and waterlogging for 2000–2020. This helped to explore whether or not TVDI sustained changes on an annual basis, the persistence of regional drought and waterlogging, and their spatiotemporal variability. The Hurst index and Sen’s slope were combined to identify the spatiotemporal patterns and trends of drought and waterlogging during the inter-annual period. The types of coupling of the extreme events were classified as shown in Table 4.

3.5. Calculation of Yield Fluctuations

Yield fluctuations were used to validate the results of the drought hazard assessments. Numerous factors affect crop yields, including climatic and sociotechnical factors. To remove the effect of technology on yield, this study calculated yield fluctuations by identifying long-term trends in yields and calculating yield trends via a one-dimensional linear regression model [79]. The yield fluctuations were calculated as follows:
Y r = Y     Y t Y t ,
where Yr is the yield fluctuation; Y is the actual yield; and Yt is the yield trend.

4. Result

4.1. Spatiotemporal Patterns of Drought and Waterlogging

Based on the Sen trends of TVDI from April to October, we obtained the annual trends of drought and waterlogging. The results of slopes > 0, <0, and =0 were defined as a drought trend, a waterlogging trend, and no predictable trend, respectively. Through the joint analysis of the Sen trend, MK test, and Hurst index, the following five coupling types of droughts and waterlogging were obtained for each year from 2000–2020: (I) from drought to waterlogging; (II) continuous drought; (III) from waterlogging to drought; (IV) continuous waterlogging; and (V) uncertainty (no predictable trend). The results were extracted from the maize croplands in Songliao Plain every year, and the proportions of the coupling types for the maize croplands were analyzed in combination with the total precipitation for 1990–2020. Figure 4 shows the spatiotemporal distribution of total monthly precipitation at each meteorological station in Songliao Plain. Precipitation in Songliao Plain was mainly concentrated in July and August. Precipitation was significantly lower in the early (April to June) and late (September to October) growth stages of maize than in its middle growth stage (July to August). The spatial characteristics of precipitation show surpluses in the east and west.
As shown in Figure 5, the continuous waterlogging trend (Type IV) accounted for the largest proportion of the four coupling types that occurred in the Songliao Plain from 2000–2020. The continuous drought exhibited the maximum proportion in 2000. In 2011, the continuous drought and drought-to-waterlogging trends showed the maximum proportion. As shown in Figure 6, in 2011, Kezuohouqi, Yingkou, and Panjin exhibited continuous drought trends, accounting for 96%, 90%, and 96% of the areas, respectively. The proportion of the continuous drought trend in Baicheng, Fuxin, Shenyang, Tieling, Benxi, Jinzhou, and Anshan exceeded 50%. Harbin, Changchun, Jilin, Songyuan, Liaoyuan, Fushun, and Liaoyang accounted for more than 50% of the area with the drought-to-waterlogging trend, where Liaoyuan reached 96%. According to the “Yearbook of Meteorological Disasters in China”, in 2011, Liaoning province experienced two tropical cyclones, “Tropical Cyclone Mire” and “Super Typhoon Muifa”, which led to four heavy rain events of varying degrees between June and August [62]. Jilin province was also affected by “Super Typhoon Muifa”. This may be the reason for the change from drought to waterlogging in some areas of the Songliao Plain. In 2010, the average annual precipitation of Liaoning and Jilin provinces exceeded the 30-year average (1981–2010) [61]. Therefore, most areas of Jilin and Liaoning provinces showed a continuous waterlogging trend in 2010 (Figure 6). In the spring and summer of 2012, Liaoning and Jilin provinces were frequently affected by heavy rainfall events, thus resulting in waterlogging in most areas. In August 2012, Liaoning and Jilin provinces were affected by tropical cyclones, such as “Typhoon Damrey” and “Typhoon Bolaven,” and suffered from waterlogging in some areas [63]. Therefore, in 2012, most regions showed continuous waterlogging and waterlogging-to-drought trends (Figure 6).
Figure 7 shows the spatiotemporal distribution maps of the drought and waterlogging trends in the Songliao Plain. According to the MK test, the four trends were divided into the following three types of significance levels: extremely significant (p < 0.01); significant (p < 0.05), and insignificant (p > 0.05). In 2011, most areas of Kezuohouqi and northeast Jilin significantly showed a continuous drought trend, while the south of Jilin exhibited a significant drought-to-waterlogging trend. Overall, a significant continuous drought trend occurred in the south of Songliao Plain, whereas a significant waterlogging trend occurred in the north of Songliao Plain.

4.2. Spatial-Temporal Characteristics of Water Stress in Maize at Different Fertility Stages

For 2000–2020, the drought frequency of Songliao Plain was high in the east and low in the west, whereas the waterlogging frequency was low in the east and high in the west, which was consistent with the spatial distribution of precipitation. As shown in Figure 8a–c, the area of the high-frequency drought was greatest in Songliao Plain during the first growth period, followed by the second growth period. Compared with the middle and late growth stages, the early growth stage showed the largest high-frequency drought area. For 2000–2020, maize in Songliao Plain was most likely to suffer from drought during the early growth stage. The drought frequency in the east of Jilin was the lowest, but Jilin showed a high probability of waterlogging. As shown in Figure 8d–f, the highest waterlogging frequency in the Songliao Plain occurred in the third growth stage, followed by the second growth stage. The waterlogging frequency was lowest in southwest Songliao Plain (Kezuohouqi, Fuxin), in particular, during the late growth stage. In the northeast Songliao Plain (Jilin, Harbin), the waterlogging frequency was high.
Figure 9 shows the weight coefficients of maize under water stress. The degree of water-stressed maize at the different growth stages could be obtained by correlating TVDI and GPP. When the weight coefficient was close to 1, maize was more severely affected by waterlogging stress. When the weight coefficient was close to −1, maize was more severely affected by drought stress. When the weight coefficient was 0, maize was not affected by water stress, and there may not have been a vegetation-covered area.
Among the three growth stages, the middle growth stage was most severely affected by drought stress. Overall, drought exerted the most significant impact on maize growth. As shown in Figure 9a, during the early growth stage, most areas were most severely affected by drought from 2000 to 2005; however, in the three stages from 2006 to 2020 (Figure 9), the degree of drought stress in the central part of Songliao Plain was alleviated. As shown in Figure 9i–l, in the late growth stage, the central and southern areas of Songliao Plain were severely affected by drought stress, while the other areas were severely affected by the varying degrees of waterlogging stress, in particular in Jilin, Harbin, Kezuohouqi, and south of Baicheng.

4.3. Drought and Waterlogging Hazard Assessment

As shown in Figure 10, the closer the hazard value was to 1, the higher the drought hazard was; the closer the value was to −1, the higher the waterlogging hazard was. For 2000–2020, the overall drought hazard in Songliao Plain was high in the west and low in the east, whereas the waterlogging hazard was low in the west and high in the east. Southwest Songliao Plain exhibited the highest drought hazard. There was a high risk of waterlogging in the western Songliao Plain (Jilin, Harbin, Liaoyuan, west of Tieling, Fushun, and Benxi).
As shown in Figure 11, the hazard grid data for 2000–2020 were cut through the maize croplands from 2000 to 2019 to obtain a box chart of the drought and waterlogging hazards in the 18 regions. The relative characteristics of the hazards in the 18 regions did not change significantly over time, and the overall hazard showed no significant inter-annual trend. In 2000 and 2001, the median and average hazards in each region were above 0, and the overall drought hazard was greater than the overall waterlogging hazard. In 2004, the hazards in Fuxin and Jinzhou rose sharply. As shown in Figure 11, the hazards on the southwest Songliao Plain (Kezuohouqi, Fuxin, Shenyang, Jinzhou, and Panjin) were higher in 2004. Precipitation in Liaoning province was lowest during the same period of 30 May–15 June 2004 and even since the founding of the People’s Republic of China according to the 2005 China Meteorological Disaster Yearbook. At the same time, high-temperature weather appeared in the first ten days of June, and drought rapidly developed, affecting the growth of maize seedlings. In the first half of 2004, severe spring and summer droughts occurred in eastern Inner Mongolia, western Jilin province, and northwestern Liaoning province.
Figure 12 shows a histogram of the average change in the hazards in the 18 regions from 2000–2020. These values were extracted from the maize croplands. As shown in Figure 12, the average hazard in most regions was above 0, and only a few regions (Jilin, Liaoyuan, Harbin, and Benxi) showed an average hazard of less than 0. In other words, most regions were most likely to have a drought. The average hazard in a region can only reflect the possibility of drought or waterlogging as a whole but cannot represent the degree of drought and waterlogging in the region.

5. Discussion

5.1. Validation Results of Drought and Waterlogging Hazards in Songliao Plain

GPP refers to the gross amount of organic carbon fixed by maize through photosynthesis over a given period. Since water stress disrupts maize photosynthesis to varying degrees, this study chose GPP to quantify the state of water-stressed maize as well as use yield fluctuation data to verify the results of the hazard assessments. Due to the lack of maize yield data for some years in Inner Mongolia, the Kezuo-houqi region was not included. Given the correlations between the maize yield fluctuations and the hazard assessments in Figure 13, the drought risk and yield fluctuations were significantly correlated (p < 0.05) in Liaoyuan City. The hazard assessments based on the remote sensing data were characterized by continuity in space, whereas the maize yield data were spatially discrete. This may be the main reason for the non-significant results. Hazard is primarily the likelihood of maize exposure to soil moisture stress, expressing the intensity, frequency, and extent of drought and waterlogging events under the influence of meteorological factors, whereas the extent of maize loss to moisture stress is the main component of the vulnerability assessment, which this study did not consider. As shown in Figure 14, in 2000, 2001, 2009, 2010, and 2018, there were reduced yields in most areas, corresponding to the high hazard values. Agricultural droughts and waterlogging are closely related to precipitation. Therefore, this study used SPI to represent the degree of meteorological variability. By correlating SPI and TVDI on multiple scales, we found that TVDI was most correlated with SPI-12 on the monthly scale. As shown in Figure S2, in May and September, TVDI showed a negative spatial correlation with SPI. Thus, TVDI was more dominant in pointing to the mid-term and long-term droughts.

5.2. Effects of Water Stress at Different Growth Stages on Maize Field Management

Maize yield was highly correlated with water, light, and temperature. Maize is most affected by water during its vegetative growth stage [80]. The effects of water, temperature, and light before and after the silking stage on the maize yield were most significant. Drought becomes the driver of maize yield if maize is sown before the best sowing date [81]. Therefore, in drought-prone areas, sowing time should be delayed to mitigate the impact of drought on maize in the early growth stage. However, it was not suitable to postpone the sowing date in areas with insufficiently effective accumulated temperature and light during the late growth stage. During the maize-growing season (from May to September), the temperature was significantly lower in the northeast of the Songliao Plain (Harbin, Jilin, and Songyuan) than in the other regions. Therefore, it was not suitable to postpone the sowing date of maize in the northeastern Songliao Plain. In western Songliao Plain (mainly in Fuxin and Kezuohouqi), the drought hazard on maize in the early growth period was high (Figure 15a); therefore, appropriately delayed sowing could be selected for these areas. Irrigation in the silking stage promotes the growth of maize, and irrigation in the completion stages of silking and grain is optimal [80]. For croplands with different soil types, different irrigation methods can be used to achieve the best irrigation effect [82]. Waterlogging in the early and middle growth stages of maize is an important factor in maize yield [83]. In the sixth leaf (V6) stage of maize, waterlogging exerts the most significant impact on the growth and yield of maize [84,85,86]. This was consistent with our results on the effect of water stress on maize at the different growth stages. However, in most areas of the Songliao Plain, the hazard of waterlogging during the early growth stage of maize was not high. Therefore, the early growth stage of maize in the Songliao Plain was a key period for avoiding drought [85,87].
The main maize varieties promoted in northeast China were high-yielding and drought-resistant (Table S3). The main varieties promoted in the Songliao Plain were “Zhengdan 985” and “Xianyu 335”, which covered a cumulative area of 105,966 km2 and 96,766 km2, respectively, for 1999–2016. Other studies found the drought vulnerability of maize in the Songliao Plain to rise annually. Areas of high vulnerability were concentrated in the south-central parts of Liaoning and Jilin provinces [88]. The increased drought vulnerability suggests that the main maize varieties adopted are not sufficiently resistant to drought and may exacerbate the drought hazards and impacts on maize yield. Drought-resistant varieties consume less water and exhibit higher yields under drought conditions [89]. Therefore, drought-resistant varieties should be planted in areas with high vulnerability to drought. In the Songliao Plain, precipitation was mainly concentrated in the summer and declined from the southeast to the northwest during the maize growth period. In eastern Liaoning and Jilin provinces, summer is susceptible to typhoons, which result in heavy precipitation events [61,62,63]. The frequency of waterlogging was therefore higher in the middle and late growth stages of maize but higher in the late growth stages in the high-frequency areas. Both high temperatures and precipitation were concentrated in July, which may have mitigated drought or waterlogging. Maize is affected by not only precipitation but also high-temperature stress, which can exacerbate the effects of drought on maize [18]. For areas in eastern Jilin province with a high risk of waterlogging, maize varieties tolerant to waterlogging and resistant to overturning should be planted. Since waterlogging events can lead to nutrient loss from the soil, effective drainage and fertilizer should be applied promptly after waterlogging [90].
The best field management practices are the key to the prevention and mitigation of the effects and risks of extreme events [91,92]. Based on the spatiotemporal patterns of historical disasters, effective countermeasures should be developed. According to the China Waterlogging and Drought Disaster Bulletin and the China Meteorological Disaster Yearbook, insufficient precipitation is the main cause of drought in the northeast. Therefore, irrigation plans need to be targeted according to the spatial differences in the drought hazards at the different growth stages. In the early growth stage of maize, the drought hazard was higher in the central and western parts of the Songliao Plain. In the middle growth stage of maize, the overall drought hazard declined, with its high values being concentrated in Kezuohouqi, Baicheng, and Songyuan. Therefore, appropriate irrigation should be applied during the early and middle growth stages in order to promote seedling emergence and grain establishment. In the late growth stage of maize, areas with a high drought risk moved southward. Given the changes in maize GPP under drought stress, appropriate irrigation should be applied to the eastern and southern parts of the Songliao Plain (mainly Kezuohouqi, Fuxin, Shenyang, and Jinzhou) during the late maize productivity.

5.3. Limitation

The study found that the proportion of the continuous drought trend in the entire growth period of maize was not high, which was different from the previous studies that have mostly identified the occurrence of drought events based on continuous days without rainfall. In this study, a TVDI constructed from LST and EVI at a temporal resolution of eight days was used to reflect the degree of water stress on maize. There was no significant drought in the early growth stage of maize, but precipitation was concentrated from July to August in the late growth stage, which may be the reason for the difference. Drought is usually divided into meteorological, agricultural, hydrological, and socioeconomic droughts. The transition from meteorological to agricultural drought requires continuously insufficient precipitation; hence, short-term insufficient precipitation may not lead to agricultural drought. Compared with the precipitation-based drought index, the TVDI characterizes meteorological drought based on a fine spatiotemporal resolution. This may also explain why TVDI was able to better detect SPI-12.
Maize yield is affected by not only water stress but also other (a)biotic stresses and is, thus, the compound result of the multiple factors. In this study, the 8-day resolution GPP data were used to indicate the biomass index of maize instead of the regional maize yield and can provide timely feedback on water stress to determine the impact of water stress on maize biomass. Based on the conceptual framework of TVDI and NPP proposed by Wan et al. [49], this study established the relationship between TVDI and GPP but did not build the relationship model between TVDI and GPP in each region (Figure 3), and lacked the vulnerability assessment of maize under water stress. This aspect remains to be addressed in future studies.
This study quantified the spatiotemporally coupled modes of drought and waterlogging in the maize croplands and their spatial distributions; however, the complex impacts of the compound stress of drought and waterlogging on maize remain to be explored and quantified. The questions of how maize yield and quality spatiotemporally respond to the different coupling types of droughts and waterlogging and to what the extent waterlogging can mitigate the adverse impact of drought in the early growth stage warrant future studies.

6. Conclusions

For 2000–2020, this study derived the TVDI of drought and waterlogging from LST and EVI, correlated TVDI and GPP in order to characterize the response of maize in the different growth stages to water stress, determined the weight coefficient of the drought hazard, and combined the Sen slope and Hurst index in order to detect the spatiotemporally composite patterns and trends of drought and waterlogging. Based on the above quantification and characterization, we found the following:
(1)
During the entire growth period of maize, the joint occurrence of drought and waterlogging was more than a single event. Overall, there existed continuous waterlogging (48%), waterlogging-to-drought (30%), continuous drought (14%), and drought-to-waterlogging (8%) trends. The continuous drought trend occurred during the entire growth period in the south of the Songliao Plain, whereas the significant continuous waterlogging trend occurred in the north of the Songliao Plain.
(2)
The drought frequency during the entire growth period of the Songliao Plain declined gradually from west to east, whereas the waterlogging frequency rose gradually from west to east, with the highest frequency occurring in Jilin. The highest waterlogging and drought frequencies were in the late and early growth stages of maize, respectively, in the Songliao Plain. The drought stress most severely influenced maize during the middle growth stage, which led to the largest affected area in the Songliao Plain, followed by the late growth stage. Spatially, the drought stress most severely affected maize in the southern Songliao Plain.
(3)
The hazards on the maize cropland in the Songliao Plain were characterized by the high drought hazard in the west and the high waterlogging hazard in the east. The inter-annual distribution of the hazards did not significantly change and was consistent with the spatial patterns of precipitation. Overall, the waterlogging hazard in Jilin was the most severe (0.1 < H < 0.39), whereas the drought hazard in Fuxin (0.27 < H < 0.68) and Jinzhou (0.28 < H < 0.74) was the highest.
In the formulation of regional agricultural policies toward disaster prevention and mitigation, Fuxin and Jinzhou should be inclined to carry out appropriate irrigation in the early and middle growth stages of maize, whereas in the late growth stage, irrigation should be reduced or even eliminated to reduce agricultural water and energy consumption. Mostly due to water and soil loss and the surface root system of maize, the maize field after waterlogging was prone to lodging in Jilin and the eastern part of the Songliao Plain due to their high elevation and abundant rainfall, where early maturing and lodging-resistant varieties of maize should be selected.

Supplementary Materials

The following supporting information can be downloaded at: https://www.mdpi.com/article/10.3390/rs15030665/s1, Figure S1: Percentage of drought and waterlogging types in each region of the Songliao Plain maize growing area from 2000 to 2020. Figure S2. Spatial correlation between SPI and TVDI. Table S1. Data description table. Table S2. Description of precipitation data. Table S3. Maize varieties in the study area. Table S4. Maize phenological information.

Author Contributions

Conceptualization, R.W., J.Z. and Z.T.; methodology, Z.T.; software, R.W. and G.R.; validation, R.W. and J.Z.; investigation, W.D.; resources, Z.T.; data curation, R.W. and G.R.; writing—original draft preparation, R.W.; writing—review and editing, J.Z. and X.L.; visualization, C.L.; supervision, C.L.; project administration, J.Z.; funding acquisition, J.Z. All authors have read and agreed to the published version of the manuscript.

Funding

This work was supported by National Key R&D Program of China (2019YFD1002201), the National Natural Science Foundation of China (U21A2040), the National Natural Science Foundation of China (41877520), the National Natural Science Foundation of China (42077443), Industrial technology research and development Project of Development and Reform Commission of Jilin Province (2021C044-5), the Key Scientific and Technology Research and Development Program of Jilin Province (20200403065SF), and the Construction Project of Science and Technology Innovation Center (20210502008ZP).

Institutional Review Board Statement

Not applicable.

Informed Consent Statement

Not applicable.

Data Availability Statement

Not applicable.

Conflicts of Interest

The authors declare no conflict of interest.

References

  1. IPCC. Climate Change 2021: The Physical Science Basis. Contribution of Working Group I to the Sixth Assessment Report of the Intergovernmental Panel on Climate Change; Cambridge University Press: Cambridge, UK; New York, NY, USA, 2021. [Google Scholar]
  2. National Bureau of Statistics of China. China Statistical Yearbook; China Statistics Press: Beijing, China, 2021. [Google Scholar]
  3. Statistic Bureau of Heilongjiang. Hei Long Jiang Statistical Yearbook; China Statistics Press: Beijing, China, 2021. [Google Scholar]
  4. Statistic Bureau of Jilin. Ji Lin Statistical Yearbook; China Statistics Press: Beijing, China, 2021. [Google Scholar]
  5. Statistic Bureau of Liaoning. Liao Ning Statistical Yearbook; China Statistics Press: Beijing, China, 2021. [Google Scholar]
  6. D’Agostino, A.L.; Schlenker, W. Recent weather fluctuations and agricultural yields: Implications for climate change. Agric. Econ. 2016, 47, 159–171. [Google Scholar] [CrossRef]
  7. Gobin, A.; Van de Vyver, H. Spatio-temporal variability of dry and wet spells and their influence on crop yields. Agric. For. Meteorol. 2021, 308–309, 108565. [Google Scholar] [CrossRef]
  8. Hertel, T.W. Food security under climate change. Nat. Clim. Chang. 2016, 6, 10–13. [Google Scholar] [CrossRef]
  9. Meng, Q.; Chen, X.; Lobell, D.B.; Cui, Z.; Zhang, Y.; Yang, H.; Zhang, F. Growing sensitivity of maize to water scarcity under climate change. Sci. Rep. 2016, 6, 19605. [Google Scholar] [CrossRef] [Green Version]
  10. Yu, X.; He, X.; Zheng, H.; Guo, R.; Ren, Z.; Zhang, D.; Lin, J. Spatial and temporal analysis of drought risk during the crop-growing season over northeast China. Nat. Hazards 2014, 71, 275–289. [Google Scholar] [CrossRef]
  11. Guan, X.; Zang, Y.; Meng, Y.; Liu, Y.; Lv, H.; Yan, D. Study on spatiotemporal distribution characteristics of flood and drought disaster impacts on agriculture in China. Int. J. Disaster Risk Reduct. 2021, 64, 102504. [Google Scholar] [CrossRef]
  12. Yin, X.G.; Jabloun, M.; Olesen, J.E.; Öztürk, I.; Wang, M.; Chen, F. Effects of climatic factors, drought risk and irrigation requirement on maize yield in the Northeast Farming Region of China. J. Agric. Sci. 2016, 154, 1171–1189. [Google Scholar] [CrossRef]
  13. Clarke, D.; Hess, T.M.; Haro-Monteagudo, D.; Semenov, M.A.; Knox, J.W. Assessing future drought risks and wheat yield losses in England. Agric. For. Meteorol. 2021, 297, 108248. [Google Scholar] [CrossRef]
  14. Li, K.; Tong, Z.; Liu, X.; Zhang, J.; Tong, S. Quantitative assessment and driving force analysis of vegetation drought risk to climate change:Methodology and application in Northeast China. Agric. For. Meteorol. 2020, 282–283, 107865. [Google Scholar] [CrossRef]
  15. Potopová, V.; Štěpánek, P.; Možný, M.; Türkott, L.; Soukup, J. Performance of the standardised precipitation evapotranspiration index at various lags for agricultural drought risk assessment in the Czech Republic. Agric. For. Meteorol. 2015, 202, 26–38. [Google Scholar] [CrossRef]
  16. Yin, Y.; Zhang, X.; Lin, D.; Yu, H.; Wang, J.a.; Shi, P. GEPIC-V-R model: A GIS-based tool for regional crop drought risk assessment. Agric. Water Manag. 2014, 144, 107–119. [Google Scholar] [CrossRef]
  17. Couëdel, A.; Edreira, J.I.R.; Lollato, R.P.; Archontoulis, S.; Sadras, V.; Grassini, P. Assessing environment types for maize, soybean, and wheat in the United States as determined by spatio-temporal variation in drought and heat stress. Agric. For. Meteorol. 2021, 307, 108513. [Google Scholar] [CrossRef]
  18. Zhu, X.; Liu, T.; Xu, K.; Chen, C. The impact of high temperature and drought stress on the yield of major staple crops in northern China. J. Environ. Manag. 2022, 314, 115092. [Google Scholar] [CrossRef]
  19. Haqiqi, I.; Grogan, D.S.; Hertel, T.W.; Schlenker, W. Quantifying the impacts of compound extremes on agriculture. Hydrol. Earth Syst. Sci. 2021, 25, 551–564. [Google Scholar] [CrossRef]
  20. Roberts, M.J.; Schlenker, W.; Eyer, J. Agronomic Weather Measures in Econometric Models of Crop Yield with Implications for Climate Change. Am. J. Agric. Econ. 2013, 95, 236–243. [Google Scholar] [CrossRef]
  21. Wu, X.; Hao, Z.; Hao, F.; Singh, V.P.; Zhang, X. Dry-hot magnitude index: A joint indicator for compound event analysis. Environ. Res. Lett. 2019, 14, 064017. [Google Scholar] [CrossRef]
  22. Žydelis, R.; Weihermüller, L.; Herbst, M.; Klosterhalfen, A.; Lazauskas, S. A model study on the effect of water and cold stress on maize development under nemoral climate. Agric. For. Meteorol. 2018, 263, 169–179. [Google Scholar] [CrossRef]
  23. Dabanlı, İ.; Mishra, A.K.; Şen, Z. Long-term spatio-temporal drought variability in Turkey. J. Hydrol. 2017, 552, 779–792. [Google Scholar] [CrossRef]
  24. Li, L.; She, D.; Zheng, H.; Lin, P.; Yang, Z.-L. Elucidating Diverse Drought Characteristics from Two Meteorological Drought Indices (SPI and SPEI) in China. J. Hydrometeorol. 2020, 21, 1513–1530. [Google Scholar] [CrossRef]
  25. Verhoeven, E.; Wardle, G.M.; Roth, G.W.; Greenville, A.C. Characterising the spatiotemporal dynamics of drought and wet events in Australia. Sci. Total Environ. 2022, 846, 157480. [Google Scholar] [CrossRef]
  26. Alahacoon, N.; Edirisinghe, M. A comprehensive assessment of remote sensing and traditional based drought monitoring indices at global and regional scale. Geomat. Nat. Hazards Risk 2022, 13, 762–799. [Google Scholar] [CrossRef]
  27. Liu, X.; Zhu, X.; Pan, Y.; Li, S.; Liu, Y.; Ma, Y. Agricultural drought monitoring: Progress, challenges, and prospects. J. Geogr. Sci. 2016, 26, 750–767. [Google Scholar] [CrossRef] [Green Version]
  28. Kchouk, S.; Melsen, L.A.; Walker, D.; van Oel, P. A geography of drought indices: Mismatch between indicators of drought and its impacts on water and food securities. Nat. Hazards Earth Syst. Sci. 2022, 22, 323–344. [Google Scholar] [CrossRef]
  29. McKee, T.; Doesken, N.; Kleist, J. The Relationship of Drought Frequency and Duration to Time Scales. In Proceedings of the 8th Conference on Applied Climatology, Anaheim, CA, USA, 17–22 January 1993; pp. 179–184. [Google Scholar]
  30. Dai, A. Characteristics and trends in various forms of the Palmer Drought Severity Index during 1900–2008. J. Geophys. Res. Atmos. 2011, 116, D12115. [Google Scholar] [CrossRef] [Green Version]
  31. Palmer, W. Meteorological Drought; US Department of Commerce, Weather Bureau: Silver Spring, MD, USA, 2006.
  32. Zhong, Z.; He, B.; Guo, L.; Zhang, Y. Performance of Various Forms of the Palmer Drought Severity Index in China from 1961 to 2013. J. Hydrometeorol. 2019, 20, 1867–1885. [Google Scholar] [CrossRef]
  33. Xiujia, C.; Guanghua, Y.; Jian, G.; Ningning, M.; Zihao, W. Application of WNN-PSO model in drought prediction at crop growth stages: A case study of spring maize in semi-arid regions of northern China. Comput. Electron. Agric. 2022, 199, 107155. [Google Scholar] [CrossRef]
  34. Meng, X.; Mao, K.; Meng, F.; Shi, J.; Zeng, J.; Shen, X.; Cui, Y.; Jiang, L.; Guo, Z. A fine-resolution soil moisture dataset for China in 2002–2018. Earth Syst. Sci. Data 2021, 13, 3239–3261. [Google Scholar] [CrossRef]
  35. Sandholt, I.; Rasmussen, K.; Andersen, J. A simple interpretation of the surface temperature/vegetation index space for assessment of surface moisture status. Remote Sens. Environ. 2002, 79, 213–224. [Google Scholar] [CrossRef]
  36. Sun, L.; Sun, R.; Li, X.; Liang, S.; Zhang, R. Monitoring surface soil moisture status based on remotely sensed surface temperature and vegetation index information. Agric. For. Meteorol. 2012, 166–167, 175–187. [Google Scholar] [CrossRef]
  37. Laimighofer, J.; Laaha, G. How standard are standardized drought indices? Uncertainty components for the SPI & SPEI case. J. Hydrol. 2022, 613, 128385. [Google Scholar] [CrossRef]
  38. Oliveira, N.M.d.; Silva, R.M.d.; Brasil Neto, R.M.; Santos, C.A.G.; Vianna, P.C.G. Spatiotemporal patterns of agricultural and meteorological droughts using SPI and MODIS-based estimates over a Brazilian semiarid region: Study case of Upper Paraíba River basin. Geocarto Int. 2022, 37, 1–24. [Google Scholar] [CrossRef]
  39. Faiz, M.A.; Zhang, Y.; Tian, X.; Tian, J.; Zhang, X.; Ma, N.; Aryal, S. Drought index revisited to assess its response to vegetation in different agro-climatic zones. J. Hydrol. 2022, 614, 128543. [Google Scholar] [CrossRef]
  40. Chen, X.; Li, Y.; Yao, N.; Liu, D.L.; Javed, T.; Liu, C.; Liu, F. Impacts of multi-timescale SPEI and SMDI variations on winter wheat yields. Agric. Syst. 2020, 185, 102955. [Google Scholar] [CrossRef]
  41. Ma, Q.; Li, Y.; Liu, F.; Feng, H.; Biswas, A.; Zhang, Q. SPEI and multi-threshold run theory based drought analysis using multi-source products in China. J. Hydrol. 2023, 616, 128737. [Google Scholar] [CrossRef]
  42. Zhao, Q.; Sun, T.; Zhang, T.; He, L.; Zhang, Z.; Shen, Z.; Xiong, S. High-Precision Potential Evapotranspiration Model Using GNSS Observation. Remote Sens. 2021, 13, 4848. [Google Scholar] [CrossRef]
  43. Zhao, Q.; Ma, Y.; Li, Z.; Yao, Y. Retrieval of a High-Precision Drought Monitoring Index by Using GNSS-Derived ZTD and Temperature. IEEE J. Sel. Top. Appl. Earth Obs. Remote Sens. 2021, 14, 8730–8743. [Google Scholar] [CrossRef]
  44. Li, C.; Peng, L.; Zhou, M.; Wei, Y.; Liu, L.; Li, L.; Liu, Y.; Dou, T.; Chen, J.; Wu, X. SIF-Based GPP Is a Useful Index for Assessing Impacts of Drought on Vegetation: An Example of a Mega-Drought in Yunnan Province, China. Remote Sens. 2022, 14, 1509. [Google Scholar] [CrossRef]
  45. Zhao, X.; Xia, H.; Liu, B.; Jiao, W. Spatiotemporal Comparison of Drought in Shaanxi–Gansu–Ningxia from 2003 to 2020 Using Various Drought Indices in Google Earth Engine. Remote Sens. 2022, 14, 1570. [Google Scholar] [CrossRef]
  46. Jacobi, J.; Perrone, D.; Duncan, L.L.; Hornberger, G. A tool for calculating the Palmer drought indices. Water Resour. Res. 2013, 49, 6086–6089. [Google Scholar] [CrossRef]
  47. Shen, R.; Yu, P.; Yan, J.; Wang, Y. Retrieving Soil Moisture by TVDI Based on Different Vegetation Index: A Case Study of Shanxi Province. In Proceedings of the 2012 International Conference on Computer Science and Electronics Engineering, Hangzhou, China, 23–25 March 2012; pp. 418–422. [Google Scholar]
  48. Han, M.; Zhang, H.; DeJonge, K.C.; Comas, L.H.; Trout, T.J. Estimating maize water stress by standard deviation of canopy temperature in thermal imagery. Agric. Water Manag. 2016, 177, 400–409. [Google Scholar] [CrossRef]
  49. Wan, W.; Liu, Z.; Li, J.; Xu, J.; Wu, H.; Xu, Z. Spatiotemporal patterns of maize drought stress and their effects on biomass in the Northeast and North China Plain from 2000 to 2019. Agric. For. Meteorol. 2022, 315, 108821. [Google Scholar] [CrossRef]
  50. Wan, W.; Liu, Z.; Li, K.; Wang, G.; Wu, H.; Wang, Q. Drought monitoring of the maize planting areas in Northeast and North China Plain. Agric. Water Manag. 2021, 245, 106636. [Google Scholar] [CrossRef]
  51. Ali, S.; Haixing, Z.; Qi, M.; Liang, S.; Ning, J.; Jia, Q.; Hou, F. Monitoring drought events and vegetation dynamics in relation to climate change over mainland China from 1983 to 2016. Environ. Sci. Pollut. Res. 2021, 28, 21910–21925. [Google Scholar] [CrossRef]
  52. Zhao, H.; Li, Y.; Chen, X.; Wang, H.; Yao, N.; Liu, F. Monitoring monthly soil moisture conditions in China with temperature vegetation dryness indexes based on an enhanced vegetation index and normalized difference vegetation index. Theor. Appl. Climatol. 2021, 143, 159–176. [Google Scholar] [CrossRef]
  53. Du, L.; Song, N.; Liu, K.; Hou, J.; Hu, Y.; Zhu, Y.; Wang, X.; Wang, L.; Guo, Y. Comparison of Two Simulation Methods of the Temperature Vegetation Dryness Index (TVDI) for Drought Monitoring in Semi-Arid Regions of China. Remote Sens. 2017, 9, 177. [Google Scholar] [CrossRef] [Green Version]
  54. Son, N.T.; Chen, C.F.; Chen, C.R.; Chang, L.Y.; Minh, V.Q. Monitoring agricultural drought in the Lower Mekong Basin using MODIS NDVI and land surface temperature data. Int. J. Appl. Earth Obs. Geoinf. 2012, 18, 417–427. [Google Scholar] [CrossRef]
  55. Cheng, J.; Dong, S.; Shi, J. 1 km Seamless Land Surface Temperature Dataset of China (2002–2020); National Tibetan Plateau/Third Pole Environment Data Center: Beijing, China, 2021. [Google Scholar] [CrossRef]
  56. Xu, S.; Cheng, J. A new land surface temperature fusion strategy based on cumulative distribution function matching and multiresolution Kalman filtering. Remote Sens. Environ. 2021, 254, 112256. [Google Scholar] [CrossRef]
  57. Zhang, Q.; Wang, N.; Cheng, J.; Xu, S. A Stepwise Downscaling Method for Generating High-Resolution Land Surface Temperature From AMSR-E Data. IEEE J. Sel. Top. Appl. Earth Obs. Remote Sens. 2020, 13, 5669–5681. [Google Scholar] [CrossRef]
  58. Zheng, Y.; Shen, R.; Wang, Y.; Li, X.; Liu, S.; Liang, S.; Chen, J.M.; Ju, W.; Zhang, L.; Yuan, W. Improved estimate of global gross primary production for reproducing its long-term variation, 1982–2017. Earth Syst. Sci. Data 2020, 12, 2725–2746. [Google Scholar] [CrossRef]
  59. Luo, Y.; Zhang, Z.; Li, Z.; Chen, Y.; Zhang, L.; Cao, J.; Tao, F. Identifying the spatiotemporal changes of annual harvesting areas for three staple crops in China by integrating multi-data sources. Environ. Res. Lett. 2020, 15, 074003. [Google Scholar] [CrossRef]
  60. Luo, Y.; Zhang, Z.; Li, Z.; Chen, Y.; Zhang, L.; Cao, J.; Tao, F. Data for: Identifying the spatiotemporal changes of annual harvesting areas for three staple crops in China by integrating multi-data sources. Environ. Res. Lett. 2020, 15, 074003. [Google Scholar] [CrossRef]
  61. China Meteorological Administration. Yearbook of Meteorological Disasters in China; China Meteorological Press: Beijing, China, 2011.
  62. China Meteorological Administration. Yearbook of Meteorological Disasters in China; China Meteorological Press: Beijing, China, 2012.
  63. China Meteorological Administration. Yearbook of Meteorological Disasters in China; China Meteorological Press: Beijing, China, 2013.
  64. Gao, Z.; Gao, W.; Chang, N.-B. Integrating temperature vegetation dryness index (TVDI) and regional water stress index (RWSI) for drought assessment with the aid of LANDSAT TM/ETM+ images. Int. J. Appl. Earth Obs. Geoinf. 2011, 13, 495–503. [Google Scholar] [CrossRef]
  65. Li, C.; Adu, B.; Wu, J.; Qin, G.; Li, H.; Han, Y. Spatial and temporal variations of drought in Sichuan Province from 2001 to 2020 based on modified temperature vegetation dryness index (TVDI). Ecol. Indic. 2022, 139, 108883. [Google Scholar] [CrossRef]
  66. Ali, S.; Tong, D.; Xu, Z.T.; Henchiri, M.; Wilson, K.; Siqi, S.; Zhang, J. Characterization of drought monitoring events through MODIS- and TRMM-based DSI and TVDI over South Asia during 2001–2017. Environ. Sci. Pollut. Res. 2019, 26, 33568–33581. [Google Scholar] [CrossRef] [PubMed]
  67. Liu, Y.; Qian, J.; Yue, H. Comparison and evaluation of different dryness indices based on vegetation indices-land surface temperature/albedo feature space. Adv. Space Res. 2021, 68, 2791–2803. [Google Scholar] [CrossRef]
  68. Shi, S.; Yao, F.; Zhang, J.; Yang, S. Evaluation of Temperature Vegetation Dryness Index on Drought Monitoring Over Eurasia. IEEE Access 2020, 8, 30050–30059. [Google Scholar] [CrossRef]
  69. Liu, Y.; Yue, H. The Temperature Vegetation Dryness Index (TVDI) Based on Bi-Parabolic NDVI-Ts Space and Gradient-Based Structural Similarity (GSSIM) for Long-Term Drought Assessment Across Shaanxi Province, China (2000–2016). Remote Sens. 2018, 10, 959. [Google Scholar] [CrossRef] [Green Version]
  70. Ma, Y.; Guga, S.; Xu, J.; Liu, X.; Tong, Z.; Zhang, J. Assessment of Maize Drought Risk in Midwestern Jilin Province: A Comparative Analysis of TOPSIS and VIKOR Models. Remote Sens. 2022, 14, 2399. [Google Scholar] [CrossRef]
  71. Fensholt, R.; Langanke, T.; Rasmussen, K.; Reenberg, A.; Prince, S.D.; Tucker, C.; Scholes, R.J.; Le, Q.B.; Bondeau, A.; Eastman, R.; et al. Greenness in semi-arid areas across the globe 1981–2007—An Earth Observing Satellite based analysis of trends and drivers. Remote Sens. Environ. 2012, 121, 144–158. [Google Scholar] [CrossRef]
  72. Jiang, W.; Yuan, L.; Wang, W.; Cao, R.; Zhang, Y.; Shen, W. Spatio-temporal analysis of vegetation variation in the Yellow River Basin. Ecol. Indic. 2015, 51, 117–126. [Google Scholar] [CrossRef]
  73. Sen, P.K. Estimates of the Regression Coefficient Based on Kendall’s Tau. J. Am. Stat. Assoc. 1968, 63, 1379–1389. [Google Scholar] [CrossRef]
  74. Theil, H. A Rank-Invariant Method of Linear and Polynomial Regression Analysis; Springer: Dordrecht, The Netherlands, 1992; pp. 345–381. [Google Scholar]
  75. Hurst, H.E. Long-Term Storage Capacity of Reservoirs. Trans. Am. Soc. Civ. Eng. 1951, 116, 770–799. [Google Scholar] [CrossRef]
  76. Chang, J.; Liu, Q.; Wang, S.; Huang, C. Vegetation Dynamics and Their Influencing Factors in China from 1998 to 2019. Remote Sens. 2022, 14, 3390. [Google Scholar] [CrossRef]
  77. Rivas-Tabares, D.A.; Saa-Requejo, A.; Martín-Sotoca, J.J.; Tarquis, A.M. Multiscaling NDVI Series Analysis of Rainfed Cereal in Central Spain. Remote Sens. 2021, 13, 568. [Google Scholar] [CrossRef]
  78. Tong, S.; Zhang, J.; Bao, Y.; Lai, Q.; Lian, X.; Li, N.; Bao, Y. Analyzing vegetation dynamic trend on the Mongolian Plateau based on the Hurst exponent and influencing factors from 1982–2013. J. Geogr. Sci. 2018, 28, 595–610. [Google Scholar] [CrossRef] [Green Version]
  79. Ray, D.K.; Gerber, J.S.; MacDonald, G.K.; West, P.C. Climate variation explains a third of global crop yield variability. Nat. Commun. 2015, 6, 5989. [Google Scholar] [CrossRef] [Green Version]
  80. Çakir, R. Effect of water stress at different development stages on vegetative and reproductive growth of corn. Field Crop. Res. 2004, 89, 1–16. [Google Scholar] [CrossRef]
  81. Lu, H.-d.; Xue, J.-q.; Guo, D.-w. Efficacy of planting date adjustment as a cultivation strategy to cope with drought stress and increase rainfed maize yield and water-use efficiency. Agric. Water Manag. 2017, 179, 227–235. [Google Scholar] [CrossRef]
  82. Yi, J.; Li, H.; Zhao, Y.; Shao, M.a.; Zhang, H.; Liu, M. Assessing soil water balance to optimize irrigation schedules of flood-irrigated maize fields with different cultivation histories in the arid region. Agric. Water Manag. 2022, 265, 107543. [Google Scholar] [CrossRef]
  83. Zhu, X.; Xu, K.; Liu, Y.; Guo, R.; Chen, L. Assessing the vulnerability and risk of maize to drought in China based on the AquaCrop model. Agric. Syst. 2021, 189, 103040. [Google Scholar] [CrossRef]
  84. Huang, C.; Gao, Y.; Qin, A.; Liu, Z.; Zhao, B.; Ning, D.; Ma, S.; Duan, A.; Liu, Z. Effects of waterlogging at different stages and durations on maize growth and grain yields. Agric. Water Manag. 2022, 261, 107334. [Google Scholar] [CrossRef]
  85. Jin, N.; He, J.; Fang, Q.; Chen, C.; Ren, Q.; He, L.; Yao, N.; Song, L.; Yu, Q. The Responses of Maize Yield and Water Use to Growth Stage-Based Irrigation on the Loess Plateau in China. Int. J. Plant Prod. 2020, 14, 621–633. [Google Scholar] [CrossRef]
  86. Tian, L.; Li, J.; Bi, W.; Zuo, S.; Li, L.; Li, W.; Sun, L. Effects of waterlogging stress at different growth stages on the photosynthetic characteristics and grain yield of spring maize (Zea mays L.) Under field conditions. Agric. Water Manag. 2019, 218, 250–258. [Google Scholar] [CrossRef]
  87. Ge, T.; Sui, F.; Bai, L.; Tong, C.; Sun, N. Effects of water stress on growth, biomass partitioning, and water-use efficiency in summer maize (Zea mays L.) throughout the growth cycle. Acta Physiol. Plant. 2012, 34, 1043–1053. Acta Physiol. Plant. 2012, 34, 1043–1053. [Google Scholar] [CrossRef]
  88. Ma, Y.; Guga, S.; Xu, J.; Liu, X.; Tong, Z.; Zhang, J. Evaluation of Drought Vulnerability of Maize and Influencing Factors in Songliao Plain Based on the SE-DEA-Tobit Model. Remote Sens. 2022, 14, 3711. [Google Scholar] [CrossRef]
  89. Su, Z.e.; Zhao, J.; Marek, T.H.; Liu, K.; Harrison, M.T.; Xue, Q. Drought tolerant maize hybrids have higher yields and lower water use under drought conditions at a regional scale. Agric. Water Manag. 2022, 274, 107978. [Google Scholar] [CrossRef]
  90. Qi, D.; Pan, C. Responses of shoot biomass accumulation, distribution, and nitrogen use efficiency of maize to nitrogen application rates under waterlogging. Agric. Water Manag. 2022, 261, 107352. [Google Scholar] [CrossRef]
  91. Wang, Y.; Lv, J.; Wang, Y.; Sun, H.; Hannaford, J.; Su, Z.; Barker, L.J.; Qu, Y. Drought risk assessment of spring maize based on APSIM crop model in Liaoning province, China. Int. J. Disaster Risk Reduct. 2020, 45, 101483. [Google Scholar] [CrossRef]
  92. Jedd, T.; Smith, K.H. Drought-Stricken U.S. States Have More Comprehensive Water-Related Hazard Planning. Water Resour. Manag. 2022. [Google Scholar] [CrossRef]
Figure 1. (a) Location map of the study area; (b) the administrative divisions of its district; and (c) its DEM.
Remotesensing 15 00665 g001
Figure 2. A schematic diagram of the TVDI estimation, adapted from Sandholt et al. [35].
Remotesensing 15 00665 g002
Figure 3. The conceptual model of the effect of water stress on maize biomass, adapted from Wan et al. [49].
Remotesensing 15 00665 g003
Figure 4. Spatiotemporal distribution of total monthly precipitation at each meteorological station in Songliao Plain.
Remotesensing 15 00665 g004
Figure 5. Inter-annual trends of the coupling types of drought and waterlogging in Songliao Plain for 2000–2020.
Remotesensing 15 00665 g005
Figure 6. The area proportions of the four coupling types of drought and waterlogging in the maize croplands of Songliao Plain (The proportions of the coupling types of drought and waterlogging for 2000–2020 are shown in Supplementary Figure S1). (a) and (b) are the top eight percentages of each type in 2010 and 2011. (c) is the top eight for the percentage of Type III and Type IV in 2012.
Remotesensing 15 00665 g006
Figure 7. Spatiotemporal distributions of the coupling types of drought and waterlogging in the maize croplands in Songliao Plain for 2000–2020 and their significance levels (I: drought to waterlogging; II: continuous drought; III: waterlogging to drought; IV: continuous waterlogging; and V: no predictable trend).
Remotesensing 15 00665 g007
Figure 8. Frequency of drought and waterlogging in the three growth stages in Songliao Plain: (a,d) the early growth stage; (b,e) the mid-growth stage; and (c,f) the late growth stage.
Remotesensing 15 00665 g008
Figure 9. Water stress weight coefficients for the three growth stages of maize: (ad) water stress weight coefficients of maize early productivity for 2000–2005, 2006–2010, and 2010–2020, respectively; (eh) water stress weight coefficients of maize mid-productivity for 2000–2005, 2006–2010, and 2010–2020, respectively; and (il) water stress weight coefficients of maize late productivity for 2000–2005, 2006–2010, and 2010–2020, respectively.
Remotesensing 15 00665 g009
Figure 10. Spatiotemporal distributions of the drought and waterlogging hazards on maize in Songliao Plain for 2000–2020.
Remotesensing 15 00665 g010
Figure 11. Box line map of drought and waterlogging hazard in maize growing area in Songliao Plain from 2000 to 2020.
Remotesensing 15 00665 g011
Figure 12. Trends in annual average hazard values in the 18 regions from 2000 to 2020.
Remotesensing 15 00665 g012
Figure 13. Correlation coefficients between the hazards and yield fluctuations: (a) the correlation between drought hazard and yield fluctuations; and (b) the correlation between waterlogging hazard and yield fluctuations.
Remotesensing 15 00665 g013
Figure 14. Heat map of yield fluctuations.
Remotesensing 15 00665 g014
Figure 15. Drought and waterlogging hazards on maize at the different growth stages: (ac) the spatial distributions of the hazards in the early, middle and late growth stages of maize, respectively; and (df) the spatial distributions of the hazards in the early, middle and late growth stages of maize, respectively.
Remotesensing 15 00665 g015
Table 1. Data types and sources (A detailed description of the data is given in Table S1).
Data TypeData ContentsResolutionTime SpanData Sources
Satellite remote sensing data8-day EVI,
MOD09A1
250 m × 250 m2000–2020National Aeronautics and Space Administration (https://ladsweb.modaps.eosdis.nasa.gov/ (accessed on 10 May 2022))
8-day LST,
MOD11A2
1 km × 1 km2000, 2001
8-day GPP,
MOD17A2HGF
500 m × 500 m2018–2020
1-day LST1 km × 1 km2002–2020A global seamless 1-km resolution daily land surface temperature dataset (2003–2020)
(https://doi.org/10.25380/iastate.c.5078492 (accessed on 10 May 2022))
8-day GPP0.05° × 0.05°2000–2017Improved estimate of global gross primary production for reproducing its long-term variation, 1982–2017
(https://doi.org/10.6084/m9.figshare.8942336.v3 (accessed on 10 May 2022))
Crop mapping dataMaize planting area1 km × 1 km2000–2015Identifying the spatiotemporal changes of annual cropland areas for three staple crops in China by integrating multi-data sources
(http://dx.doi.org/10.17632/jbs44b2hrk.2 (accessed on 10 May 2022))
Historical disaster dataDrought and waterlogging dataProvinces in Songliao Plain2006–2020The China Waterlogging and Drought Disaster Bulletin of the Ministry of water resources of China (http://www.mwr.gov.cn/ (accessed on 23 May 2022))
2000–2020The China Meteorological Disaster Yearbook of the China Meteorological Administration
Yield dataMaize yield and areaCities in Songliao Plain2000–2020National Bureau of Statistics of China (https://data.stats.gov.cn/ (accessed on 20 May 2022))
Meteorological dataDaily precipitation17 weather stations in NECAvailable in Table S2Meteorological Data Center of China Meteorological Administration (http://data.cma.cn/ (accessed on 20 May 2022))
Other dataMaize varieties 1999–2016China Seed Industry Big Data Platform (http://seedchina.com.cn/ (accessed on 20 December 2022))
Table 2. TVDI-based classification of drought and waterlogging.
Grades12345
TVDI0 ≤ TVDI ≤ 0.20.2 < TVDI ≤ 0.40.4 < TVDI ≤ 0.60.6 < TVDI ≤ 0.80.8 < TVDI ≤ 1
Grades of eventsSevere
waterlogging
Mild
waterlogging
NormalMild droughtSevere drought
Table 3. Hazard weights.
Grades12345
ρi0 ≤ ρi ≤ 0.20.2 < ρi ≤ 0.40.4 < ρi ≤ 0.60.6 < ρi ≤ 0.80.8 < ρi ≤ 1
−0.2 ≤ ρi ≤ 0−0.4 < ρi ≤ −0.2−0.6 < ρi ≤ −0.4−0.8 < ρi ≤ −0.6−1 < ρi ≤ −0.8
Table 4. The types of coupling of drought and waterlogging.
Type of ChangeType CodeHurstSlop
From drought to waterloggingI<0.5>0
Continuously getting droughtII>0.5>0
From waterlogging to droughtIII<0.5<0
Continuously getting waterloggingIV>0.5<0
Unable to determineV=0.5≠0
≠0.5=0
Note: If Hurst = 0.5, or Slop = 0, then the future trend cannot be determined.
Disclaimer/Publisher’s Note: The statements, opinions and data contained in all publications are solely those of the individual author(s) and contributor(s) and not of MDPI and/or the editor(s). MDPI and/or the editor(s) disclaim responsibility for any injury to people or property resulting from any ideas, methods, instructions or products referred to in the content.

