Abstract
Recent advances in Computer Science and the spread of internet connection have allowed specialists to virtualize complex environments on the web and offer further information with realistic exploration experiences. At the same time, the fruition of complex geospatial datasets (point clouds, Building Information Modelling (BIM) models, 2D and 3D models) on the web is still a challenge, because usually it involves the usage of different proprietary software solutions, and the input data need further simplification for computational effort reduction. Moreover, integrating geospatial datasets acquired in different ways with various sensors remains a challenge. An interesting question, in that respect, is how to integrate 3D information in a 3D GIS (Geographic Information System) environment and manage different scales of information in the same application. Integrating a multiscale level of information is currently the first step when it comes to digital twinning. It is needed to properly manage complex urban datasets in digital twins related to the management of the buildings (cadastral management, prevention of natural and anthropogenic hazards, structure monitoring, etc.). Therefore, the current research shows the development of a freely accessible 3D Web navigation model based on open-source technology that allows the visualization of heterogeneous complex geospatial datasets in the same virtual environment. This solution employs JavaScript libraries based on WebGL technology. The model is accessible through web browsers and does not need software installation from the user side. The case study is the new building of the University of Twente—Faculty of Geo-Information (ITC), located in Enschede (the Netherlands). The developed solution allows switching between heterogeneous datasets (point clouds, BIM, 2D and 3D models) at different scales and visualization (indoor first-person navigation, outdoor navigation, urban navigation). This solution could be employed by governmental stakeholders or the private sector to remotely visualize complex datasets on the web in a unique visualization, and take decisions only based on open-source solutions. Furthermore, this system can incorporate underground data or real-time sensor data from the IoT (Internet of Things) for digital twinning tasks.
1. Introduction
In recent years, the fruition of urban datasets has become even more exhaustive but at the same time, more complex. New technologies in the field of Geomatics have allowed the fast acquisition of dense point clouds of indoor and outdoor environments with a high accuracy. Terrestrial Laser Scanner (TLS) static acquisitions allow achieving cm-level accuracies [1,2,3], and new smart technologies now allow for making acquisitions in movement, such as GeoSlam [4] and Bagpack [5] solutions. At the same time, the integration of Unmanned Aerial Vehicle (UAV) technology has opened new possibilities for survey operations, offering the opportunity to make digital reconstructions on the base of aerial point cloud acquisitions [6]. Parallel solutions based on digital photogrammetry allow the virtual 3D reconstruction of complex environments starting from image acquisitions taken from nadiral orientation or around the object [7,8]. These solutions are based on Structure from Motion (SfM) and Multi View Stereo (MVS) algorithms [9,10,11]. The integration of Ground Control Points is necessary to correctly scale and localize the survey with high levels of accuracy [12]. All these solutions are now commonly exploited in Geomatics; however, the management and accessibility of these huge datasets remain a challenge due to the complexity and the data volume [13].
The management of a huge dataset is also a challenge when it comes to the use of Virtual Reality (VR) and Augmented Reality (AR). Recent research in this domain is focused on testing possibilities of virtual navigation such as immersive 3D fruition based on 3D visors [14], development of AR applications for mobile devices connected with real 2D or 3D targets [15], or generation of virtual web navigation models for desktop and mobile devices [16]. The latest solution represents an interesting way to share 3D spatial information because it employs the features of web browsers and WebGL opensource JavaScript libraries to offer users a smart virtual navigation solution [17]. In any case, VR and AR solutions require working with 3D models with a limited number of polygons inside, because representing a 3D environment on the web remains a big challenge [18].
Recent advances in Geographic Information Systems (GIS) have allowed the visualization of 3D Globe-based environments on the web [19]. The idea of developing 3D GIS solutions was born in light of solving the problems related to the complexity of the integration between 3D spatial and non-spatial datasets [20]. Integrating the third dimension in WebGIS is useful to generate more realistic visualization and analyze and describe complex urban datasets that cannot be represented in 2D [21]. In fact, the evolution of faster internet connections allowed specialists to load even more detailed datasets on desktop and mobile devices [22]. These advances allowed the testing of the integration of multiscale information from the urban scale to the architectural one, passing from urban map information to building description in the same visualization model. Most of these solutions are based on a proprietary software platform that encapsulates a ready-to-use visualization on the web, employing WebGL technologies (the same kind of libraries initially developed for VR applications).
All the technologies described below relate to the currently very popular fields of research related to Smart Cities or even more so the concept of Digital Twins (DT). Firstly, DT was introduced in industrial engineering, and relates to the creation of a digital replica of the product, with a real-time connection between the virtual and physical model [23]. The concept was recently extended to architectural and urban planning domains aiming to analyze and manage living environments with the support of heterogenous data, integration data, and analytics techniques [24].
The integration of heterogeneous datasets to manage, such as point clouds, geospatial datasets, 3D models, Building Information Models (BIM) is useful today to manage the urban environment at multiscale levels. The innovation and challenges include searching for the most suitable approaches in fusing multiscale ad multiresolution datasets that allow for analyzing urban environments from the building architectural scale to the urban context. It is necessary to acquire and integrate information in such a way that experts from multiple domains can benefit and apply it in a variety of fields, such as urban planning, quality of life, public services, transport, pollution analysis, energy efficiency, etc. To perform multiscale analysis, visualization in the same context of different 2D and 3D information that compose 3D city models is needed. A recent challenge in this field is the development of 3D city models (Figure 1) that integrate diverse datasets including BIM 3D models, GIS geospatial, text or other semantic information needed for detailed analysis, VR and AR visualization. Recent software solutions provided the first interesting results of integrated visualization for the management of multiscale levels of detail with BIM-GIS integration [25], and geomatic acquisition–VR integration [26].
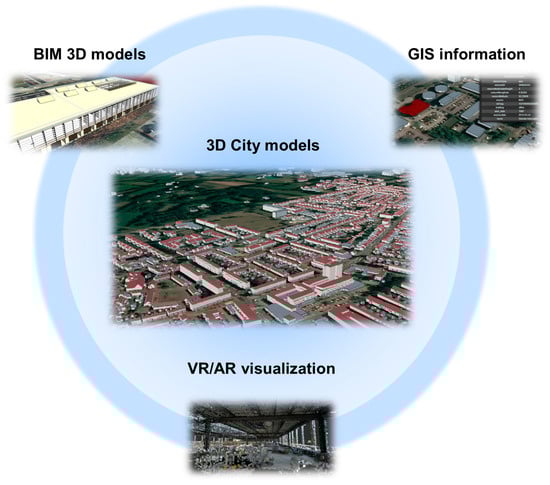
Figure 1.
The relationship between 3D city models, BIM, GIS, and VR/AR technologies. Source: author.
Even though there have been many web visualization advances, there are still many challenges facing heterogeneous data integration based only on open-source solutions. In fact, the real-time digital visualization of the urban environment still represents a challenge due to the complexity of geometric information that is aimed to be displayed and to the cost of the property software solutions used for managing urban datasets.
In this context, the adoption of open-source strategies is useful for the development of solutions that can be widely adopted from specialists that want to make DT experimentations avoiding property software costs. At the same time, the choice to share the dataset on the web, employing WebGL technologies, represents opportunities towards digital twinning since it allows the real-time web visualization of the decision-making support for every kind of device.
Therefore, this research proposes a solution based on WebGIS open-source platform visualizing urban datasets in a multiscale mode. We integrated heterogeneous datasets (point clouds, IFC model, 3D meshes, 2.5D and 2D geospatial models) in a geospatial environment. The case study is the new building of the ITC Faculty of Geoinformation—University of Twente, located in Enschede (the Netherlands), and its surrounding area. The next section will show the research carried out in this field, then the methods and datasets used for the development of the platform will be described, and, in the end, the results and new open scenarios will be explained, followed by conclusions and discussion.
3. Materials and Methods
The 3D web platform proposed in this research has been developed for a case study located in Enschede, The Netherlands. The area of the campus and, more particularly, the new building of the ITC Faculty of Geoinformation—University of Twente (ITCnb) in Enschede were explored (Figure 2). The building has two floors and internal open spaces meant to be for green areas.
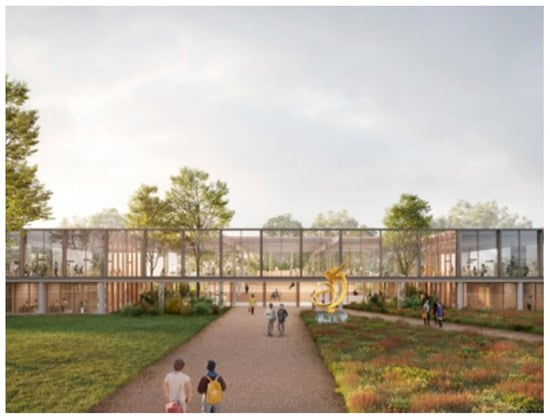
Figure 2.
Preliminary design of the new ITC building [44].
The web platform developed for this research is based on an open-source structure employing WebGL JavaScript libraries (Cesium.js and Three.js) and is stored in the Apache web server. The visualization platform allows common users to directly explore the building on the web at different scale levels, loading different datasets.
The workflow followed to produce the platform is composed of a chain of necessary operative stages (Figure 3), from the dataset retrieval to the final test of the platform on the web. The first part consists of acquiring the dataset that concerns the 3D navigation environment, composed of digital elaborations of urban survey datasets and remote WebGIS acquisition from open databases. The next phase consists of generating and customizing the 3D web visualization framework stored in a web server, based on WebGL open-source technologies and developed in an Html format. The third step includes the 3D models creation. In this step, the initial point cloud data acquired from the terrestrial laser scanning system must be simplified significantly in order to be smoothly visualized on the web. In this phase, the level of simplification should be balanced with the quality of the web browsing navigation. Once the 3D models have been loaded into the 3D web environment, it is necessary to develop a proper control system according to the visualization scale to obtain and properly link the different visualization scales. In the end, the 3D web navigation platform should be tested with different web browsers on desktop and mobile devices.
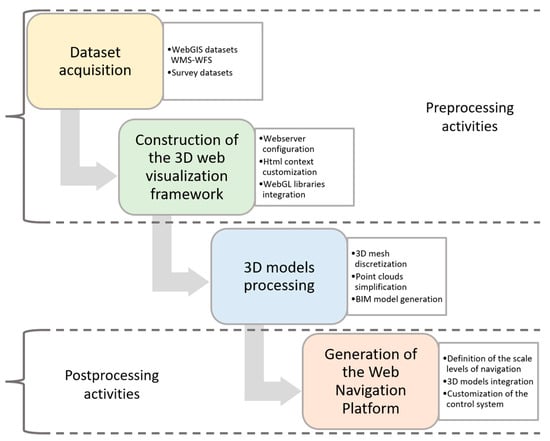
Figure 3.
Platform development workflow. The dataset acquisition and the construction of the 3D web visualization framework constitute the preprocessing steps. Instead, the generation of the Web Navigation Platform regards the post-processing activities, when the processed 3D models are integrated inside it. Source: author.
3.1. Used Dataset
The heterogeneous geospatial dataset visualized in the platform includes a variety of data captured with different acquisition techniques, scales, and qualities. The included dataset starts from the 3D volumes of the buildings and ends with the point cloud visualization of the indoor environments of the ITCnb.
The dataset was catalogued according to the corresponding Level of Detail (LoD) to visualize in the web navigation. The web visualization, as shown below, is divided in different webpages according to a proper scale of navigation.
Each scale of navigation contains the respective 3D models visualization in the platform, according to the appropriate quality of visualization. As shown below, every navigation scale could contain more LoD visualizations.
In detail, the geospatial dataset included in the web navigation models (Table 1) is composed by the following:

Table 1.
The composition of the dataset.
- LoD1—3D volumes of buildings provided by Open Street Map (OSM) servers, highlighting the elements according to the type of building (residential, office, commercial, industrial).
- LoD2—3D obj models of the neighborhood’s buildings, with a roof detailed shape, loaded from the 3D Bag dataset (https://3dbag.nl/en/viewer; accessed on 22 January 2023) shared online by TU Delft and stored in our server.
- The Image-Based Model (IBM) of the ITCnb, composed of a 3D textured mesh of the manufact, generated by photogrammetric reconstruction based on SfM algorithms.
- The Point Cloud Building Model (PCBM) of the ITCnb, composed of a point cloud of the indoor and outdoor environment of the entire building and based on in situ survey operation.
- The BIM model of the ITCnb, based on IFC standard.
3.2. Data Processing
Considering the 3D models of the neighborhoods (Figure 4), the dataset is not modified but still maintains the LoD and the aspect of the original source. Instead, the datasets that are for the new ITC building (the 3D textured mesh, the point cloud, and the BIM model) needed further processing to be visualized on the web navigation platform.
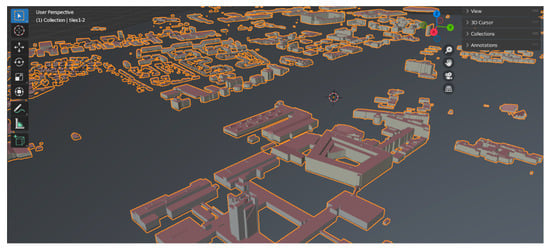
Figure 4.
The 3D obj models of the neighborhood’s buildings loaded from the 3D BAG dataset. Source: author.
The 3D textured mesh generated from a photogrammetric reconstruction needs to be a light model to be loaded quickly into the globe-based environment. For this reason, the number of polygons that compose the mesh must be reduced to 10–20 megabytes in this process, according to the WebGL loading capabilities of the most common web browsers [13].
Considering the point cloud, it represents the most complex dataset to manage and simplify to be loaded and visualized in the WebGL context due to the huge number of points that compose the entire survey of the building (Figure 5). It was necessary to apply noise reduction algorithms [45] using Cloud Compare open-source software to decimate the dimension of the cloud and, simultaneously, guarantee a realistic visualization on web browsing. In particular, two LoDs of point cloud were developed: a general Point Cloud Building Model (gPCBM) that includes the overall visualization of the ITCnb, and a detailed Point Cloud Building Model (dPCBM) of every floor of the building.
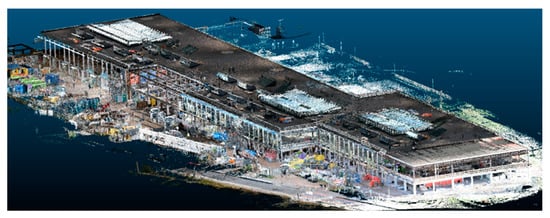
Figure 5.
The general point cloud of the new ITC building. Source: author.
The BIM model of the ITCnb, designed and kindly provided by the architects of the building, was converted into IFC format to be loaded into the web navigation platform.
3.3. Structure of the Platform
The navigation platform is composed of different parts in correspondence with different visualization scales (Table 2). For each scale, a proper navigation system has been developed with the other ones, as seen below.
Table 2.
The dataset used for each scale of navigation.
The choice of the dataset to be visualized for each navigation system depends on the different needs required in the web navigation of the urban environment. In detail, three scales of visualization (Figure 6) have been developed in this research:
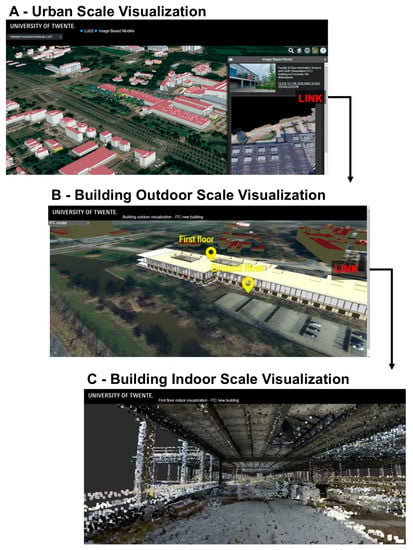
Figure 6.
The connection between the different scales of visualization: (A) the urban-scale visualization; (B) the building outdoor-scale visualization; (C) The building indoor-scale visualization. Source: author.
- An urban-scale visualization developed with the WebGIS navigation model based on Cesium.js libraries inside an Html template. This scale allows navigation in a geospatial 3D globe space, integrating the surrounding environment near the building. At this scale, the dataset involved in the visualization consists of the LoD1, LoD2, and the image-based model of the ITCnb. The images have been acquired by Phantom 4 UAV during the time of the building construction. The LoD1 is provided by the Open Street Map Service, which offers the possibility to load the 3D shapes of the buildings with the semantic information associated. We used this service to insert a thematic visualization of the urban dataset regarding the neighborhoods of the ITCnb, dividing the 3D shapes according to the function of the building. In the same scale of navigation, we inserted the LoD2, allowing a more detailed visualization of the urban environment, adding the roof information to the dataset. In the same WebGIS navigation, we loaded a basic textured mesh of the ITC building integrated with a popup link description.
- A building outdoor-scale visualization using three.js libraries inside an Html template, allow orbiting around the ITCnb and exploring the environments from a bird’s-eye view. In this 3D web navigation, users can navigate nearer the building or explore a further LoD of the ITC building. In fact, the dataset involved includes colored point clouds and the BIM model of the building. The dataset includes the low-detailed general point cloud of the entire ITC building and its surroundings; the medium-detailed point cloud of the ground zero of the ITC building; the medium-detailed point cloud of the first floor of the ITCnb; and the BIM model of the ITC building loaded in IFC standard.
- A building indoor-scale visualization developed with three.js libraries inside and an Html template, where users can explore the indoor environment of the ITCnb. The dataset employed in this scale of navigation model consists of high-detailed point clouds of the ITCnb. A first-person navigation model has been developed to allow users to explore the indoor environment in a realistic way.
4. Results
The web navigation platform is composed of a system of Html pages connected by links that allow users to switch between different levels of detail and different navigation modes. Every Html page contains JavaScript strings that call WebGL opensource JavaScript libraries located in the Apache webserver (Figure 7). The system starts with an Html page that contains a globe-based WebGIS visualization of the ITCnb and its neighborhoods, with the LoD1, LoD2, and Image-Based Model visualization. This visualization is generated employing Cesium.js libraries, stored in the Apache webserver and linked in the Html page using JavaScript strings. The globe-based visualization contains a link in correspondence with the ITC new building that opens a popup window with a brief description of the structure, its sample visualization, and a connection with the Point Cloud Building Model visualization.
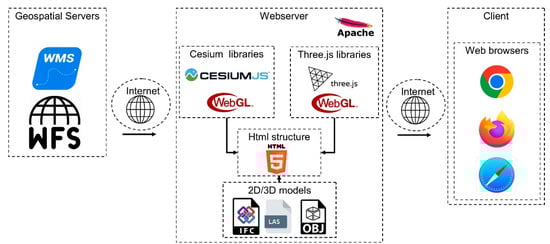
Figure 7.
The structure of the web navigation platform. Source: author.
Following the link visualized in the popup window, users have the possibility to orbit around the Point Cloud Building Model and the 3D BIM model of the IFC building. This navigation Html page is generated employing Three.js libraries. The libraries are stored in the Apache webserver and are linked to the Html page with JavaScript strings. This visualization model is linked with further Html pages that allow users to navigate inside the building with first-person navigation. The first-person navigation Html pages are still developed with Three.js libraries, allowing the detailed visualization of the environments of the building.
The web navigation platform developed is stored in the webserver of the University of Twente. It is possible to freely access the web navigation platform using the VPN connection of the university. Web navigation is available with the most common web browsers (chrome, firefox, safari) and using desktop and mobile devices. A short preview of the system is available online [46].
The starting visualization shows the 3D globe navigation model at urban-scale visualization in Enschede in the zone close to the ITCnb. In this scale of visualization, it is possible to select LoD1, LoD2, and the IBM of the ITCnb. A drop-down menu allows for highlighting the buildings according to the type of building, switching between residential, office, commercial, and industrial ones. Activating the image-based model’s visualization, a yellow popup appears in correspondence with the building. The popup activates a window that shows a preview visualization and a brief description of the building with a link connected with the outdoor scale visualization of the construction (Figure 5).
The outdoor-scale visualization allows web navigation with a bird-flight view around the ITCnb, visualizing the general point cloud of the construction. In this scale of visualization, a drop-down menu allows for switching between the ground-floor and the first-floor point clouds and the BIM model of the building. This level of scale allows users to achieve a complex vision of the building with the possibility to explore the distribution of the spaces inside and outside. In this scale of visualization, there are sprite elements that link to the first-person navigation of each indoor environment.
The indoor-scale of visualization leads the user inside the building with the possibility to explore the environment with first-person navigation. In this visualization scale, the 3D model shown is a well-detailed point cloud limited to the boundaries of the shown environment.
5. Discussion
The research involved in this work offers a possible low-cost strategy to implement 3D city models integration on the web, with the possibility of adding further modules to be real-time visualized. In fact, the use of a simple Html structure allows for integrating coding strings that can activate real-time acquisitions and database connections and visualizing them in the 3D WebGIS structure. This solution is very useful to visualize the heterogeneous 3D models dataset online with no property software requirement. Unfortunately, some aspects, regarding the dimensional limitations of the dataset to load in the web navigation experience, remain a challenge. For instance, the point clouds need to be strongly simplified to be loaded in the platform, and it represents the kind of data that needs more elaborations to be integrated in the 3D visualization; however, at the same time, its integration allows the exploitation of TLS or GeoSlam datasets [47,48]. In the future, new solutions based on tiling operations can solve part of these limitations. At the same time, the BIM model integration inside a GIS environment is an operation that needs an accurate study on BIM-to-GIS data conversion [49]. Comparing our work with other similar recent interesting studies where software combinations allowed for exploration of GIS—BIM integrations on the web [50,51,52], the studied solution represents a good strategy to integrate different kinds of datasets in a 3D WebGIS urban environment, and because it is totally based on an open-source solution, could be implemented in the future with further modules and represents the environment in a multiscale approach. In fact, in recent times, national governments invested massive technological efforts in these kind of solutions [53,54].
6. Conclusions and Open Scenarios
The developed solution shows how WebGL technologies could be exploited to create 3D Digital Twins of complex urban environments navigable on the web. Connecting different visualization scales in the same structure, generating an indoor/outdoor navigation model, and integrating datasets with different LoD are possible. Furthermore, this solution, also employing Cesium.js libraries, locates the urban-scale model in a geospatial environment on a 3D WebGIS, allowing the possible integration of Web Map Services (WMS) and Web Feature Services (WFS) datasets for further vector and raster data integration. The employment of JavaScript libraries inside an Html structure offers the possibility to integrate JSON-based script in real-time, connected with sensor networks’ real-time data acquisitions. The developed platform could be considered the reference structure for the construction of DT regarding urban and architectural datasets, avoiding property software implementations. Furthermore, the possibility of visualizing the DT on the web from any kind of device enhances the digital twinning capabilities.
The framework developed in this work could be exploited in future research for civil engineering digitalization, where DT can be applied to infrastructures, buildings, archaeological sites, facilities, etc. [55]. In fact, in the future, the integration of sensor network datasets (with real-time data acquisition) into the 3D web navigation platform will allow the digital twinning of urban and architectural datasets on the web. In this way, specialists and municipalities will be able to connect and visualize urban and architectural digital twins employing open-source solutions, while saving costs. The limited dimensions of the 3D dataset for visualization still remain a challenge, but there are early experimentations in this field that are starting to solve this problem [56].
Further implementations will be on the connection of the web digital twin visualization with a Relational Database Management System (RDBMS), offering the possibility to integrate Python calculation modules to visualize into the platform. These solutions will be the further step of this research, aimed at the development of open-source solutions for digital twinning on the web.
Author Contributions
Conceptualization, M.L.G. and M.K.; methodology, M.L.G. and M.K.; software, M.L.G. and M.K.; validation, M.L.G. and M.K.; formal analysis, M.L.G. and M.K.; investigation, M.L.G. and M.K.; resources, M.L.G. and M.K.; data curation, M.L.G. and M.K.; writing—original draft preparation, M.L.G. and M.K.; writing—review and editing, M.L.G. and M.K.; visualization, M.L.G. and M.K.; supervision, M.L.G. and M.K. All authors have read and agreed to the published version of the manuscript.
Funding
This research received no external funding.
Data Availability Statement
ITC TWENTE Web Navigation Model Preview. Available online: https://youtu.be/By3MtcjSvdQ (accessed on 17 January 2023).
Conflicts of Interest
The authors declare no conflict of interest.
References
- Guarnieri, A.; Fissore, F.; Masiero, A.; Vettore, A. From TLS survey to 3d solid modeling for documentation of built heritage: The case study of Porta Savonarola in Padua. Int. Arch. Photogramm. Remote Sens. Spatial Inf. Sci. 2017, 42, 303–308. [Google Scholar] [CrossRef]
- Crosilla, F.; Beinat, A.; Fusiello, A.; Maset, E.; Visintini, D. Basics of Terrestrial Laser Scanning. In Advanced Procrustes Analysis Models in Photogrammetric Computer Vision. CISM International Centre for Mechanical Sciences; Springer: Cham, Switzerland, 2019; Volume 590. [Google Scholar] [CrossRef]
- Ebolese, D.; Dardanelli, G.; Lo Brutto, M.; Sciortino, R. 3d Survey in Complex Archaeological Environments: An Approach by Terrestrial Laser Scanning. Int. Arch. Photogramm. Remote Sens. Spatial Inf. Sci. 2018, 42, 325–330. [Google Scholar] [CrossRef]
- Nocerino, E.; Menna, F.; Remondino, F.; Toschi, I.; Rodríguez-Gonzálvez, P. Investigation of indoor and outdoor performance of two portable mobile mapping systems. In Videometrics, Range Imaging, and Applications XIV; SPIE Press: Bellingham, WA, USA, 2017; p. 103320I. [Google Scholar] [CrossRef]
- Karam, S.; Vosselman, G.; Peter, M.; Hosseinyalamdary, S.; Lehtola, V. Design, Calibration, and Evaluation of a Backpack Indoor Mobile Mapping System. Remote Sens. 2019, 11, 905. [Google Scholar] [CrossRef]
- Kuželka, K.; Slavík, M.; Surový, P. Very High Density Point Clouds from UAV Laser Scanning for Automatic Tree Stem Detection and Direct Diameter Measurement. Remote Sens. 2020, 12, 1236. [Google Scholar] [CrossRef]
- Ebolese, D.; Lo Brutto, M.; Dardanelli, G. UAV Survey for the Archaeological Map of Lilybaeum (Marsala, Italy). Int. Arch. Photogramm. Remote Sens. Spatial Inf. Sci. 2019, XLII-2/W11, 495–502. [Google Scholar] [CrossRef]
- Alsadik, B.; Gerke, M.; Vosselman, G. Visibility analysis of point cloud in close range photogrammetry. ISPRS Ann. Photogramm. Remote Sens. Spatial Inf. Sci. 2014, 2, 9–16. [Google Scholar] [CrossRef]
- Berra, E.F.; Peppa, M.V. Advances and Challenges of UAV SFM MVS Photogrammetry and Remote Sensing: Short Review. In Proceedings of the 2020 IEEE Latin American GRSS & ISPRS Remote Sensing Conference (LAGIRS), Santiago, Chile, 21–26 March 2020; pp. 533–538. [Google Scholar] [CrossRef]
- Gonçalves, G.; Gonçalves, D.; Gómez-Gutiérrez, Á.; Andriolo, U.; Pérez-Alvárez, J.A. 3D Reconstruction of Coastal Cliffs from Fixed-Wing and Multi-Rotor UAS: Impact of SFM-MVS Processing Parameters, Image Redundancy and Acquisition Geometry. Remote Sens. 2021, 13, 1222. [Google Scholar] [CrossRef]
- Pepe, M.; Alfio, V.S.; Costantino, D. UAV Platforms and the SfM-MVS Approach in the 3D Surveys and Modelling: A Review in the Cultural Heritage Field. Appl. Sci. 2022, 12, 12886. [Google Scholar] [CrossRef]
- Scianna, A.; La Guardia, M. Survey and Photogrammetric Restitution of Monumental Complexes: Issues and Solutions—The Case of the Manfredonic Castle of Mussomeli. Heritage 2019, 2, 774–786. [Google Scholar] [CrossRef]
- Scianna, A.; La Guardia, M. Processing of 3D Models for Networking of CH in Geomatics. In R3 in Geomatics: Research, Results and Review; R3GEO 2019. Communications in Computer and Information Science; Springer: Cham, Switzerland, 2020; Volume 1246. [Google Scholar] [CrossRef]
- Virtanen, J.-P.; Julin, A.; Handolin, H.; Rantanen, T.; Maksimainen, M.; Hyyppä, J.; Hyyppä, H. Interactive Geo-Information in Virtual Reality—Observations and Future Challenges. Int. Arch. Photogramm. Remote Sens. Spatial Inf. Sci. 2020, 44, 159–165. [Google Scholar] [CrossRef]
- Scianna, A.; Gaglio, G.F.; Grima, R.; La Guardia, M. The virtualization of CH for historical reconstruction: The AR fruition of the fountain of St. George square in Valletta (Malta). Int. Arch. Photogramm. Remote Sens. Spatial Inf. Sci. 2020, 44, 143–149. [Google Scholar] [CrossRef]
- Devaux, A.; Brédif, M.; Paparoditis, N. A web-based 3D mapping application using WebGL allowing interaction with images, point clouds and models. In Proceedings of the 20th International Conference on Advances in Geographic Information Systems (SIGSPATIAL ’12) 2012, Redondo Beach, CA, USA, 6–9 November 2012; Association for Computing Machinery: New York, NY, USA, 2012; pp. 586–588. [Google Scholar] [CrossRef]
- Scianna, A.; La Guardia, M. 3D Virtual CH Interactive Information Systems for a Smart Web Browsing Experience for Desktop PCs and Mobile Devices. Int. Arch. Photogramm. Remote Sens. Spatial Inf. Sci. 2018, 42, 1053–1059. [Google Scholar] [CrossRef]
- Delgado, J.M.D.; Oyedele, L.; Beach, T.; Demian, P. Augmented and Virtual Reality in Construction: Drivers and Limitations for Industry Adoption. J. Constr. Eng. Manag. 2020, 146, 7. [Google Scholar] [CrossRef]
- Brovelli, M.A.; Minghini, M.; Zamboni, G. Participatory GIS: Experimentations for a 3D social virtual globe. Int. Arch. Photogramm. Remote Sens. Spatial Inf. Sci. 2013, 2, 13–18. [Google Scholar] [CrossRef]
- Zlatanova, S. Toward a 3D GIS for Local Governing: A Web-Oriented Approach. In Proceedings of the 22nd Urban and Regional Data Management Symposium, Delft, The Netherlands, 11–15 September 2000; pp. V133–V140. [Google Scholar]
- Sun, J.; Mi, S.; Olsson, P.-O.; Paulsson, J.; Harrie, L. Utilizing BIM and GIS for Representation and Visualization of 3D Cadastre. ISPRS Int. J. Geo-Inf. 2019, 8, 503. [Google Scholar] [CrossRef]
- Mete, M.O.; Guler, D.; Yomralıoglu, T. Development of 3D Web GIS Application with Open Source Library. Selçuk Üniversitesi Mühendislik Bilim Teknol. Derg. 2018, 6, 818–824. [Google Scholar] [CrossRef]
- Rasheed, A.; San, O.; Kvamsdal, T. Digital Twin: Values, Challenges and Enablers From a Modeling Perspective. IEEE Access 2020, 8, 21980–22012. [Google Scholar] [CrossRef]
- Shahat, E.; Hyun, C.T.; Yeom, C. City Digital Twin Potentials: A Review and Research Agenda. Sustainability 2021, 13, 3386. [Google Scholar] [CrossRef]
- Abd, A.M.; Hameed, A.H.; Nsaif, B.M. Documentation of construction project using integration of BIM and GIS technique. Asian J. Civ. Eng. 2020, 21, 1249–1257. [Google Scholar] [CrossRef]
- Chiabrando, F.; Sammartano, G.; Spanò, A.; Spreafico, A. Hybrid 3D Models: When Geomatics Innovations Meet Extensive Built Heritage Complexes. ISPRS Int. J. Geo-Inf. 2019, 8, 124. [Google Scholar] [CrossRef]
- Biljecki, F.; Stoter, J.; Ledoux, H.; Zlatanova, S.; Çöltekin, A. Applications of 3D City Models: State of the Art Review. ISPRS Int. J. Geo-Inf. 2015, 4, 2842–2889. [Google Scholar] [CrossRef]
- Eriksson, H.; Harrie, L. Versioning of 3D City Models for Municipality Applications: Needs, Obstacles and Recommendations. ISPRS Int. J. Geo-Inf. 2021, 10, 55. [Google Scholar] [CrossRef]
- Petrova-Antonova, D.; Spasov, A. Towards a Semantic 3D Model of Sofia City. In Computational Science and Its Applications—ICCSA 2021; ICCSA 2021. Lecture Notes in Computer Science; Springer: Cham, Switzerland, 2021; Volume 12952. [Google Scholar] [CrossRef]
- Noardo, F.; Harrie, L.; Arroyo Ohori, K.; Biljecki, F.; Ellul, C.; Krijnen, T.; Eriksson, H.; Guler, D.; Hintz, D.; Jadidi, M.A.; et al. Tools for BIM-GIS Integration (IFC Georeferencing and Conversions): Results from the GeoBIM Benchmark 2019. ISPRS Int. J. Geo-Inf. 2020, 9, 502. [Google Scholar] [CrossRef]
- Floros, G.S.; Ellul, C. Loss of Information during Design & Construction for Highways Asset Management: A GEOBIM Perspective. ISPRS Ann. Photogramm. Remote Sens. Spatial Inf. Sci. 2021, 8, 83–90. [Google Scholar] [CrossRef]
- Kilsedar, C.E.; Fissore, F.; Pirotti, F.; Brovelli, M.A. Extraction and Visualization of 3D Building Models in Urban Areas for Flood Simulation. Int. Arch. Photogramm. Remote Sens. Spatial Inf. Sci. 2019, 42, 669–673. [Google Scholar] [CrossRef]
- León-Sánchez, C.; Agugiaro, G.; Stoter, J. Creation of a CityGML-Based 3D City Model Testbed for Energy-Related Applications. Int. Arch. Photogramm. Remote Sens. Spatial Inf. Sci. 2022, 48, 97–103. [Google Scholar] [CrossRef]
- Costantino, D.; Pepe, M.; Alfio, V.; Vozza, G.; Occhinegro, M. Building 3D CityGML Model and Digital Management of a Vernacular Architecture. Int. Rev. Civ. Eng. 2022, 13, 156–162. [Google Scholar] [CrossRef]
- Alattas, A.; Kalogianni, E.; Alzahrani, T.; Zlatanova, S.; van Oosterom, P. Mapping private, common, and exclusive common spaces in buildings from BIM/IFC to LADM. A case study from Saudi Arabia. Land Use Policy 2021, 104, 105355, ISSN 0264-8377. [Google Scholar] [CrossRef]
- Boguslawski, P.; Zlatanova, S.; Gotlib, D.; Wyszomirski, M.; Gnat, M.; Grzempowski, P. 3D building interior modelling for navigation in emergency response applications. Int. J. Appl. Earth Obs. Geoinf. 2022, 114, 103066, ISSN 1569-8432. [Google Scholar] [CrossRef]
- Scianna, A.; La Guardia, M. Globe Based 3D GIS Solutions for Virtual Heritage. Int. Arch. Photogramm. Remote Sens. Spatial Inf. Sci. 2018, 171–177. [Google Scholar] [CrossRef]
- Liu, A.H.; Ellul, C. Quantifying Geometric Changes in BIM-GIS Conversion. ISPRS Ann. Photogramm. Remote Sens. Spatial Inf. Sci. 2022, X-4/W2-2022, 185–192. [Google Scholar] [CrossRef]
- Khawte, S.S.; Koeva, M.; Gevaert, C.M.; Oude Elberink, S.; Pedro, A.A. Digital Twin Creation for Slums in Brazil Based on UAV Data. Int. Arch. Photogramm. Remote Sens. Spatial Inf. Sci. 2022, XLVIII-4/W4-2022, 75–81. [Google Scholar] [CrossRef]
- Lehner, H.; Dorffner, L. Digital geoTwin Vienna: Towards a Digital Twin City as Geodata Hub. PFG 2020, 88, 63–75. [Google Scholar] [CrossRef]
- La Guardia, M.; Koeva, M.; D’Ippolito, F.; Karam, S. 3D Data Integration for Web Based Open Source WebGL Interactive Visualisation. Int. Arch. Photogramm. Remote Sens. Spatial Inf. Sci. 2022, XLVIII-4/W4-2022, 89–94. [Google Scholar] [CrossRef]
- La Guardia, M.; D’Ippolito, F.; Cellura, M. Construction of a WebGIS Tool Based on a GIS Semiautomated Processing for the Localization of P2G Plants in Sicily (Italy). ISPRS Int. J. Geo-Inf. 2021, 10, 671. [Google Scholar] [CrossRef]
- Scianna, A.; Gaglio, G.F.; La Guardia, M. Structure Monitoring with BIM and IoT: The Case Study of a Bridge Beam Model. ISPRS Int. J. Geo-Inf. 2022, 11, 173. [Google Scholar] [CrossRef]
- University of Twente—Preliminary Design On-Campus ITC Building. Available online: https://www.utwente.nl/en/news/2020/5/608726/preliminary-design-on-campus-itc-building (accessed on 9 December 2022).
- Noise Filter. Available online: https://www.cloudcompare.org/doc/wiki/index.php/Noise_filter (accessed on 17 January 2023).
- ITC TWENTE Web Navigation Model Preview. Available online: https://youtu.be/By3MtcjSvdQ (accessed on 17 January 2023).
- Kulawiak, M.; Kulawiak, M.; Lubniewski, Z. Integration, Processing and Dissemination of LiDAR Data in a 3D Web-GIS. ISPRS Int. J. Geo-Inf. 2019, 8, 144. [Google Scholar] [CrossRef]
- Lercari, N.; Jaffke, D.; Campiani, A.; Guillem, A.; McAvoy, S.; Delgado, G.J.; Bevk Neeb, A. Building Cultural Heritage Resilience through Remote Sensing: An Integrated Approach Using Multi-Temporal Site Monitoring, Datafication, and Web-GL Visualization. Remote Sens. 2021, 13, 4130. [Google Scholar] [CrossRef]
- Zhu, J.; Wu, P. Towards Effective BIM/GIS Data Integration for Smart City by Integrating Computer Graphics Technique. Remote Sens. 2021, 13, 1889. [Google Scholar] [CrossRef]
- Einaudi, D.; Spreafico, A.; Chiabrando, F.; Della Coletta, C. From Archive Documentation to Online 3D Model Visualization of No Longer Existing Structures: The Turin 1911 Project. Int. Arch. Photogramm. Remote Sens. Spatial Inf. Sci 2020, 43, 837–844. [Google Scholar] [CrossRef]
- Ward, Y.; Morsy, S.; El-Shazly, A. GIS-BIM Data Integration Towards a Smart Campus. In Design and Construction of Smart Cities; JIC Smart Cities 2019. Sustainable Civil Infrastructures; Springer: Cham, Switzerland, 2021. [Google Scholar] [CrossRef]
- Dursun, İ.; Varlık, A.; Ayyıldız, E. Integration and Web-Based Presentation of 3D City Models and BIM Data: The Case of the Köyceğiz Campus. Int. Arch. Photogramm. Remote Sens. Spatial Inf. Sci. 2022, 43, 513–519. [Google Scholar] [CrossRef]
- Dou, S.Q.; Zhang, H.H.; Zhao, Y.Q.; Wang, A.M.; Xiong, Y.T.; Zuo, J.M. Research on Construction of Spatio-Temporal Data Visualization Platform for GIS and BIM Fusion. Int. Arch. Photogramm. Remote Sens. Spatial Inf. Sci. 2020, 42, 555–563. [Google Scholar] [CrossRef]
- Alva, P.; Biljecki, F.; Stouffs, R. Use Cases for District-Scale Urban Digital Twins. Int. Arch. Photogramm. Remote Sens. Spatial Inf. Sci. 2022, XLVIII-4/W4-2022, 5–12. [Google Scholar] [CrossRef]
- Jiang, F.; Ma, L.; Broyd, T.; Chen, K. Digital twin and its implementations in the civil engineering sector. Autom. Constr. 2021, 130, 103838, ISSN 0926-5805. [Google Scholar] [CrossRef]
- Zhan, W.; Chen, Y.; Chen, J. 3D Tiles-Based High-Efficiency Visualization Method for Complex BIM Models on the Web. ISPRS Int. J. Geo-Inf. 2021, 10, 476. [Google Scholar] [CrossRef]
Disclaimer/Publisher’s Note: The statements, opinions and data contained in all publications are solely those of the individual author(s) and contributor(s) and not of MDPI and/or the editor(s). MDPI and/or the editor(s) disclaim responsibility for any injury to people or property resulting from any ideas, methods, instructions or products referred to in the content. |
© 2023 by the authors. Licensee MDPI, Basel, Switzerland. This article is an open access article distributed under the terms and conditions of the Creative Commons Attribution (CC BY) license (https://creativecommons.org/licenses/by/4.0/).