Article

Using Pre-Fire High Point Cloud Density LiDAR Data to Predict Fire Severity in Central Portugal

by
José Manuel Fernández-Guisuraga
1,2,* and
Paulo M. Fernandes
1,3
1
Centro de Investigação e de Tecnologias Agroambientais e Biológicas, Universidade de Trás-os-Montes e Alto Douro, 5000-801 Vila Real, Portugal
2
Department of Biodiversity and Environmental Management, Faculty of Biological and Environmental Sciences, University of León, 24071 León, Spain
3
ForestWISE—Collaborative Laboratory for Integrated Forest and Fire Management, Quinta de Prados, 5001-801 Vila Real, Portugal
*
Author to whom correspondence should be addressed.
Remote Sens. 2023, 15(3), 768; https://doi.org/10.3390/rs15030768
Submission received: 28 December 2022 / Revised: 23 January 2023 / Accepted: 24 January 2023 / Published: 29 January 2023
(This article belongs to the Section Forest Remote Sensing)

Abstract

:
The wall-to-wall prediction of fuel structural characteristics conducive to high fire severity is essential to provide integrated insights for implementing pre-fire management strategies designed to mitigate the most harmful ecological effects of fire in fire-prone plant communities. Here, we evaluate the potential of high point cloud density LiDAR data from the Portuguese áGiLTerFoRus project to characterize pre-fire surface and canopy fuel structure and predict wildfire severity. The study area corresponds to a pilot LiDAR flight area of around 21,000 ha in central Portugal intersected by a mixed-severity wildfire that occurred one month after the LiDAR survey. Fire severity was assessed through the differenced Normalized Burn Ratio (dNBR) index computed from pre- and post-fire Sentinel-2A Level 2A scenes. In addition to continuous data, fire severity was also categorized (low or high) using appropriate dNBR thresholds for the plant communities in the study area. We computed several metrics related to the pre-fire distribution of surface and canopy fuels strata with a point cloud mean density of 10.9 m−2. The Random Forest (RF) algorithm was used to evaluate the capacity of the set of pre-fire LiDAR metrics to predict continuous and categorized fire severity. The accuracy of RF regression and classification model for continuous and categorized fire severity data, respectively, was remarkably high (pseudo-R2 = 0.57 and overall accuracy = 81%) considering that we only focused on variables related to fuel structure and loading. The pre-fire fuel metrics with the highest contribution to RF models were proxies for horizontal fuel continuity (fractional cover metric) and the distribution of fuel loads and canopy openness up to a 10 m height (density metrics), indicating increased fire severity with higher surface fuel load and higher horizontal and vertical fuel continuity. Results evidence that the technical specifications of LiDAR acquisitions framed within the áGiLTerFoRus project enable accurate fire severity predictions through point cloud data with high density.

Graphical Abstract

1. Introduction

Fire is a recurrent disturbance process in the terrestrial ecosystems of many Mediterranean-type climate regions of the world [1,2], including the Mediterranean Basin. In this region, wildfires are considered a natural disturbance [3] that has not only shaped the historical mosaic-like patterns of regeneration [4,5,6,7,8], but also the species fitness of fire-prone ecosystems for millennia [5,9,10,11]. Under historical fire regimes, plant species fitness favors the resilience of vegetation communities after recurrent disturbances [3,12,13]. However, wildfires are perceived as disasters in the Mediterranean Basin when natural and cultural values, infrastructures and human lives are lost [14], which happens particularly under altered fire disturbance regimes [15]. Flammable vegetation has and is building up in the landscapes of the western Mediterranean Basin because of the land use and land cover changes experienced in the last decades [16,17,18], such as the abandonment of traditional agriculture and livestock farming in rural areas and human-made afforestation [7]. In this context, the quantity and connectivity of flammable fuels have promoted a significant increase in fire frequency [16,19]. Together with fuel build-up, extreme climate events (e.g., droughts and heat waves), related to anthropogenic climate warming [20], have increased the probability of extreme wildfire events characterized by large burned areas and a significant proportion of the surface burned at high severity [17,21].
Fire severity, defined as the ecological changes experienced in a burned area with respect to the pre-fire scenarios [22], and operationally measured in the field as the loss of aboveground and belowground organic matter [23,24], is one of the fire regime attributes with the most important implications to post-fire ecosystem response [25,26], together with fire frequency [27,28]. Severe wildfires may not only negatively impact the resilience of Mediterranean vegetation communities [11,29], promoting transitions to alternate stable states [30] and increasing the reburning potential of vegetation legacies [16], but also promote post-fire soil erosion processes [31] and unprecedented impacts on ecosystem functioning and service provisioning [32]. In this context, the assessment of fire severity spatial variability within extreme wildfire events is of utmost importance. Conventionally, fire severity is assessed in the field by measuring individual indicators such as forest floor [33] or canopy consumption [34], percent change in basal area [35], minimum tip diameter of burned branches [36], or using indices that integrate several attributes such as the Composite Burn Index (CBI) [23] or the Geometrically structured CBI (GeoCBI) [37]. However, fire severity assessments exclusively based on field measurements are not functional to obtain wall-to-wall (i.e., spatially explicit) fire severity estimates in large burned landscapes [38,39]. Remote sensing-based techniques are nowadays a reliable approach to assess fire severity over extensive areas with high spatial thoroughness and representativeness [40]. Most of the studies in the remote sensing literature use for this purpose spectral indices computed from passive optical data, such as the differenced Normalized Burn Ratio (dNBR) [41], the Relative dNBR (RdNBR) [35] or the Relativized Burn Ratio (RBR) [42]. The computation of the dNBR index is the most widely used approach and a methodological reference for the fire severity initial assessment [43]. Moreover, strong relationships have been found between the dNBR and field-based fire severity data worldwide [43,44,45,46], and the dNBR is more consistent among different passive optical sensors [47].
Wall-to-wall fire severity assessments through remote sensing techniques allow the development of predictive models of landscape susceptibility to severe wildfires [14,48,49]. These models align with forest management needs for identifying not only priority areas for pre-fire management [50], but also the most feasible actions to reduce high fire severity likelihood based on model outputs [49,51]. Fire severity is controlled by a combination of bottom-up (fuel type, fuel structure and landscape configuration) and top-down (fire weather) environmental drivers [52,53,54]. However, fuel characteristics play an essential role in the severity pattern at fine spatial scales [49], particularly in heterogeneous landscapes [55], and of all those influences are the only ones that can be managed to reduce fire severity [56].
Remote sensing techniques are the most feasible choices to estimate pre-fire fuel load and structural characteristics related to the likelihood of high fire severity as compared to field sampling campaigns [57]. For this purpose, pre-fire field data from national forest inventories are constrained by availability with enough spatial coverage [49,56], and passive optical data by the reflectance occlusion of lower strata under a dense canopy [58,59]. In this sense, active remote sensing data acquired by airborne Light Detection and Ranging (LiDAR) sensors are usually the preferred option for describing pre-fire fuel structure at plot and stand levels [39,48,49,60,61] because of their high sensitivity to the distribution and quantity of vegetation leaves and branches throughout the vertical profile of the canopy to the forest floor [62].
Nationwide LiDAR programs are the only pre-fire LiDAR data source available to estimate ab initio the potential contribution of pre-fire fuel load to fire severity and develop predictive models of extreme wildfire behavior. However, national LiDAR datasets typically offer low point cloud density that may be inadequate to accurately assess fuel structure throughout the entire vegetation profile [57]. For instance, Spanish nationwide LiDAR data acquired by the Spanish National Plan for Aerial Orthophotography (PNOA) have a mean point density of 0.5 m−2 and 0.5–4 m−2 in the first and second national coverage, respectively.
The Portuguese Permanent Forest Fund through the Institute for the Conservation of Nature and Forests (ICNF) funded a pilot LiDAR project (áGiLTerFoRus) from April 2020 to June 2021 for seven territories in Portugal, covering a total of 45,000 ha. The project aimed to evaluate the feasibility of a national airborne LiDAR coverage with balanced economic and technical specifications to provide a high enough point density (around 10 m−2) to support fuel and forest management needs. Accordingly, this study explores, for the first time, the potential of LiDAR data from the áGiLTerFoRus project to predict wildfire severity from the characterization of pre-fire fuel structure within the perimeter of a mixed-severity wildfire occurred one month after the LiDAR flight in a pilot area dominated by pine and eucalypt forest and shrubland. We considered continuous and categorized fire severity data that align with land management needs. Aside from the novelty related to the evaluation of LiDAR data from a project related to the potential development of a nationwide airborne LiDAR program, there are few studies in the literature [48,49,63] identifying fuel drivers of fire severity by using specific fuel structure metrics with ecological sense, rather than coarse vegetation type maps [64] or a battery of strong intercorrelated LiDAR metrics which prevent the development of robust models [65]. Also, this is one of the few studies in which pre-fire LiDAR data are collected close to the fire alarm date [48], so the assessment of the potential performance of LiDAR data from the áGiLTerFoRus project to predict fire severity is expected to be realistic.
We expect that the specifications of the áGiLTerFoRus LiDAR dataset, particularly the high point cloud density, will allow for effective characterization of the quantity and distribution of pre-fire fuel in several strata [66,67,68] and predict satisfactorily wildfire severity. We also expect that the benefits of high point cloud density will be leveraged by ecologically relevant LiDAR metrics, such as fuel density by height bins [57], to reduce estimation uncertainty in the lower vegetation strata [69].

2. Material and Methods
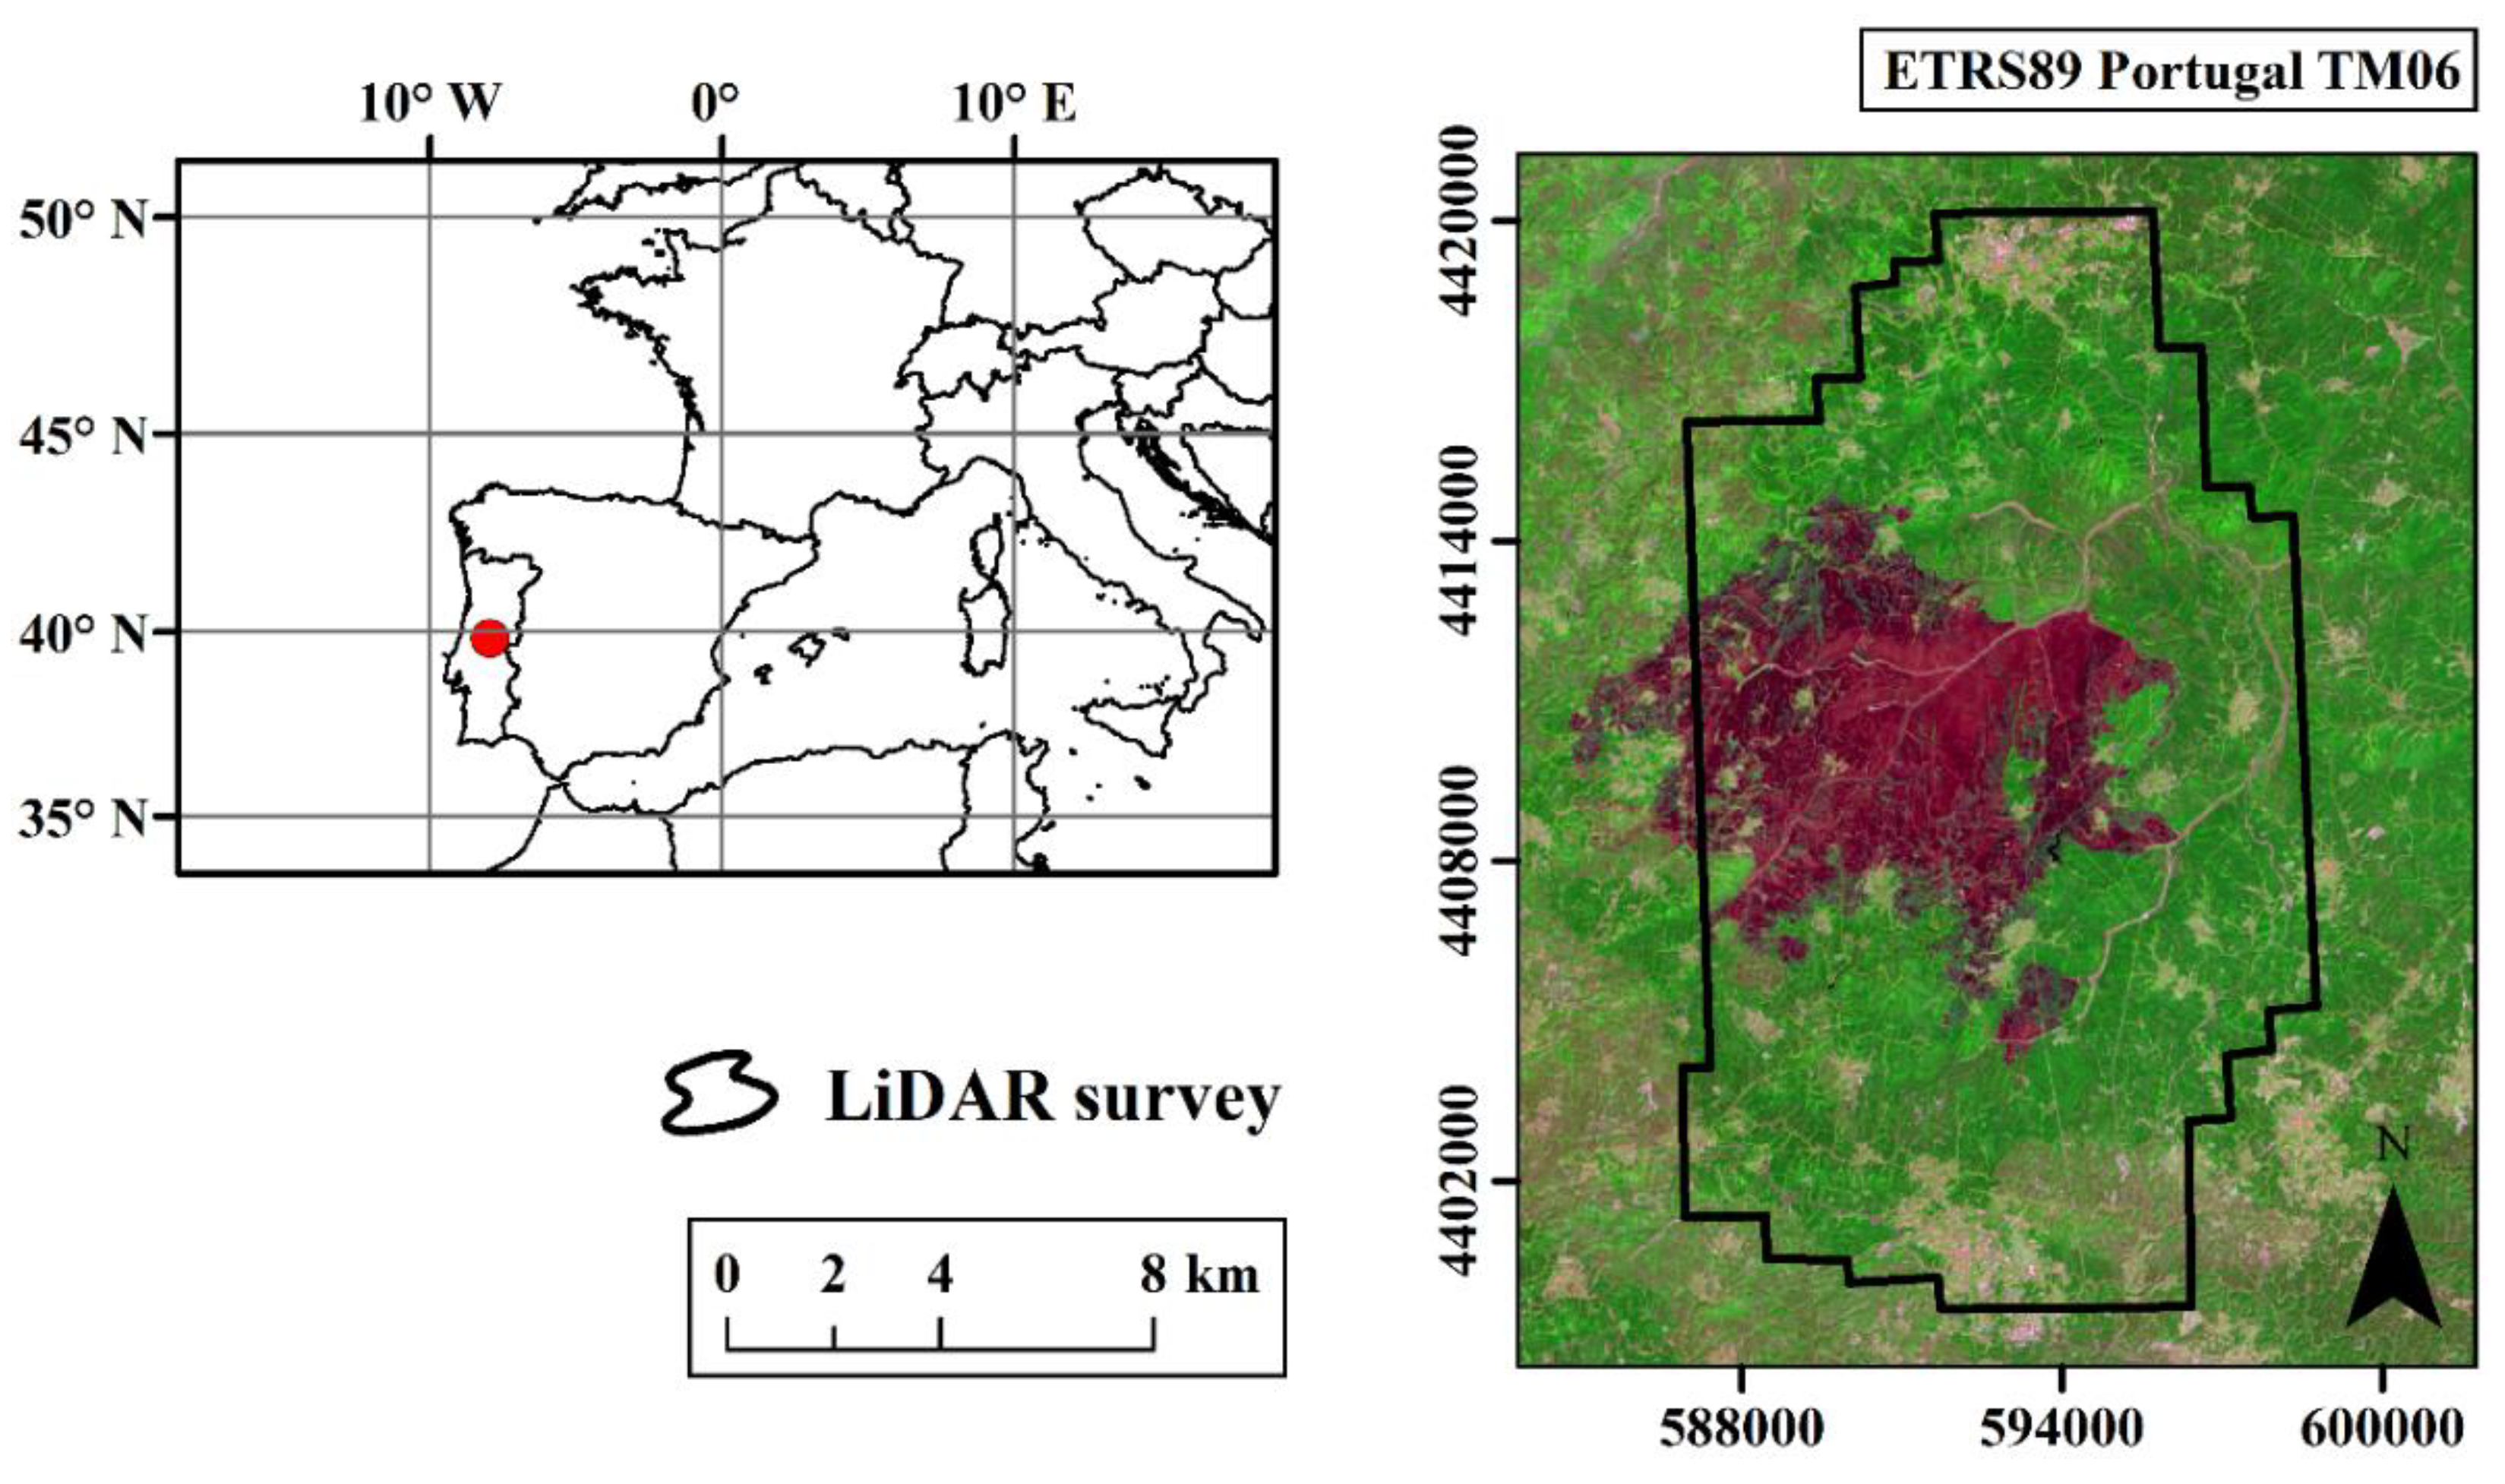
2.1. Study Site

The study site corresponds to a pilot LiDAR flight area (20,759 ha) of the áGiLTerFoRus project located in Proença-a-Nova and Oleiros municipalities within the central region of mainland Portugal (Figure 1). The fire regime of the region is characterized by low ignition density and large wildfires. A mixed-severity wildfire burned 5592 ha of forest and shrubland communities within the site between 25 and 29 July 2020, one month after the LiDAR survey. About 92% of the burned area lies within the pilot site (Figure 1). The study site is thus a perfect laboratory to evaluate the potential of pre-fire LiDAR data to support pre-fire management. Orography is characterized by mild slopes and undulated terrain at 298–1082 m above sea level. The climate is Mediterranean, with a mean annual temperature and precipitation of 12–15 °C and 1000–1300 mm for a 50-year period, respectively [70]. The wildfire developed under extreme fire weather conditions (FWI = 53), attaining a maximum hourly spread rate of 2.2 km h−1 and affected three main vegetation types: Pinus pinaster Ait. (maritime pine) stands, shrublands dominated by Cistus ladanifer L., Erica australis L. or Cytisus multiflorus (L’Hér.) Sweet, and Eucalyptus globulus Labill. (blue gum) plantations, respectively, accounting for 50.4, 23.5, and 21.1% of the burned area. Forest was relatively dense and low prior to the 2020 wildfire, reflecting natural regeneration after the 2000 and 2003 wildfires that burned the area in its entirety. None of the areas within the wildfire scar is under a conservation status and corresponds entirely to private land.

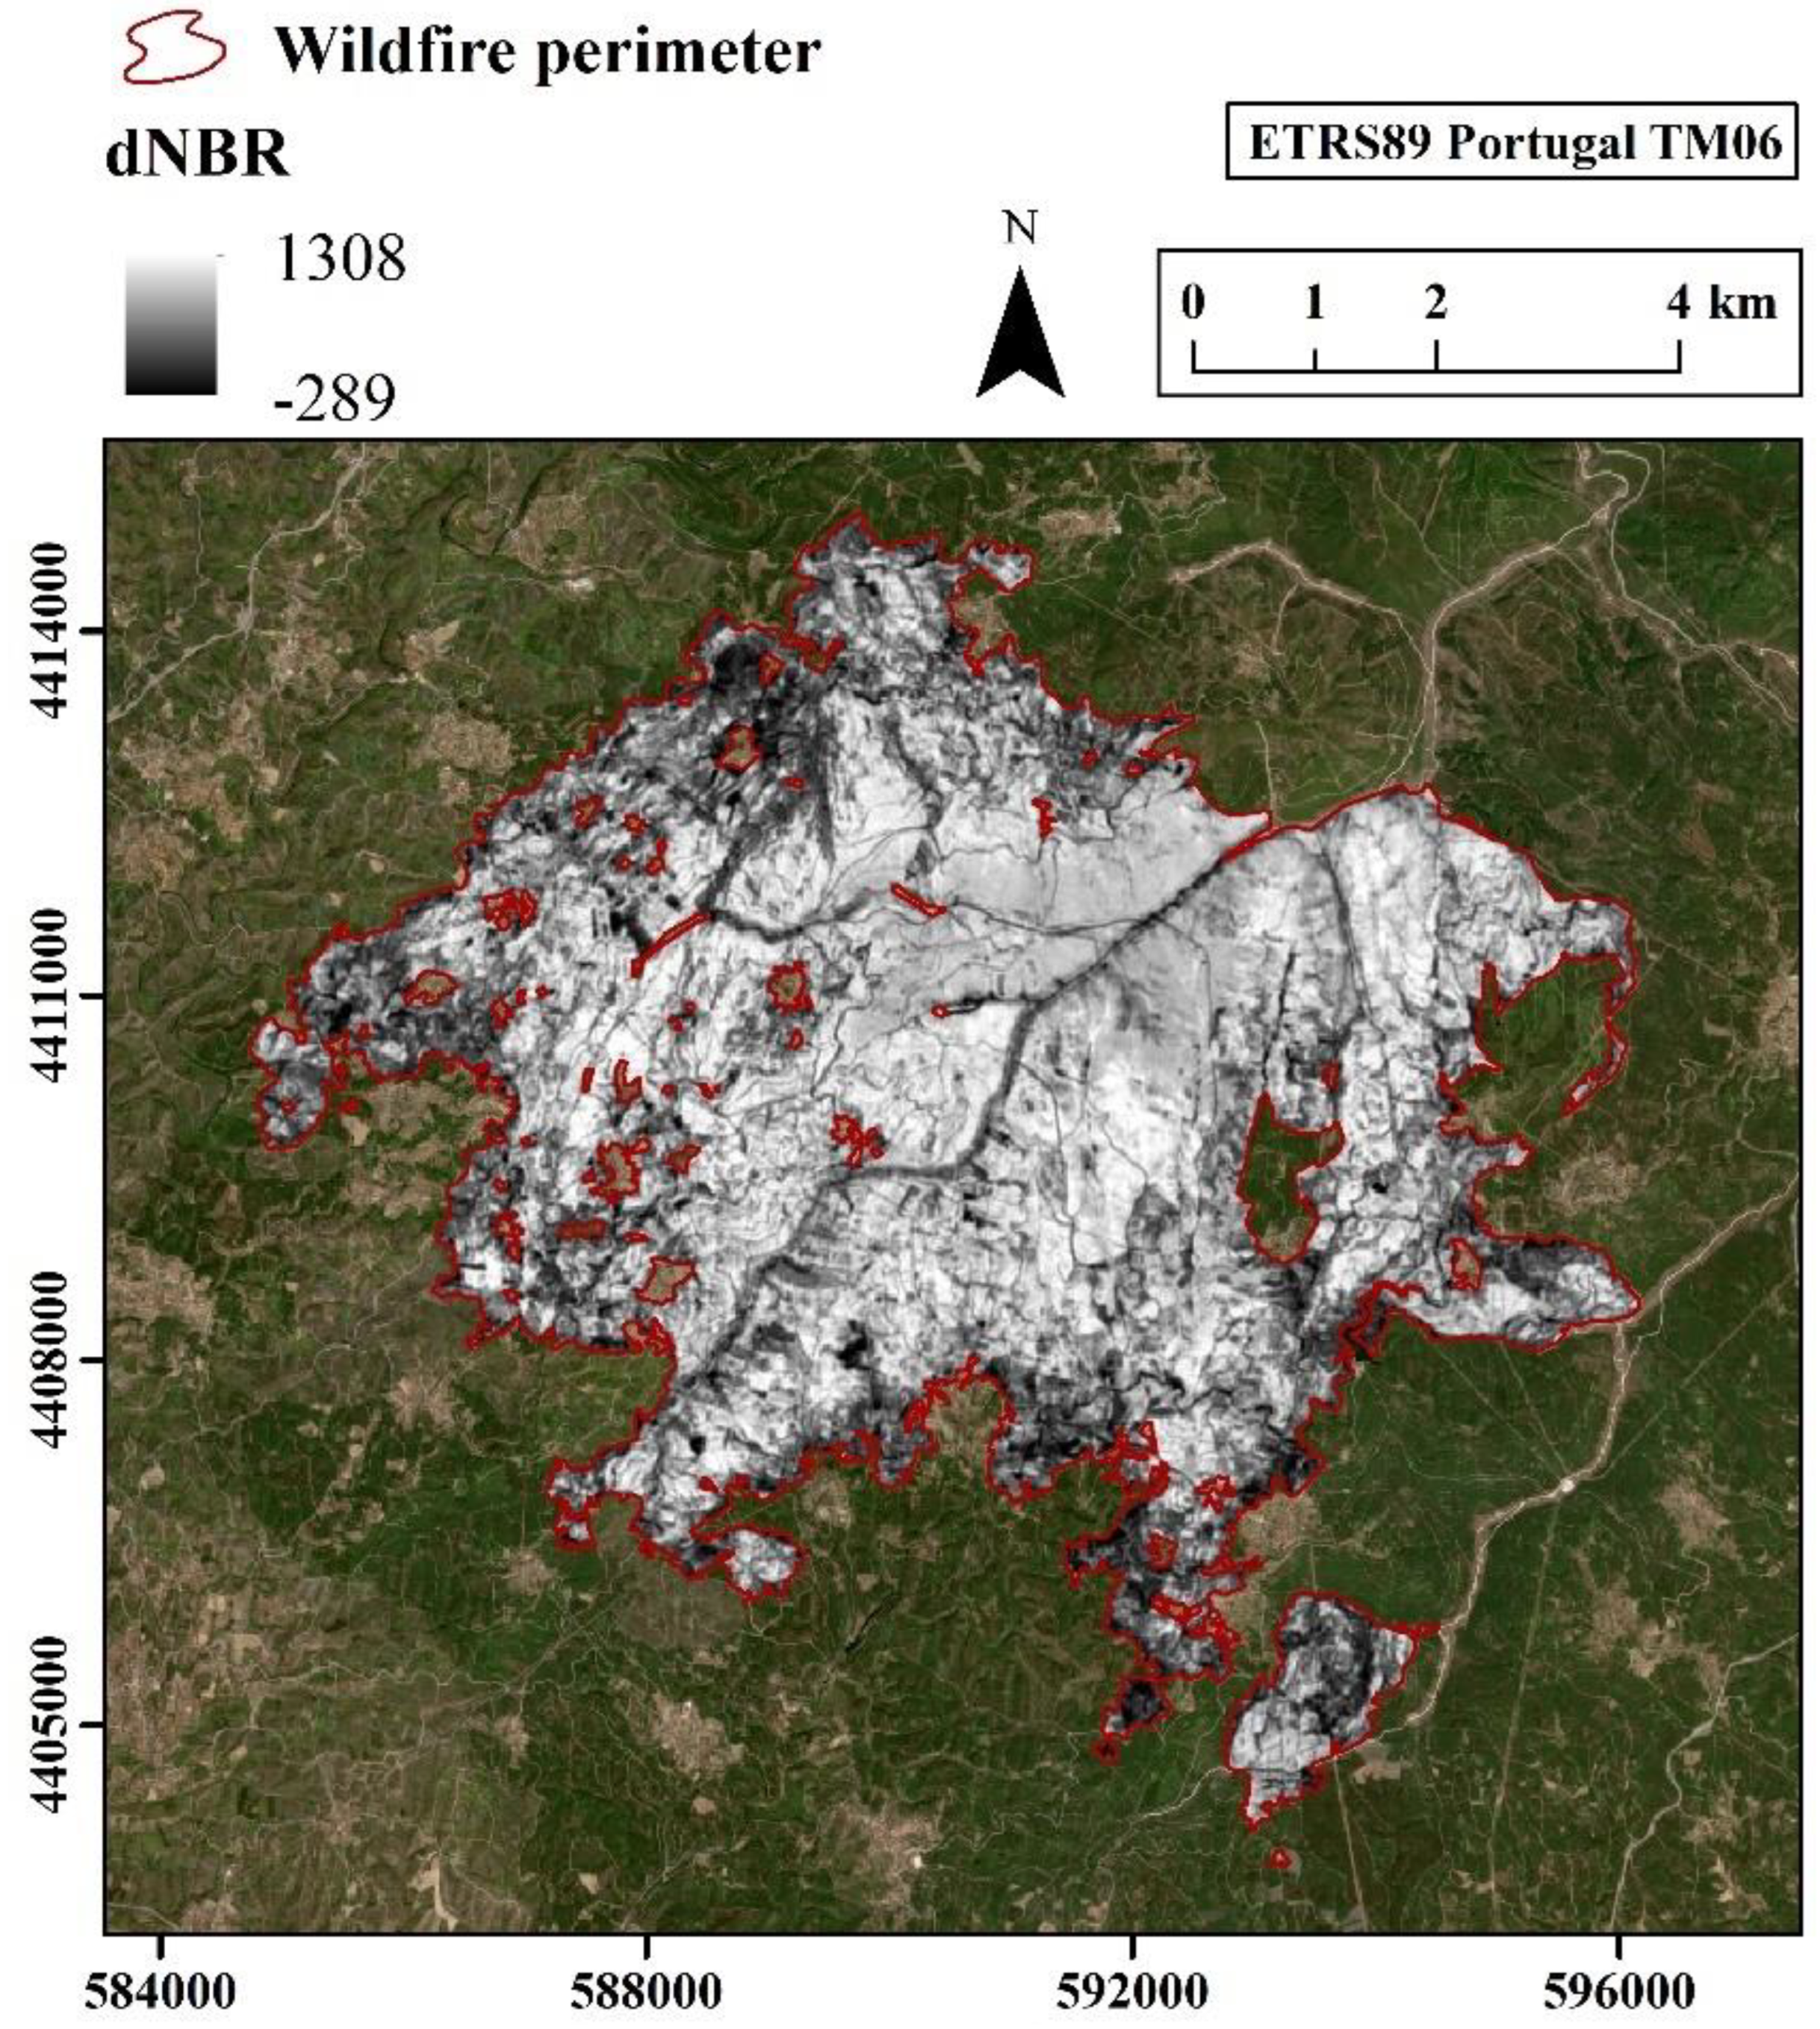
2.2. Fire Severity Assessment

Sentinel-2 is the multispectral mission from the Copernicus program of the European Space Agency (ESA) and comprises two twin satellites: Sentinel-2A and Sentinel-2B, launched on 23 June 2015 and 7 March 2017, respectively. The multispectral instrument (MSI) onboard Sentinel-2 constellation is a push-broom sensor that provides thirteen bands with varying spatial resolution over the visible (VIS), near-infrared (NIR) and short-wave infrared (SWIR) regions: four bands at 10 m, six bands at 20 m and three bands at 60 m [71].
Sentinel-2A Level 2A scenes covering the study site were downloaded from the Copernicus Open Access Hub (https://scihub.copernicus.eu/ (accessed on 25 October 2022)) for immediately pre (8 July 2020) and post-fire (27 August 2020) conditions for assessing fire severity within the intersection of the wildfire scar and the LiDAR flight. Acquisition dates were selected on the basis of cloud-free Sentinel-2 scene availability as close as possible to that of the wildfire. Level 2A is a surface reflectance (i.e., bottom-of-atmosphere) product already atmospherically corrected and orthorectified by the image provider [71]. The bands 8A (NIR) and 12 (SWIR) at 20 m spatial resolution were used to compute the dNBR index (Equations (1) and (2)) from pre- and post-fire Sentinel-2 scenes (Figure 2).
N B R = ( B a n d   8 A B a n d   12 ) / ( B a n d   8 A + B a n d   12 )
d N B R = 1000 ( N B R p r e N B R p o s t ) o f f s e t
We considered an offset term in Equation (2) that represents the mean dNBR value of homogeneous, unchanged areas outside the wildfire scar [42].
Fire severity was also categorized using dNBR thresholds based on an initial assessment of fire severity conducted by [44] in Mediterranean plant communities similar to that of the present study using the CBI [23]. Considering the CBI thresholds suggested by [72], used in many previous research [73,74] (low–moderate severity, hereafter low: CBI ≤ 2.25; and high severity: CBI > 2.25), and the linear models proposed by [74], we identified two dNBR-based fire severity categories (low: dNBR ≤ 732.6; and high: dNBR > 732.6). Although the dNBR thresholding approach used in this study was based on external field-based fire severity data, the CBI allows consistent temporal and spatial fire severity extrapolations across territories with comparable plant communities and environmental conditions [13,75].

2.3. LiDAR Data Acquisition and Processing
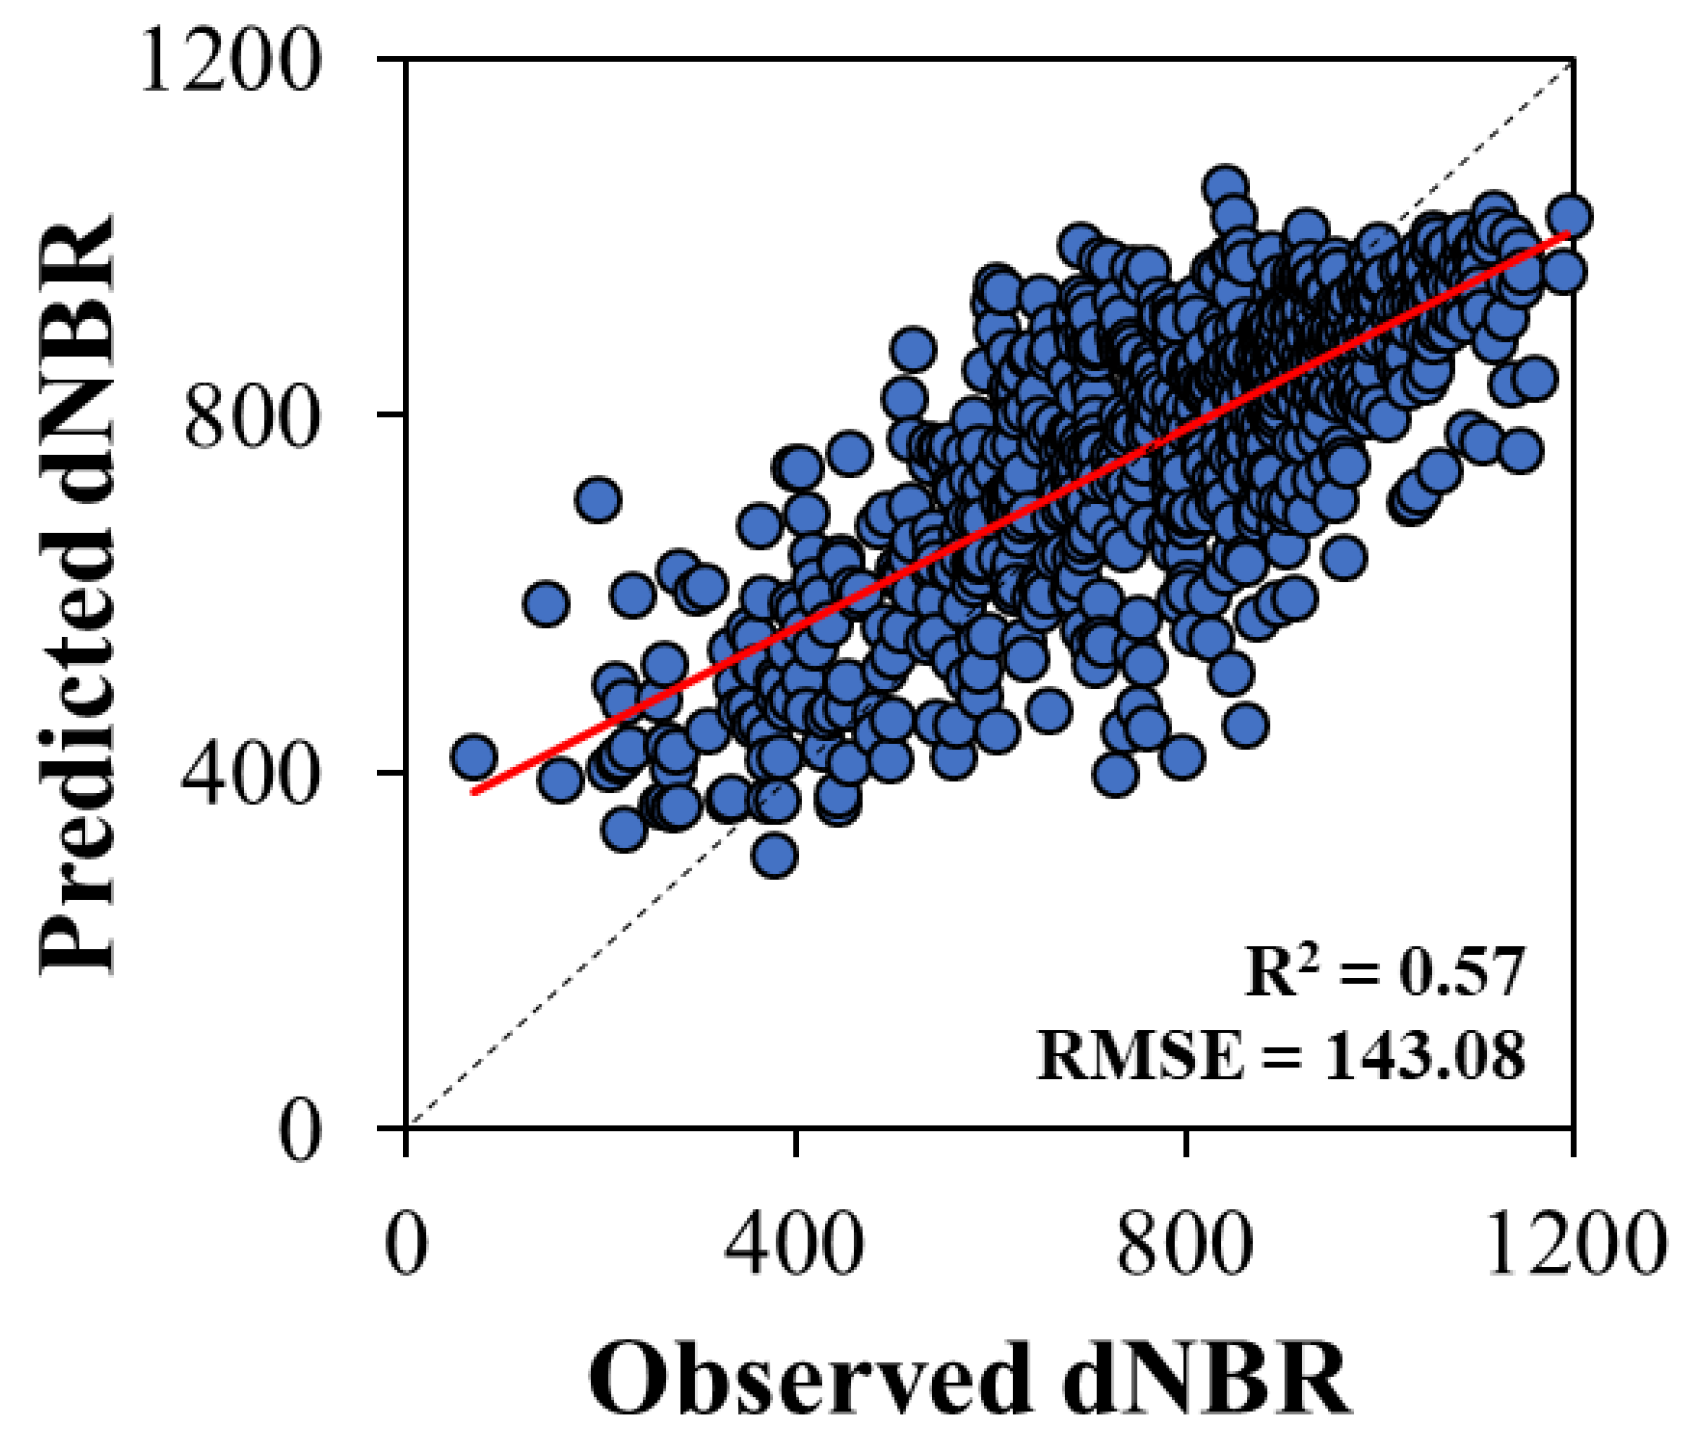
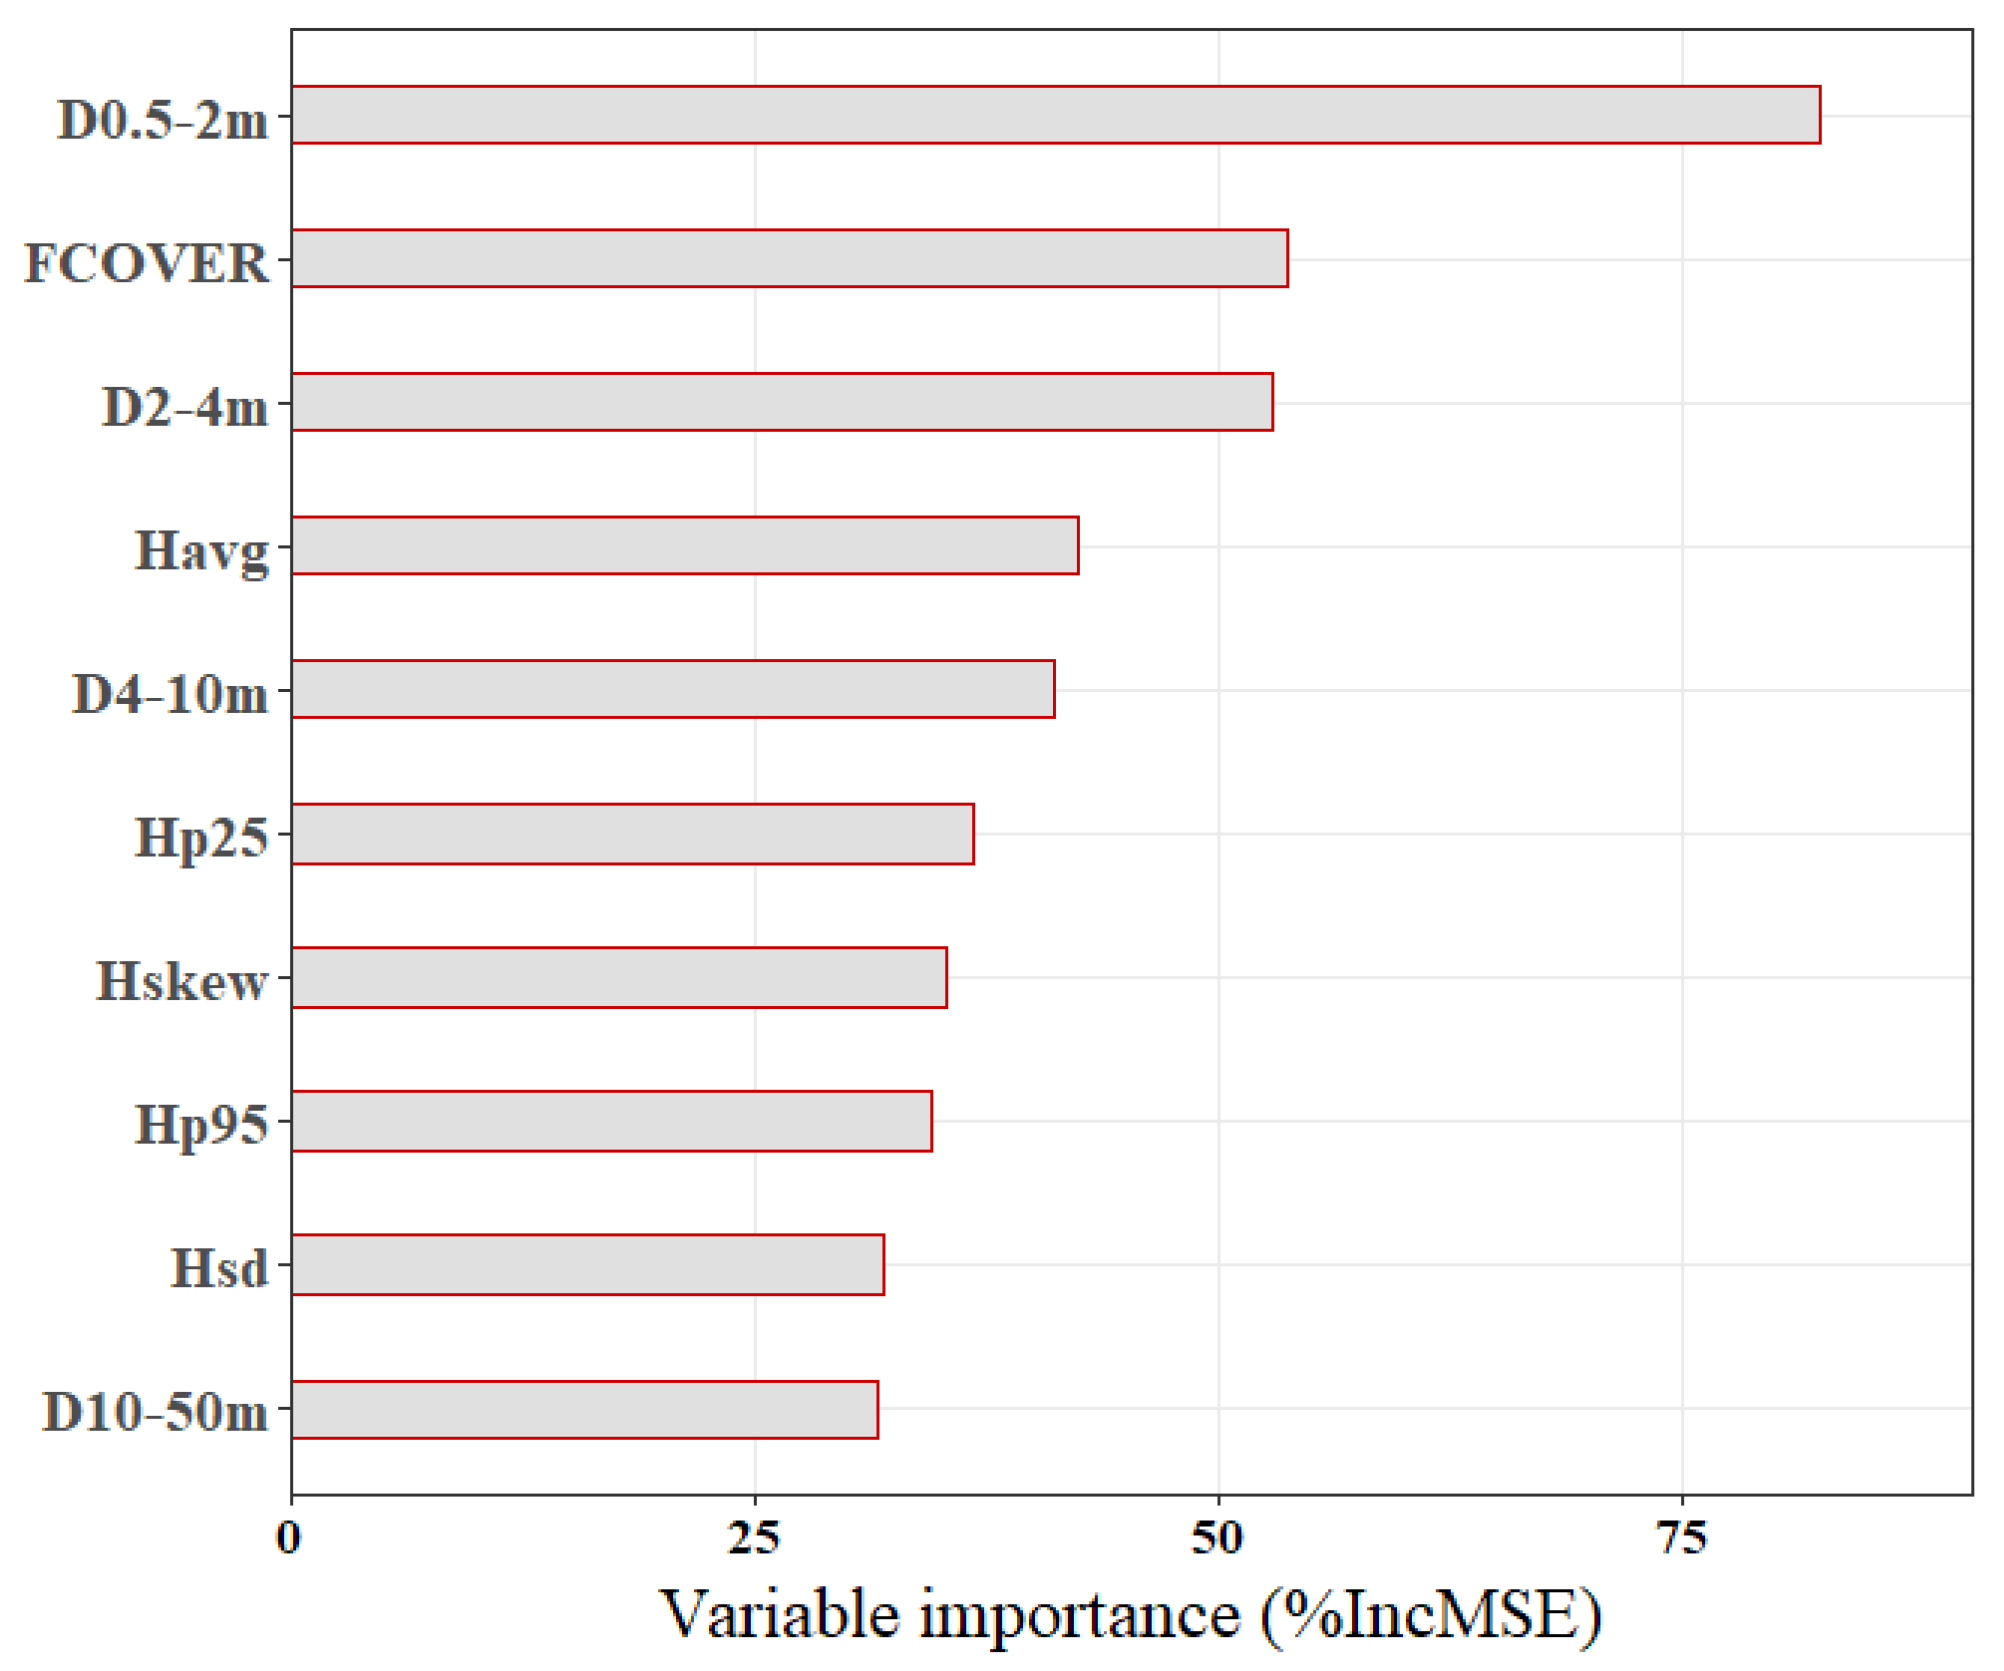
The LiDAR survey of the áGiLTerFoRus project within the study site was conducted by SPASA S.A. on 19 July 2020 using a Teledyne Optech Galaxy sensor (Teledyne Optech Inc., Vaughan, ON, Canada) onboard fixed-wing aircraft. The survey had a flight altitude of 1250 m above sea level and an average flight speed of 160 knots. The mean density of the point cloud was 10.90 m−2 (nominal pulse spacing of 0.30 m), with up to five returns per pulse. The scanning field of view was 17.5°. The RMSEZ (vertical accuracy) was lower than 0.2 m. LiDAR data were retrieved from the ICNF geocatalog (https://geocatalogo.icnf.pt/geovisualizador/agil.html (accessed on 25 October 2022)).
We used the multiscale curvature classification (MCC) algorithm [76] to classify the LiDAR point cloud into ground and non-ground returns. The MCC algorithm, designed for high-biomass forest ecosystems [76], maximizes the number of classified ground returns and increases the detail in the bare-earth surface model even in ecosystems dominated by dense, low vegetation types [77,78]. A digital terrain model (DTM) with a grid size of 1 m was computed from the classified ground returns. The LiDAR point cloud was normalized to heights relative to the ground surface through DTM subtraction. We computed several pre-fire metrics at the plot level (see Section 2.4 for plot definition) from the height-normalized LiDAR returns. A height threshold of 0.5 m was considered to remove the noise from misclassified ground returns and non-interest ground covers such as rocks or woody debris typical of Mediterranean forests [79,80]. Most forestry studies have used a height threshold of at least 0.5 m to avoid the influence of non-interest ground materials [81]. The metrics, highly related to fuel arrangement in the overstory and understory strata, comprised (Table 1): (i) average height of LiDAR returns (Havg); (ii) standard deviation of LiDAR returns (Hsd); (iii) skewness of LiDAR returns (Hskew); (iv) 25th (Hp25) and 95th (Hp95) height percentile values of LiDAR returns; (v) canopy density by height bins (D0.5–2m, D2–4m, D4–10m, D10–50m); and (vi) canopy cover (FCOVER). The considered height bins (0.5–2 m, 2–4 m, 4–10 m and >10 m) were selected to discriminate the fuel density in the near-surface and elevated layers, which can act as ladder fuels, as well as in intermediate and overstory layers, respectively [63].
The MCC-LIDAR version 2.1 [76] and US Forest Service’s FUSION version 4.40 [82] software were used to process LiDAR data.

2.4. Data Analyses

The center of one thousand dNBR pixels separated by at least 100 m were randomly sampled within the LiDAR pilot site, which were considered as plots of 10 m × 10 m to extract pre-fire LiDAR metrics and continuous/categorized fire severity data. We assume that the points are evenly distributed among plant community types. We tested for potential multicollinearity among LiDAR metrics computing bivariate Pearson correlations. A high correlation between them was dismissed (rPearson R < |0.7|).
The Random Forest (RF) [83] regression algorithm was used to disentangle the relationship between continuous fire severity, i.e., dNBR (dependent variable), and the set of LiDAR metrics at the plot level (predictors). RF is an ensemble machine learning algorithm based on the fitting of multiple classification and regression trees (CART) [84] through bootstrap aggregating techniques, which help to improve the stability and accuracy of the algorithm [85]. We chose the RF algorithm because it can properly handle potential spatial autocorrelation [85] and disclose complex, non-linear relationships between the dependent variable and predictors, as well as complex interactions among predictors [86,87]. We tuned the model parameter mtry, whereas ntree parameter was set to 2000 for ensuring stable model outcomes [88]. The RF out-of-bag error rate was used to compute the variance explained by the model (pseudo-R2) without the need to use an independent validation dataset [85,86]. The relative importance of each pre-fire LiDAR metric in the model was assessed through the increase in mean square error (%IncMSE) RF attribute. The error between observed and predicted dNBR values was evaluated using the root mean square error (RMSE). The univariate relationships between the dNBR and LiDAR metrics were examined through scatterplots and the fit of linear or quadratic models to assess their ecological significance.
Categorized fire severity data from dNBR thresholds were modeled from pre-fire LiDAR metrics through the RF algorithm adapted to supervised classification problems [83]. Model parameters of the RF classification algorithm were similar to RF regression. We evaluated variable importance using the Gini index. Classification performance was evaluated through the average confusion matrix calculated across 10-fold cross-validation resamples using the overall accuracy (OA), Kappa index, user’s accuracy (UA) and producer’s accuracy (PA) of each fire severity class. We generated partial dependence plots of high fire severity probability in a centered logit scale for each LiDAR metric.
All analyses were conducted in R [89] using the “RandomForest” [90], “caret” [91], and “pdp” [92] packages.

3. Results

Pre-fire fuel structure metrics computed from LiDAR data of the áGiLTerFoRus project revealed a satisfactory capacity to predict fire severity on a continuous scale using the RF regression algorithm (pseudo-R2 = 0.57 and RMSE = 143.05 in the dNBR scale) (Figure 3). Remarkably, the RMSE normalized from the minimum and maximum observed dNBR value was lower than 13%. LiDAR metrics describing fuel density up to 4 m in height (D0.5–2m, D2–4m) and FCOVER were the most important variables in the RF regression model (%IncMSE > 50) fitted to explain fire severity (Figure 4). In particular, D0.5–2m had a distinctively higher influence.
RF variable importance was generally consistent with the strength of the univariate linear or quadratic relationships between pre-fire LiDAR metrics and dNBR (Figure 5). All variables were significantly related to fire severity (p-value < 0.001), except for the D4–10m metric (p-value = 0.36). Surprisingly, this variable was ranked in the RF model as the fifth most important. The R2 of the univariate model fits ranged from 0 to 0.25, with the strongest relationships observed for FCOVER (R2 = 0.19), D0.5–2m (R2 = 0.25) and D2–4m (R2 = 0.23). FCOVER, Hskew, D0.5–2m, and D2–4m metrics featured a direct relationship with fire severity. Most of the relationships were non-linear (Figure 5).
The classification in low and high fire severity categories using pre-fire LiDAR-derived fuel metrics achieved an OA of 81% and a Kappa index of 0.61 (Table 2). PA and UA values for each fire severity category were balanced and consistent with OA (>75%), but the highest values were reached for the high fire severity class. The five most important variables in the RF classification model (Figure 6) were the same as in RF regression model with continuous fire severity data.
Based on the logit contribution of pre-fire LiDAR metrics to the high fire severity class likelihood (Figure 7), the existence of critical thresholds for most of the variables can be determined. In this sense, the following pre-fire fuel structural characteristics in the plant communities led to an increased probability of high fire severity: (i) FCOVER values higher than 0.5; (ii) fuel densities greater than 20–30% in strata up to 10 m in height (D0.5–2m, D2–4m, D4–10m); (iii) Hp25 and Hp95 height percentile values lower than 5 m and 15 m, respectively; (iv) positive height skewness (Hskew); (v) Havg and Hsd lower than 10 m and 5 m, respectively; and (vi) fuel density close to zero in the higher strata (D10–50m).

4. Discussion

Wall-to-wall prediction of pre-fire fuel structural characteristics conducive to high fire severity is essential to provide integrated insights for implementing pre-fire management strategies designed to mitigate fire severity in fire-prone plant communities [14,48,49,93]. In this context, we evaluated, for the first time, the potential of high point cloud density LiDAR data from the áGiLTerFoRus project to characterize the quantity and distribution of pre-fire fuel and predict wildfire severity. Our results confirm, as we initially hypothesized, that the computed LiDAR metrics from this dataset, related to the fuel distribution in several strata, were able to predict fire severity satisfactorily.
The accuracy of the RF regression model for continuous fire severity data is remarkably high (pseudo-R2 = 0.57) considering that only fuel-related variables are included as fire severity predictors, i.e., we focused only on vegetation characteristics that can be handled by pre-fire management. Fuel structure is only one of the many drivers (e.g., fire weather, fuel type and availability, landscape configuration) that potentially contribute to variation in fire severity [53,54,94,95,96,97]. This suggests that LiDAR data from the áGiLTerFoRus project are reliably measuring the fuel structural attributes that shape fire behavior [98].
LiDAR-derived fuel metrics computed from the Spanish national dataset with low point cloud density were used to predict fire severity with the RF algorithm in a maritime pine community of western Spain similar to that of the present study [63]. Although the authors also considered topography, fire history and weather variables, with a well-known, high contribution to fire severity in these communities [48,55], they achieved a pseudo-R2 of 0.42. Using the same approach in Aleppo pine communities (Pinus halepensis Mill.) in eastern Spain, [86] attained a pseudo-R2 of 0.47. [48] found that pre-fire fuel variables computed from low-density LiDAR metrics were important fire severity predictors even under extreme fire weather in eastern Spain, with pseudo-R2 values around 0.4; when including pre-fire vegetation composition and burning conditions in boosted regression tree models, the pseudo-R2 raised to around 0.7. Using LiDAR data with a moderate point cloud density (4 m−2), [99] computed pre-fire fuel-related metrics, together with landscape configuration, fire history and weather variables, to predict fire severity in eucalypt forests of southeastern Australia, achieving pseudo-R2 values lower than 0.4. Canopy bulk density estimates computed from LiDAR returns in several height bins were used to predict fire severity in Pinus rigida Mill. and Quercus spp. forests of the northwestern United States, achieving a R2 of 0.42 [100]. Alternatives to airborne LiDAR such as terrestrial laser scanning (TLS) may improve the accuracy of predictive fire severity models based on pre-fire vegetation structure. TLS typically offers a much higher point density and thus more detailed information than airborne LiDAR collections about fuel structure in the lower strata [101], precisely where low- to moderate-severity fire effects tend to concentrate [102]. However, compared to airborne LiDAR, the area coverage of TLS is small [103]. Although methods have been developed to use TLS as an operational fuel hazard observation technology [104], wall-to-wall assessments over large areas are not feasible. In this sense, future research in fire severity behavior should address the use of mobile laser scanning (MLS), a new remote sensing technique that has not much been considered in forestry applications [105] and wildfire science [106].
The high prediction accuracy of fire severity achieved in our study relying exclusively on pre-fire fuel structural characteristics may be associated with the inclusion of LiDAR density metrics by height bins in the modeling scheme, often disregarded in remote sensing-based fire research despite their ecological relevance [107], together with the high density of the LiDAR point cloud as compared to previous national airborne LiDAR datasets. First, aggregating LiDAR returns into height bins reveals more valuable information about fuel distribution underneath the canopy than discrete metrics [69]. Second, high point cloud density data are mandatory to reduce the estimation uncertainty of the forest floor and understory fuel loadings through density metrics by leveraging the increased proportion of laser pulses penetrating the canopy strata [57].
Our results highlight the synergies between different LiDAR metrics for predicting fire severity on a continuous scale. This can be inferred from the relatively low, but homogeneous accuracies (R2 = 0.17 ± 0.04) of the univariate linear model fits and the considerably higher accuracy (pseudo-R2 = 0.57) of the RF regression model, capable of capturing complex interactions within the range of variation of different predictors, and complex relationships with the dependent variable [87]. The latter can also explain the ranking of the D4–10m metric as the fifth most important variable in the RF model and its lack of significance in the univariate model. In addition, D4–10m metric should not be as important as surface (D0.5–2m) fuel load and structure and ladder fuels (D2–4m) since these are the ones that determine surface fire intensity and play a major role in the transition to crown fire [108]. This is particularly relevant in the case of low stands, which dominate the study area, with a low distance between the surface fuels and canopy fuel strata [109].
In line with continuous fire severity, categorized data obtained from the dNBR thresholding approach were also successfully predicted from LiDAR-based fuel metrics using the RF algorithm, not only with consistent OA (81%) and PA/UA (>75%) values for low and high fire severity classes, but also with the same importance pattern of predictors as in the continuous fire severity model. Higher PA and UA values were obtained for the high fire severity class than for the low class, which is common in the literature using passive optical data [110,111]. Although, to the best of our knowledge, there are no studies predicting categorized fire severity data from pre-fire LiDAR fuel metrics, this may be attributed to the low and high magnitude of fire effects that define the inherently complex nature of areas burned at moderate severity [35], considered here within the low-moderate fire severity category. Nonetheless, attaining low classification errors for the high fire severity class is a priority in identifying target pre-fire management areas [50].
The contributions of the most important pre-fire fuel metrics in RF models calibrated from continuous and categorized fire severity data (FCOVER, D0.5–2m, D2–4m, Havg) are ecologically coherent regarding how fire severity is shaped in forest and shrubland, and it illustrates the need to understand the fuel distribution in the stand, not just the total amount of fuels [100]. FCOVER metric is strongly associated with horizontal fuel continuity [112], density metrics closely resemble the distribution of fuel loads and canopy openness per strata [57,113], and Havg is related to the mean canopy height/stand-age [49,114]. Younger forest stands with very high fuel cover and vertical connectivity, as indicated by FCOVER and canopy density per strata up to 4 m in height, respectively, were associated with high fire severity, consistent with ecological expectations. Indeed, dense surface fuels and low canopy base induce high crowning potential as a combined outcome of high surface fire intensity and sufficiently high vertical continuity [109], resulting in high fire severity [115], while denser canopies increase the likelihood of active crowning and rate of spread [116]. Horizontal fuel continuity contributes to an increase in the size of patches burned at high fire severity [117]. Additionally, trees in young stands are usually less fire-resistant [48,118] and their low canopy height (and low canopy base height as measured by Hp25 metric) [57] are precisely related with low fuel strata gap and ground to canopy wildfire transitions [56]. In shrublands, increased cover and vertical connectivity have also been shown to promote high-severity fires [49], particularly with fine dead fuel accumulation close to the ground as a consequence of high canopy density and lower light availability [119]. Collectively, our results suggest that surface fuel treatments are more relevant than canopy fuel treatments to reduce fire severity, consistent with pyrosilviculture recommendations in forest stands [120]. The reduction of fuel continuity and the increase of landscape heterogeneity by creating age mosaics should be a priority in shrublands [121,122].
The predictive capacity and non-linear relationships evidenced in this study between LiDAR-based fuel metrics and fire severity in RF models, supported by ecological expectations, have profound implications for defining potential fuel treatment thresholds in pre-fire decision-making processes. Thus, LIDAR data with national coverage at a high point cloud density can then be used by land managers to identify high fuel hazard locations and prioritize adequate fuel reduction treatments. The evidenced non-linear relationships, also found by [63], could be attributed to the small variation in canopy consumption (i.e., fire severity) beyond a certain threshold of pre-fire fuel metrics [57,123]. For instance, canopy density higher than 20% in the strata up to 4 m in height and canopy base lower than 5 m may already induce a transition to crown fire where the highest potential fire severity is reached [124,125].

5. Conclusions

We evaluated, for the first time, the feasibility of airborne LiDAR data with high point density from the Portuguese áGiLTerFoRus pilot project to predict fire severity in fire-prone landscapes. This evaluation is thus essential for the potential development of a nationwide airborne LiDAR program to support pre-fire management needs. Contrary to most studies, pre-fire LiDAR data used in this study was acquired close to the fire date, so the assessment is as realistic as possible. The technical specifications of the LiDAR data acquisitions framed within the project enable remarkably accurate fire severity predictions through characterization of the pre-fire fuel quantity and distribution from point cloud data at high density. Considering that fuel structure is only one of the many drivers that potentially contribute to variation in fire severity, LiDAR data from the áGiLTerFoRus project are reliably measuring the fuel structural attributes that shape fire behavior. Our results suggest that the deployment of LIDAR programs with national coverage at high point cloud density may provide added value regarding fire severity prediction at the plot scale to support pre-fire management needs.

Author Contributions

Conceptualization, P.M.F., J.M.F.-G.; Formal analysis, J.M.F.-G.; Investigation, P.M.F., J.M.F.-G.; Methodology, J.M.F.-G.; Writing—original draft, J.M.F.-G.; Writing—review and editing, P.M.F. All authors have read and agreed to the published version of the manuscript.

Funding

This study was financially supported by the Portuguese Foundation for Science and Technology in the frame of project UIDB/04033/2020. José Manuel Fernández-Guisuraga was supported by a Ramón Areces Foundation postdoctoral fellowship.

Informed Consent Statement

Not applicable.

Data Availability Statement

The datasets analyzed for this study are available from the corresponding author on reasonable request.

Conflicts of Interest

The authors declare no conflict of interest.

References

  1. Pausas, J.G.; Verdú, M. Plant persistence traits in fire-prone ecosystems of the Mediterranean Basin: A phylogenetic approach. Oikos 2005, 109, 196–202. [Google Scholar] [CrossRef] [Green Version]
  2. Welch, K.R.; Safford, H.D.; Young, T.P. Predicting conifer establishment post wildfire in mixed conifer forests of the North American Mediterranean-climate zone. Ecosphere 2016, 7, e01609. [Google Scholar] [CrossRef]
  3. Pausas, J.G.; Llovet, J.; Rodrigo, A.; Vallejo, R. Are wildfires a disaster in the Mediterranean basin?—A review. Int. J. Wildland Fire 2008, 17, 713–723. [Google Scholar] [CrossRef] [Green Version]
  4. Rodrigo, A.; Retana, J.; Picó, F.X. Direct regeneration is not the only response of Mediterranean forests to large fires. Ecology 2004, 85, 716–729. [Google Scholar] [CrossRef]
  5. Keeley, J.E.; Bond, W.J.; Bradstock, R.A.; Pausas, J.G.; Rundel, P.W. Fire in Mediterranean Ecosystems: Ecology, Evolution and Management; Cambridge University Press: Cambridge, UK, 2012. [Google Scholar]
  6. Arnan, X.; Quevedo, L.; Rodrigo, A. Forest fire occurrence increases the distribution of a scarce forest type in the Mediterranean Basin. Acta Oecologica 2013, 46, 39–47. [Google Scholar] [CrossRef]
  7. Fernandes, P.M. Fire-smart management of forest landscapes in the Mediterranean basin under global change. Landsc. Urban Plan. 2013, 110, 175–182. [Google Scholar] [CrossRef] [Green Version]
  8. Jones, G.M.; Tingley, M.W. Pyrodiversity and biodiversity: A history, synthesis, and outlook. Divers. Distrib. 2022, 28, 386–403. [Google Scholar] [CrossRef]
  9. Keeley, J.E.; Pausas, J.G.; Rundel, P.W.; Bond, W.J.; Bradstock, R.A. Fire as an evolutionary pressure shaping plant traits. Trends Plant Sci. 2011, 16, 406–411. [Google Scholar] [CrossRef] [PubMed] [Green Version]
  10. Seidl, R.; Rammer, W.; Spies, T.A. Disturbance legacies increase the resilience of forest ecosystem structure, composition, and functioning. Ecol. Appl. 2014, 24, 2063–2077. [Google Scholar] [CrossRef] [Green Version]
  11. Johnstone, J.F.; Allen, C.D.; Franklin, J.F.; Frelich, L.E.; Harvey, B.J.; Higuera, P.E.; Mack, M.C.; Meentemeyer, R.K.; Metz, M.R.; Perry, G.L.W.; et al. Changing disturbance regimes, ecological memory, and forest resilience. Front. Ecol. Environ. 2016, 14, 369–378. [Google Scholar] [CrossRef]
  12. González-De Vega, S.; De las Heras, J.; Moya, D. Resilience of Mediterranean terrestrial ecosystems and fire severity in semiarid areas: Responses of Aleppo pine forests in the short, mid and long term. Sci. Total Environ. 2016, 573, 1171–1177. [Google Scholar] [CrossRef]
  13. Fernández-Guisuraga, J.M.; Calvo, L.; Fernandes, P.M.; Suárez-Seoane, S. Short-Term Recovery of the Aboveground Carbon Stock in Iberian Shrublands at the Extremes of an Environmental Gradient and as a Function of Burn Severity. Forests 2022, 13, 145. [Google Scholar] [CrossRef]
  14. Fernández-García, V.; Beltrán-Marcos, D.; Fernández-Guisuraga, J.M.; Marcos, E.; Calvo, L. Predicting potential wildfire severity across Southern Europe with global data sources. Sci. Total Environ. 2022, 829, 154729. [Google Scholar] [CrossRef] [PubMed]
  15. Nolè, A.; Rita, A.; Spatola, M.F.; Borghetti, M. Biogeographic variability in wildfire severity and post-fire vegetation recovery across the European forests via remote sensing-derived spectral metrics. Sci. Total Environ. 2022, 823, 153807. [Google Scholar] [CrossRef] [PubMed]
  16. Moreira, F.; Viedma, O.; Arianoutsou, M.; Curt, T.; Koutsias, N.; Rigolot, E.; Barbati, A.; Corona, P.; Vaz, P.; Xanthopoulos, G.; et al. Landscape—Wildfire interactions in southern Europe: Implications for landscape management. J. Environ. Manag. 2011, 92, 2389–2402. [Google Scholar] [CrossRef] [Green Version]
  17. Pausas, J.G.; Keeley, J.E. Abrupt climate-independent fire regime changes. Ecosystems 2014, 17, 1109–1120. [Google Scholar] [CrossRef]
  18. Sagra, J.; Moya, D.; Plaza-Álvarez, P.A.; Lucas-Borja, M.E.; González-Romero, J.; De las Heras, J.; Alfaro-Sánchez, R.; Ferrandis, P. Prescribed fire effects on early recruitment of Mediterranean pine species depend on fire exposure and seed provenance. For. Ecol. Manag. 2019, 441, 253–261. [Google Scholar] [CrossRef]
  19. Pausas, J.G.; Vallejo, V.R. The role of fire in European Mediterranean ecosystems. In Remote Sensing of Large Wildfires; Chuvieco, E., Ed.; Springer: Berlin/Heidelberg, Germany, 1999. [Google Scholar]
  20. Giorgi, F.; Lionello, P. Climate change projections for the Mediterranean region. Glob. Planet. Chang. 2008, 63, 90–104. [Google Scholar] [CrossRef]
  21. Vilà-Cabrera, A.; Coll, L.; Martínez-Vilalta, J.; Retana, J. Forest management for adaptation to climate change in the Mediterranean basin: A synthesis of evidence. For. Ecol. Manag. 2018, 407, 16–22. [Google Scholar] [CrossRef] [Green Version]
  22. Lentile, L.B.; Holden, Z.A.; Smith, A.M.S.; Falkowski, M.J.; Hudak, A.T.; Morgan, P.; Lewis, S.A.; Gessler, P.E.; Benson, N.C. Remote sensing techniques to assess active fire characteristics and post-fire effects. Int. J. Wildland Fire 2006, 15, 319–345. [Google Scholar] [CrossRef]
  23. Key, C.H.; Benson, N. Landscape assessment: Ground measure of severity, the Composite Burn Index; and remote sensing of severity, the Normalized Burn Ratio. In FIREMON: Fire Effects Monitoring and Inventory System; General Technical Report RMRS-GTR-164; Lutes, D.C., Keane, R.E., Caratti, J.F., Key, C.H., Benson, N.C., Gangi, L.J., Eds.; USDA Forest Service, Rocky Mountain Research Station: Ogden, UT, USA, 2005; pp. 1–51. [Google Scholar]
  24. Morgan, P.; Keane, R.E.; Dillon, G.K.; Jain, T.B.; Hudak, A.T.; Karau, E.C.; Sikkink, P.G.; Holden, Z.A.; Strand, E.K. Challenges of assessing fire and burn severity using field measures, remote sensing and modelling. Int. J. Wildland Fire 2014, 23, 1045–1060. [Google Scholar] [CrossRef] [Green Version]
  25. Keeley, J.E. Fire intensity, fire severity and burn severity: A brief review and suggested usage. Int. J. Wildland Fire 2009, 18, 116–126. [Google Scholar] [CrossRef]
  26. Fernández-García, V.; Marcos, E.; Fulé, P.Z.; Reyes, O.; Santana, V.M.; Calvo, L. Fire regimes shape diversity and traits of vegetation under different climatic conditions. Sci. Total Environ. 2020, 716, 137137. [Google Scholar] [CrossRef] [PubMed]
  27. Fisher, J.L.; Loneragan, W.A.; Dixon, K.; Delaney, J.; Veneklaas, E.J. Altered vegetation structure and composition linked to fire frequency and plant invasion in a biodiverse woodland. Biol. Conserv. 2009, 142, 2270–2281. [Google Scholar] [CrossRef]
  28. Lloret, F.; Pausas, J.G.; Vilà, M. Responses of Mediterranean Plant Species to different fire frequencies in Garraf Natural Park (Catalonia, Spain): Field observations and modelling predictions. Plant Ecol. 2003, 167, 223–235. [Google Scholar] [CrossRef]
  29. Fernández-Guisuraga, J.M.; Suárez-Seoane, S.; Calvo, L. Radiative transfer modeling to measure fire impact and forest engineering resilience at short-term. ISPRS J. Photogramm. Remote Sens. 2021, 176, 30–41. [Google Scholar] [CrossRef]
  30. Knox, K.J.E.; Clarke, P.J. Fire severity, feedback effects and resilience to alternative community states in forest assemblages. For. Ecol. Manag. 2012, 265, 47–54. [Google Scholar] [CrossRef]
  31. Moya, D.; González-De Vega, S.; García-Orenes, F.; Morugán-Coronado, A.; Arcenegui, V.; Mataix-Solera, J.; Lucas-Borja, M.E.; De las Heras, J. Temporal characterisation of soil-plant natural recovery related to fire severity in burned Pinus halepensis Mill. forests. Sci. Total Environ. 2018, 640, 42–51. [Google Scholar] [CrossRef]
  32. Vega, J.A.; Fontúrbel, T.; Merino, A.; Fernández, C.; Ferreiro, A.; Jiménez, E. Testing the ability of visual indicators of soil burn severity to reflect changes in soil chemical and microbial properties in pine forests and shrubland. Plant Soil 2013, 369, 73–91. [Google Scholar] [CrossRef]
  33. Ryan, K.C.; Noste, N.V. Evaluating prescribed fires. In Proceedings, Symposium and Workshop on Wilderness Fire, 15–18 November 1983, Missoula, MT, USA; General Technical Report, INT-182; Lotan, J.E., Kilgore, B.M., Fischer, W.C., Mutch, R.W., Eds.; USDA Forest Service, Intermountain Forest and Range Experiment Station: Missoula, MT, USA, 1985; pp. 230–238. [Google Scholar]
  34. Thompson, J.R.; Spies, T.A. Vegetation and weather explain variation in crown damage within a large mixed-severity wildfire. For. Ecol. Manag. 2009, 258, 1684–1694. [Google Scholar] [CrossRef]
  35. Miller, J.D.; Knapp, E.C.; Key, C.H.; Skinner, C.N.; Isbell, C.J.; Creasy, R.M.; Sherlock, J.W. Calibration and validation of the relative differenced Normalized Burn Ratio (RdNBR) to three measures of fire severity in the Sierra Nevada and Klamath Mountains, California, USA. Remote Sens. Environ. 2009, 113, 645–656. [Google Scholar] [CrossRef]
  36. Pérez, B.; Moreno, J.M. Methods for quantifying fire severity in shrubland-fires. Plant Ecol. 1998, 139, 91–101. [Google Scholar] [CrossRef]
  37. De Santis, A.; Chuvieco, E. GeoCBI: A modified version of the Composite Burn Index for the initial assessment of the short-term burn severity from remotely sensed data. Remote Sens. Environ. 2009, 113, 554–562. [Google Scholar] [CrossRef]
  38. De Santis, A.; Chuvieco, E. Burn severity estimation from remotely sensed data: Performance of simulation versus empirical models. Remote Sens. Environ. 2007, 108, 422–435. [Google Scholar] [CrossRef]
  39. Fernández-Manso, A.; Quintano, C.; Roberts, D.A. Burn severity analysis in Mediterranean forests using maximum entropy model trained with EO-1 Hyperion and LiDAR data. ISPRS J. Photogramm. Remote Sens. 2019, 155, 102–118. [Google Scholar] [CrossRef]
  40. Yin, C.; He, B.; Yebra, M.; Quan, X.; Edwards, A.C.; Liu, X.; Liao, Z. Improving burn severity retrieval by integrating tree canopy cover into radiative transfer model simulation. Remote Sens. Environ. 2020, 236, 111454. [Google Scholar] [CrossRef]
  41. Key, C.H. Ecological and sampling constraints on defining landscape fire severity. Fire Ecol. 2006, 2, 34–59. [Google Scholar] [CrossRef]
  42. Parks, S.A.; Dillon, G.K.; Miller, C. A New Metric for Quantifying Burn Severity: The Relativized Burn Ratio. Remote Sens. 2014, 6, 1827–1844. [Google Scholar] [CrossRef] [Green Version]
  43. Soverel, N.O.; Perrakis, D.D.B.; Coops, N.C. Estimating burn severity from Landsat dNBR and RdNBR indices across western Canada. Remote Sens. Environ. 2010, 114, 1896–1909. [Google Scholar] [CrossRef]
  44. Fernández-García, V.; Santamarta, M.; Fernández-Manso, A.; Quintano, C.; Marcos, E.; Calvo, L. Burn severity metrics in fire-prone pine ecosystems along a climatic gradient using Landsat imagery. Remote Sens. Environ. 2018, 206, 205–217. [Google Scholar] [CrossRef]
  45. Fassnacht, F.E.; Schmidt-Riese, E.; Kattenborn, T.; Hernández, J. Explaining Sentinel 2-based dNBR and RdNBR variability with reference data from the bird’s eye (UAS) perspective. Int. J. Appl. Earth Obs. Geoinf. 2021, 95, 102262. [Google Scholar] [CrossRef]
  46. Cai, L.; Wang, M. Is the RdNBR a better estimator of wildfire burn severity than the dNBR? A discussion and case study in southeast China. Geocarto Int. 2022, 37, 758–772. [Google Scholar] [CrossRef]
  47. Alonso-González, E.; Fernández-García, V. MOSEV: A global burn severity database from MODIS (2000–2020). Earth Syst. Sci. Data 2021, 13, 1925–1938. [Google Scholar] [CrossRef]
  48. Viedma, O.; Chico, F.; Fernández, J.J.; Madrigal, C.; Safford, H.D.; Moreno, J.M. Disentangling the role of prefire vegetation vs. burning conditions on fire severity in a large forest fire in SE Spain. Remote Sens. Environ. 2020, 247, 111891. [Google Scholar] [CrossRef]
  49. Fernández-Guisuraga, J.M.; Suárez-Seoane, S.; García-Llamas, P.; Calvo, L. Vegetation structure parameters determine high burn severity likelihood in different ecosystem types: A case study in a burned Mediterranean landscape. J. Environ. Manag. 2021, 288, 112462. [Google Scholar] [CrossRef]
  50. Alexander, J.D.; Seavy, N.E.; Ralph, C.J.; Hogoboom, B. Vegetation and topographical correlates of fire severity from two fires in the Klamath-Siskiyou region of Oregon and California. Int. J. Wildland Fire 2006, 15, 237–245. [Google Scholar] [CrossRef]
  51. Lecina-Diaz, J.; Alvarez, A.; Retana, J. Extreme Fire Severity Patterns in Topographic, Convective and Wind-Driven Historical Wildfires of Mediterranean Pine Forests. PLoS ONE 2014, 9, e85127. [Google Scholar] [CrossRef] [Green Version]
  52. Oliveras, I.; Gracia, M.; Gerard, M.; Retana, J. Factors influencing the pattern of fire severities in a large wildfire under extreme meteorological conditions in the Mediterranean basin. Int. J. Wildland Fire 2009, 18, 755–764. [Google Scholar] [CrossRef]
  53. Fernandes, P.M.; Luz, A.; Loureiro, C. Changes in wildfire severity from maritime pine woodland to contiguous forest types in the mountains of northwestern Portugal. For. Ecol. Manag. 2010, 260, 883–892. [Google Scholar] [CrossRef]
  54. Viedma, O.; Quesada, J.; Torres, I.; De Santis, A.; Moreno, J.M. Fire Severity in a Large Fire in a Pinus pinaster Forest is Highly Predictable from Burning Conditions, Stand Structure, and Topography. Ecosystems 2015, 18, 237–250. [Google Scholar] [CrossRef]
  55. Fernandes, P.M.; Monteiro-Henriques, T.; Guiomar, N.; Loureiro, C.; Barros, A.M.G. Bottom-Up Variables Govern Large-Fire Size in Portugal. Ecosystems 2016, 19, 1362–1375. [Google Scholar] [CrossRef]
  56. Wilson, N.; Bradstock, R.; Bedward, M. Influence of fuel structure derived from terrestrial laser scanning (TLS) on wildfire severity in logged forests. J. Environ. Manag. 2022, 302, 114011. [Google Scholar] [CrossRef]
  57. Fernández-Guisuraga, J.M.; Suárez-Seoane, S.; Fernandes, P.M.; Fernández-García, V.; Fernández-Manso, A.; Quintano, C.; Calvo, L. Pre-fire aboveground biomass, estimated from LiDAR, spectral and field inventory data, as a major driver of burn severity in maritime pine (Pinus pinaster) ecosystems. For. Ecosyst. 2022, 9, 100022. [Google Scholar] [CrossRef]
  58. Morsdorf, F.; Mårell, A.; Koetz, B.; Cassagne, N.; Pimont, F.; Rigolot, E.; Allgöwer, B. Discrimination of vegetation strata in a multi-layered Mediterranean forest ecosystem using height and intensity information derived from airborne laser scanning. Remote Sens. Environ. 2010, 114, 1403–1415. [Google Scholar] [CrossRef] [Green Version]
  59. Vogeler, J.C.; Cohen, W.B. A review of the role of active remote sensing and data fusion for characterizing forest in wildlife habitat models. Rev. Teledetección 2016, 45, 1–14. [Google Scholar] [CrossRef] [Green Version]
  60. Kane, V.R.; Lutz, J.A.; Cansler, C.A.; Povak, N.A.; Churchill, D.J.; Smith, D.F.; Kane, J.T.; North, M.P. Water balance and topography predict fire and forest structure patterns. For. Ecol. Manag. 2015, 338, 1–13. [Google Scholar] [CrossRef]
  61. Garcia, M.; Saatchi, S.; Casas, A.; Koltunov, A.; Ustin, S.; Ramirez, C.; Garcia-Gutierrez, J.; Balzter, H. Quantifying biomass consumption and carbon release from the California Rim fire by integrating airborne LiDAR and Landsat OLI data. J. Geophys. Res. Biogeosci. 2017, 122, 340–353. [Google Scholar] [CrossRef] [PubMed] [Green Version]
  62. Tanase, M.A.; Kennedy, R.; Aponte, C. Radar Burn Ratio for fire severity estimation at canopy level: An example for temperate forests. Remote Sens. Environ. 2015, 170, 14–31. [Google Scholar] [CrossRef]
  63. García-Llamas, P.; Suárez-Seoane, S.; Taboada, A.; Fernández-Manso, A.; Quintano, C.; Fernández-García, V.; Fernández-Guisuraga, J.M.; Marcos, E.; Calvo, L. Environmental drivers of fire severity in extreme fire events that affect Mediterranean pine forest ecosystems. For. Ecol. Manag. 2019, 433, 24–32. [Google Scholar] [CrossRef]
  64. Lee, B.; Kim, S.Y.; Chung, J.; Park, P.S. Estimation of fire severity by use of Landsat TM images and its relevance to vegetation and topography in the 2000 Samcheok forest fire. J. For. Res. 2008, 13, 197–204. [Google Scholar] [CrossRef]
  65. Bouvier, M.; Durrieu, S.; Fournier, R.A.; Renaud, J.P. Generalizing predictive models of forest inventory attributes using an area-based approach with airborne LiDAR data. Remote Sens. Environ. 2015, 156, 322–334. [Google Scholar] [CrossRef]
  66. Gatziolis, D.; Fried, J.S.; Monleon, V.S. Challenges to estimating tree height via LiDAR in closed-canopy forests: A parable from western Oregon. For. Sci. 2010, 56, 139–155. [Google Scholar]
  67. Tinkham, W.T.; Smith, A.M.S.; Hoffman, C.; Hudak, A.T.; Falkowski, M.J.; Swanson, M.E.; Gessler, P.E. Investigating the influence of LiDAR ground surface errors on the utility of derived forest inventories. Can. J. For. Res. 2012, 42, 413–422. [Google Scholar] [CrossRef]
  68. Xiao, J.; Chevallier, F.; Gomez, C.; Guanter, L.; Hicke, J.A.; Huete, A.R.; Ichii, K.; Ni, W.; Pang, Y.; Rahman, A.F.; et al. Remote sensing of the terrestrial carbon cycle: A review of advances over 50 years. Remote Sens. Environ. 2019, 233, 111383. [Google Scholar] [CrossRef]
  69. Skowronski, N.; Clark, K.; Nelson, R.; Hom, J.; Patterson, M. Remotely sensed measurements of forest structure and fuel loads in the Pinelands of New Jersey. Remote Sens. Environ. 2007, 108, 123–129. [Google Scholar] [CrossRef]
  70. Ninyerola, M.; Pons, X.; Roure, J.M. Atlas Climático Digital de la Península Ibérica. Metodología y Aplicaciones en Bioclimatología y Geobotánica; Universidad Autónoma de Barcelona: Barcelona, Spain, 2005. [Google Scholar]
  71. ESA. Sentinel-2 MSI User Guide. 2022. Available online: https://sentinel.esa.int/web/sentinel/user-guides/sentinel-2-msi (accessed on 30 November 2022).
  72. Miller, J.D.; Thode, A.E. Quantifying burn severity in a heterogeneous landscape with a relative version of the delta normalized burn ratio (dNBR). Remote Sens. Environ. 2007, 109, 66–80. [Google Scholar] [CrossRef]
  73. Quintano, C.; Fernández-Manso, A.; Roberts, D.A. Burn severity mapping from Landsat MESMA fraction images and land surface temperatures. Remote Sens. Environ. 2017, 190, 83–95. [Google Scholar] [CrossRef]
  74. Fernández-García, V.; Quintano, C.; Taboada, A.; Marcos, E.; Calvo, L.; Fernández-Manso, A. Remote Sensing Applied to the Study of Fire Regime Attributes and Their Influence on Post-Fire Greenness Recovery in Pine Ecosystems. Remote Sens. 2018, 10, 733. [Google Scholar] [CrossRef] [Green Version]
  75. Cansler, C.A.; McKenzie, D. How Robust Are Burn Severity Indices When Applied in a New Region? Evaluation of Alternate Field-Based and Remote-Sensing Methods. Remote Sens. 2012, 4, 456–483. [Google Scholar] [CrossRef] [Green Version]
  76. Evans, J.S.; Hudak, A.T. A multiscale curvature algorithm for classifying discrete return LiDAR in forested environments. IEEE Trans. Geosci. Remote Sens. 2007, 45, 1029–1038. [Google Scholar] [CrossRef]
  77. Tinkham, W.T.; Huang, H.; Smith, A.M.S.; Shrestha, R.; Falkowski, M.J.; Hudak, A.T.; Link, T.E.; Glenn, N.F.; Marks, D.G. A Comparison of Two Open Source LiDAR Surface Classification Algorithms. Remote Sens. 2011, 3, 638–649. [Google Scholar] [CrossRef]
  78. Montealegre, A.L.; Lamelas, M.T.; de la Riva, J. A Comparison of Open-Source LiDAR Filtering Algorithms in a Mediterranean Forest Environment. IEEE J. Sel. Top. Appl. Earth Obs. Remote Sens. 2015, 8, 4072–4085. [Google Scholar] [CrossRef] [Green Version]
  79. Guerra-Hernández, I.; Tomé, M.; González-Ferreiro, E. Using low density LiDAR data to map Mediterranean forest characteristics by means of an area-based approach and height threshold analysis. Rev. Teledetección 2016, 46, 103–117. [Google Scholar] [CrossRef] [Green Version]
  80. Domingo, D.; Lamelas, M.T.; Montealegre, A.L.; García-Martín, A.; De la Riva, J. Estimation of Total Biomass in Aleppo Pine Forest Stands Applying Parametric and Nonparametric Methods to Low-Density Airborne Laser Scanning Data. Forests 2018, 9, 158. [Google Scholar] [CrossRef] [Green Version]
  81. Liu, L.; Pang, Y.; Li, Z.; Si, L.; Liao, S. Combining Airborne and Terrestrial Laser Scanning Technologies to Measure Forest Understorey Volume. Forests 2017, 8, 111. [Google Scholar] [CrossRef] [Green Version]
  82. McGaughey, R.J. FUSION/LDV: Software for LiDAR Data Analysis and Visualization, Version 4.40; United States Department of Agriculture, Forest Service, Pacific Northwest Research Station: Corvallis, OR, USA, 2022.
  83. Breiman, L. Random forests. Mach. Learn. 2001, 45, 5–32. [Google Scholar] [CrossRef] [Green Version]
  84. Oliveira, S.; Oehler, F.; San-Miguel-Ayanz, J.; Camia, A.; Pereira, M.C. Modeling spatial patterns of fire occurrence in mediterranean europe using multiple regression and random forest. For. Ecol. Manag. 2012, 275, 117–129. [Google Scholar] [CrossRef]
  85. Cutler, D.R.; Edwards, T.C.; Beard, K.H.; Cutler, A.; Hess, K.T.; Gibson, J.; Lawler, J.J. Random forests for classification in ecology. Ecology 2007, 88, 2783–2792. [Google Scholar] [CrossRef]
  86. García-Llamas, P.; Suárez-Seoane, S.; Fernández-Manso, A.; Quintano, C.; Calvo, L. Evaluation of fire severity in fire prone-ecosystems of Spain under two different environmental conditions. J. Environ. Manag. 2020, 271, 110706. [Google Scholar] [CrossRef]
  87. Fernández-Guisuraga, J.M.; Suárez-Seoane, S.; Calvo, L. Radar and multispectral remote sensing data accurately estimate vegetation vertical structure diversity as a fire resilience indicator. Remote Sens. Ecol. Conserv. 2022, in press. [CrossRef]
  88. Probst, P.; Boulesteix, A.L. To tune or not to tune the number of trees in Random Forest. J. Mach. Learn. Res. 2018, 18, 1–18. [Google Scholar]
  89. R Core Team. R: A Language and Environment for Statistical Computing; R Foundation for Statistical Computing: Vienna, Austria, 2021; Available online: https://www.R-project.org/ (accessed on 25 October 2022).
  90. Liaw, A.; Wiener, M. Classification and regression by RandomForest. R News 2002, 2, 18–22. [Google Scholar]
  91. Kuhn, M.; CARET: Classification and Regression Training. R Package Version 6.0-86. 2020. Available online: https://CRAN.R-project.org/package=caret (accessed on 25 October 2022).
  92. Greenwell, B.M. pdp: An R Package for Constructing Partial Dependence Plots. R J. 2017, 9, 421–436. [Google Scholar] [CrossRef]
  93. Corona, P.; Ascoli, D.; Barbati, A.; Bovio, G.; Colangelo, G.; Elia, M.; Garfì, V.; Iovino, F.; Lafortezza, R.; Leone, V.; et al. Integrated Forest management to prevent wildfires under Mediterranean environments. Ann. Silvic. Res. 2015, 39, 1–22. [Google Scholar]
  94. Jain, T.B.; Graham, R.T. The relation between tree burn severity and forest structure in the Rocky Mountains. In Restoring Fire-Adapted Ecosystems: Proceedings of the 2005 National Silviculture Workshop; USDA Forest Service General Technical Report PSW-GTR-203; Powers, R.F., Ed.; U.S. Department of Agriculture, Forest Service, Pacific Southwest Research Station: Albany, NY, USA, 2007; pp. 213–250. [Google Scholar]
  95. Cansler, C.A.; McKenzie, D. Climate, fire size, and biophysical setting control fire severity and spatial pattern in the northern Cascade Range, USA. Ecol. Appl. 2014, 24, 1037–1056. [Google Scholar] [CrossRef]
  96. Kane, V.R.; Cansler, C.A.; Povak, N.A.; Kane, J.T.; McGaughey, R.J.; Lutz, J.A.; Churchill, D.J.; North, M.P. Mixed severity fire effects within the Rim fire: Relative importance of local climate, fire weather, topography, and forest structure. For. Ecol. Manag. 2015, 358, 62–79. [Google Scholar] [CrossRef] [Green Version]
  97. Parks, S.A.; Holsinger, L.M.; Panunto, M.H.; Jolly, W.M.; Dobrowski, S.Z.; Dillon, G.K. High-severity fire: Evaluating its key drivers and mapping its probability across western US forests. Environ. Res. Lett. 2018, 13, 044037. [Google Scholar] [CrossRef]
  98. Wulder, M.A.; White, J.C.; Alvarez, F.; Han, T.; Rogan, J.; Hawkes, B. Characterizing boreal forest wildfire with multi-temporal Landsat and LIDAR data. Remote Sens. Environ. 2009, 113, 1540–1555. [Google Scholar] [CrossRef]
  99. Gale, M.G.; Cary, G.J. What determines variation in remotely sensed fire severity? Consideration of remote sensing limitations and confounding factors. Int. J. Wildland Fire 2022, 31, 291–305. [Google Scholar] [CrossRef]
  100. Skowronski, N.S.; Gallagher, M.R.; Warner, T.A. Decomposing the Interactions between Fire Severity and Canopy Fuel Structure Using Multi-Temporal, Active, and Passive Remote Sensing Approaches. Fire 2020, 3, 7. [Google Scholar] [CrossRef] [Green Version]
  101. Loudermilk, E.L.; Pokswinski, S.; Hawley, C.M.; Maxwell, A.; Gallagher, M.; Skowronski, N.; Hudak, A.T.; Hoffman, C.; Hiers, J.K. Terrestrial laser scan metrics predict surface vegetation biomass and consumption in a frequently burned southeastern U.S. ecosystem. bioRxiv 2023, arXiv:2023.01.15.524107. [Google Scholar]
  102. Gallagher, M.R.; Maxwell, A.E.; Guillén, L.A.; Everland, A.; Loudermilk, E.L.; Skowronski, N.S. Estimation of Plot-Level Burn Severity Using Terrestrial Laser Scanning. Remote Sens. 2021, 13, 4168. [Google Scholar] [CrossRef]
  103. Disney, M.; Burt, A.; Calders, K.; Schaaf, C.; Stovall, A. Innovations in Ground and Airborne Technologies as Reference and for Training and Validation: Terrestrial Laser Scanning (TLS). Surv. Geophys. 2019, 40, 937–958. [Google Scholar] [CrossRef] [Green Version]
  104. Wallace, L.; Hillman, S.; Hally, B.; Taneja, R.; White, A.; McGlade, J. Terrestrial Laser Scanning: An Operational Tool for Fuel Hazard Mapping? Fire 2022, 5, 85. [Google Scholar] [CrossRef]
  105. Bienert, A.; Georgi, L.; Kunz, M.; Maas, H.G.; Von Oheimb, G. Comparison and Combination of Mobile and Terrestrial Laser Scanning for Natural Forest Inventories. Forests 2018, 9, 395. [Google Scholar] [CrossRef]
  106. Qi, Y.; Coops, N.C.; Daniels, L.D.; Butson, C.R. Assessing the effects of burn severity on post-fire tree structures using the fused drone and mobile laser scanning point clouds. Front. Environ. Sci. 2022, 10, 949442. [Google Scholar] [CrossRef]
  107. Sheridan, R.D.; Popescu, S.C.; Gatziolis, D.; Morgan, C.L.S.; Ku, N.-W. Modeling Forest Aboveground Biomass and Volume Using Airborne LiDAR Metrics and Forest Inventory and Analysis Data in the Pacific Northwest. Remote Sens. 2015, 7, 229–255. [Google Scholar] [CrossRef]
  108. Mitsopoulos, I.D.; Dimitrakopoulos, A.P. Canopy fuel characteristics and potential crown fire behavior in Aleppo pine (Pinus halepensis Mill.) forests. Ann. For. Sci. 2007, 64, 287–299. [Google Scholar] [CrossRef] [Green Version]
  109. Cruz, M.G.; Alexander, M.E.; Wakimoto, R.H. Modeling the likelihood of crown fire occurrence in conifer forest stands. For. Sci. 2004, 50, 640–658. [Google Scholar]
  110. Quintano, C.; Fernández-Manso, A.; Roberts, D.A. Multiple Endmember Spectral Mixture Analysis (MESMA) to map burn severity levels from Landsat images in Mediterranean countries. Remote Sens. Environ. 2013, 136, 76–88. [Google Scholar] [CrossRef]
  111. Quintano, C.; Fernández-Manso, A.; Roberts, D.A. Enhanced burn severity estimation using fine resolution ET and MESMA fraction images with machine learning algorithm. Remote Sens. Environ. 2020, 244, 111815. [Google Scholar] [CrossRef]
  112. Karna, Y.K.; Penman, T.D.; Aponte, C.; Gutekunst, C.; Bennett, L.T. Indications of positive feedbacks to flammability through fuel structure after high-severity fire in temperate eucalypt forests. Int. J. Wildland Fire 2021, 30, 664–679. [Google Scholar] [CrossRef]
  113. Kane, V.R.; McGaughey, R.J.; Bakker, J.D.; Gersonde, R.F.; Lutz, J.A.; Franklin, J.F. Comparisons between field- and LiDAR-based measures of stand structural complexity. Can. J. For. Res. 2010, 40, 761–773. [Google Scholar] [CrossRef]
  114. Beets, P.N.; Reutebuch, S.; Kimberley, M.O.; Oliver, G.R.; Pearce, S.H.; McGaughey, R.J. Leaf Area Index, Biomass Carbon and Growth Rate of Radiata Pine Genetic Types and Relationships with LiDAR. Forests 2011, 2, 637–659. [Google Scholar] [CrossRef] [Green Version]
  115. Riaño, D.; Meier, E.; Allgöwer, B.; Chuvieco, E.; Ustin, S.L. Modeling airborne laser scanning data for the spatial generation of critical forest parameters in fire behavior modeling. Remote Sens. Environ. 2003, 86, 177–186. [Google Scholar] [CrossRef]
  116. Cruz, M.G.; Alexander, M.E.; Wakimoto, R.H. Development and testing of models for predicting crown fire rate of spread in conifer forest stands. Can. J. For. Res. 2005, 35, 1626–1639. [Google Scholar] [CrossRef]
  117. Hoff, V.; Rowell, E.; Teske, C.; Queen, L.; Wallace, T. Assessing the Relationship between Forest Structure and Fire Severity on the North Rim of the Grand Canyon. Fire 2019, 2, 10. [Google Scholar] [CrossRef] [Green Version]
  118. Furlaud, J.M.; Prior, L.D.; Williamson, G.J.; Bowman, D.M.J.S. Fire risk and severity decline with stand development in Tasmanian giant Eucalyptus forest. For. Ecol. Manag. 2021, 502, 119724. [Google Scholar] [CrossRef]
  119. Quintano, C.; Fernández-Manso, A.; Calvo, L.; Roberts, D.A. Vegetation and Soil Fire Damage Analysis Based on Species Distribution Modeling Trained with Multispectral Satellite Data. Remote Sens. 2019, 11, 1832. [Google Scholar] [CrossRef] [Green Version]
  120. Agee, J.K.; Skinner, C.N. Basic principles of forest fuel reduction treatments. For. Ecol. Manag. 2005, 211, 83–96. [Google Scholar] [CrossRef]
  121. Keeley, J.E. Fire management of California shrubland landscapes. Environ. Manag. 2002, 29, 395–408. [Google Scholar] [CrossRef] [PubMed]
  122. Fernandes, P.M. Empirical support for the use of prescribed burning as a fuel treatment. Curr. For. Rep. 2015, 1, 118–127. [Google Scholar] [CrossRef] [Green Version]
  123. Stocks, B.J.; Alexander, M.E.; Wotton, B.M.; Stefner, C.N.; Flannigan, M.D.; Taylor, S.W.; Lavoie, N.; Mason, J.A.; Hartley, G.R.; Maffey, M.E.; et al. Crown fire behaviour in a northern jack pine—Black spruce forest. Can. J. For. Res. 2004, 34, 1548–1560. [Google Scholar] [CrossRef] [Green Version]
  124. Gill, A.M.; Christian, K.R.; Moore, P.H.R.; Forrester, R.I. Bushfire incidence, fire hazard and fuel reduction burning. Austral Ecol. 1987, 12, 299–306. [Google Scholar] [CrossRef]
  125. Storey, M.; Price, O.; Tasker, E. The role of weather, past fire and topography in crown fire occurrence in eastern Australia. Int. J. Wildland Fire 2016, 25, 1048–1060. [Google Scholar] [CrossRef]
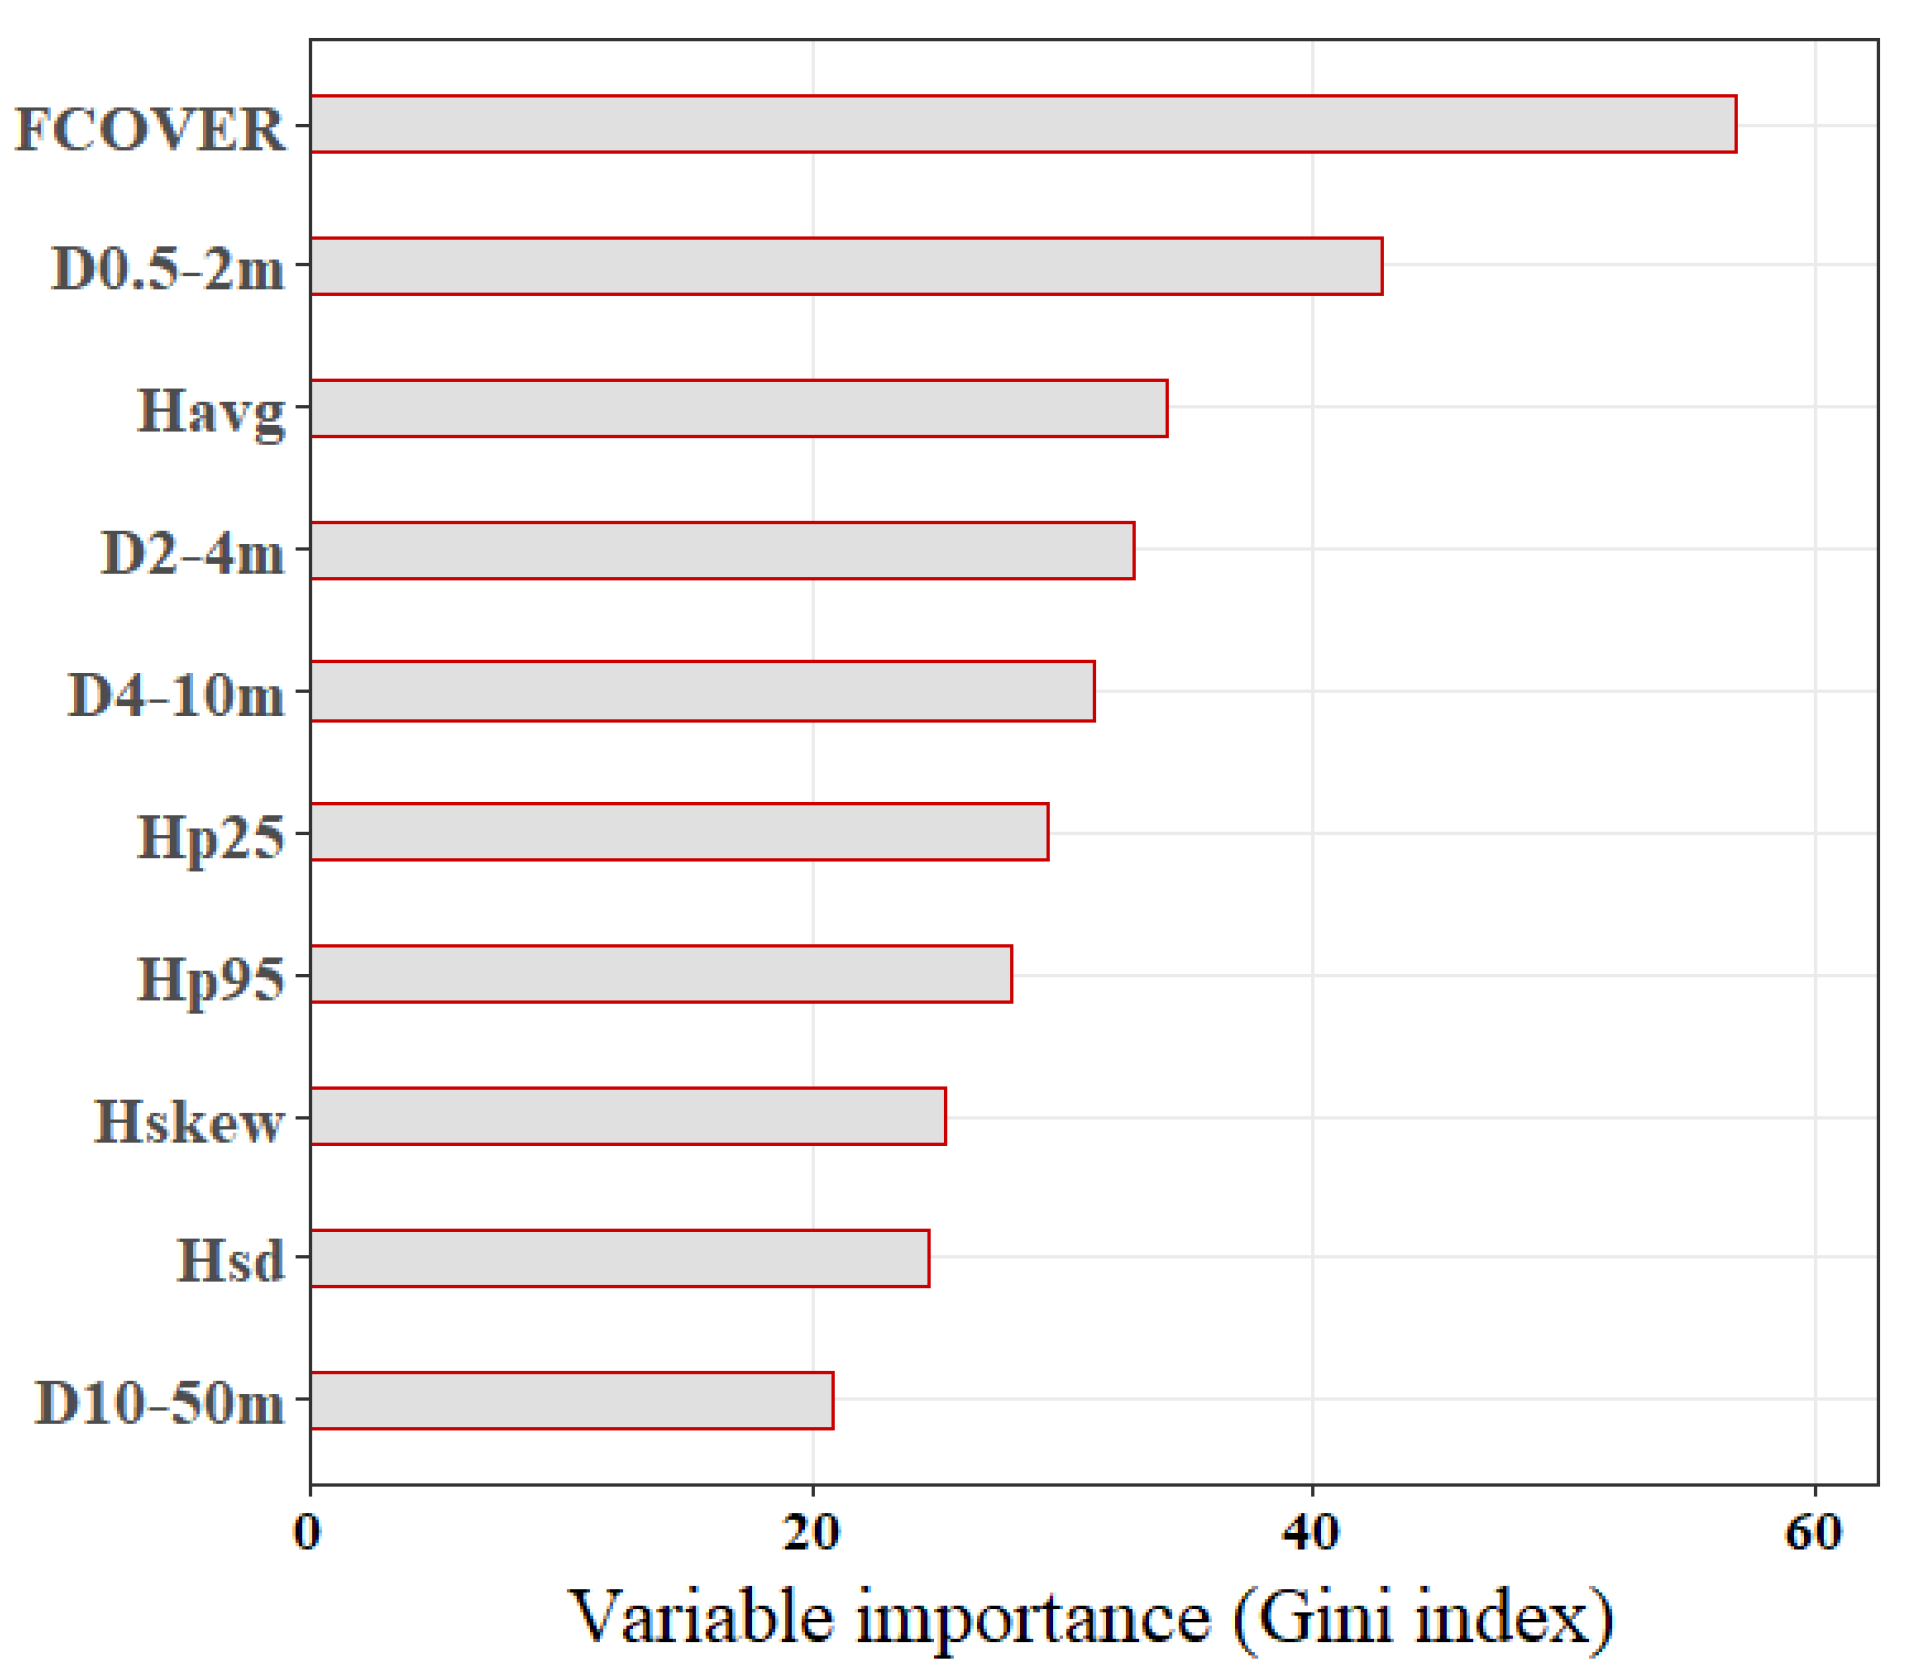
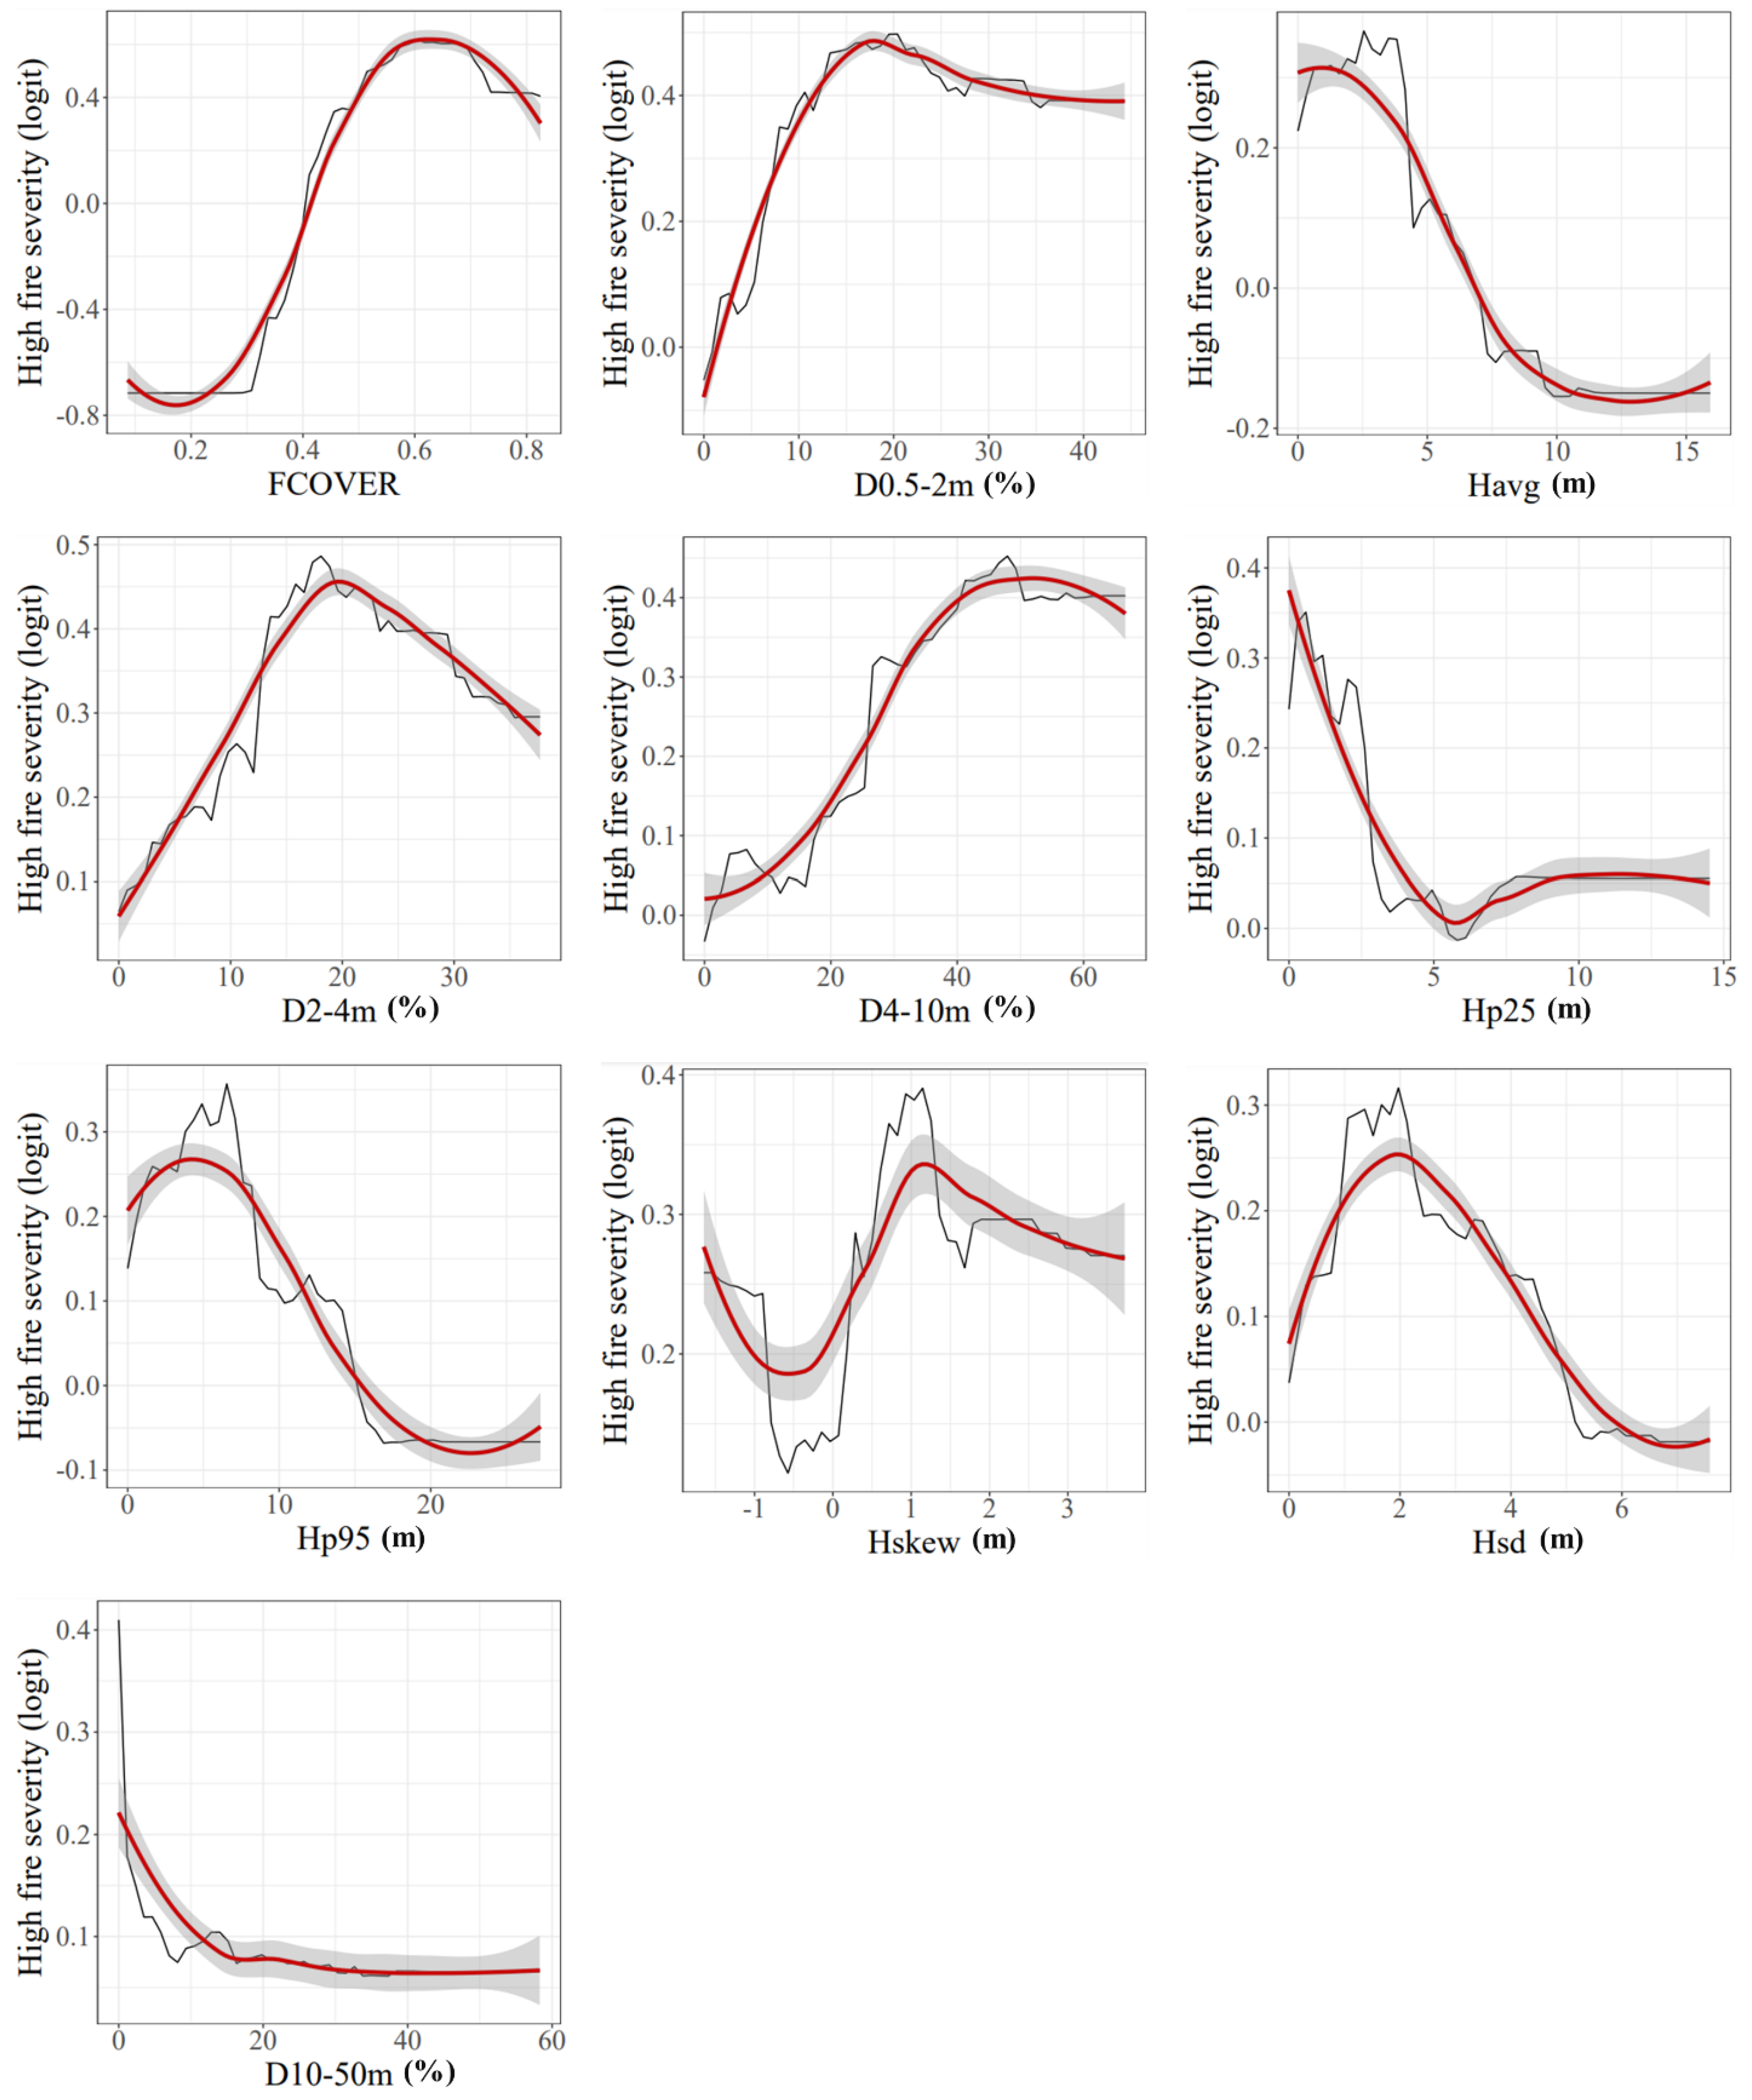
Figure 1. Location of the study site within the LiDAR flight site of the áGiLTerFoRus project in central Portugal. The background image is a Sentinel-2 false color composite (R = band 12; G = band 8A; B = band 4) that allows us to highlight the wildfire scar that occurred one month after the LiDAR survey.
Remotesensing 15 00768 g001
Figure 2. Fire severity within the wildfire scar assessed through the differenced Normalized Burn Ratio (dNBR) index computed from pre- and post-fire Sentinel-2 scenes.
Remotesensing 15 00768 g002
Figure 3. Relationship between observed and predicted fire severity (dNBR) using the Random Forest (RF) regression algorithm. The dotted line represents the 1:1 line, and the solid line is the fit of the linear model.
Remotesensing 15 00768 g003
Figure 4. Variable importance (%IncMSE) of the pre-fire LiDAR metrics in the Random Forest (RF) regression algorithm.
Remotesensing 15 00768 g004
Figure 5. Relationships between fire severity (dNBR) and pre-fire LiDAR metrics. The solid line represents the fit of the linear model.
Remotesensing 15 00768 g005
Figure 6. Variable importance (Gini index) of the pre-fire LiDAR metrics in the Random Forest (RF) classification algorithm of fire severity.
Remotesensing 15 00768 g006
Figure 7. Partial dependence plots of the pre-fire LiDAR metrics in the Random Forests (RF) classification algorithm of fire severity. The probability of high fire severity outcome is displayed in a centered logit scale for each LiDAR metric. The red line is a LOESS smooth curve.
Remotesensing 15 00768 g007
Table 1. Description of the LiDAR metrics considered in this study.
LiDAR MetricAbbreviationEcological Meaning
Average height of LiDAR returnsHavgMean canopy height
Standard deviation of LiDAR returnsHsdCanopy vertical complexity and continuity
Skewness of LiDAR returnsHskewDistribution of vegetation heights in the canopy
25th height percentileHp25Canopy base height
95th height percentileHp95Height of dominant vegetation in the canopy
Canopy density by height binsD0.5–2m, D2–4m, D4–10m, D10–50mDistribution of the fuel load per canopy strata
Canopy coverFCOVERHorizontal continuity of the canopy
Table 2. Random Forest (RF) classification performance evaluated through the average confusion matrix computed across 10-fold cross-validation resamples. We calculated the overall accuracy (OA), Kappa index, and user’s (UA) and producer’s (PA) accuracy (%).
Reference Fire Severity
LowHigh
Classified fire severityLow29.79.1
High9.551.7
PA (%)75.3485.25
UA (%)76.9283.87
OA (%)Kappa
81.190.61
Disclaimer/Publisher’s Note: The statements, opinions and data contained in all publications are solely those of the individual author(s) and contributor(s) and not of MDPI and/or the editor(s). MDPI and/or the editor(s) disclaim responsibility for any injury to people or property resulting from any ideas, methods, instructions or products referred to in the content.

