Article

SISLU-Net: Spatial Information-Assisted Spectral Information Learning Unmixing Network for Hyperspectral Images

1
School of Computer Science, Nanjing University of Information Science and Technology, Nanjing 210044, China
2
Jiangsu Collaborative Innovation Center of Atmospheric Environment and Equipment Technology (CICAEET), Nanjing University of Information Science and Technology, Nanjing 210044, China
3
Internet of Things & Smart City Innovation Platform, Zhuhai Fudan Innovation Institute, Zhuhai 519031, China
*
Author to whom correspondence should be addressed.
Remote Sens. 2023, 15(3), 817; https://doi.org/10.3390/rs15030817
Submission received: 26 December 2022 / Revised: 26 January 2023 / Accepted: 30 January 2023 / Published: 31 January 2023
(This article belongs to the Section Remote Sensing Image Processing)

Abstract

:
Spectral unmixing is among one of the major hyperspectral image analysis tasks that aims to extract basic features (endmembers) at the subpixel level and estimate their corresponding proportions (fractional abundances). Recently, the rapid development of deep learning networks has provided us with a new method to solve the problem of spectral unmixing. In this paper, we propose a spatial-information-assisted spectral information learning unmixing network (SISLU-Net) for hyperspectral images. The SISLU-Net consists of two branches. The upper branch focuses on the extraction of spectral information. The input of the upper branch is a number of pixels randomly extracted from the hyperspectral image. The data are fed into the network as a random combination of different pixel blocks each time. The random combination of batches can boost the network to learn global spectral information. Another branch focuses on learning spatial information from the entire hyperspectral image and transmitting it to the upper branch through the shared weight strategy. This allows the network to take into account the spectral information and spatial information of HSI at the same time. In addition, according to the distribution characteristics of endmembers, we employ Wing loss to solve the problem of uneven distributions of endmembers. Experimental results on one synthetic and three real hyperspectral data sets show that SISLU-Net is effective and competitive compared with several state-of-the-art unmixing algorithms in terms of the spectral angle distance (SAD) of the endmembers and the root mean square error (RMSE) of the abundances.

1. Introduction

Hyperspectral images (HSIs) are three-dimensional data cubes that contain both spatial and spectral information. The obtained HSIs contain hundreds or thousands of two-dimensional images, that are sampled from approximately continuous wavelengths in continuous electromagnetic spectrums [1]. Therefore, one can use this technology to identify and detect materials with greater accuracy and precision [2]. Hyperspectral image analysis is gaining increasing attention because it contains a wealth of information and plays an important role in land cover classification or segmentation [3,4,5,6], target/anomaly detection [7,8,9], military investigation, etc. However, due to the spectrometer sensor, the spatial resolution of HSIs is low, and one pixel of HSI may contain more than one spectral feature, resulting in the "mixed pixels" phenomenon [10,11]. The presence of a large number of mixed pixels inevitably affects subsequent applications.
As an essential preprocessing task of hyperspectral analysis, spectral unmixing (SU) aims to extract the basic characteristics of spectra (termed endmembers) at the subpixel level and estimate their corresponding proportions (termed fractional abundances) at the same time. From the modeling perspective, SU techniques are broadly divided into two categories: linear unmixing and nonlinear unmixing [12,13]. The Linear mixing model (LMM) assumes that the spectrum observed in a mixed pixel is a weighted linear combination of endmembers in the scene [12,14]. In current remote sensing applications, the endmembers of mixed pixels in HSIs are basically fixed, so LMM can show favorable results in SU [12]. The nonlinear mixing model (NLMM), which takes into account possible intimate or multi-layer mixing problems between materials, usually shows unmixing well in specific cases and requires some nonlinear prior knowledge [15,16,17].
In this paper, we focus on the LMM-based method. Early linear hyperspectral unmixing (HU) can be broadly divided into geometric, statistical, and sparse regression methods. The geometry-based approach holds that mixed pixels are in a simplex set or a positive cone, and the vertices of the simplex correspond to the endmembers. Methods such as Vertex Component Analysis (VCA) [18], N-FINDR [19], Pixel Purity Index (PPI) [20], etc., are representative methods, which rely on the presence of pure pixels in the scene. However, in real scenarios with low spatial resolutions, pure pixels may not exist. Therefore, non-pure pixel-based methods are proposed, the most representative being the minimum volume simplex analysis (MVSA) [21]. When the degree of spectral mixing is high, the geometry-based method is less effective. In this case, it presents a good alternative to using statistical-based methods such as Bayesian frameworks, which use the Dirichlet distribution [22] to sample the abundance polynomial while exploiting the physical constraints of abundance (i.e., non-negative constraint abundance (ANC) and sum-to-one constraint (ASC)). Sparse unmixing is also an important unmixing technique. The main idea is to use sparse regression technology to estimate the abundance fraction. This method assumes that the observed image features can be expressed as linear combinations of some pre-known pure spectral features. These pure spectral features may come from the spectral library [23]. It is typically represented by variable splitting and augmented Lagrangian (SUnSAL) [24]. In addition, by applying regularization terms (such as total variation (TV)) to abundance, algorithms such as SUnSAL-TV [25] and Collaborative SUnSAL (CLSUnSAL) [26] have been proposed. In order to better preserve the three-dimensional structure of HSIs and make better use of the correlation between the images of various bands, many tensor-based unmixing models have been investigated. For instance, in [27], a nonlocal tensor-based sparse unmixing (NL-TSUn) algorithm was proposed for hyperspectral unmixing. First, HSIs were grouped by similarity, and then each group was unmixed by applying a mixed regularization term on the corresponding third-order abundance tensor. Later, Xue et al. [28] proposed a new multi-layer sparsity-based tensor decomposition (MLSTD) for low-rank tensor completion (LRTC). By applying three sparse constraints to the subspace, the complex structure information hidden in the subspace can be fully mined. In order to better describe the hierarchical structure of the subspace and improve the modeling ability in estimating accurate rank, Xue et al. [29] recently proposed a parametric tensor sparsity measure model that encoded the sparsity of the general tensor through the Laplacian scale mixture (LSM) modeling based on three-level transform (TLT), and converted the sparsity of the tensor into factor subspace. The factor sparsity was used to characterize the local similarity in within-mode, and the sparsity was further refined by applying the transform learning scheme. The above tensor-based unmixing methods employ the three-dimensional structure of images to better describe and constrain the sparsity of the subspace. However, it inevitably suffers from issues concerning complex computation and a large number of iterations. Therefore, the selection of an optimization algorithm is more important.
Recently, deep learning (DL) techniques have shown excellent performance successfully solving many difficult practical problems in the fields of pattern recognition, natural language processing, automatic control, computer vision, etc. Due to the powerful learning and data-fitting capabilities of DL methods, researchers are beginning to use DL more frequently to solve HU problems. Many DL-based SU networks have been proposed [30,31,32], and the abundance estimation of HSIs using neural networks in [33,34] has achieved better unmixing results than traditional methods. However, the above methods are supervised, and their endmember features need to be obtained in advance, and thus are not applicable to all scenarios. Due to the network structure characteristics of autoencoders, autoencoders are widely used for blind HU [35]. The autoencoder network transforms the HU problem into a problem that minimizes reconstruction errors and learns the semantic features of the data by minimizing spectral errors [36,37,38], thus obtaining both the endmembers and abundances. Typical examples of autoencoders are EndNet [39], DAEN [40], DeepGUn [41], and uDAS [42]. EndNet proposed a loss function containing the Kullback–Leibler divergence term, SAD similarity, and a sparsity term to constrain abundance; however, this also made parameter selection very difficult. The DEAN network consisted of two parts, the first of which initialized the network using a stacked autoencoder (SAE) and learned the spectral characteristics. In the second part of the network, a variational autoencoder (VAE) was used to obtain both endmember characteristics and abundance fractions. UDAS took into account robustness to noise and reduced redundant endmembers. Its decoder component utilized a denoising constraint and the 2 , 1 sparsity constraint.
However, these autoencoder-based methods ignore spatial information, and they tend to produce physically meaningless endmembers. In [43], an adaptive abundance smoothing method using spatial context information was proposed, which introduced spatial information in the autoencoder network. In [44], a network of pixel-based and cube-based convolutional autoencoders was proposed to introduce spatial information by slicing images into patches. Recently, in [45], an autoencoder using 3D convolutional filtersfor supervised SU was proposed. These papers demonstrate that the use of spatial information can help improve unmixing results. However, due to the incomplete spatial information in small batches, the estimated abundance may be rendered inaccurate to some extent [46]. In addition, these methods do not pay attention to the problem of differences in the distribution of endmembers, resulting in an unsatisfactory estimation of endmembers. Gao et al. [47] were inspired by the perception mechanism to feed the extracted batches into the network for end-to-end learning through two cascading autoencoders; however, the batches were extracted in adjacent regions, and the initial weights of the network depended on the endmembers extracted by the VCA. Similarly, this method also did not take into account the influence of the distribution of endmembers on the learning direction of the network. In addition to the unmixing method based on the autoencoder network, the unmixing method based on the convolutional neural network is another commonly employed method. The use of the convolution kernel in the convolutional neural network introduces the spatial information of the image into the network. In [48], the authors used simplex volume minimization to introduce geometric information into the network, and achieved good endmembers. However, the input of the network was the same size as the original hyperspectral data with noise, and the network did not fully learn the spatial and spectral information of the HSIs. The problem of differences in the distribution of endmembers remains overlooked.
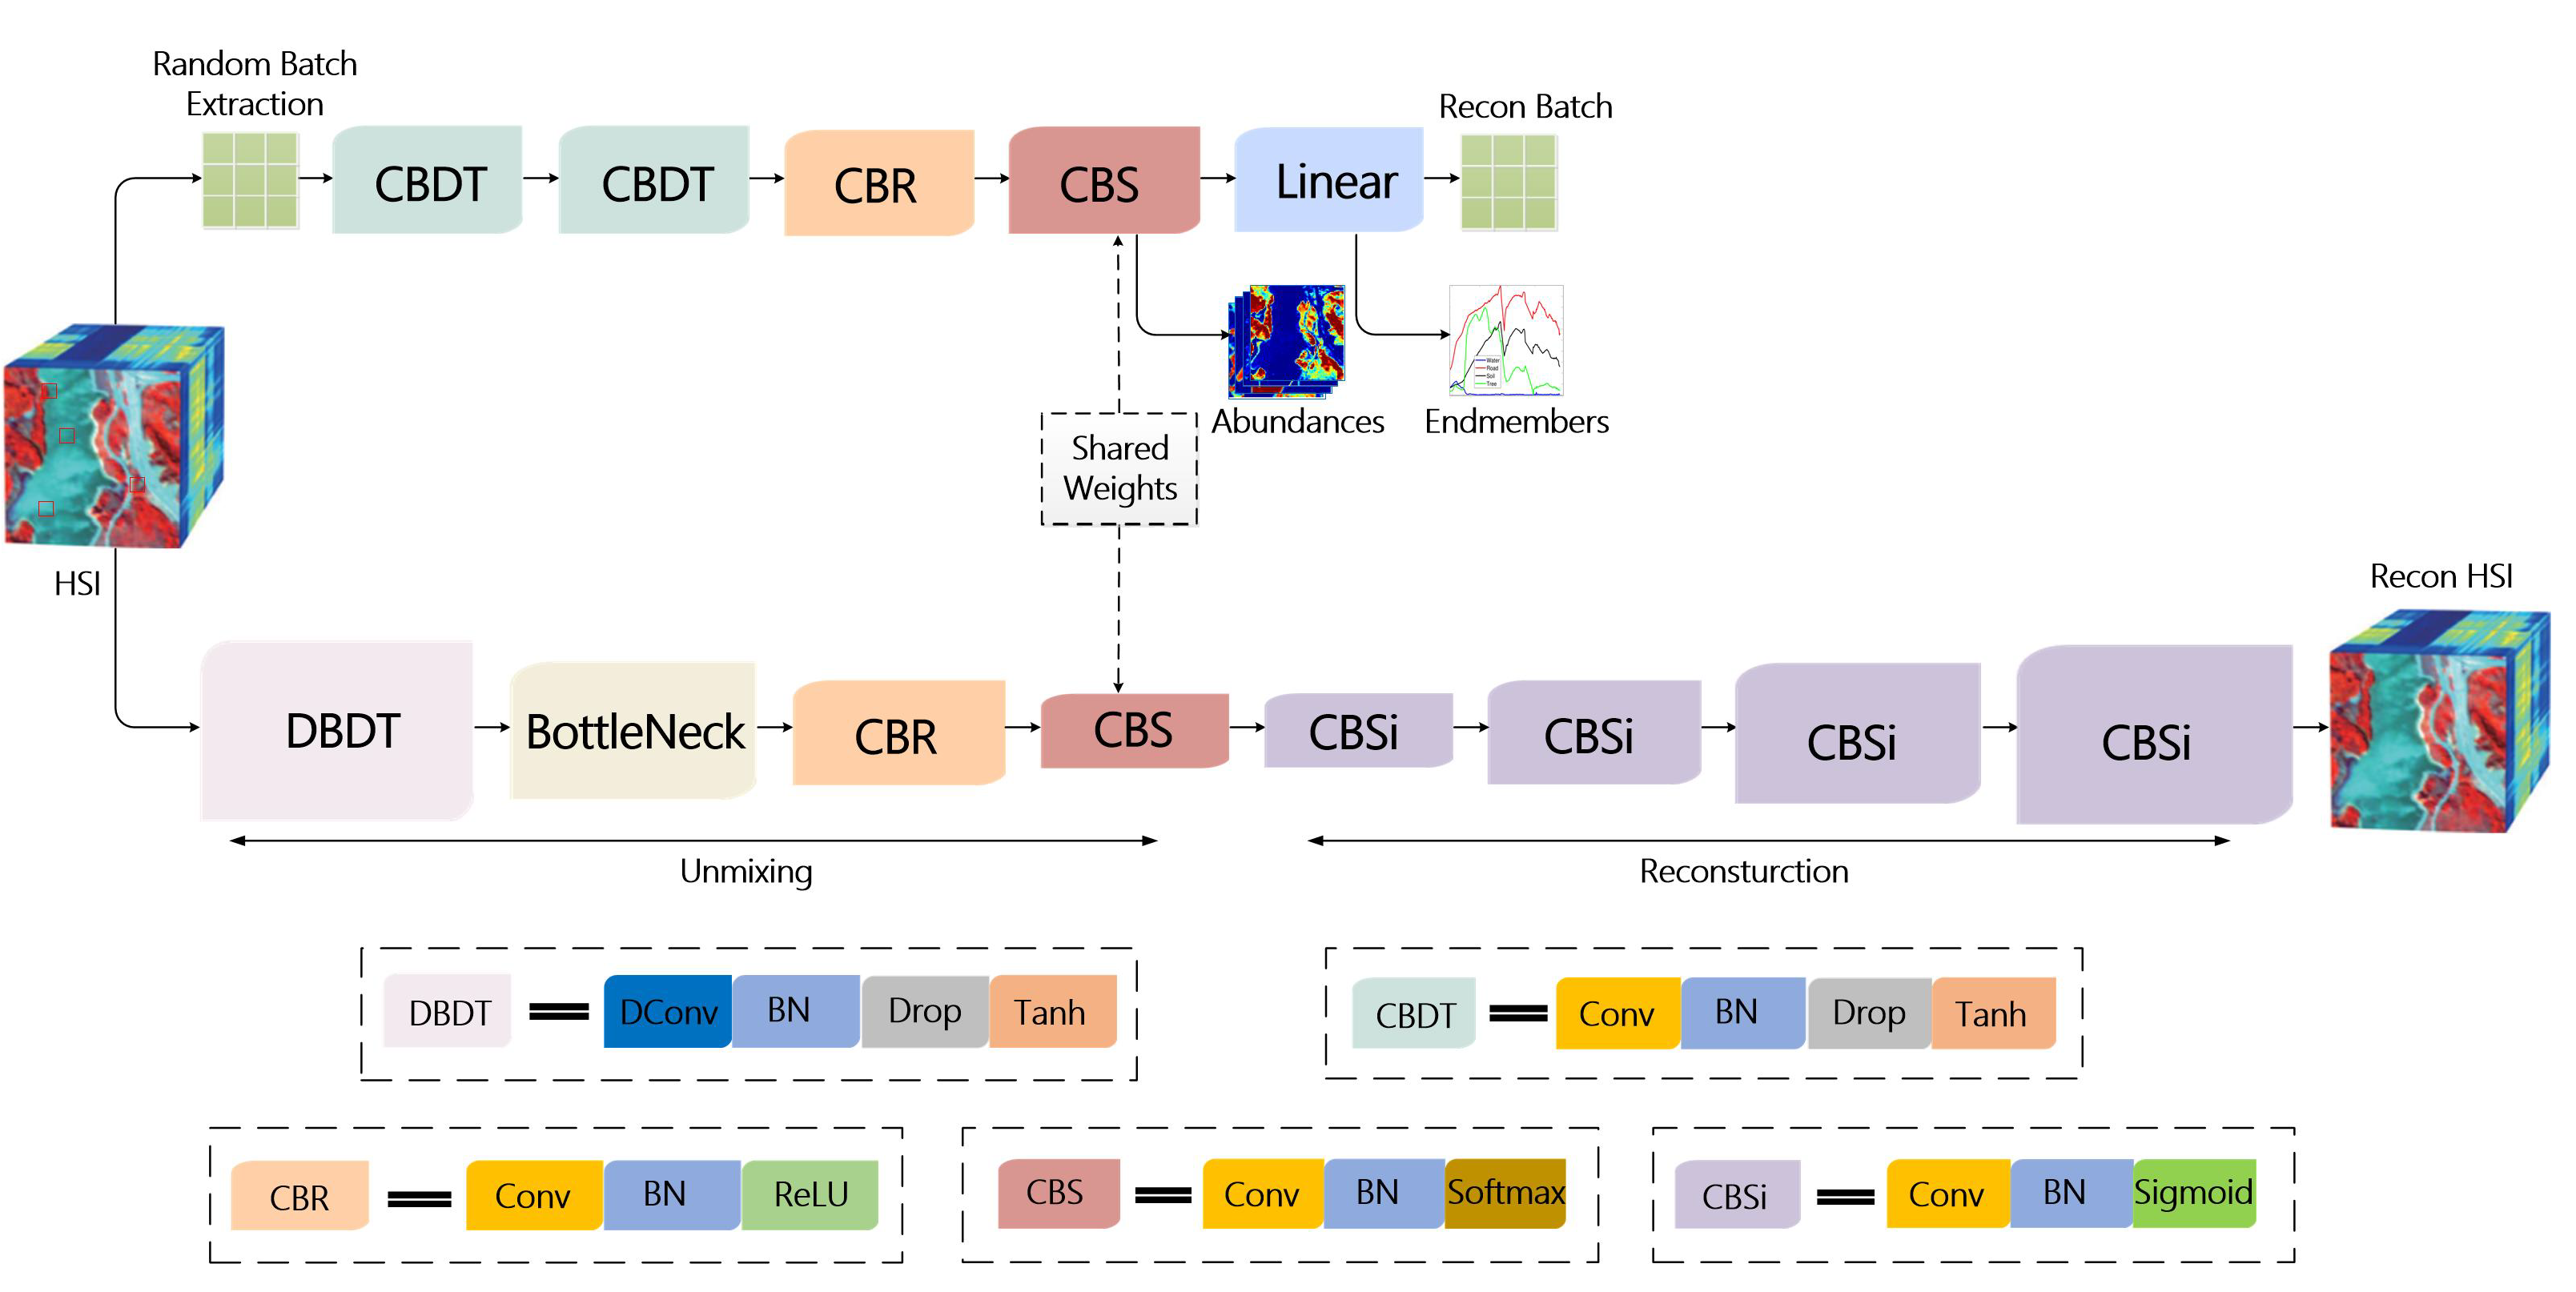
The above methods do not fully exploit the spatial–spectral information and ignore differences in the distribution of endmembers. To solve these problems, in this paper, a spatial-information-assisted spectral information learning unmixing network (SISLU-Net) is proposed. It has two branches. One branch focuses on the extraction of spectral information, where the HSI is divided into 1 × 1 pixels, and a random combination of several pixels is selected each time and sent into the network for training. Another branch uses DBDT and residual modules to learn the spatial information of the entire HSI. By sharing the weight, the lower branch can transfer the learned spatial information to the upper branch, which helps the upper branch network to better unmix the data [32]. Considering that the distribution of endmembers presents different problems, we employ a new loss function to deal with situations where there are different data distributions. More specifically, the contributions of this paper can be elaborated as follows:
(1) We propose an end-to-end two-branch network structure called SISLU-Net for HSI unmixing. The two branches collaborate on HU by sharing weights. Through the shared weight strategy, the lower branch transfers the learned spatial information to the upper branch, which then assists the upper branch to estimate the abundance and endmembers effectively and accurately.
(2) The main purpose of the upper branch of the network is to learn spectral information. Due to the similarity of adjacent regions, pixels from each region are extracted as randomly as possible from the global scene and transported into the network. Thus, the learned spectral information is more diverse and accurate.
(3) In another branch of the network, we introduce a bottleneck residual module, which combines low-level features with high-level features to achieve feature multiplexing. In addition, in the DBDT module, the dilated convolution obtains context information in a dilated manner, thus avoiding only learning local similar spatial information and making the network more comprehensive.
(4) Wing loss is employed as a new loss function in the proposed SISLU-Net. Wing loss is better compatible with data outliers and therefore able to solve the problem of differences in the distribution of endmembers. Experiments on the Samson and Jasper Ridge data sets verify the superiority of the proposed Wing loss compared to several commonly used loss functions.

2. Problem Formulation and Method

2.1. Linear Mixing Models

In this section, we mainly elaborate on the principles of LMM. LMM assumes that the observed spectrum is a linear combination of endmembers and their corresponding abundances. Accordingly, LMM can be expressed as:
Y = MA + N
where Y = y 1 , y 2 , , y N R L × N represents the observed HSI, containing L bands and N pixels. y i represents the ith spectral vector. M = m 1 , m 2 , , m P R L × P denotes the endmember matrix, P stands for the number of endmembers. A = a 1 , a 2 , , a N R P × N represents the abundance matrix and a i denotes the abundance fraction for each pixel. Each abundance vector a i ( i = 1 , . . . , N ) needs to satisfy physical constraints, namely an ANC and ASC constraint, and the constraint expression is as follows:
a i 0 j = 1 p a i j = 1
N R L × N represents the model error, including the Gaussian noise and other errors.

2.2. General Introduction to SISLU-Net

Since the convolutional neural network can transform the problem into a function curve fitting problem, by inputting hyperspectral data into the network, the network can fully learn the function curve relationship between the endmember and abundance and the original image, so that the unmixing task can be completed.Therefore, in this paper, we propose a new SISLU-Net, and the network structure diagram is shown in Figure 1. It is a dual-branch network that mainly utilizes convolutional operations for HU. Convolutional neural networks have the characteristics of local perception, and in the low-level feature extraction layer, there is no need to learn the global elements of the image, but rather to learn the features of local pixels. Then, local information from the low-level feature layer is integrated into the high-level layer to obtain sufficient spatial and spectral information.
On the whole, SISLU-Net is composed of two branches: a spectral convolutional network (SCN), and a spatial convolutional network (SPCN). The SCN takes the random extraction of a number of pixels as input, each pixel size is 1 × 1 . In SCN, we design spectral feature extraction modules such as CBDT and CBR modules, and let SCN learn the global spectral information by randomly combining pixels. The SPCN feeds the entire image into the network to learn the spatial information of the HSI, and also uses the DBDT and bottleneck residual module to assist in the learning of spatial information and features. In the CBS module, we design a shared weight strategy to enable the parameters in the two CBS modules to be updated synchronously, so that the spatial information learned in the SPCN is transferred to the SCN to assist SCN in unmixing. In addition, due to differences in the range of data distribution between materials, we introduced the Wing loss to deal with the data outliers problem.

2.3. Spectral Convolutional Network

The SCN is applied mainly through the random extraction of pixels to fully excavate the spectral information of HSIs, the random extraction method proposed in this paper is different from the previous extraction method [49]. Here, the pixels are extracted as randomly as possible at various locations, so that the trained network can fully consider the global spectral information, thus avoiding fixed pixel combinations resulting in the limitation of spectral information learning. The extraction of spectral information is mainly achieved through feature extraction modules such as CBDT and CBR. The combination inside the module is an optimal combination as verified in many experiments. In addition, through the shared weight strategy, the weights updated by the former are shared with the SPCN, which strengthens the connection between the two branches and thus realizes the interaction of specific information.
Given randomly extracted pixels y i i = 1 N R L × N with L bands by N pixels and abundances a i i = 1 N R P with P categories. The kth hidden feature representation obtained by the convolutional layer in the SCN, defined by h i ( k ) , can be then formulated as follows:
h i ( k ) = C o n v W c ( k ) , b c ( k ) , y i , k = 1 C o n v W c ( k ) , b c ( k ) , h i ( k 1 ) , k = 2 , , m
where C o n v is defined as a convolutional layer with the convolution kernel size of 1 × 1 and the stride of 1. The variables W c and b c represent the weight and bias of all layers ( k = 1 , 2 , , m ) in the SCN, respectively.
After going through the output of the convolutional layer, it is then fed into a batch normalization (BN) layer. We use the batch mean and standard deviation to adjust the network parameters and intermediate outputs to alleviate the problem of gradient explosion or disappearance during network training so that the network can converge faster. The output of the BN layer is formulated as follows:
h B N i ( k ) = α h i ( k ) + β
where h i ( k ) represents the output of the convolutional layer, and  α and β represent the parameters of the BN layer. In order to avoid the problem of overfitting in network training, after the BN layer, a dropout layer is used to drop some neural nodes with a certain probability p, and different neural nodes are sent to the network for training each time, which enhances the generalization ability of the model. Here, we use h D r o p i ( k ) to represent the output of the dropout layer, and the final representation of the nonlinear activation function after the output is a i ( k ) . Then, we have:
a i ( k ) = f h D r o p i ( k )
Because abundance is physically constrained, in the CBR and CBS modules, we use the ReLU nonlinear activation function to impose ANC constraint on the abundance and the ANC constraint on the Softmax layer. The formula is defined as follows:
a R e L U i ( k ) = f R e L U h B N i ( k ) = max 0 , h B N i ( k )
a S o f t i ( k ) = e a i ( l ) j = 1 P e a j ( l )
Through the Softmax function, the network outputs abundance. The pixels are then reconstructed through a linear layer while the endmembers are output.
In SISLU-Net, we use a new loss function, namely Wing loss [50], because the endmembers may be in different band fluctuation ranges, which likely leads to data outliers. Compared with L 1 loss and L 2 loss, Wing loss is better compatible with the data outlier range, which has the ability to cope with errors in small and medium ranges. Wing loss is defined as follows:
wing ( x ) = w ln ( 1 + | x | / ϵ ) if | x | < w | x | C otherwise
where w 0 , which limits the nonlinear part to the range of w , w , ϵ controls the degree of curvature of the curve. C is a constant that is used to connect the linear and nonlinear parts of the loss function. ϵ cannot be set too small, otherwise, the training may become unstable resulting in some very small errors that lead to gradient explosions. In the following, we use L w i n g l o s s to represent Wing loss. In SCN, the loss function consists of two reconstruction errors and one abundance error, which are defined as follows:
L S C N = α L w i n g l o s s y ^ s c n y s c n i + β L w i n g l o s s y ^ s c n w L i n e a r × a ^ s c n i + γ L w i n g l o s s a ^ s c n i a i
where y ^ s c n i = 1 N represents the reconstructed pixels. The  a ^ s c n i stands for the abundance of the output of SCN. The  a i represents the target abundance value. α , β , and  γ are used to balance the order of magnitude and importance of each loss. The values of α , β , and  γ will be proved in the following experiments.
Due to the local similarity of adjacent regions, the pixel block information extracted from adjacent regions has a large degree of similarity. The fixed pixel batches do not contain rich diverse spectra making it difficult for the network to learn the global spectral information. By randomly extracting pixels, the network can learn more comprehensively about the spectral information of the HSIs. In this way, the SCN can avoid the limitation of the learning direction of the model, so that the network can find a better learning direction. Here, the learning of spectral information features is mainly done through feature extraction modules such as CBDT and CBR. The determination of the combination in the module is based on the classic unmixing network and has been verified by many experiments. In addition, through the shared weight strategy, the CBS module can realize the synchronous update of parameters, so the spatial information learned by SPCN can be transferred to SCN, and the spectral unmixing of the SPCN is corrected and guided.

2.4. Spatial Convolutional Network

The SPCN also contains two modules of unmixing and reconstruction, and SPCN feeds the entire HSI into the network and trains jointly with SCN in a parameter-sharing manner. In the DBDT module, the dilated convolution [51] is used to expand the convolutional kernels’ receptive fields, which can achieve long-range extraction of spatial context information without increasing the amount of network computation. At the same time, the bottleneck residual module [52] is applied to better integrate low-level features with high-level features to avoid loss of low-level features in the process of network training and achieve feature reuse. In addition, the bottleneck residual module is used to alleviate the problem of gradient disappearance, which can effectively improve the network training efficiency.
(1) Dilated Convolution: In order to obtain more HSI spatial information, we usually expand the receptive field by increasing the size of the convolution kernel; however, this approach will reduce the spatial resolution of HSIs, resulting in the loss of some image feature information. In order to expand the receptive field without losing HSIs spatial resolution, we introduce the dilated convolution into the DBDT module. By introducing dilated convolution in this module, the network can learn rich spatial information of each region on the HSI at the low-level feature extraction layer, so that the high-level semantic information learned later is more real and effective. Compared with traditional convolution, dilated convolution is beneficial for capturing more information without affecting the extracted features while increasing the receptive field. After the introduction of dilated convolution, a  3 × 3 convolution kernel with an expansion rate of 2 will obtain the same receptive fields as the 5 × 5 convolution kernel without a significant increase in computational effort. Compared with the traditional convolution calculation, the efficiency is improved and the extracted features are more comprehensive. The traditional convolutional and expanded convolutional receptive field sizes are shown in Figure 2. The dilated convolutional expansion rate used in this paper is 2.
(2) Bottleneck Residual Module: In SPCN, we take advantage of the residual thought and adopt a bottleneck residual module. Compared with the common convolutional group, with the use of the bottleneck residual module, the amount of parameters is significantly reduced, which can speed up the network training. In addition, the bottleneck residual module can achieve better feature reuse, and the effective features discarded before can be retained and reused in the advanced feature extraction layer. However, the common convolutional group cannot reuse the discarded features. The obtained abundance maps are clearer through feature reuse. The network structure of the bottleneck residuals module used in this paper is shown in Table 1.
Finally, optimization of the SPCN is achieved by minimizing the cost of the reconstruction as follows:
L S P C N = L w i n g l o s s Y ^ s p c n Y s p c n i
where Y ^ s p c n represents the reconstructed HSI and δ is a hyperparameter. Thus, the loss function of the network as a whole is:
L = L S C N + L S P C N

2.5. Clarifying Details on Our Network Architecture

For the SCN sub-branch, we use a convolutional kernel with a size of 1 × 1 in the convolutional layer. The step size is set to 1, the nonlinear activation function used is Tanh, and the ANC and ASC constraints on abundance are realized by ReLU and Softmax activation functions, respectively. In SPCN, a dilated convolution of size 3 × 3 with a dilation rate of 2 is used. In addition, SPCN has a bottleneck residual module. The activation function used in the reconstruction part is the Sigmoid function. The optimization of the SISLU-Net uses the Adam with decoupled weight decay (AdamW) optimizer, and the learning rate is set to 0.1. The deep network construction platform is Pytorch. The detailed structure of each layer of the SISLU-Net is shown in Table 2. In addition, the pseudocode of the proposed SISLU-Net is summarized in Algorithm 1.
Algorithm 1: SISLU-Net for HSI Unmixing
Input: 
y scn i R L × N with L bands by N pixels and y spcn i R L × N are denoted as the SCN and SPCN inputs, respectively. a i R P with P categories are the abundance priors.
Output: 
Estimated endmembers and abundances.
1:
Set batch size = 1000 (For Jasper Ridge Dataset), optimizer AdamW (learning rate = 0.1), epochs = 200.
2:
for each i [ 1 , 200 ]  do
3:
   Randomly select several y scn i for combination input SCN.
4:
   Input y scn i to CBDT and CBR modules to extract the spectral features, denoted as h i .
5:
   Input y spcn i to DBDT and BottleNeck modules to fully mine HSI’s spatial information and realize feature multiplexing. Here, the spatial features are denoted as f i .
6:
    h i and f i implement parameter sharing on the CBS module and share feature information with each other.
7:
   Input h i to CBS module and linear layer to get estimated endmembers and abundances, respectively, and reconstructs random pixels finally.
8:
   Reconstruct f i by four CBSi modules and update the network parameters using the Wing loss function.
9:
   The updated parameters are passed to SCN by the sharing strategy, and the estimated endmembers and abundances are updated simultaneously.
10:
end for
11:
For datasets with similar scenarios, the trained network can be used to obtain the estimated abundances and endmembers.

3. Experiments

3.1. Data Description

The experiments were conducted on one simulated data set and four real data sets, which are described below.
(1) Synthetic Dataset: The simulated dataset consists of four reference endmembers selected from the ASTER spectral library. The spatial size of the dataset is 60 × 60 . The four endmebers are: Limestone, Basalt, Concrete and Asphalt, and the full map contains 200 spectral bands with a wavelength range of 0.4 μ m 14 μ m . To better simulate the variability of the endmembers in the real datasets, on the basis of the original dataset, the asphalt material is used as the image background, and the remaining several materials are placed in the corner of the image. The specific generation steps of the endmembers are given in [53] and the procedure of producing the abundance maps is referred from [54]. Figure 3a,b show the false color images and the corresponding reference endmembers, respectively.
(2) Samson Dataset: The Samson dataset was captured via the SAMSON sensor [55], which is a dataset commonly used for HU. The original image contains 952 × 952 pixels and 156 bands (as shown in Figure 4a). The scene used here has 95 × 95 pixels cropped from the original image with a wavelength range from 0.401 to 0.889 μ m . There are three main endmembers (i.e., Soil, Tree, and Water). The ground truth endmembers are shown in Figure 4b, where the ground truth endmembers were manually selected from the HSI, and the ground truth fraction abundances were generated using FCLSU [56].
(3) Jasper Ridge Dataset: The Jasper Ridge dataset was captured using the Jet Propulsion Laboratory’s (JPL) Airborne Visible/Infrared Imaging Spectrometer (VIRIS). The original image has 512 × 614 pixels, with a wavelength range of 0.38 to 2.50 μ m and 224 bands (as shown in Figure 5a). We cut the popular region of interest (ROI) of 100 × 100 pixels in size from the original image, removing bands affected by water vapor and atmosphere, and finally retaining 198 bands. There are four main endmembers (i.e., tree, water, soil, and road). The ground truth endmembers are shown in Figure 5b, which is provided by [47].
(4) Washington DC Mall Dataset: The dataset for the Washington DC Mall dataset was captured at a Washington DC Mall using Hyperspectral Digital Image Collection Experiment (HYDICE) sensor (https://engineering.purdue.edu/biehl/MultiSpec/hyperspectral.-html, accessed on: 28 February 2020). The original image has 1208 × 307 pixels, with a wavelength range of 0.4 μ m 2.4 μ m , and contains 210 bands. Figure 6a shows the cropped data used herein, the data size is 319 × 292 pixels in the wavelength range of 0.4 to 0.24 μ m , the bands affected by water vapor and noise are removed, and finally 191 bands are left. We manually select six endmembers (i.e., grass, tree, roof, road, water, and trail) from the HSI (Figure 6b) as the ground truth endmembers and use FCLSU to estimate the ground truth fractional abundance. Here, the ground truth abundance is provided by [48].

3.2. Experimental Setup

We selected six state-of-the-art unmixing methods for comparison, including NMF-QMV [57], Collaborative SUnSAL (CLSUnSAL) [26], uDAS [42] CyCUNet [47], MiSiCNet [48], EGU-Net [58]. Among these methods, CLSUnSAL, uDAS and CyCUNet use the VCA method for initialization. NMF-QMV and MisiCNet make use of the minimum simplex volume method. CLSUnSAL utilizes a large spectral library that endmembers are sparsely distributed in this library, thus improving unmixing results via collaborative sparse regression. NMF-QMV is a typical representative of blind unmixing. UDAS considers the optimization of the network denoising ability when dealing with the unmixing problem. By incorporating the denoising constraint into the autoencoder network, it can improve the network denoising ability and avoid introducing additional reconstruction errors. CyCUNet applies the cycle consistency constraint simultaneously through cascaded autoencoders. The high-level semantic information of HSI can be preserved so that the network can obtain better unmixing ability. MiSiCNet uses the minimal simplex constraint to add geometric information to the network. EGU-Net also employs a dual branch structure, and the upper branch of the network uses extracted pure endmembers to supervise and guide the lower branch network.
The detailed setup of the proposed SISLU-Net is described in detail in Section 2.5. All comparison methods use default parameters. In the experiment, the magnitude of error between the estimated abundance and GT is quantitatively measured using root mean square error (RMSE), and the angular distance between the estimated endmembers and the reference endmembers is measured using the spectral angle distance (SAD). The SAD and RMSE are defined as:
SAD m ^ i , m i = 1 P i = 1 P arccos m ^ i T m i m ^ i m i
RMSE a ^ j , a j = 1 N j = 1 N a ^ j a j 2 2
where m ^ i and m i represent the estimated endmember of the network and the reference endmember, respectively. a ^ j and a j represent the estimated abundance and the target abundance, respectively.

3.3. Experiment on Synthetic Dataset

(1) Noise Robustness Analysis: To evaluate the robustness of the proposed SISLU-net to noise, we add Gaussian noise to the simulated dataset and obtain the noisy data with 20, 30, and 40 dB, respectively. Table 3 shows the results of SAD quantification for different methods at different signal-to-noise ratios. As can be seen from the table, the EGU-Net results are the worst, probably due to the small size of the simulation dataset and the insufficient amount of training data required by the network, so the information learned by the network is limited. MiSiCNet and NMF-QMV perform poorly. CLSUnSAL and CyCUNet produe better results; howevevr, the results are not competitive compared with uDAS and SISLU-Net. It can be seen from Table 3 that uDAS demonstrates good robustness to noise due to the consideration of denoising. SISLU-Net obtains the best results at 20 dB 30 dB and 40 dB. The overall results confirm that SISLU-Net is robust to noise.
Table 4 reports the RMSE results of the simulated dataset. The trend is generally similar to SAD results. Specifically, the EGU-Net has achieved good results owing to the use of the pure abundance of the extract as self-supervision; however, its endmember results are poor. The difference observed between the endmember and the abundance results may be due to the poor fit between the small size of the dataset and the network training curve. In contrast, the RMSE results obtained by SISLU-Net are generally superior to those of other methods. The reason for this may be that SISLU-Net takes into account both spatial and spectral information by using sharing strategy, and employs the DBDT module and bottleneck residual modules to assist feature learning. In general, compared with other methods, SISLU-Net can obtain lower RMSE and SAD values, which indicates the robustness and superiority of this method. Figure 7 and Figure 8 show the abundances and endmembers estimated by different unmixing methods on the simulated dataset (30 dB). The figures show the endmembers and abundances obtained by SISLU-Net and other methods. As can be seen from Figure 7, SISLU-Net provides a more accurate estimation of abundances and the abundance maps look cleaner. From Figure 8, we can see that SISLU-Net successfully estimates all the endmembers, which are well-matched to the reference endmembers. CLSUnSAL achieves good results; however, its abundance estimation effect is slightly worse than SISLU-Net. Overall, SISLU-Net demonstrates a good trade-off between abundance and endmember estimation.
(2) Impact of SPCN: In order to confirm the effectiveness of spatial information obtained by SPCN in assisting SCN unmixing, in this experiment, we test the unmixing performance of SISLU-Net after SPCN removal. Table 3 and Table 4 show the results of the endmember and abundance estimation, respectively. We can observe that SISLU-Net without SPCN gets poor RMSE and SAD values. Figure 7 and Figure 8 show the resulting endmembers and abundance maps. It is also clear that many discrete and isolated points appear in the abundance of Asphalt and Limestone materials. This shows that the extraction of spectral information from HSIs alone does not achieve satisfactory results, and the parameters shared with SPCN make it possible to fully exploit both spatial information and spectral information during the unmixing process, further improving unmixing performance.
(3) The effectiveness of using Wing loss: To verify the effectiveness of the Wing loss function in dealing with the inconsistent distribution of each endmembers, we compare the Wing loss function with the commonly used L 1 loss function and L 2 loss function. Because there are clear differences between water and other materials in the spectrum, we choose to experiment on the Samson dataset and Jasper Ridge dataset. The experimental results are shown in Table 5 and Table 6. We can observe that the L 1 loss function and L 2 loss function are not ideal for water discrimination. The reason is that the water is significantly different from other materials in the spectrum, the L 1 loss function and L 2 loss function cannot handle data with large differences well. Wing loss can well solve the problem of inconsistent distribution between water and other materials. Therefore, compared with L 1 loss and L2 loss, Wing loss can better handle data outliers problems.
(4) Impact of DBDT and bottleneck residual module: In order to verify the effectiveness of SPCN’s DBDT module and bottleneck residual module in assisting to extract spatial information, we conducted comparative experiments. In the experiment, we tested the unmixing effect of removing, adding and removing the two modules. Table 7 shows the results of endmember and abundance estimation, respectively. After removing these two modules, we can observe that the SISLU-Net obtains poor RMSE and SAD values. When these two modules are added separately, the experimental results are improved. This shows that the DBDT module is effective for auxiliary spatial information extraction, and the feature reuse of bottleneck residual modules can also help the network learn more efficiently.

3.4. Experiment on Samson Dataset

Table 8 shows the abundance RMSE and endmember SAD obtained by different unmixing techniques on the Samson dataset. As can be seen from Table 8, CLSUnSAL and NMF-QMV exhibit poor results compared to DL-based methods. This also shows the advantages of using DL methods for HU.
We can see that SISLU-Net achieves better endmember estimation compared with the suboptimal results given by CyCUNet. SISLU-Net performs 0.0322 and 0.004 better in Tree and Water materials, respectively, and SISLU-Net performs slightly worse SAD in Soil than CyCUNet. However, overall, the mean SAD of SISLU-Net is optimal. UDAS adds physical constraints to the network by imposing non-negative constraints and denoising constraints, and also achieves good results in the estimation of end members. In addition, EGU-Net has also achieved more accurate results in endmember estimation due to the guidance of the extracted pure materials and the collaboration of double branches. In terms of abundance estimation, the proposed SISLU-Net obtains the lowest RMSE value, and the MiSiCNet obtains suboptimal values. However, in terms of abundance and endmember estimation, SISLU-Net delivers better performance. In particular, the proposed method has a significantly better effect on the unmixing of water. The reason for this is that the Wing loss takes into account the widely varying data between bands. Figure 9 and Figure 10 illustrate the estimated abundances and endmembers obtained by different techniques. We can see that the abundance maps obtained by SISLU-Net are very close to the GT in Figure 9, and the endmember curves are also very close to the reference endmembers.

3.5. Experiment on Jasper Ridge Dataset

In this subsection, all the above unmixing techniques are applied to the Jasper Ridge dataset. Table 9 quantitatively lists the performance of all competing methods. As we can see from the table, the DL-based approaches perform better than the non-DL-based approaches. The proposed SISLU-Net achieves the best results in Tree, Water, and Soil materials. Meanwhile, the RMSE of abundance estimation is also optimal. Similarly, due to the use of Wing loss, the unmixing effect of water is significantly better than other methods. On this dataset, the EGU-Net obtains suboptimal results. The reasons for this have already been mentioned above. Although uDAS takes into account the effect of denoising on the unmixing performance, as a deep encoder network, it does not take into account spatial and geometric information, so the overall result is poor. The unmixing results of MiSiCNet are not ideal due to its inability to fully learn the spatial and spectral information of HSIs. The abundance maps of the Jasper Ridge dataset are shown in Figure 11. It can be clearly observed that most comparison methods do not completely separate the road. However, as shown in Figure 11, SISLU-Net, due to its strong learning ability, fully integrates the spectral information and spatial information, and better separates the road. The endmember visualization results are shown in Figure 12.

3.6. Experiment on Washington DC Mall Dataset

Table 10 shows the abundance of RMSE and endmember SAD for the Washington DC Mall dataset. On this dataset, SISLU-Net increases the overall abundance of RMSE and SAD by 0.114 and 0.0135 degrees over the second-best results provided by EGU-Net, respectively.
As we can see from Table 10, most methods demonstrate poor endmember estimation for the grass and tree materials. CLSUnSAL and NMF-QMV obtain moderate results on the Washington DC Mall dataset, which may be attributed to the optimization of regularization terms for the selection of regularization parameters. Because uDAS ignores the spatial and geometric information of the HSI, it also produces some errors in the estimation of endmembers and abundances. CyCUNet exhibits the worst result, probably due to the complexity of the Washington DC Mall dataset. It cannot obtain a better endmember estimation through VCA. SISLU-Net exhibits significant improvements in the grass and roof materials through the fusion of spatial information and spectral information. In addition, SISLU-Net enhances spatial information learning through the use of DBDT and residual modules. Overall, SISLU-Net can achieve better competitive results in terms of mean SAD and RMSE than other comparison methods. The visualization results of the endmembers and the abundances are shown in Figure 13 and Figure 14, respectively.

4. Discussion

4.1. Hyperparameter Sensitivity Analysis

In this section, we discuss the sensitivity of SISLU-Net to the selection of hyperparameters. We have selected four of the most important hyperparameters that affect SISLU-Net performance: the loss function parameter, the learning rate, the kernel size and the activation function.
(1) Loss Function Parameter:Figure 15 shows the RMSE values as a function of three weight parameters in Wing loss. The Wing loss function contains two reconstruction errors and one abundance error. Reconstruction error is a commonly used loss item for deep unmixing problems. The first reconstruction error focuses on pixel-level reconstruction. By comparing the reconstructed data with the original data, the accuracy of the network estimated endmembers and abundances could be adjusted. However, it is not enough to focus solely on pixel-level errors, which may result in small reconstruction errors but significantly incorrect estimated endmembers and abundances. Therefore, we employ the estimated endmembers and abundances to add a second reconstruction error. The main purpose behind this is to prevent the network from focusing only on the overall loss, so as to prevent the network from the training stage. To minimize the overall reconstruction error, the endmembers and abundances estimation will have a large deviation. Therefore, the performance of the proposed SISLU-Net is, to some extent, sensitive to the settings of three parameters ( α , β , and γ ) in the loss function. Meanwhile, in order to ascertain the optimal settings of those parameters and adjust the weight of each loss function, the network is suggested to pay different levels of attention to the loss items. For these reasons, the corresponding experiments are conducted to investigate the effects of parameter setting, as shown in Figure 15. When α = 0.5 , we can see that the best RMSE is obtained on three datasets. Although the result of the Jasper Ridge dataset is slightly worse than α = 0.5 , on the whole, α = 0.5 is more appropriate. For β , when the value of β is 0.5, the best result is obtained on all datasets. For the third parameter, we set the value of γ to about 0.2 to bias the loss function toward the optimization direction. In practice, the value of γ will be adjusted to around 0.2 according to the specific situation.
(2) Learning Rate:Figure 16a shows the loss function values at learning rates (LR) of 1, 0.1, 0.01, and 0.001, respectively. For LR = 1, the loss function values show a large variation. At LR = 0.001, there is less variation in the curve varies; however, the loss function converges to a relatively high minimum. At LR = 0.01, the loss declines too rapidly in the early stage, it is easy to skip the network optimal value, and the curve shows that the change is small. For the LR = 0.1 curve, fluctuation is moderate, and the loss function converges to a smaller value. Therefore, we recommend using LR = 0.1 for the proposed methodology.
(3) Kernel Size:Figure 16b shows the abundance RMSE in relation to the kernel size used in the convolutional layer. We adjusted all convolution kernels in SPCN to sizes of 1 × 1 and 5 × 5 , respectively. The figure shows that the convolution kernel size set by our network obtained the optimal value in abundance estimation, thus confirming our choice.
(4) Activation Function:Figure 16c shows the effect of employing activation functions on network unmixing performance. We replaced Tanh and Sigmoid with the ReLU activation function. It can be seen that, compared with using a single activation function, multiple activation functions can strengthen the curve-fitting ability of the network, thus improving the unmixing performance.

4.2. Processing Time

Table 11 shows the processing time of all methods on three real datasets. Among them, CLSUnSAL and NMF-QMV are implemented in Matlab (2018b). The rest of the methods are run in PyCharm (2021). Experiments are conducted on a computer with a 2.20-GHz Intel(R) Xeon(R) Silver 4210 CPU and 128 GB of memory. The results obtained are averaged over five times. As can be seen from the table, the DL-based method requires more time in general, but according to the efficiency of GPU programming, the DL-based methods can be improved by the use of a GPU. Therefore, the computational cost is deemed acceptable.

5. Conclusions

In this paper, we propose a double-branch HU network referred to as SISLU-Net. The network is composed of two subbranches: SCN and SPCN. SCN focuses on the learning of global spectral information and SPCN focuses on the learning of spatial information in HSIs. In SCN, modules such as CBDT and CBS are designed for the learning of HSI spectral feature information. The DBDT and bottleneck residual modules are employed in SPCN to promote the spatial feature extraction of HSIs by the network. This allows the network to learn more comprehensive spatial information. With the sharing-weight strategy, the learned spatial information is assisted in spectral unmixing. In addition, given that the spectral distribution of the endmembers may be inconsistent, we employ Wing loss to handle this problem. Experimental results on synthetic and real hyperspectral datasets demonstrate that the proposed SISLU-Net architecture performs well. In future research, we consider further optimizing the network loss function and designing more efficient network structures to further enhance the unmixing effect.

Author Contributions

Conceptualization, Y.C. and L.S.; methodology, Y.C.; software, Y.C.; validation, L.S.; investigation, Y.C. and L.S.; writing—original draft preparation, Y.C.; writing—review and editing, L.S., and B.L.; visualization, Y.C.; supervision, B.L., and L.S; funding acquisition, B.L. All authors have read and agreed to the published version of the manuscript.

Funding

This study was supported by the National Natural Science Foundation of China under grants Nos. 61971233, 62076137, and 61901191, in part by the Shangdong Provincial Natural Science Foundation under Grant No. ZR2020LZH005, in part by the China Postdoctoral Science Foundation under Grant No. 2022M713668.

Data Availability Statement

The data presented in this study are available in the article.

Acknowledgments

The authors thank the anonymous reviewers and the editors for their insightful comments and helpful suggestions that helped improve the quality of our manuscript.

Conflicts of Interest

The authors declare no conflict of interest.

References

  1. Turner, W.; Spector, S.; Gardiner, N.; Fladeland, M.; Sterling, E.; Steininger, M. Remote sensing for biodiversity science and conservation. Trends Ecol. Evol. 2003, 18, 306–314. [Google Scholar]
  2. Hong, D.; He, W.; Yokoya, N.; Yao, J.; Gao, L.; Zhang, L.; Chanussot, J.; Zhu, X. Interpretable hyperspectral artificial intelligence: When nonconvex modeling meets hyperspectral remote sensing. IEEE Geosci. Remote Sens. Mag. 2021, 9, 52–87. [Google Scholar]
  3. Sun, L.; Cheng, S.; Zheng, Y.; Wu, Z.; Zhang, J. SPANet: Successive Pooling Attention Network for Semantic Segmentation of Remote Sensing Images. IEEE J. Sel. Top. Appl. Earth Obs. Remote Sens. 2022, 15, 4045–4057. [Google Scholar]
  4. Sun, L.; Fang, Y.; Chen, Y.; Huang, W.; Wu, Z.; Jeon, B. Multi-structure KELM with attention fusion strategy for hyperspectral image classification. IEEE Trans. Geosci. Remote Sens. 2022, 60, 1–17. [Google Scholar]
  5. Allan, A.; Soltani, A.; Abdi, M.H.; Zarei, M. Driving Forces behind Land Use and Land Cover Change: A Systematic and Bibliometric Review. Land 2022, 11, 1222. [Google Scholar]
  6. Zhu, Q.; Guo, X.; Deng, W.; Guan, Q.; Zhong, Y.; Zhang, L.; Li, D. Land-use/land-cover change detection based on a Siamese global learning framework for high spatial resolution remote sensing imagery. ISPRS J. Photogramm. Remote Sens. 2022, 184, 63–78. [Google Scholar]
  7. Wang, K.; Du, S.; Liu, C.; Cao, Z. Interior Attention-Aware Network for Infrared Small Target Detection. IEEE Trans. Geosci. Remote Sens. 2022, 60, 1–13. [Google Scholar]
  8. Li, Q.; Li, Z.; Shi, Z.; Fan, H. Application of Helbig integrals to magnetic gradient tensor multi-target detection. Measurement 2022, 200, 111612. [Google Scholar]
  9. Wu, X.; Hong, D.; Tian, J.; Chanussot, J.; Li, W.; Tao, R. ORSIm detector: A novel object detection framework in optical remote sensing imagery using spatial-frequency channel features. IEEE Trans. Geosci. Remote Sens. 2019, 57, 5146–5158. [Google Scholar]
  10. Jin, Q.; Ma, Y.; Mei, X.; Dai, X.; Li, H.; Fan, F.; Huang, J. Gaussian mixture model for hyperspectral unmixing with low-rank representation. In Proceedings of the IGARSS 2019-2019 IEEE International Geoscience and Remote Sensing Symposium, Yokohama, Japan, 28 July–2 August 2019; pp. 294–297. [Google Scholar]
  11. Jin, Q.; Ma, Y.; Mei, X.; Li, H.; Ma, J. UTDN: An unsupervised two-stream Dirichlet-Net for hyperspectral unmixing. In Proceedings of the ICASSP 2021–2021 IEEE International Conference on Acoustics, Speech and Signal Processing (ICASSP), Toronto, ON, Canada, 6–11 June 2021; pp. 1885–1889. [Google Scholar]
  12. Bioucas-Dias, J.M.; Plaza, A.; Dobigeon, N.; Parente, M.; Du, Q.; Gader, P.; Chanussot, J. Hyperspectral unmixing overview: Geometrical, statistical, and sparse regression-based approaches. IEEE J. Sel. Top. Appl. Earth Obs. Remote Sens. 2012, 5, 354–379. [Google Scholar]
  13. Zhang, J.; Zhang, X.; Meng, H.; Sun, C.; Wang, L.; Cao, X. Nonlinear Unmixing via Deep Autoencoder Networks for Generalized Bilinear Model. Remote Sens. 2022, 14, 5167. [Google Scholar]
  14. Ma, W.K.; Bioucas-Dias, J.M.; Chan, T.H.; Gillis, N.; Gader, P.; Plaza, A.J.; Ambikapathi, A.; Chi, C.Y. A signal processing perspective on hyperspectral unmixing: Insights from remote sensing. IEEE Signal Process. Mag. 2013, 31, 67–81. [Google Scholar]
  15. Tang, M.; Gao, L.; Marinoni, A.; Gamba, P.; Zhang, B. Integrating spatial information in the normalized P-linear algorithm for nonlinear hyperspectral unmixing. IEEE J. Sel. Top. Appl. Earth Obs. Remote Sens. 2017, 11, 1179–1190. [Google Scholar]
  16. Marinoni, A.; Plaza, J.; Plaza, A.; Gamba, P. Nonlinear hyperspectral unmixing using nonlinearity order estimation and polytope decomposition. IEEE J. Sel. Top. Appl. Earth Obs. Remote Sens. 2015, 8, 2644–2654. [Google Scholar]
  17. Marinoni, A.; Gamba, P. Improving reliability in nonlinear hyperspectral unmixing by multidimensional structural optimization. IEEE Trans. Geosci. Remote Sens. 2019, 57, 5211–5223. [Google Scholar]
  18. Nascimento, J.M.; Dias, J.M. Vertex component analysis: A fast algorithm to unmix hyperspectral data. IEEE Trans. Geosci. Remote Sens. 2005, 43, 898–910. [Google Scholar]
  19. Winter, M.E. N-FINDR: An algorithm for fast autonomous spectral end-member determination in hyperspectral data. In Proceedings of the SPIE’s International Symposium on Optical Science, Engineering, and Instrumentation, Denver, CO, USA, 18–23 July 1999; Volume 3753, pp. 266–275. [Google Scholar]
  20. Boardman, J.; Kruscl, F.; Grccn, R. Mapping target signatures via partial unmixing of AVIRIS data. Summaries of the Fifth Annual JPL Airborne Earth Science Workshop; NASA: Washington, DC, USA, 1995. [Google Scholar]
  21. Li, J.; Agathos, A.; Zaharie, D.; Bioucas-Dias, J.M.; Plaza, A.; Li, X. Minimum volume simplex analysis: A fast algorithm for linear hyperspectral unmixing. IEEE Trans. Geosci. Remote Sens. 2015, 53, 5067–5082. [Google Scholar]
  22. Nascimento, J.M.; Bioucas-Dias, J.M. Hyperspectral unmixing based on mixtures of Dirichlet components. IEEE Trans. Geosci. Remote Sens. 2011, 50, 863–878. [Google Scholar]
  23. Loughlin, C.; Pieper, M.; Manolakis, D.; Bostick, R.; Weisner, A.; Cooley, T. Efficient hyperspectral target detection and identification with large spectral libraries. IEEE J. Sel. Top. Appl. Earth Obs. Remote Sens. 2020, 13, 6019–6028. [Google Scholar]
  24. Bioucas-Dias, J.M.; Figueiredo, M.A. Alternating direction algorithms for constrained sparse regression: Application to hyperspectral unmixing. In Proceedings of the 2010 2nd Workshop on Hyperspectral Image and Signal Processing: Evolution in Remote Sensing, Reykjavik, Iceland, 14–16 June 2010; pp. 1–4. [Google Scholar]
  25. Iordache, M.D.; Bioucas-Dias, J.M.; Plaza, A. Total variation spatial regularization for sparse hyperspectral unmixing. IEEE Trans. Geosci. Remote Sens. 2012, 50, 4484–4502. [Google Scholar]
  26. Iordache, M.D.; Bioucas-Dias, J.M.; Plaza, A. Collaborative sparse regression for hyperspectral unmixing. IEEE Trans. Geosci. Remote Sens. 2013, 52, 341–354. [Google Scholar]
  27. Huang, J.; Huang, T.Z.; Zhao, X.L.; Deng, L.J. Nonlocal tensor-based sparse hyperspectral unmixing. IEEE Trans. Geosci. Remote Sens. 2020, 59, 6854–6868. [Google Scholar]
  28. Xue, J.; Zhao, Y.; Huang, S.; Liao, W.; Chan, J.C.W.; Kong, S.G. Multilayer sparsity-based tensor decomposition for low-rank tensor completion. IEEE Trans. Neural Netw. Learn. Syst. 2021, 33, 6916–6930. [Google Scholar]
  29. Xue, J.; Zhao, Y.; Bu, Y.; Chan, J.C.W.; Kong, S.G. When Laplacian Scale Mixture Meets Three-Layer Transform: A Parametric Tensor Sparsity for Tensor Completion. IEEE Trans. Cybern. 2022, 52, 13887–13901. [Google Scholar]
  30. Xu, X.; Song, X.; Li, T.; Shi, Z.; Pan, B. Deep Autoencoder for Hyperspectral Unmixing via Global-Local Smoothing. IEEE Trans. Geosci. Remote Sens. 2022, 60, 1–16. [Google Scholar]
  31. Ghosh, P.; Roy, S.K.; Koirala, B.; Rasti, B.; Scheunders, P. Hyperspectral Unmixing Using Transformer Network. IEEE Trans. Geosci. Remote Sens. 2022, 60, 1–16. [Google Scholar]
  32. Qi, L.; Gao, F.; Dong, J.; Gao, X.; Du, Q. SSCU-Net: Spatial–Spectral Collaborative Unmixing Network for Hyperspectral Images. IEEE Trans. Geosci. Remote Sens. 2022, 60, 1–15. [Google Scholar]
  33. Plaza, J.; Plaza, A.; Perez, R.; Martinez, P. On the use of small training sets for neural network-based characterization of mixed pixels in remotely sensed hyperspectral images. Pattern Recognit. 2009, 42, 3032–3045. [Google Scholar]
  34. Licciardi, G.A.; Del Frate, F. Pixel unmixing in hyperspectral data by means of neural networks. IEEE Trans. Geosci. Remote Sens. 2011, 49, 4163–4172. [Google Scholar]
  35. Kong, F.; Chen, M.; Cao, T.; Meng, Y. Spectral-Spatial Hyperspectral Unmixing Method Based on the Convolutional Autoencoders. In Proceedings of the International Conference in Communications, Signal Processing, and Systems; Springer: Berlin/Heidelberg, Germany, 2022; pp. 881–886. [Google Scholar]
  36. Hong, D.; Chanussot, J.; Yokoya, N.; Heiden, U.; Heldens, W.; Zhu, X.X. WU-Net: A weakly-supervised unmixing network for remotely sensed hyperspectral imagery. In Proceedings of the IGARSS 2019-2019 IEEE International Geoscience and Remote Sensing Symposium, Yokohama, Japan, 28 July–2 August 2019; pp. 373–376. [Google Scholar]
  37. Jin, Q.; Ma, Y.; Fan, F.; Huang, J.; Mei, X.; Ma, J. Adversarial autoencoder network for hyperspectral unmixing. IEEE Trans. Neural Netw. Learn. Syst. 2021. [Google Scholar] [CrossRef]
  38. Zhao, M.; Wang, M.; Chen, J.; Rahardja, S. Hyperspectral unmixing for additive nonlinear models with a 3-D-CNN autoencoder network. IEEE Trans. Geosci. Remote Sens. 2021, 60, 1–15. [Google Scholar]
  39. Ozkan, S.; Kaya, B.; Akar, G.B. Endnet: Sparse autoencoder network for endmember extraction and hyperspectral unmixing. IEEE Trans. Geosci. Remote Sens. 2018, 57, 482–496. [Google Scholar]
  40. Su, Y.; Li, J.; Plaza, A.; Marinoni, A.; Gamba, P.; Chakravortty, S. DAEN: Deep autoencoder networks for hyperspectral unmixing. IEEE Trans. Geosci. Remote Sens. 2019, 57, 4309–4321. [Google Scholar]
  41. Borsoi, R.A.; Imbiriba, T.; Bermudez, J.C.M. Deep generative endmember modeling: An application to unsupervised spectral unmixing. IEEE Trans. Comput. Imaging 2019, 6, 374–384. [Google Scholar]
  42. Qu, Y.; Qi, H. uDAS: An untied denoising autoencoder with sparsity for spectral unmixing. IEEE Trans. Geosci. Remote Sens. 2018, 57, 1698–1712. [Google Scholar]
  43. Hua, Z.; Li, X.; Qiu, Q.; Zhao, L. Autoencoder network for hyperspectral unmixing with adaptive abundance smoothing. IEEE Geosci. Remote Sens. Lett. 2020, 18, 1640–1644. [Google Scholar]
  44. Zhang, X.; Sun, Y.; Zhang, J.; Wu, P.; Jiao, L. Hyperspectral unmixing via deep convolutional neural networks. IEEE Geosci. Remote Sens. Lett. 2018, 15, 1755–1759. [Google Scholar]
  45. Khajehrayeni, F.; Ghassemian, H. Hyperspectral unmixing using deep convolutional autoencoders in a supervised scenario. IEEE J. Sel. Top. Appl. Earth Obs. Remote Sens. 2020, 13, 567–576. [Google Scholar]
  46. Palsson, B.; Ulfarsson, M.O.; Sveinsson, J.R. Convolutional autoencoder for spectral–spatial hyperspectral unmixing. IEEE Trans. Geosci. Remote Sens. 2020, 59, 535–549. [Google Scholar]
  47. Gao, L.; Han, Z.; Hong, D.; Zhang, B.; Chanussot, J. CyCU-Net: Cycle-consistency unmixing network by learning cascaded autoencoders. IEEE Trans. Geosci. Remote Sens. 2021, 60, 1–14. [Google Scholar]
  48. Rasti, B.; Koirala, B.; Scheunders, P.; Chanussot, J. Misicnet: Minimum simplex convolutional network for deep hyperspectral unmixing. IEEE Trans. Geosci. Remote Sens. 2022, 60, 1–15. [Google Scholar]
  49. Huang, Y.; Li, J.; Qi, L.; Wang, Y.; Gao, X. Spatial-spectral autoencoder networks for hyperspectral unmixing. In Proceedings of the IGARSS 2020—2020 IEEE International Geoscience and Remote Sensing Symposium, IEEE, Waikoloa, HI, USA, 26 September–2 October 2020; pp. 2396–2399. [Google Scholar]
  50. Feng, Z.H.; Kittler, J.; Awais, M.; Huber, P.; Wu, X. Wing Loss for Robust Facial Landmark Localisation with Convolutional Neural Networks. Comput. Vis. Pattern Recognit. 2018, 2235–2245. [Google Scholar] [CrossRef]
  51. Gaihua, W.; Tianlun, Z.; Yingying, D.; Jinheng, L.; Lei, C. A serial-parallel self-attention network joint with multi-scale dilated convolution. IEEE Access 2021, 9, 71909–71919. [Google Scholar]
  52. Shi, W.; Du, H.; Mei, W.; Ma, Z. (SARN) spatial-wise attention residual network for image super-resolution. Vis. Comput. 2021, 37, 1569–1580. [Google Scholar]
  53. Zhou, Y.; Rangarajan, A.; Gader, P.D. A Gaussian mixture model representation of endmember variability in hyperspectral unmixing. IEEE Trans. Image Process. 2018, 27, 2242–2256. [Google Scholar]
  54. Zhou, Y.; Rangarajan, A.; Gader, P.D. A spatial compositional model for linear unmixing and endmember uncertainty estimation. IEEE Trans. Image Process. 2016, 25, 5987–6002. [Google Scholar]
  55. Davis, C.O.; Kavanaugh, M.; Letelier, R.; Bissett, W.P.; Kohler, D. Spatial and spectral resolution considerations for imaging coastal waters. In Proceedings of the Optical Engineering + Applications, San Diego, CA, USA, 19–20 March 2007; Volume 6680, pp. 196–207. [Google Scholar] [CrossRef] [Green Version]
  56. Heinz, D.; Chang, C.I. Fully constrained least squares linear spectral mixture analysis method for material quantification in hyperspectral imagery. IEEE Trans. Geosci. Remote Sens. 2001, 39, 529–545. [Google Scholar]
  57. Zhuang, L.; Lin, C.H.; Figueiredo, M.A.; Bioucas-Dias, J.M. Regularization parameter selection in minimum volume hyperspectral unmixing. IEEE Trans. Geosci. Remote Sens. 2019, 57, 9858–9877. [Google Scholar]
  58. Hong, D.; Gao, L.; Yao, J.; Yokoya, N.; Chanussot, J.; Heiden, U.; Zhang, B. Endmember-guided unmixing network (EGU-Net): A general deep learning framework for self-supervised hyperspectral unmixing. IEEE Trans. Neural Netw. Learn. Syst. 2021, 33, 6518–6531. [Google Scholar] [CrossRef]
Figure 1. The architecture of SISLU-Net. The proposed SISLU-Net is a dual-branch structure. The first branch is the SCN for learning HSI spectral information. The second branch is the SPCN which learns the spatial information of the image. Spatial information learning is assisted by DBDT and bottleneck residual modules. The two branches exchange information by sharing weights and output abundance and endmembers.
Remotesensing 15 00817 g001
Figure 2. (a) Traditional convolution (b) dilated convolution.
Remotesensing 15 00817 g002
Figure 3. Synthetic image: (a) Synthetic color image (488, 566, and 693 nm) (b) Mean spectra extracted from the ASTER library.
Remotesensing 15 00817 g003
Figure 4. Samson image: (a) Samson color image ((Red: 571.01 nm, Green: 539.53 nm, and Blue: 432.48 nm) (b) Ground truth endmembers.
Remotesensing 15 00817 g004
Figure 5. Jasper image: (a) Jasper color image (Red: 570.14 nm, Green: 532.11 nm, Blue: 427.53 nm) (b) Ground truth endmembers.
Remotesensing 15 00817 g005
Figure 6. WDC image: (a) WDC color image (Red: 572.7 nm, Green: 530.1 nm, Blue: 425.0 nm) (b) Ground truth endmembers.
Remotesensing 15 00817 g006
Figure 7. Estimated abundances by all competing methods on the Synthetic Dataset.
Remotesensing 15 00817 g007
Figure 8. Estimated endmembers by all competing methods on the Synthetic Dataset. Red: the ground truth endmembers; Black: the estimated endmembers.
Remotesensing 15 00817 g008
Figure 9. Estimated abundances by all competing methods on the Samson Dataset.
Remotesensing 15 00817 g009
Figure 10. Estimated endmembers by all competing methods on the Samson Dataset. Red: the ground truth endmembers; Black:the estimated endmembers.
Remotesensing 15 00817 g010
Figure 11. Estimated abundances by all competing methods on the Jasper Ridge Dataset.
Remotesensing 15 00817 g011
Figure 12. Estimated endmembers by all competing methods on the Jasper Ridge Dataset. Red: the ground truth endmembers; Black: the estimated endmembers.
Remotesensing 15 00817 g012
Figure 13. Estimated abundances by all competing methods on the Washington DC Mall Dataset.
Remotesensing 15 00817 g013
Figure 14. Estimated endmembers by all competing methods on the Washington DC Mall Dataset. Red: the ground truth endmembers; Black: the estimated endmembers.
Remotesensing 15 00817 g014
Figure 15. Parameter sensitivity analysis of the Wing loss function in four datasets. (a) Synthetic Dataset (b) Samson Dataset (c) Jasper Ridge Dataset (d) Washington DC Mall Dataset.
Remotesensing 15 00817 g015
Figure 16. Sensitivity of SISLU-Net to the hyperparameters of the network. (a) Learning Rate (performed on the Jasper Ridge dataset) (b) Kernel Size (performed on the Jasper Ridge dataset) (c) Activation Function (performed on three real datasets).
Remotesensing 15 00817 g016
Table 1. Bottleneck residual module network structure.
Layer Input Ch.Output Ch.Filter SizeStride
Layer 1Conv256641 × 11
BN
Tanh
Layer 2Conv64643 × 31
BN
Tanh
Layer 3Conv642561 × 11
BN
Tanh
Table 2. Network structure of SISLU-Net.
PathwaySpectral Convolutional NetworkSpatial Convolutional Network
Input Ch.Output Ch. Input Ch.Output Ch.
Block11 × 1 ConvP2563 × 3 Dilated ConvP 256
BNBN
DropoutDropout
TanhTanh
Block21 × 1 Conv256128BottleNeck
Residual Module
256256
BN
Dropout
Tanh
Block31 × 1 Conv128323 × 3 Conv256128
BN
BNTanh
1 × 1 Conv12832
ReLUBN
ReLU
ShareBlock1 × 1 Conv32r1 × 1 Conv32r
BNBN
SoftmaxSoftmax
Block4LinearrP---
ReconBlock1---1 × 1 Convr32
-BN
-Sigmoid
ReconBlock2---1 × 1 Conv32128
-BN
-Sigmoid
ReconBlock3---3 × 3 Conv128256
-BN
-Sigmoid
ReconBlock4---5 × 5 Conv256P
-BN
-Sigmoid
Table 3. Mean SAD of the Simulated Dataset. The best results are shown in bold.
MethodsCLSUnSALNMF-QMVuDASCyCUNetEGU-NetMiSiCNetSISLU-NetSISLU-Net
(without SPCN)
20 dB0.02420.10720.02460.07610.67610.14380.01860.0824
30 dB0.02330.09710.01910.07090.67610.14400.01800.0804
40 dB0.02220.09600.01790.06620.67600.14400.01660.0799
Table 4. RMSE of the Simulated Dataset. The best results are shown in bold.
MethodsCLSUnSALNMF-QMVuDASCyCUNetEGU-NetMiSiCNetSISLU-NetSISLU-Net
(without SPCN)
20 dB0.03970.08530.05030.16910.03060.09160.02710.0875
30 dB0.03850.07620.04400.16130.02790.08970.02470.0849
0 dB0.03660.07410.04260.15930.03040.08940.02200.0855
Table 5. Comparison of different loss functions used by the proposed network in Samson Dataset. The best results are shown in bold.
LossSoilTreeWaterMean SADRMSE
L1 Loss0.03500.05150.10010.06220.0244
L2 Loss0.06200.04620.10720.07180.0300
Wing Loss0.02090.05280.03970.03780.0108
Table 6. Comparison of different loss functions used by the proposed network in Jasper Ridge Dataset. The best results are shown in bold.
LossTreeWaterSoilRoadMean SADRMSE
L1 Loss0.04100.26150.03810.04180.09560.0519
L2 Loss0.05020.28980.02950.03670.10160.0545
Wing Loss0.02740.04940.02640.03420.03440.0390
Table 7. Ablation study on evaluating the contribution of dilated convolution and residual modules in SPCN. The best results are shown in bold.
ModuleDBDT
Module
Bottleneck
Residual
Module
Mean SADRMSE
Dataset
Synthetic (30 dB) 0.04140.0524
0.02090.0281
0.01940.0260
0.01800.0247
Samson 0.04600.0215
0.03880.0113
0.03930.0146
0.03780.0106
Jasper 0.05170.0464
0.04370.0450
0.03980.0408
0.03440.0390
WDC 0.07800.0373
0.06910.0341
0.06500.0332
0.06220.0291
Table 8. Quantitative metrics for unmixing on the SAMSON dataset, including the SAD for each material, the mean SAD and RMSE. The optimal values are shown in bold.
MethodsCLSUnSALNMF-QMVuDASCyCUNetEGU-NetMiSiCNetSISLU-Net
SADSoil0.03510.02600.03580.01220.01700.01230.0209
Tree0.10760.10650.09600.05680.06450.04630.0528
Water0.21661.48360.15270.07190.09960.37330.0397
Mean SAD0.11980.53870.09480.04700.06040.14390.0378
RMSE0.14030.16980.18670.17750.19810.02460.0106
Table 9. Quantitative metrics for unmixing on the Jasper Ridge Dataset, including the SAD for each material, the mean SAD and RMSE. The optimal values are shown in bold.
MethodsCLSUnSALNMF-QMVuDASCyCUNetEGU-NetMiSiCNetSISLU-Net
SADTree0.15200.28460.17850.03540.03720.04340.0274
Water0.07331.48770.36060.15500.05740.28970.0494
Soil0.11570.17220.09670.03430.03190.06620.0264
Road0.06960.05010.04440.04150.03040.32950.0342
Mean SAD0.10260.49860.17010.06660.03920.18220.0344
RMSE0.15580.16800.12290.11630.05250.18240.0390
Table 10. Quantitative metrics for unmixing on the Washington DC Mall Dataset, including the SAD for each material, the mean SAD, and RMSE. The optimal values are shown in bold.
MethodsCLSUnSALNMF-QMVuDASCyCUNetEGU-NetMiSiCNetSISLU-Net
SADGrass0.36610.18660.19800.29200.08030.28530.1369
Tree0.37800.44570.38650.50930.13530.15600.0523
Road0.28760.26290.58440.39910.06430.08860.0295
Roof0.04180.20210.06610.82870.07230.33170.0712
Water0.03880.41950.10730.04730.06600.04320.0308
Trail0.15280.06120.084481390.03640.34540.0527
Mean SAD0.21090.26300.23780.37010.07570.20750.0622
RMSE0.28310.23140.30510.31320.14310.18240.0291
Table 11. The processing time (in seconds) of each method on the real dataset. (The optimal results are bolded).
CLSUnSALNMF-QMVuDASCyCUNetEGU-NetMiSiCNetSISLU-Net
Samson0.9411.2812.6569.4433.8178.5086.14
Jasper1.6714.1026.3380.1839.4581.40105.05
WDC44.46859.251050.0676.52252.08442.68712.41
Disclaimer/Publisher’s Note: The statements, opinions and data contained in all publications are solely those of the individual author(s) and contributor(s) and not of MDPI and/or the editor(s). MDPI and/or the editor(s) disclaim responsibility for any injury to people or property resulting from any ideas, methods, instructions or products referred to in the content.

