Technical Note

Variability of Surface Radiation Budget over Arctic during Two Recent Decades from Perspective of CERES and ERA5 Data

1
Center of Remote Sensing and GIS, Korea Polar Research Institute, Incheon 21990, Republic of Korea
2
Division of Earth Environmental System Science (Major of Spatial Information Engineering), Pukyong National University, Busan 48513, Republic of Korea
*
Author to whom correspondence should be addressed.
Remote Sens. 2023, 15(3), 829; https://doi.org/10.3390/rs15030829
Submission received: 29 December 2022 / Revised: 28 January 2023 / Accepted: 30 January 2023 / Published: 1 February 2023
(This article belongs to the Special Issue Remote Sensing of the Cryosphere)

Abstract

:
This study focused on surface radiation budget, one of the essential factors for understanding climate change. Arctic surface radiation budget was summarized and explained using a satellite product, Clouds and the Earth’s Radiant Energy System (CERES) Energy Balanced and Filled (EBAF), and reanalysis data, ERA5. Net radiation records indicated an increasing trend only in ERA5, with EBAF indicating a decreasing trend in the Arctic Circle (AC; poleward from 65°N) from 2000 to 2018. The differences in the net radiation trend between product types was due to longwave downward radiation. The extreme season was selected according to the seasonality of net radiation, surface air temperature, and sea ice extent. The surface radiation budget was synthesized for extreme season in the AC. Regardless of the data, net radiation tended to increase in the summer on an annual trend. By contrast, in the winter, trend of surface net radiation was observed in which ERA5 increased and EBAF decreased. The difference in surface radiation is represented in longwave of each data. This comprehensive information can be used to analyze and predict the surface energy budget, transport, and interaction between the atmosphere and surface in the Arctic.

Graphical Abstract

1. Introduction

The Arctic is experiencing rapid climate change [1,2,3,4]. Arctic amplification has been observed with surface air temperatures (SAT) increasing rapidly compared to mid-latitude regions [5]. Arctic amplification is affected by the surface energy budget, which originates from the warming of the surface and atmosphere [6,7,8].
Especially, the radiation budget is an important factor for understanding the energy balance at the surface [9]. The energy budget controls turbulent fluxes, surface temperature, and several energy variables [9]. Among these, the surface radiation budget is a key climate change parameter and serves to provide energy in various climate feedback mechanisms [10]. Therefore, the surface radiation budget changes play an important role in environmental problems, such as global warming and glacier retreat [11,12].
Various studies on the radiation budget in the Arctic have been conducted. These studies have analyzed the energy budget, using model data and reanalysis data [13,14,15]. A variety of atmospheric and oceanic data were synthesized to examine the large-scale energy budget of the Arctic. Surface radiation was verified by in situ data and an inter-comparison was performed between different satellite-based radiation data in the Arctic [4,16,17,18]. Spatiotemporal analyses of the Arctic surface radiation budget have been synthesized using various spatial data [9,19].
The Arctic is a complex area where many feedback mechanisms are intertwined. As such, research into what factors and iterations influence radiative flux is ongoing and is considered essential for polar climate analysis [20,21,22,23,24]. Moreover, the Arctic climate is influenced by different physical parameters by negative or positive feedback [13,15,16]. For example, ice-albedo feedback [25,26] and cloud feedback [27,28,29]. Many studies analyzed Arctic shortwave and longwave radiation to analyze feedback and the effect of the arctic climate changes.
Shortwave analysis was mainly carried out in the correlation analysis between sea ice and albedo. The research focused on ice-albedo feedback, which accelerates global warming as the albedo decreases as sea ice decreases [19,21,26,30,31]. In the case of longwave, analyses of clouds and sea ice were carried out, among which many studies of longwave downwelling have been carried out [22,23,32,33,34]. In the case of net radiation, long-term trend analysis [9,19], comprehensive research on energy budget [3], and the evaluation of products [4,17,18,35] were conducted.
A quantitative analysis of the Arctic energy budget is needed to understand the climate processes and to simulate them realistically [36]. Research on radiative fluxes has been conducted in various fields [4,9,10,11,37,38,39]. However, the difference between satellite and reanalyzed data becomes more conspicuous as we go to higher latitude regions [18]. In sensitive regions such as the Arctic, there are limits to predicting and understanding climate change due to observational limitations [40]. Therefore, there is a need to determine how it has changed quantitatively using refined data, considering the differences in source data and regional characteristics, how much it has changed over a long period, and how it will likely change in the future.
In this study, we analyzed the long-term changes in surface net radiation in the Arctic and determined the sub-fluxes that affect trends. Therefore, we observed the long-term changes over the last 20 years using data from ERA5 and Clouds and the Earth’s Radiant Energy System (CERES) Energy Balanced and Filled (EBAF). The trends and characteristic were analyzed based on time series with seasonality removed using time-series decomposition. In addition, the Arctic extreme seasons were classified using air temperature, net radiation, and sea ice extent. The surface radiation budget was analyzed based on characteristic periods. We determined how the surface radiation budget has changed over long-term periods using a robust statistics method. The results provide comprehensive information, such as long-term trends in the Arctic radiation budgets and the characteristics of longwave and shortwave radiation over time. This information has been chosen as the initial field for the Arctic climate and sea ice models. In addition, it is helpful for studies such as partitioning energy budgets associated with different physical changes.

2. Materials and Methods

2.1. Definition of Net Radiation

In this study, the direction of energy defined as the positive direction was energy absorbed to the ground, and the negative direction was the energy emitted or reflected from the surface. Surface net radiation is the sum of net shortwave radiation and longwave radiation. It is defined as follows, with the radiative flux calculated by defining the shortwave range as 0.2–5 μm and the longwave range as 5–50 μm [37]
R n = S S + L L
where R n is the net radiation, S is the shortwave downward radiation, S is the shortwave upward radiation, L is the longwave downward radiation, and L is the longwave upward radiation.
Various reanalysis and satellite-based radiation products are available. Based on previous studies, the fifth-generation European Centre for Medium-Range Weather Forecasts (ECMWF) atmospheric reanalysis product of the global climate (ERA5) and Clouds and the Earth’s Radiant Energy System (CERES) data with a high degree of accuracy were selected for use [18]. ERA5 is a reanalysis-based dataset and represents the most recent data. CERES EBAF Edition 4.0 (Ed4) includes satellite-based data, which have been accumulated for over 15 years and have a high degree of accuracy. We used the radiation products in the all-sky condition at surface, so these radiations included the atmospheric influence. In a previous study, ERA5 and EBAF data were analyzed for the accuracy of surface net radiation using the same ground observation data [18]. Previous research analyzed the accuracy of various net radiation data, among which the accuracy of ERA5 and EBAF appeared to be higher in order. Therefore, ERA5 and EBAF data were used in this study, synthesizing similar accuracy, data provision period, and spatiotemporal resolution in the Arctic. Differences between the two data were observed remarkably above 80°N, and an increasing trend in EBAF values was observed in this region [18].

2.1.1. ERA5

The Copernicus Climate Change Service (C3S) provided the ERA5 data. ERA5 data are calculated based on the assimilation of a 12 h four-dimensional ensemble variational (4DEnVar) formulation using an advanced numerical weather product, Cycle 41r2 of the Integrated Forecasting System [38,39]. The spatial resolution of the surface radiation budget of ERA5 provided by C3S is 0.25° in both longitude and latitude. The monthly averaged surface radiation budget product was used in this study due to the temporal availability of the EBAF. The model’s accuracy depends on the number of assimilated stations; accordingly, ERA5 indicates higher deviations from the observed values at locations with few stations. However, the accuracy of ERA5 net radiation was observed to have a root mean square error (RMSE) of 19.02 W/m2 and bias of −0.26 W/m2 [18]. Therefore, we used the ERA5 product.

2.1.2. CERES EBAF

The CERES [41] product is one of the most widely used satellite radiation datasets. CERES product indicated the unknown trend in TOA shortwave fluxes due to calibration [42]. However, the accuracy of The CERES Energy Balanced and Filled (EBAF) all-sky net radiation was observed with an RMSE of 23.95 W/m2 and bias of −2.67 W/m2 in the Arctic [14]. The CERES EBAF product is suitable for analyzing long-term data [18,43,44,45] and is used in climate model assessments and the estimation of energy budgets [46]. The CERES EBAF Ed4-surface product was used in this study. The spatial resolution of the EBAF is 1° × 1° in longitude and latitude, and the temporal resolution is a monthly mean [45,46]. CERES EBAFd4 data were available from March 2000 to March 2018.

2.1.3. Climatic Variables

Surface air temperature data were obtained from Modern-Era Retrospective analysis for Research and Applications, Version 2 (MERRA-2). MERRA-2 SAT data were used to detect extreme seasons. The system was based on the original MERRA system [47] with several major updates, in which these are described in detail in [48]. The SAT data from MERRA2 indicated a low mean absolute error (MAE) of less than 2 °C, which was the closest to the ground observations among the seven reanalyzed products used in Antarctica [49]. The data used were from March 2000 to March 2018 similar to the radiation data. Although ERA5 provides the SAT products, MERAA2 data was used for keeping the independents because we used the surface radiation products of ERA5.
Sea ice extent (SIE) data was obtained from National Snow and Ice Data Center (NSIDC). “Sea ice index monthly data by year” products within SIE was used, which is calculated based on sea ice concentration [50]. The data used were from March 2000 to March 2018 similar to the radiation data.

2.2. Methods

The analysis was based on the latest re-analysis dataset, ERA5, and satellite-based dataset, EBAF. The study period was from March 2000 to March 2018 when the EBAF ed4.0 was available. The Arctic consists mainly of the ocean, divided into various sea areas. Near the Eurasian continent are the East Greenland Sea, Barents Sea, Kara Sea, Laptev Sea, and East Siberia Sea. The Beaufort Sea, Baffin Bay, and Chukchi sea are near the North American continent. The Beaufort Gyre, one of the major Arctic currents, exists in this area. Figure 1 describes the research area focused on the Arctic Circle (AC; poleward from 65° N).
This study conducted an analysis of the long-term changes in radiative fluxes, being divided into two parts: (i) An analysis of the variation in radiative flux; and (ii) a determination of the changes in the surface radiation budget in extreme periods.
In the first part, the long-term patterns in the net radiation of ERA5 and EBAF were analyzed. To determine which components affected the net radiation, it was subdivided into upward/downward radiation components.
The Arctic is a region with strong seasonality [15], therefore we removed seasonality using a Seasonal Trend Decomposition by Loess (STL). The STL method is based on a locally weighted regression [51,52]. It decomposes the components of a time series into trends, seasonality, and residual. It can process all types of seasonality, as well as monthly and quarterly data, and abnormal observations do not affect the estimation of trend periods and seasonal components [51]. The details of the STL method are given in [51]. We decompose the monthly surface radiation budget into trend, seasonality, and error using STL and estimate the long-term changes using the trends. In other words, it is a monthly time series data with seasonality and error removed. Based on monthly data, annual changes were analyzed using linear regression analysis.
Unfortunately, at this time, ERA5 and EBAF data have different spatial resolutions, so it is not easy to directly compare the difference without post-processing. So, when both the products (ERA5, EBAF) were directly compared, it was difficult to perform a comparison between different spatial resolution products. Therefore, we analyzed the large-scale radiation when the two products are compared in parallel. This allows to understand the simple variation and to remove the regional bias in each product.
In the second part, a time series analysis was performed by extracting the extreme season in which the seasonality of net radiation, SAT, and SIE occurred. The changes in radiative fluxes were quantitatively analyzed based on the extreme season that reflected the characteristics of the climate variables in the AC. We used the Mann–Kendall test to detect the trend of surface radiation budget in extreme season [53,54]. The changes in surface radiation budget in the AC were quantitatively summarized in one diagram.

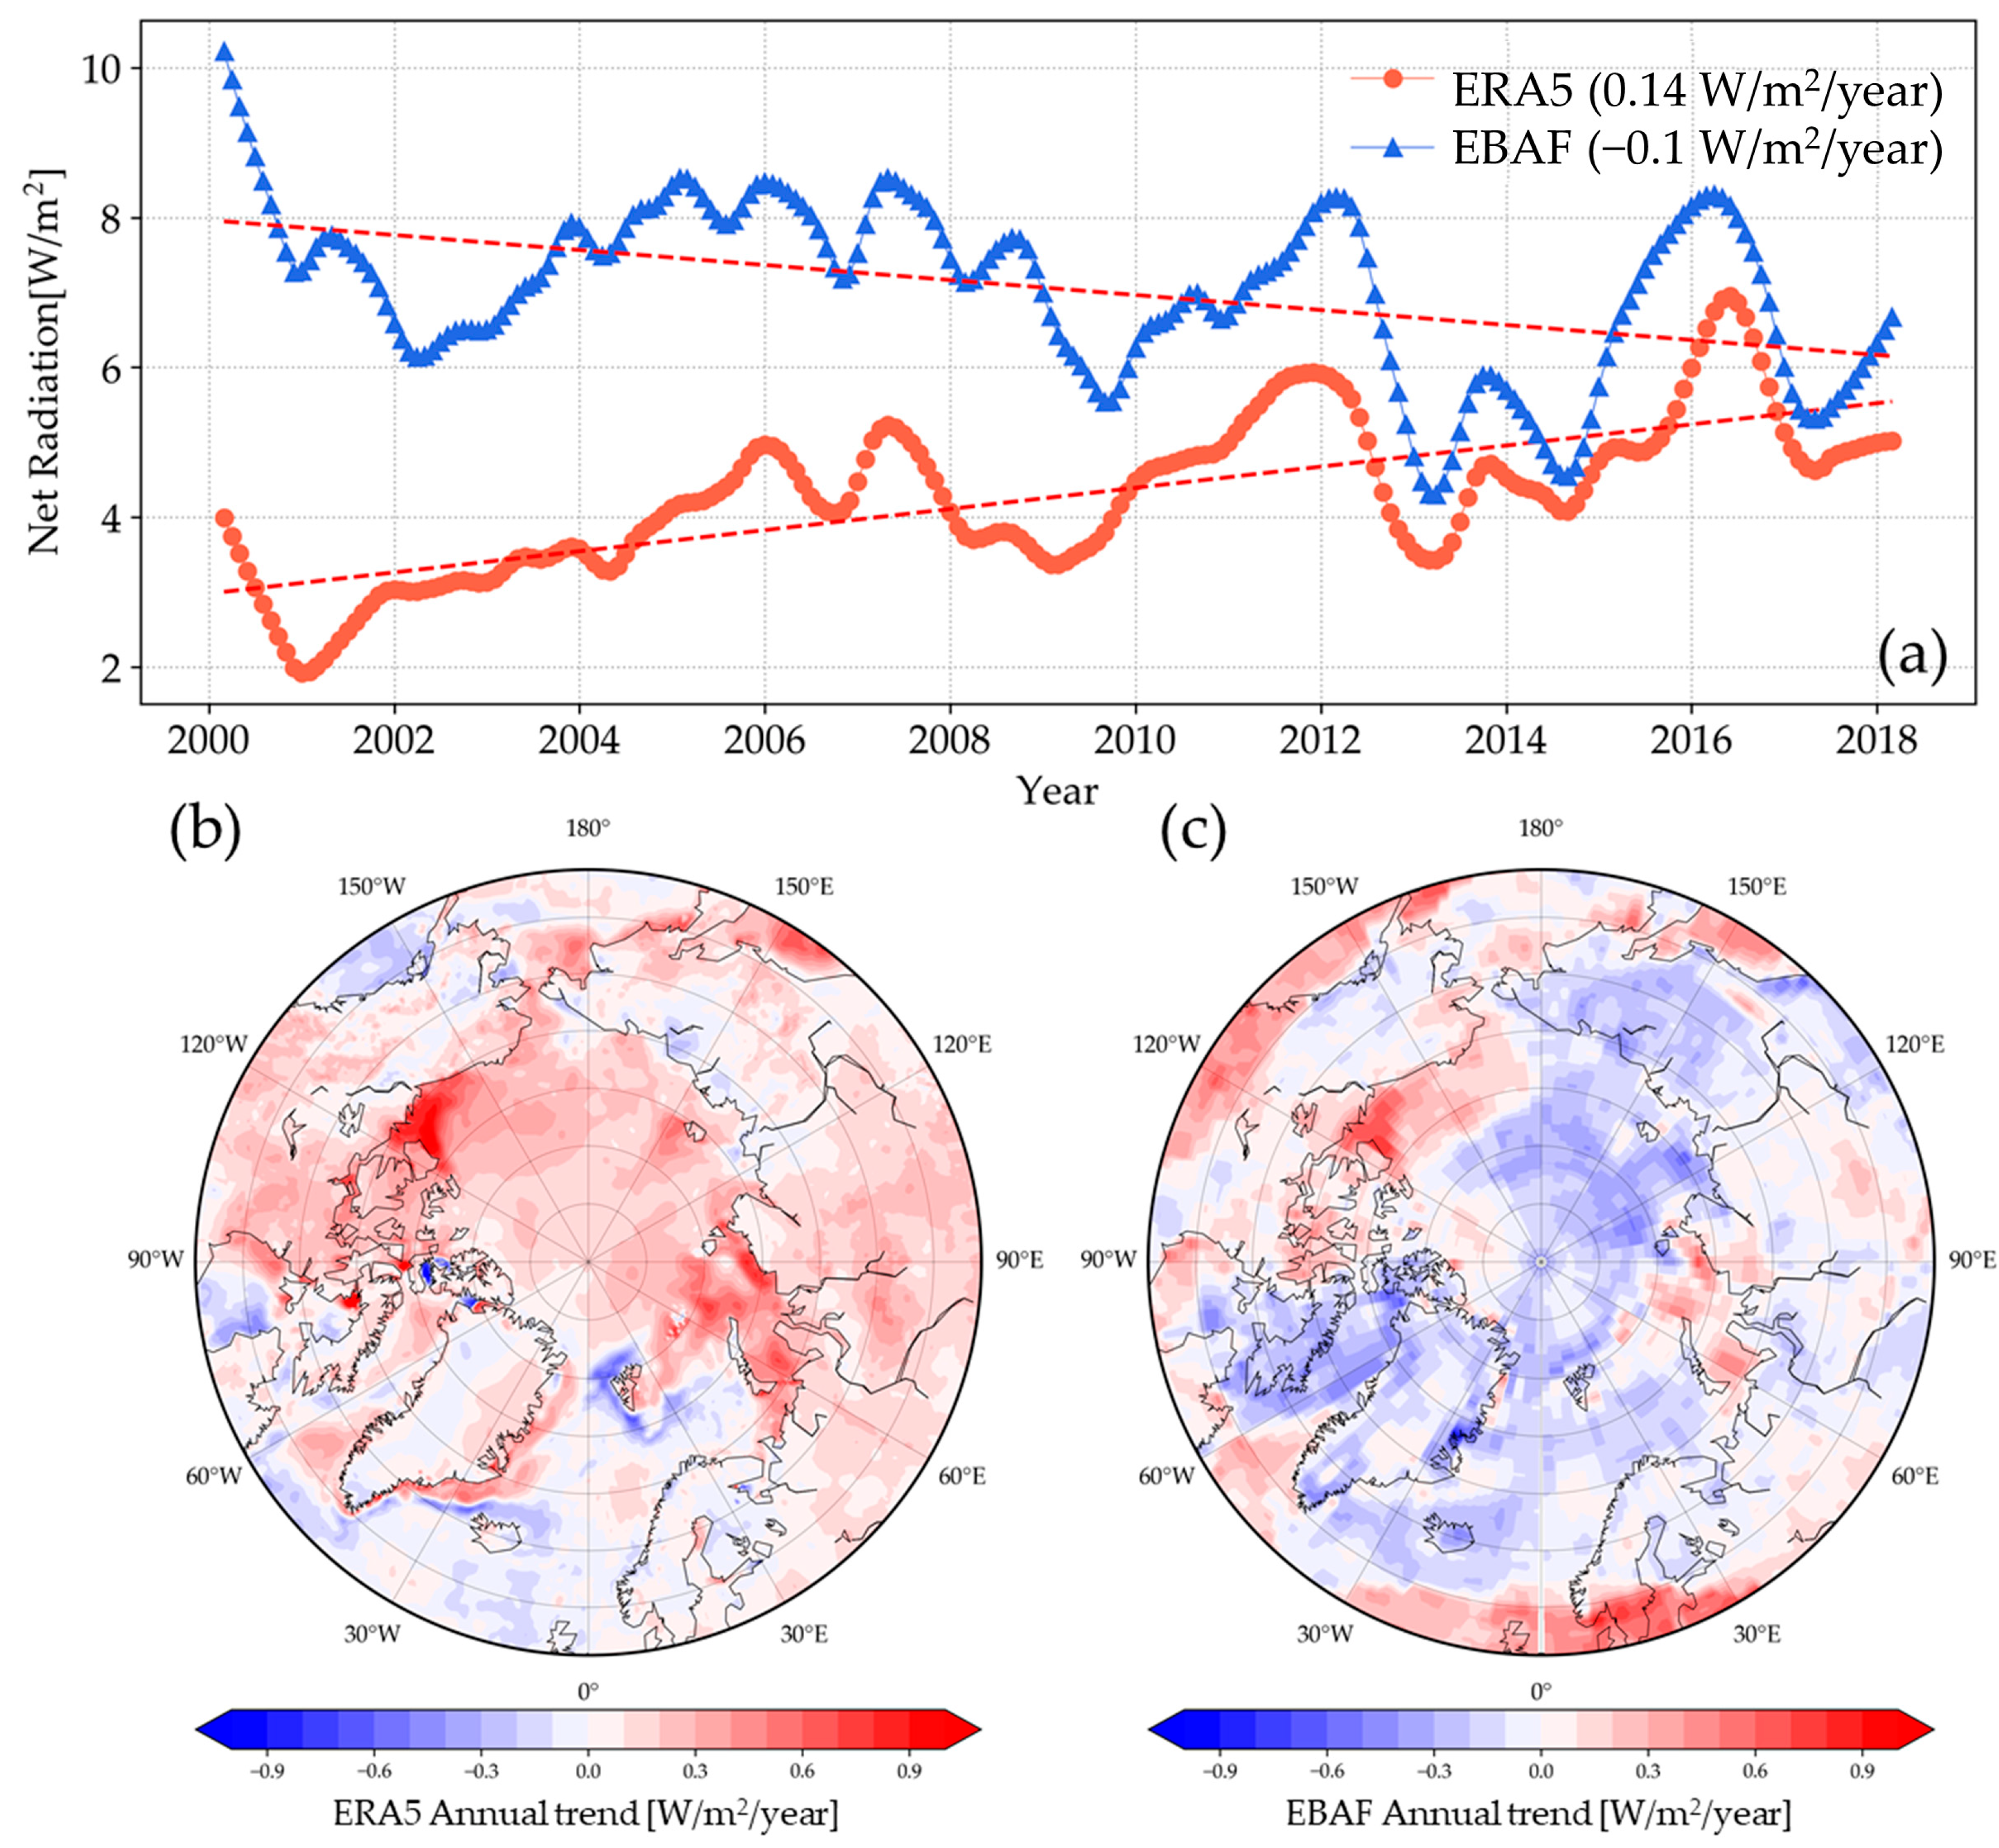
3. Long-Term Trend in Surface Radiation Budget

3.1. Net Radiation

Figure 2 shows a time series of net radiation over the AC. In this study, a time series of net radiation with seasonality removed was analyzed using the STL method. The ERA5 and EBAF data indicated different trends in net radiation. Although different trends were observed, the time series patterns were similar. The SIE was lowest (3.57 million km2) in 2012 since 1979 as satellite records were made available, and it recovered (5.21 million km2) in 2013; both net radiations showed a pattern varying from a high-peak to a low-peak. Similarly, in 2016, when the minimum SIE was observed, the net radiation value was higher compared to that in the surrounding period.
The ERA5 data presented a positive trend of 1.4 W/m2/decade, indicating that the net radiation absorbed in the AC increased over time. By contrast, EBAF presented a negative trend of −1.0 W/m2/decade. The net radiation decreased over time, which resulted in a different phenomenon from the commonly reported ice-albedo feedback [25,26]. In a previous study, net radiation was also reported to follow a decreasing trend at an annual rate of −0.33 W/m2 from 1982 to 1999 using satellite data [9].
The trends of the two datasets differed when the spatial distribution of the net radiation changes was compared (Figure 2b,c). Most ERA5 data showed a positive change in AC, with the Beaufort Sea, Chukchi Sea, and Kara Sea regions presenting a particularly strong increasing trend. In the Fram Strait in the western ocean area off Svalbard Island there was a decreasing net radiation trend unlike another in the AC. This characteristic was observed because it is a region where cold and warm currents mix through the Fram Strait. In the ocean where a strong increasing tendency was observed in ERA5, the tendency was also for an increase in EBAF data. However, the remaining area experienced a decrease in net radiation, except in the ocean. This can be explained by the relatively high ultra violet reflectance. CERES is relatively difficult to measure in a high ultra violet reflectance and low longwave region, such as the Arctic ocean.
In the continental areas, the ERA5 and EBAF trends were different from those in the ocean. The differences in the trends between the two datasets were particularly clear in the Central Arctic Ocean, Laptev Sea, and East Siberian Sea. In the Greenland region and its surroundings, EBAF data indicated a decrease in net radiation, but there was little or no trend in the ERA5 data.
The ERA5 and EBAF data were completely different when the AC area was averaged. The same net radiation data presented a significant difference when observing long-term trends. It is therefore important to understand what factors are causing this difference. This difference could be caused by CERES calibrations [42] or the uncertainty of the cloud condition each product.

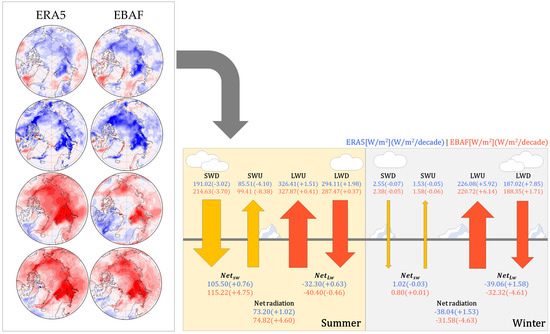
3.2. Components of Net Radiation

Figure 3 shows a time series of surface radiation budget components with removed seasonality. Shortwave radiation (Figure 3a,b) presents large seasonal variability, with values of up to 300 W/m2 in summer (white night) and close to 0 W/m2 in winter (polar night). Due to the large seasonal variability, when performing a STL, the shortwave radiation had smaller values than the longwave radiation. The time series data removed the seasonality, and therefore the characteristics of the monthly data could be identified, and the actual trend could be analyzed. In the case of shortwave radiation, both ERA5 and EBAF data indicated decreasing trends, and the peaks and troughs (i.e., high and low peaks) in the actual data and the pattern of the data were the same. The EBAF data had larger variation and contained higher values than the ERA5 data in its shortwave components, i.e., shortwave downward radiation (SWD) and shortwave upward radiation (SWU). When analyzing each component, SWD displayed the same annual change, but for SWU, the ERA5 values tended to be 1.5 times lower than the EBAF values. Combining these two characteristics, the extent of the reduction in energy reflected by the same amount of solar radiation differed between the two datasets. The reduction of reflected energy means there was an increase in the energy absorbed at the surface. Therefore, the increasing trend of EBAF data was nearly twice that of the ERA5 in terms of net shortwave radiation.
Unlike the shortwave components, there was an increasing trend for longwave components (Figure 3c,d). Although there was a difference in the extent of the increase, all longwave variables increased during the study period regardless of the product used. For longwave downward radiation (LWD), ERA5 data presented a stronger positive trend of 5.3 W/m2/decade. This was about five times larger than the trend using EBAF data of 1.3 W/m2/decade. Both datasets presented similar increases in longwave upward radiation (LWU), with ERA5 producing a positive trend of 4.5 W/m2/decade and EBAF producing a positive trend of 4.0 W/m2/decade. These results explain the phenomenon in well-known ice-albedo feedback mechanism [25,26]. In addition, a loss of sea ice will increase absorbed sunlight and increase evaporation, which can increase temperature and water vapor and therefore downward longwave radiation. The deviations caused in LWD are related to cloud condition and radiative effect [29,32]. Therefore, the cloud may make the differences between the two products.
Figure 4 shows the distribution of the annual trends over the Arctic for each radiative component. For SWD, both ERA5 and EBAF had the same spatial distribution of the trend. For SWU, there were differences in the central Arctic Ocean, but both products presented a decreasing trend in the land area. Observations of the spatial variability of shortwave radiation indicated some differences in the data, but the same trend in the shortwave radiative flux was observed for each region. It seems the stronger negative trends in EBAF are over the ocean which is consistent with a sea ice effect.
The LWU distribution had the same characteristics as the shortwave components, but there were differences in the LWD. For Greenland and the nearby ocean, the ERA5 data showed an increasing trend of LWD, but for the EBAF data there was a decreasing trend. For components other than LWD, only differences in the actual level were observed, but for LWD, there was a difference in the tendency. In the central Arctic Ocean, there was a decreasing trend in LWD for ERA5 data, but the EBAF data indicated a slight increase. Due to this difference, there was a difference in net longwave radiation, which ultimately caused a difference in the net radiation flux.
The ERA5 data produced increasing trends in all regions, but the amounts of LWD and LWU were similar, resulting in a positive trend and maintaining the equilibrium. In the case of EBAF, the LWU increase was about three times stronger than the LWD increase. The net longwave radiation refers to the difference between the LWD and LWU. Therefore, if the LWU increases faster than the LWD, the net longwave radiation will decrease because more energy is lost. Therefore, the pattern of EBAF net longwave radiation decreased, unlike the ERA5 net longwave radiation, which continued to increase.
In the Arctic region, shortwave radiation is difficult to observe in winter due to the polar nights, but longwave radiation can be observed throughout the year. Therefore, the longwave radiation flux is the factor that controls the pattern of net radiation in winter, and it affects the overall trend of net radiation. Therefore, the differences in longwave radiation fluxes influence the net radiation trend. This suggests that the pattern of changes in net radiation in the Arctic region can be controlled by the longwave radiation flux.
Previous studies have focused on longwave radiation when investigating the causes of changes in the Arctic sea ice [20,23]. The characteristics of the longwave radiation fluxes determined using the two commonly used datasets were different. It is important to consider this when making sea ice predictions and determining energy balances.

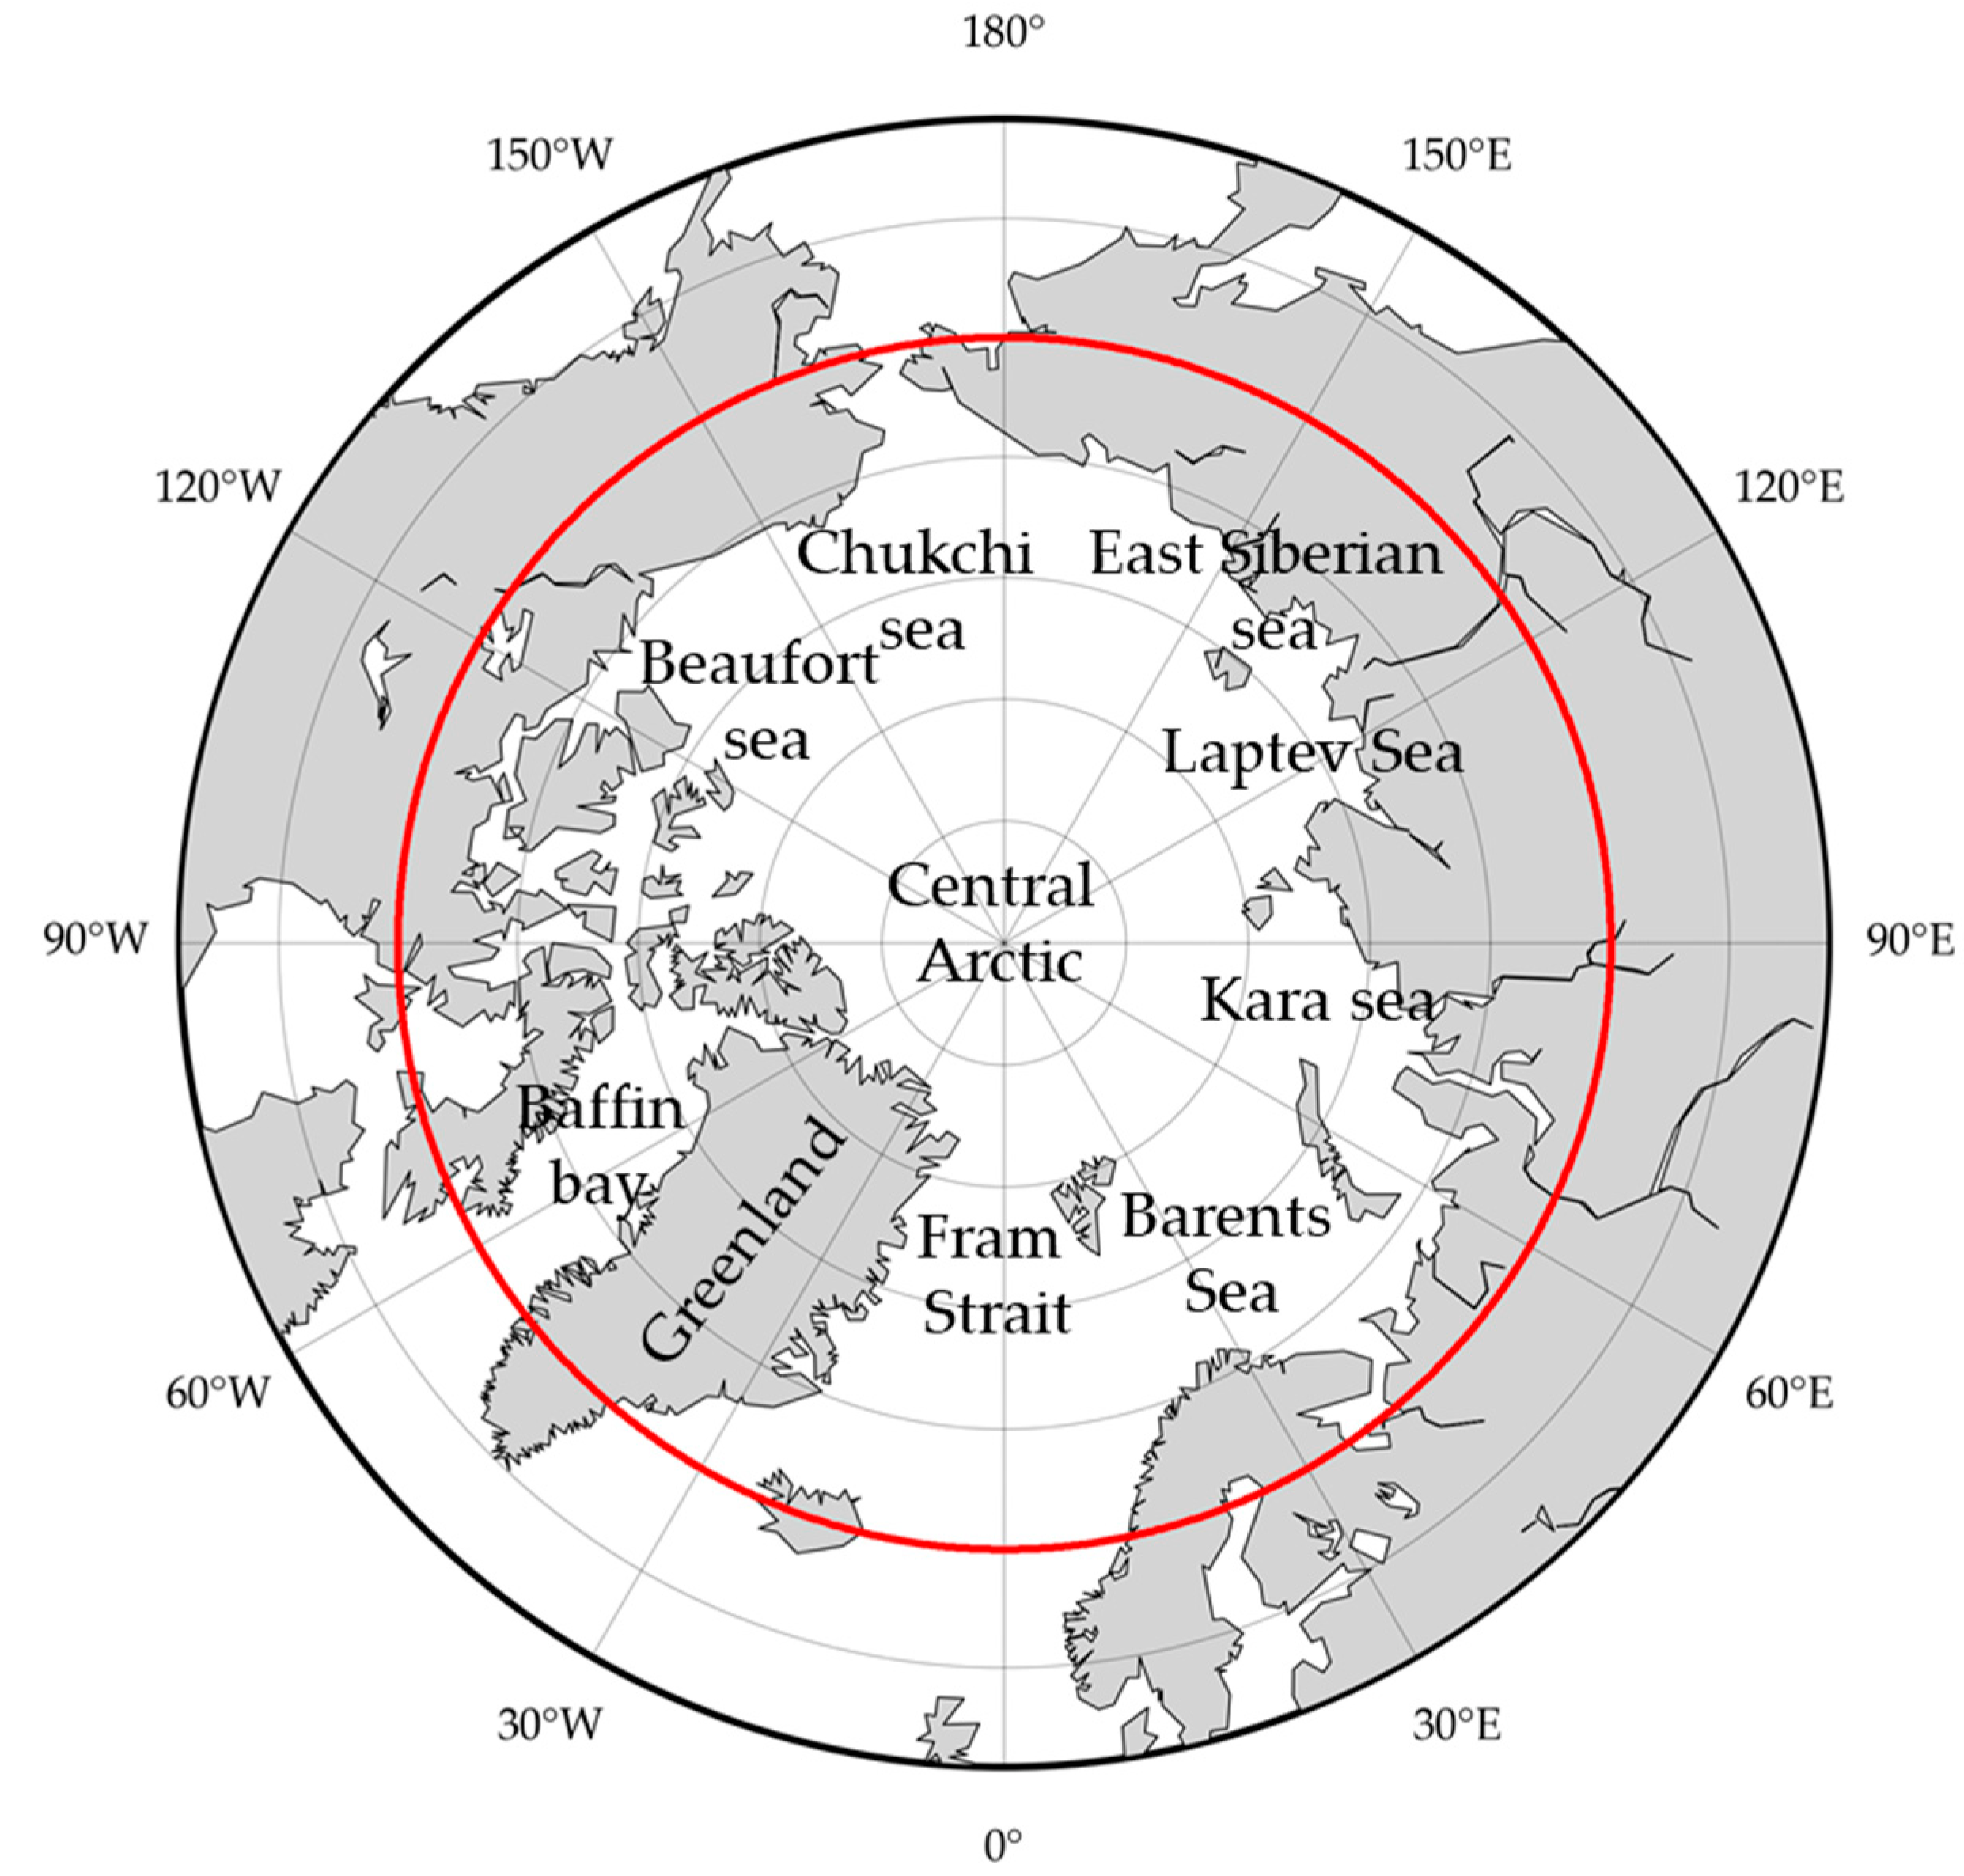
4. Surface Radiation Budget in the Arctic Circle

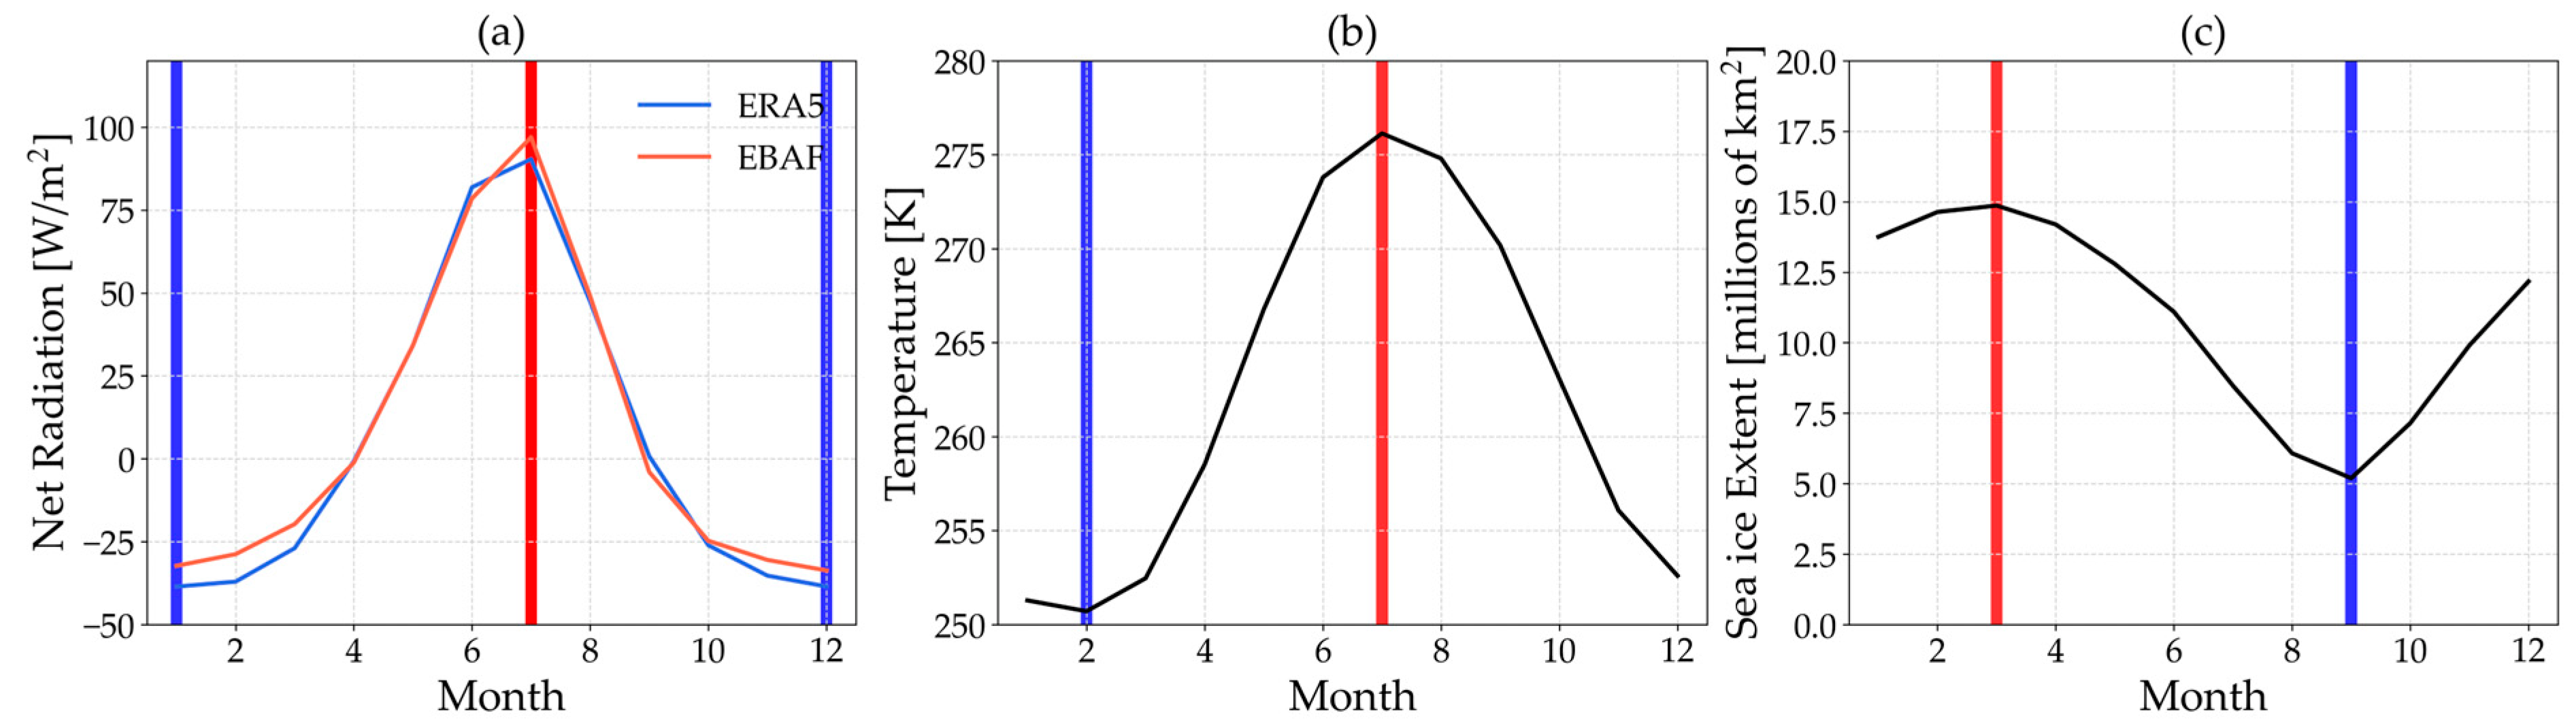
4.1. Estimation of Extreme Seasons

The trend of the surface radiation budget was analyzed during the study period (2000–2018). As previously mentioned, it is necessary to analyze the interannual trend due to the Arctic seasonal characteristics. Therefore, in this section, the extreme season was selected using the seasonality of the Arctic climate variables and the surface radiation budget.
Figure 5 shows the seasonal cycle and high (or low) peaks of net radiation, SAT, and SIE. Net radiation and SAT indicate the same high peak in July. SIE recorded the minimum in September, and a gap period of 2-months occurred between the high peaks of the other factors.
SIE recorded the maximum in March, considering the gap observed in the high peak, the low peaks of other factors were expected to be observed in January. However, low peaks were observed in different months in winter depending on the variables and products. The low peaks of ERA5 and EBAF were observed in January and December. SAT observed a peak in February. Therefore, it is difficult to determine the extreme month unlike the high peak found in July.
In the case of summer (white night with sunlight. during all night), high peaks were observed in July with all variables. This indicates that the seasonal characteristics were clearly observed. On the other hand, in the case of winter (polar night), it is difficult to determine an extreme month because the low peak was observed differently depending on the variables and data.
There is a possibility that the peaks are a factor in which different trends are observed for each data when analyzing the surface radiation budget in the previous section. In particular, there is almost no solar radiation during winter, therefore, the trends de-pend on the longwave component. The difference in the seasonality of longwave can eventually affect the change in the entire period.
Thus, it is necessary to analyze the surface radiation budget by dividing it by season. Summer (June-July-August) and winter (December-January-February) are designated as extreme seasons to show the influence of the seasonality of net radiation, SAT, and SIE.

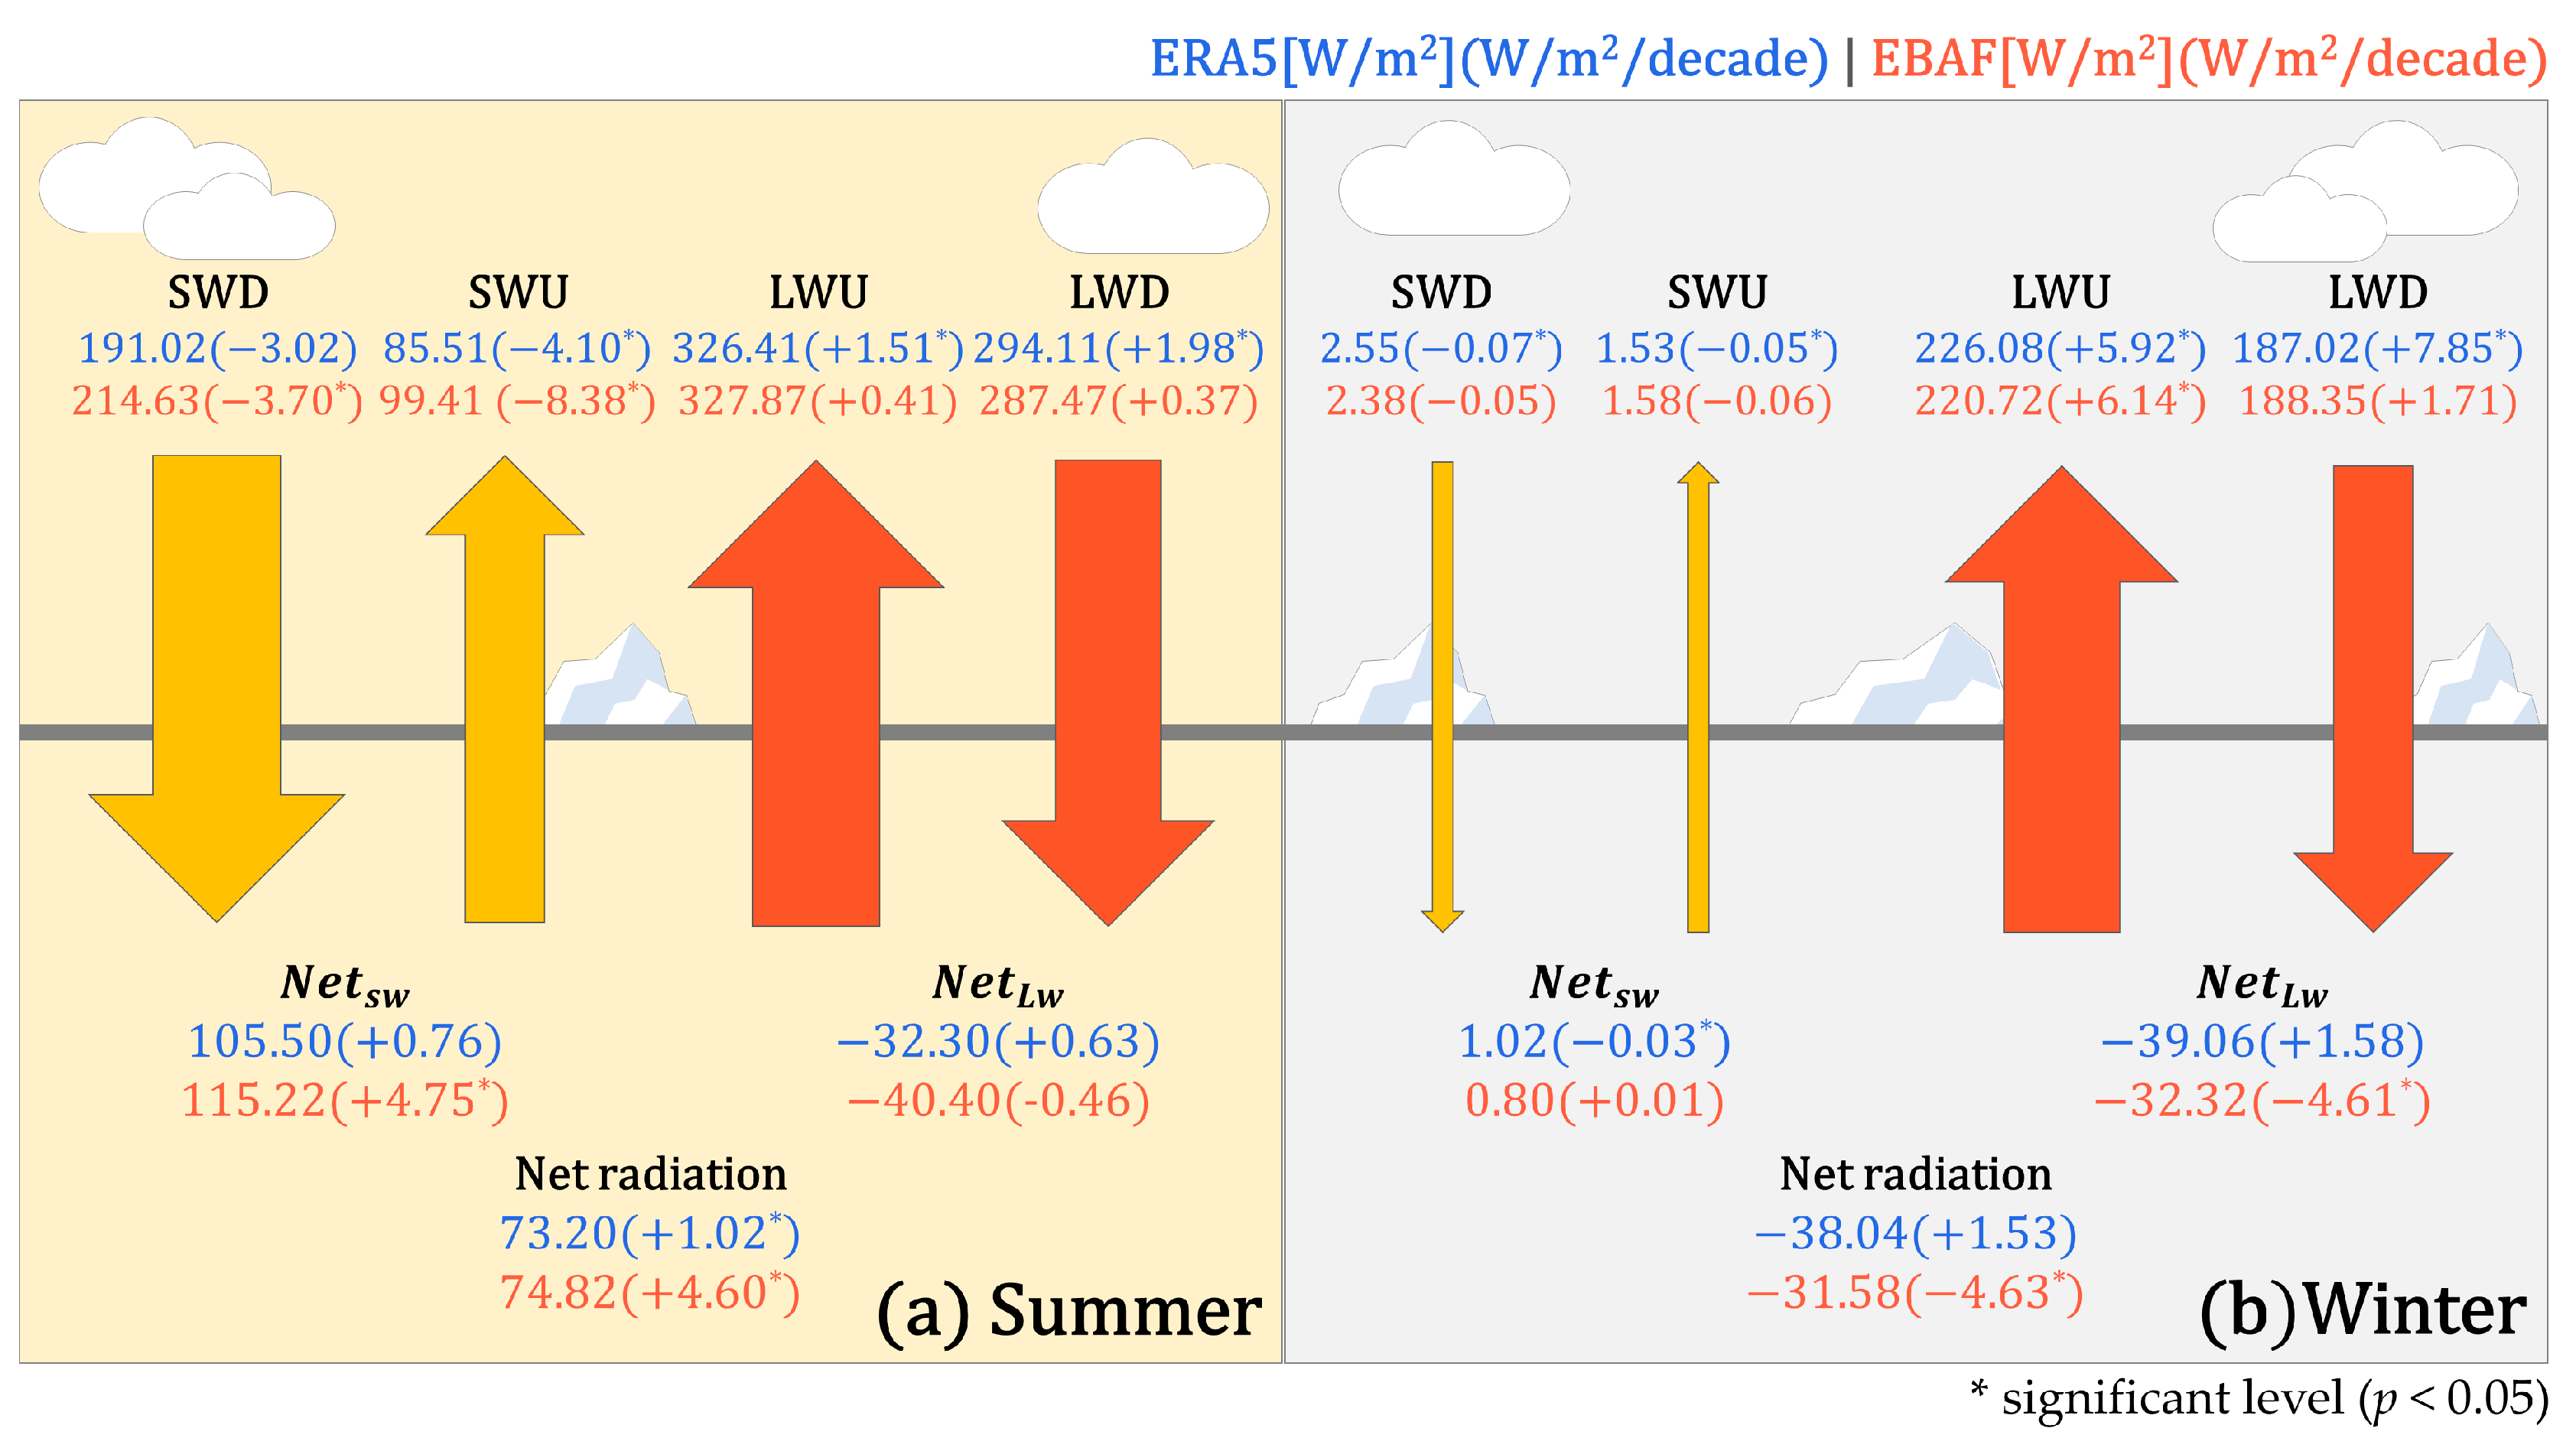
4.2. Changes in the Surface Radiation Budget in Extreme Seasons

Table 1 presents the decadal trend of the radiative components in extreme seasons. Net radiation showed an increasing trend, except for EBAF data during winter. The positive feedback of SAT and net radiation showed that the long-term changes in net radiation were consistent with the ice-albedo feedback.
All shortwave components declined, which was likely caused by surface conditions and atmospheric factors. Most of the heat input to the Arctic surface occurs in summer, while from autumn to winter the surface decreased energy [5,55,56]. In the ice-albedo feedback, when sea ice retreats, the albedo is reduced, decreasing the amount of reflected solar radiation and increasing the amount of absorbed solar radiation at the surface accordingly, and SWU is reduced. Moreover, a decrease in the amount of sea ice increases evaporation [57]. This reduces the SWD reaching the surface because increasing evaporation results in more clouds. These phenomena explain the results of this study. Both the EBAF and ERA5 products produced similar trends and levels of change in shortwave components, except for the upward in summer.
In addition, regardless of the data, LWD tends to increase in two seasons. It is consistent with the high-level cloud and longwave feedback in which the longwave emitted back to the surface increases as the cloud cover increases [28,29].
For longwave radiation, ERA5 and EBAF displayed different trends. When using ERA5 data, the increase in LWD was large compared to the increase in LWU. The amount of re-incident energy increased more than the amount of energy emitted from the surface increased. Therefore, the net longwave radiation steadily increased from 0.36 to 1.58 W/m2/decade. However, when using EBAF data, LWU increased more than twice as much as the LWD increased. The net longwave radiation steadily decreased from −4.61 to −0.46 W/m2/decade. The same trend was observed for both EBAF and ERA5 in terms of the longwave components, but the characteristics of the amount of change were the opposite. ERA5 represents a more positive trend of net radiation in winter which is explained by LWD, while the summer has a less positive trend that is mainly explained by SWU. Therefore, there was a difference in the net radiation trend using each dataset that was a consequence of the characteristics of the longwave radiation.

4.3. Surface Radiation Budget in the Arctic

The quantitative variabilities of the surface radiation budget in the AC from March 2000 to March 2018 are shown in Figure 6. There was an increasing trend in the amount of net radiation absorbed by the surface, with more than 70 W/m2 of energy absorbed in the summer. The amount of radiative energy absorbed by the net radiation was controlled by the shortwave radiation. The SWD was similar for ERA5 and EBAF, but the SWU decreased by more than two times when using EBAF compared to ERA5, which generated a difference in net shortwave radiation. The SWU is a key parameter that causes radiation changes during summer in ice-albedo feedback [26]. For SWU, the use of ERA5 and EBAF data resulted in a difference of about 14 W/m2.
The trend of net radiation absorbed by the surface differed depending on the variable responsible for changes in radiation fluxes, with more than 30 W/m2 of the radiation flux emitted in winter. The amount of energy absorbed by the net radiation was controlled by the longwave radiation. Unlike the shortwave radiation in the summer, the longwave radiation had similar upward radiation as LWU and trends. Although the average of the LWD were similar, the respective trends showed a difference of about seven times in the amount of increase between the two datasets. During winter, LWD was one of the key variables responsible for changes in surface radiation budget. The average LWD was similar for both datasets, but the decadal trend had a difference of about three times. There was a difference of 7 W/m2 in the net radiation absorbed by the surface between the two datasets.

5. Discussion

How is the Arctic surface radiation budget changing? Reanalysis products, such as ERA5, indicate an increasing trend in net radiation. By contrast, satellite-based products show a declining trend. This difference occurs due to the differences in longwave radiation and is an important point to consider in the analysis of the Arctic energy budget.
When comparing the net radiation trend of the reanalysis data (ERA5) and satellite-based data (EBAF), contrasting trends were observed. The use of ERA5 data indicated a change of 1.4 W/m2/decade, while the use of EBAF data indicated a change of −1.0 W/m2/decade. This difference was caused by variation in longwave radiation, particularly LWD.
Since the Arctic is a region with distinct seasonality, the extreme season was selected based on surface air temperature, sea ice extent, and net radiation. The surface radiation components were analyzed with a focus on the Arctic seasonality.
By synthesizing the above results, the changes in surface radiation in the AC from March 2000 to March 2018 were determined. Shortwave radiation, particularly SWU, significantly affected the net radiation during the summer. During the winter, longwave radiation, particularly the LWD, greatly influenced the change in net radiation. Although similar studies have been conducted previously, the present study focused on radiant energy and its long-term changes over a period of about 20 years. In LWD, the difference between satellite and reanalysis data is clear. It is expected that it is caused by the difference between the algorithm of the satellite and reanalyzed data. In addition, more investigation of trends in the components of temperature, water vapor, and ERA5 cloud cover would help in isolating the physical cause. Although this study did not focus an investigation toward such difference, it is necessary to recognize the difference and to consider the cause in future research.

6. Conclusions

The long-term characteristics of the radiation flux were analyzed and a quantitative evaluation was made of how the radiant energy of the Arctic region has changed. The study produced useful data for analyzing the energy balance of the Arctic region. The differences between the sea ice predictions could be explained by linking the characteristics of the input data. In addition, it was possible to improve the sea ice prediction accuracy using the different surface radiation budgets. The results can be used as reference data for the validation and development of models [15,36].
Because we analyzed the changes in radiative energy quantitatively, the results can be used in future studies of radiative forcing. They represent a reference point when analyzing the impact of changes in surface radiant energy at the top of the atmosphere.
This study recorded the differences between satellite data and reanalysis data, and analyzed which of the radiative components caused these differences. However, it is difficult to analyze the external factors causing the changes in net radiation. This study could not directly analyze different causes, but previous studies may refer to them. The data may differ due to deviations in the surface product caused by the ERA5 data itself and calibration of the CERES TOA data [42]. A significant difference is indicated in LWD, which is closely related to clouds, so differences may occur depending on the cloud conditions used to generate the data [23,29,32]. In addition, the Arctic Ocean is a region composed of ice and sea ice, and the surface conditions are incredibly different, so there may be differences in radiation depending on the surface conditions [21,25,26,34]. Although the relationship between climatic factors and sub-radiative fluxes, such as longwave and shortwave, has been analyzed, it is difficult to understand the overall processes that drive the surface radiation budget changes. Therefore, studies on the climate factors that increase (or decrease) net radiation and the mechanisms that affect them should be conducted. To resolve these issues, an analysis should be conducted of the connection points affecting climate feedback, such as the role of evaporation, radiative forcing, and clouds in the variability of sea ice [23,24,31,58]. The energy balance of the Arctic region should be analyzed by linking the changes in radiative energy with changes in non-radiative flux components.

Author Contributions

Conceptualization, M.S. and K.-S.H.; methodology, M.S., H.-C.K. and K.-S.H.; formal analysis, M.S. and N.-H.S.; investigation, S.S.; data curation, N.-H.S. and S.S.; writing—original draft preparation, M.S.; writing—review and editing, H.-C.K. and K.-S.H.; visualization, M.S.; supervision, K.-S.H.; funding acquisition, H.-C.K. All authors have read and agreed to the published version of the manuscript.

Funding

This work was supported by Korea Polar Research Institute (KOPRI) grant funded by the Ministry of Oceans and Fisheries (KOPRI project No. PE23040).

Data Availability Statement

CERES EBAF dataset can be found at http://ceres.larc.nasa.gov/order_data.php (accessed on 28 December 2022), hosted at NASA. ERA5 dataset can be found at https://cds.climate.copernicus.eu (accessed on 28 December 2022), hosted at ECMWF. MERRA2 surface air temperature dataset can be found at https://gmao.gsfc.nasa.gov/reanalysis/MERRA-2/ (accessed on 28 December 2022), hosted at NASA. Sea ice extent dataset can be found at https://nsidc.org/ (accessed on 28 December 2022), hosted at NSIDC.

Acknowledgments

We would like to thank the anonymous reviewers for providing valuable comments on this study.

Conflicts of Interest

No potential conflict of interest was reported by the authors.

References

  1. Maslanik, J.A.; Key, J.; Fowler, C.W.; Nguyen, T.; Wang, X. Spatial and Temporal Variability of Satellite-Derived Cloud and Surface Characteristics during FIRE-ACE. J. Geophys. Res. Atmos. 2001, 106, 15233–15249. [Google Scholar] [CrossRef]
  2. Kay, J.E.; L’Ecuyer, T. Observational Constraints on Arctic Ocean Clouds and Radiative Fluxes during the Early 21st Century. J. Geophys. Res. Atmos. 2013, 118, 7219–7236. [Google Scholar] [CrossRef]
  3. Christensen, M.W.; Behrangi, A.; L’ecuyer, T.S.; Wood, N.B.; Lebsock, M.D.; Stephens, G.L. Arctic Observation and Reanalysis Integrated System: A New Data Product for Validation and Climate Study. Bull. Am. Meteorol. Soc. 2016, 97, 907–916. [Google Scholar] [CrossRef]
  4. Riihelä, A.; Key, J.R.; Meirink, J.F.; Kuipers Munneke, P.; Palo, T.; Karlsson, K.-G. An Intercomparison and Validation of Satellite-Based Surface Radiative Energy Flux Estimates over the Arctic. J. Geophys. Res. Atmos. 2017, 122, 4829–4848. [Google Scholar] [CrossRef]
  5. Serreze, M.C.; Barrett, A.P.; Stroeve, J.C.; Kindig, D.N.; Holland, M.M. The Emergence of Surface-Based Arctic Amplification. Cryosphere 2009, 3, 11–19. [Google Scholar] [CrossRef]
  6. Laîné, A.; Yoshimori, M.; Abe-Ouchi, A. Surface Arctic Amplification Factors in CMIP5 Models: Land and Oceanic Surfaces and Seasonality. J. Clim. 2016, 29, 3297–3316. [Google Scholar] [CrossRef]
  7. Sejas, S.A.; Cai, M.; Hu, A.; Meehl, G.A.; Washington, W.; Taylor, P.C. Individual Feedback Contributions to the Seasonality of Surface Warming. J. Clim. 2014, 27, 5653–5669. [Google Scholar] [CrossRef]
  8. Previdi, M.; Smith, K.L.; Polvani, L.M. Arctic Amplification of Climate Change: A Review of Underlying Mechanisms. Environ. Res. Lett. 2021, 16, 093003. [Google Scholar] [CrossRef]
  9. Wang, X.; Key, J.R. Arctic Surface, Cloud, and Radiation Properties Based on the AVHRR Polar Pathfinder Dataset. Part I: Spatial and Temporal Characteristics. J. Clim. 2005, 18, 2558–2574. [Google Scholar] [CrossRef]
  10. Wild, M. Decadal Changes in Radiative Fluxes at Land and Ocean Surfaces and Their Relevance for Global Warming. WIREs Clim. Chang. 2016, 7, 91–107. [Google Scholar] [CrossRef]
  11. Wild, M. Global Dimming and Brightening: A Review. J. Geophys. Res. Atmos. 2009, 114, D00D16. [Google Scholar] [CrossRef]
  12. Mazhar, U.; Jin, S.; Duan, W.; Bilal, M.; Ali, M.A.; Farooq, H. Spatio-Temporal Trends of Surface Energy Budget in Tibet from Satellite Remote Sensing Observations and Reanalysis Data. Remote Sens. 2021, 13, 256. [Google Scholar] [CrossRef]
  13. Serreze, M.C.; Barrett, A.P.; Slater, A.G.; Steele, M.; Zhang, J.; Trenberth, K.E. The Large-Scale Energy Budget of the Arctic. J. Geophys. Res. 2007, 112, D11122. [Google Scholar] [CrossRef]
  14. Tsubouchi, T.; Bacon, S.; Aksenov, Y.; Garabato, A.C.N.; Beszczynska-Möller, A.; Hansen, E.; de Steur, L.; Curry, B.; Lee, C.M. The Arctic Ocean Seasonal Cycles of Heat and Freshwater Fluxes: Observation-Based Inverse Estimates. J. Phys. Oceanogr. 2018, 48, 2029–2055. [Google Scholar] [CrossRef]
  15. Mayer, M.; Tietsche, S.; Haimberger, L.; Tsubouchi, T.; Mayer, J.; Zuo, H. An Improved Estimate of the Coupled Arctic Energy Budget. J. Clim. 2019, 32, 7915–7934. [Google Scholar] [CrossRef]
  16. Allan, R.P. Evaluation of Simulated Clear-Sky Longwave Radiation Using Ground-Based Observations. J. Clim. 2000, 13, 1951–1964. [Google Scholar] [CrossRef]
  17. Seo, M.; Lee, E.; Lee, K.; Choi, S.; Jin, D.; Seong, N.; Han, H.; Kim, H.-C.; Han, K. Comparative Analysis of Radiative Flux Based on Satellite over Arctic. Korean J. Remote Sens. 2018, 34, 1193–1202. [Google Scholar] [CrossRef]
  18. Seo, M.; Kim, H.-C.; Lee, K.-S.; Seong, N.-H.; Lee, E.; Kim, J.; Han, K.-S. Characteristics of the Reanalysis and Satellite-Based Surface Net Radiation Data in the Arctic. J. Sens. 2020, 2020, e8825870. [Google Scholar] [CrossRef]
  19. Wang, X.; Key, J.R. Recent Trends in Arctic Surface, Cloud, and Radiation Properties from Space. Science 2003, 299, 1725–1728. [Google Scholar] [CrossRef]
  20. Garrett, T.J.; Zhao, C. Increased Arctic Cloud Longwave Emissivity Associated with Pollution from Mid-Latitudes. Nature 2006, 440, 787–789. [Google Scholar] [CrossRef]
  21. Nicolaus, M.; Katlein, C.; Maslanik, J.; Hendricks, S. Changes in Arctic Sea Ice Result in Increasing Light Transmittance and Absorption. Geophys. Res. Lett. 2012, 39, 2012GL053738. [Google Scholar] [CrossRef]
  22. Park, H.-S.; Lee, S.; Kosaka, Y.; Son, S.-W.; Kim, S.-W. The Impact of Arctic Winter Infrared Radiation on Early Summer Sea Ice. J. Clim. 2015, 28, 6281–6296. [Google Scholar] [CrossRef]
  23. Gong, T.; Feldstein, S.; Lee, S. The Role of Downward Infrared Radiation in the Recent Arctic Winter Warming Trend. J. Clim. 2017, 30, 4937–4949. [Google Scholar] [CrossRef]
  24. Lee, K.-S.; Jin, D.; Yeom, J.-M.; Seo, M.; Choi, S.; Kim, J.-J.; Han, K.-S. New Approach for Snow Cover Detection through Spectral Pattern Recognition with MODIS Data. J. Sens. 2017, 2017, e4820905. [Google Scholar] [CrossRef]
  25. Curry, J.A.; Schramm, J.L.; Ebert, E.E. Sea Ice-Albedo Climate Feedback Mechanism. J. Clim. 1995, 8, 240–247. [Google Scholar] [CrossRef]
  26. Chapin, F.S.; Sturm, M.; Serreze, M.C.; McFadden, J.P.; Key, J.R.; Lloyd, A.H.; McGuire, A.D.; Rupp, T.S.; Lynch, A.H.; Schimel, J.P.; et al. Role of Land-Surface Changes in Arctic Summer Warming. Science 2005, 310, 657–660. [Google Scholar] [CrossRef]
  27. Przybylak, R. The Climate of the Arctic; Atmospheric and Oceanographic Sciences Library; Springer International Publishing: Cham, Switzerland, 2016; Volume 52, ISBN 978-3-319-21695-9. [Google Scholar]
  28. Morrison, A.L.; Kay, J.E.; Chepfer, H.; Guzman, R.; Yettella, V. Isolating the Liquid Cloud Response to Recent Arctic Sea Ice Variability Using Spaceborne Lidar Observations. J. Geophys. Res. Atmos. 2018, 123, 473–490. [Google Scholar] [CrossRef]
  29. Morrison, A.L.; Kay, J.E.; Frey, W.R.; Chepfer, H.; Guzman, R. Cloud Response to Arctic Sea Ice Loss and Implications for Future Feedback in the CESM1 Climate Model. JGR Atmos. 2019, 124, 1003–1020. [Google Scholar] [CrossRef]
  30. Seo, M.; Kim, H.-C.; Huh, M.; Yeom, J.-M.; Lee, C.S.; Lee, K.-S.; Choi, S.; Han, K.-S. Long-Term Variability of Surface Albedo and Its Correlation with Climatic Variables over Antarctica. Remote Sens. 2016, 8, 981. [Google Scholar] [CrossRef]
  31. Riihelä, A.; Manninen, T.; Laine, V. Observed Changes in the Albedo of the Arctic Sea-Ice Zone for the Period 1982–2009. Nat. Clim Chang. 2013, 3, 895–898. [Google Scholar] [CrossRef]
  32. Crawford, T.M.; Duchon, C.E. An Improved Parameterization for Estimating Effective Atmospheric Emissivity for Use in Calculating Daytime Downwelling Longwave Radiation. J. Appl. Meteorol. Climatol. 1999, 38, 474–480. [Google Scholar] [CrossRef]
  33. Wang, X.; Liu, J.; Yang, B.; Bao, Y.; Petropoulos, G.P.; Liu, H.; Hu, B. Seasonal Trends in Clouds and Radiation over the Arctic Seas from Satellite Observations during 1982 to 2019. Remote Sens. 2021, 13, 3201. [Google Scholar] [CrossRef]
  34. Di Biagio, C.; Pelon, J.; Blanchard, Y.; Loyer, L.; Hudson, S.R.; Walden, V.P.; Raut, J.-C.; Kato, S.; Mariage, V.; Granskog, M.A. Toward a Better Surface Radiation Budget Analysis Over Sea Ice in the High Arctic Ocean: A Comparative Study Between Satellite, Reanalysis, and Local-Scale Observations. J. Geophys. Res. Atmos. 2021, 126, e2020JD032555. [Google Scholar] [CrossRef]
  35. Jia, A.; Jiang, B.; Liang, S.; Zhang, X.; Ma, H. Validation and Spatiotemporal Analysis of CERES Surface Net Radiation Product. Remote Sens. 2016, 8, 90. [Google Scholar] [CrossRef]
  36. Bourassa, M.A.; Gille, S.T.; Bitz, C.; Carlson, D.; Cerovecki, I.; Clayson, C.A.; Cronin, M.F.; Drennan, W.M.; Fairall, C.W.; Hoffman, R.N.; et al. High-Latitude Ocean and Sea Ice Surface Fluxes: Challenges for Climate Research. Bull. Amer. Meteor. Soc. 2013, 94, 403–423. [Google Scholar] [CrossRef]
  37. Loeb, N.G.; Priestley, K.J.; Kratz, D.P.; Geier, E.B.; Green, R.N.; Wielicki, B.A.; Hinton, P.O.; Nolan, S.K. Determination of Unfiltered Radiances from the Clouds and the Earth’s Radiant Energy System Instrument. J. Appl. Meteorol. Climatol. 2001, 40, 822–835. [Google Scholar] [CrossRef]
  38. Johannsen, F.; Ermida, S.; Martins, J.P.A.; Trigo, I.F.; Nogueira, M.; Dutra, E. Cold Bias of ERA5 Summertime Daily Maximum Land Surface Temperature over Iberian Peninsula. Remote Sens. 2019, 11, 2570. [Google Scholar] [CrossRef]
  39. Hersbach, H.; Bell, B.; Berrisford, P.; Hirahara, S.; Horányi, A.; Muñoz-Sabater, J.; Nicolas, J.; Peubey, C.; Radu, R.; Schepers, D.; et al. The ERA5 Global Reanalysis. Q. J. R. Meteorol. Soc. 2020, 146, 1999–2049. [Google Scholar] [CrossRef]
  40. Kay, J.E.; L’Ecuyer, T.; Chepfer, H.; Loeb, N.; Morrison, A.; Cesana, G. Recent Advances in Arctic Cloud and Climate Research. Curr. Clim. Chang. Rep. 2016, 2, 159–169. [Google Scholar] [CrossRef]
  41. Wielicki, B.A.; Barkstrom, B.R.; Harrison, E.F.; Lee, R.B.; Smith, G.L.; Cooper, J.E. Clouds and the Earth’s Radiant Energy System (CERES): An Earth Observing System Experiment. Bull. Am. Meteorol. Soc. 1996, 77, 853–868. [Google Scholar] [CrossRef]
  42. Dewitte, S.; Clerbaux, N.; Cornelis, J. Decadal Changes of the Reflected Solar Radiation and the Earth Energy Imbalance. Remote Sens. 2019, 11, 663. [Google Scholar] [CrossRef]
  43. Loeb, N.G.; Wielicki, B.A.; Doelling, D.R.; Smith, G.L.; Keyes, D.F.; Kato, S.; Manalo-Smith, N.; Wong, T. Toward Optimal Closure of the Earth’s Top-of-Atmosphere Radiation Budget. J. Clim. 2009, 22, 748–766. [Google Scholar] [CrossRef]
  44. Kato, S.; Loeb, N.G.; Rose, F.G.; Doelling, D.R.; Rutan, D.A.; Caldwell, T.E.; Yu, L.; Weller, R.A. Surface Irradiances Consistent with CERES-Derived Top-of-Atmosphere Shortwave and Longwave Irradiances. J. Clim. 2013, 26, 2719–2740. [Google Scholar] [CrossRef]
  45. Hinkelman, L.M. The Global Radiative Energy Budget in MERRA and MERRA-2: Evaluation with Respect to CERES EBAF Data. J. Clim. 2019, 32, 1973–1994. [Google Scholar] [CrossRef]
  46. Kato, S.; Rose, F.G.; Rutan, D.A.; Thorsen, T.J.; Loeb, N.G.; Doelling, D.R.; Huang, X.; Smith, W.L.; Su, W.; Ham, S.-H. Surface Irradiances of Edition 4.0 Clouds and the Earth’s Radiant Energy System (CERES) Energy Balanced and Filled (EBAF) Data Product. J. Clim. 2018, 31, 4501–4527. [Google Scholar] [CrossRef]
  47. Rienecker, M.M.; Suarez, M.J.; Gelaro, R.; Todling, R.; Bacmeister, J.; Liu, E.; Bosilovich, M.G.; Schubert, S.D.; Takacs, L.; Kim, G.-K.; et al. MERRA: NASA’s Modern-Era Retrospective Analysis for Research and Applications. J. Clim. 2011, 24, 3624–3648. [Google Scholar] [CrossRef]
  48. Gelaro, R.; McCarty, W.; Suárez, M.J.; Todling, R.; Molod, A.; Takacs, L.; Randles, C.A.; Darmenov, A.; Bosilovich, M.G.; Reichle, R.; et al. The Modern-Era Retrospective Analysis for Research and Applications, Version 2 (MERRA-2). J. Clim. 2017, 30, 5419–5454. [Google Scholar] [CrossRef]
  49. Huai, B.; Wang, Y.; Ding, M.; Zhang, J.; Dong, X. An Assessment of Recent Global Atmospheric Reanalyses for Antarctic near Surface Air Temperature. Atmos. Res. 2019, 226, 181–191. [Google Scholar] [CrossRef]
  50. Fetterer, F.; Knowles, K.; Meier, W.N.; Savoie, M.; Windnagel, A.K. Sea Ice Index, Version 3 [Data Set]; National Snow and Ice Data Center: Boulder, CO, USA, 2017. [Google Scholar] [CrossRef]
  51. Cleveland, R.B.; Cleveland, W.S.; McRae, J.E.; Terpenning, I. STL: A Seasonal-Trend Decomposition. J. Off. Stat 1990, 6, 3–73. [Google Scholar]
  52. Hafen, R.P.; Anderson, D.E.; Cleveland, W.S.; Maciejewski, R.; Ebert, D.S.; Abusalah, A.; Yakout, M.; Ouzzani, M.; Grannis, S.J. Syndromic Surveillance: STL for Modeling, Visualizing, and Monitoring Disease Counts. BMC Med. Inform. Decis. Mak. 2009, 9, 21. [Google Scholar] [CrossRef] [Green Version]
  53. Mann, H.B. Nonparametric Tests Against Trend. Econometrica 1945, 13, 245–259. [Google Scholar] [CrossRef]
  54. Kendall, M.G. Rank Correlation Methods; Griffin: Oxford, UK, 1948. [Google Scholar]
  55. Bekryaev, R.V.; Polyakov, I.V.; Alexeev, V.A. Role of Polar Amplification in Long-Term Surface Air Temperature Variations and Modern Arctic Warming. J. Clim. 2010, 23, 3888–3906. [Google Scholar] [CrossRef]
  56. Carmack, E.; Polyakov, I.; Padman, L.; Fer, I.; Hunke, E.; Hutchings, J.; Jackson, J.; Kelley, D.; Kwok, R.; Layton, C.; et al. Toward Quantifying the Increasing Role of Oceanic Heat in Sea Ice Loss in the New Arctic. Bull. Am. Meteorol. Soc. 2015, 96, 2079–2105. [Google Scholar] [CrossRef]
  57. Porter, D.F.; Cassano, J.J.; Serreze, M.C. Local and Large-Scale Atmospheric Responses to Reduced Arctic Sea Ice and Ocean Warming in the WRF Model. J. Geophys. Res. Atmos. 2012, 117, D11115. [Google Scholar] [CrossRef]
  58. Seong, N.-H.; Kim, H.-C.; Choi, S.; Jin, D.; Jung, D.; Sim, S.; Woo, J.; Kim, N.; Seo, M.; Lee, K.-S.; et al. Evaluation of Sea Ice Radiative Forcing According to Surface Albedo and Skin Temperature over the Arctic from 1982–2015. Remote Sens. 2022, 14, 2512. [Google Scholar] [CrossRef]
Figure 1. The study area. The red circle indicates the Arctic Circle.
Remotesensing 15 00829 g001
Figure 2. Time series of net radiation in the Arctic Circle and the spatial distribution of annual changes in net radiation. (a) A time series in which the line with orange-circles is the ERA5 data and the line with blue-triangles is the EBAF data. The figure below shows the spatial distribution of annual net radiative changes with red shaded areas representing increasing net radiation and blue shaded areas representing decreasing areas. (b) ERA5 data and (c) EBAF data.
Remotesensing 15 00829 g002
Figure 3. Time series of the four components that compose the net radiation in the Arctic Circle: (a) shortwave downward radiation, (b) shortwave upward radiation, (c) longwave downward radiation, and (d) longwave upward radiation. The symbols for each product are the same as in Figure 2.
Remotesensing 15 00829 g003
Figure 4. The spatial distribution of annual changes in the four components that composed the net radiation. The top line represents ERA5 data and the bottom line indicates EBAF data: (a,e) are the shortwave downward radiation, (b,f) are the shortwave upward radiation, (c,g) is the longwave downward radiation, and (d,h) is the longwave upward radiation.
Remotesensing 15 00829 g004
Figure 5. The seasonal cycle and high/low peak of net radiation and climate components; red and blue bars represent period of a high peak and low peak respectively; (a) net radiation, (b) MERRA2 surface air temperature, and (c) sea ice extent.
Remotesensing 15 00829 g005
Figure 6. The surface radiation budget in the Arctic Circle from 2000 to 2018; the left (yellow shade) is summer and the right (gray shade) is winter. Width of arrows represents an intensity of radiation, each number represents an average of radiations (W/m2) (change trend per decade [W/m2/decade]); the blue and orange colors represent ERA5 and EBAF, respectively.
Remotesensing 15 00829 g006
Table 1. Decadal trend [W/m2/decade] of the radiative components in extreme season.
Net RadiationSWDSWULWDLWU
ERA5Winter1.53−0.06 *−0.04 *7.84 *5.91 *
Summer1.02 *−3.02−4.10 *1.98 *1.51 *
EBAFWinter−4.62 *−0.04−0.051.716.14 *
Summer4.59 *−3.69 *−8.37 *0.370.42
* significant level (p < 0.05).
Disclaimer/Publisher’s Note: The statements, opinions and data contained in all publications are solely those of the individual author(s) and contributor(s) and not of MDPI and/or the editor(s). MDPI and/or the editor(s) disclaim responsibility for any injury to people or property resulting from any ideas, methods, instructions or products referred to in the content.

