Article

An Object-Oriented Method for Extracting Single-Object Aquaculture Ponds from 10 m Resolution Sentinel-2 Images on Google Earth Engine

1
State Key Laboratory of Remote Sensing Science, Beijing Normal University, Beijing 100875, China
2
Key Laboratory of Environmental Change and Natural Disaster, MOE, Beijing Normal University, Beijing 100875, China
3
Beijing Key Laboratory of Environmental Remote Sensing and Digital City, Beijing Normal University, Beijing 100875, China
4
Faculty of Arts and Sciences, Beijing Normal University at Zhuhai, Zhuhai 519087, China
*
Author to whom correspondence should be addressed.
Remote Sens. 2023, 15(3), 856; https://doi.org/10.3390/rs15030856
Submission received: 3 January 2023 / Revised: 28 January 2023 / Accepted: 1 February 2023 / Published: 3 February 2023
(This article belongs to the Special Issue Remote Sensing of Wetlands and Biodiversity)

Abstract

:
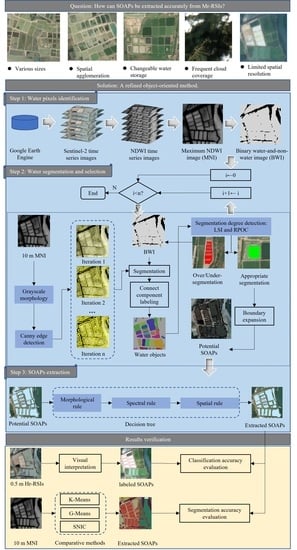
Aquaculture plays a key role in achieving Sustainable Development Goals (SDGs), while it is difficult to accurately extract single-object aquaculture ponds (SOAPs) from medium-resolution remote sensing images (Mr-RSIs). Due to the limited spatial resolutions of Mr-RSIs, most studies have aimed to obtain aquaculture areas rather than SOAPs. This study proposed an object-oriented method for extracting SOAPs. We developed an iterative algorithm combining grayscale morphology and edge detection to segment water bodies and proposed a segmentation degree detection approach to select and edit potential SOAPs. Then a classification decision tree combining aquaculture knowledge about morphological, spectral, and spatial characteristics of SOAPs was constructed for object filter. We selected a 707.26 km2 study region in Sri Lanka and realized our method on Google Earth Engine (GEE). A 25.11 km 2 plot was chosen for verification, where 433 SOAPs were manually labeled from 0.5 m high-resolution RSIs. The results showed that our method could extract SOAPs with high accuracy. The relative error of total areas between extracted result and the labeled dataset was 1.13%. The MIoU of the proposed method was 0.6965, representing an improvement of between 0.1925 and 0.3268 over the comparative segmentation algorithms provided by GEE. The proposed method provides an available solution for extracting SOAPs over a large region and shows high spatiotemporal transferability and potential for identifying other objects.

Graphical Abstract

1. Introduction

Aquaculture is an important source of food and livelihood for hundreds of millions of people around the world [1,2,3]. As shown in Figure 1, the human consumption quantity of aquaculture and fishery products has almost doubled since the 1990s. Driven by increasing populations and social needs, aquaculture has been one of the fastest-growing food production sectors in the world over the past decades [4]. The influences of aquaculture on local natural and social environments are double-edged. On the one hand, the aquaculture industry provides nutritive food and many job opportunities for people, which contributes to the “zero hunger” [5] and “no poverty” [6] goals directly related to the Sustainable Development Goals (SDGs) [7]. On the other hand, the booming aquaculture industry also exerts a negative influence on the environment, causing problems, such as sediment accumulation and water eutrophication [8,9,10,11]. The operation and development of aquaculture are also threatened by natural disasters such as tropical cyclones, floods, and tsunamis. Because aquaculture pond areas are usually close to oceans, lakes, and other natural water bodies, the destruction of aquaculture ponds causes a reduction in aquaculture products, such as fish, shrimp, and mollusks, resulting in vast economic losses. Aquaculture-related losses are considered and measured by the Sendai Framework for Disaster Risk Reduction 2015–2030 [12]. With the increasing development of the global aquaculture industry, it is extremely vital to strengthen both the monitoring and the management of aquaculture [13].
As a result of the rapid global growth of aquaculture in recent years, the spatial distribution of aquaculture and the collection of relevant geographical data reflecting spatio-temporal changes of aquaculture properties represent a focus in agricultural, environmental, and coastal research [4,15,16]. The geospatial information on aquaculture can support the effective management and sustainable development of this growing industry. Aquaculture ponds are the basic units of aquaculture properties; the spatial distribution and temporal change information of aquaculture ponds offer valuable resources for understanding aquaculture situations [15], implementing fishery resource surveys [4], protecting the water environment [16], etc. In addition, when a disaster occurs, a map depicting aquaculture ponds can provide basic geospatial information for disaster relief and loss evaluation. Therefore, accurate and spatially explicit extraction of aquaculture ponds is crucial for monitoring and managing aquaculture properties and further improving the sustainability of the aquaculture industry.
Remote sensing has the features of wide-area spatial coverage and routine observation capability and is a suitable tool for mapping water bodies in wetlands on a regional, national, or global level [17,18,19]. As a type of wetlands, aquaculture ponds are suitable to be detected and extracted from remote sensing images (RSIs) with various spatial, temporal, and spectral resolutions. Researchers have regarded remote sensing as a promising tool for aquaculture mapping [20]. Current methods for extracting the spatial distribution of aquaculture ponds can be divided into four categories. The first category involves visual interpretation methods [21,22]. These methods use aquaculture priori knowledge to classify water bodies and map aquaculture resources from high-resolution remote sensing images (Hr-RSIs). The second category comprises pixel-based image processing methods [23,24,25]. Such methods identify aquaculture and non-aquaculture pixels according to spectral [24,25] and texture [23] features extracted from RSIs. However, most studies of this category aimed to obtain aquaculture areas rather than aquaculture at a single-pond level, since the extraction results tend to contain aquaculture ponds stuck together, forming adhesion areas. The third category involves machine learning methods [26,27,28,29]. These methods are also pixel-based while relying on training samples. Researchers extract features from RSIs and input them into machine learning models, the outputs of which show the identification results of aquaculture pixels. Machine learning methods, especially those based on deep learning models [28,29], are widely used in aquaculture studies. However, those models essentially are data-driven “black-box”; a major limitation in using these models is their sole dependence on the available labeled data [30], which is often limited in aquaculture ponds extraction tasks. The fourth category represents object-oriented methods [4,31,32]. These methods obtain water components by segmenting RSIs, then extract the characteristics of these objects, such as their area and rectangular degree, to finally distinguish between aquaculture and non-aquaculture objects according to knowledge-driven classification rules [31,32] or data-driven statistical models [4]. Compared with other methods, object-oriented approaches can delineate and classify the landscape objects or patches at different scales and are suitable tools for segmenting and classifying aquaculture ponds at a single-object level. Therefore, we explored an object-oriented method for extracting aquaculture ponds in this study.
According to the current literature, various challenges have been faced in studies mapping the spatial information of aquaculture ponds. First, single-object aquaculture ponds (SOAPs) are the basic units of the aquaculture properties. Different kinds of aquaculture products with diverse productive and economic values may be present in such ponds. Since SOAPs represent aquaculture properties at the single-pond level, once a disaster occurs, it is more meaningful to calculate the economic losses of the aquaculture industry based on the affected situation of SOAPs than based on that of pond-clustering aquaculture regions; this is a distinct feature that separates aquaculture from other types of agriculture. However, most studies have aimed to obtain pond-clustering aquaculture areas rather than SOAPs, while the spatial information of aquaculture at the single-pond level is more helpful than that of aquaculture areas for achieving scientific management. Second, it is difficult to accurately extract SOAPs from medium-resolution remote sensing images (Mr-RSIs) due to their limited spatial resolutions. Previous studies usually extracted aquaculture ponds from Hr-RSIs, while an enormous number of Hr-RSIs for study regions at national or global levels are costly and difficult to acquire. The extraction performance using Hr-RSIs is also limited by their long data revisit periods because the object detection of aquaculture ponds requires temporarily dense time series to distinguish ponds from temporarily flooded areas and abandoned aquaculture ponds. Third, object-oriented methods are considered to be suitable tools for segmenting water components and distinguishing SOAPs from them. However, there still exists room for improving the accuracy of extracting SOAPs from Mr-RSIs. Some studies tried to map aquaculture at a single-pond level, while many ponds were mutually connected in the extraction results, and some natural water bodies were misclassified as aquaculture water, resulting in the limited performance of such methods.
Image segmentation is a crucial part of extracting aquaculture ponds at the single-pond level. Although the spatial resolution of the Mr-RSIs poses challenges in detecting detailed structures of small-scale aquaculture ponds, water bodies can be identified and partitioned into proper-scale segments with effective remote sensing indices and well-designed segmentation techniques. Moreover, in terms of object classification, classifiers that comprehensively understand the morphological, spectral, and spatial characteristics of aquaculture ponds have huge potential in distinguishing aquaculture water and non-aquaculture water, while relevant studies are scarce. We thus hypothesize that: (1) an image segmentation algorithm with a fine segmentation strategy can overcome the limitation coming from 10 m spatial resolution to a certain extent, and enhance the segmentation accuracy of SOAPs as soon as possible, and (2) based on a comprehensive understanding of morphological, spectral, and spatial characteristics of aquaculture ponds, we can construct a knowledge-driven classifier to filter aquaculture ponds from segmented objects and realize high classification accuracy. Aiming to solve the problems existing in previous studies and verifying the above hypotheses, the specific objectives of this study are (1) to develop a segmentation algorithm using 10 m Sentinel-2 time series data to explore the potential of applying Mr-RSIs to extract SOAPs, (2) to construct a classification framework for identifying SOAPs according to aquaculture prior knowledge, and (3) to verify the extraction accuracy of aquaculture ponds at the single-pond level. We realized our method on a Google Earth Engine (GEE) big data cloud platform and produced SOAP extraction results. These results were confirmed by a manually labeled verification dataset and by comparing our result with those from widely used image segmentation algorithms on GEE.

2. Materials

2.1. Study Region

A 707.26 km 2 study region (7°39′~60′N, 79°44′~51′E, Figure 2a), selected for the development and testing of the proposed methodology, is located in Northwest Province, Sri Lanka, Asia. This region is one of the major landside aquaculture production areas in the country. Various types of water bodies exist in the study region, including marine areas, rivers, and other water bodies, though aquaculture ponds dominate (Figure 2b,c). The aquaculture ponds in the study area show the following characteristics. First, these aquaculture ponds are located mainly alongside sea, river, and lake regions, especially around lagoons and their connected water systems (Figure 2c). In addition, Sri Lanka is a developing country; its aquaculture industry is dominated by small-scale ponds [33]. These ponds are clustered and separated by thin embankments (Figure 2d,e). In particular, the shapes and sizes of aquaculture ponds are not fixed but change over time. Some ponds may shrink or even dry up because of pond cleaning or dry seasons (Figure 2d). Moreover, Sri Lanka witnessed an economic recession in 2020 due to the COVID-19 epidemic [34]. According to data from the World Bank (https://datatopics.worldbank.org/world-development-indicators/themes/economy.html, accessed on 11 December 2022), the gross domestic product (GDP) of Sri Lanka in 2020 was USD 80.7 billion, down 3.6% from the previous year. This economic recession has limited the development of Sri Lanka’s aquaculture industry, causing many ponds to be abandoned. The complex features of aquaculture ponds in the study region, combined with the limited resolutions of Mr-RSIs (Figure 2e), have undoubtedly increased the difficulty of extracting SOAPs. Therefore, we chose this area for methodology testing and validation to prove the effectiveness of the proposed method.

2.2. Data

The method described in this paper was designed and implemented on GEE. We achieved the proposed algorithm by calling GEE’s application programming interface (API) on the open-source Python interface of Visual Studio Code. GEE is a cloud-based geospatial processing computing platform; it allows for geospatial data retrieval, processing, and analysis from the local to planetary scales [35]. A massive amount of RSIs and geospatial data are available on GEE. This platform can reduce the technical and infrastructural requirements of large-scale and long time-series geospatial analyses, thus making it possible to rapidly and accurately process various amounts of satellite data. To ensure the consistency of spatial location and the accuracy of area statistics [25,36], all data in this paper were projected using the Cylindrical Equal Area project (ESRI: 54034).
For the entire study region, we employed Sentinel-2 multi-spectral images from the entire year of 2020 to extract SOAPs, resulting in a total of 48 standard processed slices embedded in GEE. All of the images were Level-2A and were orthorectified to correct for atmospheric surface reflectance through the Sen2Cor processor [37]. Each scene has spectral bands with spatial resolutions ranging from 10 m to 60 m. Sentinel-2 is a constellation with two twin satellites, Sentinel-2A (S2A) and Sentinel-2B (S2B), with a revisit cycle of up to five days. Table 1 lists the specifications of the primarily used Sentinel-2 bands. The comprehensive use of time-series data throughout the year can effectively prevent the effects of missing data caused by cloud interference and facilitate the effective distinguishing of permanent features from seasonal water bodies [23]. Since the study region is located at low latitudes, the RSIs in this area are vulnerable to the influence of clouds, and it is necessary to preprocess the acquired Sentinel-2 images. We constructed a cloud mask for each RSI based on the quality assessment (QA) band of Sentinel-2 and produced full-coverage clear-sky images. To select aquaculture ponds among the water objects, we acquired the European Space Agency (ESA) WorldCover product for 2020 on GEE. This product provides a global land-use land cover (LULC) map at 10 m resolution based on Sentinel-1 and Sentinel-2 data; the map contains 11 LULC classes, including croplands, herbaceous wetlands, built-up areas, etc. According to the validation report of the ESA WorldCover 2020 product (https://esa-worldcover.org/en/data-access, accessed on 9 September 2022), the overall accuracy of the LULC product reaches 80.7 ± 0.1% in Asia; for the cropland type, the producer’s accuracy is 82.1 ± 0.4%, and the user’s accuracy is 80.5 ± 0.4%.

3. Methodology

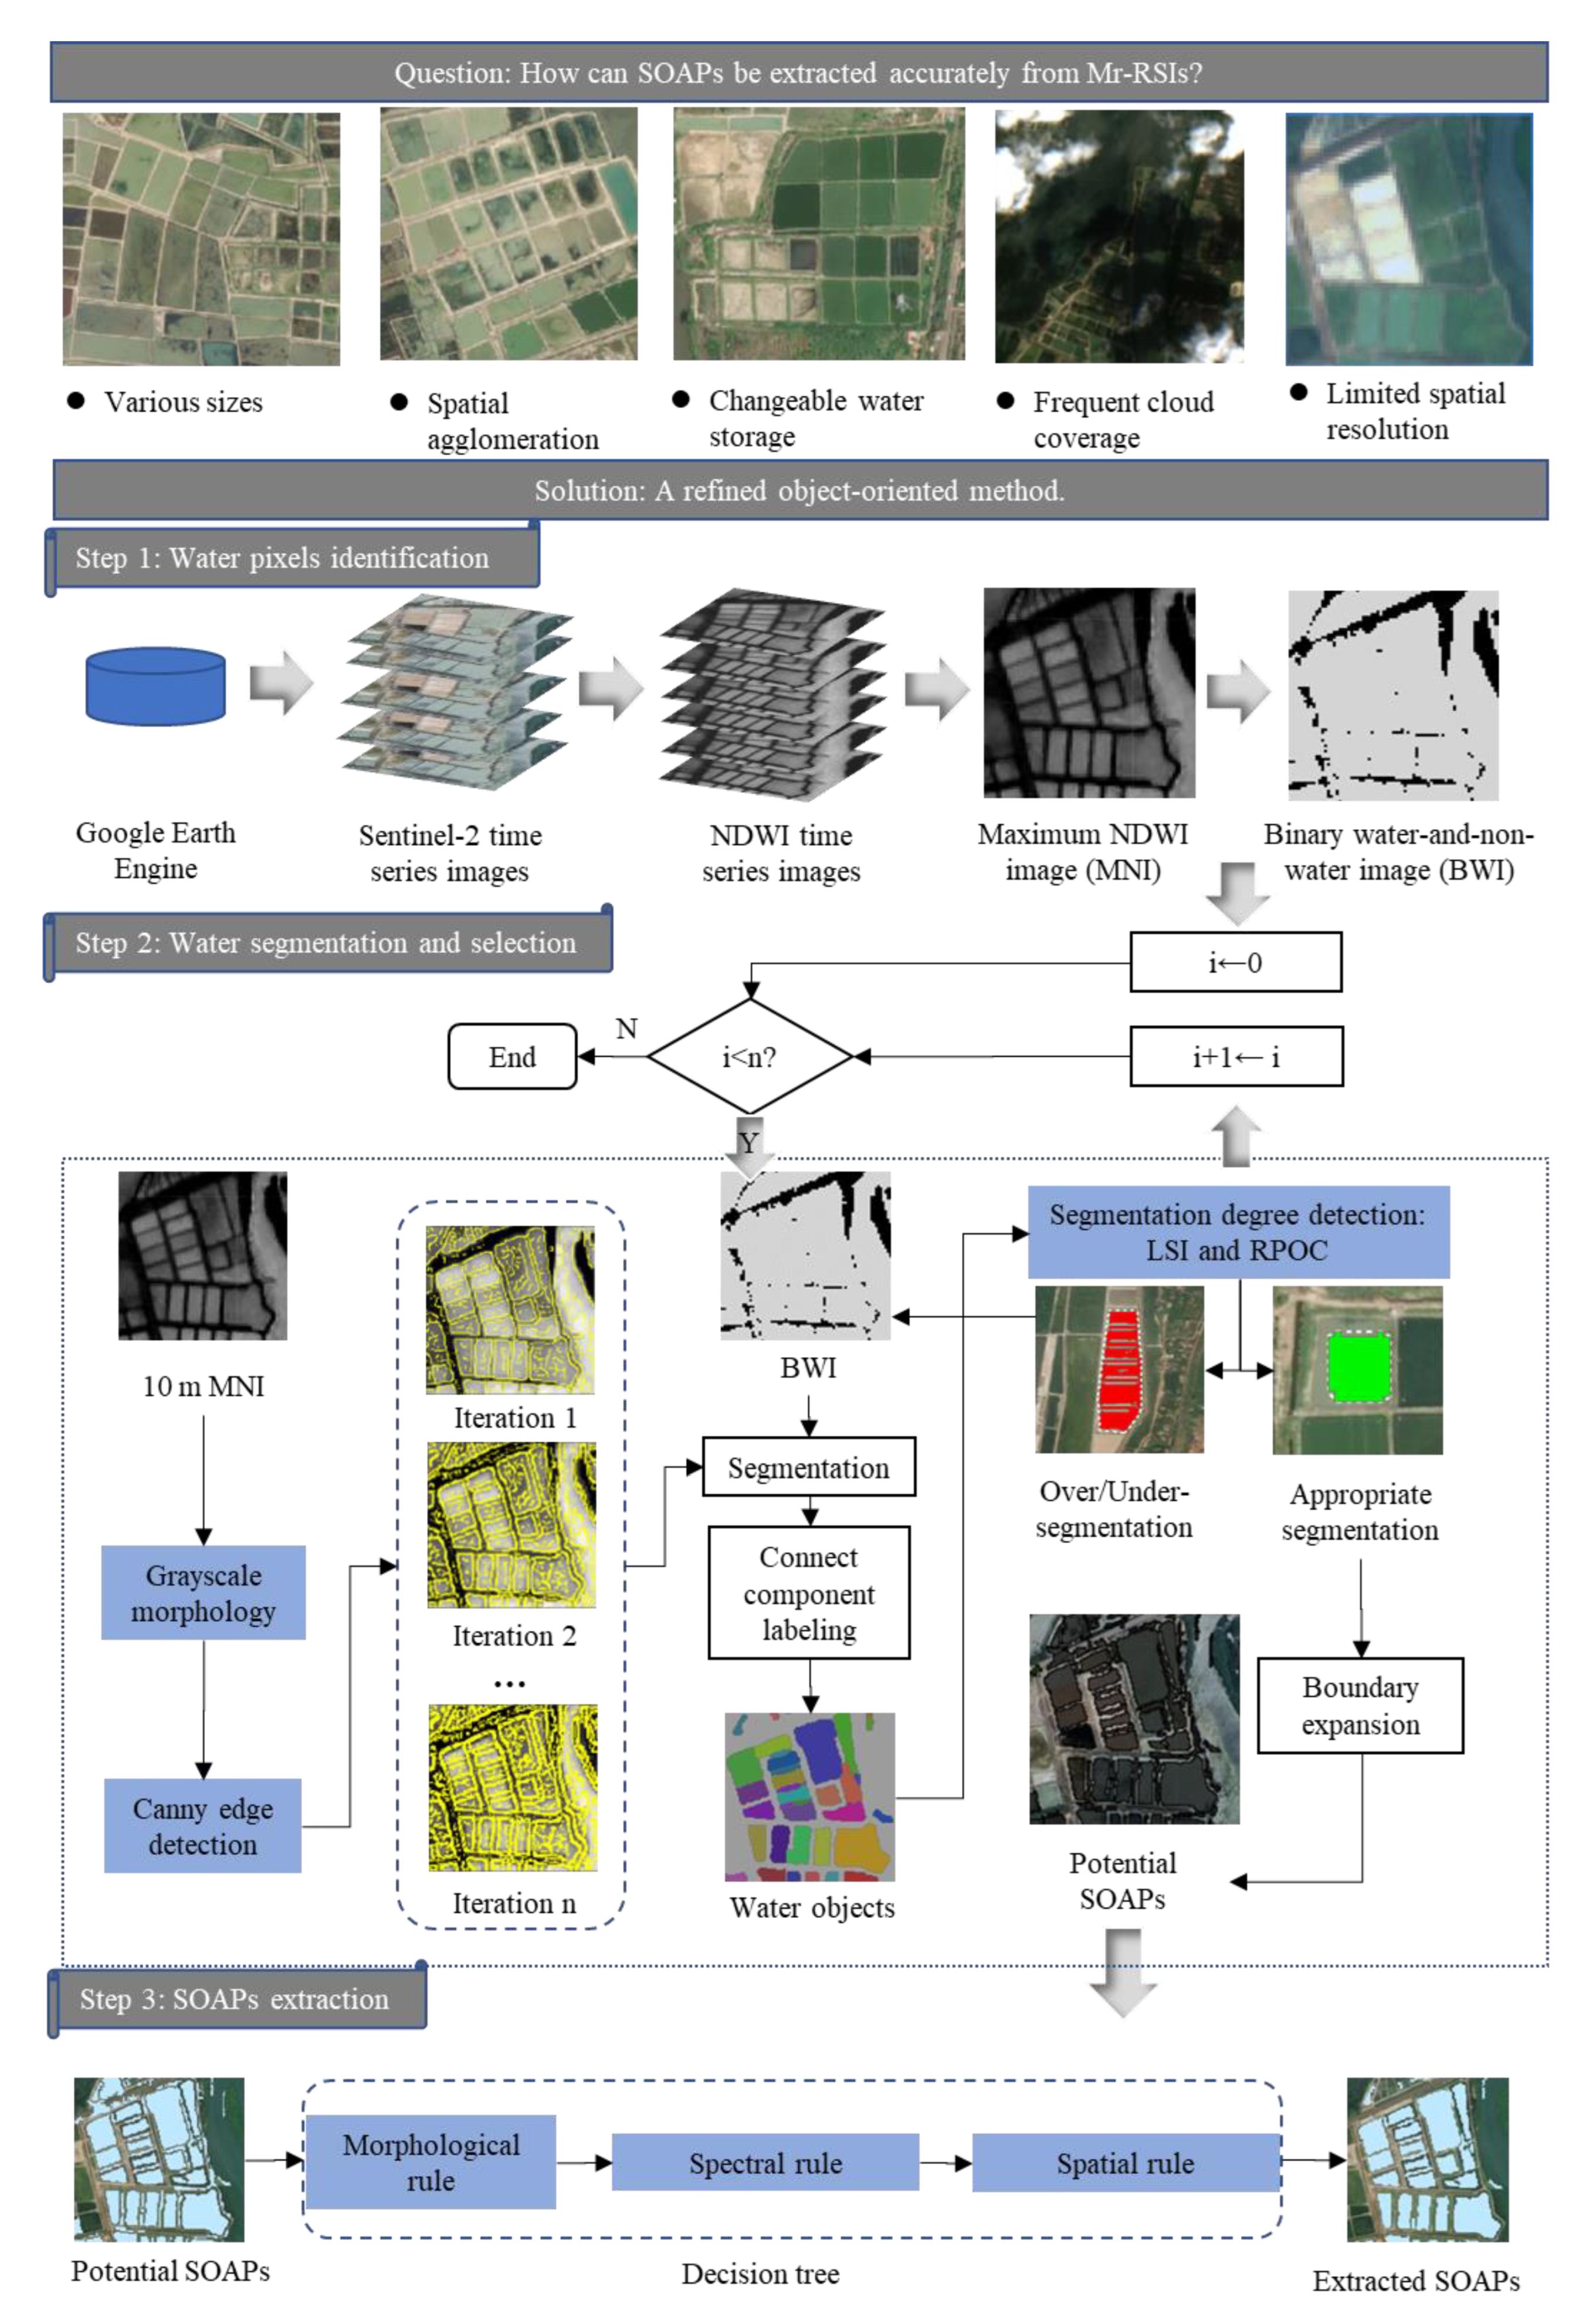
It is a challenging task to extract SOAPs from Mr-RSIs. In terms of image segmentation, densely distributed aquaculture ponds are difficult to distinguish in Mr-RSIs, and this difficulty hinders the accurate segmentation of SOAPs. In terms of object classification, the various sizes and shapes of aquaculture ponds make it difficult to select true SOAPs from water objects. To address the spatial and temporal accuracy challenges faced when extracting SOAPs at large scales, we proposed a refined single-object aquaculture pond extraction method, as shown in Figure 3. Our method comprises three parts: (1) producing a per-pixel maximum water index image from Sentinel-2 time series data, then identifying water pixels by the thresholding method and constructing a binary water and non-water image (hereinafter referred to as the BWI); (2) implementing an iterative algorithm combining grayscale morphology and Canny edge detection to acquire water objects from the BWI, then detecting the segmentation degree of all water objects to select potential SOAPs from those water objects and finally expanding the boundaries of the potential SOAPs to bring them closer to the ground-truth data; and (3) constructing a decision tree based on prior aquacultural knowledge in which true SOAPs are selected according to their morphological, spectral, and spatial features.

3.1. Water Pixels Identification

The water index method, which is both simple and rapid, is widely used to identify water pixels from RSIs. Some commonly used water indices include the Normalized Difference Water Index (NDWI) [38], modified Normalized Difference Water Index (mNDWI) [39], and Automated Water Extraction Index (AWEI) [40]. Calculating the mNDWI and AWEI requires SWIR bands of Sentinel-2 with 20 m resolutions (Table 1); in contrast, the calculation of NDWI requires the B3 (green) and B8 (NIR) bands of Sentinel-2 with 10 m resolutions, and these bands can make distinguishing the embankments between SOAPs easier [23]. Therefore, based on the cloud-free Sentinel-2 time-series images, we calculated NDWI images according to the following formula:
NDWI = B 3 - B 8 B 3 + B 8
To identify water bodies from the NDWI time-series data, a single-band image can be produced by mean, median, or maximum calculation. As mentioned in Section 2.1., the morphology of aquaculture ponds in the study region changes over time. When ponds are in regulation or witnessing abundant precipitation, they have abundant water storage and are close to regular shapes, such as squares or trapezoids; when the ponds are abandoned or in a dry season, they tend to shrink in size or even dry up (Figure 2d). A per-pixel maximum image can reflect the entire morphology of ponds compared to that derived using a mean or median calculation. Since we aimed to extract all potential SOAPs in the image segmentation process, we calculated the maximum value corresponding to each pixel throughout the time-series images and produced a maximum NDWI image (MNI).
Since the MNI was produced from the NDWI time-series data throughout the year using the maximum calculation method, noisy pixels may exist on the generated image. For each pixel covering the study region, a high NDWI value may occur due to sensor errors or temporary water caused by floods. The existence of such noisy pixels would interfere with the refined water segmentation results. We introduced three-sigma limits [41] to reduce possible noise. This is a statistical calculation method in which the data must be within one to three standard deviations from the mean. This approach is available for reducing possible noise in the NDWI time-series data. In this study, data within two standard deviations were retained in the NDWI time-series data and used to produce the MNI. Since the pixels with NDWI values greater than or equal to 0 tend to be identified as water [42], we set 0 as the threshold to separate the MNI pixels into water or non-water and produced a binary water and non-water image (hereinafter referred to as the BWI) for water pixel identification.

3.2. Water Segmentation and Selection

The spatial agglomerating feature of aquaculture ponds and the limited spatial resolution of Sentinel-2 images pose challenges when attempting to achieve refined SOAP extractions. We developed an iterative algorithm combining grayscale morphology (GM) and Canny edge detection (CED) to partition the BWI into water segments explicitly. A segmentation degree detection procedure was embedded into the algorithm to extract potential SOAPs among the water objects. The boundaries of the output objects were expanded to recover the true sizes of the aquaculture ponds. A flowchart of the developed algorithm is shown in Figure 4 and summarized as follows:
  • Inputs: MNI and BWI.
  • Output: potential SOAPs.
  • Parameters: n is the total number of iterations; i is the sequence number during the iteration.
  • Step 1: Set the value of i to 0.
  • Step 2: Compare the values of n and i . If i < n , then go to Step 3; otherwise, end the procedure and output the potential SOAPs.
  • Step 3: Use a 3 × 3 square kernel to implement the GM erosion operation on the MNI and output a processed MNI.
  • Step 4: Implement the CED operation (threshold = 0.2) on the processed MNI and output a Canny edge image (CEI).
  • Step 5: If i = 0, then go to Step 6; otherwise, overlay the CEI with the previously output CEIs and output an accumulated CEI.
  • Step 6: For the BWI, remove the intersected pixels between the output CEI and the BWI and then output a segmented BWI with water segments.
  • Step 7: Implement the connect component labeling operation on the segmented BWI and mark all water segments as unique water objects based on pixel connectivity (four-connected).
  • Step 8: Implement segmentation degree detection on all water objects and select those passing this detection as potential SOAPs.
  • Step 9: Remove the pixels belonging to potential SOAPs from the BWI and output a new BWI for Step 6.
  • Step 10: Expand the boundaries of the newly acquired potential SOAPs and set the distance to expand these SOAPs equal to i × 2.5   m .
  • Step 11: Set i to i + 1 , then go to Step 2.

3.2.1. Grayscale Morphology and Canny Edge Detection

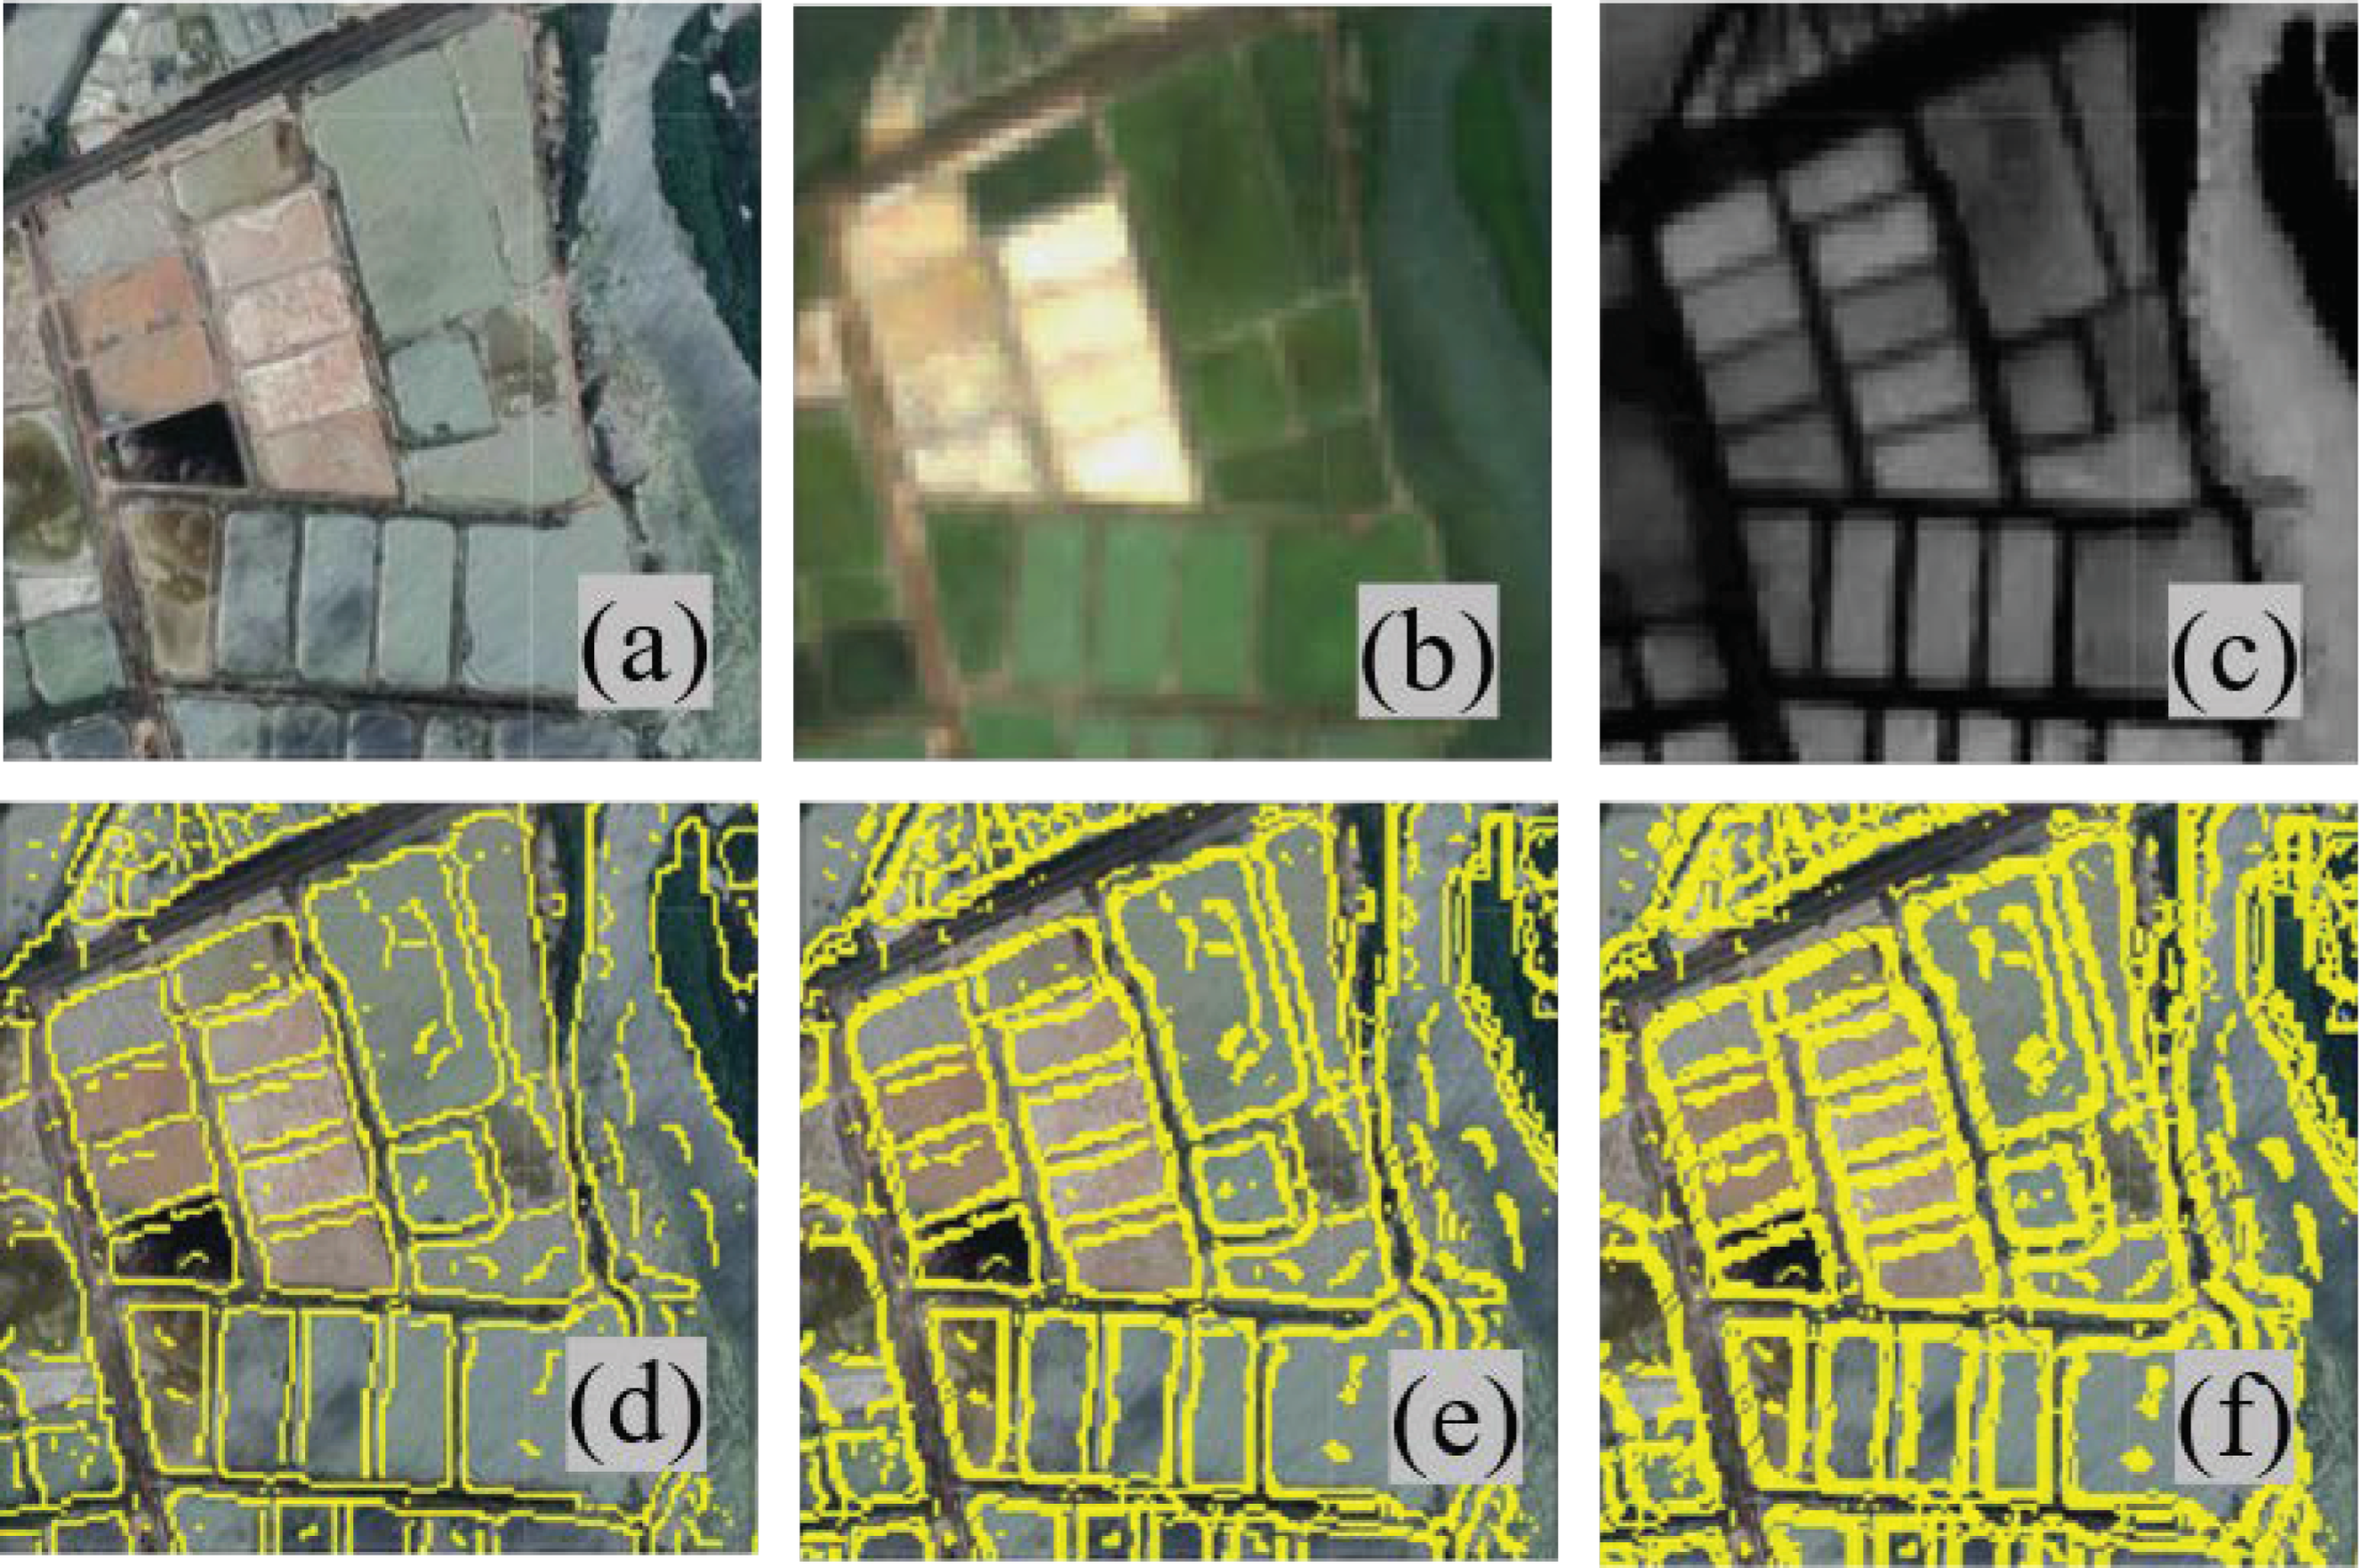
The BWI generated by the single-threshold segmentation method can identify water bodies and estimate water areas at large scales but can hardly achieve explicit water segmentation results. In this binary image, aquaculture ponds often appear to be connected. Since the contrast between the features of embankments and water bodies is obvious on the MNI (Figure 5c), edge detection can be carried out based on the NDWI within the detected water bodies to further identify the embankments of aquaculture ponds. We selected the widely used Canny operator [43] to implement edge detection on the MNIs. After testing a few sample sites, we set the Canny edge detection threshold to 0.2 and produced a Canny edge image (CEI). The spatial resolution of the CEI is settable on GEE because the Canny edge is calculated according to the difference between two adjacent pixels. Considering that the MNI and BWI from Sentinel-2 data have 10 m resolutions, we reprojected the initial CEI to a 5 m resolution image and overlaid it with the BWI. A few testing sample sites showed that the 5 m CEI could partition the BWIs into water segments that were similar to the ground truth.
However, a single CED can hardly identify all SOAPs from the CEI because narrow embankments cannot be seen clearly in the CEI due to its limited spatial resolution. Mathematical Morphology (MM) contributes a wide range of operators to the image-processing domain and is widely used to change the morphology of objects on the image [44]. As a kind of MM approach, binary morphology (BM) methods such as expansion or opening operations are usually applied to link Canny edges [23], but these procedures may change the initial morphology of water segments. Instead of implementing BM procedures on the CEI, we chose to carry out a grayscale morphology (GM) operation on the MNI, one of the key steps to achieve refined water segmentation. Although GM operations change the digital numbers (DNs) of the MNI, the shapes of aquaculture ponds are retained on the processed MNI, constituting the advantage of the GM compared to the BM [45]. Therefore, we combined the GM and CED methods to produce the CEI from the MNI and acquired water segments by overlaying the CEI with the BWI. The above operations were repeated during the execution of the iterative algorithm. As shown in Figure 5, as the iterative segmentation proceeded, the MNI was continually eroded by the GM operation; then, a new CEI was generated by implementing CED on the eroded MNI. The new CEI was accumulated with the previously generated CEIs, so the interrupted parts of the previous CEIs were supplemented by the new Canny edges (Figure 5d–f). Therefore, the iterative operation connected Canny edges while maintaining the initial shapes of the aquaculture ponds.

3.2.2. Segmentation Degree Detection

After acquiring water segments from the BWI at each iteration, connected component labeling (CCL) was introduced to mark each segment with a unique label. The CCL approach detects objects by considering the connectivity of focal pixels with neighboring pixels (four neighbors were used in this study), where the connected pixels are merged into the same objects [46]. As shown in Figure 5f, continuous segmentation and CCL operations on aquaculture pond segments are unnecessary, thus not only increasing the computational effort of the developed algorithm but also leading to the possible destruction of the morphology of these ponds. Considering that aquaculture ponds commonly have regular boundaries that are artificially constructed to minimize construction costs [47], we used morphological regularity to depict the geometric differences between aquaculture ponds and non-aquaculture ponds and thus proposed the segmentation degree detection (SDD) method. For each water object, if its geometry passed the SDD, it was identified as a potential SOAP and the corresponding water segment was removed from the BWI; otherwise, this object was considered as a connected pond and participated in the next segmentation iteration.
The key step of SDD is defining suitable parameters for measuring the consistency between the water object and the aquaculture pond. We classified the object morphology into three segmentation degrees (Figure 6e). The first degree was the appropriate segmentation degree, among which each water object had a regular contour and involved only one single-object pond (Figure 6b). The second degree represented over-segmentation. As shown in Figure 6a, over-segmented objects were usually man-made dykes or levees alongside aquaculture ponds. The last degree was under-segmentation, and such water bodies were connected with aquaculture ponds or embankments (Figure 6c,d). If connected embankments were contained in an object, the morphology of this object was irregular; if ponds were connected in the object, its contours tended to appear cogged-like.
We defined two SDD parameters to determine whether an object needed to participate in the next segmentation round or not. The landscape shape index (LSI) [48] was introduced in this study to measure the morphological regularity of objects. This index measures the complexity of a shape by calculating the deviation between the object and the square of the same area. An object having a large LSI indicates that its shape greatly deviates from the corresponding square, representing a highly irregular morphology. LSI is formulated as follows:
LSI = 0 . 25 P object A object
where P object is the perimeter of the object, and A object is the area of the object.
LSI can measure the regularity of objects and further indicate their segmentation degrees. However, its capability to measure contour-based regularity is limited, especially when the object involves a few connected ponds or embankments (Figure 6d). We found that the contour of the completely separated object appears close to that of its corresponding convex hull. In contrast, objects involving connected ponds or embankments have anfractuous contours, and the perimeters of such objects appear far beyond those of their convex hulls. Therefore, we defined the ratio of the perimeter between an object and its convex hull (hereinafter referred to as RPOC) to measure the contour-based regularity, formulated as follows:
RPOC = P object P convex   hull
where P convex   hull is the perimeter of the convex hull corresponding to the object.
After testing a few sample sites, we set the LSI threshold to 2.5 and the RPOC threshold to 1.5. These thresholds conform to the general regulation of aquaculture ponds and show good applicability. If both the LSI and RPOC of the water object were less than or equal to their thresholds, this object was considered appropriately segmented and extracted as a potential SOAP. Because the SOAPs were separated by the overlay of CEI and BWI, their current sizes were smaller than those of the ground truth. The weakening phenomenon of the size of an object increased incrementally as the iterative method proceeded. Therefore, we extended the boundary of each potential SOAP to restore its true morphology. Considering that the resolution of Canny edges was set to 5 m in this study, we set the distance to buffer these selected objects as the product of 2.5 m and the sequence number of iterations.

3.3. Aquaculture Ponds Extraction

The proposed water segmentation and selection algorithm output potential SOAPs, among which some incorrect types were included, such as natural water objects, such as oceans, rivers, and lakes, and manual objects, such as rice paddies and embankments between aquaculture ponds. Such misclassified objects share similar morphology features with SOAPs but may differ in their spectral or spatial characteristics. To filter these misclassifications from the potential SOAPs, we constructed a decision tree according to aquaculture knowledge. We employed the decision tree to select true SOAPs based on their morphological, spectral, and spatial characteristics, as detailed in Figure 7.
We implemented a survey in the study area and found that the SOAP area did not exceed 520,000 m 2 . Therefore, we filtered objects larger than this size, thus excluding water objects such as oceans, lakes, and rivers. Since aquaculture ponds are clustered in the study area, the embankments between two ponds are usually difficult to distinguish using 10 m Sentinel-2 Mr-RSIs. This situation is especially common regarding densely distributed aquaculture ponds. Although the spatial resolution of the Sentinal-2 images is limited, we can take advantage of the abundant spectral bands of these images to expand their application for identifying the embankments between ponds. Since the NDWI of an embankment is lower than that of a pond, we counted the median NDWI of each object from the potential SOAPs and excluded objects with median NDWIs lower than 0.15. This threshold was determined after a few testing sample sites and was shown to successfully filter not only embankment objects but also abandoned ponds, because an abandoned pond lacks regular water supplementation and can see restored water only during the rainy seasons, thus determining its unstable NDWI throughout the time-series data. Rice paddies share similar morphology and spatial distribution characteristics with aquaculture ponds, making it difficult to exclude these objects from potential SOAPs. Thanks to the current era of big data, we have a wealth of thematic data at our disposal that can be used to further eliminate misclassified objects. We implemented overlay analysis between acquired LULC imagery and potential SOAP objects. For each object, we counted its LULC content; if 50% or more pixels in this object belonged to cropland, it would be identified as rice paddies and would be filtered from potential SOAPs. Since aquaculture ponds are clustered, objects distant from other water bodies are likely to be non-SOAPs. We sampled some aquaculture ponds from the study area and counted their numbers of near-neighbor ponds within 100 m. After a few testing sample sites, we found most aquaculture ponds have 3 or more near-neighbor ponds. According to the above aquaculture priori knowledge, the decision tree selects true SOAPs based on the following rules: (1) areas smaller than 520,000 m 2 , (2) median NDWIs greater than or equal to 0.15, (3) LULC contents of cropland less than 50%, and (4) numbers of near-neighbor objects within 100 m greater than or equal to 3.

4. Results

4.1. Mapping Aquaculture Ponds

We achieved the proposed method by calling GEE’s API on the Python interface of Visual Studio Code. Aquaculture ponds in the study region were extracted as SOAPs and mapped in Figure 8. Most extracted aquaculture ponds were concentrated around oceans, lagoons, and other water systems (Figure 8a), and this result not only conforms to the real situation in the study area but also conforms to the general distribution pattern of aquaculture ponds [47,49]. We used the developed iterative algorithm to partition the BWI into water segments and selected potential SOAPs from these segments, thus successfully separating adjacent waters from aquaculture ponds (Figure 8b,c). The boundary expansion operation applied to the potential SOAPs successfully made their shapes and sizes close to those shown in the ground-truth data (Figure 8b). We considered the spectral characteristics of aquaculture ponds while constructing the decision tree to extract aquaculture ponds, thereby filtering abandoned ponds from potential SOAPs and producing a temporally efficient map of aquaculture ponds (Figure 8d).
To explore the SOAP extraction results, we counted the numbers of aquaculture ponds within different areal ranges. The statistical operation was implemented using Python tool packages mentioned in Appendix A. The results presented in Figure 9a show that our proposed method extracted a total of 3577 aquaculture ponds in the study region, with a total area of 13,208,439.33 m 2 . Most aquaculture ponds were 0–10,000 m 2 in size, accounting for 96.39% of all SOAPs extracted in this study. Only 129 aquaculture ponds were larger than 10,000 m 2 , thus accounting for a small proportion compared to those at smaller scales. This situation is in line with the ground truth because the aquaculture industry in the study region is dominated by small-scale ponds. Only 10 aquaculture ponds larger than 50,000 m 2 were extracted in this study, illustrating that very large aquaculture ponds are rare in the local aquaculture industry. To further explore the numerical distribution of common aquaculture ponds within the size of 0–10,000 m 2 , a histogram is presented in Figure 9b. The number of extracted SOAPs with areas of 1000–2000 m 2 was the greatest, accounting for 30.37% of all extracted SOAPs within the size of 0–10,000 m 2 . With an increase in the areal range, the number of corresponding SOAPs decreased. It is noticeable that the proposed method extracted only 289 SOAPs smaller than 1000 m 2 , 27.60% of those within the size of 1000–2000 m 2 . This situation may deviate from the real situation because we extracted SOAPs from 10 m Mr-RSIs where small-scale ponds were difficult to distinguish from adjacent water bodies. Although the performance of the proposed method in extracting small-scale aquaculture ponds was limited by the spatial resolution of the Mr-RSIs, we took advantage of the abundant spectral information and frequent revisits of Sentinel-2 images and realized a refined SOAP extraction method as soon as possible. Our method promoted the application value of the Mr-RSIs in mapping aquaculture ponds.

4.2. SOAPs Extraction Accuracy Assessment

To verify the performance of the proposed method in extracting aquaculture ponds, we selected a 25.11 km2 region as a verification plot (Figure 10a). Aquaculture experts were invited to mark SOAPs by visually interpreting the 0.5 m Hr-RSIs from World Imagery Wayback (https://livingatlas.arcgis.com/wayback, accessed on 28 September 2022). During the manual labeling process, the MNI served as reference information to filter abandoned SOAPs and ensure the consistency of label coverage and ground-truth water. A total of 433 SOAPs with a total area of 1,737,425.02 m 2 were finally labeled from the verification plot. The size of labelled SOAPs varied from 0 to 20,088.66 m 2 and were representative in terms of morphological, spectral, and spatial characteristics. This manually labeled dataset was accurate and could be considered as ground truth. We tested our method in the verification region and extracted 526 SOAPs with a total area of 1,757,058.66 m 2 . The relative error of the total areas between labelled SOAPs and extracted SOAPs was 1.13%, revealing a high agreement between the manual annotations in the verification data and the extracted result.

4.2.1. Classification Accuracy Assessment

To further evaluate the classification accuracy of the proposed method, we overlaid labeled SOAPs with extracted SOAPs and produced spatially matched SOAP samples on GEE. Those extracted SOAPs with spatially matched labeled SOAPs would be concerned as correctly classified SOAPs. As a comparison, extracted SOAPs without spatially matched labeled ponds would be concerned as commission SOAPs; labeled SOAPs without matched extracted ponds would be concerned as omission SOAPs. The omission and commission errors were calculated by using the Python tool packages mentioned in Appendix A. Overall, 3.46% of the labeled SOAPs were missed in the extraction result (Table 2). The omission error of the area covered by labeled SOAPs was 1.95%. All ponds larger than 4000 m 2 were correctly classified in the verification region. The above analyses revealed a high producer’s accuracy of the proposed method. Moreover, ponds within the size of 2000–4000   m 2 contributed most to the omission SOAPs (Figure 10d).
Table 3 shows the commission errors between extracted and labeled SOAPs. Among all the SOAPs extracted by the proposed method, 17.87% of them were actually non-aquaculture ponds, which accounted for 13.17% of the total area of extracted SOAPs. Moreover, SOAPs with areas ≤ 2000 m 2 contributed most to the commission ponds, and those within the size of 2000–4000 m 2 contributed most to the total area of the wrongly extracted ponds. Most wrongly extracted objects were located in rivers, lakesides, and coasts close to aquaculture areas (Figure 10c). A possible explanation is that the morphology of water bodies in those regions was unstable during the whole year, which generates obvious contrast between these water bodies and adjacent objects on the MNI. It can be found from Table 2 and Table 3 that the classification error is mainly contributed by small-scale aquaculture ponds with an area ≤ 4000 m 2 , because these aquaculture ponds are difficult to distinguish on Mr-RSIs.

4.2.2. Segmentation Accuracy Assessment and Comparison

Compared to those manually labeled SOAPs from 0.5 m Hr-RSIs, the SOAPs extracted using the proposed method were generated from 10 m Mr-RSIs, causing their shapes and sizes to deviate from the ground-truth data somewhat. However, those labeled SOAPs are available for comparing the segmentation performance between the proposed method and other widely used image segmentation algorithms. We compared our method with three image segmentation algorithms provided by GEE: K-Means [50], G-Means [51], and Simple Non-Iterative Clustering (SNIC) [52]. For each method, we input the same MNI, acquired image segments from this water index image, and examined whether the labeled SOAPs matched the corresponding segments in terms of their locations, shapes, and sizes. All three algorithms on GEE were pretested and deployed with optimized parameters to output optimal image segmentation results. Table 4 provides the parameters setting for the proposed and comparative methods.
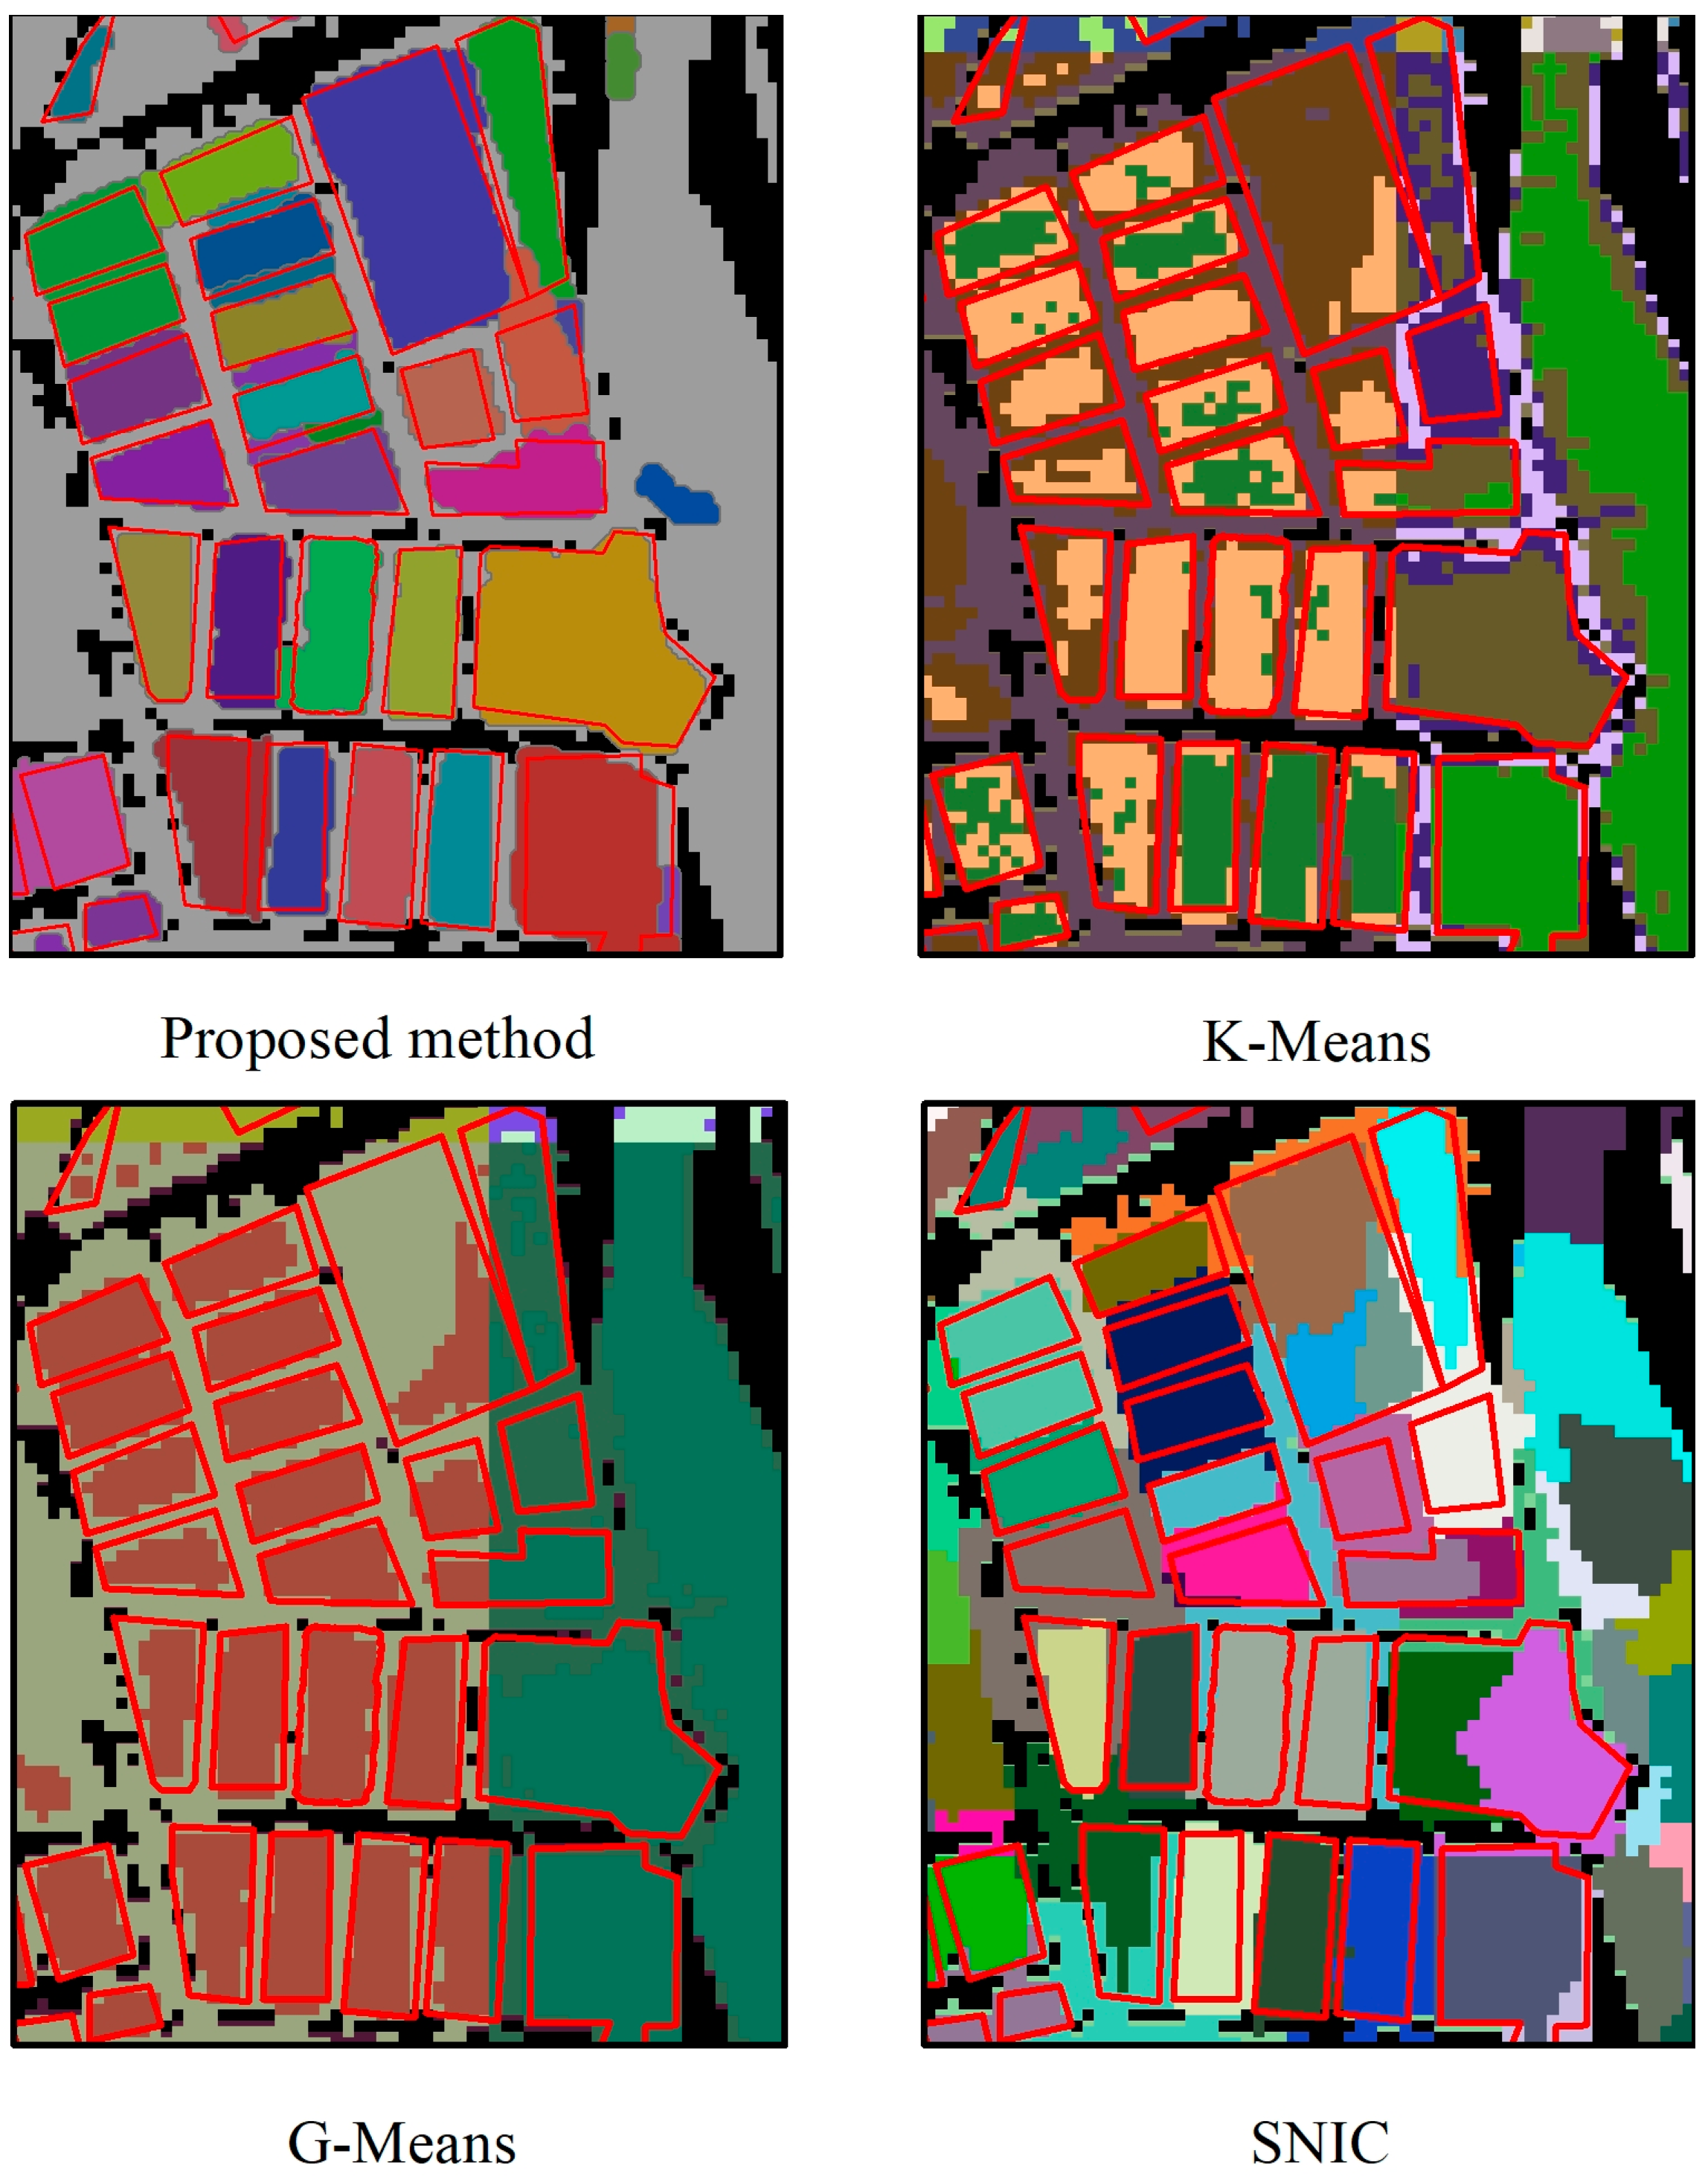
Figure 11 shows the differences among the four methods in partitioning the MNI into water objects. The water objects representing SOAPs extracted by the proposed method are close to the labeled SOAPs, meaning that our method successfully separated water objects and could further acquire SOAPs that were similar to the ground truth. In contrast, many noisy pixels were observed in the K-Means segmentation results, even though the algorithm was deployed with optimized parameters. The G-Means results showed that some water objects involving aquaculture ponds were connected with natural waters, thus indicating that this method could not separate aquaculture ponds from adjacent water bodies well. Compared to the G-Means results, the SNIC segmentation results correctly distinguished aquaculture waters from natural waters, but some water objects representing SOAPs were over-segmented and separated into multiple parts. Compared to the methods provided by GEE, our proposed method implemented a refined image segmentation process, implying that the SOAPs extracted from the following decision tree classification method were similar to the ground-truth data.
To further evaluate the segmentation accuracy of the proposed method, we overlaid the labeled SOAPs with extracted SOAPs and acquired produced spatially matched SOAP samples on GEE. Similar operations were also conducted between labeled SOAPs and image segments from the K-Means, G-Means, and SNIC methods to compare the segmentation accuracy between the proposed method and image segmentation algorithms provided by GEE. We introduced four metrics to verify and compare the segmentation performances of the proposed, K-Means, G-Means, and SNIC methods. These five indicators were the root mean squared error (RMSE), mean absolute error (MAE), mean absolute percentage error (MAPE), and mean intersection over union (MIoU), which can be formulated as follows:
RMSE = 1 n i = 1 n y i x i 2 ,
MAE = 1 n i = 1 n y i x i ,
MAPE = 100 % n i = 1 n | y i x i y i | ,
MIoU = 1 n i = 1 n Area Overlap Area Union ,
where n is the number of spatially matched SOAP samples; xi is the area of extracted SOAP in the i th sample; y i is the area of labeled SOAP in the i th sample;   x ¯ and   y ¯ are the average areas of extracted SOAPs and labeled SOAPs, respectively, for each matched SOAP sample; Area Overlap is the area of the overlap between the extracted SOAP and the corresponding labeled SOAP; and Area Union is the area of the union of the two SOAPs.
We calculated the areas of labeled SOAPs and their spatially matched extracted SOAPs, as well as their IoUs, on GEE, and counted the above four metrics using the Python tool packages as mentioned in Appendix A. Table 5 shows the overall segmentation accuracy of the proposed and comparative methods. We introduced the RMSE and MAE metrics to evaluate the comprehensive SOAP segmentation performances among the four methods. The RMSE of our method was 3850.41 m 2 , which was higher than that of SNIC and G-Means. However, the proposed method has the lowest MAE at 1286.04 m2, followed by 1803.92   m 2 MAE of the SNIC method. The highest MAE, coming from the G-Means method, was 2533.89 m 2 , over twice that of the proposed method. Since aquaculture ponds have diverse sizes, the RMSE and MAE results may be influenced by matched SOAP samples with huge areal deviations between labeled and segmented objects. For each sample with labeled SOAP and the corresponding segment, we calculated the relative error of their areas and introduced the MAPE metric to eliminate possible interruptions due to huge areal deviation. The result showed that the MAPE of the proposed method was 34.23%. In other words, the area of each extracted SOAP exhibited a 34.23% deviation from the true area on average. The MIoU of the proposed method was 0.6965, showing an obvious improvement compared with that of the SNIC (0.5040), K-Means (0.4326), and G-Means (0.3697) methods. In general, compared to the widely used image segmentation methods on GEE, our proposed method showed the best performance in segmenting SOAPs.
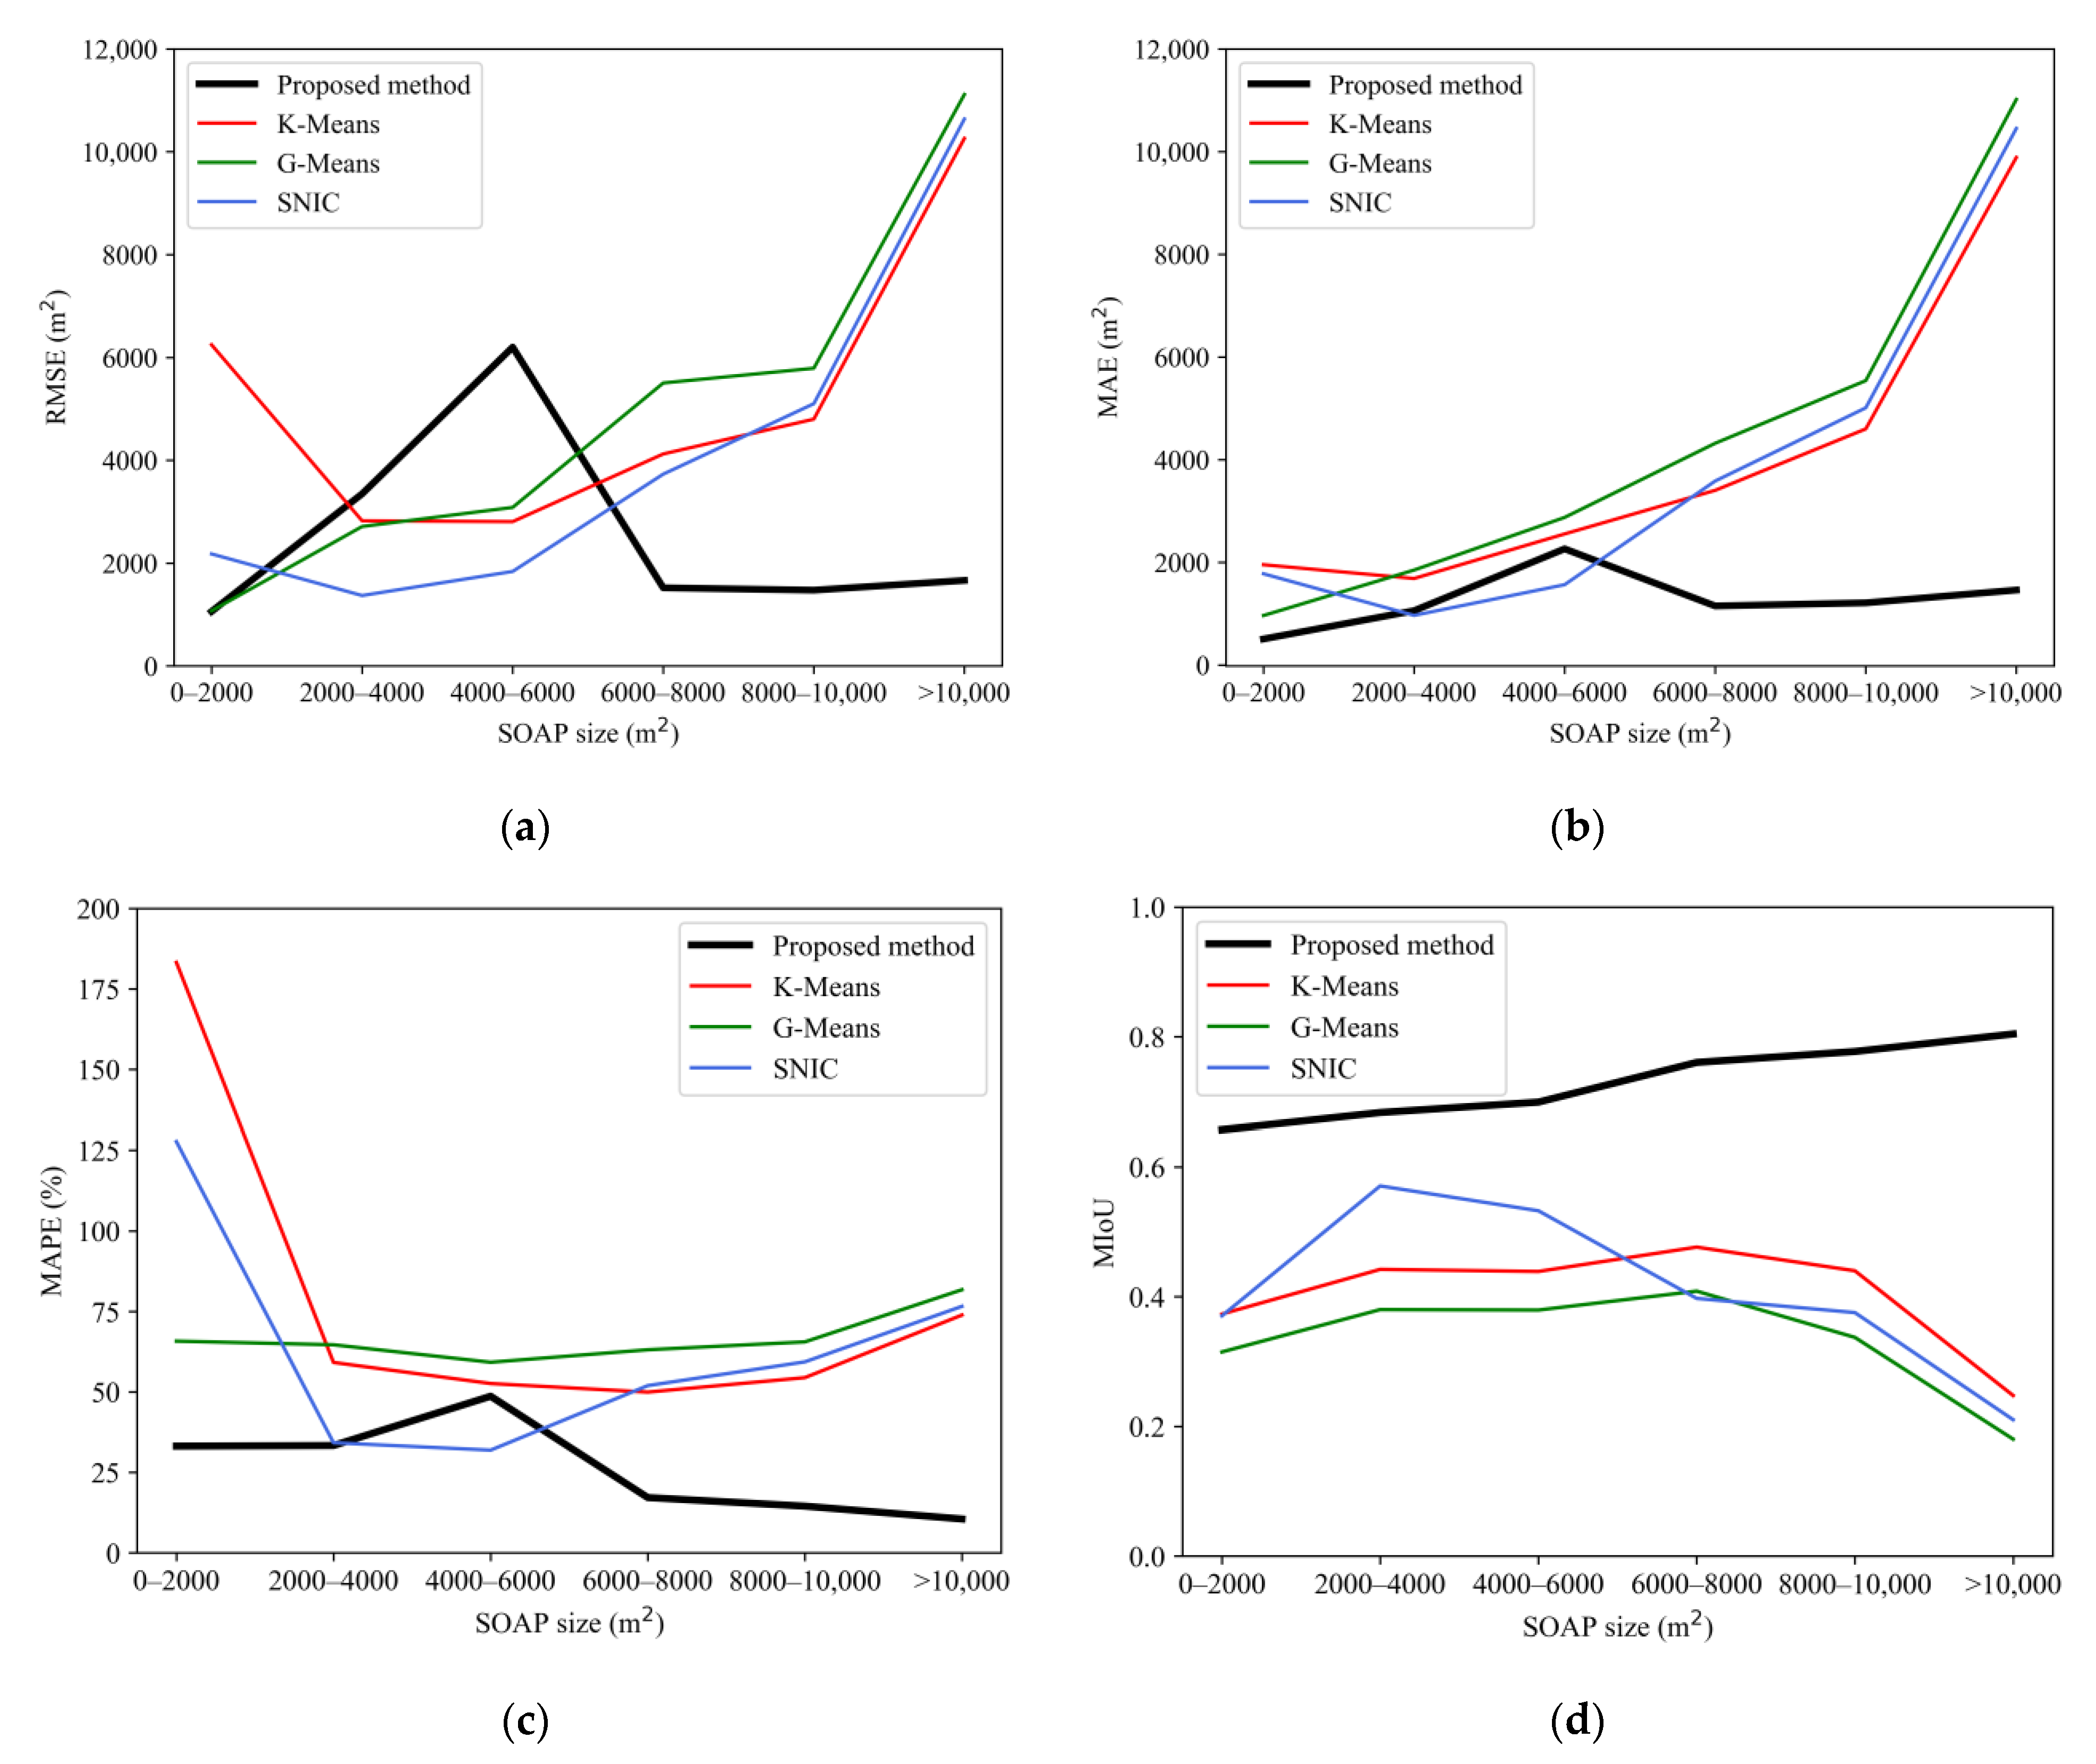
To further explore the segmentation accuracies of the proposed, K-Means, G-Means, and SNIC methods for aquaculture ponds at different scales, we compared the RMSEs, MAEs, MAPEs, and MIoUs of these four methods for SOAPs in different size classes. The accuracy assessment result was produced by using the Python tool packages on Visual Studio Code (for more details, please see Appendix A), which is shown in Figure 12. It can be found that our proposed method showed higher segmentation accuracy for large-scale aquaculture ponds than the comparative methods. All four metrics of the proposed method showed the best performance for segmenting SOAPs with areas > 6000 m 2 among all the image segmentation methods. In contrast, for large-scale aquaculture ponds ( > 8000 m 2 ), surprising accuracy consistency could be found among the K-Means, G-Means, and SNIC methods; in particular, the three comparative methods showed unsatisfied segmentation accuracy for SOAPs larger than 10,000 m 2 . The majority of aquaculture ponds in the verification region are small-scale, and those comparative methods after parameter optimization tend to show segmentation performance well for most SOAPs, which is small. At the same time, the segmentation accuracy for large aquaculture ponds was ignored, which may explain the accuracy consistency of the comparative methods for large-scale SOAPs. This phenomenon demonstrated that the three comparative algorithms provided by GEE failed to simultaneously satisfy the segmentation requirement for SOAPs with diverse sizes. In contrast, our proposed method showed stable and good segmentation performance for aquaculture ponds with different sizes. It can be seen in Figure 12d that the MIoUs of the proposed methods are higher than those of the comparative methods, increasing steadily from 0.6569 (0–2000 m 2 ) to 0.8043 ( > 10,000 m 2 ). However, the performance of our method for aquaculture ponds with the size class 4000–6000 m 2 could be improved. As shown in Figure 12a–c, the RMSE of the proposed method for 4000–6000 m 2 SOAPs was the highest, at 6199.59 m2, and the MAE (2262.83) and MAPE (48.65%) of the method for such SOAPs were higher than those of SNIC. A possible explanation is that some extracted SOAPs failed to separate adjacent aquaculture ponds with the size of 4000–6000 m 2 and caused the ‘adhesion’ phenomenon [53]. Overall, the proposed method showed a better segmentation performance than those image segmentation methods on GEE and could satisfy the segmentation task for aquaculture ponds at different scales.

5. Discussion

5.1. A Transferable Approach

We proposed an object-oriented method to extract SOAPs based on their real characteristics. Although the development status of aquaculture varies regionally, some common features of aquaculture ponds can be applied to SOAP extraction methods. The method proposed herein can be applied to large-scale SOAP extraction and mapping tasks in other regions around the world. First, we calculated the NDWI from Sentinel-2 time-series data, which is a general approach for extracting water bodies. The MNI made from the NDWI time-series images reflected the complete morphology of aquaculture ponds. In addition, grayscale morphology and edge detection methods are widely used in processing images, and we combined these two methods to implement a refined image segmentation. We provided two segmentation degree detection parameters that measured the morphology of water objects and selected potential SOAPs from those objects. These parameters conformed to the general morphological rules of aquaculture ponds and helped achieve preliminary SOAP selection. Moreover, the priori knowledge about common aquaculture ponds in terms of their morphological, spectral, and spatial information was combined to construct a decision tree classification framework. Finally, the proposed method was implemented and realized on GEE. This method is easily transferable and can be applied in any region around the world. By adjusting algorithm parameters to allow adaptation to different regions, this proposed method is promising for mapping global aquaculture ponds on GEE.
The proposed method can be applied not only to extract SOAPs but also to detect and extract other objects, such as single-object buildings and cultivated plots. Our SOAP extraction method is essentially an object-oriented image segmentation and classification method. We created an MNI, a single-band image from which aquaculture ponds could be clearly reflected. Researchers have proposed many remote sensing indices to help extract various objects on Earth. For example, the normalized difference vegetation index (NDVI) can be calculated using optical RSIs and can help extract plants on the surface of the Earth and measure their growth situation. We also proposed the segmentation degree detection procedure to measure the morphological regularity of segmented objects and extract potential SOAPs during image segmentation. Many objects appear to be regularly shaped and can be seen explicitly on such images using remote sensing indices. For example, croplands with regular shapes can be clearly shown in the NDVI images. Bare lands tend to exist between croplands, making the margins of croplands easily identifiable. Therefore, we believe that the proposed method can be applied to cropland extraction tasks and can output satisfactory results. We further recommend our method for the extraction of such targets: (1) those shown on a single-band image, (2) with regular morphology, and (3) with clear boundaries between the targets and nontargets.

5.2. Future Work

Some limitations to the proposed method exist. First, our method was developed for processing single-band images. A procedure to transform original multiband images to single-band images is thus necessary, and this limits the application of the proposed algorithm. Second, our algorithm requires that many thresholds be set according to a few testing sample sites, and this requirement, to a certain extent, challenges the professional qualifications of the users. Some adaptive threshold methods will be explored to improve the automaticity of our algorithm. Third, the classification rules proposed in this study are exclusive to extracting aquaculture ponds. When applying our method to extract other types of objects, extra work is needed, which limits the application scenarios of this method. Some universal rules for extracting common objects will be explored and embedded into our approach for expanding its application scenarios. In general, we proposed an object-oriented method for extracting SOAPs based on the geological mechanisms of aquaculture. Although the priori knowledge about these geological mechanisms has significantly advanced our understanding of aquaculture and guides us in extracting SOAPs, our proposed method is limited in its ability to extract all the knowledge directly from RSIs. In the era of big data, data science and machine learning have become indispensable tools for knowledge discovery, as the volume of data continues to explode in practically every research domain [30,54,55]. In future research, we will try to use aquaculture big data and machine learning models to extract SOAPs, explore their combinations with methods based on geological mechanisms and propose new methods coupling geological mechanisms and machine learning.

6. Conclusions

This study constitutes a step forward in achieving a refined SOAPs extraction from Mr-RSIs. We proposed an object-oriented image segmentation and classification method to extract SOAPs by producing an MNI and BWI from Sentinel-2 time-series data using the water index and thresholding segmentation, respectively. To achieve water segmentation and selection, we developed an iterative algorithm combining CM and CED. The iterative algorithm acquired water objects from the BWI and MNI and employed LSI and ROPC to detect their segmentation degrees. Potential SOAPs were selected from water objects and buffered to make their shapes similar to the ground truth. Using a decision tree based on aquacultural prior knowledge, true SOAPs were selected according to their morphological, spectral, and spatial features. We selected a 707.26 km 2 study region in Sri Lanka and achieved the proposed method on GEE. We chose a 25.11 km plot for verification. A total of 433 SOAPs were manually labeled from 0.5 m Hr-RSIs to compare with those extracted by the proposed method and comparative image segmentation algorithms (K-Means, G-Means, and SNIC) provided by GEE. The following conclusions were drawn from the results that were obtained in this study:
  • A total of 3577 aquaculture ponds were extracted in the study region, with a total area of 13,208,439.33 m 2 . Most aquaculture ponds were 0–10,000 m 2 in size, accounting for 96.39% of all SOAPs extracted in this study, indicating that the aquaculture industry in the study region is dominated by small-scale ponds.
  • The proposed method could extract SOAPs with high accuracy. The relative error of the total areas between labeled SOAPs and extracted SOAPs was 1.13%, and the omission errors of labeled SOAPs were 3.46% in number and 1.95% in area, revealing that our method could effectively map aquaculture ponds.
  • The proposed method showed better performance in segmenting SOAPs than K-Means, G-Means, and SNIC methods provided by GEE. The MIoU of our method was 0.6965, representing an improvement of between 0.1925 and 0.3268 over the comparative methods. The MIoUs of the proposed methods at all SOAP size classes were higher than those of the comparative methods, indicating that our method is superior to widely used image segmentation algorithms in segmenting SOAPs.
We provided an effective solution for extracting and mapping SOAPs at large scales. As an object-oriented image-processing algorithm, the proposed method shows application potential beyond the extraction of aquaculture ponds. In this paper, we proposed suitable application scenarios for this method to extract other objects and recommended that researchers apply this method in future work. However, the proposed method achieves this effect by manually selecting the optimal parameters. The same parameters may no longer be applicable after changing the scene, thus requiring that users possess professional knowledge. We will further improve our method by altering these adaptive thresholds in the hope of broadening its application scenarios and audience.

Author Contributions

Conceptualization, A.G. and B.L.; methodology, B.L. and A.G.; software, B.L.; validation, Z.C., X.P., L.L. and J.L.; formal analysis, A.G. and W.B.; investigation, B.L., Z.C. and X.P.; data curation, B.L. and Z.C.; writing—original draft preparation, B.L. and A.G.; writing—review and editing, B.L., A.G. and X.P.; visualization, L.L. and J.L.; supervision, A.G.; project administration, A.G. and B.L.; funding acquisition, A.G. All authors have read and agreed to the published version of the manuscript.

Funding

This research was funded by the National Key Research and Development Program of China (Grant No. 2019YFE01277002) and the National Natural Science Foundation of China (Grant No. 41671412).

Data Availability Statement

The code of the proposed method can be accessed at https://github.com/designer1024/Single_Object_Aquaculture_Ponds_Extraction (accessed on 23 January 2023).

Acknowledgments

The authors would like to express deep gratitude to Zexin Fu from Beijing University of Civil Engineering and Architecture for her help in manuscript editing. We are also very grateful to the anonymous reviewers for their valuable comments and suggestions for the improvement of this paper.

Conflicts of Interest

The authors declare no conflict of interest.

Appendix A

Software and tools used for algorithm achievement, SOAPs extraction result analyses, and accuracy assessments: Visual Studio Code 1.74.3, Python 3.11.0 (GEE Python API; basic tool packages: numpy 1.24.1, pandas 1.5.3, and matplotlib 3.6.3), and ArcGIS 10.7.

References

  1. Zhang, W.; Belton, B.; Edwards, P.; Henriksson, P.J.; Little, D.C.; Newton, R.; Troell, M. Aquaculture Will Continue to Depend More on Land than Sea. Nature 2022, 603, E2–E4. [Google Scholar] [CrossRef] [PubMed]
  2. Sandström, V.; Chrysafi, A.; Lamminen, M.; Troell, M.; Jalava, M.; Piipponen, J.; Siebert, S.; van Hal, O.; Virkki, V.; Kummu, M. Food System By-Products Upcycled in Livestock and Aquaculture Feeds Can Increase Global Food Supply. Nat. Food 2022, 3, 729–740. [Google Scholar] [CrossRef]
  3. Stiller, D.; Ottinger, M.; Leinenkugel, P. Spatio-Temporal Patterns of Coastal Aquaculture Derived from Sentinel-1 Time Series Data and the Full Landsat Archive. Remote Sens. 2019, 11, 1707. [Google Scholar] [CrossRef]
  4. Ottinger, M.; Bachofer, F.; Huth, J.; Kuenzer, C. Mapping Aquaculture Ponds for the Coastal Zone of Asia with Sentinel-1 and Sentinel-2 Time Series. Remote Sens. 2021, 14, 153. [Google Scholar] [CrossRef]
  5. Nasr-Allah, A.; Gasparatos, A.; Karanja, A.; Dompreh, E.B.; Murphy, S.; Rossignoli, C.M.; Phillips, M.; Charo-Karisa, H. Employment Generation in the Egyptian Aquaculture Value Chain: Implications for Meeting the Sustainable Development Goals (SDGs). Aquaculture 2020, 520, 734940. [Google Scholar] [CrossRef]
  6. Food and Agriculture Organization (FAO). The State of World Fisheries and Aquaculture 2020. Sustainability in Action; FAO: Rome, Italy, 2020; ISBN 978-92-5-132692-3. [Google Scholar]
  7. Wu, X.; Fu, B.; Wang, S.; Song, S.; Li, Y.; Xu, Z.; Wei, Y.; Liu, J. Decoupling of SDGs Followed by Re-Coupling as Sustainable Development Progresses. Nat. Sustain. 2022, 5, 452–459. [Google Scholar] [CrossRef]
  8. Wang, B.; Cao, L.; Micheli, F.; Naylor, R.L.; Fringer, O.B. The Effects of Intensive Aquaculture on Nutrient Residence Time and Transport in a Coastal Embayment. Environ. Fluid Mech. 2018, 18, 1321–1349. [Google Scholar] [CrossRef]
  9. Neofitou, N.; Papadimitriou, K.; Domenikiotis, C.; Tziantziou, L.; Panagiotaki, P. GIS in Environmental Monitoring and Assessment of Fish Farming Impacts on Nutrients of Pagasitikos Gulf, Eastern Mediterranean. Aquaculture 2019, 501, 62–75. [Google Scholar] [CrossRef]
  10. Herbeck, L.S.; Krumme, U.; Andersen, T.J.; Jennerjahn, T.C. Decadal Trends in Mangrove and Pond Aquaculture Cover on Hainan (China) since 1966: Mangrove Loss, Fragmentation and Associated Biogeochemical Changes. Estuar. Coast. Shelf Sci. 2020, 233, 106531. [Google Scholar] [CrossRef]
  11. Emenike, E.C.; Iwuozor, K.O.; Anidiobi, S.U. Heavy Metal Pollution in Aquaculture: Sources, Impacts and Mitigation Techniques. Biol. Trace Elem. Res. 2022, 200, 4476–4492. [Google Scholar] [CrossRef]
  12. United Nations for Disaster Risk Reduction (UNISDR) Technical Guidance for Monitoring and Reporting on Progress in Achieving the Global Targets of the Sendai Framework for Disaster Risk Reduction. Available online: https://www.preventionweb.net/publication/technical-guidance-monitoring-and-reporting-progress-achieving-global-targets-sendai (accessed on 30 May 2022).
  13. Duan, Y.; Li, X.; Zhang, L.; Chen, D.; Liu, S.; Ji, H. Mapping National-Scale Aquaculture Ponds Based on the Google Earth Engine in the Chinese Coastal Zone. Aquaculture 2020, 520, 734666. [Google Scholar] [CrossRef]
  14. Food and Agriculture Organization (FAO). The State of World Fisheries and Aquaculture 2022. Towards Blue Transformation; FAO: Rome, Italy, 2022; ISBN 978-92-5-136364-5. [Google Scholar]
  15. Duan, Y.; Tian, B.; Li, X.; Liu, D.; Sengupta, D.; Wang, Y.; Peng, Y. Tracking Changes in Aquaculture Ponds on the China Coast Using 30 Years of Landsat Images. Int. J. Appl. Earth Obs. Geoinf. 2021, 102, 102383. [Google Scholar] [CrossRef]
  16. Hukom, V.; Nielsen, R.; Asmild, M.; Nielsen, M. Do Aquaculture Farmers Have an Incentive to Maintain Good Water Quality? The Case of Small-Scale Shrimp Farming in Indonesia. Ecol. Econ. 2020, 176, 106717. [Google Scholar] [CrossRef]
  17. Isikdogan, F.; Bovik, A.C.; Passalacqua, P. Surface Water Mapping by Deep Learning. IEEE J. Sel. Top. Appl. Earth Obs. Remote Sens. 2017, 10, 4909–4918. [Google Scholar] [CrossRef]
  18. Mayer, T.; Poortinga, A.; Bhandari, B.; Nicolau, A.P.; Markert, K.; Thwal, N.S.; Markert, A.; Haag, A.; Kilbride, J.; Chishtie, F.; et al. Deep Learning Approach for Sentinel-1 Surface Water Mapping Leveraging Google Earth Engine. ISPRS Open J. Photogramm. Remote Sens. 2021, 2, 100005. [Google Scholar] [CrossRef]
  19. Orusa, T.; Cammareri, D.; Borgogno Mondino, E.B. A Possible Land Cover EAGLE Approach to Overcome Remote Sensing Limitations in the Alps Based on Sentinel-1 and Sentinel-2: The Case of Aosta Valley (NW Italy). Remote Sens. 2022, 15, 178. [Google Scholar] [CrossRef]
  20. Ottinger, M.; Clauss, K.; Kuenzer, C. Opportunities and Challenges for the Estimation of Aquaculture Production Based on Earth Observation Data. Remote Sens. 2018, 10, 1076. [Google Scholar] [CrossRef]
  21. Rajitha, K.; Mukherjee, C.K.; Vinu Chandran, R. Applications of Remote Sensing and GIS for Sustainable Management of Shrimp Culture in India. Aquac. Eng. 2007, 36, 1–17. [Google Scholar] [CrossRef]
  22. Gong, P.; Niu, Z.; Cheng, X.; Zhao, K.; Zhou, D.; Guo, J.; Liang, L.; Wang, X.; Li, D.; Huang, H.; et al. China’s wetland change (1990–2000) determined by remote sensing. Sci. China Earth Sci. 2010, 53, 1036–1042. [Google Scholar] [CrossRef]
  23. Wang, Z.; Zhang, J.; Yang, X.; Huang, C.; Su, F.; Liu, X.; Liu, Y.; Zhang, Y. Global Mapping of the Landside Clustering of Aquaculture Ponds from Dense Time-Series 10 m Sentinel-2 Images on Google Earth Engine. Int. J. Appl. Earth Obs. Geoinf. 2022, 115, 103100. [Google Scholar] [CrossRef]
  24. Hou, Y.; Zhao, G.; Chen, X.; Yu, X. Improving Satellite Retrieval of Coastal Aquaculture Pond by Adding Water Quality Parameters. Remote Sens. 2022, 14, 3306. [Google Scholar] [CrossRef]
  25. Peng, Y.; Sengupta, D.; Duan, Y.; Chen, C.; Tian, B. Accurate Mapping of Chinese Coastal Aquaculture Ponds Using Biophysical Parameters Based on Sentinel-2 Time Series Images. Mar. Pollut. Bull. 2022, 181, 113901. [Google Scholar] [CrossRef] [PubMed]
  26. Gusmawati, N.F.; Zhi, C.; Soulard, B.; Lemonnier, H.; Selmaoui-Folcher, N. Aquaculture Pond Precise Mapping in Perancak Estuary, Bali, Indonesia. J. Coast. Res. 2016, 75, 637–641. [Google Scholar] [CrossRef]
  27. Gusmawati, N.; Soulard, B.; Selmaoui-Folcher, N.; Proisy, C.; Mustafa, A.; Le Gendre, R.; Laugier, T.; Lemonnier, H. Surveying Shrimp Aquaculture Pond Activity Using Multitemporal VHSR Satellite Images-Case Study from the Perancak Estuary, Bali, Indonesia. Mar. Pollut. Bull. 2018, 131, 49–60. [Google Scholar] [CrossRef] [PubMed]
  28. Shi, T.; Zou, Z.; Shi, Z.; Chu, J.; Zhao, J.; Gao, N.; Zhang, N.; Zhu, X. Mudflat Aquaculture Labeling for Infrared Remote Sensing Images via a Scanning Convolutional Network. Infrared Phys. Technol. 2018, 94, 16–22. [Google Scholar] [CrossRef]
  29. Zou, Z.; Chen, C.; Liu, Z.; Zhang, Z.; Liang, J.; Chen, H.; Wang, L. Extraction of Aquaculture Ponds along Coastal Region Using U2-Net Deep Learning Model from Remote Sensing Images. Remote Sens. 2022, 14, 4001. [Google Scholar] [CrossRef]
  30. Daw, A.; Karpatne, A.; Watkins, W.; Read, J.; Kumar, V. Physics-Guided Neural Networks (PGNN): An Application in Lake Temperature Modeling. arXiv 2021, arXiv:1710.11431. [Google Scholar]
  31. Sun, Z.; Luo, J.; Yang, J.; Yu, Q.; Zhang, L.; Xue, K.; Lu, L. Nation-Scale Mapping of Coastal Aquaculture Ponds with Sentinel-1 SAR Data Using Google Earth Engine. Remote Sens. 2020, 12, 3086. [Google Scholar] [CrossRef]
  32. Wen, K.; Yao, H.; Huang, Y.; Chen, H.; Liao, P. Remote Sensing Image Extraction for Coastal Aquaculture Ponds in the Guangxi Beibu Gulf based on Google Earth Engine. Trans. Chin. Soc. Agric. Eng. 2021, 37, 280–288. [Google Scholar] [CrossRef]
  33. Asbjorn, D. Aquaculture in Sri Lanka: History, Current Status and Future Potential. Int. J. Aquac. Fish. Sci. 2020, 6, 102–105. [Google Scholar] [CrossRef]
  34. Ahmed, N.; Azra, M.N. Aquaculture Production and Value Chains in the COVID-19 Pandemic. Curr. Environ. Health Rep. 2022, 9, 423–435. [Google Scholar] [CrossRef] [PubMed]
  35. Gorelick, N.; Hancher, M.; Dixon, M.; Ilyushchenko, S.; Thau, D.; Moore, R. Google Earth Engine: Planetary-Scale Geospatial Analysis for Everyone. Remote Sens. Environ. 2017, 202, 18–27. [Google Scholar] [CrossRef]
  36. Bao, W.; Gong, A.; Zhang, T.; Zhao, Y.; Li, B.; Chen, S. Mapping Population Distribution with High Spatiotemporal Resolution in Beijing Using Baidu Heat Map Data. Remote Sens. 2023, 15, 458. [Google Scholar] [CrossRef]
  37. Yang, L.; Mansaray, L.; Huang, J.; Wang, L. Optimal Segmentation Scale Parameter, Feature Subset and Classification Algorithm for Geographic Object-Based Crop Recognition Using Multisource Satellite Imagery. Remote Sens. 2019, 11, 514. [Google Scholar] [CrossRef]
  38. McFeeters, S.K. The Use of the Normalized Difference Water Index (NDWI) in the Delineation of Open Water Features. Int. J. Remote Sens. 1996, 17, 1425–1432. [Google Scholar] [CrossRef]
  39. Xu, H. Modification of Normalised Difference Water Index (NDWI) to Enhance Open Water Features in Remotely Sensed Imagery. Int. J. Remote Sens. 2006, 27, 3025–3033. [Google Scholar] [CrossRef]
  40. Feyisa, G.L.; Meilby, H.; Fensholt, R.; Proud, S.R. Automated Water Extraction Index: A New Technique for Surface Water Mapping Using Landsat Imagery. Remote Sens. Environ. 2014, 140, 23–35. [Google Scholar] [CrossRef]
  41. Pukelsheim, F. The Three Sigma Rule. Am. Stat. 1994, 48, 88–91. [Google Scholar] [CrossRef]
  42. Deng, Y.; Jiang, W.; Tang, Z.; Ling, Z.; Wu, Z. Long-Term Changes of Open-Surface Water Bodies in the Yangtze River Basin Based on the Google Earth Engine Cloud Platform. Remote Sens. 2019, 11, 2213. [Google Scholar] [CrossRef]
  43. Canny, J.F. A Computational Approach to Edge Detection. IEEE Trans. Pattern Anal. Mach. Intell. 1986, 8, 679–698. [Google Scholar] [CrossRef]
  44. Rishikeshan, C.A.; Ramesh, H. An Automated Mathematical Morphology Driven Algorithm for Water Body Extraction from Remotely Sensed Images. ISPRS J. Photogramm. Remote Sens. 2018, 146, 11–21. [Google Scholar] [CrossRef]
  45. Nachtegael, M.; Kerre, E.E. Connections between Binary, Gray-Scale and Fuzzy Mathematical Morphologies. Fuzzy Sets Syst. 2001, 124, 73–85. [Google Scholar] [CrossRef]
  46. Samet, H. Connected Component Labeling Using Quadtrees. J. ACM 1981, 28, 487–501. [Google Scholar] [CrossRef]
  47. Zeng, Z.; Wang, D.; Tan, W.; Huang, J. Extracting Aquaculture Ponds from Natural Water Surfaces around Inland Lakes on Medium Resolution Multispectral Images. Int. J. Appl. Earth Obs. Geoinf. 2019, 80, 13–25. [Google Scholar] [CrossRef]
  48. Gyenizse, P.; Bognár, Z.; Czigány, S.; Elekes, T. Landscape Shape Index, as a Potencial Indicator of Urban Development in Hungary. Landsc. Environ. 2014, 8, 78–88. [Google Scholar]
  49. Hou, X.; Feng, L.; Tang, J.; Song, X.-P.; Liu, J.; Zhang, Y.; Wang, J.; Xu, Y.; Dai, Y.; Zheng, Y. Anthropogenic Transformation of Yangtze Plain Freshwater Lakes: Patterns, Drivers and Impacts. Remote Sens. Environ. 2020, 248, 111998. [Google Scholar] [CrossRef]
  50. Krishna, K.; Murty, M.N. Genetic K-Means Algorithm. IEEE Trans. Syst. Man Cybern. Part B 1999, 29, 433–439. [Google Scholar] [CrossRef]
  51. Hamerly, G.; Elkan, C. Learning the k in K-Means. Adv. Neural Inf. Process. Syst. 2003, 16. [Google Scholar] [CrossRef]
  52. Achanta, R.; Susstrunk, S. Superpixels and Polygons Using Simple Non-Iterative Clustering. In Proceedings of the IEEE Conference on Computer Vision and Pattern Recognition, Honolulu, HI, USA, 21–26 July 2017; pp. 4651–4660. [Google Scholar]
  53. Cui, B.; Fei, D.; Shao, G.; Lu, Y.; Chu, J. Extracting Raft Aquaculture Areas from Remote Sensing Images via an Improved U-Net with a PSE Structure. Remote Sens. 2019, 11, 2053. [Google Scholar] [CrossRef]
  54. Li, B.; Gong, A.; Zeng, T.; Bao, W.; Xu, C.; Huang, Z. A Zoning Earthquake Casualty Prediction Model Based on Machine Learning. Remote Sens. 2021, 14, 30. [Google Scholar] [CrossRef]
  55. Bao, W.; Gong, A.; Zhao, Y.; Chen, S.; Ba, W.; He, Y. High-Precision Population Spatialization in Metropolises Based on Ensemble Learning: A Case Study of Beijing, China. Remote Sens. 2022, 14, 3654. [Google Scholar] [CrossRef]
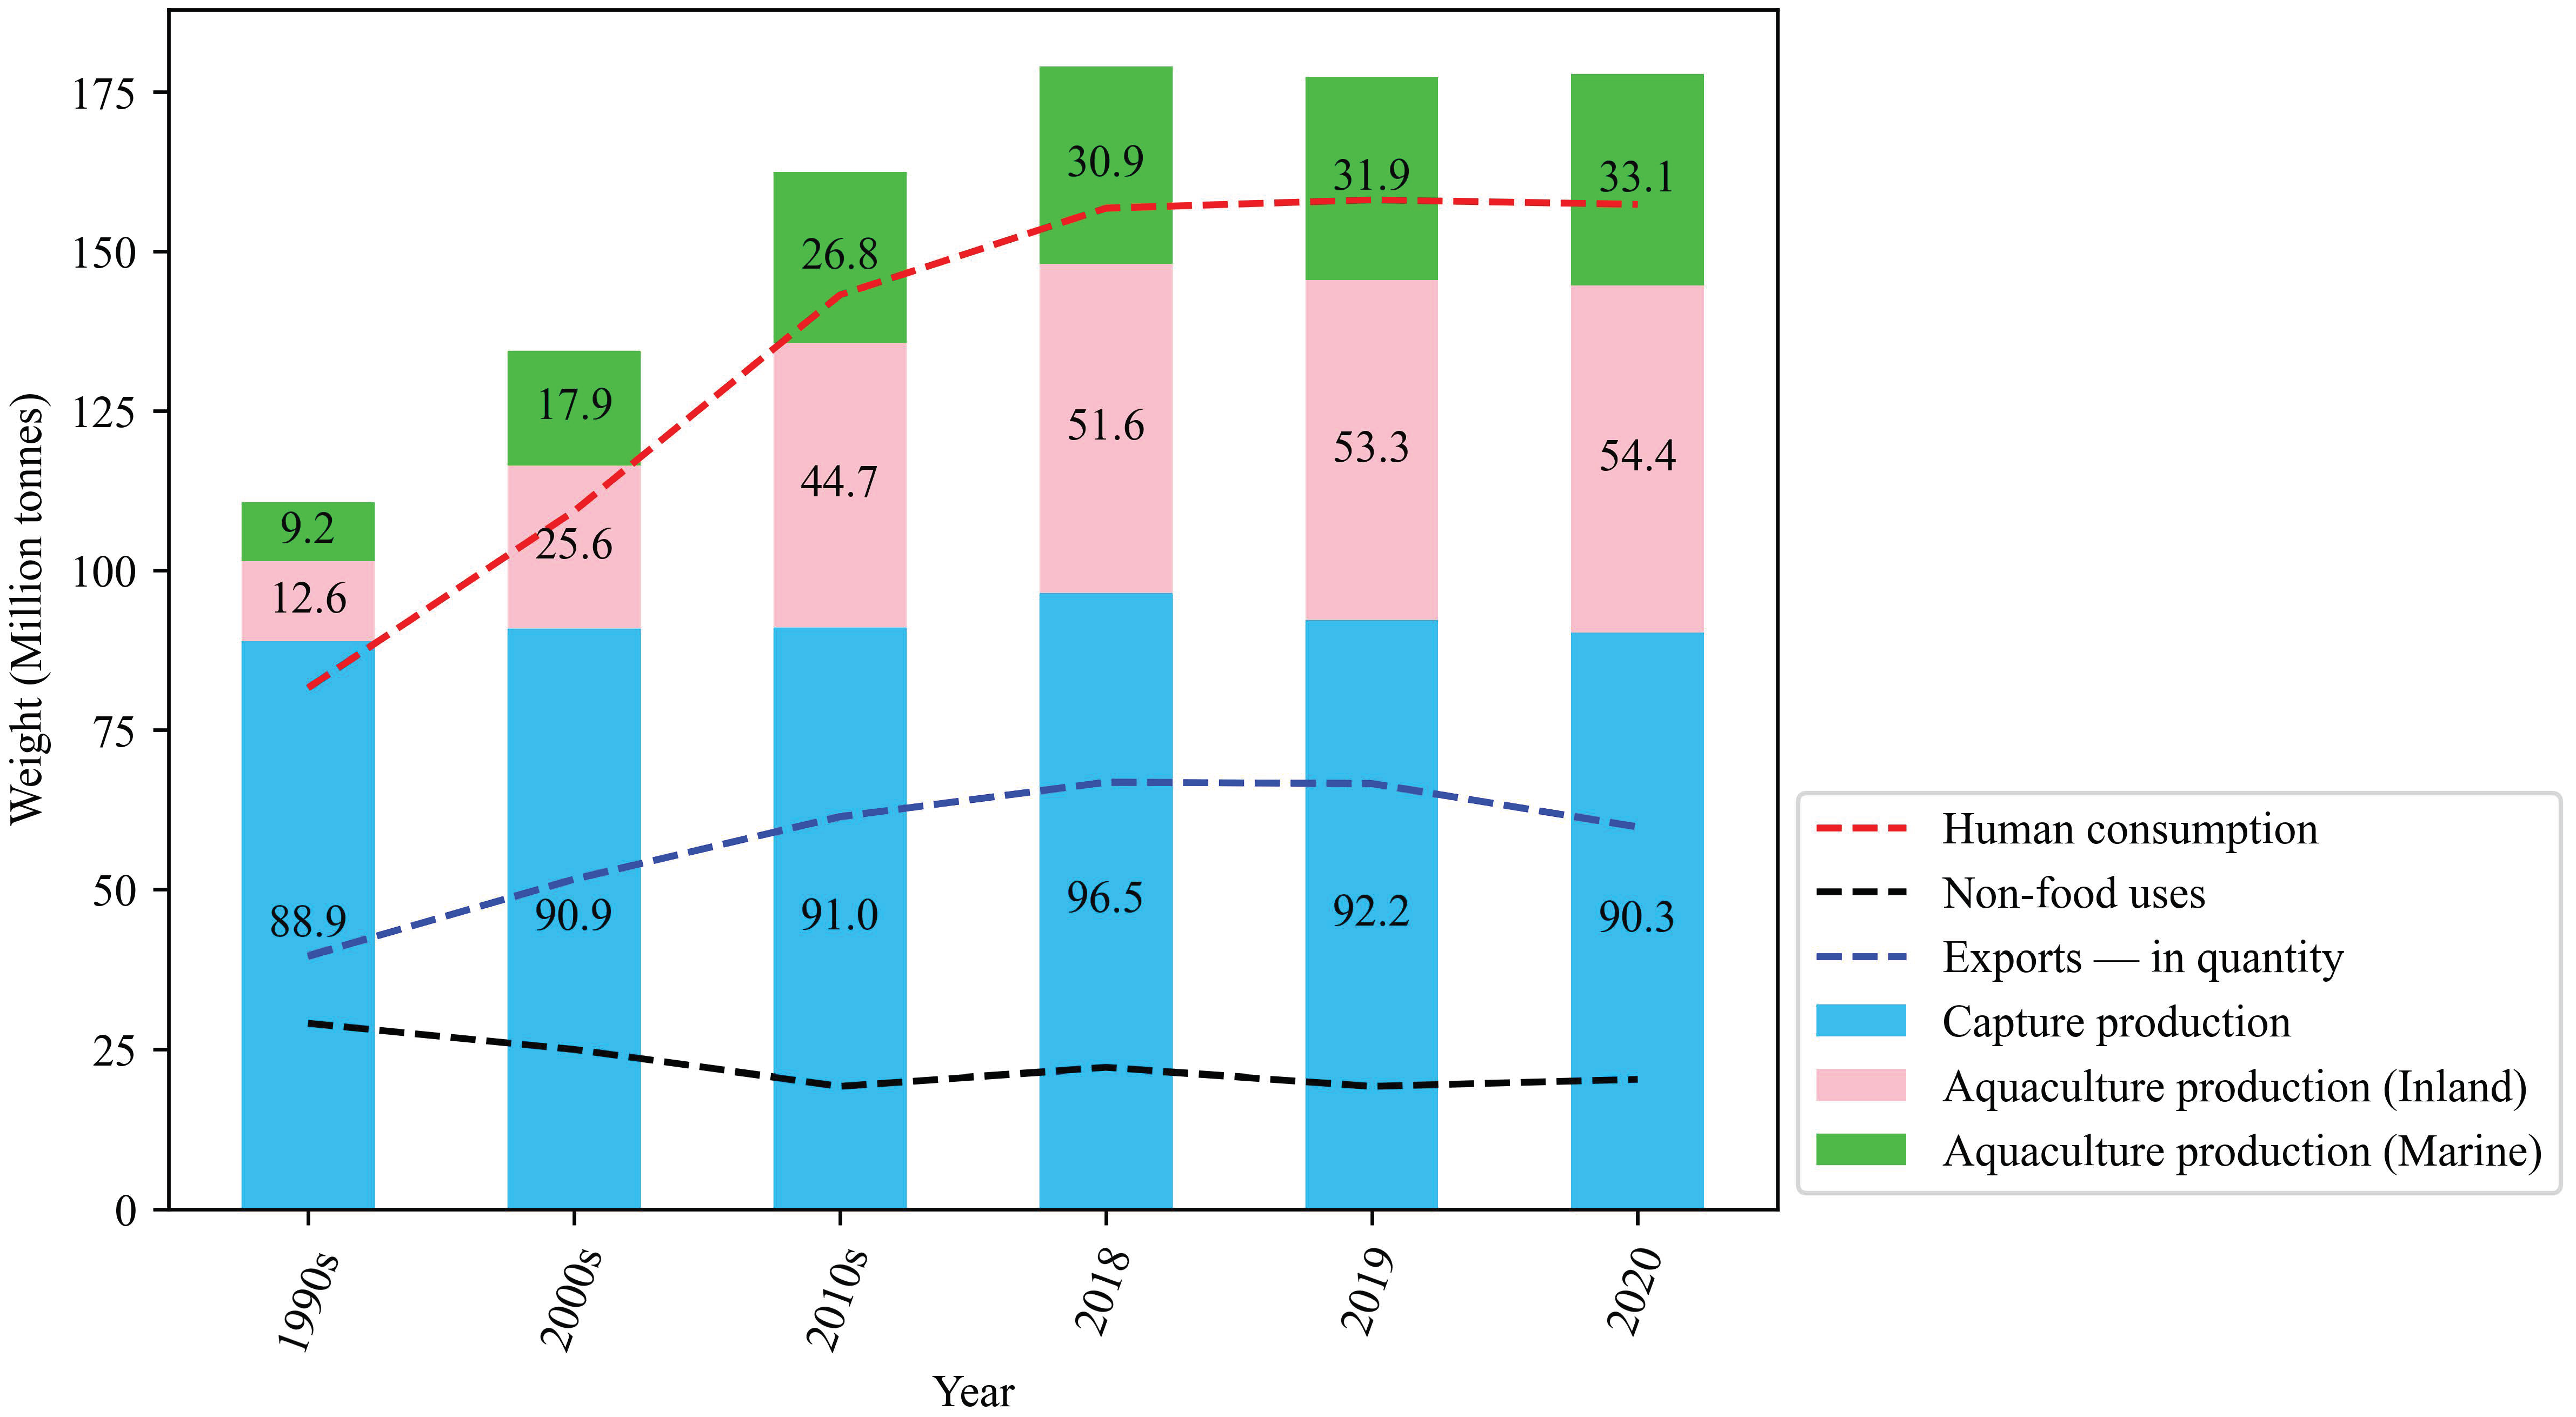
Figure 1. World aquaculture and fishery production and consumption. Data source: [14].
Remotesensing 15 00856 g001
Figure 2. Study region selected in this study: (a) location of the study region; (b) overview of the study region; (c) Sentinel-2 true-color RSI; (d) detailed image from 0.5 m Hr-RSI, where SOAPs can be explicitly seen; (e) detailed image from 10 m Sentinel-2 Mr-RSI, where SOAPs are hard to distinguish. All maps in this paper are projected using the Cylindrical Equal Area project (ESRI: 54034).
Remotesensing 15 00856 g002
Figure 3. Framework of the proposed method for SOAPs extraction.
Remotesensing 15 00856 g003
Figure 4. Flowchart of the iterative algorithm combining grayscale morphology and Canny edge detection (Note: Y = Yes; N = No).
Remotesensing 15 00856 g004
Figure 5. Example of the use of the proposed iterative algorithm to segment water pixels: (a) 0.5 m Hr-RSI: (b) 10 m Mr-RSI from Sentinel-2: (c) maximum NDWI image (MNI); (d) Canny edge image (CEI) generated from the MNI at the first iteration, where a few aquaculture ponds are segmented completely; (e) CEI at the second iteration, where most aquaculture ponds are segmented completely; (f) CEI at the third iteration, where all the aquaculture ponds are segmented completely.
Remotesensing 15 00856 g005
Figure 6. Introduction of the segmentation degree detection method: (a) examples of over-segmented objects (LSI > 2.5 and RPOC 1.5); (b) examples of appropriately segmented objects (LSI 2.5 and RPOC   1.5 ); (c) examples of under-segmented objects (LSI >   2.5 and RPOC >   1.5 ); (d) examples of under-segmented objects (LSI   2.5 and RPOC >   1.5 ); (e) an illustration of these segmentation degrees.
Remotesensing 15 00856 g006
Figure 7. Decision tree for extracting aquaculture ponds from potential SOAPs (Note: Y = Yes; N = No).
Remotesensing 15 00856 g007
Figure 8. Extraction result of SOAPs in the study region: (a) a comprehensive overview of the distribution of aquaculture ponds in the study region; (b) the similar shapes and sizes of SOAPs extracted in this study compared to the ground-truth data; (c) most extracted aquaculture ponds were separated from adjacent waters and extracted as SOAPs; (d) abandoned ponds excluded from the extraction result.
Remotesensing 15 00856 g008
Figure 9. (a) Number of SOAPs in different areal ranges extracted in the study region and (b) histogram of the numerical distribution of SOAPs ranging in size from 0 to 10,000 m 2 .
Remotesensing 15 00856 g009
Figure 10. Comparison between extracted SOAPs and labeled SOAPs: (a) location of the verification region; (b) distribution of omission and commission SOAPs; (c) example of commission SOAPs; (d) example of omission SOAPs.
Remotesensing 15 00856 g010
Figure 11. Image segmentation result comparisons among the proposed, K-Means, G-Means, and SNIC methods; the red contours represent the labeled SOAPs.
Remotesensing 15 00856 g011
Figure 12. Segmentation accuracies comparison between the proposed K-Means, G-Means, and SNIC methods in different SOAP size classes: (a) RMSEs of the four methods for SOAPs in different size ranges; (b) as in (a), but for the MAEs; (c) as in (a), but for the MAPEs; (d) as in (a), but for the MIoUs.
Remotesensing 15 00856 g012
Table 1. Specification of Sentinel-2 bands used in this study.
Band NameDescriptionSpatial Resolution (m)Wavelength (nm)
B2Blue10496.6 (S2A)/492.1 (S2B)
B3Green10560 (S2A)/559 (S2B)
B4Red10664.5 (S2A)/665 (S2B)
B8NIR 110835.1 (S2A)/833 (S2B)
B11SWIR 2 1201613.7 (S2A)/1610.4 (S2B)
B12SWIR 2202202.4 (S2A)/2185.7 (S2B)
QA60 3Cloud mask60——
1 Near infrared (NIR); 2 shortwave infrared (SWIR); 3 quality assessment (QA) band with 60 m resolution.
Table 2. Omission error evaluation from the comparison between labeled and extracted SOAPs. The statistics show the number of SOAPs (and their areas) that the proposed method did not extract for different SOAP size classes.
SOAP SizeNumberOmissionOmission (%)Omission % from Total Number Area   ( m 2 ) Omission   Area   ( m 2 ) Omission Area (%)Omission (%) from Total Area
All433153.463.461,737,425.02 33,919.10 1.951.95
≤2000 m 2 63711.111.6291,731.57 10,979.46 11.970.63
2000–4000   m 2 20283.961.85603,841.49 22,939.64 3.801.32
4000–6000   m 2 10000.000.00485,161.17 0.00 0.000.00
6000–8000   m 2 4700.000.00324,497.41 0.00 0.000.00
8000–10,000   m 2 1200.000.00102,317.70 0.00 0.000.00
>10,000   m 2 900.000.00129,875.68 0.00 0.000.00
Table 3. Commission error evaluation from the comparison between extracted and labeled SOAPs. The statistics show the number of SOAPs (and their areas) extracted from the proposed method while labeled as background, for different SOAP size classes.
SOAP SizeNumberCommissionCommission%Commission % from Total NumberArea (m2)Commission Area (m2)Commission Area (%)Commission (%) from Total Area
All5269417.8717.8717,57,058.66 231,476.63 13.1713.17
≤2000 m21715230.419.89236,285.85 64,936.18 27.483.70
2000–4000   m 2 2082612.504.94595,886.07 75,470.61 12.674.30
4000–6000   m 2 901213.332.28433,611.42 60,642.55 13.993.45
6000–8000   m 2 3725.410.38252,144.04 13,836.04 5.490.79
8000–10,000   m 2 8225.000.3868,465.23 16,591.25 24.230.94
>10,000   m 2 1200.000.00170,666.05 0.00 0.000.00
Table 4. Parameters setting for the proposed and comparative methods.
MethodParameters
Proposed methodCanny threshold = 0.2; LSI threshold = 2.5; RPOC threshold= 1.5; area threshold = 520,000; median NDWI threshold = 0.15; number threshold of near-neighbor objects = 3
K-MeansnumClusters = 6; numIterations = 20; neighborhoodSize = 0; forceConvergence = false; uniqueLabels = true
G-MeansnumIterations = 10; pValue = 582; neighborhoodSize = 0; uniqueLabels = true
SNICsize = 5; compactness = 1; connectivity = 4
Table 5. Overall segmentation accuracy comparison between the proposed, K-Means, G-Means, and SNIC methods.
Method RMSE   ( m 2 ) MAE   ( m 2 ) MAPE (%)MIoU
Proposed method3850.471286.0434.230.6965
K-Means3907.932355.5572.640.4326
G-Means3556.882533.8963.700.3697
SNIC2610.181803.9249.210.5040
Disclaimer/Publisher’s Note: The statements, opinions and data contained in all publications are solely those of the individual author(s) and contributor(s) and not of MDPI and/or the editor(s). MDPI and/or the editor(s) disclaim responsibility for any injury to people or property resulting from any ideas, methods, instructions or products referred to in the content.