Article

Rapid Compaction Monitoring and Quality Control of Embankment Dam Construction Based on UAV Photogrammetry Technology: A Case Study

1
College of Construction Engineering, Jilin University, Changchun 130026, China
2
China Water Northeastern Investigation, Design and Research Co., Ltd., Changchun 130026, China
3
North China Power Engineering Co., Ltd. of China Power Engineering Consulting Group, Changchun 130026, China
*
Author to whom correspondence should be addressed.
Remote Sens. 2023, 15(4), 1083; https://doi.org/10.3390/rs15041083
Submission received: 3 January 2023 / Revised: 4 February 2023 / Accepted: 13 February 2023 / Published: 16 February 2023

Abstract

:
The compaction quality of embankment dams directly affects the safe operation of power stations. The traditional monitoring method has the shortcomings of limited sample and time consumption. Compaction quality can be reflected by the compression ratio (CR) of the filling material. A novel method based on unmanned aerial vehicle (UAV) photogrammetry technology, which can rapidly acquire the CR of the entire filling area, is proposed in the present paper. Specifically, the CR nephogram is obtained by processing the terra information of the compaction body collected by the UAV. Validation of the CR results is performed by comparing them with the results obtained via leveling measurements. Mean absolute error between CR results and leveling measurements results is less than 1%, and the corresponding settlement value error is millimeter-level, reflecting a fairly good agreement. Furthermore, the reduced-scale experiment shows that the UAV-based CR method is more stable than manual measurements, and the efficiency is increased by more than five times, which meets the requirements of compaction quality monitoring and quality control. The CR nephogram obtained can reflect the compaction quality information rapidly, comprehensively, and accurately, thereby guiding the quality control of embankment dam construction.

Graphical Abstract

1. Introduction

Embankment dams have become one of the most widely used and the fastest developing dam types. Filling engineering is an essential process in the construction of embankment dams. Inadequate compaction has the potential to cause quality flaws [1,2,3]. For example, 5% air voids due to incomplete compaction can result in 30% strength loss, whereas 20% air voids can result in 80% strength loss [4]. The increase of the compaction quality can increase the interlock among the rockfill particles and change the state of particle rotation and contact force among particles, which are macroscopically characterized by the enhancement of strength and stiffness of the dam [5]. Therefore, the compaction quality of filling materials is critical to the engineering performance of dams.
The quality control of compaction engineering depends mainly on the monitoring of compaction parameters. However, accurate information on compaction quality cannot be adequately and rapidly acquired due to the lack of necessary techniques. Many studies have attempted to propose various methods to obtain compaction parameters [6,7,8,9,10,11] and establish continuous compaction quality control systems [12,13,14,15,16]. Liu et al. [17] proposed unit compaction energy (UCE) as a monitoring quality parameter and developed a monitoring system for dam compaction quality on the basis of UCE. Xu et al. [18] establish a compacting quality control system containing three indexes to determine the compacting quality control parameters of large-particle-size-filled stone embankment. Many different systems based on global navigation satellite system (GNSS) have been developed over the years [19,20,21,22,23,24]. Huang et al. [25] proposed a GNSS real-time monitoring system to collect the real width information of rolling track so that the calculation of rolling times is real-time and accurate. In particular, the monitoring system integrating GNSS technology with wireless data communication, intelligent monitoring terminal, Internet of Things, and computer graphics technology was developed to supervise the roller parameters (i.e., compaction trajectory, number of compaction times, driving speed, lift thickness, and smoothness) [26,27,28,29]. It has been successfully applied to the construction quality control of the Ludila, Longkaikou, and Fengman RCC dams in China. For the construction environment with poor satellite signal, Zhong et al. [30] proposes the PCT and the positioning method for compaction machines by GNSS and RTS combined operation. This technology greatly improves the stability and integrity of the rolling machine positioning. On the basis of acoustic wave methods and unmanned driving technology, Zhang et al. [11,31,32] proposed an integrated monitoring system to detect compaction quality continuously and monitor the compaction parameters comprehensively (i.e., the number of compaction times, driving speed, vibration frequency, lift thickness, and compaction trajectory) [29]. Soil compaction can be quantified by analyzing the stress wave received at the smart aggregate sensor; thus, soil compaction can be described by a set of indices [33]. In addition, Wang et al. [34,35] used the “modal analysis of Rayleigh wave” technology to assess the deep compaction of the dam foundation (i.e., Péribonka dam). Shi et al. [36] proposed an intelligent compaction system that is based on an unmanned roller fleet (URF), which uses a strip genetic algorithm (GA) to plan the optimal rolling path to maximize strip compaction efficiency. Field experiments show that the compacting quality and compacting efficiency are improved by 2.57% and 24.18%, respectively, compared with the monitoring-based manual compaction method.
The above systems have been widely used in engineering practice, but the approach is concentrated mostly in the construction of concrete dams and cannot be completely applied to the compaction quality control of embankment dams. Moreover, some disadvantages in the use of these monitoring and quality control systems include the complicacy of representing the compaction state directly, time and energy consumption, the ease of disturbance by human error, and construction quality problems caused by manual driving.
A rapid monitoring and quality control system based on the unmanned aerial vehicle (UAV) photogrammetry differential method for embankment dams is proposed in this paper to solve the shortcomings of the existing quality control methods in the field of embankment dam. Compression ratio (CR) is used as the key monitoring parameter to characterize compaction quality directly. The feedback control of compaction quality is achieved by identifying the unqualified area and guiding rework through a visual CR nephogram obtained rapidly. A reduced scale case study is carried out to verify the feasibility of this system.

2. Methods

In this paper, a compaction quality monitoring and control system that is based on UAV photogrammetry technology is established. The procedural steps of the system in this paper are depicted in Figure 1.
The system adopts feedback control theory to accurately monitor the compaction quality. Firstly, UAV photogrammetry technology is applied to collect the digital elevation model (DEM) data (Step a). Then, the multi-stage DEM is calculated and processed to obtain CR information, which is used as a characterization parameter of compaction quality (Step b). Finally, the quality control criterion is deduced to evaluate CR information and realize the quality feedback control (Step c).

2.1. Multi-Stage DEM Collection

High quality DEM has been successfully applied in the field of surveying and mapping as well as geological disaster investigation, which greatly improves the precision of survey [37,38]. The accuracy of DEM affects the feasibility of this study. The collection of DEM consists of three parts: ground control point (GCP) survey, UAV images collection, and DEM generation. UAV images with 3D coordinates are directly applied to DEM generation. GCPs with higher accuracy correct the error of DEM generation process and provide a unified spatial reference for DEMs.
In this paper, static measurement mode of SINO M6 II RTK was adopted for GCP measurement. GCPs were selected and measured at aerial survey sites, which can provide a unified geographic reference at the millimeter level. To obtain high-precision DEM, suitable UAV equipment is crucial. A quadcopter DJI M300 RTK equipped with Zenmuse P1 payload was used to carry out photogrammetric survey. DJI M300 RTK can provide high-level positioning information to the images. The Zenmuse P1 camera produces 45-megapixel format (8192 × 5460) images. The sensor size of the camera is 35.9 × 24 mm, and the smallest size of the pixel is 4.4 μm.
The quality of the DEM affects the accuracy of the CR. A bootstrapping resampling technique was implemented within DJI Terra to evaluate and quantify the quality of the obtained DEM. Concretely, this technique randomly selected 1/3 of the GCPs as check points (CPs) to provide an independent measure of uncertainty of each point. After thousands of repetitions, during which the optimization was reset, for each point used as CP, the difference between the actual coordinates in this point and the modeled values (i.e., residuals) were obtained. The residuals could be calculated using the 3D root mean error (RMSE3D) on CPs, reflecting the accuracy of DEM reconstruction. The CP method is widely used to assess the design elevation accurately because of its simple operation and reliable outcomes [39,40].

2.2. Compaction Quality Information

Compaction quality is related to the vertical deformation of the material under lateral constraints. Accordingly, CR can be used to characterize compaction quality. The filling thickness and vertical deformation of filling materials are two important parameters in compaction. UAV was used to collect images of filling materials under different compaction states, and then terrain information was obtained through 3D modeling. Finally, the terrain information of the different compaction states was compared with extract important parameters (filling thickness and vertical deformation).
After obtaining the filling thickness and vertical deformation on the basis of terrain comparison, compaction quality information (CR) can be calculated, as shown in Equation (1):
C R = Δ H 2 Δ H 1 × 100 %
where Δ H 1 is the filling thickness of the material, and Δ H 2 is the vertical deformation caused by compaction.

2.3. Compaction Quality Control

CR can be used to describe the compaction state at any point. For a material in certain engineering, a specific CR value (CRk) satisfies the compaction quality standard required for a material in certain engineering applications. Therefore, CRk can be used as the criterion to control compaction quality. The model of material was drawn according to the compaction site (Figure 2a) to assist in explaining the quality control criteria (Figure 2b).
In all equal conditions, CR depends on the state of particle arrangement, which is generally described by density or relative density. Therefore, the relationship between common compaction parameters (density or relative density) and CR is analyzed in this paper, and CRk is used as the standard of compaction quality.
The relationship between density and relative density is shown in Equation (2):
ρ d k = ρ d   m a x × ρ d   m i n ρ d   m a x D r × ρ d   m a x ρ d   m i n
where ρ d k is the required dry density value of dam material, ρ d   m a x is the maximum dry density of the material obtained from the compaction test, ρ d   m i n is the dry density of the dam material in loose state, and D r is the required relative density of the dam material.
CR can be calculated according to the relationship of uncompacted dry density and compacted dry density, as shown in Figure 2. The relationship between density and CR can be expressed in Equation (3):
ρ d 1 ρ d 2 = M d A × Δ H 1 / M d A × Δ H 1 Δ H 2 = 1 Δ H 2 Δ H 1 C R
where ρ d 1 and ρ d 2 indicate the uncompacted dry density and compacted dry density, respectively, M d is the dry weight of the dam material in the rolling area, A is the area of the rolling area, and Δ H is the vertical deformation.
On the basis of the two equations, the CR value satisfying the compaction quality requirements can be obtained in Equation (4), putting ρ d k into ρ d 2 to obtain the CRk, which just meets the quality requirements (Figure 2c,d).
C R k = 1 ρ d 1 ρ d k = 1 ρ d 1 × ρ d   m a x D r × ρ d   m a x ρ d   m i n ρ d   m a x × ρ d   m i n
When filling thickness ( Δ H 1 ) and vertical deformation ( Δ H 2 ) are known, the CR at any location can be obtained. Then, compaction quality can be evaluated by CRk to determine whether the area satisfies the engineering design requirements. The coordinates and CR value of the unqualified (CR lower than CRk) area are identified and reported. According to the unqualified information, the scope and times of rework can be accurately guided. The overall assessment of compaction quality can be estimated using Equation (5):
μ = S D S A × 100 %
where μ is the qualification rate, and SD is the area, where CR is greater than CRk. SA is the total area of the surface. A larger   μ indicates better compaction quality.
The unqualified information was fed back to the construction department to guide the rework accurately. The above process can then be repeated for quality monitoring again.

3. Case Study

3.1. Study Area and Materials

The research was carried out on the basis of the rolling tests for the convenience of obtaining deformation information of compaction materials. The rolling test site lies downstream of the proposed dam (Figure 3a), which is located at the pumped storage power station project in Zhirui, Inner Mongolia Autonomous Region. The dam structure is rockfill dam with asphalt concrete core wall. The elevation of the dam crest is 1133 m, with the crest width and length of 10 m and 530 m, respectively. The biggest height of the dam is 27 m. The dam is composed mainly of ripped-rock revetment, hard core, inverted filter, riprap stone revetment, Transition I and II zones, asphalt concrete core wall, and upstream and downstream rockfill zones (Figure 3b). Both widths of Transition I and II zones are 1.5 m, and the widths of other structures can be found in Figure 3b. Boundaries of the testing site and each testing stripe were delineated by white pigment (Figure 3c).
The test site should be leveled prior to the test. A 33T rolling machine was used to level the site until the average settlement of the site was no more than 2 mm after every two rolls. The height difference of the entire site needs to be less than 20 cm, and the local height difference needs to be less than 5 cm to reach the field flatness standard.
Different types of filling materials were used in different regions of the dam. This paper focused on the rockfill material and transition material. The rockfill materials used were natural pebble mixture soil obtained from the upstream and downstream rivers. The transitional materials used were excavated cobble mixed soil processed by the screening system. The design indicators of the two materials are shown in Table 1.

3.2. Test Procedure

Four mesoscale physical models of the filling body were constructed using the two materials to simulate the deformation of the dam under compression. The filling materials were filled on the four strip test areas (A, B, C, and D); the same materials (A, B, C, and D) were filled with relatively uniform and consistent moisture content and gradation. Zones A and B had a length of 18 m and a width of 6 m, and C and D had a length of 15 m and a width of 4.5 m. Multiple sets of rolling tests were carried out on filling materials, and the experimental scheme is shown in Table 2.
The UAV data of the test area were collected before and after each set of rolling tests. The total station and density tests were carried out on the physical model, and the results were used for the comparison of the proposed method. Levelling survey was used as the evaluation standard for total station method and UAV method.

3.3. High-Precision Data Acquisition

3.3.1. UAV Photogrammetric Survey

UAV survey enables monitoring the CR of compaction materials rapidly in a non-contact manner. A DJI M300RTK UAV equipped with ZENMUSE P1 payload was used in this paper.
Multi-stage UAV survey was carried out to obtain the terra information of the filling body in different stages of rolling test. When receiving GPS satellite signals, the RTK module of UAV receives data transmitted by the network base station through wireless receiving equipment and then calculates the 3D coordinates of UAV in real time according to the principle of relative positioning. The 3D coordinate information is written into the UAV image in real time.
Initially, the assessment of the working environment and the assembly, preheating, and calibration of the UAV were carried out on site. Then, the flight area and flight parameters were set by the DJI Pilot software installed on the Smart Controller Enterprise. The DJI Pilot generated the flight plane and planned the flight path according to the setting and automatically collected images on the test site. According to the testing program, eight flights were performed on the test field. Each flight yielded approximately 584 photographs and lasted approximately 25 min. All photographs were 12 m above the ground, with a resolution of 1.5 mm per pixel. To ensure sufficient image overlap, flight planning accounted for an overlap in flight direction of 70% and an overlap of flight strips of 60% (Figure 4a).

3.3.2. Establishment of High-Precision Spatial Reference

The accurate CR information depends on high-precision DEM. In this paper, a reliable spatial reference of DEM is established by real-time kinematic GPS (RTK) static measurement GCPs. GCPs should be evenly distributed and easily observed in the survey area, which can consist of point features whose locations are independently measured or known.
Eight printed markers GCPs (Figure 4a) were measured by static measurement mode of SINO M6 II RTK (Figure 4b), and the position correction was provided by the virtual base station service. The service used permanent GPS stations to produce locations with absolute accuracy of 2.5–5 mm.

3.4. Three-Dimensional DEM Modeling and Precision Evaluation

The image data should be reconstructed into a 3D DEM model to compare the elevation changes during compaction. The generation of 3D DEM was performed using the Structure from Motion (SfM) photogrammetry technique based on UAV photogrammetry survey. The accuracy of DEMs can be assessed by the bootstrapping resampling techniques.

3.4.1. Three-Dimensional DEM Reconstruction

The DEM reconstruction was processed using DJI Terra, a commercial SfM software installed on a workstation. The software has short computation time and high reliability. GCPs and RTK module integrated with UAV adopted in this process guaranteed high precision of DEM, thereby ensuring that the positioning information obtained from DEM was meaningful and reliable. With uniform geographic reference, multiperiod DEM data can be compared effectively. The advanced reconstruction algorithm is the key to ensuring the accuracy of DEM.
Workstations equipped with high performance graphics card can greatly improve the speed of 3D DEM reconstruction. The Dell Precision 3640 workstation used in this paper is configured with Intel Core i7, RTX3060 independent graphics card (12 GB video memory), 128 GB hard disk, and 64 GB of memory, which guarantee the rapid acquisition of subsequent compaction quality information.
The reconstruction includes the following: First, the collected images are arranged in order, and 20 images are grouped into a cluster. The feature points of each cluster are extracted and described. Second, feature matching is carried out to obtain the corresponding relationship between adjacent images. The pose and position information of the camera in 3D space are preliminarily obtained. Third, the camera attitude parameters are optimized by bundle adjustment to obtain the sparse point cloud of each image cluster. In this process, GCPs are introduced to provide a unified geographic reference and reduce non-linear distortions for point cloud. Then, by restoring the depth map of each image, on the basis of the method of depth map fusion, these depth maps are fused to obtain the dense point clouds of each image cluster. Subsequently, the dense point cloud of each image cluster is fused to obtain the 3D information of the whole scene. Finally, the dense point cloud is encapsulated by a grid reconstruction algorithm to generate a grid model, which is DEM.
Ten DEMs were obtained through data collection and reconstruction. The pixel size of DEM was 0.15 mm, and the real measuring area represented by a single DEM was 4970 m2.

3.4.2. Precision Evaluation of DEM

The RMSE3D results of the CP method indicated that the quality of UAV photogrammetry was sufficient to investigate the compaction deformation of the test area through difference of DEM (DoD) technical. Ten DEMs with different experiment time were obtained by SfM, whose RMSE3D value was lower than 0.5 mm, especially those in the Z direction (elevation direction) at less than 0.05 mm (Table 3). The generation of a single DEM took approximately 45 min. Reliable DEM was used to generate visual monitoring information.

4. Results

4.1. CR Nephogram and Compaction Quality Control

In accordance with the calculation method of CR parameter in Section 2.2, DEM with different compaction states was processed to obtain the CR nephogram. With the support of computer graphics technology, the CR at any location of embankment dam can be estimated.
The DoD technique uses grid calculator tools provided by ArcGIS to calculate DEM [39,40,41,42,43,44]. This technique divides the entire filling body into m × n grids. Assuming that the surface elevation at the (i, j) grid prior to rolling is Dt (i, j) and that after rolling is Dl (i, j), the elevation difference between the two is then obtained as follows:
D l i , j D t i , j
Calculate two important parameters by the DoD technique:
D E M 1 D E M 0 = Δ H 1
D E M 1 D E M 2 = Δ H 2
where D E M 0 is the DEM of the initial ground prior to filling, D E M 1 is the uncompacted DEM, and D E M 2 is the compacted DEM.
To obtain the CR nephogram, the DoD results were processed by the division method in ArcGIS in Equation (9):
C R = Δ H 2 Δ H 1 × 100 % = D E M 2 D E M 3 D E M 1 D E M 2 × 100 %
In accordance with the calculation method in Section 2.2 and this section, the above DEM model was processed by computer graphic technology to obtain visual compaction information. In Figure 5, two important parameters were calculated by DoD technology, as shown in Equations (7) and (8), and then the CR nephogram was generated by grid operation according to Equation (9).
After DoD processing, six phase CR nephograms were obtained. The data should be rendered to obtain a more intuitive compaction model that reflects CR information. According to the CR value, the nephogram was rendered in color, from red to blue, representing the CR value from high to low. In Figure 6, the rendered data are beautiful and can intuitively display the compaction state. The compaction quality of any point in the test area can be quantitatively analyzed by visual digital CR nephogram. The CRk calculated in Section 2.3 is the critical value to determine whether the compaction quality satisfies the requirements (Table 4), and the CRk is used as the boundary value of nephograms’ color matching. The CRk in Table 4 is the critical value to determine whether the compaction quality satisfies the requirements. According to the compaction quality criterion described in Section 2.3, a CR value greater than CRk indicates that the compaction quality meets the engineering requirements. The present study used the warmest color matching to represent the qualified CR in Figure 6, which is the nephogram of CR in the area. In addition, the warmer the colors are, the greater the CR values are.
The CR nephogram obtained by ArcGIS showed remarkable variations in relation to rolling times over the experiment period. Nephograms (a) and (b) or (c) and (d) were compared, and the CR of the dam materials increased with increasing compaction times. After two additional compacts, most of the uncompacted (CR lower than 8.52%) areas in nephograms (a) and (c) were compacted. Under certain compaction times, the CR for the 0.8 m dam material was greater than that of the 1.0 m dam material. The qualified ratio of 0.8 m and 1.0 m rockfill material (CR greater than 8.52%) are 42.56% and 20.98%, respectively. The qualified ratio of 0.6 m and 1.0 m transition material (CR greater than 9.78%) are 45.53% and 38.29%, respectively. The thickness of the filling material has obvious influence on the compaction effect. Under the same conditions (soil quality, water content, and compaction energy remain unchanged), the thicker soil layer needs more rolling times to meet the engineering requirements. The compaction quality of the filling body was influenced by filling thickness and rolling times, and the visual analysis of the compaction quality was successfully realized by CR nephogram, which can help to determine the optimal filling construction parameters.
From the nephograms of CR for the dam material, the overall compaction performance covering 100% of the test area can be clearly determined for quality assessment. For the test areas A to D, CRk was calculated using Equation (5). The CRk and qualified ratio of the test area are shown in Table 4. The quality of compaction can be quantified according to the nephogram and qualified ratio information. According to the quantitative results, the weak areas of compaction quality were screened out to provide targets for rework. After feedback control, the compaction uniformity of the whole working area was improved.

4.2. Verification of UAV-Based CR Method

The accuracy and efficiency of the UAV-based CR parameter were verified by traditional methods in this section. As a control experiment, traditional compaction quality tests, including deformation monitoring and in situ density testing, were carried out after each photogrammetry survey.
A number of elevation checkpoints (ECPs) were designated within each test strip in a white grid pattern at a distance of 1.5 m (Figure 7a). Moreover, the RTK measurement system was used to ensure the position of ECP. In practice, the deformation of filling material is measured by the total station instrument to evaluate the degree of compaction. The CR of ECPs, as shown in Figure 7a, was measured by UAV and total station to verify the accuracy of the CR on the basis of UAV photogrammetry technology, as shown in Figure 7b. Level survey (Figure 7c) was used as the test standard of UAV and traditional measurement. The CR obtained by the UAV survey and CR’ obtained by the traditional full-station measure was used for comparison and analysis with the CRL measured by level survey. The dynamic mode of RTK was used to measure the horizontal position of ECP to ensure that the sampling position of UAV was consistent with that of the total station.
The maximum accuracy of the TOPCON GM-102 total station combined with the prism used in this study was 1.5 mm. CRL obtained by Trimble DiNi 03 electronic level with accuracy of 0.3 mm was used as the standard value of the control experiment. The theoretical plane accuracy of SINO M6 II RTK dynamic mode was 8 mm.
In Figure 8, CR and CR’ in all regions fit well, indicating that the two methods can achieve approximate results. When the compaction times in the same zone increases, as shown in Figure 9a–d, the CR or CR’ curves show an overall upward trend, which is consistent with practical experience. Further analysis according to CRL found that the error of CR and CR’ varies in different test zones, but they remain relatively low. The mean absolute errors (MAE) are mostly below 1%, and the corresponding settlement errors are millimeters (Table 5).
Table 5 shows that for different regions, the error fluctuation of CR is small, and the error fluctuation of CR’ is large. In addition, the CR’ error in Zone A 10 times reaches a maximum value of 1.32%. This tendency may be caused by operational errors in traditional instrument measurement. Compared with manual measurement, UAV will undoubtedly be subject to less environmental disturbance. The overall error of Zone B is lower than that of Zone A, which may be due to the larger filling thickness of Zone B. With the same settlement error, the CR error in Zone A is larger, indicating that the error of CR value may be affected by the filling thickness.
Error analysis for all ECPs (Table 6) shows that the MAEs of CR and CR’ are close to 0.715% and 0.712%, respectively. The standard deviations (SD) of CR and CR’ errors are 0.59 and 0.68, respectively. Thus, the error dispersion degree of CR is lower, and its accuracy is relatively more stable.
These findings show that the accuracy of the UAV-based CR method can satisfy the requirements of filling quality monitoring. This section evaluates the efficiency of this method through a controlled experiment. According to Section 4, the calculation time and complexity of CR method are related to the number and spatial resolution of images. The method is based on image processing, and the computing unit is pixel. More images indicate higher resolution and longer processing time. According to the quality report provided by DJI Terra, the calculation time of DEM can be accurately obtained. In addition, the DoD processing time consumption is counted. Accordingly, the time consumed for density testing (Figure 9) and settlement monitoring will be recorded. Statistical results show that the total station survey of all zones consumed approximately 1 h, and the parallel density test was completed after approximately 6 h. UAV photography requires approximately 1.1 h to collect data of four test zones and generate a CR nephogram. The new method is far more efficient than the traditional one. In addition, traditional methods require four to five workers for one test zone, and inappropriate backfilling of test pits can result in defects. The UAV-based CR method requires only one person to complete and does not damage the dam-filling body.

5. Discussion

This paper is the first to evaluate compaction quality monitoring on the basis of UAV photogrammetry using CR as a reference. The results indicate that the compaction quality detection based on the UAV photogrammetry method in this reduced-scale case study is feasible. However, the large-scale application of this method in dam construction is affected by many factors.
The success of this method is based on high-precision data. The accuracy of DEM is substantially higher than those obtained by Nicoletta Nappo [41] and Isola Ismaila Ajibola [45], in which SfM provided centimeter-level accuracy for the DEMs at the plot scale. The probable reason for this difference was the coarser DEM resolutions used in the two previous studies, namely 2 and 1 cm, contrary to the higher resolution of 1.5 mm in this paper. Data quality is affected by many factors. The RTK module of UAV has good positioning performance, but GCP is still required to provide a unified geographical reference for data of each period. Existing studies have found that the reliability of GCP is constrained by factors such as recognition, location, and distribution characteristics. Regions with bright colors and rich textures have evident local features, which can effectively avoid the identification error of GCP. Therefore, printed signs with red and white colors are used as GCP in this paper. In addition, GCPs are uniformly arranged around the test area with a certain height difference, forming a 3D geographic reference coordinate system, which can improve the accuracy of the geographic reference system. However, for the dam-filling construction site with a scale of several hundred meters, increasing the quantity of GCP blindly is wasteful and ineffective. Combined with existing studies, the GCP layout plan with uniform distribution around the survey area and a small amount in the center of the survey area is speculated to become the best GCP layout plan.
The light conditions during UAV survey can also affect the data quality. Extremely strong or dark light can lead to poor image contrast, so effective geometry information cannot be extracted. The UAV survey was conducted from 10:00 to 16:00 during a clear day to ensure the reliability of the DEM data. The time limit is harsh for the monitoring of dam compaction quality, so the post optimization processing of UAV images is of great importance. Traditional aviation remote sensing uniform light and color algorithm is used mainly for remote sensing images [46,47]; it is not fully applicable to UAV images. In recent years, scholars have proposed various uniform light and color algorithms for UAV images. Wang [48] extracted the low light area and brightness compensation coefficient through Gaussian filter and achieved brightness compensation for the low brightness area. Li et al. [49] proposed an algorithm for uniform color and light processing of UAV images by using 2D radiation space attributes. Zhang et al. [50] constructed the brightness error function and transformed the uniform color problem into L-M to solve the optimal uniform color algorithm. The application of these algorithms helps reduce the dependence of UAV surveys on climate conditions. Therefore, the quality monitoring of continuous dam compaction can be satisfied.
In addition to these factors, the coordinate accuracy of DEM may be affected by flight parameters. Selecting appropriate flight height, flight speed, overlap rate, and other parameters is necessary according to conditions such as the shape of the filling body and material properties. Moreover, efficiency can be improved by combining multiple unmanned aerial vehicles to achieve full coverage of the monitoring area.
The excellent spatial geometry information acquisition ability of UAV is used to monitor the compaction state of soil and rock. This method provides a new idea for deformation monitoring of other materials, such as deformation monitoring of dam body during operation and deformation trend monitoring of geological hazard body. The further study will continue to explore real-time data transmission, automatic image processing, and intelligent defect target identification. The progress in these aspects will promote the automation and intellectualization of the technique system. Compaction engineering also plays an important role in the construction of RCC dams, highways, railways, airports, aqueducts, etc. The novel method proposed in this paper may be used for quality monitoring of the above projects. More application and extension of this method will be carried out in the future. In addition, higher-resolution images help analyze information for material surfaces.

6. Conclusions

In this paper, UAV photogrammetry technology is proposed as a new means to realize the rapid monitoring of compaction quality. The feasibility of this method in monitoring compaction quality of embankment dam materials is verified by reduced scale field tests. A compaction quality control scheme is proposed on the basis of these techniques. The main conclusions are as follows:
(1)
UAV photogrammetry technology can be used to monitor the quality of compaction. The verification results show that the mean absolute errors (MAE) of CR are close to 0.715% (compared with leveling survey), the corresponding settlement errors are millimeters, and the standard deviations (SD) of CR errors are 0.59 (compared with leveling survey). The accuracy of the new method is close to that of the manual method, and the dispersion degree is low, indicating that the proposed method is reasonable.
(2)
This method can monitor compaction quality visually and quickly without time-consuming, labor-intensive manual measurement. The verification results show that the efficiency of the new method can reach five times that of the traditional method as long as appropriate equipment is selected. Therefore, this method improves the efficiency of filling quality monitoring.
(3)
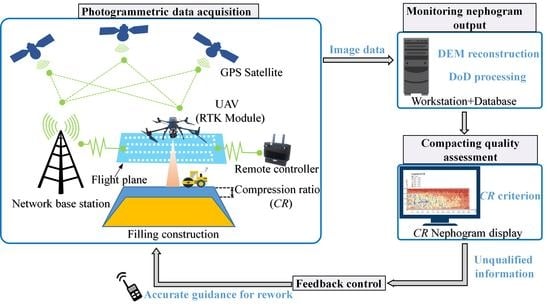
A quality control system combining UAV photogrammetry technology with computer graphic technology is proposed. The traditional rolling machine equipped with GNSS RTK can monitor only the elevation variation along the track line. While the proposed system can achieve full coverage and continuous evaluation of compaction quality. The visual compaction information is helpful to improve the compaction quality of embankment dam construction.
(4)
The successful application of this method has made a positive, beneficial exploration for the dam construction from automation to intelligence and low carbon. However, the CR criterion proposed in the present study may be not applicable to different materials, compaction quality standards, and construction environments. Therefore, extensive field experiments should be conducted to collect adequate data for evaluating the performance of the CR method in different projects.

Author Contributions

Conceptualization, H.Y. and W.Z.; methodology, H.Y. and C.C.; software, C.T.; validation, C.C., X.X. and J.W.; investigation, H.Y. and C.C.; resources, C.T.; data curation, J.C.; writing—original draft preparation, H.Y.; writing—review and editing, W.Z. and J.W.; visualization, J.C.; funding acquisition, W.Z. All authors have read and agreed to the published version of the manuscript.

Funding

This research was funded by the National Natural Science Foundation of China (grant nos. 42022053, 41877220, and 41941017). The recipient of the above funds is all Zhang Wen.

Data Availability Statement

The data presented in this study are available on request from the corresponding author.

Conflicts of Interest

The authors declare no conflict of interest.

References

  1. Vaughan, P.R.; Kluth, D.J.; Leonard, M.W.; Pradoura, H.H.M. Cracking and erosion of the rolled clay core of Balderhead Dam and the remedial works adopted for its repair. In Selected Papers on Geotechnical Engineering; Thomas Telford Publishing: London, UK, 2009. [Google Scholar]
  2. Uddin, N. Lessons Learned: Failure of a Hydroelectric Power Project Dam. J. Perform. Constr. Facil. 2005, 19, 69–77. [Google Scholar] [CrossRef]
  3. Chen, H.; Liu, D.; Qi, L. Spatial Estimation of Material Parameters and Refined Finite-Element Analysis of Rockfill Dam Based on Construction Digitization. Int. J. Géoméch. 2018, 18, 04018119. [Google Scholar] [CrossRef]
  4. U.S. Army Corps of Engineers (USACE). Engineering and Design of Roller-Compacted Concrete; Engineer Manual (EM) 1110-2-2006; U.S. Army Corps of Engineers (USACE): Washington, DC, USA, 2000. [Google Scholar]
  5. Liu, D.H.; Yang, J.Q.; Dong, B. Discrete element analysis of the influence of compaction quality on mechanical properties of rockfill materials. Comput. Geotech. 2022, 151, 104958. [Google Scholar] [CrossRef]
  6. Meehan, C.L.; Khosravi, M.; Cacciola, D. Monitoring Field Lift Thickness Using Compaction Equipment Instrumented with Global Positioning System (GPS) Technology. Geotech. Test. J. 2013, 36, 755–767. [Google Scholar] [CrossRef] [Green Version]
  7. Cacciola, D.V.; Khosravi, M.; Meehan, C.L. Using Compaction Equipment Instrumented with Global Positioning System (GPS) Technology to Monitor Field Lift Thickness. Geo-Congr. Tech. Pap. 2014, 2630–2639. [Google Scholar] [CrossRef]
  8. Kumar, S.A.; Aldouri, R.; Nazarian, S.; Si, J. Accelerated assessment of quality of compacted geomaterials with intelligent compaction technology. Constr. Build. Mater. 2016, 113, 824–834. [Google Scholar] [CrossRef]
  9. Zhong, D.; Liu, D.; Cui, B. Real-time compaction quality monitoring of high core rockfill dam. Sci. China Technol. Sci. 2011, 54, 1906–1913. [Google Scholar] [CrossRef]
  10. Zhang, Q.L.; An, Z.Z.; Huangfu, Z.H.; Li, Q.B. A Review on Roller Compaction Quality Control and Assurance Methods for Earthwork in Five Application Scenarios. Materials 2022, 15, 2610. [Google Scholar] [CrossRef]
  11. Zhang, Q.; Liu, T.; Zhang, Z.; Huangfu, Z.; Li, Q.; An, Z. Unmanned rolling compaction system for rockfill materials. Autom. Constr. 2019, 100, 103–117. [Google Scholar] [CrossRef]
  12. Chen, C.; Hu, Y.; Jia, F.; Wang, X. Intelligent compaction quality evaluation based on multi-domain analysis and artificial neural network. Constr. Build. Mater. 2022, 341, 127583. [Google Scholar] [CrossRef]
  13. Liu, D.; Lin, M.; Li, S. Real-Time Quality Monitoring and Control of Highway Compaction. Autom. Constr. 2016, 62, 114–123. [Google Scholar] [CrossRef]
  14. Wang, N.; Ma, T.; Chen, F.; Ma, Y. Compaction quality assessment of cement stabilized gravel using intelligent compaction technology—A case study. Constr. Build. Mater. 2022, 345, 128100. [Google Scholar] [CrossRef]
  15. Dawei, Z.; Lizhuang, Q.; Demin, Z.; Baohui, Z.; Lianglin, G. Unmanned Aerial Vehicle (UAV) Photogrammetry Technology for Dynamic Mining Subsidence Monitoring and Parameter Inversion: A Case Study in China. IEEE Access 2020, 8, 16372–16386. [Google Scholar] [CrossRef]
  16. Krishnamurthy, B.K.; Tserng, H.-P.; Schmitt, R.L.; Russell, J.S.; Bahia, H.U.; Hanna, A.S. AutoPave: Towards an automated paving system for asphalt pavement compaction operations. Autom. Constr. 1998, 8, 165–180. [Google Scholar] [CrossRef]
  17. Liu, D.; Li, Z.; Liu, J. Experimental study on real-time control of roller compacted concrete dam compaction quality using unit compaction energy indices. Constr. Build. Mater. 2015, 96, 567–575. [Google Scholar] [CrossRef]
  18. Xu, P.; Zhu, X.; Qiao, S.; Wang, G.; Yu, P. Field Study of Compaction Quality Control Parameters and Compaction Mechanism of Large Particle Size Stone-filled Embankment. Rock Mech. Rock Eng. 2022, 55, 3687–3702. [Google Scholar] [CrossRef]
  19. Weng, C.C.; Wu, H.; Liu, X.D.; Du, Z.Y.; Shi, L.; Feng, Y.Q.; Yang, J.; Yuan, L.Y. A Novel Integration of GNSS and GIS Approach to Foundation Roller Compaction in Civil Engineering. Adv. Mater. Res. 2012, 468–471, 186–189. [Google Scholar] [CrossRef]
  20. Pampagnin, L.H.; Peyret, F.; Garcia, G. Architecture of a GPS-based guiding system for road compaction. In Proceedings of the 1988 IEEE International Conference on Robotics & Automation, Leuven, Belgium, 20 May 1998; pp. 2422–2427. [Google Scholar]
  21. Oloufa, A.A.; Do, W.S.; Thomas, H.R. An automated system for quality control of compaction operations: Receiver tests & algorithms. In Proceedings of the 16th International Symposium on Automation and Robotics in Construction, Madrid, Spain, 22–24 September 1999; pp. 67–71. [Google Scholar]
  22. Oloufa, A. Quality control of asphalt compaction using GPS-based system architecture. IEEE Robot. Autom. Mag. 2002, 9, 29–35. [Google Scholar] [CrossRef]
  23. Huang, S.X.; Liu, J.N.; Wu, X.M. GPS real-time supervisory system and its preliminary application in the construction of face rockfill dam. Geomat. Inf. Sci. Wuhan Univ. 2005, 30, 813–816. [Google Scholar]
  24. Zhang, J.; Chen, X.L.; Zhong, C.; Wu, H.; Duan, S.H. Application of geo-spatial information technology in the engineering manage of roller compaction construction. In Proceedings of the Geoscience and Remote Sensing Symposium, 2008 IEEE International-IGARSS, Boston, MA, USA, 7–11 July 2008. [Google Scholar]
  25. Huang, S.; Zhang, W. A fast calculation method of rolling times in the GNSS real-time compaction quality supervisory system. Adv. Eng. Softw. 2018, 128, 20–33. [Google Scholar] [CrossRef]
  26. Huang, S.; Zhang, W.; Wu, G. Research on Real-Time Supervisory System for Compaction Quality in Face Rockfill Dam Engineering. J. Sens. 2018, 2018, 6487405. [Google Scholar] [CrossRef]
  27. Liu, D.; Li, Z.; Lian, Z. Compaction quality assessment of earth-rock dam materials using roller-integrated compaction monitoring technology. Autom. Constr. 2014, 44, 234–246. [Google Scholar] [CrossRef]
  28. Li, Z.L.; Liu, L.; Sun, Y.C.; Ma, R.X.; Ge, G.S. Research and application of real-time control system for construction quality of digital dynamic compaction. In Proceedings of the 2018 IEEE 4th Information Technology and Mechatronics Engineering Conference (ITOEC), Chongqing, China, 14–16 December 2018. [Google Scholar]
  29. Zhang, Q.; An, Z.; Liu, T.; Zhang, Z.; Huangfu, Z.; Li, Q.; Yang, Q.; Liu, J. Intelligent rolling compaction system for earth-rock dams. Autom. Constr. 2020, 116, 103246. [Google Scholar] [CrossRef]
  30. Zhong, D.; Li, X.; Cui, B.; Wu, B.; Liu, Y. Technology and application of real-time compaction quality monitoring for earth-rockfill dam construction in deep narrow valley. Autom. Constr. 2018, 90, 23–38. [Google Scholar] [CrossRef]
  31. Zhang, Q.; Liu, T.; Zhang, Z.; Huangfu, Z.; Li, Q.; An, Z. Compaction quality assessment of rockfill materials using roller-integrated acoustic wave detection technique. Autom. Constr. 2019, 97, 110–121. [Google Scholar] [CrossRef]
  32. Zhang, Q.; Liu, T.; Li, Q. Roller-Integrated Acoustic Wave Detection Technique for Rockfill Materials. Appl. Sci. 2017, 7, 1118. [Google Scholar] [CrossRef] [Green Version]
  33. Yang, W.; Kong, Q.; Ho, S.C.M.; Mo, Y.-L.; Song, G. Real-Time Monitoring of Soil Compaction Using Piezoceramic-Based Embeddable Transducers and Wavelet Packet Analysis. IEEE Access 2018, 6, 5208–5214. [Google Scholar] [CrossRef]
  34. Wang, Z.M. Design and Implementation of Dynamic Compaction Quality Control System. Master’s thesis, Jilin University, Changchun, China, 2016. (In Chinese). [Google Scholar]
  35. Karray, M.; Lefebvre, G.; Ethier, Y.; Bigras, A. Assessment of deep compaction of the Péribonka dam foundation using “modal analysis of surface waves” (MASW). Can. Geotech. J. 2010, 47, 312–326. [Google Scholar] [CrossRef]
  36. Shi, M.N.; Wang, J.J.; Li, Q.H.; Cui, B.; Guan, S.W.; Zeng, T.C. Accelerated Earth-Rockfill Dam Compaction by Collaborative Operation of Unmanned Roller Fleet. J. Constr. Eng. Manag. 2022, 148, 04022046. [Google Scholar] [CrossRef]
  37. Cândido, B.M.; Quinton, J.N.; James, M.R.; Silva, M.L.N.; de Carvalho, T.S.; de Lima, W.; Beniaich, A.; Eltner, A. High-resolution monitoring of diffuse (sheet or interrill) erosion using structure-from-motion. Geoderma 2020, 375, 114477. [Google Scholar] [CrossRef]
  38. Yang, Y.; Shi, Y.Z.; Liang, X.Z.; Huang, T.T.; Fu, S.H.; Liu, B.Y. Evaluation of structure from motion (SfM) photogrammetry on the measurement of rill and interrill erosion in a typical loess. Geomorphology 2021, 385, 107734. [Google Scholar] [CrossRef]
  39. Daliakopoulos, I.N.; Tsanis, I.K. A SIFT-Based DEM Extraction Approach Using GEOEYE-1 Satellite Stereo Pairs. Sensors 2019, 19, 1123. [Google Scholar] [CrossRef] [Green Version]
  40. Yang, Z.; Sun, P.C.; Xie, Q.; Zhang, W.J.; Ye, K. The experiment of making DEM by GF3 Satellite Images. Sci. Surv. Mapp. 2020, 45, 53–60. (In Chinese) [Google Scholar]
  41. Nappo, N.; Mavrouli, O.; Nex, F.; van Westen, C.; Gambillara, R.; Michetti, A.M. Use of UAV-based photogrammetry products for semi-automatic detection and classification of asphalt road damage in landslide-affected areas. Eng. Geol. 2021, 294, 106363. [Google Scholar] [CrossRef]
  42. Menegoni, N.; Giordan, D.; Perotti, C.; Tannant, D.D. Detection and geometric characterization of rock mass discontinuities using a 3D high-resolution digital outcrop model generated from RPAS imagery—Ormea rock slope, Italy. Eng. Geol. 2019, 252, 145–163. [Google Scholar] [CrossRef]
  43. Cucchiaro, S.; Cazorzi, F.; Marchi, L.; Crema, S.; Beinat, A.; Cavalli, M. Multi-temporal analysis of the role of check dams in a debris-flow channel: Linking structural and functional connectivity. Geomorphology 2019, 345, 106844. [Google Scholar] [CrossRef]
  44. Cucchiaro, S.; Cavalli, M.; Vericat, D.; Crema, S.; Llena, M.; Beinat, A.; Marchi, L.; Cazorzi, F. Geomorphic effectiveness of check dams in a debris-flow catchment using multi-temporal topographic surveys. Catena 2019, 174, 73–83. [Google Scholar] [CrossRef]
  45. Ajibola, I.I.; Mansor, S.; Pradhan, B.; Shafri, H.Z.M. Fusion of UAV-based DEMs for vertical component accuracy improvement. Measurement 2019, 147, 106795. [Google Scholar] [CrossRef]
  46. Jidesh, P.; Febin, I.P. A Perceptually Inspired Variational Model for Enhancing and Restoring Remote Sensing Images. IEEE Geosci. Remote Sens. Lett. 2020, 18, 251–255. [Google Scholar] [CrossRef]
  47. Li, S.; Wang, H. Adaptive dodging method based on variational mask for remote sensing images. J. Remote Sens. 2018, 22, 450–457. [Google Scholar] [CrossRef]
  48. Wang, W. The Research on Dodging Technique of UAV Image. Master’s Thesis, Changsha University of Science & Technology, Changsha, China, 2017. (In Chinese). [Google Scholar]
  49. Li, W.; Sun, K.; Li, D.; Bai, T. Algorithm for automatic image dodging of unmanned aerial vehicle images using two-dimensional radiometric spatial attributes. J. Appl. Remote Sens. 2016, 10, 36023. [Google Scholar] [CrossRef] [Green Version]
  50. Zhang, Q. An improved Mask dodging method for areial images. Surv. Sci. 2015, 40, 122–124, 143. (In Chinese) [Google Scholar]
Figure 1. Compaction quality monitoring and control system processing steps.
Remotesensing 15 01083 g001
Figure 2. Compaction model of filling material: (a) Photo of the compaction site; (b) Simplified model of compacted material; (c) Simplified model of uncompacted material; and (d) Compaction model of embankment dam.
Remotesensing 15 01083 g002
Figure 3. Testing site in Zhirui hydropower station: (a) Panorama of Zhirui hydropower station; (b) Cross section of the embankment dam; and (c) Photo of the testing site.
Remotesensing 15 01083 g003
Figure 4. Data acquisition in the study area: (a) Aerial survey site and route planning and (b) GCP measured by RTK.
Remotesensing 15 01083 g004
Figure 5. CR nephogram generation via UAV photogrammetry technology.
Remotesensing 15 01083 g005
Figure 6. CR nephogram: (a) Zone A compacted 8 times; (b) Zone A compacted 10 times; (c) Zone B compacted 10 times; (d) Zone B compacted 12 times; (e) Zone C compacted 6 times; and (f) Zone D compacted 8 times.
Remotesensing 15 01083 g006aRemotesensing 15 01083 g006b
Figure 7. ECP measurement: (a) Distribution of ECP; (b) ECP measured by total station; and (c) ECP measured by level survey.
Remotesensing 15 01083 g007
Figure 8. Comparison between CR measured by total station and UAV: (a) Zone A compacted 8 times; (b) Zone A compacted 10 times; (c) Zone B compacted 10 times; (d) Zone B compacted 12 times; (e) Zone C compacted 6 times; and (f) Zone D compacted 8 times.
Remotesensing 15 01083 g008aRemotesensing 15 01083 g008b
Figure 9. Density testing: (a) Test pit excavation and (b) Water replacement method.
Remotesensing 15 01083 g009
Table 1. Design indicators of the two materials.
MaterialDesign Indicators
Rockfill materialMaximum size400 mm
Proportion <5 mm25%~41%
Proportion <0.075 mm≤5%
Non-uniformity coefficient C u >10
Relative density D r ≥72%
Maximum density ρ d   m a x 2.2 g/cm3
Minimum density ρ d   m i n 1.9 g/cm3
Transitional materialMaximum size200 mm
Proportion <5 mm25%~39%
Proportion <0.075 mm≤5%
Non-uniformity coefficient>15
Relative density D r ≥75%
Maximum density ρ d   m a x 2.3 g/cm3
Minimum density ρ d   m i n 2.0 g/cm3
Table 2. Rolling test scheme.
MaterialZonePassesVelocity
(km/h)
Thickness
(m)
Material Volume (m3)Density TestTotal Station SurveyLeveling Survey
Rockfill materialA82.5 ± 0.5 km/h0.8160211
A100.8211
B101.0200211
B121.0211
Transitional
material
C60.6100211
D81.0145211
Table 3. RMSE3D of the DEM generation for the test area.
NumberDx (mm)Dy (mm)Dz (mm)
DEMA10.350.410.06
DEMA20.270.300.04
DEMA30.260.340.05
DEMB10.260.340.05
DEMB20.310.400.03
DEMB30.230.250.03
DEMC10.240.250.04
DEMC20.220.230.03
DEMD10.240.250.04
DEMD20.220.230.03
Table 4. CRk and qualified ratio ( μ ) of the filling materials.
MaterialNephograms D r /% ρ d   m a x  g/cm3 ρ d   m i n  g/cm3CRk/% μ /%
Rockfill materialZone A 8 times752.201.958.5220.79
Zone A 10 times42.56
Zone B 10 times20.98
Zone B 12 times28.67
Transitional materialZone C 6 times752.302.009.7845.53
Zone D 8 times38.29
Table 5. Error of ECPs in subregional statistics.
CR/%CRLCR’CRMAE (CR’)MAE (CR)
Zone A 8 times6.587.206.770.760.80
Zone A 10 times8.917.639.131.320.61
Zone B 10 times6.575.987.000.590.58
Zone B 12 times7.266.857.950.430.72
Zone C 6 times8.537.609.510.960.99
Zone D 8 times8.698.549.270.230.57
Table 6. Error analysis for all ECPs.
MAE (CR’)/%MAE (CR)/%SD (CR’)/%SD (CR)/%
0.720.710.680.59
Disclaimer/Publisher’s Note: The statements, opinions and data contained in all publications are solely those of the individual author(s) and contributor(s) and not of MDPI and/or the editor(s). MDPI and/or the editor(s) disclaim responsibility for any injury to people or property resulting from any ideas, methods, instructions or products referred to in the content.

