Article

Integrating Stereo Images and Laser Altimetry Points Derived from the Same Satellite for High-Accuracy Stereo Mapping

1
Land Satellite Remote Sensing Application Center, Ministry of Natural Resources of the People’s Republic of China, Beijing 100048, China
2
Geosciences and Info-Physics, Central South University, Changsha 410083, China
*
Author to whom correspondence should be addressed.
Remote Sens. 2023, 15(4), 869; https://doi.org/10.3390/rs15040869
Submission received: 21 November 2022 / Revised: 2 February 2023 / Accepted: 2 February 2023 / Published: 4 February 2023

Abstract

:
At present, some mapping satellites, such as GaoFen-7 and ZiYuan3-03, are equipped with both optical stereo cameras and laser altimeters that can synchronously obtain stereo images and sparse ground laser altimetry points (LAPs). To effectively improve the geometric accuracy of these satellite stereo images, this study proposed an integrated processing method for LAPs and stereo images derived from the same satellite. This method makes full use of the advantages of synchronously obtaining stereo images and LAPs, and designs measurement technology for accurate pixel coordinates of LAPs in stereo images, which works toward solving a technical difficulty that has restricted their integration to achieve higher accuracy. The method also constructs a combined block adjustment model of LAPs and stereo images. We selected 70 GaoFen-7 stereo images and 463 GaoFen-7 LAPs from Hebei Province, China, and 12 ZiYuan3-03 stereo images and 81 ZiYuan3-03 LAPs from Heilongjiang Province, China, to conduct integrated processing experiments. The vertical accuracy of the GaoFen-7 images in all types of terrain were improved substantially and reached the accuracy requirements of 1:10,000 (even 1:5000) scale mapping in China. The vertical accuracy of the ZiYuan3-03 images in various terrain areas were also improved markedly, satisfying the accuracy requirement of 1:50,000 scale mapping. These experimental results indicate that the working mode of synchronously obtaining LAPs and stereo images using the same satellite is advanced, and the proposed method is correct and effective.

1. Introduction

Satellite laser altimetry can actively obtain high-precision elevation information of discrete ground points. Conducting the integrated processing of stereo images and laser altimetry points (LAPs) has become an effective approach to improve the geometric accuracy of optical stereo images. It is of great significance for using satellite images to conduct high-precision mapping in regions lacking ground control data. Since the 1990s, the satellites or spacecraft launched by some countries for the exploration of extraterrestrial planets such as Mars and the moon have contained laser altimetry altimeters [1,2,3,4], which are used to measure the three-dimensional topography of the surface of celestial bodies. Some satellites or spacecraft are also equipped with laser altimeters and optical cameras, such as the Mars Global Surveyor (MGS) spacecraft of the United States [3] and Chang’e-1 and Chang’e-2 of China [4]. In the field of Earth observation, the United States launched two laser altimetry satellites in 2003 and 2018. They are the ICESat satellite equipped with the Geoscience Laser Altimeter System (GLAS) and the ICESat-02 satellite equipped with the Advanced Topographical Laser Altimeter System (ATLAS) [5,6], which are mainly used for the monitoring of polar glaciers, sea ice, and forests. In the flat and smooth surface area, the vertical accuracy of GLAS data can reach 0.15 m [5], and the vertical accuracy of ATLAS data can reach 0.1 m [6].
Using LAPs as control data and conducting combined block adjustment with stereo images is one of the main methods of integrated processing of stereo images and LAPs. On the premise that the LAPs themselves have high and reliable precision, the main technical difficulties of this method include the accurate measurement of pixel coordinates of LAPs in stereo images and the construction of a reasonable and effective block adjustment model. However, the low measurement accuracy of the pixel coordinates of the LAPs in the stereo image has been the main technical bottleneck restricting the integration of LAPs and stereo images to achieve higher accuracy.
In order to solve this problem and to make the integrated processing of LAPs and stereo images more efficient, convenient, and accurate, in November 2019 and July 2020, China launched the GaoFen-7 satellite (GF7) [7] and the ZiYuan3-03 satellite (ZY3-03) [8], which were equipped with both a stereo optical camera and a laser altimeter. In the process of developing the hardware payload of the two satellites, many targeted designs conducive to the integrated processing of LAPs and stereo images were proposed. In addition, the laser altimeter and the optical camera were designed to work synchronously to obtain stereo images and sparse LAPs in the same geographical area and at the same time. Compared with the LAPs and stereo images obtained by different satellites, the concurrent optical images and LAPs obtained by GF7 and ZY3-03 have more unique advantages, such as minimal relative plane error, the same data acquisition time, and overlapping geographical distribution range. In addition, GF7 is equipped with a footprint camera to assist in determining the plane position relationship between LAPs and optical images. Based on these advantages, this study proposed an integrated processing method of LAPs and stereo images obtained by the same satellite, effectively solving the technical problem of limited pixel coordinate measurement accuracy of LAPs in stereo images. It should be noted that the ZiYuan3-02 satellite (ZY3-02) launched by China in May 2016 is also equipped with both a stereo optical camera and a laser altimeter. However, the laser altimeter of ZY3-02 is an experimental payload, and it has an imperfect design. Only 44 orbits of laser altimetry data have been obtained, and the laser altimeter and optical camera did not work synchronously, with most of the LAPs and optical images being obtained in different orbits at separate times [9], resulting in the ZY3-02 data not having the same advantages as GF7 and ZY3-03 data obtained from the same platform. Therefore, ZY3-02 data are not included in the scope of this study.
The article is organized as follows: In Section 1, we briefly describe the research background and significance. Section 2 describes the existing literature. Section 3 outlines the design of the integrated processing method. In Section 3.1, the feasibility of using LAPs to improve the geometric accuracy of stereo images is analyzed. In Section 3.2, the main steps of the proposed method are introduced. In Section 3.3 and Section 3.4, the design of the method to accurately measure LAPs in stereo images with and without footprints is provided. In Section 3.5, a simple and effective combined block adjustment model of the LAPs and stereo images is constructed. Section 4 describes several sets of integration experiments conducted on various terrains and the analysis of the results. Finally, in Section 5, we draw the conclusions.

2. Related Works

Many scholars have carried out research on the integration of the LAPs and optical images from satellites for extraterrestrial planet exploration. Spiegel et al. used the LAPs of the MGS spacecraft as the control points and performed bundle block adjustment with the optical images obtained by the stereo camera on the European Mars Express, so as to improve the orientation accuracy of the stereo images [10]. Yoon and Shan improved the orientation accuracy of stereo images through combined block adjustment of the LAPs and stereo images, both from the MGS spacecraft [11]. Lin et al. used the digital elevation model (DEM) generated by the LAPs of the MGS as the control data and improved the orientation accuracy of the optical images by registering the DEM generated by the MGS optical stereo images and that generated by the MGS LAPs [12]. Di et al. used the DEM generated by the Chang’e-1 satellite laser altimeter as control data to improve the geometric accuracy of the DEM generated by stereo images from the same satellite [13,14]. Because the observation environment of an extraterrestrial planet is simpler than that of Earth, most extraterrestrial planet observation satellites adopt low-orbit and high-repetition observation modes. This produces higher density LAPs with a large number of redundant observed values when integrated processing of LAPs and optical images is performed. Additionally, the relative accuracy of the DEM generated by the LAPs is higher. Furthermore, the accuracy requirements for the integrated processing of extraterrestrial LAPs and images are far lower than the requirements for Earth observation, which typically require a dozen or even tens of meters. Therefore, the aforementioned research results cannot directly meet the requirements for the integrated processing of LAPs and stereo images for Earth observation and do not have much reference value for this study.
In the field of Earth observation, using LAPs, such as GLAS and ATLAS, as control data to improve the geometric accuracy of stereo images or the geometric accuracy of the Digital Surface Model (DSM) generated by stereo images has become a research hotspot in recent years. The technical methods used in studies can be divided into two categories. The first type of method is to use stereo images to generate a DSM and then perform high-precision registration between the generated DSM and the dense LAP cloud so as to obtain the accurate plane position of the LAPs on the DSM, effectively improving the vertical accuracy of the DSM generated by stereo image. Ye et al. used ATLAS LAPs to improve the vertical accuracy of the DSM generated by GF7 stereo images and WorldView-2 stereo images to 1.8 m and 0.71 m, respectively [15]. Some scholars used ATLAS LAPs and Worldview images to generate a DSM in Antarctica with a vertical accuracy better than 1 m [16]. Using a similar method, Magruder et al. corrected the vertical error of the Shuttle Radar Topography Mission DSM using ATLAS LAPs [17]. In research that uses the first type of method, the core link is to realize the high-precision registration between the laser point cloud and the DSM. To achieve the ideal registration accuracy, the laser altimeter is required to have a high sampling frequency and be able to obtain enough dense LAPs. For example, the sampling frequency of ATLAS reaches 10,000 Hz. However, the sampling frequencies of the GF7 and ZY3-03 laser altimeters are 3 Hz and 2 Hz, respectively, so their data cannot be well applied to this type of method. The second type of method is to use LAPs as control points to perform combined block adjustment between LAPs and stereo images to improve the geometric accuracy of stereo images. Dongchen et al. used GLAS LAPs and ASTER stereo images to conduct integrated processing to generate a 1:50,000-scale DEM in coverage of the expedition route of the Antarctic [18]. Takaku et al. used GLAS LAPs as a vertical control and produced a global high-precision DSM using ALOS PRISIM stereo images [19]. Li et al., Zhou et al., and Cao et al., conducted combined block adjustment between GLAS LAPs and ZY3 stereo images, which can improve the vertical accuracy of ZY3 stereo image to the 1:50,000-scale requirements in China [20,21,22]. Li et al. and Zhang et al. used the ZY3-02 LAPs and ZY3-02 stereo images to conduct combined block adjustment, which can improve the vertical accuracy of the stereo images in flat terrain areas to about 3 m [23,24]. Zhang et al. used spaceborne SAR and GLAS LAPs as horizontal and vertical control, respectively, and conducted block adjustment for ZY3 stereo images, which can improve the horizontal and vertical accuracy of stereo images to 7 m and 3 m, respectively [25]. In research that uses the second type of method, the rough estimate value of the pixel coordinates of the LAP in the stereo images is generally calculated according to the longitude and latitude parameters of the LAP. Because the relative plane error between the LAP and stereo image cannot be accurately known and effectively eliminated, there may be a large error in the pixel coordinates obtained using the aforementioned method, which will seriously affect the accuracy of the combined block adjustment. This phenomenon is particularly evident in areas with widely variable topography. Therefore, in research that uses this method, the experimental area is mainly distributed in areas with flat terrain, and the final accuracy of the integrated processing of LAPs and optical images generally cannot meet the accuracy requirements of 1:10,000-scale mapping. To solve these technical difficulties, the present study used the advantages of the LAPs and stereo images obtained by the same satellite to design an accurate measurement method for pixel coordinates of LAPs in stereo images, which not only ensures that the LAPs can be effectively used in various terrain areas but also provides a guarantee for integrated processing to achieve higher geometric accuracy.
Some scholars have also carried out research on the integrated processing of LAPs and stereo images obtained by the same satellite. Zhou et al. used ZY3-03 LAPs and stereo images obtained concurrently on the same satellite to design a combined block adjustment method using them that can effectively improve the vertical accuracy [8]. However, Zhou et al.’s research is only relevant to the ZY3-03 satellite and is not applicable to other satellites, such as GF7, that can obtain both LAPs and stereo images, and the use of laser footprint images was not considered. The research presented herein is aimed at all satellites that can obtain both LAPs and stereo images. Chen et al. carried out research on the combined adjustment of laser altimetry data and optical stereo images from the GF7 satellite [26] and designed a matching method between laser footprint images and stereo images. However, this method does not analyze and utilize the unique advantages of acquiring LAPs and optical images from the same satellite. For example, in areas with large topographic relief (mainly mountainous terrain types), the occlusion and shadow caused by the undulation of the ground can easily lead to the failure of the match between the footprint image and the stereo image. However, Chen et al. failed to study the corresponding remedial methods, resulting in a low utilization rate of the LAPs. This is also the main reason why the experimental area in their study can only be selected in flat terrain areas. However, the method proposed in our study is more comprehensive and advanced and fully considers the problem of footprint images and stereo images not being successfully matched due to the fluctuation of the ground. Therefore, the novel method in our study can be applied to all kinds of terrain areas.

3. Materials and Methods

3.1. Working Mechanism for Obtaining LAPs and Images from the Same Satellite

3.1.1. Data Acquisition from the GF7 and ZY3-03 Satellites

The GF7 stereo camera is composed of a forward camera tilting 26° and a backward camera tilting -5° in the direction of satellite flight. Both cameras are time delay and integration (TDI) charge coupled devices (CCD) linear-array pushing broom optical cameras that can obtain panchromatic images with spatial resolutions of 0.8 m and 0.65 m, respectively (referred to as forward and backward images, respectively). The forward and backward images construct a stereo image with a base-height ratio of ~0.67, and all images had swath widths of ~20 km. Moreover, the GF7 laser altimeter includes two laser beams, with a laser pointing angle almost perpendicular to the ground and a working frequency of 3 Hz that yields discrete laser altimetry data with an along-track interval of 2.4 km and an across-track interval of 12.25 km. The ground diameter of the laser spot (also known as the ground footprint) is ~20 m, and each laser beam is also equipped with a footprint camera to collect an optical image of the laser spot on the ground. The length and width of this footprint image are 1.6 km, and the spatial resolution is 3.2 m.
The ZY3-03 stereo camera is composed of a forward camera tilting 22°, a nadir camera almost perpendicular to the ground, and a backward camera tilting −22° along the satellite flight direction. The three cameras are TDI CCD linear-array pushing broom optical cameras that can obtain panchromatic images with spatial resolutions of 2.5 m, 2.1 m, and 2.5 m, respectively (called the forward, nadir, and backward images). A three linear-array stereo image with a base-height ratio of ~0.89 can be constructed using these images, and the swath width of all images is ~51 km. In addition, the ZY3-03 laser altimeter includes a laser beam that is pointed almost perpendicular to the ground and has a working frequency of 2 Hz. Discrete laser altimetry data with an along-track interval of 3.5 km can be obtained using this system. The ground diameter of the laser spot is approximately 45 m, and the laser altimeter is not equipped with a footprint camera. The data acquisition methods of the GF7 and ZY3-03 satellites are shown in Figure 1.

3.1.2. GF7 and ZY3-03 Data Processing

The raw images from the GF7 and ZY3-03 satellites require processing to generate sensor calibration (SC) images [27,28] before they can be distributed to users for mapping applications. The SC images are a basic image product similar to the level 1A product of the SPOT5 satellite, the basic product of the Worldview satellite, and the primary product of the Pleiades satellite and are primarily composed of image, rational function model (RFM), and metadata files.
The raw laser altimetry data from the GF7 and ZY3-03 satellites require processing to generate LAPs [29,30]. As topographic relief and a rough ground surface will seriously reduce the geometric accuracy of the LAPs [31], the LAP production system performs quality analysis of all generated LAPs to eliminate those with topographic relief and a rough ground surface within the footprint area. The judgment criteria for LAP elimination include whether the echo wave pulse width is significantly larger, the number of echo wave crests is greater than 1, the quality of the footprint image is poor, and the terrain slope of the footprint area is greater than 5° [30,32]. The GF7 and ZY3-03 LAPs include accurate elevation values and the approximate longitude and latitude coordinates of the center point of the ground footprint. In addition, the GF7 LAPs include the footprint image and accurate pixel coordinates of the LAP on the footprint image.

3.1.3. Feasibility of using LAPs to Improve Image Geometric Accuracy

According to the technical parameters of the GF-7 and ZY3-03 satellites and the production and application of images and LAPs, the root-mean square error (RMSE) in the vertical direction of the GF-7 image is about 3 m [33] and that of the LAPs is about 0.1 m [34]. The vertical accuracy of the GF-7 LAPs far exceeds the requirements of 1:10,000 scale mapping in China and is ~30 times higher than that of stereo images obtained simultaneously from the same platform. The RMSE in the vertical direction of the ZY3-03 image is about 6 m and that of the LAPs is about 0.5 m [8]. The vertical accuracy of ZY3-03 LAPs far exceeds the requirements of 1:50,000-scale mapping in China and is more than ~10 times higher than that of stereo images obtained simultaneously from the same platform. Therefore, the vertical accuracy of the GF7 stereo images can theoretically be improved to meet the accuracy requirements for 1:10,000 scale mapping using the GF7 LAPs. In addition, the vertical accuracy of the ZY3-03 stereo images can theoretically be improved using the ZY3-03 LAPs to meet the accuracy requirements for 1:50,000 scale mapping.
Previous studies have shown that the geometric accuracy of push-broom optical images is primarily affected by errors in attitude measurement, orbital measurement, calibration parameters of on-board equipment, and interior orientation elements of the camera [35,36,37]. During the generation of SC images, on-orbit geometric calibration is carried out, so the errors in calibration parameters of on-board equipment and interior orientation elements of the camera can be ignored. The geometric accuracy of LAPs is primarily affected by attitude measurement errors, orbital measurement errors, laser pointing angle errors, atmospheric delay, the Earth tide, ranging hardware errors, topographic relief, and ground surface roughness [31]. During the generation of LAP products, on-orbit geometric calibration with a reasonable frequency is carried out [34,38]; thus, ranging hardware and laser pointing angle errors can be ignored. The atmospheric delay correction [39] and tidal correction [40] models are also used to correct the errors in the laser ranging value, and any LAPs with topographic relief and a rough ground surface within the footprint area are eliminated. Therefore, the geometric accuracy of SC images and LAPs is primarily affected by attitude measurement and orbital measurement errors.
The laser pointing angle of the ZY3-03 laser altimeter is designed to be completely consistent with the tilt angle of the nadir camera, while the laser pointing angle of the GF-7 laser altimeter is basically consistent with the tilt angle of the backward camera, and the laser altimeter and optical camera work synchronously, so the type and magnitude of satellite platform errors (such as satellite attitude and orbit measurement errors) that affect the laser altimeter and stereo images are basically the same. The horizontal accuracy of the GF7 LAPs and backward images obtained at the same time is almost the same at about 5 m [33]. The horizontal accuracy of the ZY3-03 LAPs and nadir images obtained at the same time is almost the same at about 20 m [8,41]. This is an important feature of LAPs and optical images obtained from the same satellite platform. The main purpose of this design is to facilitate the accurate measurement of LAPs on the stereo images. Therefore, the horizontal accuracy of the images cannot theoretically be improved using synchronously obtained LAPs.

3.2. Integrated Processing Steps

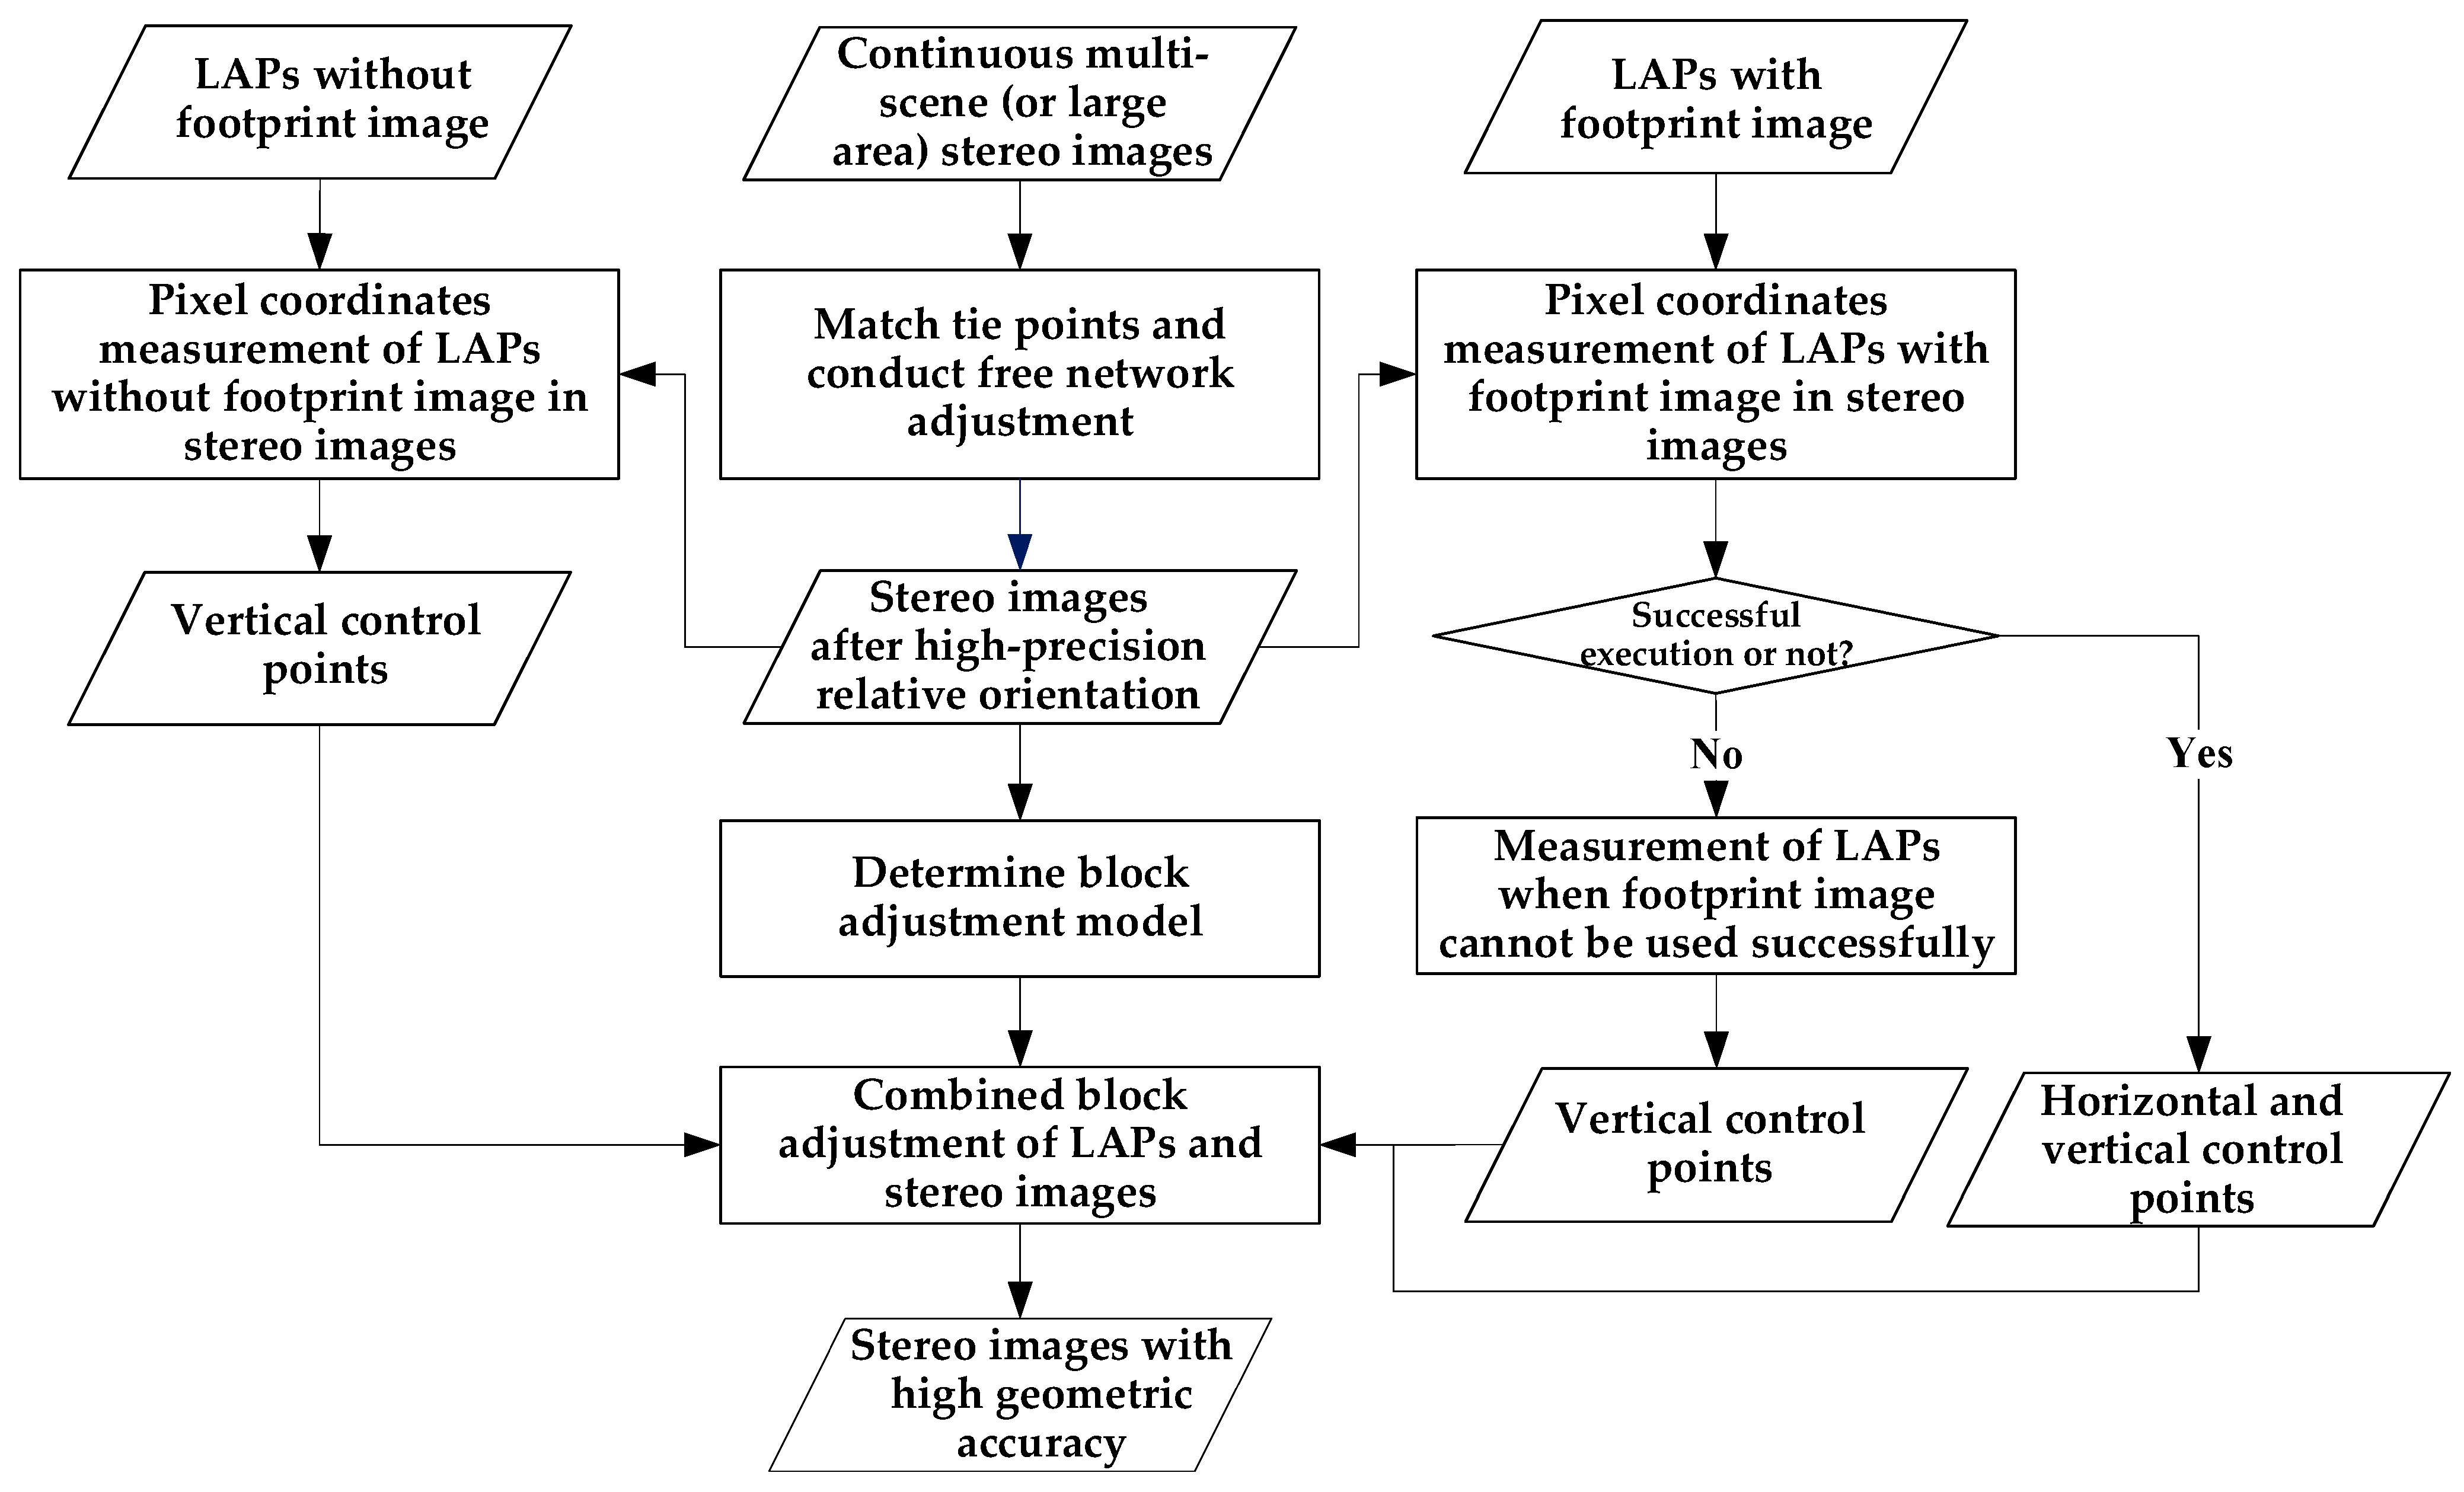
The integrated processing procedure for the LAPs and stereo images is shown in Figure 2.
The process proceeds as follows:
  • Stereo images from continuous multi-scenes or large areas were selected. The dense tie points within each stereo image were automatically matched, after which an appropriate number of common tie points in the overlapping region among the adjacent stereo images were automatically matched. Thereafter, the free network adjustment of the stereo images was performed. Stereo images resulting from the high-precision relative orientation were then used for the subsequent steps.
  • For LAPs with footprint images, high-precision matching was performed between the laser footprint image and the stereo images using the method described in Section 3.3.1 to obtain the correct pixel coordinates of the LAPs in the stereo images. The LAPs were also used as vertical or horizontal control points for block adjustment. For LAPs that could not use the above method, the method described in Section 3.3.2 was used to obtain tie points within the range of the laser footprint on the stereo images, and a tie point closest to the footprint center was used as the vertical control point.
  • For LAPs without footprint images, the method described in Section 3.4 was used to calculate the pixel coordinates of the LAPs in the image with the smallest imaging tilt angle in the synchronously obtained stereo image. Image matching was then performed between the image with the smallest imaging tilt angle and the other constituent images of the stereo image to obtain the correct pixel coordinates of the LAPs in the stereo images. The LAPs were then used as the vertical control points.
  • The block adjustment model described in Section 3.5 was used to conduct a combined block adjustment of the stereo images and LAPs to effectively improve the vertical accuracy of the stereo images. Finally, the RFM of the stereo image was updated according to the block adjustment results.

3.3. Pixel Coordinate Measurement of LAPs with Footprint Images in Stereo Images

3.3.1. Measurement of LAPs when Successfully Using Footprint Image

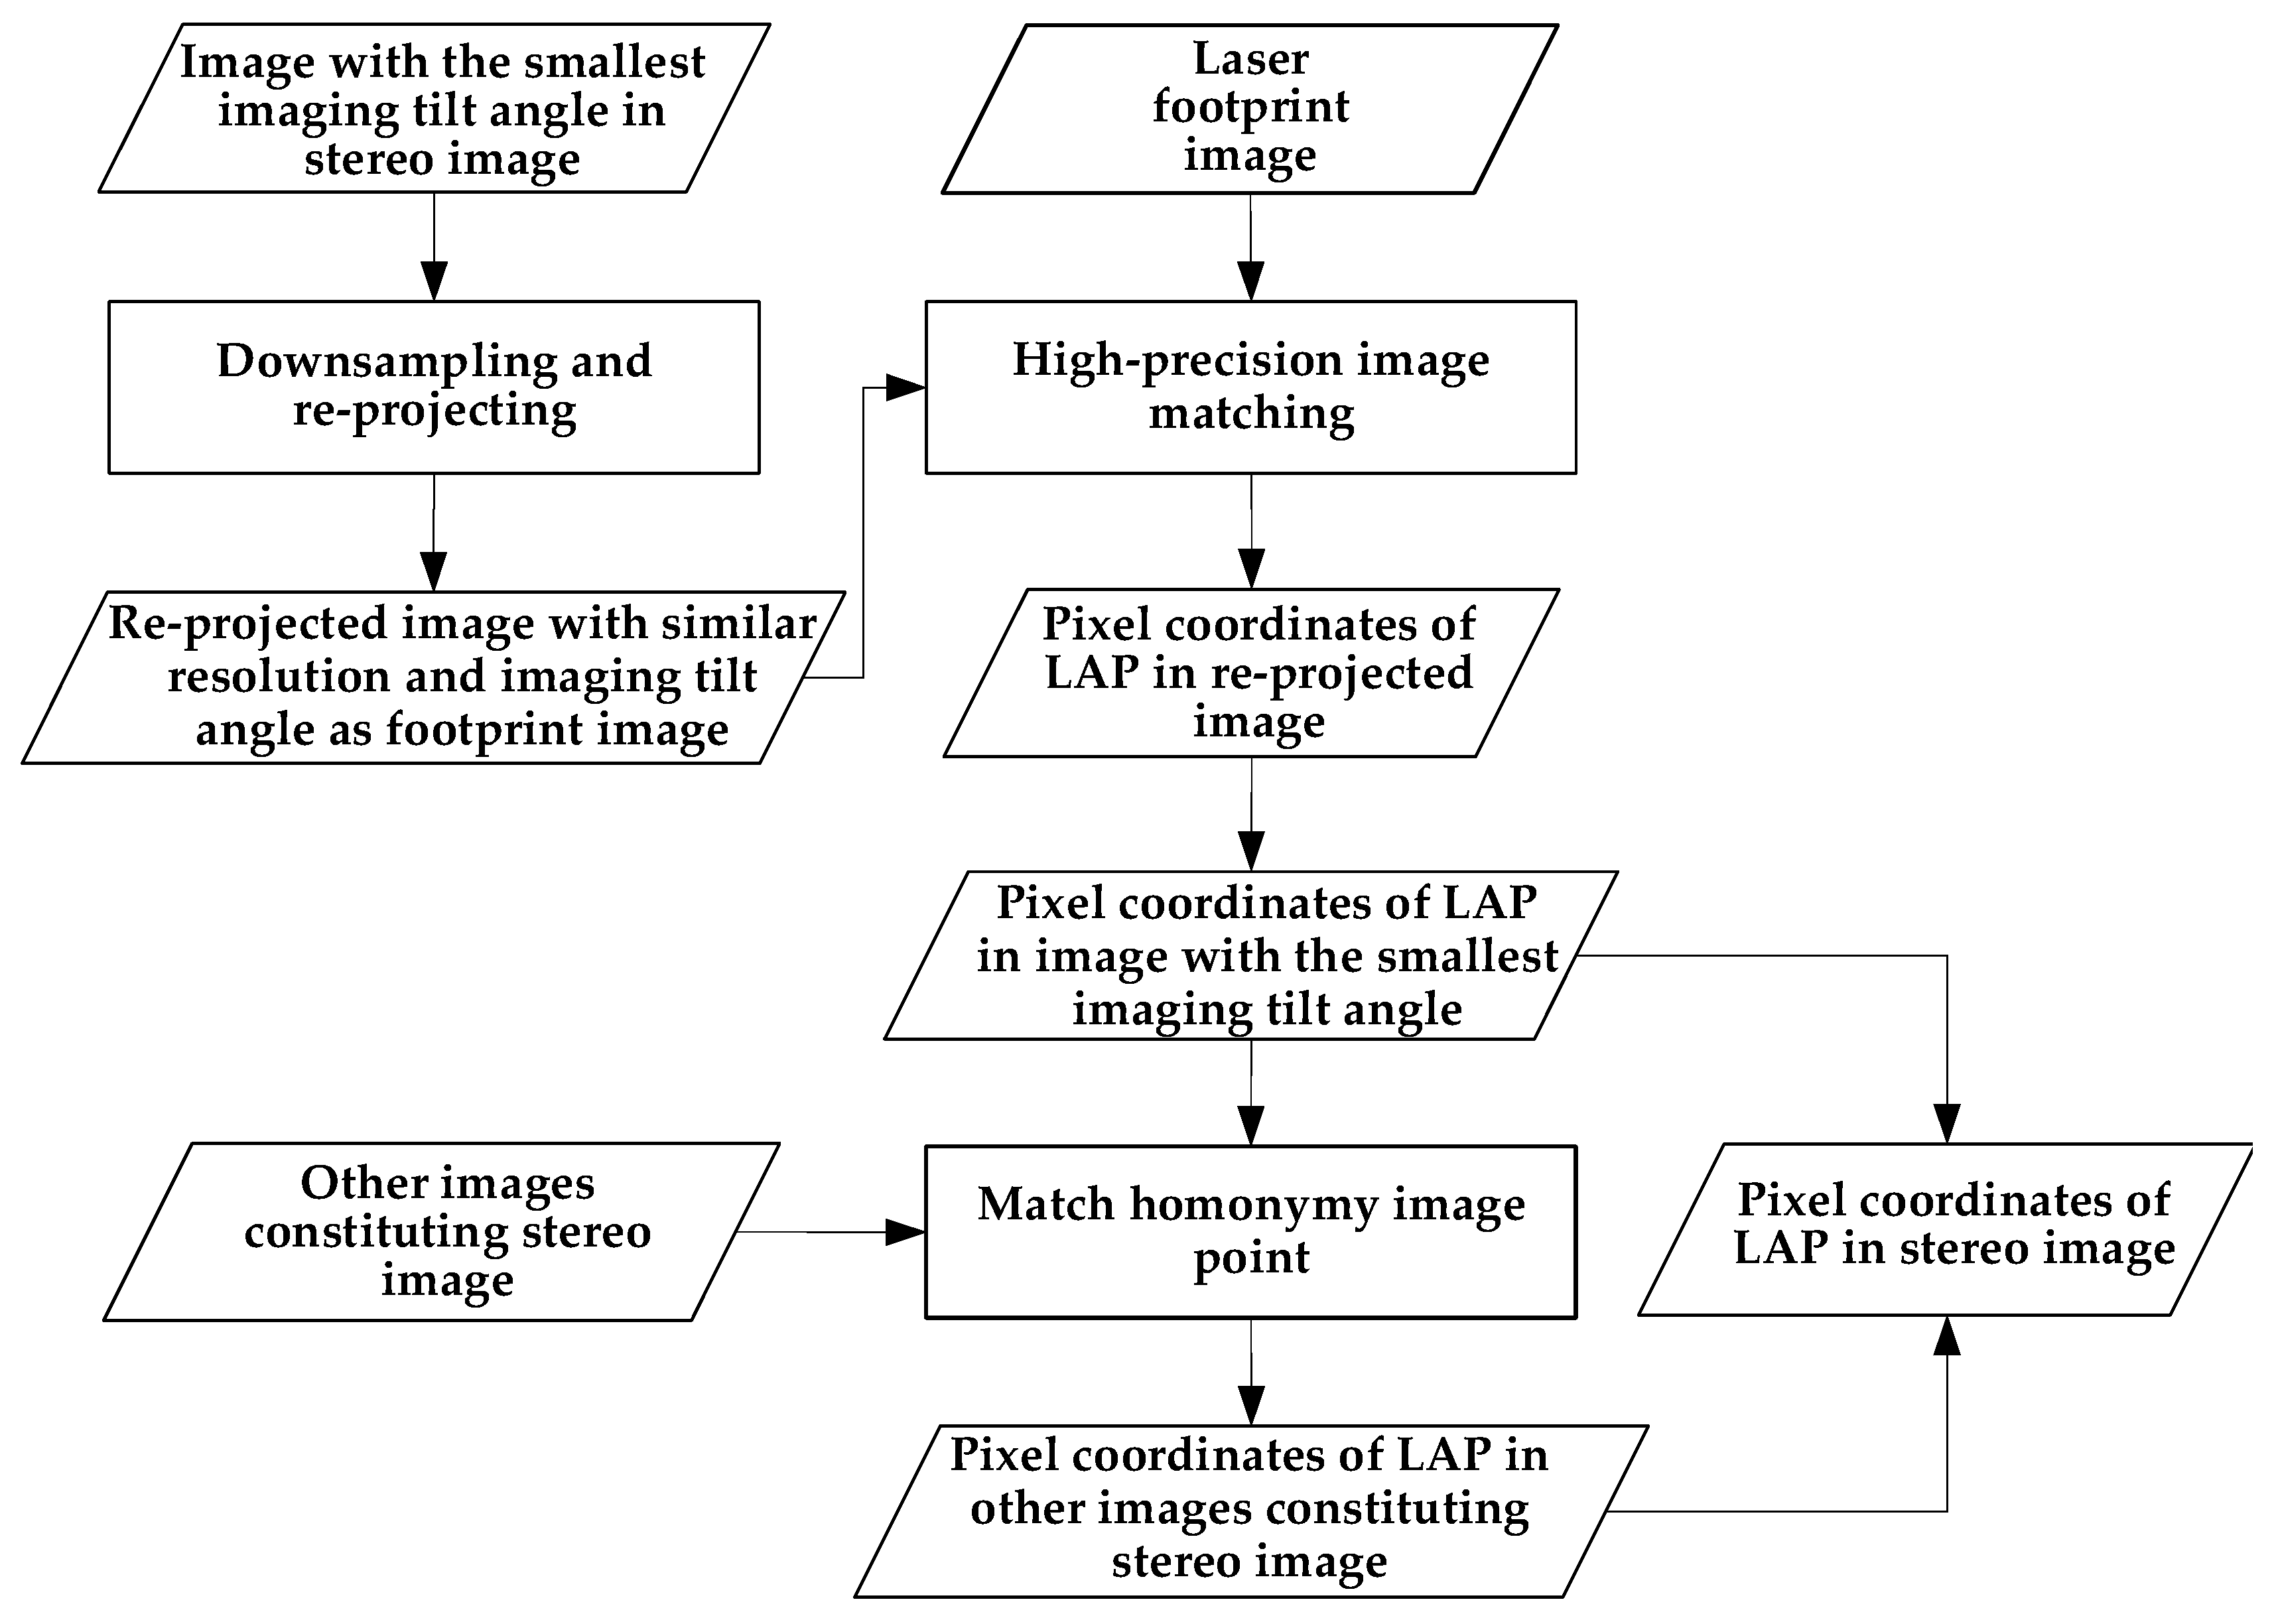
When the LAPs have footprint images (such as the GF7 LAPs), the corresponding image point of the LAP on the footprint image must be known (for the convenience of discussion, the corresponding image point is called the ‘laser image point on the footprint image’). The homonymy image point on the stereo image that corresponds to the laser image point on the footprint image can be obtained using high-precision image matching between the footprint and stereo images. The homonymy image point on the stereo image is the corresponding pixel coordinates of the LAP in the stereo image. The specific method is shown in Figure 3.
The specific steps are as follows:
  • According to the spatial resolution and imaging tilt angle of the laser footprint camera, the image with the smallest imaging tilt angle in the stereo image was down-sampled and re-projected to generate a re-projected image with a similar spatial resolution and imaging tilt angle as the footprint image. This improves the image matching success rate between the footprint and the stereo images.
  • Using a combination of scale-invariant feature transform (SIFT) matching [42] and least squares matching [43], image matching was performed between the re-projected image and the laser footprint image to obtain the homonymy image point on the re-projected image that corresponds to the laser image point on the footprint image. According to the corresponding relationship between the re-projected image and the original image before projection, the homonymy image point on the image with smallest imaging tilt angle that corresponds to the laser image point on the footprint image was calculated.
  • Using a combination of SIFT matching and least squares matching, image matching was performed between the image with the smallest imaging tilt angle and the other images constituting the stereo image to obtain the homonymy image points on the other images comprising the stereo image, corresponding to the image point of the LAP on the image with the smallest imaging tilt angle. The pixel coordinates of the homonymy image points in the stereo images are actually the pixel coordinates of the LAPs in the stereo images.

3.3.2. Measurement of LAPs when Footprint Image Cannot Be Used Successfully

Owing to the influence of terrain, clouds, and other factors, the accurate pixel coordinates in the stereo images of some LAPs cannot be successfully obtained using the method described above. For convenience, in the following description, these LAPs are abbreviated as ‘processing LAPs,’ whereas the LAPs that successfully yielded correct pixel coordinates in stereo images using the above method are abbreviated as ‘processed LAPs.’ As described in Section 3.1.2, when generating and distributing the LAPs, those with topographic relief and a rough ground surface within the footprint range were eliminated; therefore, the ground elevation within the footprint range of the LAPs is similar. Therefore, one tie point can be obtained within the footprint of the processing LAP on the stereo image and is then used as the pixel coordinates of the processing LAPs. The specific method is shown in Figure 4.
The specific steps are as follows:
1.
Equation (1) is used to obtain the horizontal relative error corrections Δ l o n and Δ l a t in the longitude and latitude directions between the processing LAP and the image with smallest imaging tilt angle.
Δ l o n = Δ l o n p r o + n N ( Δ l o n n e x t Δ l o n p r o ) Δ l a t = Δ l a t p r o + n N ( Δ l a t n e x t Δ l a t p r o ) ,
where Δ l o n p r o and Δ l a t p r o are the horizontal relative errors in the longitude and latitude directions, respectively, between the previous processed LAP acquired on the same orbit and the image with the smallest imaging tilt angle. Δ l o n n e x t and Δ l a t n e x t are the horizontal relative errors in the longitude and latitude directions between the latter processed LAP acquired on the same orbit and the image with the smallest imaging tilt angle. These are obtained by subtracting the longitude and latitude coordinates of the processed LAP from the ground longitude and latitude coordinates that were calculated using the pixel coordinates of the processed LAP in the image with the smallest imaging tilt angle to perform the spatial forward intersection. N is the theoretical number of LAPs between the previous and the latter processed LAPs acquired on the same orbit and by the same beam. n is the theoretical number of LAPs between the processing LAP and the previous processed LAP acquired on the same orbit and by the same beam. If the previous processed LAP does not exist, then n / N = 1 . If the latter processed LAP does not exist, then n / N = 0 .
2.
Using the longitude and latitude coordinates and the elevation values of the processing LAPs, the pixel coordinates of the processing LAPs in the image with the smallest imaging tilt angle are calculated using the imaging geometric model of the image. The pixel coordinates are also corrected using the Δ l o n and Δ l a t obtained in the previous step. According to the laser footprint radius, the pixel range of the ground footprint of the processing LAP on the image with the smallest imaging tilt angle can be obtained.
3.
The image matching between the image with the smallest imaging tilt angle and other constituent images of the stereo image is used to obtain multiple tie points. After eliminating the incorrect tie points, the tie point that is closest to the center point of the laser footprint and distributed within the range of the laser footprint on the image with the smallest imaging tilt angle is selected as the vertical control point, and its elevation is used as the elevation of the LAP.

3.4. Pixel Coordinate Measurement of LAPs without Footprint Image on Stereo Images

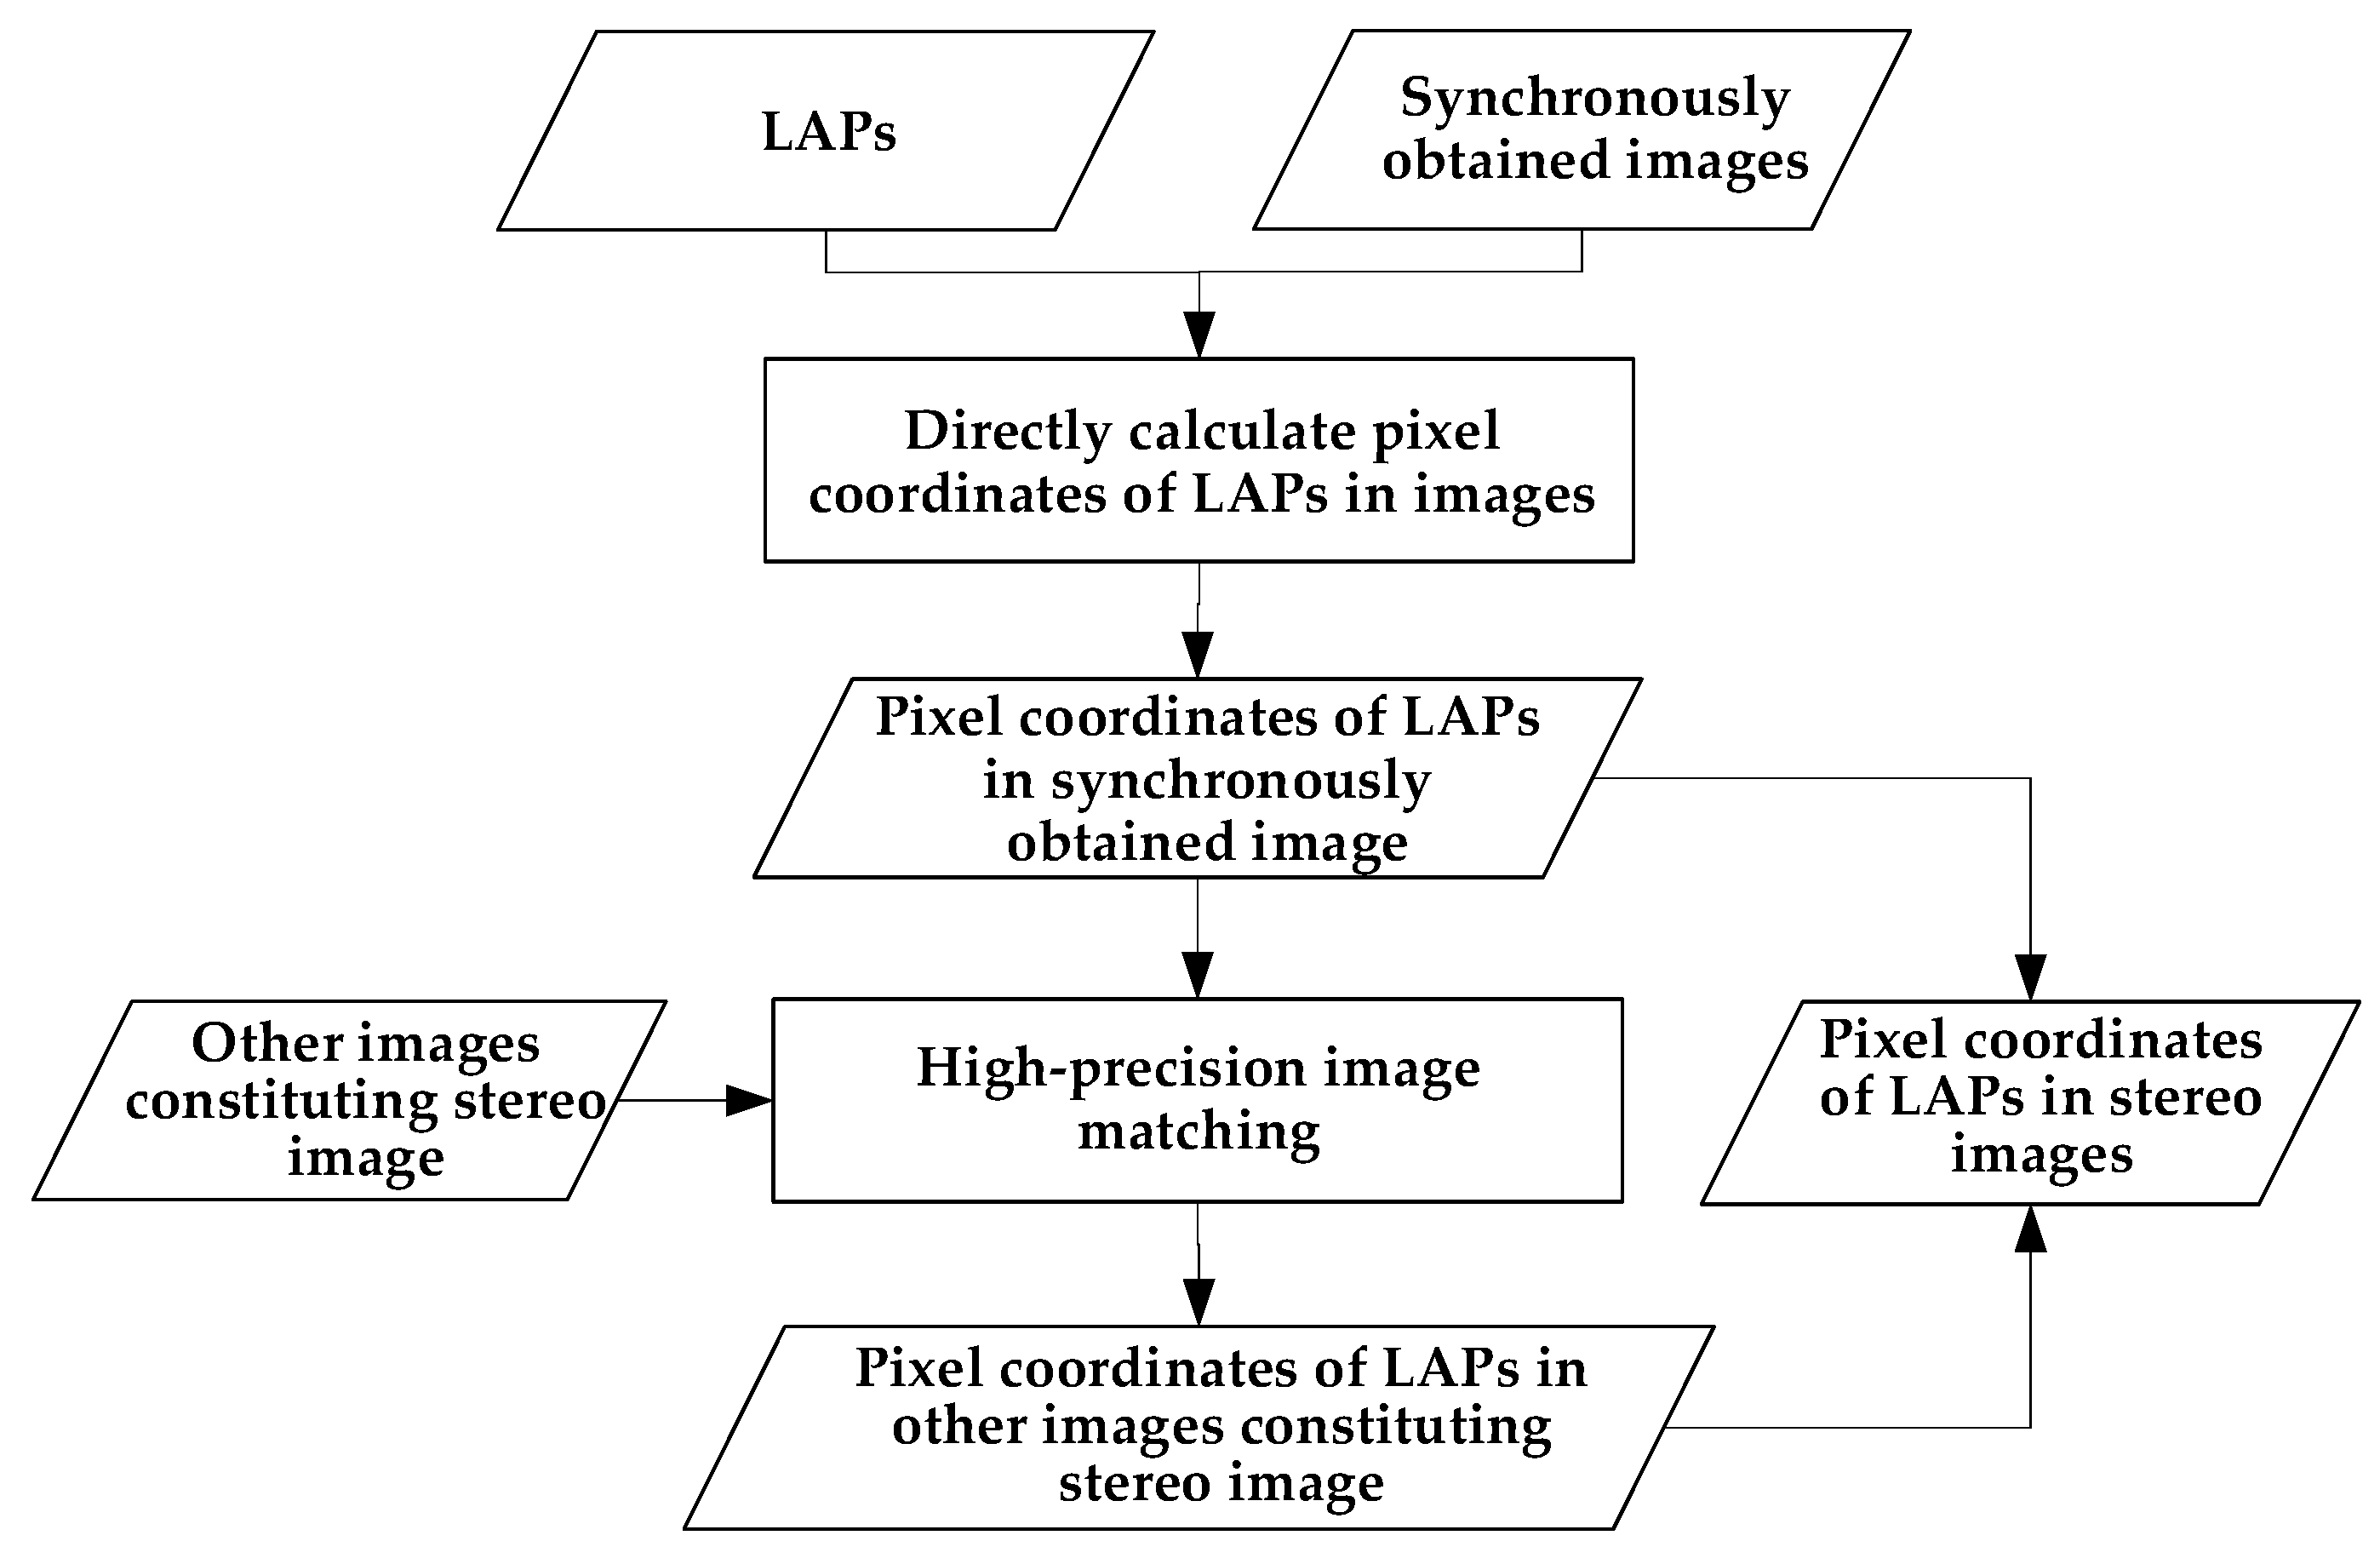
When the LAPs do not have corresponding footprint images (such as the ZY3-03 LAPs), the pixel coordinates of the LAP in the image can only be calculated using the longitude and latitude coordinates of the LAP. Currently, in satellite design, the laser pointing angle is generally consistent with the angle of the main optical axis of an optical camera, and the laser altimeter works simultaneously with the optical camera (for convenience, the images obtained by the optical camera are called ‘synchronously obtained images’). This design allows the laser altimeter and optical camera to work under the influence of the same external error (such as attitude measurement error) and ensures that the LAPs and the synchronously obtained image have a higher relative horizontal accuracy. For example, the horizontal RMSEs of the ZY3-03 LAPs are almost the same as those of the synchronously obtained ZY3-03 nadir images [41], whereas the relative horizontal error is approximately 0. The specific method is shown in Figure 5.
The specific steps are as follows:
  • According to the longitude and latitude coordinates and the elevations of the LAPs, the pixel coordinates of the LAP on the synchronously obtained image can be calculated directly using the RFM of the image.
  • A combination of SIFT feature matching and least squares matching is used to perform high-precision image matching of the stereo images. On the other constituent images of the stereo image, the homonymy points of the pixel coordinates of the LAPs in the synchronously obtained image were obtained, i.e., the accurate pixel coordinates of the LAPs in the stereo image were obtained.
It should be noted that the control points obtained using the above method can only be used as vertical control points.

3.5. Combined Block Adjustment Model

The geometric model of the SC images is the RFM; thus, the combined block adjustment is based on the RFM. The RFM is a mathematical transformation relationship between the image pixel coordinates (r, c) and their corresponding geodetic coordinates on the ground (X, Y, Z) established by rational polynomials. The basic equation of the RFM is defined as follows [44]:
{ r = P 1 ( X , Y , Z ) P 2 ( X , Y , Z ) c = P 3 ( X , Y , Z ) P 4 ( X , Y , Z ) ,
where, to avoid rounding errors caused by large order of magnitude differences between the different parameters in the calculation process, (r, c) and (X, Y, Z) need to be normalized to −1–1 to enhance the stability of the parameter solution. P i ( i = 1 , 2 , 3 , 4 ) represents a general polynomial in which the power of each variable does not exceed 3, and the sum of the powers of all variables does not exceed 3. Its form is as follows:
P i = a i 0 + a i 1 Z + a i 2 Y + a i 3 X + a i 4 Z Y + a i 5 Z X + a i 6 Y X + a i 7 Z 2 + a i 8 Y 2 + a i 9 X 2 + a i 10 Z Y X +   a i 11 Z 2 Y + a i 12 Z 2 X + a i 13 Y 2 Z + a i 14 Y 2 X + a i 15 Z X 2 + a i 16 Y X 2 + a i 17 Z 3 + a i 18 Y 3 + a i 19 X 3 ,
where a i j ( i = 1 , 2 , 3 , 4 ; j = 0 , 1 , , 19 ) is the rational polynomial coefficient.
The error compensation of the RFM adopts the image affine transformation model [44,45], and the relationship between the image pixel coordinates and the corresponding geodetic coordinates described in Equation (2) can be corrected as follows:
{ r + a 0 + a 1 r + a 2 c = P 1 ( X , Y , Z ) P 2 ( X , Y , Z )   c + b 0 + b 1 r + b 2 c = P 3 ( X , Y , Z ) P 4 ( X , Y , Z ) ,
where ( a 0 , a 1 , a 2 , b 0 , b 1 , b 2 ) represent affine transformation parameters.
The error equations are constructed for each of the tie points and LAPs to form the combined block adjustment model:
V 1 = A t + B 1 x 1 L 1 P 1 ,
V 2 = A t + B 2 x 2 L 2 P 2 ,
Equation (5) is an error equation constructed for the tie point that uses the affine transformation parameters of the RFM and the ground geodetic coordinates corresponding to the tie points as unknowns. Equation (6) is an error equation constructed for the LAPs. When the LAPs are used as the horizontal and vertical control points, the affine transformation parameters of the RFM are used as the unknowns. When the LAPs are only used as the vertical control points, the affine transformation parameters of the RFM and the ground longitude and latitude coordinates of the LAPs were used as unknowns.
In Equations (5) and (6), V 1 = [ v R 1   v C 1 ] T and V 2 = [ v R 2   v C 2 ] T are the residual vectors of the image point coordinate observations of the tie points and in the image, respectively. t = [ Δ a 0   Δ a 1   Δ a 2   Δ b 0   Δ b 1   Δ b 2     ] T is the corrected vector of the affine transformation parameters. A = [ 1 r c 0 0 0 0 0 0 1 r c ] is the partial derivative coefficient matrix corresponding to t. x 1 = [ Δ X t i e   Δ Y t i e   Δ Z t i e ] T is the corrected vector of the ground geodetic coordinates corresponding to the tie point. B 1 = [ r X t i e r Y t i e r Z t i e c X t i e c Y t i e c Z t i e ] is the partial derivative coefficient matrix corresponding to x 1 . When LAPs are used as the horizontal and vertical control points, x 2 = 0 . When a LAP is only used as the vertical control point, x 2 = [ Δ X l a s e r   Δ Y l a s e r ] T is the corrected vector of the ground latitude and longitude of the LAP and B 2 = [ r X l a s e r r Y l a s e r c X l a s e r c Y l a s e r ] is the partial derivative coefficient matrix corresponding to x 2 . L i ( i = 1 , 2 ) is the constant term calculated by substituting the initial value into the error equation. P i ( i = 1 , 2 ) is the weight matrix of each observation, and the weights of each observation are determined by their priori information. Generally, 10 times the a priori standard deviation of each observation was used to determine the initial value of the corresponding observation weight, and each observation weight was recalculated after each adjustment iteration.

4. Results and Discussion

4.1. Experimental Regions and Data

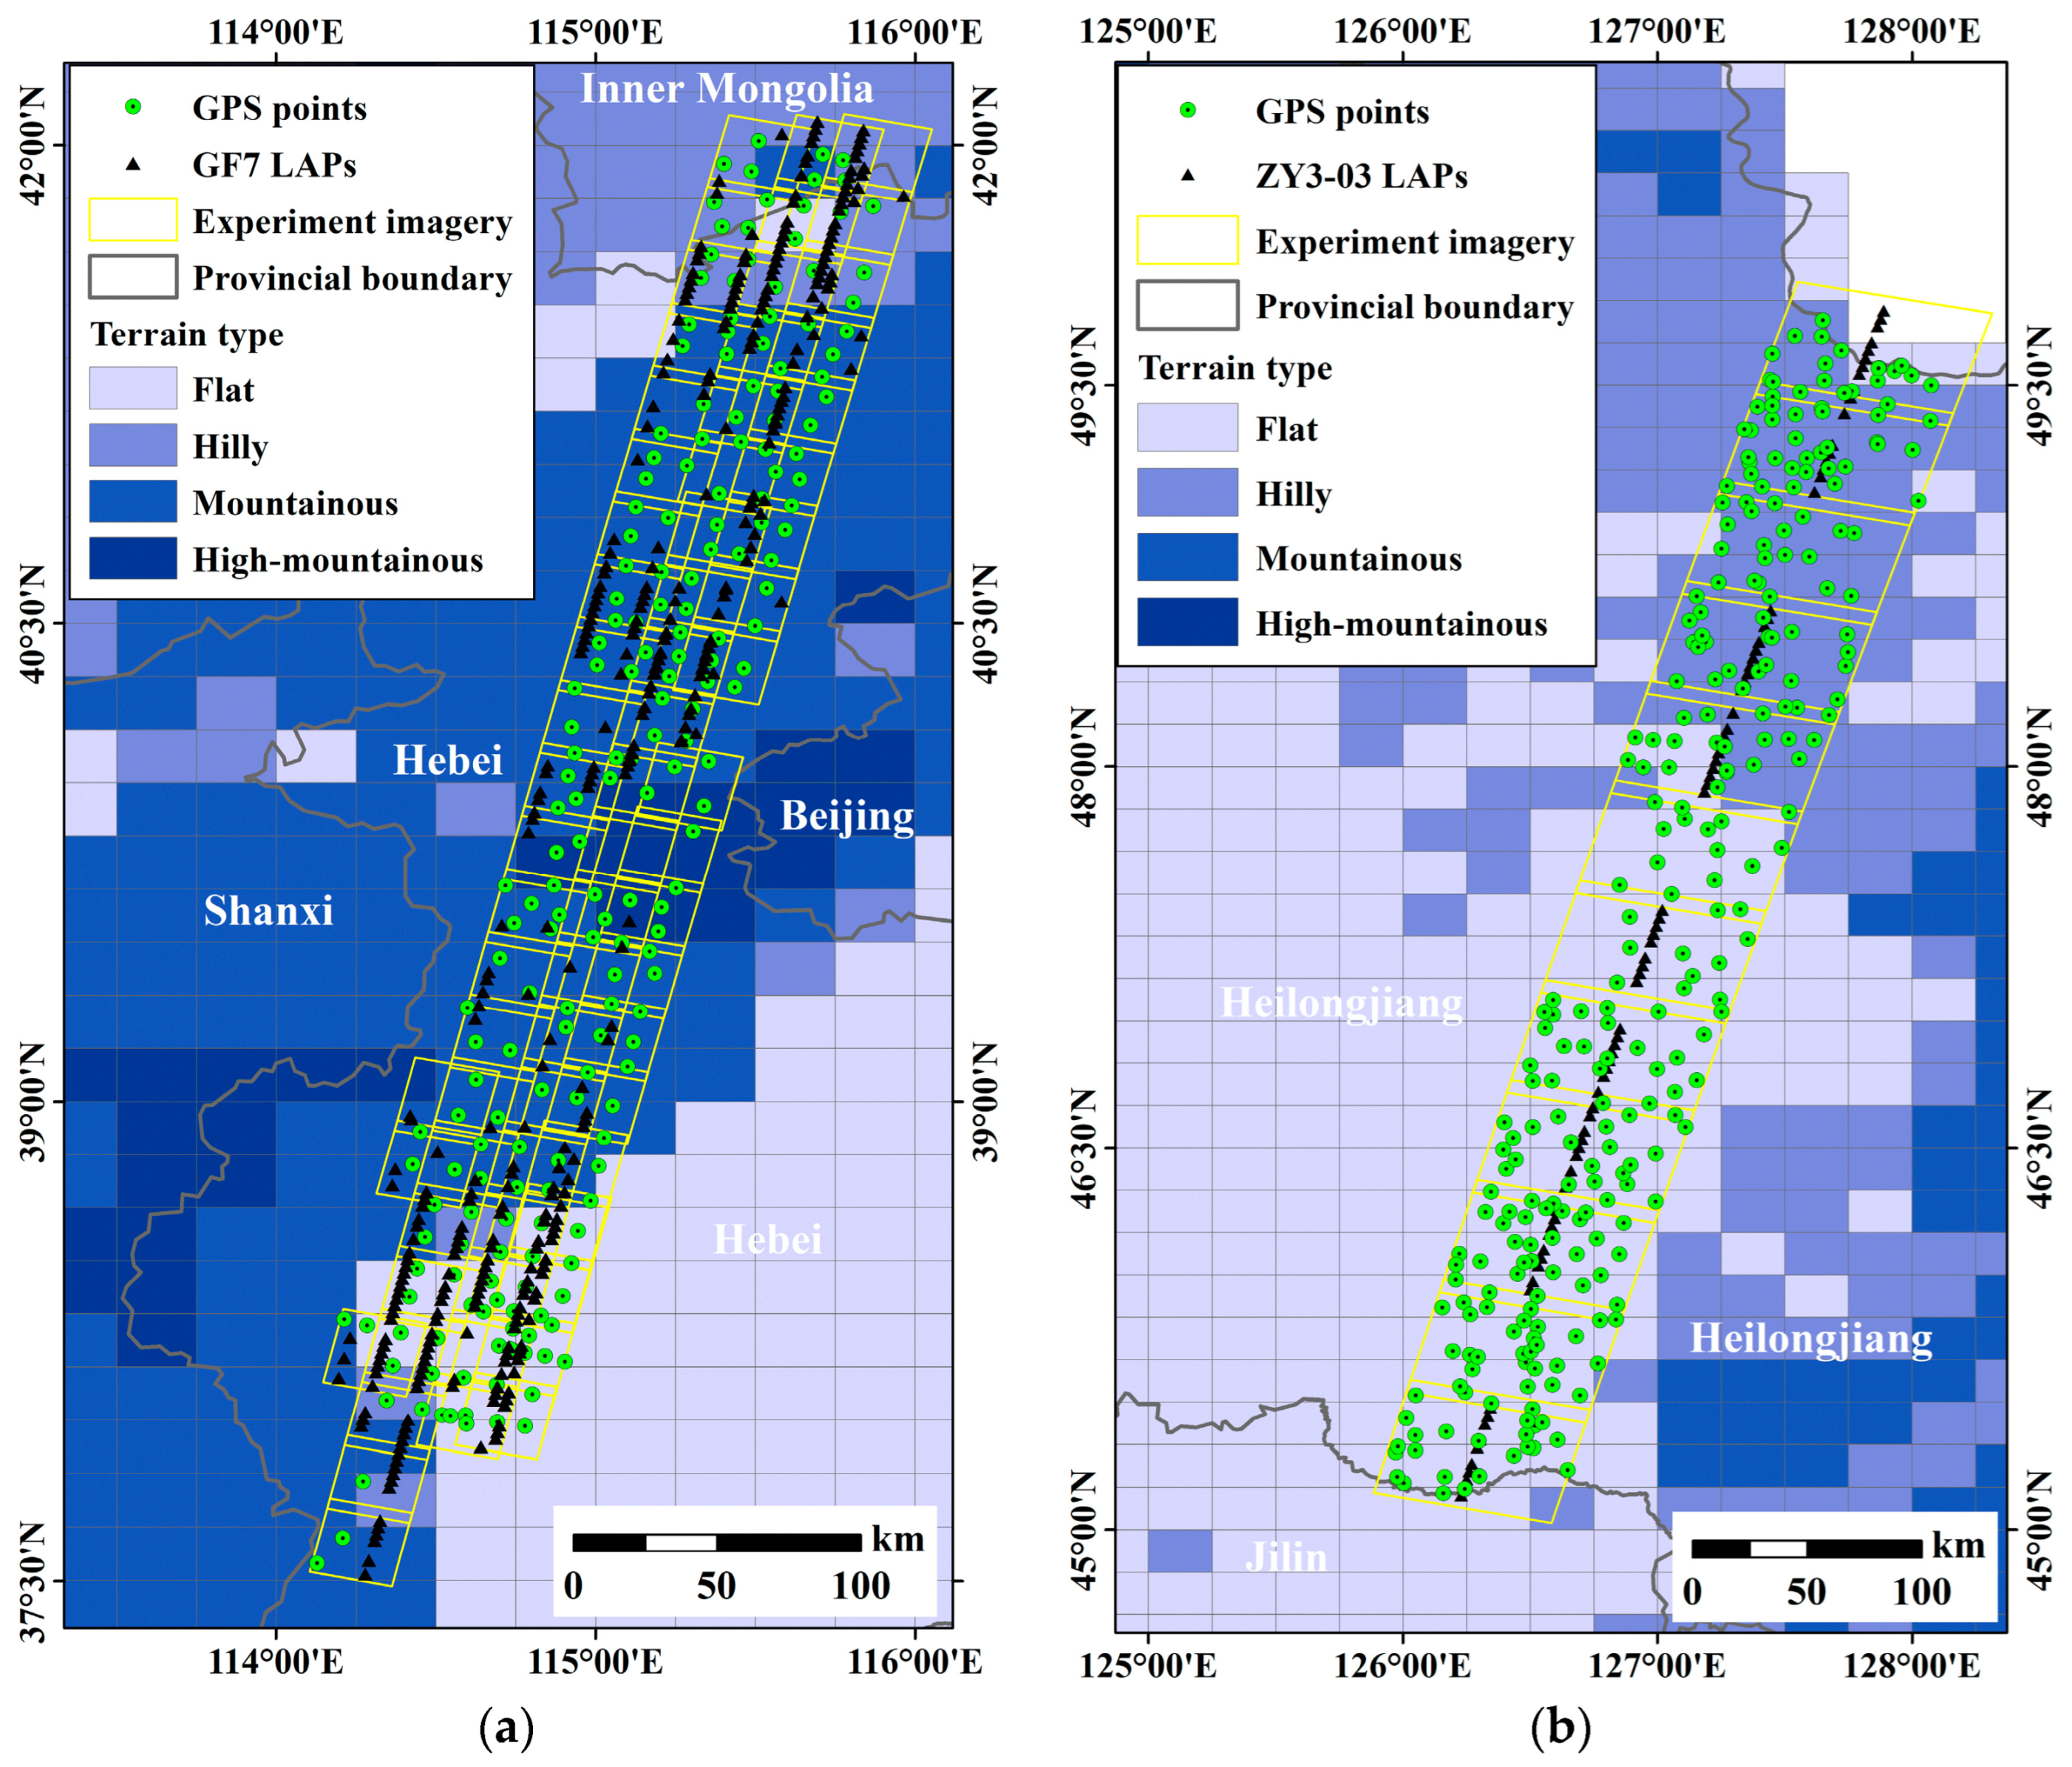
The GF7 SC stereo images and LAPs covering the northern region of Hebei Province, China, and ZY3-03 SC stereo images and LAPs covering the central region of Heilongjiang Province were selected as the experimental data in this study. According to the requirements of the proposed integrated processing method, the ZY3-03 LAPs do not have footprint images; thus, integrated processing must be performed using synchronously obtained LAPs and stereo images. In contrast, the GF7 LAPs have footprint images; thus, integrated processing can be performed using LAPs and stereo images obtained at different times. The Global Positioning System (GPS) points measured by continuously operating reference stations in the study regions were collected as check points for geometric accuracy verification. The horizontal and vertical accuracies of the GPS points were better than 0.1 m. To ensure that the GPS points could be identified accurately and measured in the experimental images, the collected GPS points were distributed mainly at the intersections of fine linear features with suitable intersection angles (30°–150°) and at the corners of obvious feature, such as road intersections and corners of artificial surface features. The details of the data used in the study are shown in Table 1.
Owing to the influence of weather, satellite side-swing, and other factors, only one set of GF7 LAPs and GF7 stereo images in the experimental data were obtained from the same orbit, whereas the others were obtained from different orbits.
The terrain types of the regions covered by the experimental data were determined according to those illustrated in the 1:50,000 scale topographic maps of China. According to the terrain type classification principles in China’s surveying and mapping standards, the Chinese surveying and mapping department has classified each 1:50,000 scale topographic map into four terrain types: flat, hilly, mountainous, or high mountainous. The ground elevations in the regions covered by the GF7 satellite experimental data ranged from 50 m to 3000 m above sea level, whereas the ground elevations in the regions covered by the ZY3-03 satellite experimental data ranged from 120 m to 510 m above sea level. The geographical distributions of the experimental regions and data are shown in Figure 6.
In addition, the ATLAS LAPs (obtained from January 2020 to the present in the coverage area of the GF7 experiment image) and all available GLAS LAPs (obtained from 2003–2009 in the coverage area of the ZY3-03 experiment image) were collected for combined block adjustment experiments with GF7 and ZY3-03 experiment images. The product level of GLAS LAPs is GLA14 (i.e., global land-surface altimeter data), and that of ATLAS LAPs is ATL08. The results of this adjustment were compared to those of the integrated processing of stereo images and LAPs obtained by the same satellite, which not only proved the advantages of using the data obtained from the same satellite to perform integrated processing but also verified the effectiveness of the method proposed in this study. In order to ensure the accuracy of the selected ATLAS and GLAS LAPs, the LAPs with low precision were eliminated by comprehensively analyzing the LAP parameter information such as beam type, signal-to-noise ratio, terrain, and slope [46]. Then an elevation comparison was made between the LAPs and the TanDEM-X data [47], and the LAPs with an elevation difference greater than 2 m were eliminated. Finally, a total of 8824 ATLAS LAPs and 8528 GLAS LAPs were retained. The geographical distribution of ATLAS and GLAS LAPs is shown in Figure 7.

4.2. Initial Stereo Images and LAPs Accuracy Verification

4.2.1. Initial Image Geometric Accuracy Verification

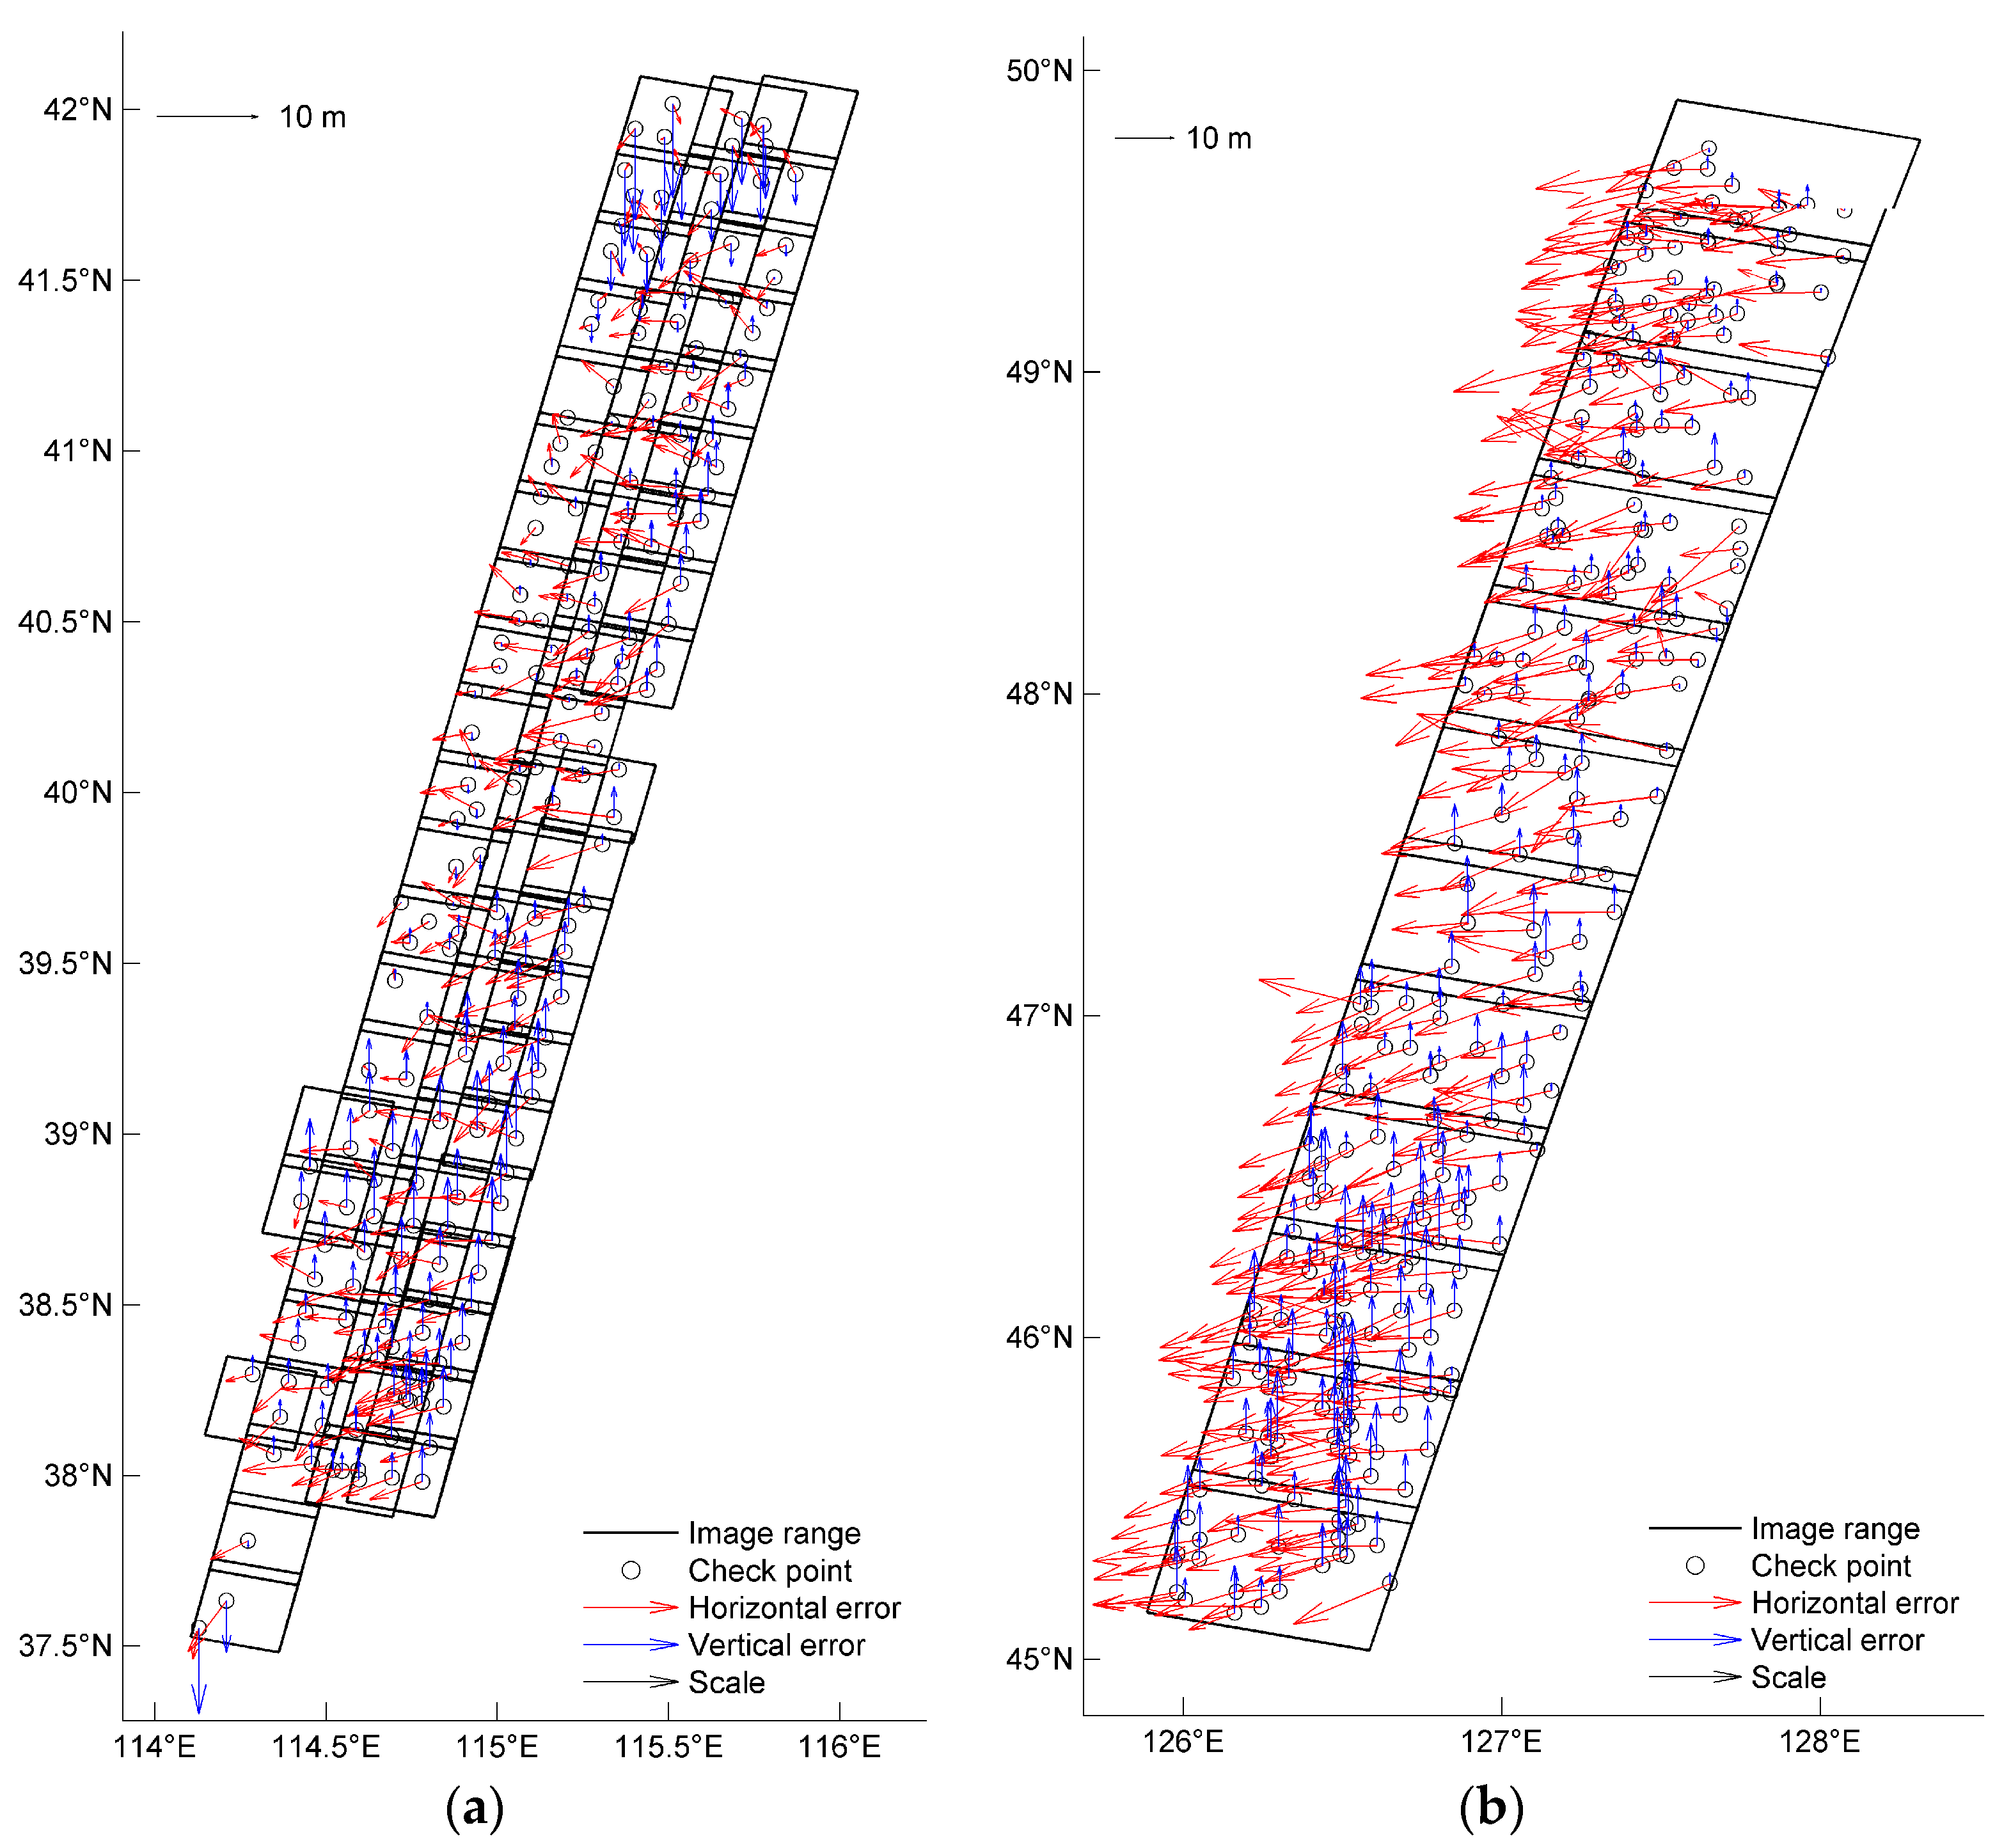
The GPS points were used as check points (the pixel coordinates of the GPS points in the stereo images were obtained manually, with a measurement accuracy better than 1 pixel) and the free network adjustment was performed for the GF7 and ZY3-03 images using Equation (5). In the experiment, the evenly distributed tie points were matched using image matching technology [48] in the interiors of the stereo images and in the overlapping regions of adjacent stereo images. The density of the tie points was approximately 200 points within the range of each stereo image. The experimental results are shown in Table 2, and the check point residuals are shown in Figure 8.
Table 2 shows that the horizontal accuracy of the GF7 stereo images can meet the accuracy requirements for 1:10,000 scale mapping in China; however, the vertical accuracy does not meet these accuracy requirements in flat and hilly terrain. In addition, the horizontal accuracy of the ZY3-03 stereo images can meet the accuracy requirements for 1:50,000 scale mapping in China; however, the vertical accuracy does not meet these accuracy requirements. The accuracy requirements for 1:50,000 and 1:10,000 scale mapping in China are listed in Table 3 [49].

4.2.2. Initial LAP Geometric Accuracy Verification

Because no GPS point distributions were available within the ground footprint ranges of the LAPs, it was impossible to directly use the GPS points to verify the geometric accuracy of the LAPs, so an indirect accuracy detection and evaluation method was used to verify their geometric accuracy. The pixel coordinates of the GF7 LAPs in the GF7 stereo images were measured using the method described in Section 3.3.1, whereas the pixel coordinates of ZY3-03 LAPs in the ZY3-03 stereo images were measured using the method described in Section 3.4. The LAPs that were successfully measured were used as check points to check the vertical accuracies of the GF7 and ZY3-03 stereo images after the free network adjustment. The results are listed in Table 4.
The difference between the vertical RMSEs of the GF7 images in each terrain type region (Table 4) and the corresponding values listed in Table 2 were within ±0.13 m. It is known that the vertical accuracy of the GPS points is better than 0.1 m. Therefore, the vertical accuracy of the GF7 LAPs should be at least better than the absolute value of 0.1 ± 0.13 m that exceeds the vertical accuracy requirements for 1:10,000 scale stereo mapping and was far higher than the actual vertical accuracy of the GF7 stereo images. In contrast, the difference between the vertical RMSEs of the ZY3-03 images in each terrain type region (Table 4) and the corresponding values in Table 2 were within 0.5 m. Therefore, the vertical accuracy of the ZY3-03 LAPs should be at least better than the absolute value of 0.1 ± 0.5 m that exceeds the vertical accuracy requirements for 1:50,000 scale stereo mapping and was far higher than the actual vertical accuracy of the ZY3-03 stereo images.
In the GF7 experimental data, only one orbit of stereo images (that included 21 continuous stereo images) and one orbit of LAPs (that included 75 LAPs) were synchronously obtained from the same photographic orbit of the GF-7 satellite (orbit no. 3267). Because the relative horizontal error between the LAPs and the stereo images obtained from different orbits was irregular, we did not determine the relative plane accuracy between them. The LAPs from orbit 3267 were measured on the stereo images from orbit 3267 using the method described in Section 3.3.1, and 66 LAPs were successfully measured and used as check points to verify the horizontal accuracy of the stereo images. The results are listed in Table 5.
The horizontal RMSE of each terrain type region (Table 5) was less than 0.4 m, which indicates that the horizontal accuracy of the GF7 LAPs was consistent with that of the stereo images. The maximum error (Table 5) was similar to the RMSE, which indicates that the horizontal accuracy between different LAPs was almost the same.

4.3. Integrated Processing Accuracy Verification

According to the processing steps described in Section 3.2, the following four groups of experiments were performed on the GF7 experimental data:
  • The GF7 LAPs were measured on the GF7 stereo images using the method described in Section 3.3 and were utilized as vertical control points. All GPS points were used as check points, and block adjustment was performed using the block adjustment model described in Section 3.5. This group of experiments was used to verify whether the GF7 LAPs effectively improved the vertical accuracy of the stereo images.
  • The GF7 LAPs were measured on the GF7 stereo images using the method described in Section 3.3.1 and were utilized as horizontal and vertical control points. All GPS points were used as check points and block adjustment was performed using the block adjustment model described in Section 3.5. This group of experiments was used to verify whether the GF7 LAPs effectively improved the horizontal and vertical accuracies of the stereo images simultaneously.
  • Fifty-seven GPS points were selected as horizontal and vertical control points, and the remaining GPS points were used as check points to perform block adjustment of the GF7 stereo images. This group of experiments was used to reflect the accuracy level that can be achieved for stereo images when high-precision ground control points are available.
  • The pixel coordinates of all ATLAS LAPs in the GF7 stereo images were measured, and the ATLAS LAPs were used as vertical control points. All GPS points were taken as checkpoints and the combined block adjustment model described in Section 3.5 was used to conduct block adjustment of stereo images. This group of experiments was used to verify the accuracy level of integrated processing using LAPs and stereo images obtained from different satellites, which reflects the actual effect of using the traditional integration method. The measurement method of the pixel coordinates of LAPs in this group of experiments is as follows. First, the pixel coordinates of the ATLAS LAPs in the GF7 backward image were calculated through the longitude, latitude, and elevation parameters of the LAPs. Then, through high-precision image matching between the GF7 forward image and backward image, the corresponding pixel coordinates of the ATLAS LAPs in the forward image were obtained.
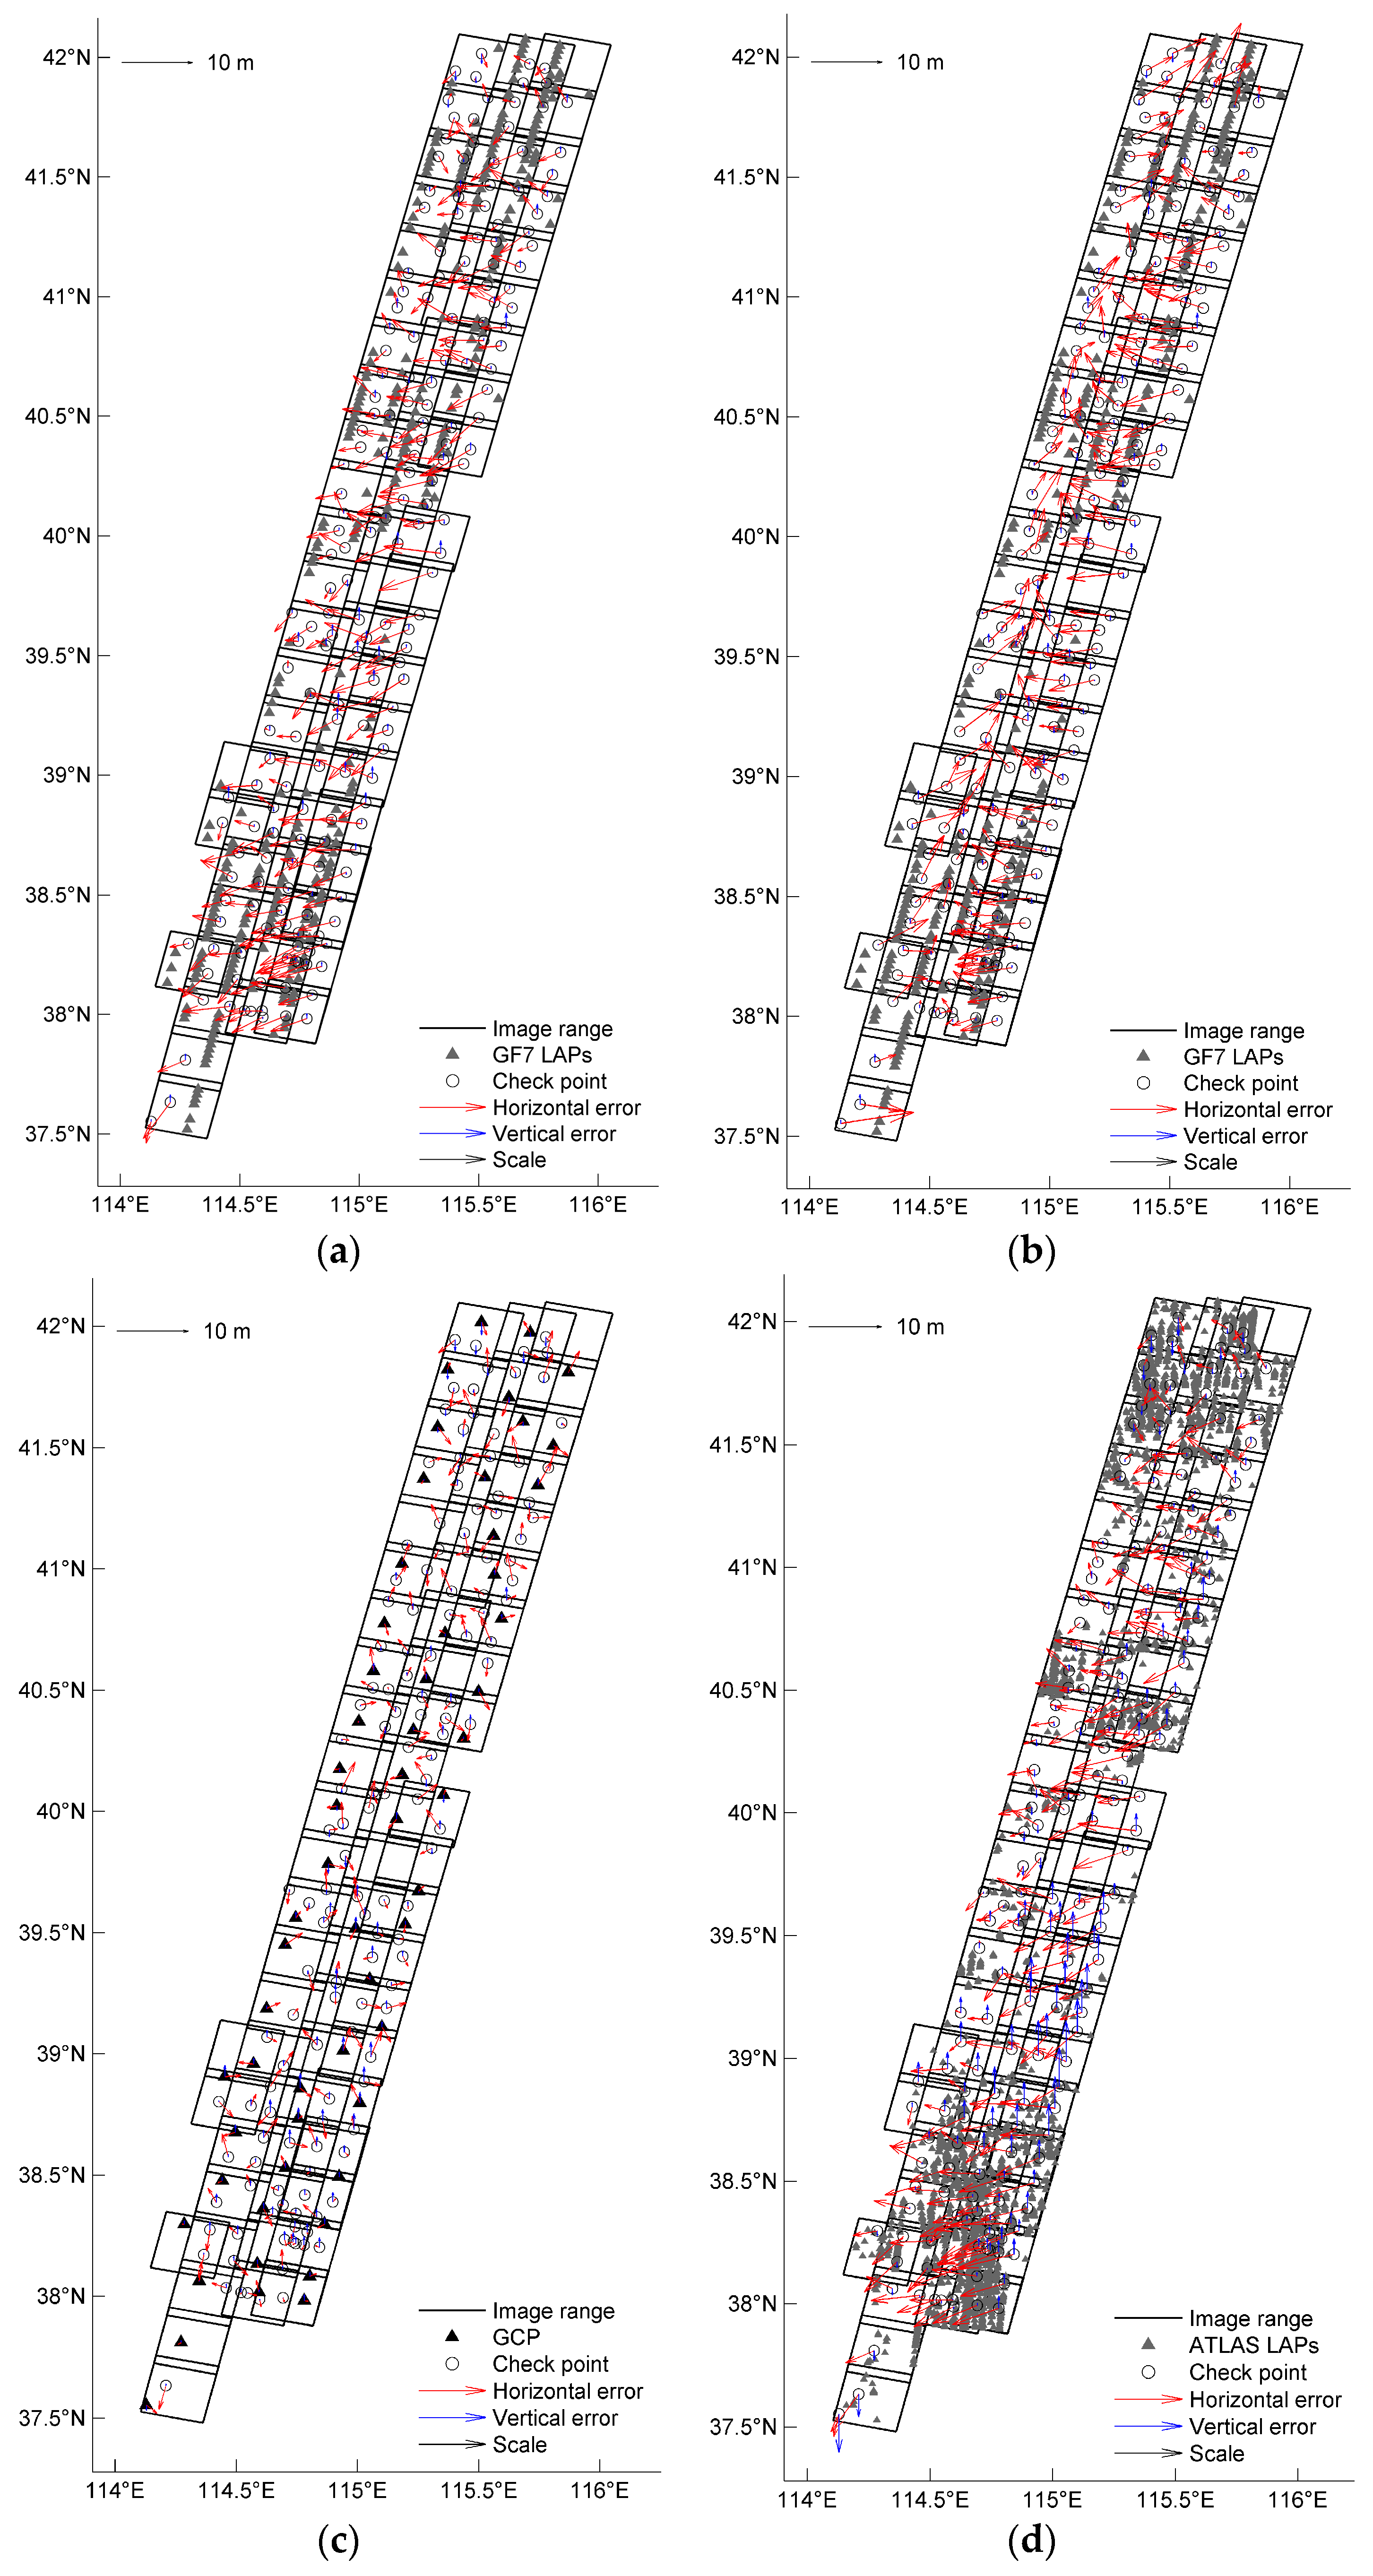
The experimental results are presented in Table 6, Table 7, Table 8 and Table 9, and the residuals of the check points are presented in Figure 9.
According to the processing steps described in Section 3.2, the following three groups of experiments were performed on the ZY3-03 experimental data:
  • The ZY3-03 LAPs were measured on the ZY3-03 stereo images using the method described in Section 3.4 and were used as vertical control points. All GPS points were used as check points, and the block adjustment model described in Section 3.5 was applied to perform block adjustment.
  • Fourteen GPS points were selected as horizontal and vertical control points, and the remaining GPS points were used as check points to perform block adjustment of the ZY3-03 stereo images.
  • The pixel coordinates of all the GLAS LAPs in the ZY3-03 stereo image were measured and used as vertical control points. Taking all GPS points as check points, the block adjustment of stereo images was conducted using the combined block adjustment model described in Section 3.5. The measurement method of the pixel coordinates of LAPs in this group of experiments is as follows. First, the pixel coordinates of the GLAS LAPs in the ZY3-03 Nadir image were calculated through the longitude, latitude, and elevation parameters of the LAPs. Then, through high-precision image matching between the ZY3-03 forward image and the Nadir image, and between the backward image and the Nadir image, the corresponding pixel coordinates of the LAPs in the forward image and the backward image were obtained.
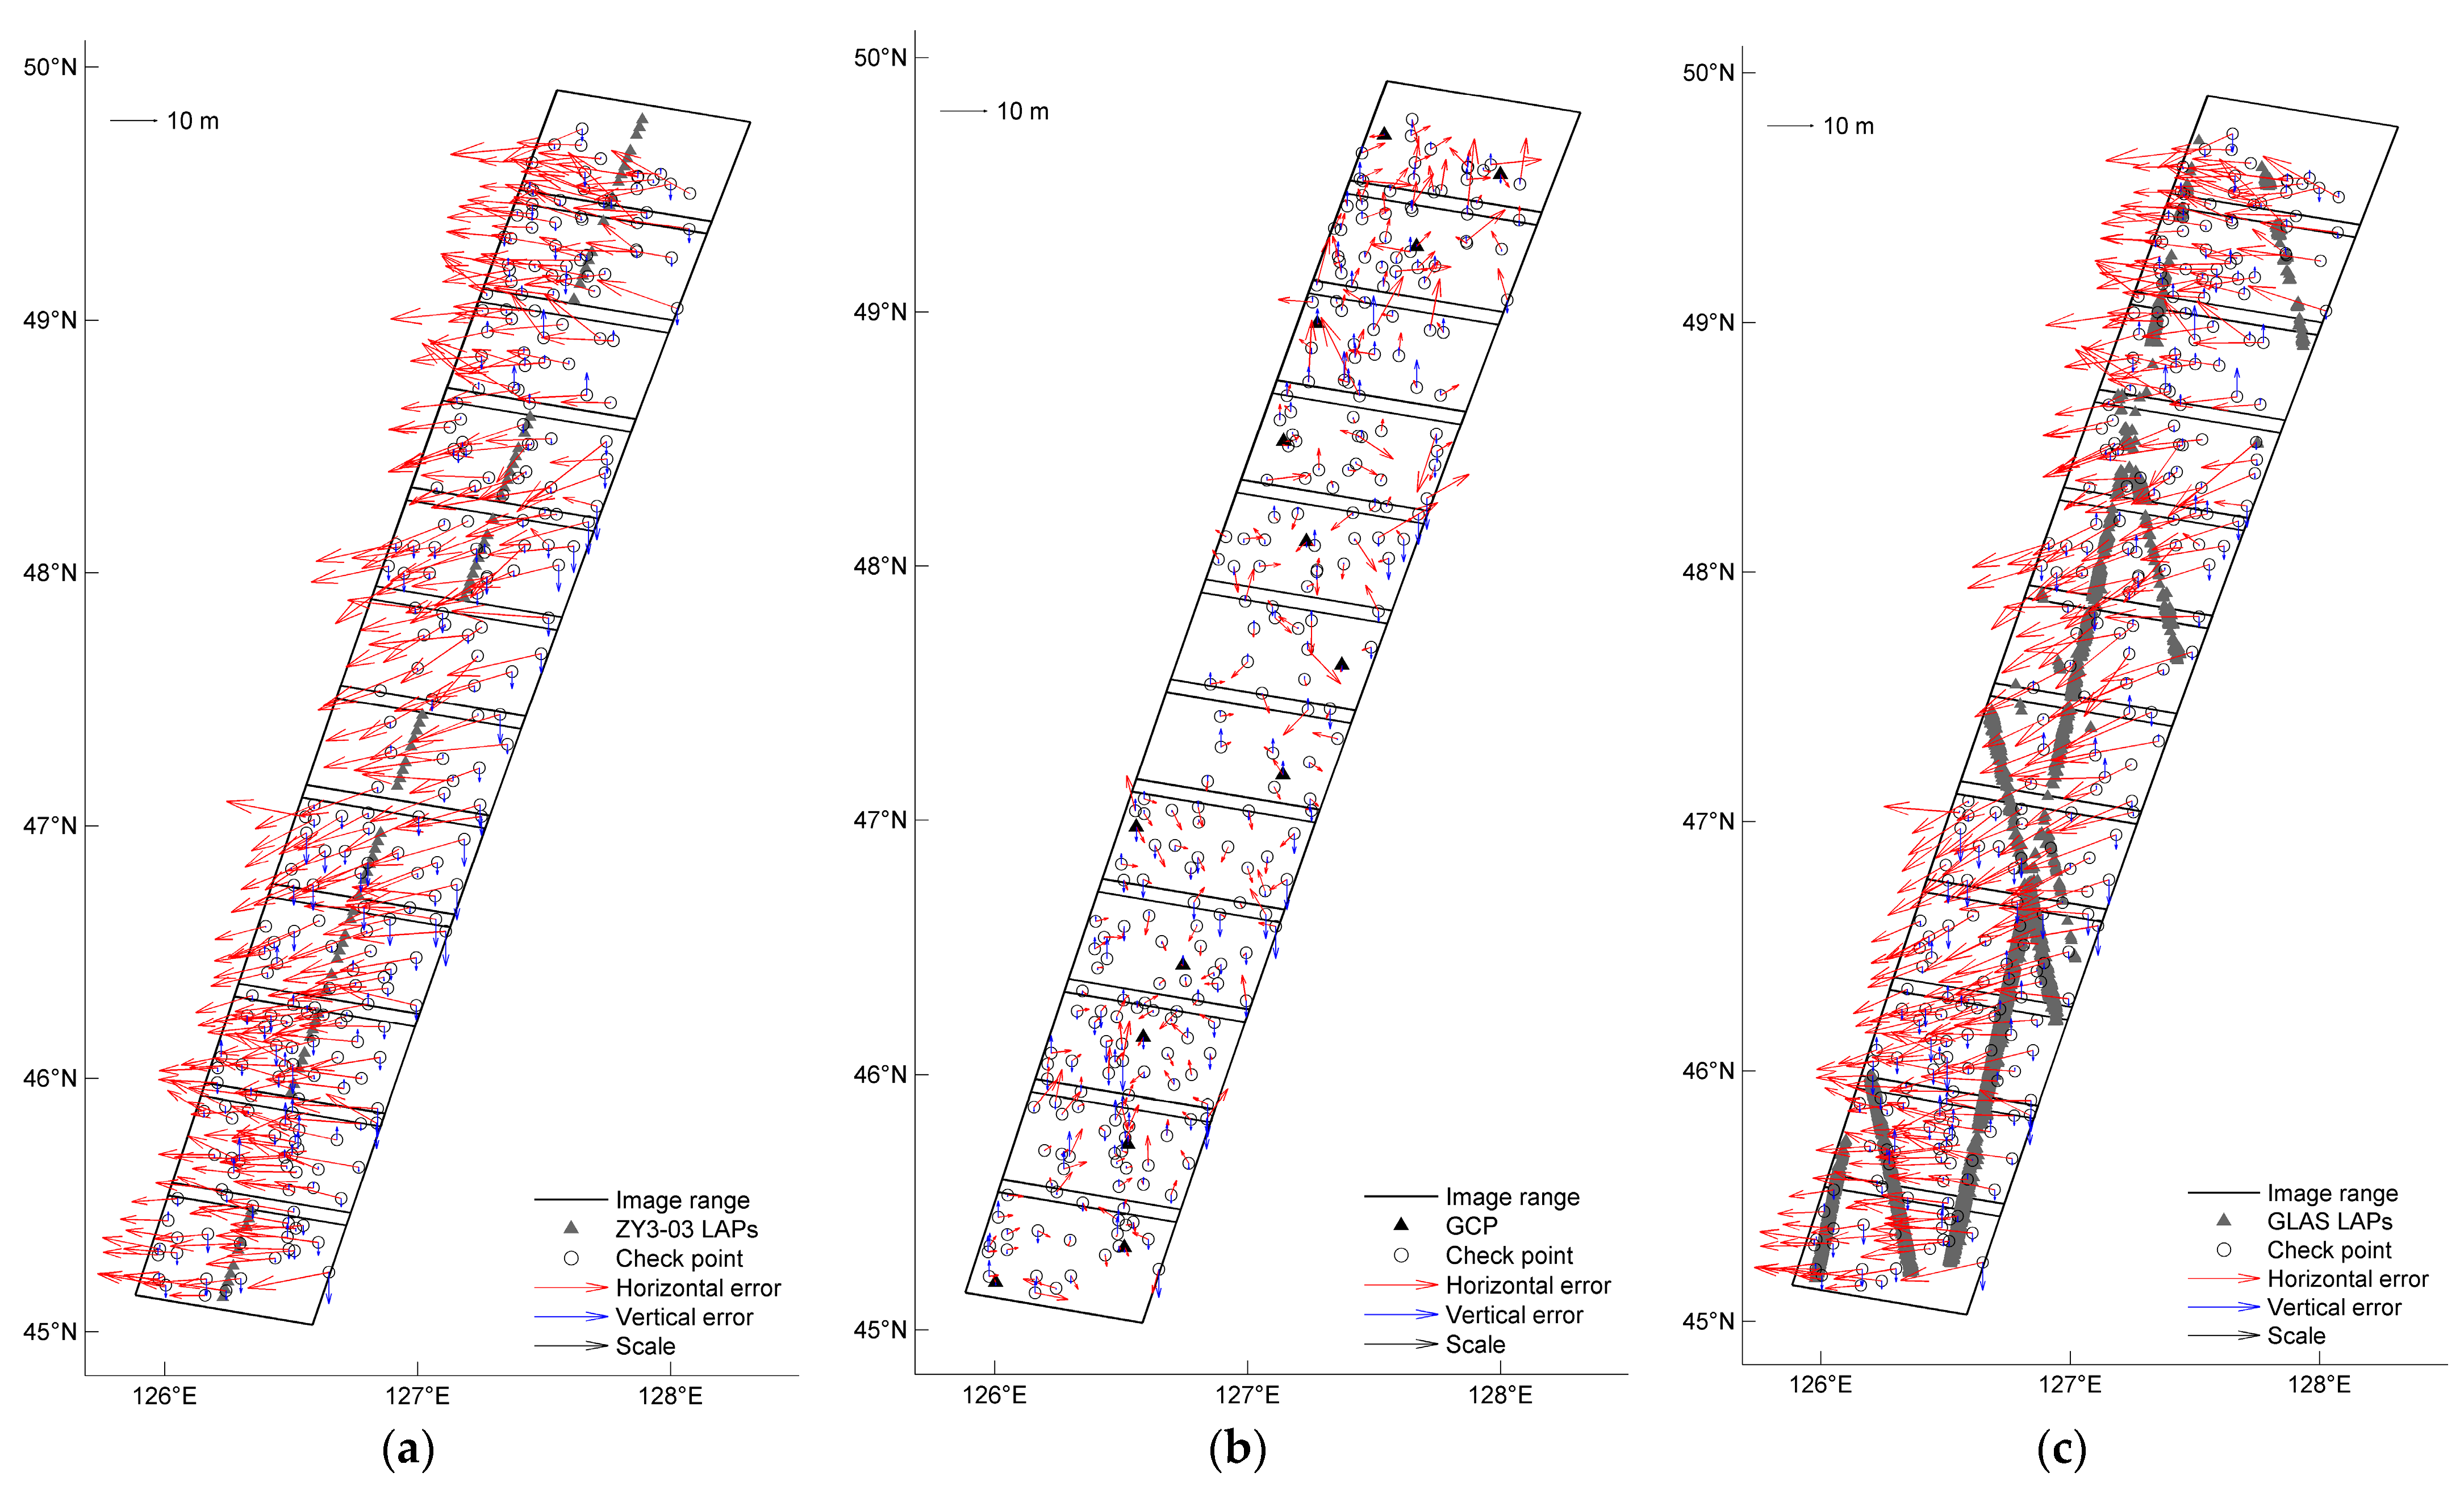
The experimental results are presented in Table 10, Table 11 and Table 12, and the residuals of the check points are shown in Figure 10.
The tie points used in each experimental group for the GF7 and ZY3-03 experimental data were derived from the tie points used in the free network adjustment experiment described in Section 4.2.1.
Compared with the corresponding values listed in Table 2, the vertical accuracies of the check points (Table 6 and Table 10) were substantially improved. The overall vertical RMSE of the GF7 images in the entire region was reduced from 3.19 m to 0.68 m, and the vertical RMSE of the flat, hilly, mountainous, and high-mountainous regions was 0.35 m, 0.66 m, 0.74 m, and 0.91 m, respectively, which meets the accuracy requirements for 1:10,000 (even 1:5000) scale mapping in China. In contrast, the overall vertical RMSE of the ZY3-03 images in the entire region was reduced from 5.27 m to 2.58 m, and the vertical RMSE of the flat and hilly regions was 2.78 m and 2.24 m, respectively, which also meets the accuracy requirements for 1:50,000 scale stereo mapping in China. This indicates the effectiveness of the integrated processing method proposed in this study. As the LAPs were not used as horizontal control points, the horizontal accuracy values of the check points (Table 6 and Table 10) did not change compared with the corresponding values in Table 2. However, the horizontal accuracy of the GF7 and ZY3-03 images meets the horizontal accuracy requirements for 1:10,000 and 1:50,000 scale mapping in China, respectively.
The horizontal RMSEs of the check points (Table 7) and the corresponding values in Table 6 were similar (although the horizontal residuals of each check point differed; Figure 9a,b). In addition, the vertical RMSEs of the check points (Table 7) were similar to the corresponding values in Table 6 (vertical residuals of each check point were also similar; Figure 9a,b). This indicates that using the GF7 LAPs as horizontal and vertical control points effectively improved the vertical accuracy of the GF7 stereo images. However, this cannot ensure improved stereo image horizontal accuracy.
The vertical accuracy of the check points (Table 8) was lower than the corresponding values in Table 6, whereas the vertical accuracy of the check points (Table 11) was almost equivalent to the corresponding values in Table 10. This indicates that in terms of the ability and effect of improving the vertical accuracy of the stereo images, the integrated processing method proposed herein becomes equal to or even better than block adjustment using an appropriate number of high-precision ground control points.
Comparing Table 2 and Table 9 shows that after the combined block adjustment using the ATLAS LAPs and GF7 stereo images, the overall vertical accuracy of the GF7 images was improved from 3.19 m to 1.78 m, which is almost consistent with the vertical accuracy of the DSM generated by integrated processing of the ATLAS LAPs and GF7 images in the literature [15]. Although the number of ATLAS LAPs is approximately 20 times that of GF7 LAPs, and the nominal vertical accuracy of ATLAS LAPs is almost the same as that of GF7 LAPs (both are approximately 0.1 m), the RMSEs of the checkpoints in all terrain areas in Table 9 are far greater than the corresponding values in Table 6. This indicates that the accuracy of the integrated processing of the GF7 LAPs and GF7 stereo images is much higher than that of the integrated processing of the ATLAS LAPs and GF7 stereo images. Comparing Table 12 and Table 10, we can see that the number of GLAS LAPs is nearly 100 times that of ZY3-03 LAPs, and the nominal vertical accuracy of GLAS LAPs (approximately 0.15 m) is also higher than that of ZY3-03 LAPs. However, the overall vertical accuracy of the checkpoints in Table 12 is almost consistent with the corresponding values in Table 10, and the vertical accuracy of the checkpoints in hilly areas in Table 12 is slightly lower than the corresponding values in Table 10. This shows that the accuracy of the integrated processing of the ZY3-03 LAPs and ZY3-03 stereo images is better than that of the integrated processing of the GLAS LAPs and ZY3-03 stereo images in areas with undulating ground. There are three main potential reasons for these results. First, although most of the low-precision ATLAS and GLAS LAPs were eliminated using TanDEM-X data and the LAPs parameter information when they were collected, many LAPs with geometric accuracies far lower than the nominal accuracy were still used in the experiment. For example, the footprint diameter of GLAS LAPs (~70 m) is larger than that of ZY3-03 LAPs (~45 m), which greatly affects the geometric accuracies of the GLAS LAPs in regions with considerable topographic relief. In addition, the ATLAS LAPs obtained using the photon counting technique contain a large number of noise points, which are difficult to eliminate effectively using the parameter information of LAPs and external digital elevation model data. Second, there is a problem similar to the previous research on integrated processing of LAPs and stereo images; that is, there may be large errors in the pixel coordinates of ATLAS or GLAS LAPs in the experiment images. Third, the acquisition time of LAPs (including ATLAS and GLAS) and experiment images is quite different, and the ground height of the experiment area will inevitably change in different periods. All these factors will affect the final accuracy of the integrated processing. Except for the first factor, the other two factors fully illustrate the superiority of integrated processing using LAPs and stereo images obtained by the same satellite, and indicate the progressiveness of the method proposed in this study.

5. Conclusions

In this study, we analyzed the feasibility of using LAPs to improve the geometric accuracy of stereo images obtained from the same satellite. On this basis, an integrated processing method for LAPs and stereo images obtained from the same satellite was proposed. An important characteristic of this method is that it uses the advantages of the acquisition of LAPs and stereo images obtained from the same satellite. We designed a precise measurement method for different types of LAPs in stereo images suitable for a variety of terrain types and solved the most difficult problem in previous integrated processing methods. Appropriate numbers of GF7 stereo images and LAPs as well as ZY3-03 stereo images and LAPs were then selected to perform integrated processing experiments. The conclusions can be summarized as follows:
  • Using the LAPs as vertical control points in the integrated processing method proposed herein, the vertical RMSEs of the GF7 images in flat, hilly, mountainous, and high-mountainous terrain and throughout the region were reduced to 0.35 m, 0.66 m, 0.74 m, 0.91 m, and 0.68 m, respectively, which meet the accuracy requirements for 1:10,000 (even 1:5000) scale stereo mapping in China. The vertical accuracy was even better than the results of block adjustment using an appropriate number of GPS points as control points. Moreover, the vertical RMSEs of the ZY3-03 images in flat and hilly terrain and throughout the region were reduced to 2.78 m, 2.24 m, and 2.58 m, respectively, which meet the accuracy requirements for 1:50,000 scale stereo mapping in China. These results indicate that the integrated processing method proposed herein can improve the vertical accuracy of stereo images in a variety of terrain types.
  • In the integrated processing of the GF7 data, LAPs were used as both horizontal and vertical control points. Although the vertical accuracy of experimental images improved, the horizontal accuracy did not change substantially. This indicates that using LAPs cannot ensure improvements in the horizontal accuracy of stereo images.
  • The ATLAS LAPs were used to replace the GF7 LAPs, and the combined block adjustment experiment was conducted with GF7 experiment images. The GLAS LAPs were used to replace the ZY3-03 LAPs, and the combined block adjustment experiment was conducted with the ZY3-03 experiment images. The two groups of experiments reflect the effect that can be achieved by using the traditional method to conduct the integrated processing of LAPs and stereo images obtained from different satellites. Although the number and vertical accuracy of ATLAS and GLAS LAPs in the experiments are far better than those of GF7 and ZY3-03 LAPs, the final experiment results are worse than those obtained using our method. This shows that the method of acquiring stereo images and LAPs on the same platform at the same time has great advantages, and the technical method proposed in our study based on these advantages has been proven to be effective and advanced.
In summary, based on theoretical analysis and experiment verification, the integrated processing method for stereo images and LAPs obtained from the same satellite proposed in this study is effective and valid.

Author Contributions

Conceptualization, X.T. and P.Z.; methodology, X.T. and P.Z.; software, P.Z. and H.P.; validation, P.Z.; formal analysis, P.Z.; investigation, P.Z.; data acquisition, P.Z. and X.T.; writing—original draft preparation, X.T. and P.Z.; writing—review and editing, X.T. and P.Z.; visualization, L.G.; supervision, H.P.; project administration, X.T. and P.Z.; funding acquisition, P.Z. All authors have read and agreed to the published version of the manuscript.

Funding

This research was funded by National key research and development program for international cooperation (grant number 2020YFE0200800), the Special Fund for High Resolution Images Surveying and Mapping Application System (grant number 42-Y30B04-9001-19/21) and National Natural Science Foundation of China (NSFC) (grant number 41971418).

Institutional Review Board Statement

Not applicable.

Informed Consent Statement

Not applicable.

Data Availability Statement

Not applicable.

Acknowledgments

The authors would like to thank the editors and reviewers for their efforts to help the publication of this work.

Conflicts of Interest

The authors declare no conflict of interest.

References

  1. Spudis, P.D.; Gillis, J.J.; Reisse, R.A. Ancient Multiring Basins on the Moon Revealed by Clementine Laser Altimetry. Science 1994, 266, 1848–1851. [Google Scholar] [CrossRef]
  2. Smith, D.E.; Zuber, M.T.; Jackson, G.B.; Cavanaugh, J.F.; Neumann, G.A.; Riris, H.; Sun, X.; Zellar, R.S.; Coltharp, C.; Connelly, J.; et al. The Lunar Orbiter Laser Altimeter Investigation on the Lunar Reconnaissance Orbiter Mission. Space Sci. Rev. 2009, 150, 209–241. [Google Scholar] [CrossRef]
  3. Cavanaugh, J.F.; Smith, J.C.; Sun, X.; Bartels, A.E.; Ramos-Izquierdo, L.; Krebs, D.J.; McGarry, J.F.; Trunzo, R.; Novo-Gradac, A.M.; Britt, J.L.; et al. The Mercury Laser Altimeter Instrument for the MESSENGER Mission. Space Sci. Rev. 2007, 131, 451–479. [Google Scholar] [CrossRef]
  4. Li, C.; Ren, X.; Liu, J.; Zou, X.; Mu, L.; Wang, J.; Shu, R.; Zou, Y.; Zhang, H.; Lu, C.; et al. Laser altimetry data of Chang’E-1 and the global lunar DEM model. Sci. China Earth Sci. 2010, 53, 1582–1593. [Google Scholar] [CrossRef]
  5. Schutz, B.E.; Zwally, H.J.; Shuman, C.A.; Hancock, D.; DiMarzio, J.P. Overview of the ICESat Mission. Geophys. Res. Lett. 2005, 32, L21S01. [Google Scholar] [CrossRef]
  6. Neumann, T.A.; Martino, A.J.; Markus, T.; Bae, S.; Bock, M.R.; Brenner, A.C.; Brunt, K.M.; Cavanaugh, J.; Fernandes, S.T.; Hancock, D.W.; et al. The Ice, Cloud, and Land Elevation Satellite—2 mission: A global geolocated photon product derived from the Advanced Topographic Laser Altimeter System. Remote Sens. Environ. 2019, 233, 111325. [Google Scholar] [CrossRef] [PubMed]
  7. Tang, X.; Xie, J.; Liu, R.; Huang, G.; Zhao, C.; Zhen, Y.; Tang, H.; Dou, X. Overview of the GF-7 Laser Altimeter System Mission. Earth Space Sci. 2020, 7, e2019EA000777. [Google Scholar] [CrossRef]
  8. Zhou, P.; Tang, X.; Li, D.; Wang, X. Combined Block Adjustment of Stereo Imagery and Laser Altimetry Points of the ZY3-03 Satellite. IEEE Geosci. Remote Sens. Lett. 2022, 19, 1–5. [Google Scholar] [CrossRef]
  9. Xie, J.; Tang, X.; Mo, F.; Tang, H.; Wang, Z.; Wang, X.; Liu, Y.; Tian, S.; Liu, R.; Xia, X. In-orbit geometric calibration and experimental verification of the ZY3-02 laser altimeter. Photogramm. Rec. 2018, 33, 341–362. [Google Scholar] [CrossRef]
  10. Spiegel, M.; Baumgartner, A.; Ebner, H. Orientation of Mars Express/HRSC imagery using laser altimeter data as control information. In Proceedings of the ISPRS Workshop High Resolution Mapping from Space 2003, Hannover, Germany, 6–8 October 2003. [Google Scholar]
  11. Yoon, J.-S.; Shan, J. Combined Adjustment of MOC Stereo Imagery and MOLA Altimetry Data. Photogramm. Eng. Remote Sens. 2005, 71, 1179–1186. [Google Scholar] [CrossRef] [Green Version]
  12. Lin, S.-Y.; Muller, J.-P.; Mills, J.P.; Miller, P.E. An assessment of surface matching for the automated co-registration of MOLA, HRSC and HiRISE DTMs. Earth Planet. Sci. Lett. 2010, 294, 520–533. [Google Scholar] [CrossRef]
  13. Di, K.; Yue, Z.; Peng, M.; Liu, Z. Co-registration of CHANG’E-1 stereo images and laser altimeter data for 3D mapping of lunar surface. In Proceedings of the ASPRS/CaGIS 2010 Specialty Conference, Orlando, FL, USA, 15–19 December 2010. [Google Scholar]
  14. Di, K.; Hu, W.; Liu, Y.; Peng, M. Co-registration of Chang’E-1 stereo images and laser altimeter data with crossover adjustment and image sensor model refinement. Adv. Space Res. 2012, 50, 1615–1628. [Google Scholar] [CrossRef]
  15. Ye, J.; Qiang, Y.; Zhang, R.; Liu, X.; Deng, Y.; Zhang, J. High-Precision Digital Surface Model Extraction from Satellite Stereo Images Fused with ICESat-2 Data. Remote Sens. 2021, 14, 142. [Google Scholar] [CrossRef]
  16. Howat, I.M.; Porter, C.; Smith, B.E.; Noh, M.-J.; Morin, P. The Reference Elevation Model of Antarctica. Cryosphere 2019, 13, 665–674. [Google Scholar] [CrossRef]
  17. Magruder, L.; Neuenschwander, A.; Klotz, B. Digital terrain model elevation corrections using space-based imagery and ICESat-2 laser altimetry. Remote Sens. Environ. 2021, 264, 112621. [Google Scholar] [CrossRef]
  18. Dongchen, E.; Shen, Q.; Xu, Y.; Chen, G. High-accuracy topographical information extraction based on fusion of ASTER stereo-data and ICESat/GLAS data in Antarctica. Sci. China Ser. D Earth Sci. 2009, 52, 714–722. [Google Scholar] [CrossRef]
  19. Takaku, J.; Tadono, T.; Tsutsui, K. Algorithm development of high resolution global DSM generation by ALOS prism. In Proceedings of the IGARSS 2014–2014 IEEE International Geoscience and Remote Sensing Symposium, Quebec City, QC, Canada, 13–18 July 2014. [Google Scholar]
  20. Li, G.; Tang, X.; Gao, X.; Wang, H.; Wang, Y. ZY-3 Block adjustment supported by GLAS laser altimetry data. Photogramm. Rec. 2016, 31, 88–107. [Google Scholar] [CrossRef]
  21. Zhou, P.; Tang, X.; Wang, Z.; Cao, N.; Wang, X. Vertical Accuracy Effect Verification for Satellite Imagery with Different GCPs. IEEE Geosci. Remote Sens. Lett. 2017, 14, 1268–1272. [Google Scholar] [CrossRef]
  22. Cao, N.; Zhou, P.; Wang, X.; Tang, X.M.; Li, G.Y. Refined processing of satellite imaging geometric model assisted by laser altimetry data. J. Remote Sens. 2018, 22, 599–610. [Google Scholar] [CrossRef]
  23. Li, G.; Tang, X.; Gao, X.; Wang, X.; Fan, W.; Chen, J.; Mo, F. Integration of ZY3-02 satellite laser altimetry data and stereo images for high-precise surveying and mapping. Photogramm. Eng. Remote Sens. 2018, 84, 569–578. [Google Scholar] [CrossRef]
  24. Zhang, G.; Xu, K.; Jia, P.; Hao, X.; Li, D. Integrating Stereo Images and Laser Altimeter Data of the ZY3-02 Satellite for Improved Earth Topographic Modeling. Remote Sens. 2019, 11, 2453. [Google Scholar] [CrossRef]
  25. Zhang, G.; Jiang, B.; Wang, T.; Ye, Y.; Li, X. Combined Block Adjustment for Optical Satellite Stereo Imagery Assisted by Spaceborne SAR and Laser Altimetry Data. Remote Sens. 2021, 13, 3062. [Google Scholar] [CrossRef]
  26. Chen, J.; Tang, X.; Xue, Y.; Li, G.; Zhou, X.; Hu, L.; Zhang, S. Registration and Combined Adjustment for the Laser Altimetry Data and High-Resolution Optical Stereo Images of the GF-7 Satellite. Remote Sens. 2022, 14, 1666. [Google Scholar] [CrossRef]
  27. Tang, X.; Zhang, G.; Zhu, X.; Pan, H.; Jiang, Y.; Zhou, P.; Wang, X. Triple linear-array image geometry model of ZiYuan-3 surveying satellite and its validation. Int. J. Image Data Fusion 2013, 4, 33–51. [Google Scholar] [CrossRef]
  28. Pan, H.; Zhang, G.; Tang, X.; Li, D.; Zhu, X.; Zhou, P.; Jiang, Y. Basic Products of the ZiYuan-3 Satellite and Accuracy Evaluation. Photogramm. Eng. Remote Sens. 2013, 79, 1131–1145. [Google Scholar] [CrossRef]
  29. Xie, J.; Huang, G.; Liu, R.; Zhao, C.; Dai, J.; Jin, T.; Mo, F.; Zhen, Y.; Xi, S.; Tang, H.; et al. Design and Data Processing of China’s First Spaceborne Laser Altimeter System for Earth Observation: GaoFen-7. IEEE J. Sel. Top. Appl. Earth Obs. Remote Sens. 2020, 13, 1034–1044. [Google Scholar] [CrossRef]
  30. Li, G.; Tang, X.; Chen, J.; Yao, J.; Liu, Z.; Gao, X.; Zuo, Z.; Zhou, X. Processing and preliminary accuracy validation of the GF-7 satellite laser altimetry data. Acta Geod. Cartogr. Sin. 2021, 50, 1338–1348. [Google Scholar] [CrossRef]
  31. NASA Goddard Space Flight Center. The GLAS Algorithm Theoretical Basis Document for Laser Footprint Location (Geolocation) and Surface Profiles. 1 July 2014. Available online: https://ntrs.nasa.gov/citations/20140017859 (accessed on 21 November 2022.).
  32. Li, G.; Guo, J.; Tang, X.; Ye, F.; Zuo, Z.; Liu, Z.; Chen, J.; Xue, Y. Preliminary quality analysis of GF-7 satellite laser altimeter full waveform data. ISPRS-Int. Arch. Photogramm. Remote Sens. Spat. Inf. Sci. 2020, XLIII-B1-2, 129–134. [Google Scholar] [CrossRef]
  33. Zhou, P.; Tang, X. Geometric Accuracy Verification of GF-7 Satellite Stereo Imagery Without GCPs. IEEE Geosci. Remote Sens. Lett. 2022, 19, 6509105. [Google Scholar] [CrossRef]
  34. Tang, X.; Xie, J.; Mo, F.; Dou, X.; Li, X.; Li, S.; Li, S.; Huang, G.; Fu, X.; Liu, R.; et al. GF-7 dual-beam laser altimeter on-orbit geometric calibration and test verification. Acta Geod. Cartogr. Sin. 2021, 50, 384–395. [Google Scholar] [CrossRef]
  35. Zhang, Y.; Zheng, M.; Xiong, J.; Lu, Y.; Xiong, X. On-Orbit Geometric Calibration of ZY-3 Three-Line Array Imagery With Multistrip Data Sets. IEEE Trans. Geosci. Remote Sens. 2013, 52, 224–234. [Google Scholar] [CrossRef]
  36. Tang, X.; Zhou, P.; Zhang, G.; Wang, X.; Pan, H. Geometric Accuracy Analysis Model of the Ziyuan-3 Satellite without GCPs. Photogramm. Eng. Remote Sens. 2015, 81, 927–934. [Google Scholar] [CrossRef]
  37. Zhou, P.; Tang, X.; Wang, X.; Liu, C.; Wang, Z. Geometric accuracy evaluation model of domestic push-broom mapping satellite image. Geomat. Inf. Sci. Wuhan Univ. 2018, 43, 1628–1634. [Google Scholar] [CrossRef]
  38. Xie, J.; Ren, C.; Jiao, H.; Pan, J. In-orbit geometric calibration approach and positioning accuracy analysis for the Gaofen-7 laser footprint camera. IET Image Process. 2021, 15, 3130–3141. [Google Scholar] [CrossRef]
  39. NASA Goddard Space Flight Center. The Algorithm Theoretical Basis Document for the Atmospheric Delay Correction to GLAS Laser Altimeter Ranges. 1 October 2012. Available online: https://ntrs.nasa.gov/search.jsp?R=20130001652 (accessed on 21 November 2022.).
  40. NASA Goddard Space Flight Center. The algorithm theoretical basis document for tidal corrections. 1 December 2012. Available online: https://ntrs.nasa.gov/search.jsp?R=20130013632 (accessed on 21 November 2022.).
  41. Li, G.; Tang, X.; Zhou, P.; Chen, J.; Liu, Z.; Dou, X.; Zhou, X.; Wang, X. Laser altimetry data processing and combined surveying application of ZY3-03 satellite. Infrared Laser Eng. 2022, 51, 20210356. [Google Scholar] [CrossRef]
  42. Lowe, D.G. Distinctive Image Features from Scale-Invariant Keypoints. Int. J. Comput. Vis. 2004, 60, 91–110. [Google Scholar] [CrossRef]
  43. Gruen, A. Adaptive least squares correlation: A powerful image matching technique. S. Afr. J. Photogramm. Remote Sens. Cartogr. 1985, 14, 175–187. [Google Scholar]
  44. Fraser, C.S.; Hanley, H.B. Bias-compensated RPCs for Sensor Orientation of High-resolution Satellite Imagery. Photogramm. Eng. Remote Sens. 2005, 71, 909–915. [Google Scholar] [CrossRef]
  45. Fraser, C.; Yamakawa, T. Insights into the affine model for high-resolution satellite sensor orientation. ISPRS J. Photogramm. Remote Sens. 2004, 58, 275–288. [Google Scholar] [CrossRef]
  46. Li, B.; Xie, H.; Liu, S.; Tong, X.; Tang, H.; Wang, X. A Method of Extracting High-Accuracy Elevation Control Points from ICESat-2 Altimetry Data. Photogramm. Eng. Remote Sens. 2021, 87, 821–830. [Google Scholar] [CrossRef]
  47. Krieger, G.; Fiedler, H.; Zink, M.; Hajnsek, I.; Younis, M.; Huber, S.; Bachmann, M.; Gonzalez, J.H.; Werner, M.; Moreira, A. The TanDEM-X mission: A satellite formation for high-resolution SAR interferometry. In Proceedings of the Radar Conference, EuRAD 2007, Munich, Germany, 10–12 October 2007. [Google Scholar]
  48. Leprince, S.; Barbot, S.; Ayoub, F.; Avouac, J.-P. Automatic and Precise Orthorectification, Coregistration, and Subpixel Correlation of Satellite Images, Application to Ground Deformation Measurements. IEEE Trans. Geosci. Remote Sens. 2007, 45, 1529–1558. [Google Scholar] [CrossRef] [Green Version]
  49. CH/T 9009.1-2013; Digital Products of Fundamental Geographic Information—1:5000 1:10,000 1:25,000 1:50,000 1:100,000—Part 1:Digital Line Graphs. Surveying and Mapping Press: Beijing, China, 2013.
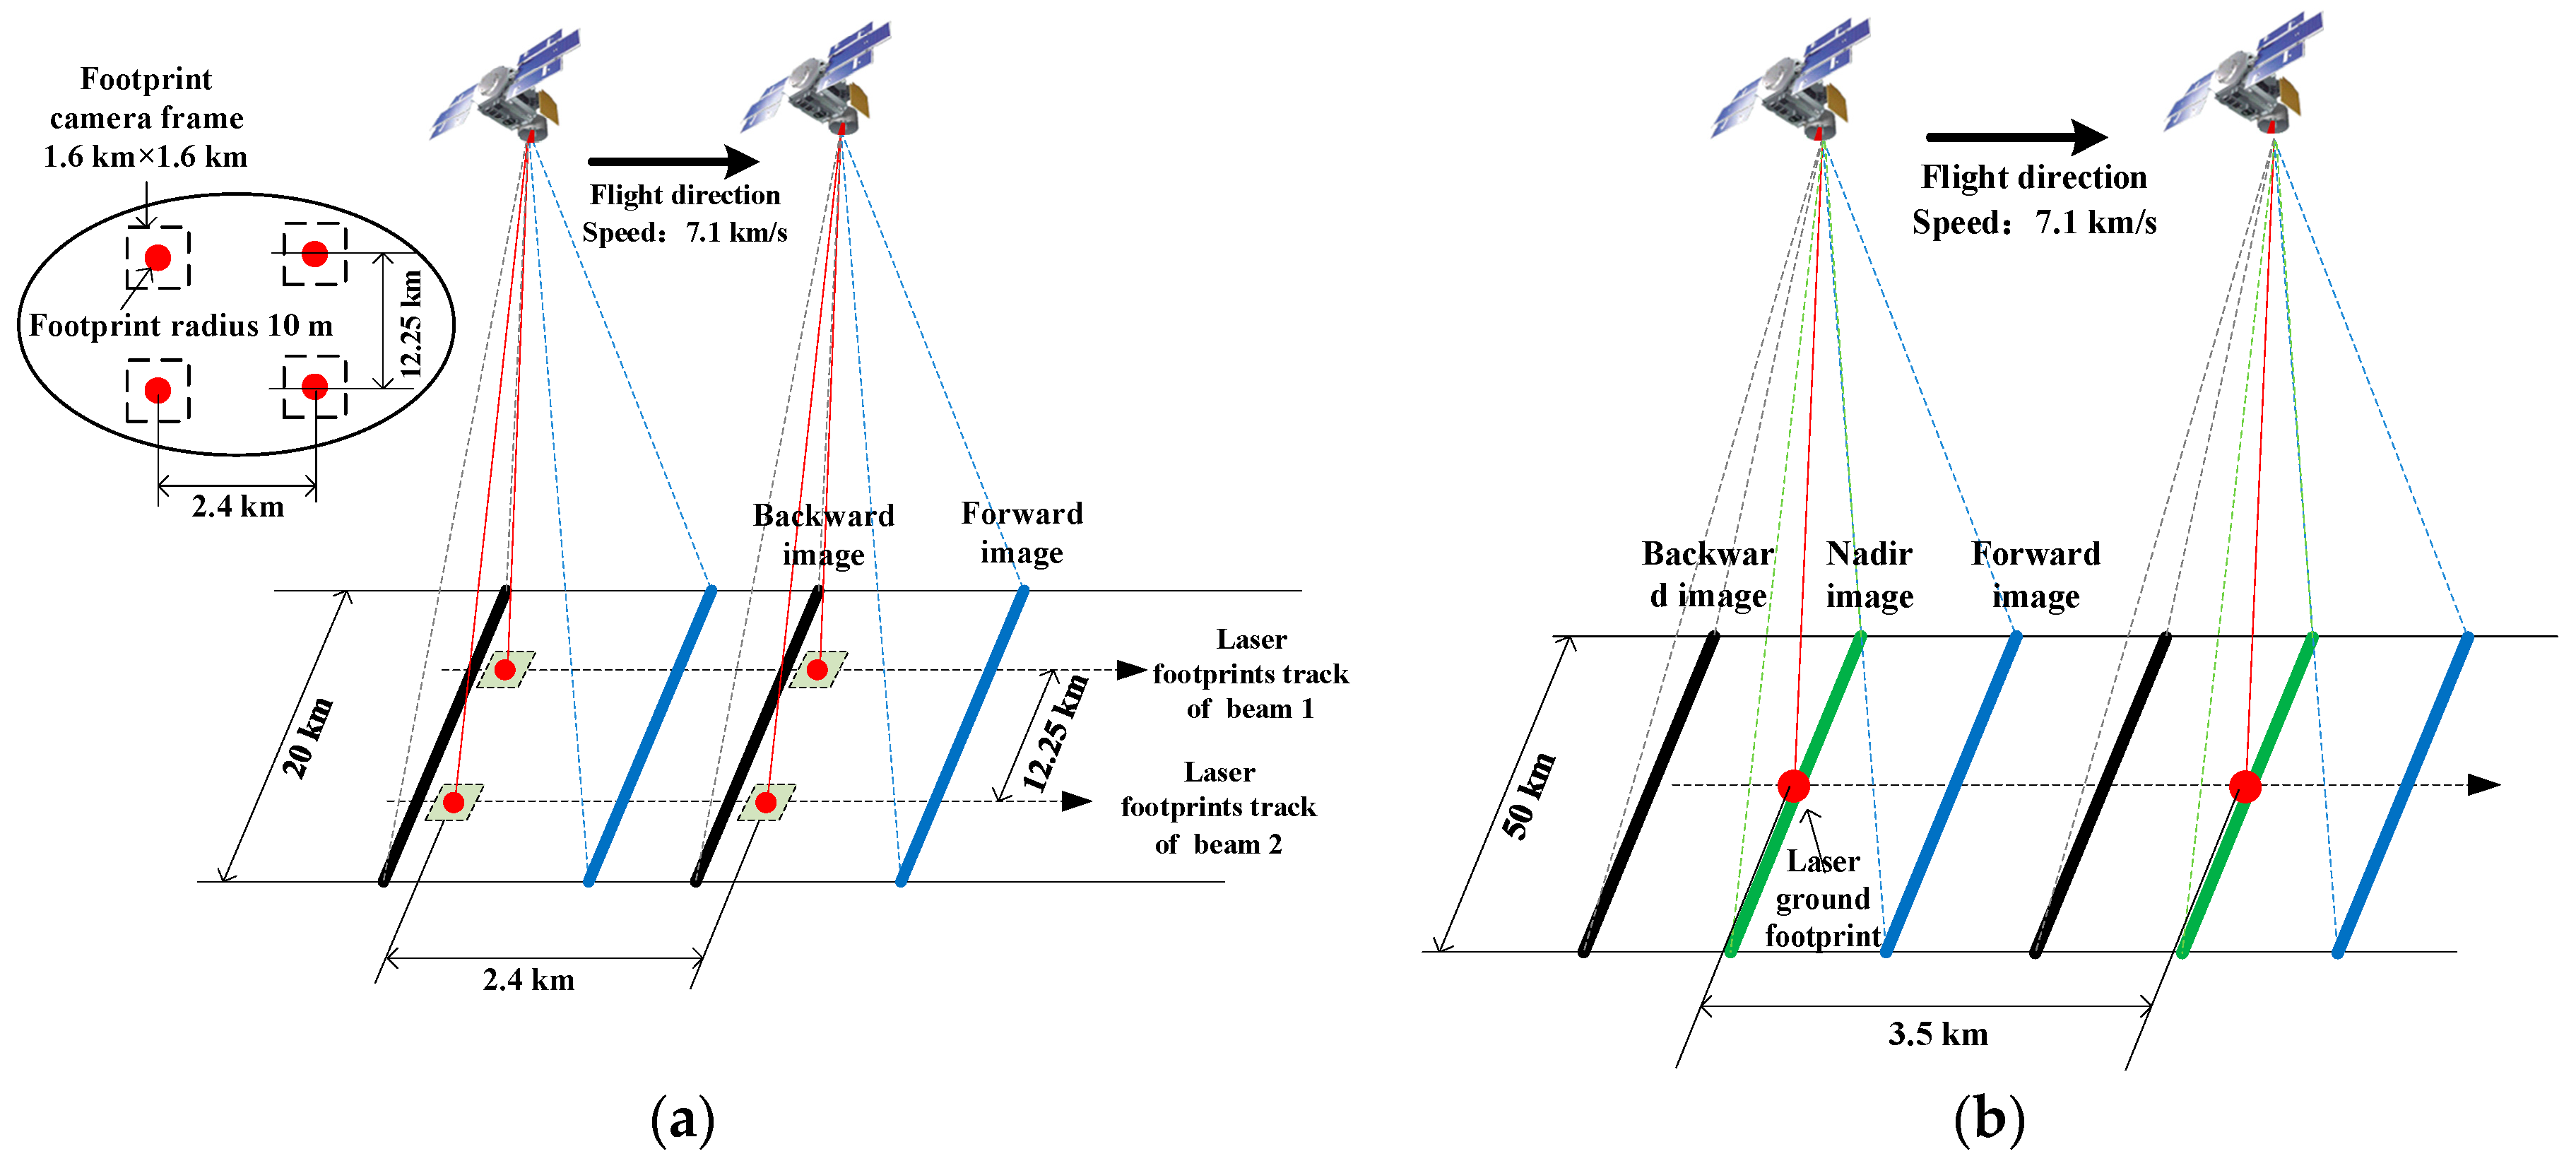
Figure 1. Schematic of stereo image and laser altimetry point (LAP) acquisition by the same satellite: (a) GF7, (b) ZY3-03.
Remotesensing 15 00869 g001
Figure 2. Integrated processing flow for the LAPs and stereo images.
Remotesensing 15 00869 g002
Figure 3. LAPs measurement using image matching between footprint image and stereo image.
Remotesensing 15 00869 g003
Figure 4. LAP measurement for substituting homonymy points for LAPs.
Remotesensing 15 00869 g004
Figure 5. Measurement of LAPs without footprint image.
Remotesensing 15 00869 g005
Figure 6. Geographical distributions of the experimental regions and data: (a) GF7 satellite data, (b) ZY3-03 satellite data.
Remotesensing 15 00869 g006
Figure 7. Geographical distributions of the ATLAS and GLAS LAPs: (a) ATLAS LAPs, (b) GLAS LAPs.
Remotesensing 15 00869 g007
Figure 8. Residuals of the free network adjustment: (a) GF7 satellite experimental region, (b) ZY3-03 satellite experimental region.
Remotesensing 15 00869 g008
Figure 9. Residuals of integrated processing of GF7 experimental data. (a) First group; (b) second group; (c) third group; and (d) fourth group experiments.
Remotesensing 15 00869 g009
Figure 10. Residuals of integrated processing of the ZY3-03 experimental data. (a) First group; (b) second group; and (c) third group experiments.
Remotesensing 15 00869 g010
Table 1. Characteristics of the experimental data used in this study.
Data TypeCovering TerrainStereo ImagesLAPsNumber of GPS Points
Covering Area (km2)NumberImage OrbitNumberData Orbit
GF7 Satellite dataFlat3500702449, 3267, 5806, 5880, 59621343267, 6786, 6868, 7679, 865240
Hilly42008426
Mountainous17,300244124
High mountainous2000111
All regions27,000463201
ZY3-03 Satellite dataFlat16,000121552561552167
Hilly14,00025103
All regions30,00081270
Table 2. Experimental results of the free network adjustment.
Data TypeTerrain TypeNumber of Check PointsHorizontal Accuracy (m)Vertical Accuracy (m)
RMSEMax. ErrorRMSEMax. Error
GF7 satellite dataFlat405.009.263.07−6.72
Hilly263.816.404.68−7.14
Mountainous1244.328.122.86−7.17
High mountainous116.368.892.486.23
All regions2014.939.263.19−7.17
ZY3-03 satellite dataFlat16715.2021.615.3810.29
Hilly10315.3625.025.097.61
All regions27015.2625.025.2710.29
Note: during free network adjustment, the root mean square error (RMSE) of the pixel coordinate residuals of the tie points were all less than 0.3 pixels, and the maximum pixel residuals were all less than 1.2 pixels.
Table 3. Accuracy requirements for 1:50,000 and 1:10,000 scale mapping in China.
ScaleHorizontal RMSE (m)Vertical RMSE (m)
Flat and HillyMountainous and High MountainousFlatHillyMountainousHigh
Mountainous
1:50,0002537.535814
1:10,00057.50.51.22.55
Table 4. Stereo image vertical accuracies obtained using the LAPs as check points.
Experimental RegionTerrain TypeNumber of Laser PointsVertical Accuracy (m)
RMSEMax. Error
GF7 experimental regionFlat1292.96−6.33
Hilly754.76−8.06
Mountainous2162.95−8.22
High mountainous12.412.41
All regions4213.32−8.22
ZY3-03 experimental regionFlat565.90−12.08
Hilly255.62−8.97
All regions815.79−12.08
Table 5. Relative horizontal accuracies of GF7 LAPs and GF7 stereo images from orbit 3267.
Terrain TypeNumber of LAPsHorizontal Accuracy (m)
RMSEMax. Error
Flat300.400.46
Hilly40.330.39
Mountainous310.290.40
High
mountainous
10.350.35
All regions660.350.46
Table 6. Experimental results of integrated processing of GF7 experimental data (first group).
TerrainGPS Check PointsGF7 Laser Vertical Control Points
NumberHorizontal AccuracyVertical AccuracyNumberVertical Residual
RMSEMax. ErrorRMSEMax. ErrorRMSEMax. Error
Flat404.998.390.35−0.721340.33−0.84
Hilly263.526.720.66−1.40840.571.33
Mountainous1244.427.540.742.072440.691.61
High
mountainous
115.998.080.911.8010.821.00
All regions2014.828.390.682.074630.601.61
Table 7. Experimental results of integrated processing of GF7 experimental data (second group).
TerrainGPS Check PointsGF7 Laser Horizontal and Vertical Control Points
NumberHorizontal
Accuracy
Vertical
Accuracy
NumberHorizontal
Residual
Vertical
Residual
RMSEMax. ErrorRMSEMax. ErrorRMSEMax. ErrorRMSEMax. Error
Flat404.948.830.35−0.771294.558.450.34−0.87
Hilly263.126.480.62−1.44753.015.990.561.28
Mountainous1245.2810.850.731.922164.978.770.701.56
High
mountainous
115.689.110.901.7816.136.130.800.98
All regions2015.0010.850.671.924214.558.770.591.56
Table 8. Experimental results of integrated processing of GF7 experimental data (third group).
TerrainGPS Check PointsGPS Horizontal and Vertical Control Points
NumberHorizontal
Accuracy
Vertical
Accuracy
NumberHorizontal
Residual
Vertical
Residual
RMSEMax. ErrorRMSEMax. ErrorRMSEMax. ErrorRMSEMax. Error
Flat291.643.250.921.33111.632.890.771.54
Hilly172.403.600.951.8692.313.330.84−1.75
Mountainous912.344.160.882.21332.053.850.882.09
High
mountainous
72.513.860.94−1.5341.672.410.83−1.28
All regions1442.234.160.902.21571.993.840.852.09
Table 9. Experimental results of integrated processing of GF7 experimental data (fourth group).
TerrainGPS Check PointsATLAS Laser Vertical Control Points
NumberHorizontal
Accuracy
Vertical
Accuracy
NumberVertical
Residual
RMSEMax. ErrorRMSEMax. ErrorRMSEMax. Error
Flat404.998.431.334.2930381.28−6.46
Hilly263.536.361.21−2.4832481.249.53
Mountainous1244.297.652.015.5924931.685.69
High mountainous116.028.221.742.55450.991.94
All regions2014.798.431.785.5988241.399.53
Table 10. Experimental results of integrated processing of ZY3 experimental data (first group).
TerrainGPS Check PointsZY3-03 Laser Vertical
Control Points
NumberHorizontal
Accuracy
Vertical
Accuracy
NumberVertical
Residual
RMSEMax. ErrorRMSEMax. ErrorRMSEMax. Error
Flat16715.4125.242.78−7.63561.51−3.93
Hilly10314.9424.852.24−7.07251.77−3.90
All regions27015.3525.692.58−7.63811.56−3.93
Table 11. Experimental results of integrated processing of ZY3 experimental data (second group).
TerrainGPS Check PointsGPS Horizontal and Vertical Control Points
NumberHorizontal
Accuracy
Vertical
Accuracy
NumberHorizontal
Residual
Vertical
Residual
RMSEMax. ErrorRMSEMax. ErrorRMSEMax. ErrorRMSEMax. Error
Flat1574.1510.602.53−7.03102.955.352.613.81
Hilly996.1218.542.41−7.2544.246.841.983.88
All regions2564.9918.562.41−7.25143.376.842.453.88
Table 12. Experimental results of integrated processing of ZY3 experimental data (third group).
TerrainGPS Check PointsGLAS Laser Vertical
Control Points
NumberHorizontal
Accuracy
Vertical
Accuracy
NumberVertical
Residual
RMSEMax. ErrorRMSEMax. ErrorRMSEMax. Error
Flat16715.5325.322.437.0576472.0514.93
Hilly10314.9924.992.757.478812.26−8.43
All regions27015.3225.332.557.4785282.0714.93
Disclaimer/Publisher’s Note: The statements, opinions and data contained in all publications are solely those of the individual author(s) and contributor(s) and not of MDPI and/or the editor(s). MDPI and/or the editor(s) disclaim responsibility for any injury to people or property resulting from any ideas, methods, instructions or products referred to in the content.