Article

Superior Clone Selection in a Eucalyptus Trial Using Forest Phenotyping Technology via UAV-Based DAP Point Clouds and Multispectral Images

1
Co-Innovation Center for the Sustainable Forestry in Southern China, Nanjing Forestry University, Nanjing 210037, China
2
Research Institute of Fast-Growing Trees, Chinese Academy of Forestry, Zhanjiang 524022, China
3
State-Owned Dongmen Forest Farm of Guangxi Zhuang Autonomous Region, Chongzuo 532199, China
*
Author to whom correspondence should be addressed.
Remote Sens. 2023, 15(4), 899; https://doi.org/10.3390/rs15040899
Submission received: 12 January 2023 / Revised: 2 February 2023 / Accepted: 2 February 2023 / Published: 6 February 2023
(This article belongs to the Section Forest Remote Sensing)

Abstract

:
The quantitative, accurate and efficient acquisition of tree phenotypes is the basis for forest “gene-phenotype-environment” studies. It also offers significant support for clarifying the genetic control mechanisms of tree traits. The application of unmanned aerial vehicle (UAV) remote sensing technology to the collection of phenotypic traits at an individual tree level quantitatively analyses tree phenology and directionally evaluates tree growth, as well as accelerating the process of forest genetics and breeding. In this study, with the help of high-resolution, high-overlap, multispectral images obtained by an UAV, combined with digital elevation models (DEMs) extracted from point clouds acquired by a backpack LiDAR, a high-throughput tree structure and spectral phenotypic traits extraction and a genetic selection were conducted in a trial of Eucalyptus clones in the State-owned Dongmen Forest Farm in the Guangxi Zhuang Autonomous Region. Firstly, we validated the accuracy of extracting the phenotypic parameters of individual tree growth based on aerial stereo photogrammetry point clouds. Secondly, on this basis, the repeatability of the tree growth traits and vegetation indices (VIs), the genetic correlation coefficients between the traits were calculated. Finally, the eucalypt clones were ranked by integrating a selection index of traits, and the superior genotypes were selected and their genetic gain predicted. The results showed a high accuracy of the tree height (H) extracted from the digital aerial photogrammetry (DAP) point cloud based on UAV images (R2 = 0.91, and RMSE = 0.56 m), and the accuracy of estimating the diameter at breast height (DBH) was R2 = 0.71, and RMSE = 0.75 cm. All the extracted traits were significantly different within the tree species and among the clones. Except for the crown width (CW), the clonal repeatability ( R c ) of the traits were all above 0.9, and the individual repeatability values ( R i ) were all above 0.5. The genetic correlation coefficient between the tree growth traits and VIs fluctuated from 0.3 to 0.5, while the best clones were EA14-15, EA14-09, EC184, and EC183 when the selection proportion was 10%. The purpose of this study was to construct a technical framework for phenotypic traits extraction and genetic analysis of trees based on unmanned aerial stereo photography point clouds and high-resolution multispectral images, while also exploring the application potential of this approach in the selective breeding of eucalypt clones.

1. Introduction

In the background of increasing global climate and environmental change, the importance of forests, especially the development of forest plantations, has become the focus of a broad consensus of the international community, and it also plays a key role in the development of a climate strategy for all countries [1]. Eucalyptus spp. originally comes from Australia, and is now one of the most widely planted broadleaf species due to its fast-growth, high-yield, short rotation period and strong resistance to adversity [2,3,4]. Statistically, the global planting area of Eucalyptus spp. has exceeded 22.57 million hm2 [2], which represents an important part of the world’s plantation forests, playing an indispensable role in timber production, increasing carbon sinks and alleviating global climate change [5]. In China’s main eucalypt producing areas, the proportion of clonal plantations is at more than 90% [6,7]; however, the use of few clones in afforestation for a significant period of time and the low quality of those clones are among the important reasons for the decline in stand quality in recent years [8]. Therefore, studying the trait performance of eucalypt clonal plantations, quantitatively characterizing the tree growth and analyzing the genetic variation, are some of the important ways to promote the sustainable development of eucalypt plantations, while there is also an urgent need for the socio-economic development and construction of an ecological forestry civilization [9,10,11].
A phenotype is the set of observable characteristics that an organism exhibits under the control of underlying genes and the influence of its environment [12]. The diameter at breast height (DBH), tree height (H) and crown width (CW) are extremely important and widely used phenotypic parameters of tree growth. In addition, DBH and H, as significant components in tree measurement, are crucial fundamental data for a thorough evaluation of plantation production, the ecological benefits, and a management plan determination [13]. Moreover, by regulating the effective foliage area for light absorption and photosynthesis [14,15], which defines a tree’s competitive position in the forest [16,17], the tree height and canopy size can greatly affect the stand growth and wood yield.
Obtaining multi-scale, multi-dimensional and high-precision tree phenotype data is a key step to clarify the genetic control of phenotypic tree traits [18], and it is also an important bridge to study the mechanism of the “gene-phenotype-environment” [19]. Traditional, manual, phenotype information collection methods are often destructive, inefficient, and labor-intensive, and it can be hard to obtain growth information [20,21]. For example, for trees with tall individuals, long growth spans, and complex genome sequences and habitats, large-scale phenotypic trait monitoring is difficult and expensive, which affects the rapid development of the forest breeding industry [22,23]. Unmanned aircraft remote sensing technology can gather high-resolution, multi-spectral images at a low altitude, and it can not only obtain extensive forest condition data in a timely and nondestructive manner, but it can also improve the fineness to the structure of the branches and leaves, and the reflective spectrum within an individual tree canopy, thereby increasing the accuracy of the information extraction and the efficiency of the data acquisition [24,25]. In recent years, with the development of artificial intelligence and computer vision algorithms, UAV remote sensing has been gradually applied to the inversion of the forest structure and physicochemical parameters as well as the forest biomass [26,27], the classification of dominant forest species [28,29] and the dynamic monitoring of forest resources [30]. The application of this technology to precisely collect phenotypic forest variables and combine them with forest genetic breeding operations, nevertheless, has received little understanding. Currently, one study has already used UAV-LiDAR technology to detect the differences in growth and morphological traits among different families in a eucalypt trial with known genetic gain gradients, finding that the structural traits of trees were greatly influenced by their genetic diversity [31]. However, due to the high cost of acquiring data via LiDAR technology, this type of study is challenging to promote in large-scale applications for achieving dynamic monitoring, indicating that the advantages of UAV remote sensing technology are to be found in acquiring high-throughput phenotypic tree traits.
Compared to UAV-LiDAR, the use of UAV photogrammetry technology can produce high-density three-dimensional point clouds with the aid of stereo photogrammetry processing algorithms, as well as obtaining high-resolution, multispectral images. This technology can accurately estimate the forest structure in a multi-scale and multi-dimensional manner while further reducing the cost and data processing requirements, and it can ensure low-cost continuous dynamic monitoring, which is a key direction for forestry remote sensing for small and medium scale applications with high precision [29].
In addition, forest canopies are affected by the chlorophyll, tissue cell structure and water content in foliage, which show a different reflectance at specific wavelengths [32]. For a quantitative and qualitative assessment of the vegetation condition, vegetation reflectance spectra extracted from aerial multispectral imagery have been used to reflect the physiological health of forests, the invert foliage pigments and the biomass [33,34]. The vegetation index (VI) is derived by the calculation or statistical transformation of multiple spectral bands. On the basis of ensuring the effective acquisition of optical image information, it is necessary to comprehensively consider the influence of atmospheric space-phase variation, soil properties and electromagnetic radiation [35,36].
Until now, VIs have been used in a number of high-throughput phenotypic studies of field crops [37,38,39], while the frontier of forestry high-throughput phenotype studies have mostly focused on the growth and structural traits of trees [17,31,40,41,42]. A previous study on the genetic variation of slash pine families analyzed both tree growth traits and VIs, but it did not construct a strain evaluation framework combining them in the selection of superior genotypes [43]. Most of the genetic breeding experiment studies on eucalypt, however, are still based on traditional artificial methods to measure the phenotype, which have not been combined with remote sensing technology [10,44,45].
In this study, a typical plantation trial with multiple clones of Eucalyptus was implemented for research. High-resolution and high-overlap images were acquired using a multi-rotor UAV equipped with multiple spectral sensors, and then the tree growth parameters were extracted from point clouds obtained by aerial stereo photogrammetry. After the extraction of individual trees from the point clouds, a series of vegetation indices calculated from the multi-spectral images within the individual tree crown were combined as new, indirectly-phenotypic traits of the trees, and the genetic parameters were then calculated to analyze the genetic variation and to select the superior clones by using a mathematical statistics model of a forestry experiment. This is intended to serve as a guide for future applications of precise remote sensing in forest genetic breeding experiments and to advance eucalypt clonal development. The specific study goals were to: (1) verify the accuracy of an individual tree growth phenotypic parameter extraction based on digital aerial photogrammetry (DAP) point clouds; (2) to analyze the genetic variation of tree growth traits and vegetation indices after extracting individual trees from the point clouds, and to calculate the repeatability of all the traits and the genetic correlation coefficient between traits; and (3) to rank eucalypt clones by combining the selection index of traits, in order to choose superior genotypes and predict their genetic gain.

2. Materials and Methods

The technical route of this study is shown in Figure 1. First of all, the experimental area’s remote sensing data was first collected by UAV, and then pre-processed to produce multispectral orthophoto and DAP point clouds. Then, the DAP point clouds were normalized with the help of a digital elevation model extracted from backpack LiDAR-based point clouds. An individual tree segmentation algorithm was performed using the marker-controlled watershed algorithm by the normalized DAP point clouds. The tree growth trait parameters were then extracted within the tree crowns, and the accuracy was assessed by the field measurements. Moreover, the vegetation index maps covering the experimental area were calculated based on a multispectral orthophoto, and the spectral eigenvalues were counted within an individual tree canopy. With this, the growth and spectral phenotypic trait values of all trees in the site were totaled. Finally, the genetic parameters were calculated by an analysis of variance (ANOVA), the genetic variation was analyzed, the clones were comprehensively evaluated for their preference, and then the genetic gain of the superior clones was predicted.

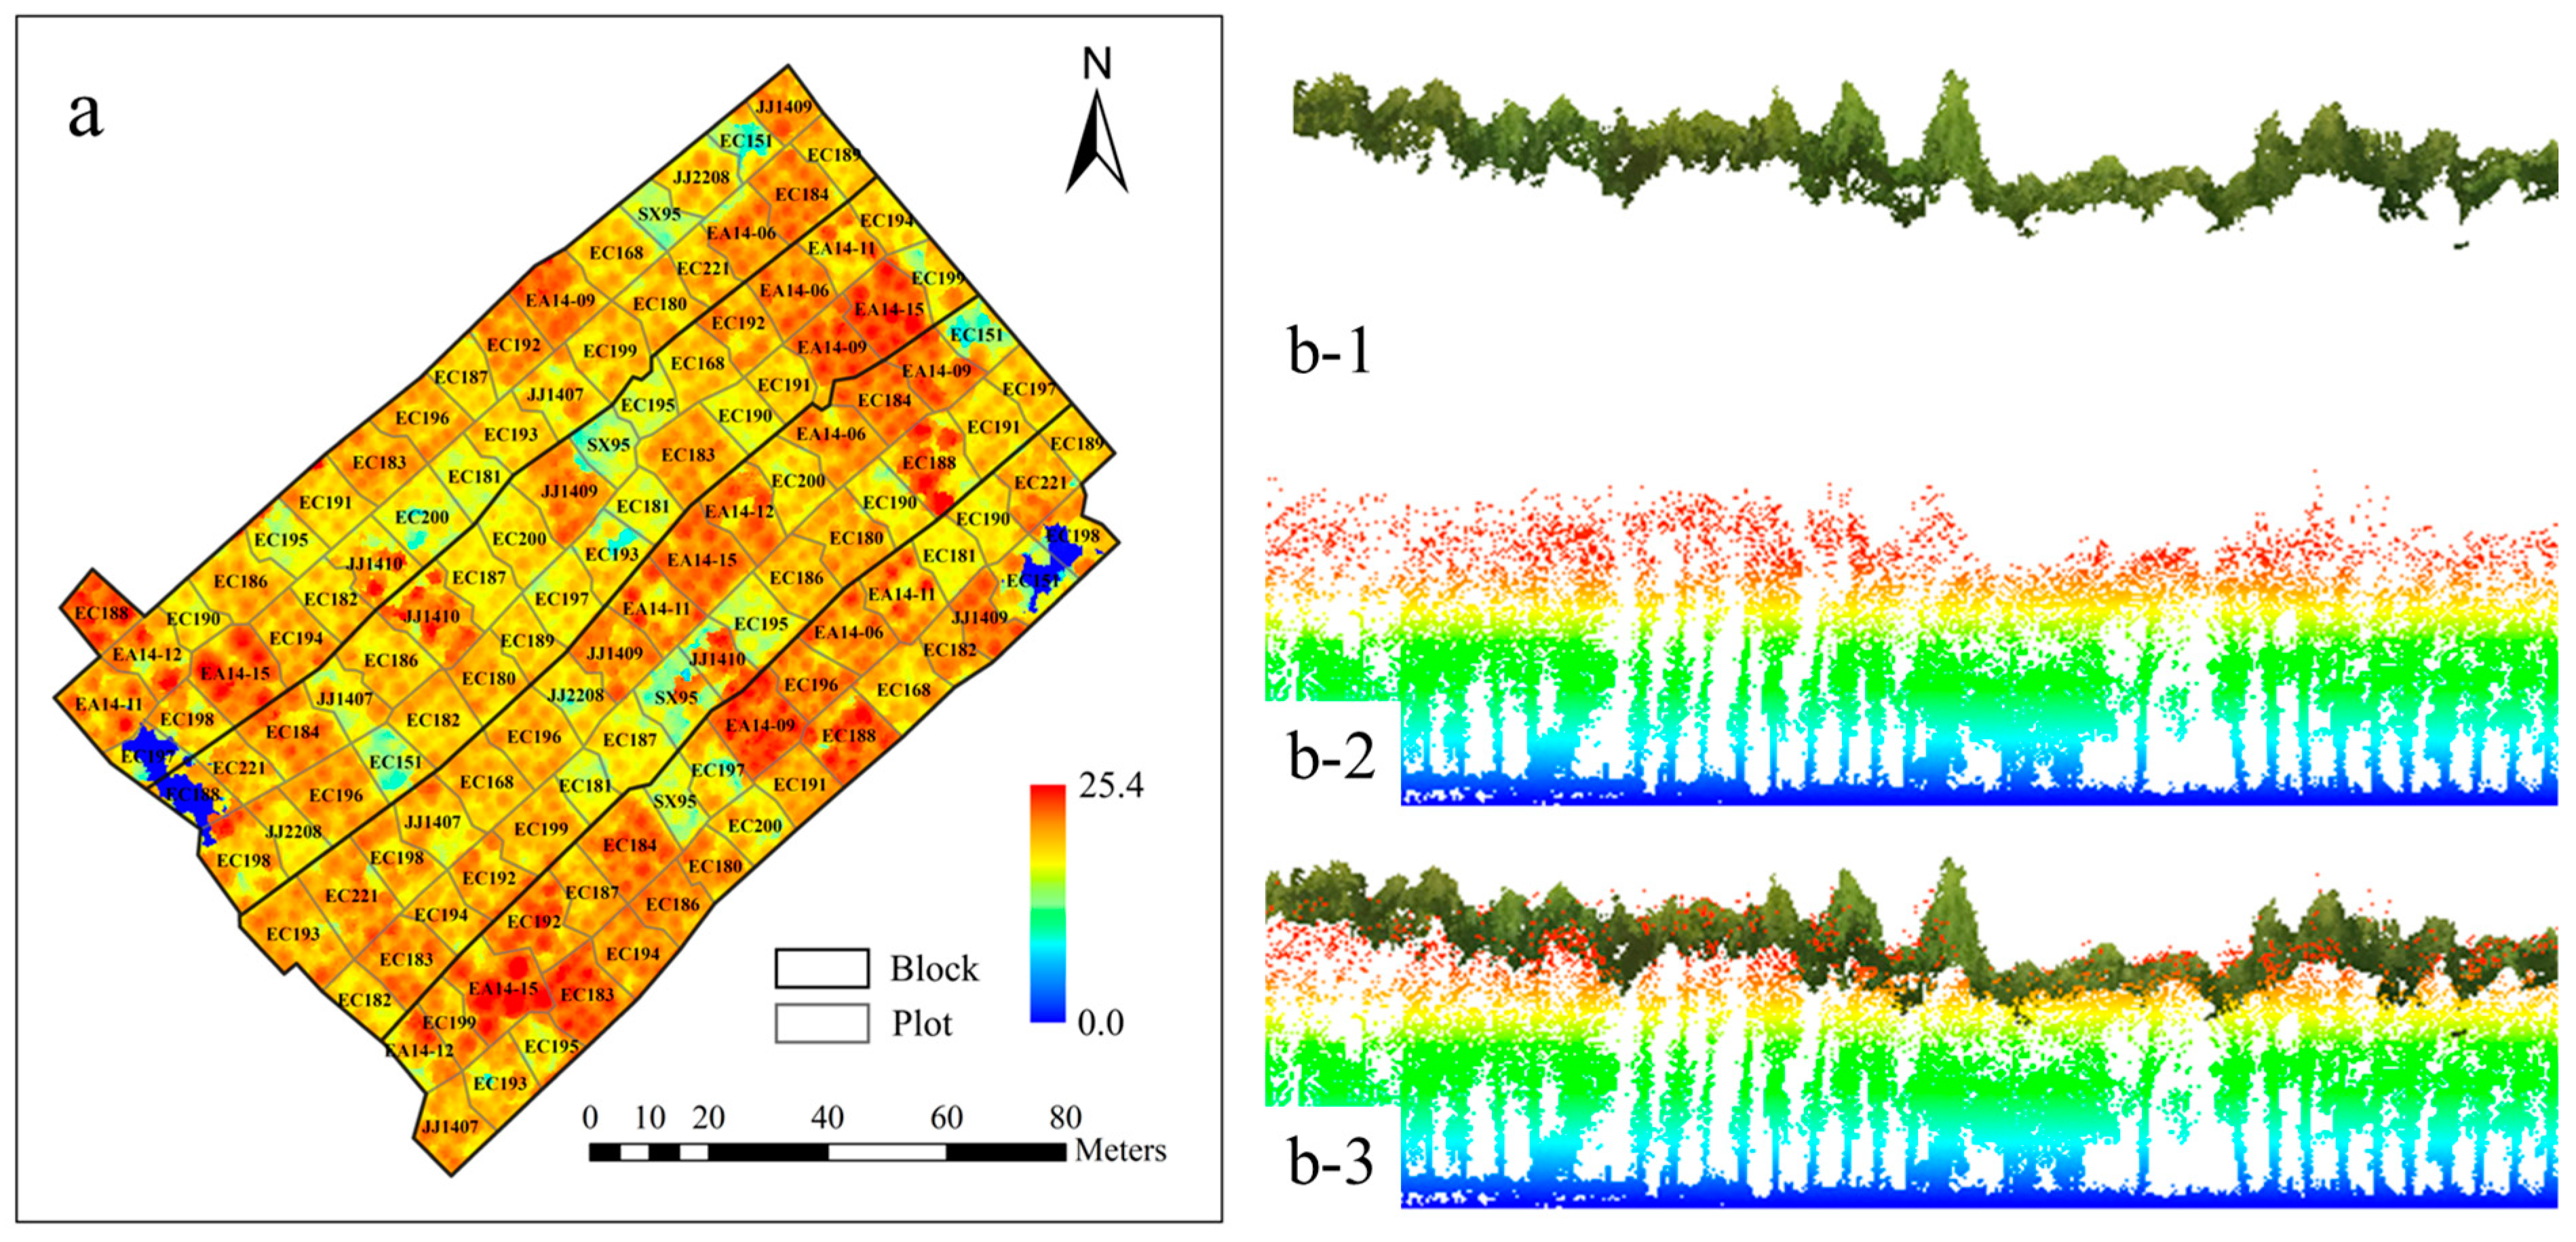
2.1. Site Description

The clonal trial site was located in the State-owned Dongmen Forest Farm in the Guangxi Zhuang Autonomous Region (Figure 2a). The Dongmen Forest Farm is an important eucalypt germplasm research base in China, integrating the scientific research, development and production of Eucalyptus spp., which is also the largest eucalypt gene bank in Asia and the largest eucalypt seedling propagation research and production base in Guangxi. An improved breeding system that closely combines sexual and clonal breeding has been established since the introduction of a large number of genetic resources were started in 1982. As a result, the research on eucalypt clonal breeding in the Dongmen Forest Farm has always been kept at the world’s advanced level [46]. The forest farm is located at 107°15′~108°00′E and 22°17′~22°30′N. It belongs to the southern subtropical monsoon climate zone, with average sunshine of 1634–1719 h and average rainfall of 120–180 days per year [47].
The altitude of this site is in the range of 133.0 to 144.5 m. The eucalypt clones in the trial were planted in July 2016 in a randomized plot design containing 33 clones, with 4 blocks (i.e., replicates), and each containing 31–33 plots; the plots were uniformly 4 rows of 5 plants with a spacing of 2 m × 3 m (Figure 2b). The stands within each plot were asexual propagation branches of the same eucalypt hybrid or a pure species with the same genotype, and each clone had a number corresponding to the parents and its seed background information (Figure 2c).

2.2. Data Acquisition

2.2.1. Field Data Collection

The ground survey was conducted on 18 July 2022. A total of 89 typical individual trees were measured, including the DBH, tree height and height under branch, in each plot of the site. The DBH was measured at 1.3 m of the tree height with a breast diameter ruler; the tree height and height under branch were measured using a Vertex IV ultrasonic altimeter. A Trimble R6 GNSS (Trimble, Westminster, CO, USA) was used to measure the coordinates of sample corner points and the locations of typical trees, which is more accurate than 0.5 m by receiving a wide area differential signal for positioning.

2.2.2. UAV Data Acquisition

The DJI Phantom4 Multispectral UAV was used to collect the planation images. This UAV has a multispectral imaging system, integrated with one visible light camera and five multispectral cameras, all of which have a resolution of 2 million pixels. At the same time, a time synchronization system was configured, and combined with the high-precision D-RTK 2 GNSS mobile station, the millisecond error of the camera imaging time was realized by a microsecond synchronization of the flight control, camera and RTK clock system, while a real-time compensation was made for the center position of each camera lens and antenna center position combined with the attitude information of the UAV. The orthophoto with high precision coordinate information, thus, could be obtained without laying the image control points. More specifications of the UAV are listed in Table 1.
The data were collected on 20 July 2022, when the sky was clear without cloud cover. Before flight, 50% of the calibration cloth was laid in an open area next to the site for a radiometric calibration of the multispectral images. The flight altitude was set at 120 m, and the horizontal and vertical overlap degrees were both set at 80%.

2.2.3. Backpack LiDAR Data Acquisition

The LiBackpack DGC50 scanning system was used to collect the point cloud data to obtain the digital terrain of the site. The device was equipped with LiDAR sensors in horizontal and vertical directions, respectively, and a high-resolution panoramic camera and high-precision GNSS equipment could also be selected. Being used in conjunction with simultaneous localization and mapping (SLAM) technology, the scanning area could produce high-resolution panoramic images and highly accurate 3D point clouds. More specifications of the LiBackpack DGC50 are listed in Table 2. The backpack LiDAR data acquisition was completed on 24 July 2022.

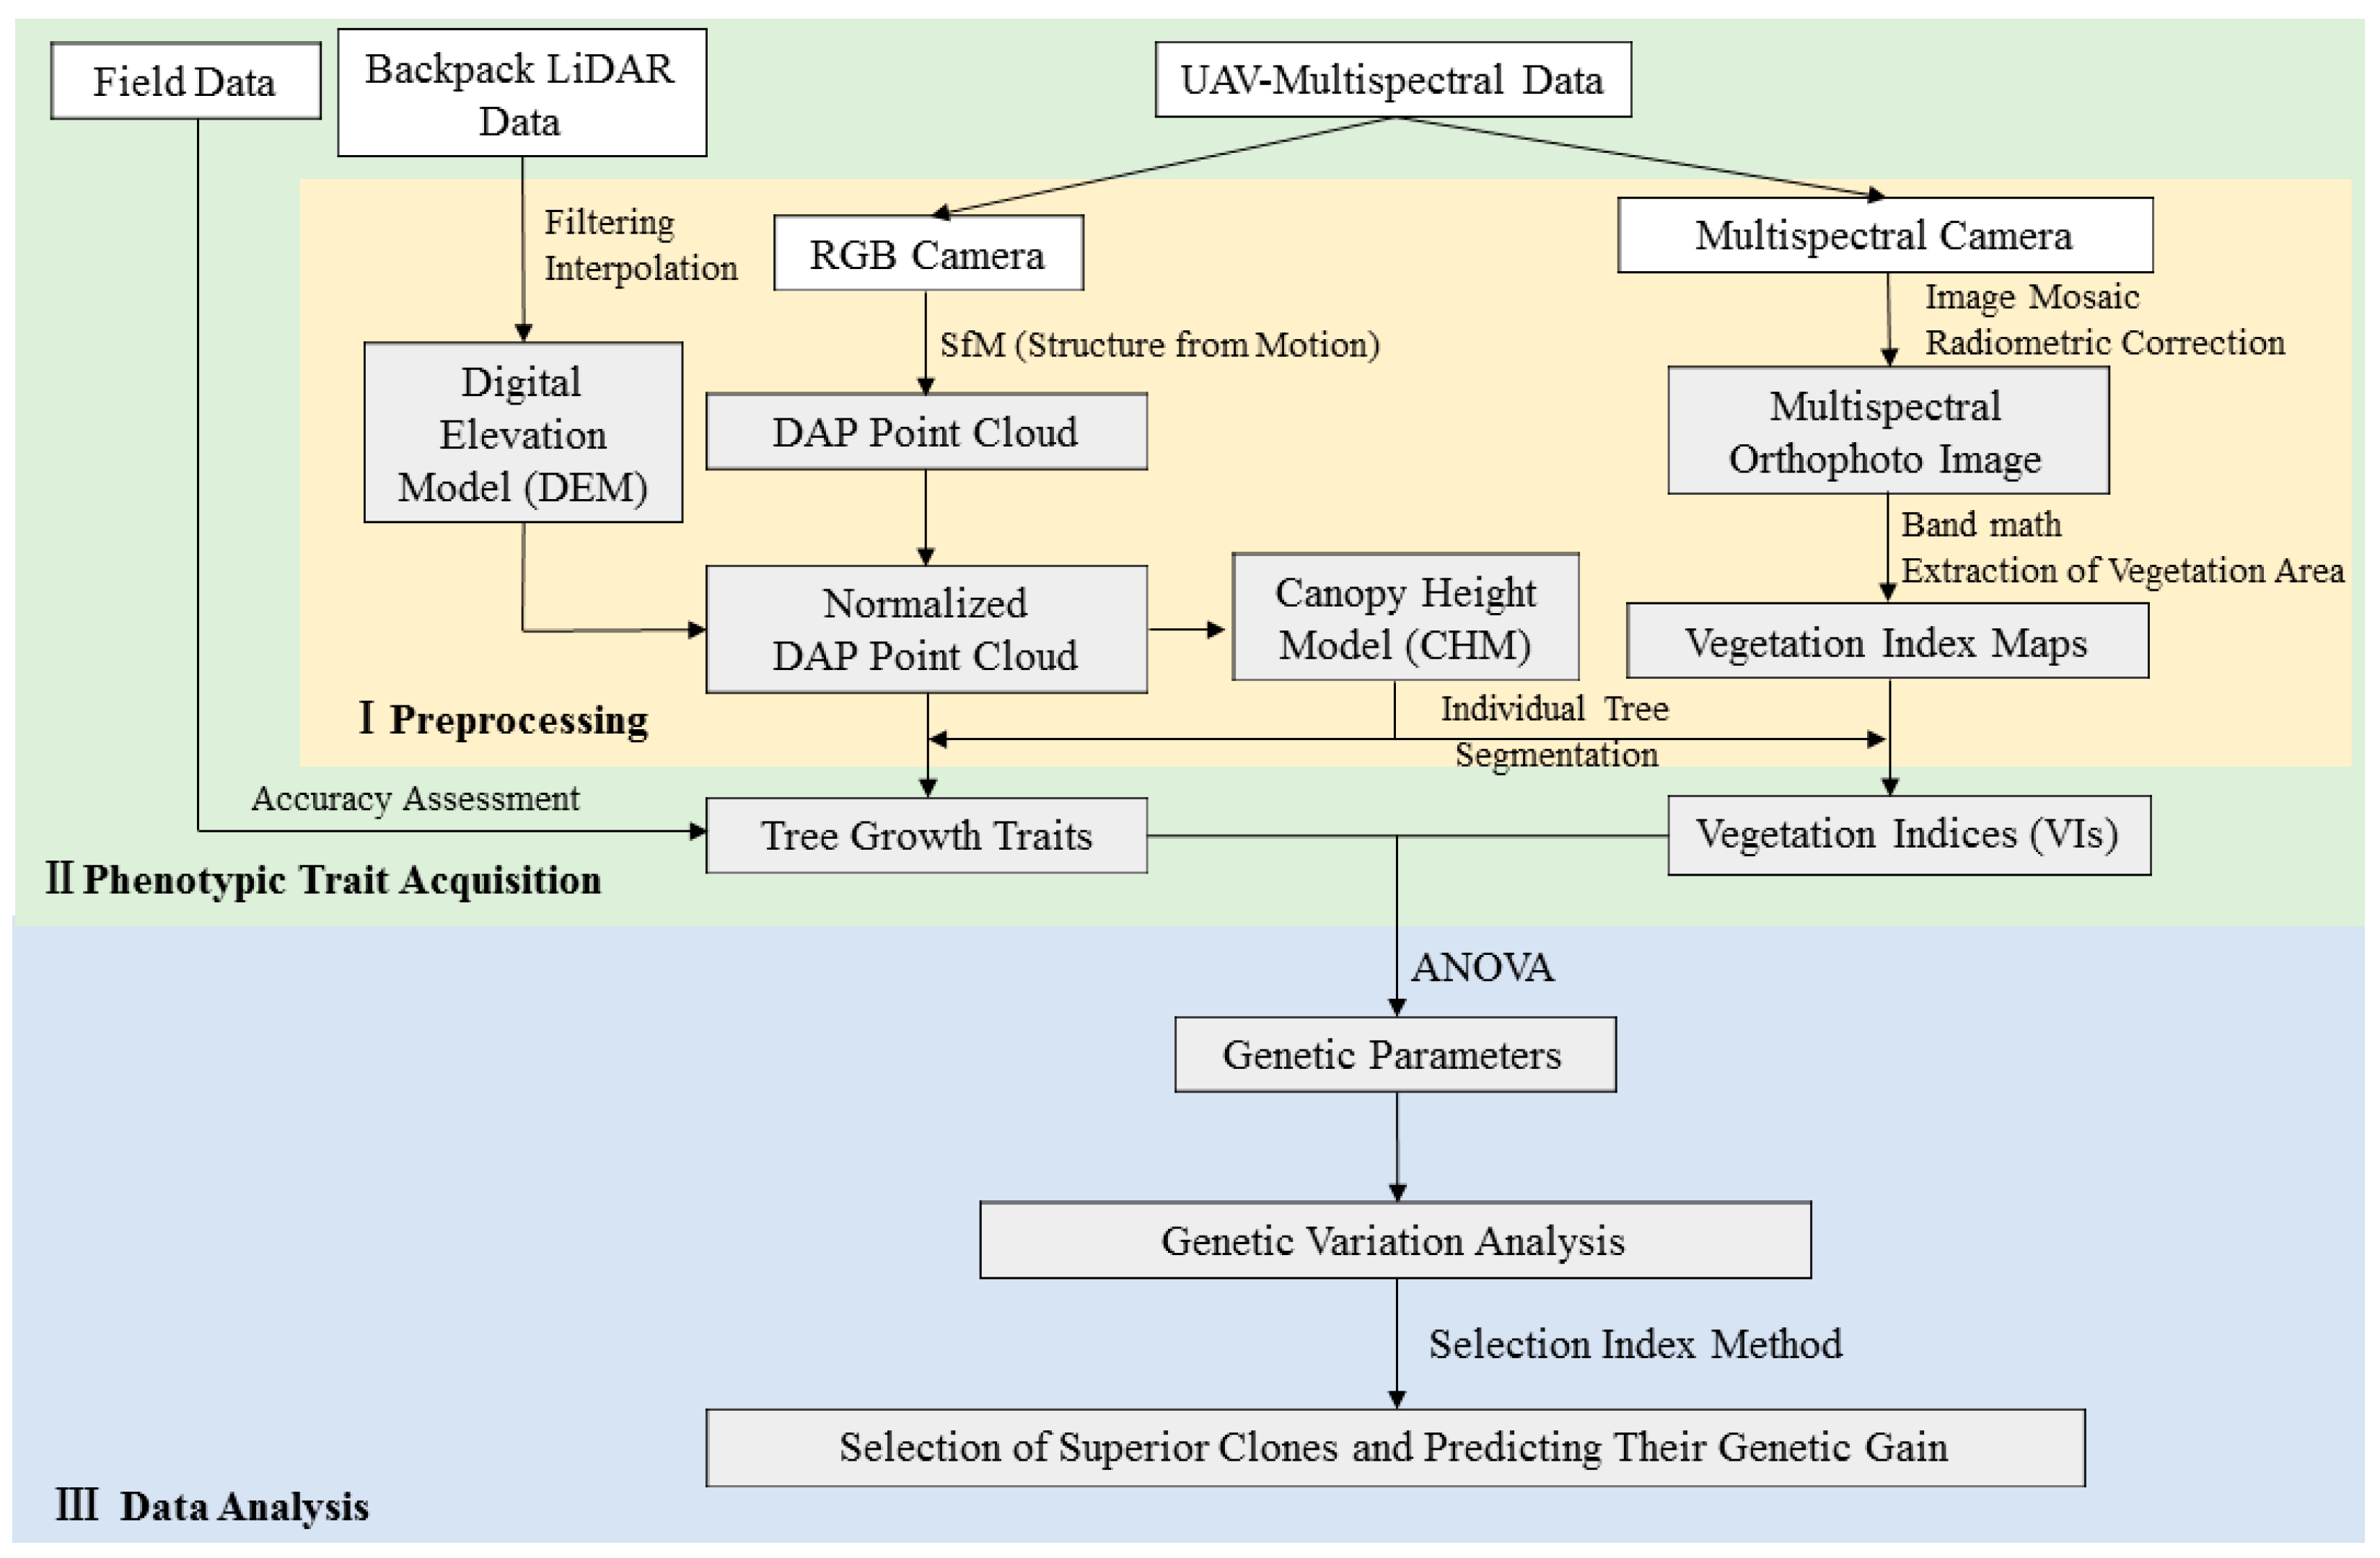
2.3. Data Processing

2.3.1. UAV and Backpack LiDAR Data Pre-Processing

For the multispectral images, the aerial photographs with a high-overlap and their internally recorded POS data were used for a 2D reconstruction and radiation correction to generate a multispectral orthophoto with a spatial resolution of 0.057 m. For the RGB images, after image mosaic and feature point matching, a 3D reconstruction was performed based on the Structure from Motion (SfM) algorithm to finally obtain a high-density point cloud. The digital aerial photogrammetry (DAP) point cloud was obtained with an average point cloud density of 370 pts/m2.
The LiDAR data were pre-processed by firstly removing the high coarseness and low coarseness through point cloud filtering, and secondly, by aligning the LiDAR point cloud with the DAP point cloud using a polynomial correction algorithm, before finally classifying the ground points using an improved progressive encrypted triangular mesh filtering algorithm [48], and generating a digital elevation model (DEM) with a resolution of 0.3 m by a kriging interpolation of the extracted ground points. The DAP point cloud was normalized by the DEM, and then the normalized DAP point cloud was interpolated to generate a canopy height model (CHM) with a resolution of 0.3 m.

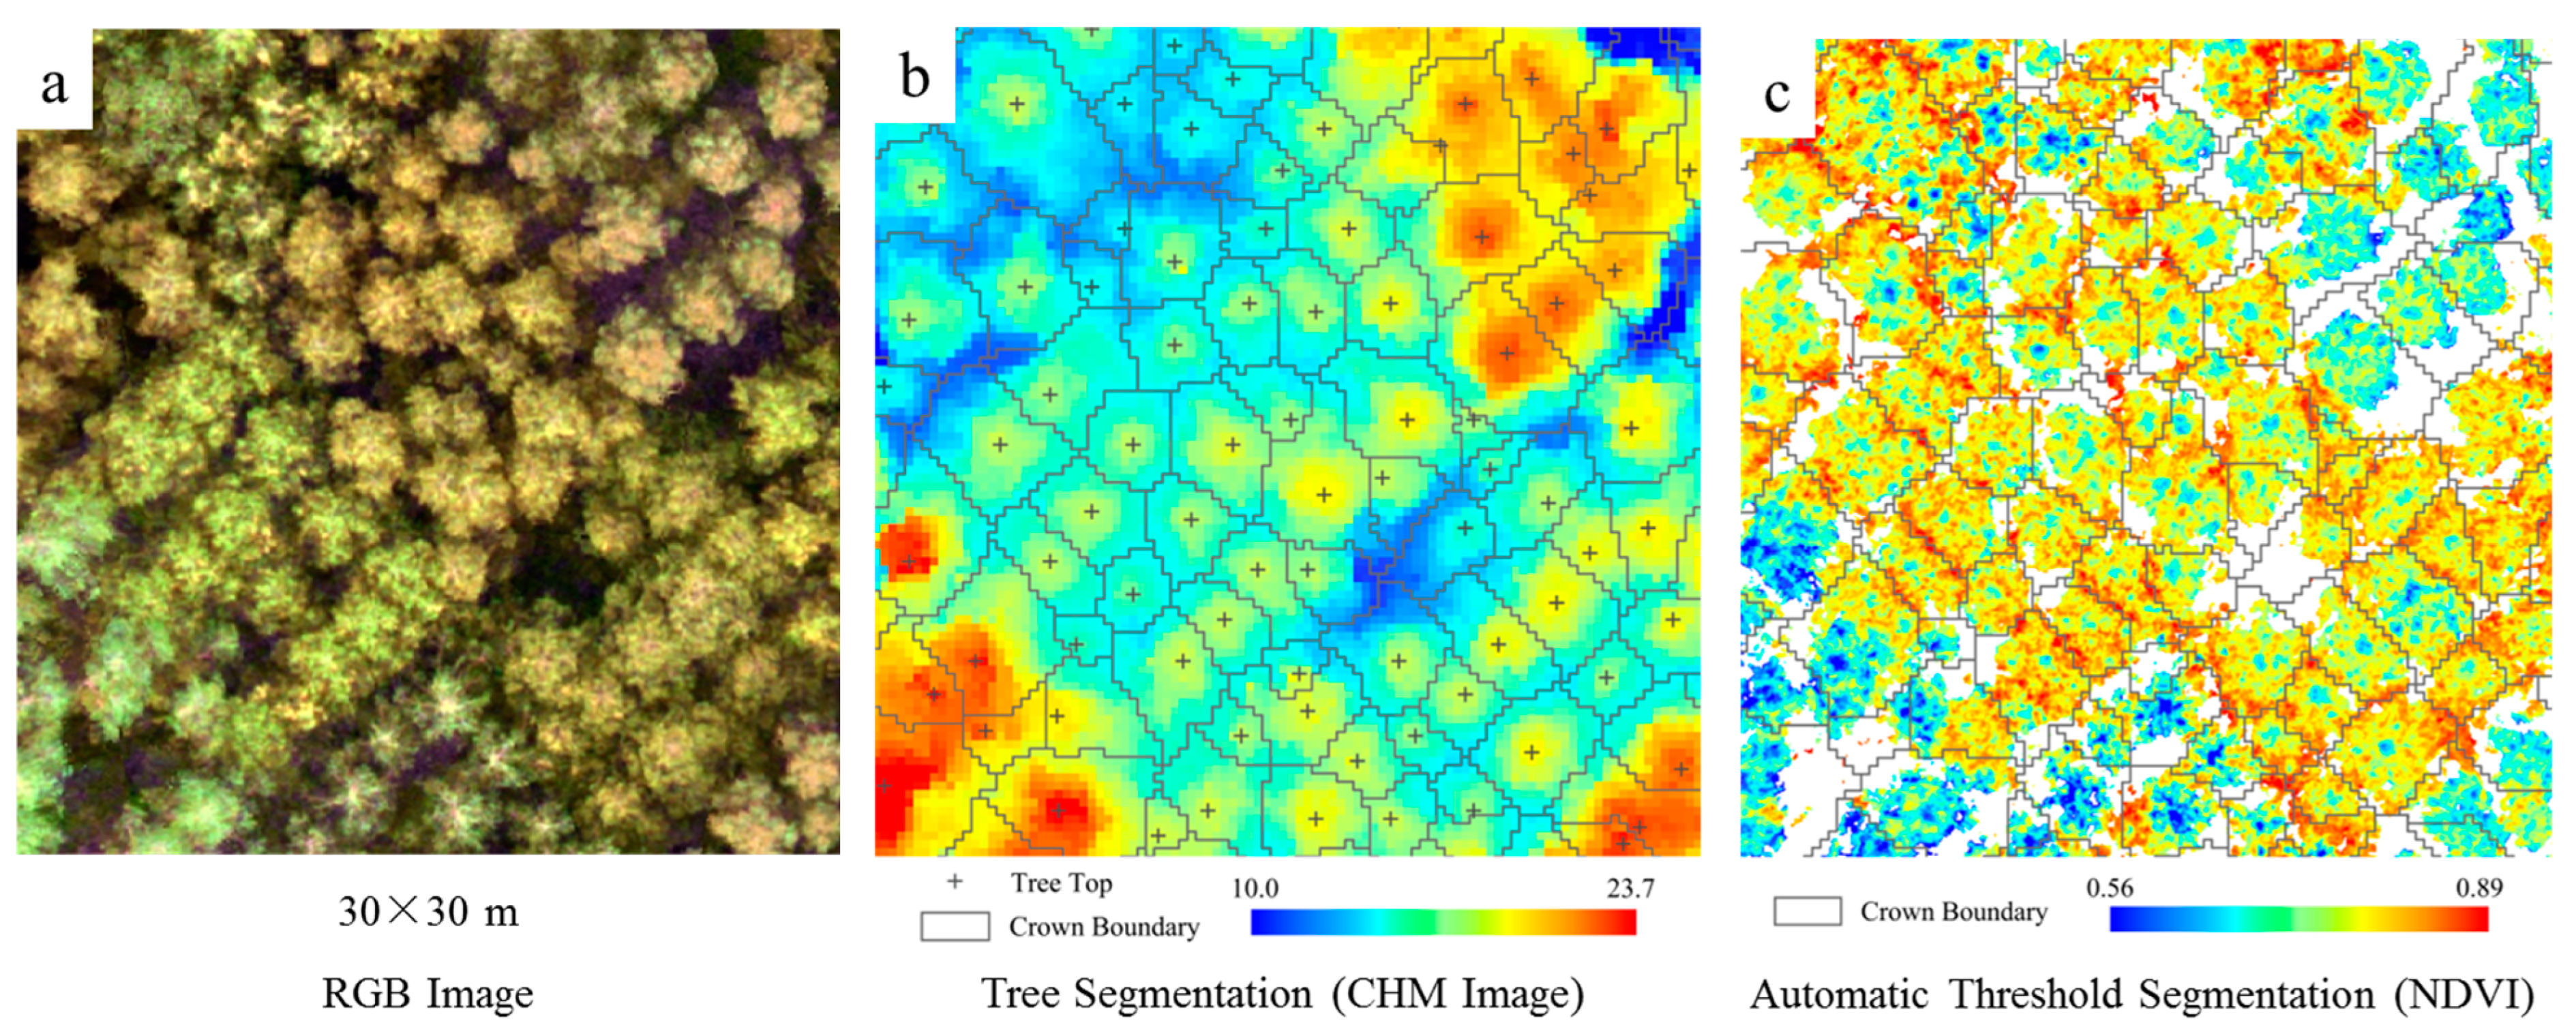
2.3.2. Individual Tree Segmentation

An individual tree segmentation was performed by a marker-controlled watershed algorithm [40]. This method marks local maxima as the canopy vertices (which are considered as peaks), while local minima are considered as valleys, and the water confluence of different valleys as the individual tree segmentation boundary. The variable window size is determined by the lower limit of the prediction interval of the regression curve between the canopy size and tree height, which avoids the over-segmentation issue compared to the traditional watershed algorithm [49,50]. After the segmentation was completed, 6 plots were randomly selected from each block group for an accuracy evaluation. A confusion matrix F-score was used as the evaluation index of the individual tree segmentation results [51], with three formulas:
r = N t N t + N o
p = N t N t + N c
F = 2 ( r × p ) r + p
where r is the crown detection rate, p is the crown accuracy rate, and the F-score is calculated from r and p , considering both the missed and over-segmented total accuracy. N t is the number of canopies correctly segmented by the algorithm, N o is the number of canopies missed by the algorithm, and N c is the number of canopies over-segmented by the algorithm. After the completion of the individual tree segmentation, they were categorized with reference to the boundaries of the divided clonal plots.

2.3.3. Phenotypic Traits Extraction

The extracted phenotypic traits in this study are shown in Table 3. Among them, the H, DBH and CW were extracted based on the DAP point cloud, and the height threshold of the point cloud was set as 2 m to reduce data errors caused by understory shrubs. The maximum point cloud height within the boundary range of an individual tree was extracted as the H. For the DBH, it was obtained through a DBH-H model established by Liao et al. [40] based on the quadratic function, and the determination coefficient (R2) and root mean square error (RMSE) were used to evaluate the accuracy of the model based on the measured data. The CW was obtained based on the polygons that represented the boundaries of the trees in the individual tree segmentation results, and by calculating the diameter of the area assuming that the canopy was circular.
In addition to extracting the tree growth traits using point clouds, vegetation index maps were created by band math based on two-dimensional multispectral images. It has been demonstrated that the spectra of different species of Eucalyptus exhibit similar characteristics in the shape and location of their absorption characteristics, but statistically significant differences do exist. The selected vegetation indices for each species are shown in Table 3. The ratio vegetation index (RVI) is a parameter proposed by Jordan in 1969 to reflect the vegetation cover by the ratio of the near-infrared band to the red band [52]. The normalized difference vegetation index (NDVI) is obtained from the RVI by nonlinear normalization [53], and is a vegetation index used by ecologists to track the physiological dynamics of the key traits of tree species and applied as the vegetation productivity [54,55]. The difference vegetation index (DVI) is sensitive to changes in the soil background [56], while the soil-adjusted vegetation index (SAVI) and the modified soil-adjusted vegetation index (MSAVI) can further reduce the influence of soil on the vegetation extraction [57,58]. The enhanced vegetation index (EVI) can reflect the vegetation condition stably and reduce the influence of atmospheric and soil noise at the same time [59]. The nitrogen reflectance index (NRI) was first established in agricultural maize research and can be related to the actual nitrogen value of each growth stage of vegetation in a 1:1 ratio [60,61]. The green normalized difference vegetation index (GNDVI) is a modification of the NDVI, using green instead of red as the vegetation-sensitive band, which can measure the chlorophyll content more accurately [62]. The red edge chlorophyll index (RECI), normalized difference red edge index (NDRE) and the modified red edge normalized difference vegetation index (mNDI) were also selected. As a vegetation-sensitive band, the red-edge band has been proved to reflect vegetation growth dynamics more effectively [63,64]. All the vegetation indices highlighted above have been reported in the biomass estimation [65], leaf nitrogen concentration [66], and forest diseases and pests [67,68] of Eucalyptus.
Table 3. Individual tree phenotypic traits extracted based on UAV data. Tree height (H), diameter at breast height (DBH), and crown width (CW) were obtained from normalized digital aerial photogrammetry (DAP) point cloud and individual tree segmentation results, and the vegetation indices (VIs) of individual trees were extracted from the vegetation index map after an automatic threshold segmentation combined with the individual tree boundaries.
TraitsDescriptionReference
HTotal tree height, maximum photogrammetric point cloud height within the boundary of individual tree boundaries.[69]
DBHDiameter at 1.3 m, derived from a quadratic function model using tree height.[40]
CWCrown width, assuming the crown is circular, calculated by dividing the area of the projected polygon (shapefile) describing the ground cover of the canopy by π and multiplied by 4.[31]
NDVI ( N I R R ) / ( N I R + R ) [53]
RVI N I R / R [52]
DVI N I R R [70]
EVI 2.5 [ ( N I R R ) / ( N I R + 6 R 7.5 B + 1 ) ] [71]
SAVI 1.5 ( N I R R ) / ( N I R + R + 0.5 ) [72]
MSAVI { 2 N I R + 1 [ ( 2 N I R + 1 ) ˆ 2 8   ( N I R R ) ]   } / 2 [73]
NRI N I R / G [60]
GNDVI ( N I R G ) / ( N I R + G ) [62]
ARI 1 / G 1 / E [74]
RECI N I R / E 1 [75]
NDRE ( N I R E ) / ( N I R + E ) [76]
mNDI ( N I R E ) / ( N I R + E 2 B ) [77]
Since the soil background noise in remote sensing images has a great impact on the spectral reflectance of vegetation, the maximum inter-class variance method [78] was used to determine the threshold value, and the VI maps were binarized. The segmentation results of one of the vegetation indices were visually selected to correctly segment the vegetation and soil area, and then the vegetation areas were extracted and masked for all images. Finally, the spectral traits of an individual tree were obtained by combining the results of the individual tree segmentation.

2.3.4. Statistical Analysis

  • Statistical Model of Variance Analysis
The value of a measured quantitative trait can be expressed by a statistical genetic model as:
Y ijk = μ + B i   + C j + ( BC ) ij + e ijk
where Y ijk is the k th phenotypic value of the j th clone in the i th block, μ is the overall mean for the extracted traits, B i is the fixed effect value of the ith block group ( i = 1 ,   2 ,   3 ,   ), and C j is the random effect value of the j th clone ( j = 1 ,   2 ,   3 ,   ). ( BC ) ij is the random interaction effect value of the j th clone in i th block. e ijk is the random error of the k th individual tree in the ij th plot.
2.
Genetic parameters estimation
The correct estimation of genetic parameters is of great significance for the development of expected genetic gains and a variety of selection strategies [79]. Repeatability refers to the degree that the phenotype of an individual organism of the same genotype is kept stable at different times or different sites, and its value ranges from 0 to 1, where the higher the value, the stronger the stability [80]. Biologically, it is defined as the proportion of the sum of the genotypic variance and the general environmental variance in phenotypic variance, and statistically, it is defined as the intra-group correlation coefficient between multiple production records of the same biological individual or the same clone [81]. Therefore, the analysis of the repeatability of clones is of great significance for clone selection and promotion. The formula for calculating the clonal repeatability ( R c ) and individual repeatability ( R i ) is as follows:
R c = σ b 2 σ b 2 + σ w 2 / r = 1   1 F
R i = σ b 2 σ b 2 + σ w 2
where σ b 2 is the component of the clonal genetic variance, σ w 2 is the environmental variance component, and r is the number of replications (i.e., the number of blocks).
To calculate the genetic correlation coefficient among phenotypic trait values, the genetic correlation coefficient removes the effect of environmental factors and can truly reflect the interrelationship of genetic effects among the traits [82]. It is calculated by the following formula:
r g = σ gxgy σ gx 2 σ gy 2
where r g is the genetic correlation coefficient, σ gxgy is the genetic covariance between trait x and trait y , σ g x 2 is the genetic variance of trait x , and σ g y 2 is the genetic variance of trait y .
Due to the different degree of plant absence in clones, and the calculation method of clonal repeatability being similar to that of half-sib family heritability, the HalfsibMS package in R software [83] was used for a statistical analysis and genetic parameters estimation, which used the most widely-used analysis of variance (ANOVA) to estimate the variance component of the model. The visualization of the genetic correlation matrix used the corrplot package in R software.
3.
Superior clone selection
A multi-trait comprehensive evaluation was carried out on all clones in the site by the selection index method [84], and the formula was as follows:
I = i w i R c i ( x i X i ¯ ) σ i
where I is the selection index value of a clone, R ci is the clonal repeatability of trait i   , x i is the mean value of the phenotypic trait i of the clone,   X i ¯ is the mean value of the phenotypic trait i of all clones, σ i is the standard deviation of trait i , and w i is the weight of trait i . The weight coefficients of the growth traits were set as w i = ( H ,   DBH ,   CW ) = ( 0.6 ,   0.3 ,   0.1 ) with reference to the related study of Liao et al. [40]. The weight of each vegetation index was equal to 1/12. The final selection index value was the result of the summation of two types of traits, namely, the growth traits and VIs.
Finally, after calculating the selection index values of all clones, the superior clones were selected by an inclusion ratio in different gradients to provide reference for more extensive phenotypic trials. The genetic gain of the phenotypic trait values of the selected superior eucalypt clones was estimated as follows [85]:
Δ G i = ( x i ¯ X i ¯ ) × R ci X i ¯ × 100 %
where Δ G i is the expected genetic gain of trait i , and x i ¯ is the mean value of the phenotypic trait i of the selected clones.

3. Results

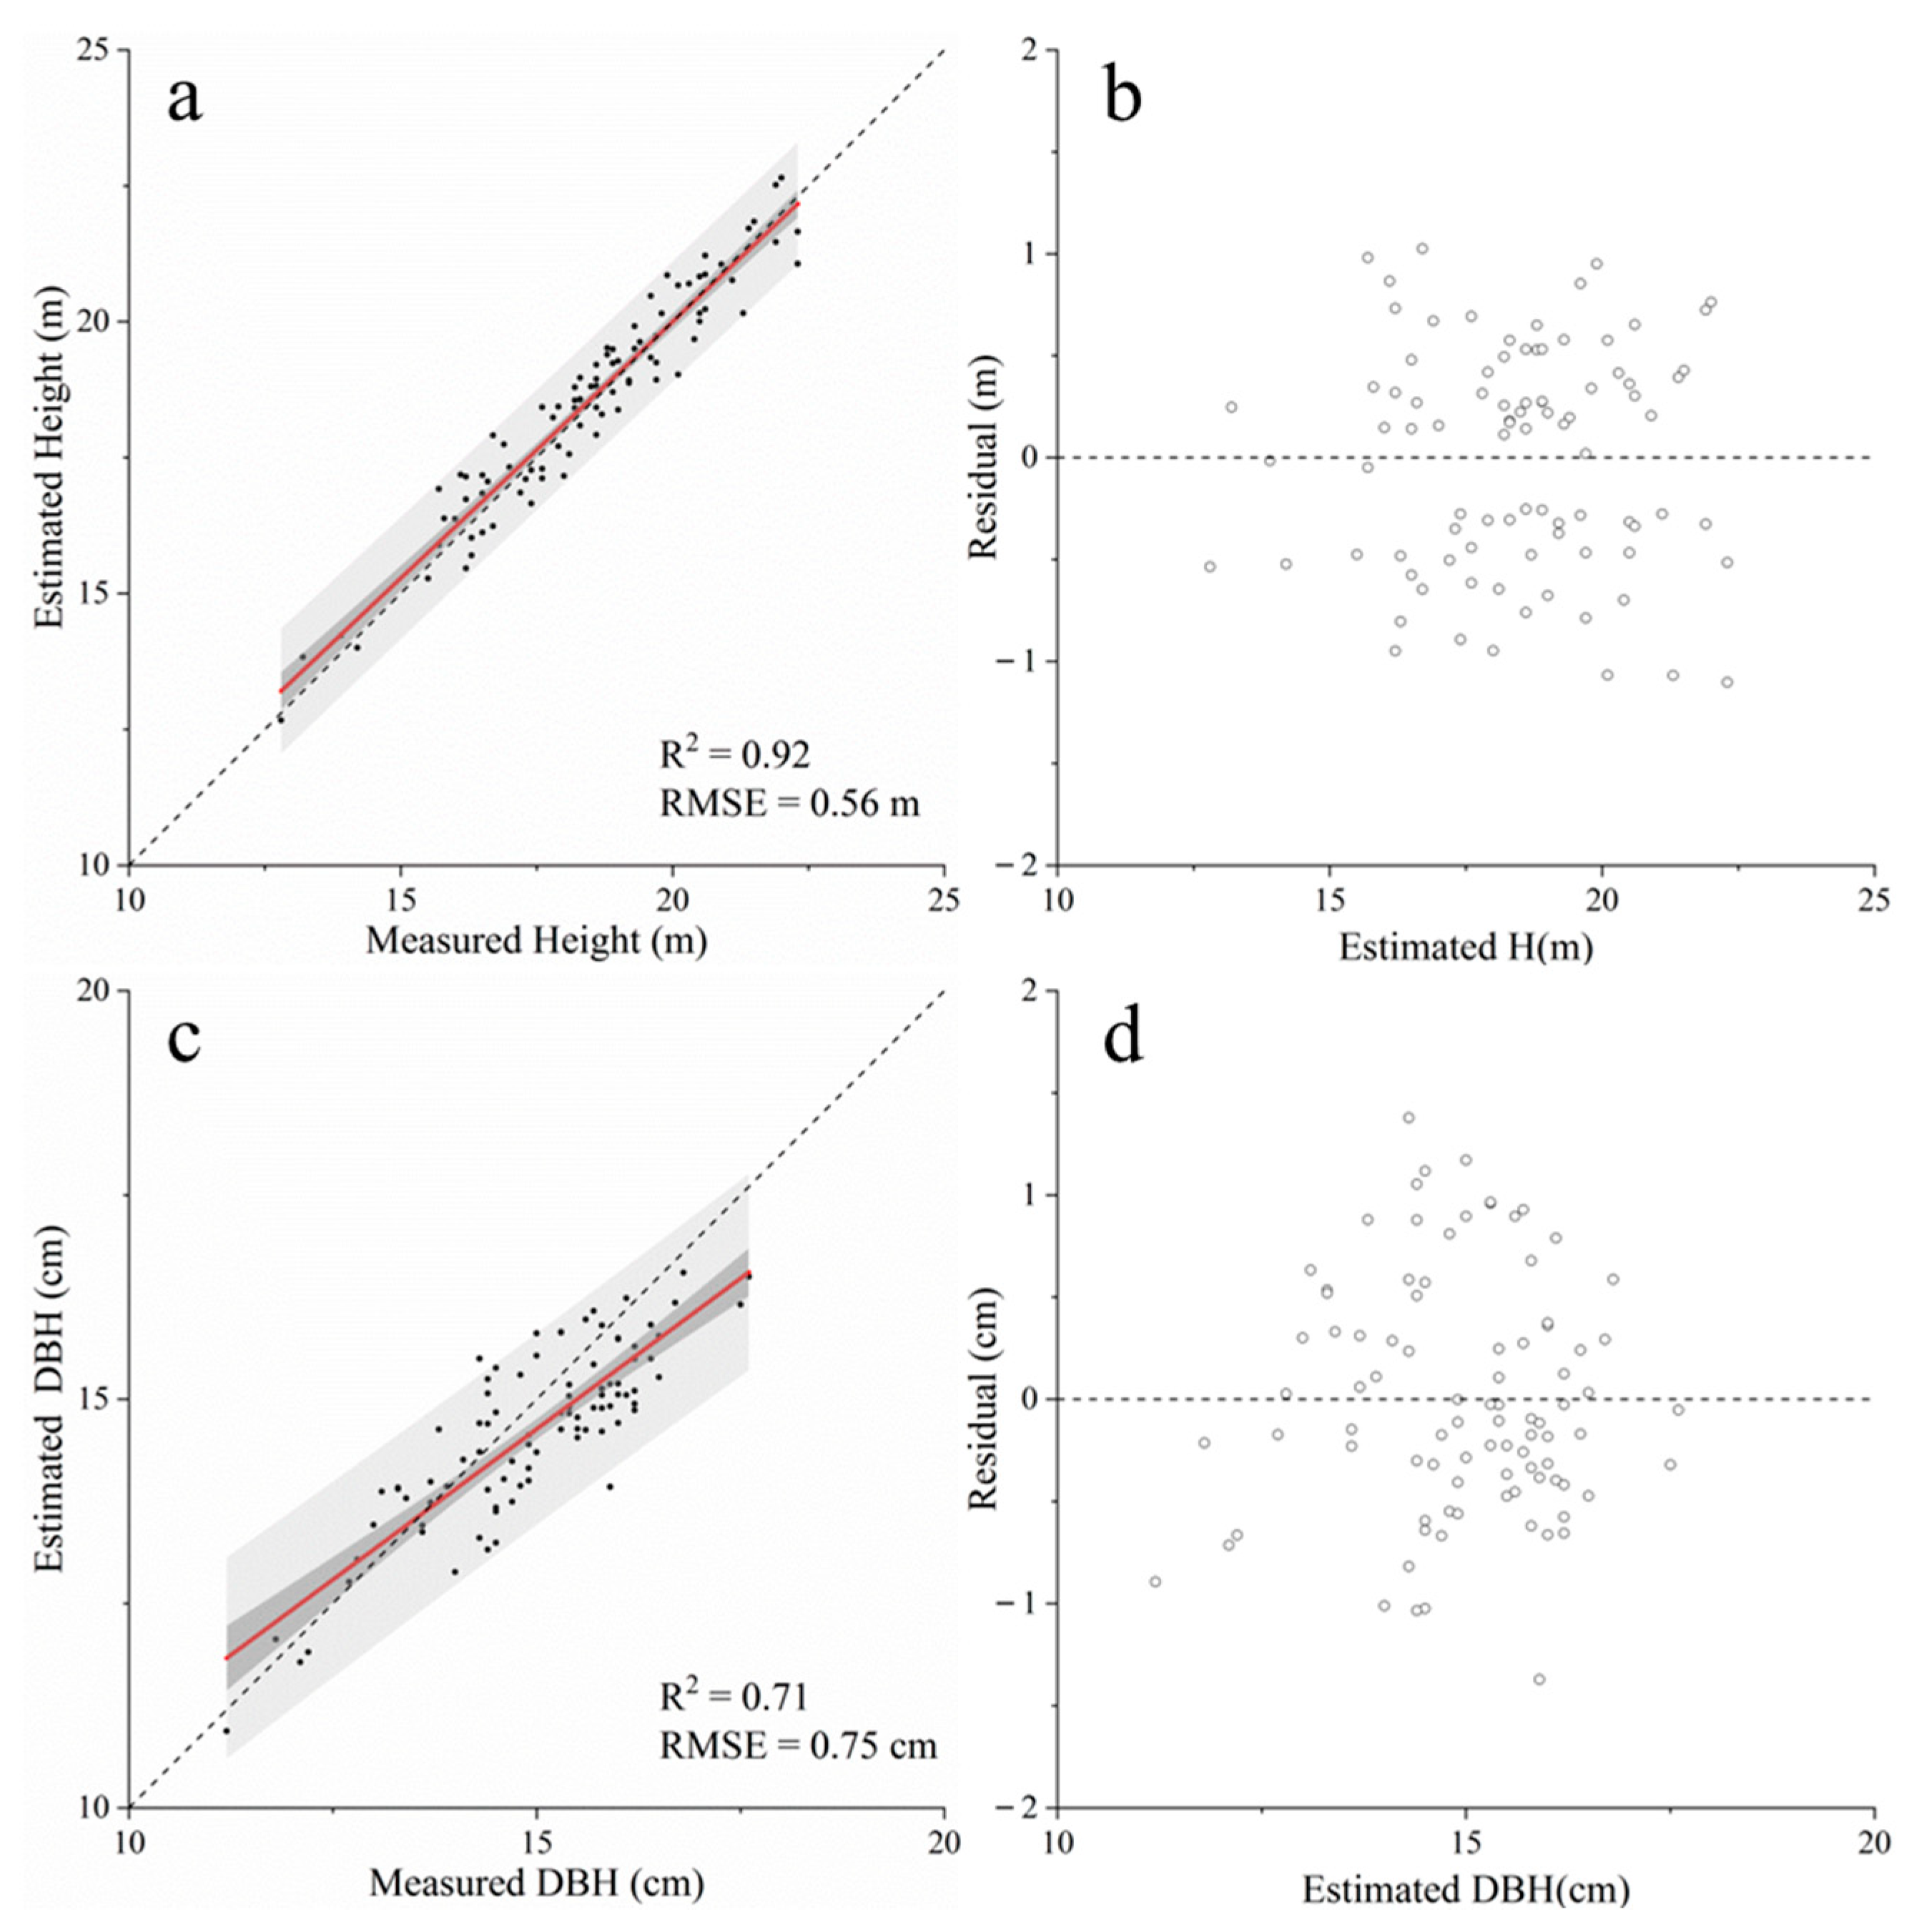
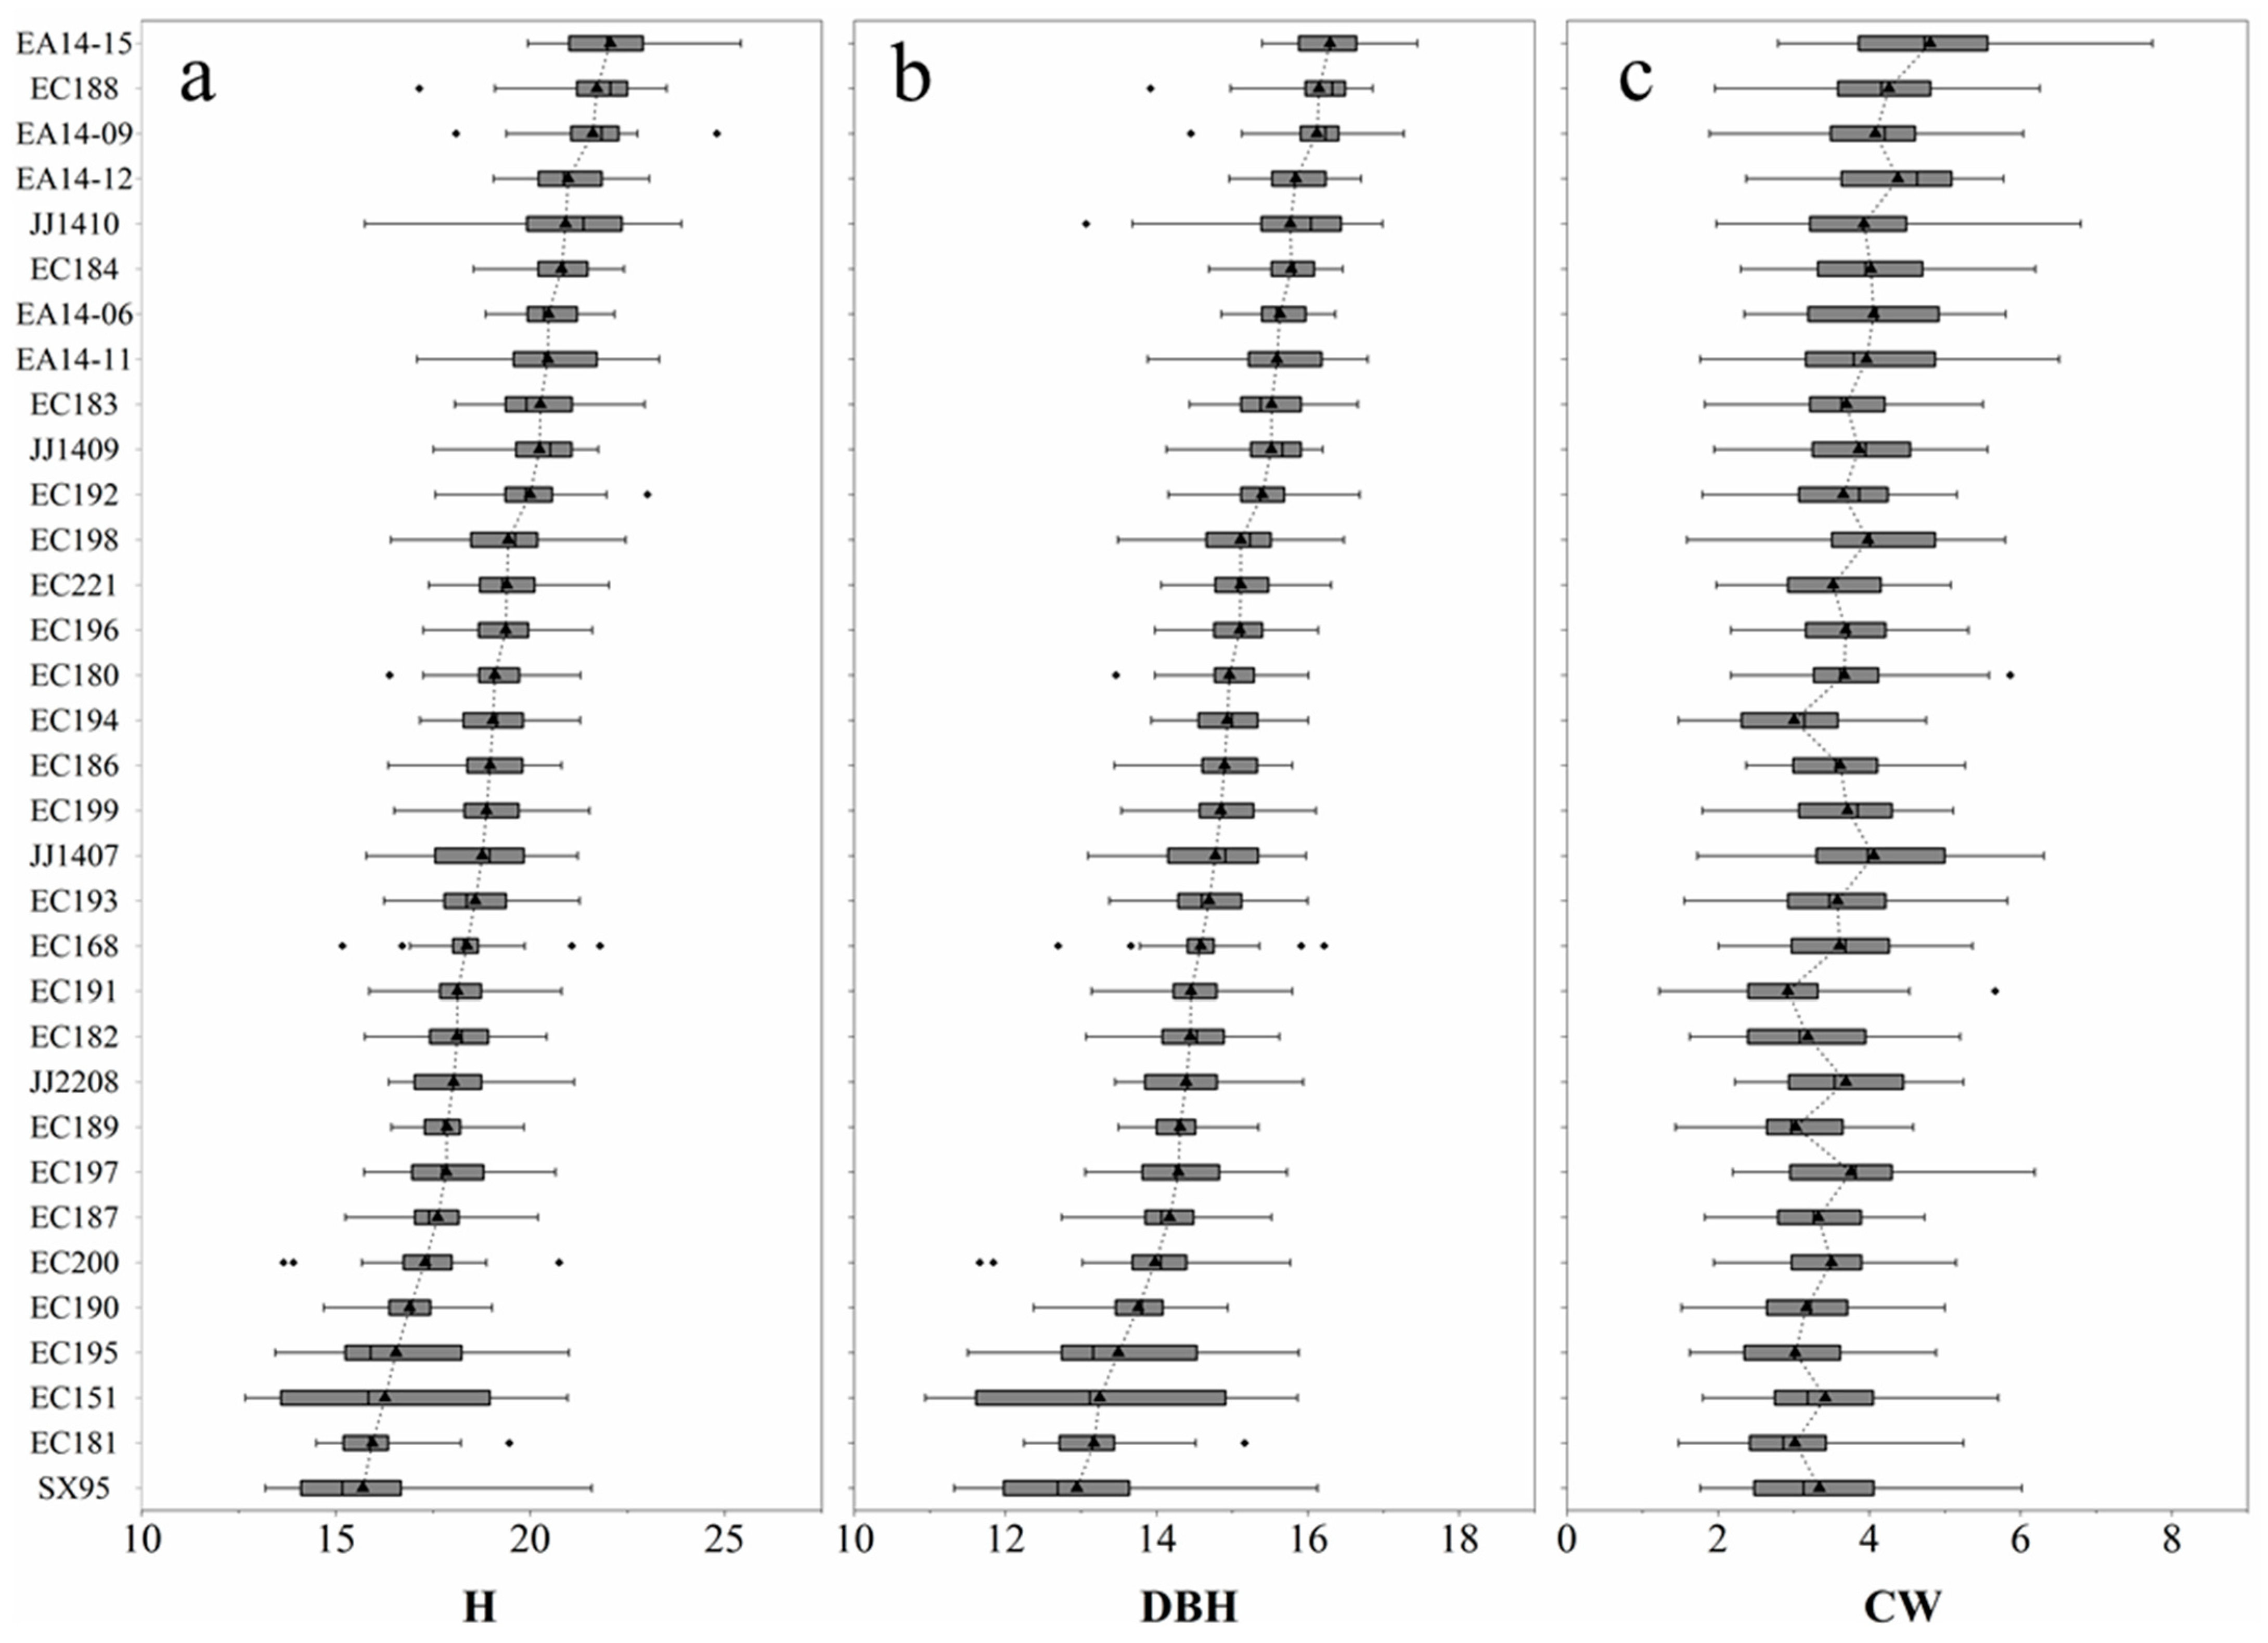
3.1. Traits Extraction and Accuracy Assessment

The CHM generated by a normalized DAP point cloud and the profile comparison between the backpack LiDAR and the DAP point cloud are shown in Figure 3. It can be seen that after registration and normalization, the tree contour described by the DAP point cloud and LiDAR point cloud was roughly consistent.
The results of individual tree segmentation were detected in 24 randomly selected plots. A total of 334 trees ( N t ) were correctly divided, 84 trees ( N o ) were missed, and 32 trees ( N c ) were over-divided. The crown detection rate ( r ) was 0.80, the crown accuracy ( p ) was 0.91, and the overall accuracy ( F ) was 0.85 (Figure 4b). After comparing the threshold results of the VIs, the DVI vegetation index map was finally selected for an automatic threshold segmentation to extract the vegetation area, and the threshold was 0.33 (Figure 4c). It can be seen that the method successfully removed the soil background and retained the intact tree crowns.
Figure 5 shows the scatter relationship between the estimated tree height (H) and DBH and the measured ground values based on drones, with the relationship between the residual and the estimated values. The extraction accuracy of the H was higher, with R2 reaching 0.92 and an RMSE error of 0.58 m. The R2 of the estimated DBH was 0.71, and the RMSE error was 0.75 cm. The residuals for the H and DBH estimates ranged from ±2 m to ±2 cm.
The differences of the tree growth traits among different clones were compared (Figure 6). As a whole, the H, DBH and crown width (CW) showed a consistent change trend among the different clones, and the crowns of the clones with advantages in their tree heights were relatively larger.
The figure of the vegetation index in the site after the threshold segmentation is shown in Figure 7. It can be clearly seen that the spectral differences among each clonal plot, and the spatial distribution of the vegetation index shows roughly the same high and low trends.

3.2. Genetic Parameters Estimation

All the extracted phenotypic traits were substituted into the mixed linear model (Equation (4)), and the results of the specific statistical analysis are shown in Table 4. Hypothesis tests were performed on the model, and all results showed a p < 0.01, indicating that the model was highly significant. Additionally, the hypothesis test results for the factors showed that all factors reached a highly significant level (p < 0.01), except for the block difference for the CW, which was not significant. The results of the variance components for each trait of the clones showed that among the tree growth traits, the overall variance components of H were larger; except for the RVI, where the variance components of all the vegetation indices were in the range of 0 to 1.
In general, the clonal repeatability of all traits was higher than the individual repeatability. The clonal repeatability for the H, DBH and VIs were all above 0.9, and their individual repeatabilities were higher than 0.5; the repeatability of the EVI, SAVI, MSAVI, NRI and GNDVI were slightly higher than other traits, and the clonal repeatabilities were above 0.95, while their individual repeatability also exceeded 0.75. The repeatability of the CW was lower, with 0.78 for the clonal repeatability and 0.15 for the individual repeatability.
Figure 8 shows the genetic correlation matrix between the traits. The genetic correlation coefficients between the CW and H, CW and DBH were 0.87 and 0.85, respectively. The genetic correlation coefficients between the vegetation indices and tree growth traits fluctuated from 0.3 to 0.6. The correlation coefficients between the NDVI, RVI, DVI, EVI, SAVI and MSAVI were all above 0.8. The DVI, NRI and GNDVI had a higher genetic correlation with the growth traits. The genetic correlation coefficients of the NRI and GNDVI were 0.99, and the genetic correlation coefficients of the ARI and NRI, ARI and GNDVI were 0.89 and 0.90, respectively. Additionally, the correlation coefficients of the three red-edge vegetation indices, namely, RECI, NDRE and mNDI, were all above 0.98.

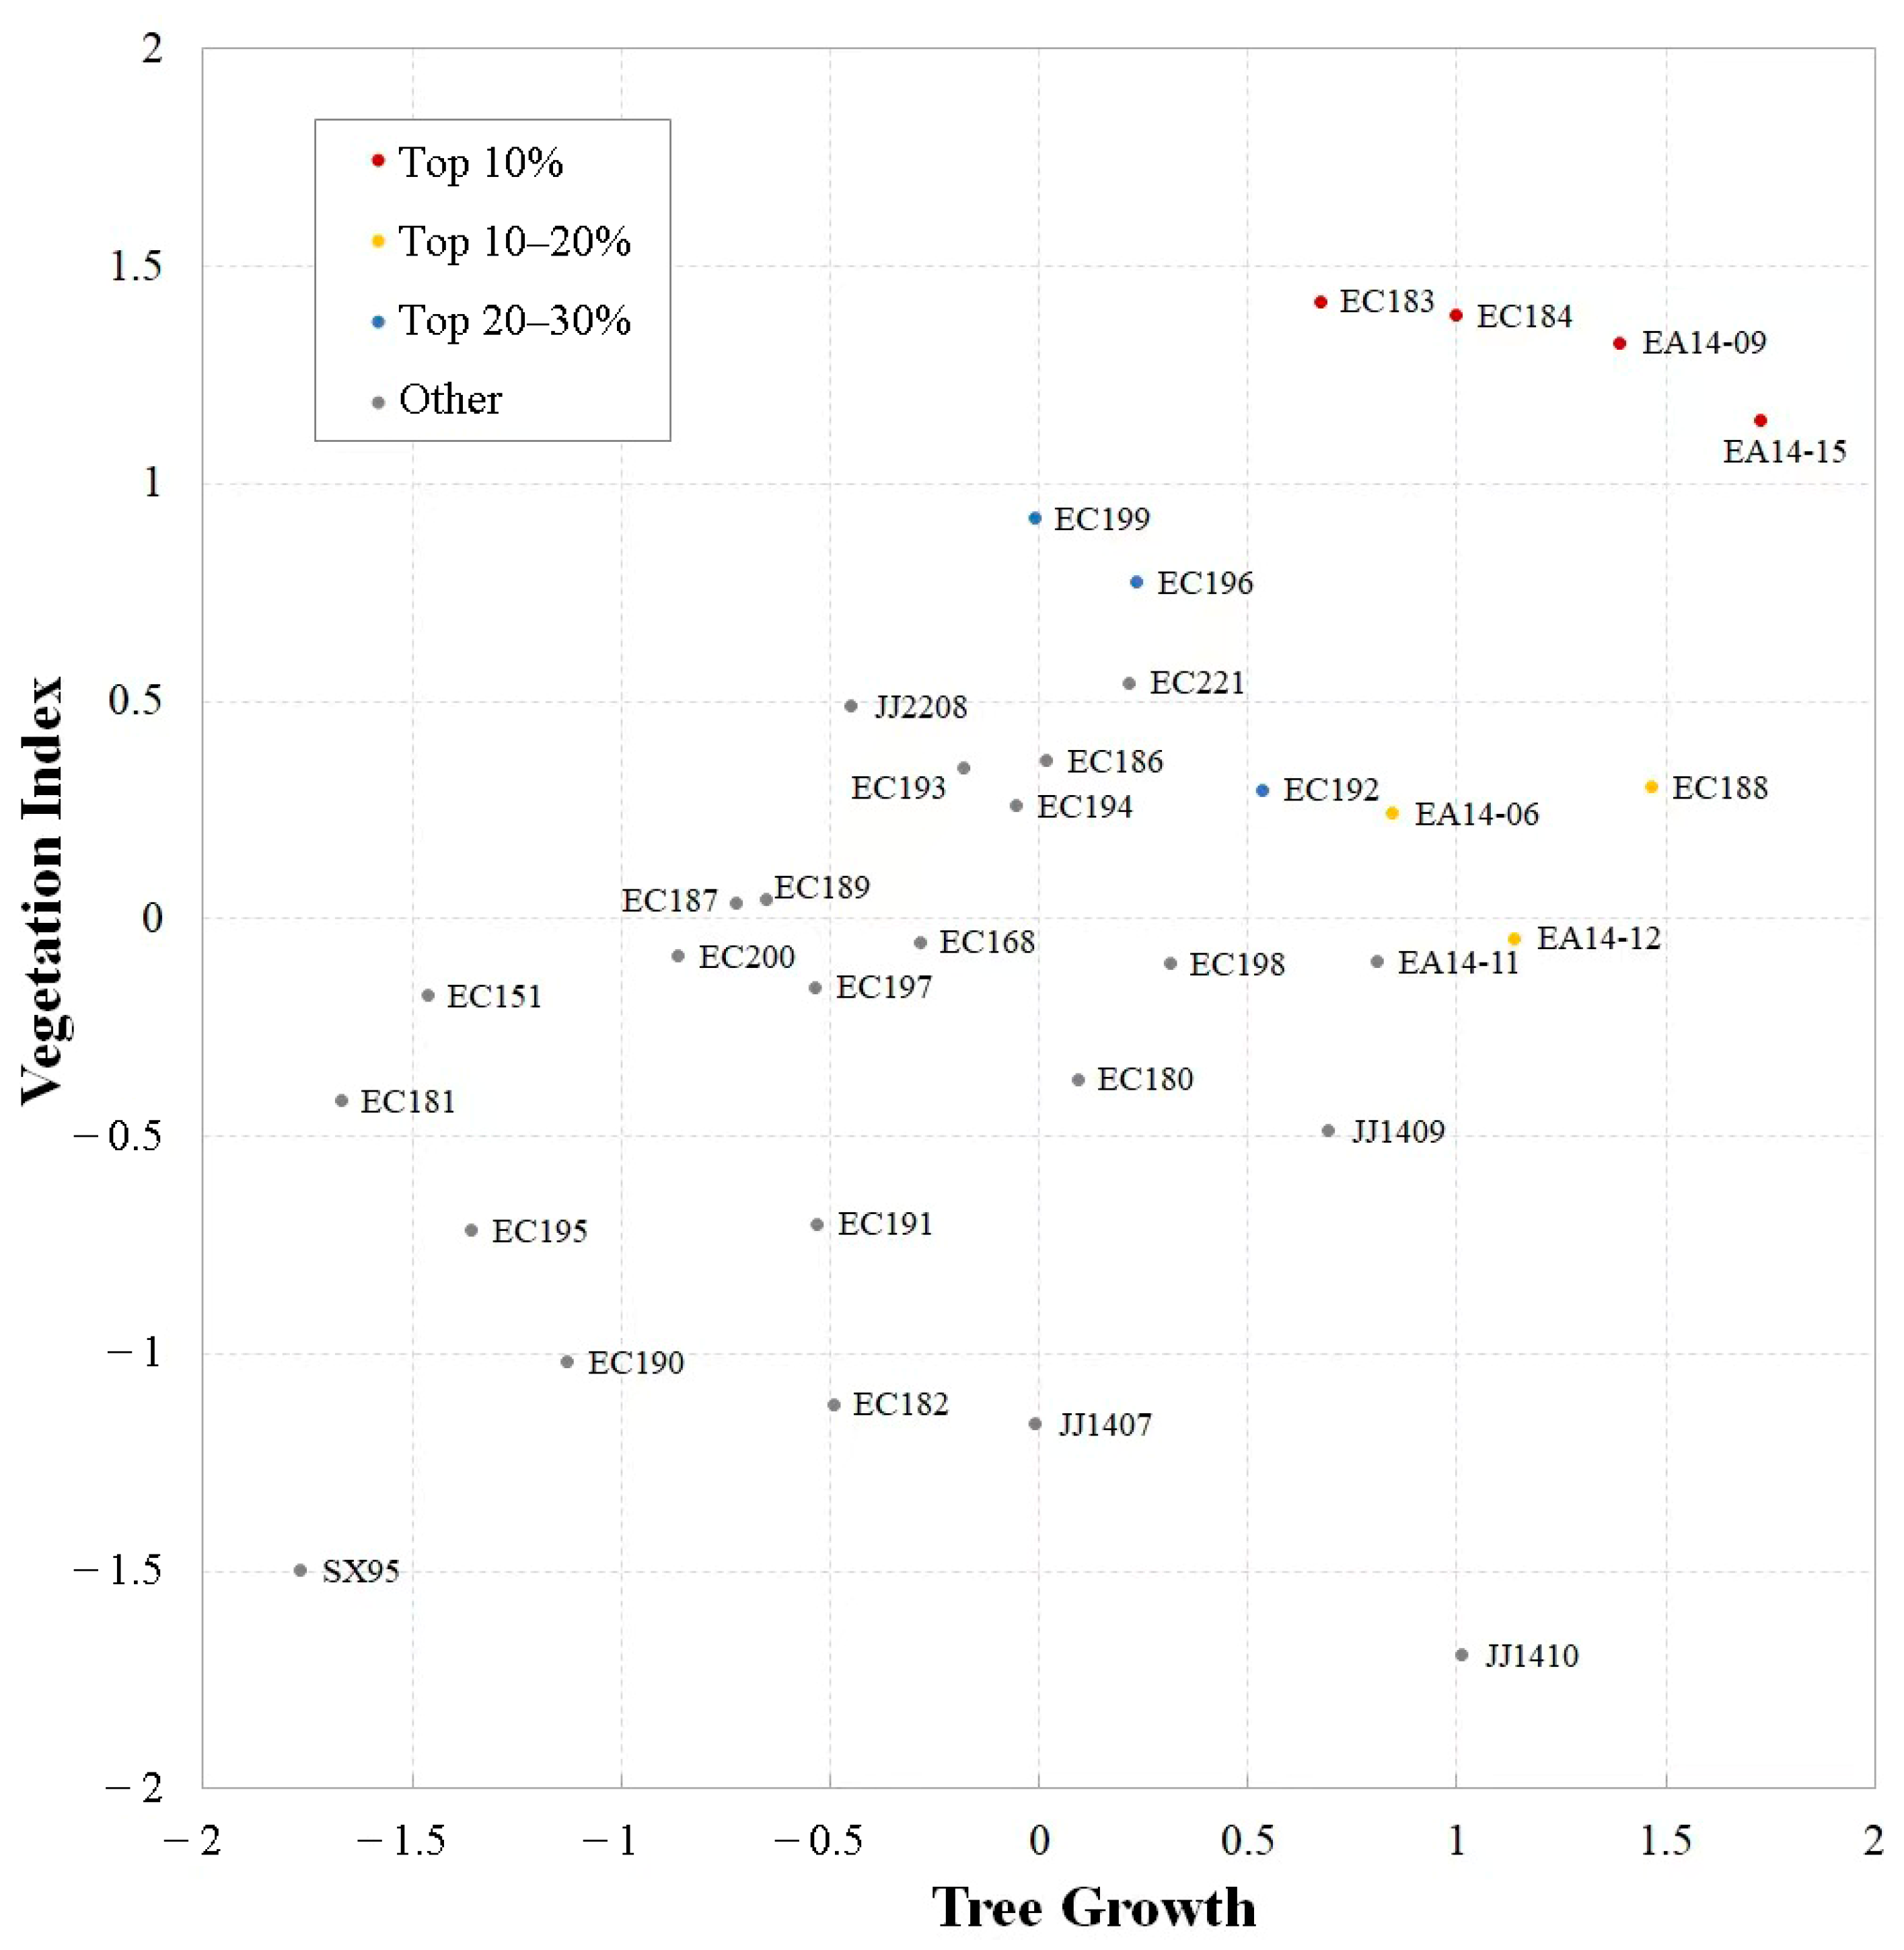
3.3. Evaluation and Selection of Clones

The selection index values were calculated, and a scatter plot of the scores was drawn with the tree growth traits as the horizontal coordinate and the vegetation index as the vertical coordinate (Figure 9), while the clones with the highest scores were selected as the superior clones selected by different selection ratios. There were four clones in the top 10%, which were EA14-15, EA14-09, EC184 and EC183, while three clones were in the top 10–20%, namely, EC188, EA14-12 and EA14-06, respectively. EC196, EC199 and EC192 were ranked in the top 20–30%.
The expected genetic gains of the superior clones are summarized in Table 5. The expected genetic gains of the H, DBH and CW ranged from 1.87 to 10.55%, 1.51 to 6.63% and 1.26 to 11.30%, respectively. Among the vegetation indices, the expected genetic gain was relatively high for the RVI and NRI, with the RVI ranging from 17.00%, −2.96%, and 10.03% in the order of the smallest to largest accessions, and the NRI ranging from 3.11 to 15.47%. In addition, the expected genetic gain of the DVI, ARI and RECI could have been more than 10% at a 10% inclusion proportion. Compared to the other vegetation indices, the genetic gain of the NDVI was small, ranging from −0.39 to 3.57%.

4. Discussion

In this study, the high-throughput phenotype information was obtained by remote sensing technology and a few ground data were combined to comprehensively extract the phenotypic traits of forest trees. The remote sensing technology of an unmanned aerial vehicle (i.e., an individual tree extraction and multi-spectral vegetation index based on a stereoscopic point cloud and multispectral image measurement) was combined with a selective breeding experiment of trees and directly applied to the genetic analysis and breeding selection of individual trees within a species and among clones. As a result, this study can serve as a guide for the future use of UAV aerial photogrammetry and multispectral photography in forest genetic breeding.

4.1. Phenotypic Trait Extraction

The key to obtaining growth parameters at an individual tree level is to obtain an accurate normalized point cloud of the forest. In a similar phenotype study, Tao et al. [43] used photogrammetric point clouds directly to obtain topographic data in a coniferous forest with a very low density and flat terrain. The effect of different UAV flight heights on rice phenotype data was investigated, and it was concluded that the flight height should not be higher than 100 m. Moreover, the accuracy of the results at different flight heights differed significantly due to the sensor field of view and feature characteristics [86]. In this study, the height difference of the study site was up to 11 m, and there were many lumps on the ground due to silvicultural land preparation and nurturing management. To ensure the accuracy of the phenotypic parameters, the normalized point cloud was processed with the help of DEM data generated by a backpack LiDAR to compensate for the defect that aerial photography could not penetrate the tree canopy; considering that the height of the eucalypt trees ranged from 10 to 30 m and there were some differences in heights among the different eucalypt clones, the UAV flight height was 120 m. In spite of this, this study still proves the applicability of tree growth extraction by aerial photogrammetry technology; consequently, while regional topography generally does not change much over time, the acquisition of topographic information based on higher-cost LiDAR data, followed by measurements using aerial photogrammetry, can better support the continuous, multi-year monitoring of forest growth dynamics.
In this study, the marker-controlled watershed algorithm was used for the individual tree segmentation with an overall accuracy of 0.85. Liao et al. [40] investigated the effect of different point cloud-based individual tree segmentation methods in trials of eucalypt plantations, and the results showed that the advantage of the marker-controlled watershed method over the point cloud distance discrimination method was gradually highlighted as the stand density increased, and the over-segmentation phenomenon was significantly reduced. In this study, the stand density in the experimental area was 845 plants/hm2, and the segmentation error was more a result from an over-segmentation of the algorithm, while the canopy detection rate r was low, at only 0.80. In addition, even for large-area forest surveys, most studies have still used the algorithm combined with a visual delineation of the canopy contours [31,67]. In the context of rapid development in the fields of deep learning and artificial intelligence, there is an urgent need to further promote and apply more accurate, automatic, individual tree segmentation algorithms suitable for high-density forest stands [87].

4.2. Genetic Parameters Estimation and Clone Evaluation

Through clone reproduction and clone determination, clonal breeding for forest trees is a selective breeding technique that inherits all the genetic effects of the parent genes [80]. In order to direct genetic improvement and forest breeding, the calculation of genetic parameters for the traits of clones is of great significance. There is no concept of generation between individuals in clones, hence, there is no heritability between the different individuals that share the same clone. The variation of tree clones should be focused on repeatability rather than heritability. A broad-sense heritability, h2, was defined or calculated according to the same mathematical statistics principle in some forest clonal studies, but the genetic meaning should have been consistent [88,89]. For example, the h2 for the DBH has been calculated to be 0.26 by combining the clone and seedling data for a clonal population of radiata pine in New Zealand [90]. Meanwhile, in studies on the genetic variation in clones of poplar, the repeatability of the tree height and DBH ranged from 0.549 to 0.912 [91]. In terms of Eucalyptus, the early growth of eucalypt clones is highly competitive, but the tree growth gradually stabilizes and the repeatability increases with an increasing stand age; therefore, the late selection of clones is more reliable than the early ones [92,93,94]. In this paper, excluding the crown width, the clonal repeatability for the DBH and tree height were above 0.9, and the individual repeatability was also higher than 0.5, which were of a high heritability. The repeatability of the VIs showed the same superior stability as the tree growth traits, which fully illustrates the important potential of vegetation spectra obtained by remote sensing to explore intra-species variation [95] and the importance of applying this to the phenotypic and genetic analyses of forest trees [96].
All of the calculated vegetation indices showed positive genetic correlations with the tree growth parameters according to the genetic correlation matrix, but the correlation coefficients were only moderately high. High genetic correlations were found among the vegetation indices calculated using the same bands. Vegetation indices were frequently employed in the past to estimate forest parameters and biomass, but few researchers have used quantitative genetics concepts to examine the genetic relationships between VIs and growth parameters.
A superior species is an organic synthesis of numerous superior traits, and the worth of a tree species is decided by a number of traits taken together. Multi-trait selection must be taken into account since multiple traits are frequently needed to be enhanced simultaneously in forest development initiatives [97]. This paper adopted the selection index method, which integrates the growth traits and vegetation indices reflecting the physiological and biochemical aspects of a stand with equal weights for a comprehensive evaluation. Some scholars, for example, have used the canopy cover, canopy height, canopy temperature and NDVI measured by UAV as indirect traits, and constructed indirect selection indices based on the correlation between these traits and the growth parameters applied to sugarcane single-row, early clone, evaluation trials, which resulted in a higher than expected efficiency of pure stand yield selection-related responses based on indirect traits (44–73%) compared to those based on a single-row yield (45%). The potential, therefore, of high-throughput phenotyping techniques for early clone selection in sugarcane breeding was highlighted [98]. For 63 clones of Eucalyptus spp., Resende et al. [99] examined the genetic heterogeneity among environments, and all the tests revealed a high, narrow sense, heritability (0.65–0.95), but the ranking of the clones varied significantly, indicating that the analysis would be more accurate if genealogical data were included. Henery [100] stated that a selection for desirable traits is accompanied by resistance and genetic diversity trade-offs, and that the identification of superior genotypes should be followed by a consideration of the adjustments in a stand species’ structure and forest management measures to reduce the impact of pests and diseases on the productivity of Eucalyptus.
A higher repeatability indicates a greater phenotypic stability, and the genetic gain of traits in the selected superior clones here was predicted accordingly. The results showed that the expected genetic gain of the growth traits and VIs, except for the NDVI, was more than 6% under the condition of a 10% inclusion proportion. The eucalypt clones in the selected experimental area were seven years old, and all the participating species had been introduced and improved, crossbred and selected for many generations, and thus had an excellent genetic quality basis. Another scholar selected from among 146 clones of aspen, and the repeatability of the tree height and DBH ranged from 0.36 to 0.64, while genetic gains of up to 15% for the tree height and 34% for the DBH were predicted after the selection of 18 clones [101]. The genetic variables in trees include additive effects and non-additive effects, among which the non-additive effects refer to the effects produced by allelic or non-allelic interactions, including dominant and epistatic effects. Sexual reproduction is unable to fix non-additive effects due to gene segregation and recombination, while clonal reproduction can transmit and utilize all the genetic effects to obtain a maximum genetic gain and protect the genetic diversity of the germplasm resources [102].

5. Conclusions

In this paper, a high throughput technical framework for the extraction and selection breeding of phenotypic traits was established by taking vegetation indices as the new indirect phenotypic traits and combining them with key tree growth traits extracted from an image point cloud. The potential of UAV multispectral imaging and aerial photogrammetry for the genetic breeding of Eucalyptus clones was explored. The study verified the accuracy of aerial photogrammetry in extracting individual tree growth phenotypes, it calculated the repeatability and genetic correlation coefficients among tree growth traits and vegetation indices, and it ranked the eucalypt clones for the genetic selection and prediction of genetic gains. The results showed that the R2 of the tree height extracted from the normalized DAP point cloud reached 0.91 with an RMSE error of 0.56 m; the R2 of the estimated diameter at breast height (DBH) was 0.71 with an RMSE error of 0.75 cm. All the extracted traits were significantly different within the tree species and among the clones. Except for the crown width (CW), the clonal repeatabilities ( R c ) of the traits were all above 0.9, and the individual repeatabilities ( R i ) were all above 0.5. The genetic correlation coefficient between the growth traits and VIs fluctuated from 0.3 to 0.5. The best clones were EA14-15, EA14-09, EC184, and EC183 when the selection proportion was 10%.
In the quantitative evaluation method of clones, the weight of traits in a selection index method is empirical, and later scholars can focus on designing a more perfect genetic evaluation formula considering the specific planting targets, repeatability of each trait and genetic correlation coefficient between traits. The DBH estimation model used in this paper is based on earlier research of the same forest farm [40], and more models that are applicable to larger eucalyptus areas need to be developed. In addition, we think it would be worthwhile to look into the phenotypic comparison of the same clones or families in various regions using remote sensing technology, as well as the impact of different flight altitudes and angles of UAVs on the extraction accuracy of tree phenotypes, and the analysis of tree traits combined with the provenance environment and detailed gene backgrounds.

Author Contributions

Writing—original draft preparation, S.T.; conceptualization, L.C.; methodology, S.T.; validation, S.T.; resources, Y.X., J.L., J.W., L.Z. and G.W.; writing—review and editing, S.T., L.C., Y.X. and J.L.; supervision, L.C.; funding acquisition, L.C. All authors have read and agreed to the published version of the manuscript.

Funding

This research was funded by the National Key Research and Development Program (2022YFD2200101), National Natural Science Foundation of China (31922055), Priority Academic Program Development of Jiangsu Higher Education Institutions (PAPD).

Acknowledgments

The authors gratefully acknowledge the foresters in Dongmen Forest Farm for their assistance with data collection and sharing their experiences of the local forests. We also would like to thank the graduate students from the department of forest management at Nanjing Forestry University for helping in the data collection and providing suggestions for improving this study.

Conflicts of Interest

The authors declare no conflict of interest.

References

  1. Gurevitch, J. Managing forests for competing goals. Science 2022, 376, 792–793. [Google Scholar] [CrossRef] [PubMed]
  2. Wen, Y.; Zhou, X.; Yu, S.; Zhu, H. The Predicament and Countermeasures of Development of Global Eucalyptus Plantations. Guangxi Sci. 2018, 25, 107–116. [Google Scholar] [CrossRef]
  3. Zhang, S.; Mo, X. Study on Crown Growth Law of Eucalyptus urophylla × E. grandis Clones. Eucalypt Sci. Technol. 2022, 39, 45–49. [Google Scholar] [CrossRef]
  4. Iglesias-Trabado, G.; Wilstermann, D. Eucalyptus Universalis, Global Cultivated Eucalypt Forests Map 2008. Version 1.0.1. 2008. Available online: http://www.mfkp.org/INRMM/article/13780278 (accessed on 2 December 2022).
  5. Zhang, Y.; Wang, X. Geographical spatial distribution and productivity dynamic change of eucalyptus plantations in China. Sci. Rep. 2021, 11, 19764. [Google Scholar] [CrossRef] [PubMed]
  6. Luo, J.; Arnold, R.; Cao, J.G.; Lu, W.; Ren, S.; Xie, Y.J. Variation in pulp wood traits between eucalypt clones across sites and implications for deployment strategies. J. Trop. For. Sci. 2012, 24, 70–82. [Google Scholar] [CrossRef]
  7. Turnbull, J.W. Development of Sustainable Forestry Plantations in China: A Review; Australian Centre for International Agricultural Research: Canberra, ACT, Australia, 2007; pp. 43–46. [Google Scholar] [CrossRef]
  8. Chen, S.; Li, C.; Xu, C.; Deng, Z.; Guo, D.; Tang, Q.; Ren, S.; Lu, C.; Liu, Y.; Wu, Q.; et al. Genetic analysis and selection of Eucalyptus clones growth. J. Cent. South Univ. For. Technol. 2020, 40, 25–30. [Google Scholar] [CrossRef]
  9. Lu, Z.; Xu, J.; Li, G.; Bai, J.; Huang, H.; Hu, Y. Study on Multi-characters Genetic Analysis and Selection Index of 93 Eucalyptus urophylla Clones. Eucalypt Sci. Technol. 2010, 27, 1–8. [Google Scholar] [CrossRef]
  10. Wu, S.; Zhu, Y.; Xu, J.; Lu, Z.; Chen, G.; Song, P.; Guo, W. Genetic variation and genetic gain for energy production, growth traits and wood properties in Eucalyptus hybrid clones in China. Aust. For. 2017, 80, 57–65. [Google Scholar] [CrossRef]
  11. Xie, Y.; Mo, X.; Peng, S.; Deng, H.; Liu, L. Genetic variation analysis and early comprehensive selection of 21 Eucalyptus clones in western Guangdong Province, China. J. Nanjing For. Univ. Nat. Sci. 2018, 42, 73–80. [Google Scholar] [CrossRef]
  12. Zhou, J.; Francois, T.; Tony, P.; John, D.; Daniel, R.; Neil, H.; Simon, G.; Cheng, T.; Zhu, Y.; Wang, X.; et al. Plant phenomics: History, present status and challenges. J. Nanjing Agric. Univ. 2018, 41, 580–588. [Google Scholar]
  13. Peper, P.J.; Alzate, C.P.; McNeil, J.W.; Hashemi, J. Allometric equations for urban ash trees (Fraxinus spp.) in Oakville, Southern Ontario, Canada. Urban For. Urban Green. 2014, 13, 175–183. [Google Scholar] [CrossRef]
  14. Chmura, D.J.; Rahman, M.S.; Tjoelker, M.G. Crown structure and biomass allocation patterns modulate aboveground productivity in young loblolly pine and slash pine. For. Ecol. Manag. 2007, 243, 219–230. [Google Scholar] [CrossRef]
  15. Arzai, A.; Aliyu, B. The relationship between canopy width, height and trunk size in some tree species growing in the Savana zone of Nigeria. Bayero J. Pure Appl. Sci. 2010, 3, 260–263. [Google Scholar] [CrossRef]
  16. Sharma, R.P.; Bílek, L.; Vacek, Z.; Vacek, S. Modelling crown width–diameter relationship for Scots pine in the central Europe. Trees 2017, 31, 1875–1889. [Google Scholar] [CrossRef]
  17. Sangjan, W.; Sankaran, S. Phenotyping Architecture Traits of Tree Species Using Remote Sensing Techniques. Trans. ASABE 2021, 64, 1611–1624. [Google Scholar] [CrossRef]
  18. Neale, D.B.; Ingvarsson, P.K. Population, quantitative and comparative genomics of adaptation in forest trees. Curr. Opin. Plant Biol. 2008, 11, 149–155. [Google Scholar] [CrossRef]
  19. Houle, D.; Govindaraju, D.R.; Omholt, S. Phenomics: The next challenge. Nat. Rev. Genet. 2010, 11, 855–866. [Google Scholar] [CrossRef]
  20. Yang, G.; Liu, J.; Zhao, C.; Li, Z.; Huang, Y.; Yu, H.; Xu, B.; Yang, X.; Zhu, D.; Zhang, X.; et al. Unmanned Aerial Vehicle Remote Sensing for Field-Based Crop Phenotyping: Current Status and Perspectives. Front. Plant Sci. 2017, 8, 1111. [Google Scholar] [CrossRef]
  21. Madec, S.; Baret, F.; De Solan, B.; Thomas, S.; Dutartre, D.; Jezequel, S.; Hemmerlé, M.; Colombeau, G.; Comar, A. High-Throughput Phenotyping of Plant Height: Comparing Unmanned Aerial Vehicles and Ground LiDAR Estimates. Front. Plant Sci. 2017, 8, 2002. [Google Scholar] [CrossRef]
  22. White, J.W.; Andrade-Sanchez, P.; Gore, M.A.; Bronson, K.F.; Coffelt, T.A.; Conley, M.M.; Feldmann, K.A.; French, A.N.; Heun, J.T.; Hunsaker, D.J.; et al. Field-based phenomics for plant genetics research. Field Crop. Res. 2012, 133, 101–112. [Google Scholar] [CrossRef]
  23. Dungey, H.S.; Dash, J.P.; Pont, D.; Clinton, P.W.; Watt, M.S.; Telfer, E.J. Phenotyping Whole Forests Will Help to Track Genetic Performance. Trends Plant Sci. 2018, 23, 854–864. [Google Scholar] [CrossRef] [PubMed]
  24. Kellner, J.R.; Albert, L.P.; Burley, J.T.; Cushman, K.C. The case for remote sensing of individual plants. Am. J. Bot. 2019, 106, 1139–1142. [Google Scholar] [CrossRef] [PubMed]
  25. Krause, S.; Sanders, T.G.M.; Mund, J.-P.; Greve, K. UAV-Based Photogrammetric Tree Height Measurement for Intensive Forest Monitoring. Remote Sens. 2019, 11, 758. [Google Scholar] [CrossRef]
  26. Iizuka, K.; Yonehara, T.; Itoh, M.; Kosugi, Y. Estimating Tree Height and Diameter at Breast Height (DBH) from Digital Surface Models and Orthophotos Obtained with an Unmanned Aerial System for a Japanese Cypress (Chamaecyparis obtusa) Forest. Remote Sens. 2018, 10, 13. [Google Scholar] [CrossRef]
  27. Berninger, A.; Lohberger, S.; Zhang, D.; Siegert, F. Canopy Height and Above-Ground Biomass Retrieval in Tropical Forests Using Multi-Pass X- and C-Band Pol-InSAR Data. Remote Sens. 2019, 11, 2105. [Google Scholar] [CrossRef]
  28. Nezami, S.; Khoramshahi, E.; Nevalainen, O.; Pölönen, I.; Honkavaara, E. Tree Species Classification of Drone Hyperspectral and RGB Imagery with Deep Learning Convolutional Neural Networks. Remote Sens. 2020, 12, 1070. [Google Scholar] [CrossRef]
  29. Nevalainen, O.; Honkavaara, E.; Tuominen, S.; Viljanen, N.; Hakala, T.; Yu, X.; Hyyppä, J.; Saari, H.; Pölönen, I.; Imai, N.N.; et al. Individual Tree Detection and Classification with UAV-Based Photogrammetric Point Clouds and Hyperspectral Imaging. Remote Sens. 2017, 9, 185. [Google Scholar] [CrossRef]
  30. Constantinescu, S.G.; Niculescu, M. Experimental and numerical research of lift force produced by Coanda? In AIP Conference Proceedings; American Institute of Physics: College Park, MA, USA, 2013. [Google Scholar] [CrossRef]
  31. Camarretta, N.; Harrison, P.A.; Lucieer, A.; Potts, B.M.; Davidson, N.; Hunt, M. From Drones to Phenotype: Using UAV-LiDAR to Detect Species and Provenance Variation in Tree Productivity and Structure. Remote Sens. 2020, 12, 3184. [Google Scholar] [CrossRef]
  32. Kim, J.; Kim, K.-S.; Kim, Y.; Chung, Y.S. A short review: Comparisons of high-throughput phenotyping methods for detecting drought tolerance. Sci. Agric. 2021, 78. [Google Scholar] [CrossRef]
  33. Chang, A.; Yeom, J.; Jung, J.; Landivar, J. Comparison of Canopy Shape and Vegetation Indices of Citrus Trees Derived from UAV Multispectral Images for Characterization of Citrus Greening Disease. Remote Sens. 2020, 12, 4122. [Google Scholar] [CrossRef]
  34. Im, J.; Jensen, J.R. Hyperspectral Remote Sensing of Vegetation. Geogr. Compass 2008, 2, 1943–1961. [Google Scholar] [CrossRef]
  35. Xue, J.; Su, B. Significant remote sensing vegetation indices: A review of developments and applications. J. Sens. 2017, 2017, 1353691. [Google Scholar] [CrossRef]
  36. Tayade, R.; Yoon, J.; Lay, L.; Khan, A.L.; Yoon, Y.; Kim, Y. Utilization of Spectral Indices for High-Throughput Phenotyping. Plants 2022, 11, 1712. [Google Scholar] [CrossRef] [PubMed]
  37. Han, L. Study on High-Throughput Maize Phenotyping Analysis and Evaluation Based on UAV Quantitative Remote Sensing. Ph.D. Thesis, China University of Mining & Technology, Beijing, China, 2019. [Google Scholar]
  38. Anche, M.T.; Kaczmar, N.S.; Morales, N.; Clohessy, J.W.; Ilut, D.C.; Gore, M.A.; Robbins, K.R. Temporal covariance structure of multi-spectral phenotypes and their predictive ability for end-of-season traits in maize. Theor. Appl. Genet. 2020, 133, 2853–2868. [Google Scholar] [CrossRef]
  39. Rabab, S.; Breen, E.; Gebremedhin, A.; Shi, F.; Badenhorst, P.; Chen, Y.-P.; Daetwyler, H. A New Method for Extracting Individual Plant Bio-Characteristics from High-Resolution Digital Images. Remote Sens. 2021, 13, 1212. [Google Scholar] [CrossRef]
  40. Liao, L.; Cao, L.; Xie, Y.; Luo, J.; Wang, G. Phenotypic Traits Extraction and Genetic Characteristics Assessment of Eucalyptus Trials Based on UAV-Borne LiDAR and RGB Images. Remote Sens. 2022, 14, 765. [Google Scholar] [CrossRef]
  41. Liziniewicz, M.; Ene, L.T.; Malm, J.; Lindberg, J.; Helmersson, A.; Karlsson, B. Estimation of Genetic Parameters and Selection of Superior Genotypes in a 12-Year-Old Clonal Norway Spruce Field Trial after Phenotypic Assessment Using a UAV. Forests 2020, 11, 992. [Google Scholar] [CrossRef]
  42. Pont, D.; Dungey, H.S.; Suontama, M.; Stovold, G.T. Spatial Models With Inter-Tree Competition From Airborne Laser Scanning Improve Estimates of Genetic Variance. Front. Plant Sci. 2021, 11, 596315. [Google Scholar] [CrossRef]
  43. Tao, X.; Li, Y.; Yan, W.; Wang, M.; Tan, Z.; Jiang, J.; Luan, Q. Heritable variation in tree growth and needle vegetation indices of slash pine (Pinus elliottii) using unmanned aerial vehicles (UAVs). Ind. Crop. Prod. 2021, 173, 114073. [Google Scholar] [CrossRef]
  44. Wu, S.; Lu, Z.; Xu, J.; Chen, G.; Zhu, Y.; Li, G. Genetic variation in growth traits and stem–branch characteristics and their relationships to Eucalyptus clones. J. For. Res. 2015, 26, 957–962. [Google Scholar] [CrossRef]
  45. Andrade, M.C.; Fernandes, A.C.M.; de Siqueira, L.; Tambarussi, E.V. THE USE OF GENETIC DISTANCE AND GROUPING METHODS TO PREDICT Eucalyptus Pellita F. MUELL GENITORS FOR HYBRIDIZATION. Cerne 2020, 26, 414–426. [Google Scholar] [CrossRef]
  46. Zhang, L.; Xiong, T.; Wang, J.; Shi, Q.; Li, L.; Chen, D.; Tang, Z.; Lan, J. Eucalyptus Clonal Breeding at Guangxi Dongmen Forest Farm. Eucalypt Sci. Technol. 2015, 32, 45–49. [Google Scholar] [CrossRef]
  47. Mo, J.; Wu, Y.; Lan, J.; Li, H.; Wu, B.; Deng, H. Present Status of Forest Resources and Sustainable Development in Dongmen Forest Farm, Guangxi. Eucalypt Sci. Technol. 2011, 28, 53–56. [Google Scholar] [CrossRef]
  48. Zhao, X.; Guo, Q.; Su, Y.; Xue, B. Improved progressive TIN densification filtering algorithm for airborne LiDAR data in forested areas. ISPRS J. Photogramm. Remote Sens. 2016, 117, 79–91. [Google Scholar] [CrossRef]
  49. Chen, Q.; Baldocchi, D.; Gong, P.; Kelly, M. Isolating Individual Trees in a Savanna Woodland Using Small Footprint Lidar Data. Photogramm. Eng. Remote Sens. 2006, 72, 923–932. [Google Scholar] [CrossRef]
  50. Zhang, Y.; Chen, Q.; Tian, X.; Shi, X.; Zhang, C. Individual Tree Crown Extraction based on UAV Visible Light Remote Sensing Technology. J. West China For. Sci. 2022, 51, 49–59. [Google Scholar] [CrossRef]
  51. Goutte, C.; Gaussier, E. A probabilistic interpretation of precision, recall and F-score, with implication for evaluation. In Proceedings of the European Conference on Information Retrieval, Santiago de Compostela, Spain, 21–23 March 2005; Springer: Berlin/Heidelberg, Germany, 2005; pp. 345–359. [Google Scholar]
  52. Jordan, C.F. Derivation of Leaf-Area Index from Quality of Light on the Forest Floor. Ecology 1969, 50, 663–666. [Google Scholar] [CrossRef]
  53. Rouse, J.W.; Haas, R.H.; Schell, J.A.; Deering, D.W. Monitoring Vegetation Systems in the Great Plains with ERTS; NASA Special Publications: Washington, DC, USA, 1973. [Google Scholar]
  54. Nielsen, A.A.; Conradsen, K.; Simpson, J.J. Multivariate Alteration Detection (MAD) and MAF Postprocessing in Multispectral, Bitemporal Image Data: New Approaches to Change Detection Studies. Remote Sens. Environ. 1998, 64, 1–19. [Google Scholar] [CrossRef]
  55. Zhou, M.; Li, C.; Dai, H. Monitoring annual forest change in Eucalyptus plantation based on RGB-NDVI detection of remote sensing imagery. J. Nanjing For. Univ. Nat. Sci. 2017, 41, 65–71. [Google Scholar] [CrossRef]
  56. Becker, F.; Choudhury, B.J. Relative sensitivity of normalized difference vegetation Index (NDVI) and microwave polarization difference Index (MPDI) for vegetation and desertification monitoring. Remote Sens. Environ. 1988, 24, 297–311. [Google Scholar] [CrossRef]
  57. Li, Z.; Hu, D.; Zhao, D.; Xiang, D. Research Advance of Broadband Vegetation Index Using Remotely Sensed Images. J. Yangtze River Sci. Res. 2015, 32, 125–130. [Google Scholar] [CrossRef]
  58. Huete, A.; Hua, G.; Qi, J.; Chehbouni, A.; van Leeuwen, W. Normalization of multidirectional red and NIR reflectances with the SAVI. Remote Sens. Environ. 1992, 41, 143–154. [Google Scholar] [CrossRef]
  59. Lu, X.; Huang, Y.; Yan, H.; Wei, W.; Li, Z. Research on Eucalyptus Extraction Based on Automatic Threshold Decision Tree Classification. For. Resour. Manag. 2020, 4, 117–126. [Google Scholar] [CrossRef]
  60. Bausch, W.C.; Duke, H.R. Remote Sensing of Plant Nitrogen Status in Corn. Trans. ASAE 1996, 39, 1869–1875. [Google Scholar] [CrossRef]
  61. Diker, K.; Bausch, W.C. Potential Use of Nitrogen Reflectance Index to estimate Plant Parameters and Yield of Maize. Biosyst. Eng. 2003, 85, 437–447. [Google Scholar] [CrossRef]
  62. Gitelson, A.A.; Kaufman, Y.J.; Merzlyak, M.N. Use of a green channel in remote sensing of global vegetation from EOS-MODIS. Remote Sens. Environ. 1996, 58, 289–298. [Google Scholar] [CrossRef]
  63. Coops, N.C.; Stone, C.; Culvenor, D.S.; Chisholm, L. Assessment of Crown Condition in Eucalypt Vegetation by Remotely Sensed Optical Indices. J. Environ. Qual. 2004, 33, 956–964. [Google Scholar] [CrossRef]
  64. Barry, K.M.; Stone, C.; Mohammed, C. Crown-scale evaluation of spectral indices for defoliated and discoloured eucalypts. Int. J. Remote Sens. 2008, 29, 47–69. [Google Scholar] [CrossRef]
  65. Zhang, L. Research on Remote Sensing Biomass Estimate of Eucalyptus Plantation; Guangxi University: Nanning, China, 2012. [Google Scholar]
  66. De Oliveira, L.F.R.; Gomes, F.S.; Santana, R. Estimating foliar nitrogen in Eucalyptus using vegetation indexes. Sci. Agricola 2017, 74, 142–147. [Google Scholar] [CrossRef] [Green Version]
  67. Liao, K.; Yang, F.; Dang, H.; Wu, Y.; Luo, K.; Li, G. Detection of Eucalyptus Leaf Disease with UAV Multispectral Imagery. Forests 2022, 13, 1322. [Google Scholar] [CrossRef]
  68. Duarte, A.; Acevedo-Muñoz, L.; Gonçalves, C.I.; Mota, L.; Sarmento, A.; Silva, M.; Fabres, S.; Borralho, N.; Valente, C. Detection of Longhorned Borer Attack and Assessment in Eucalyptus Plantations Using UAV Imagery. Remote Sens. 2020, 12, 3153. [Google Scholar] [CrossRef]
  69. Shen, X.; Cao, L.; Yang, B.; Xu, Z.; Wang, G. Estimation of Forest Structural Attributes Using Spectral Indices and Point Clouds from UAS-Based Multispectral and RGB Imageries. Remote Sens. 2019, 11, 800. [Google Scholar] [CrossRef]
  70. Richardsons, A.J.; Wiegand, A. Distinguishing vegetation from soil background information. Photogramm. Eng. Remote Sens. 1977, 43, 1541–1552. [Google Scholar] [CrossRef]
  71. Huete, A.; Didan, K.; Miura, T.; Rodriguez, E.P.; Gao, X.; Ferreira, L.G. Overview of the radiometric and biophysical performance of the MODIS vegetation indices. Remote Sens. Environ. 2002, 83, 195–213. [Google Scholar] [CrossRef]
  72. Huete, A.R. A soil-adjusted vegetation index (SAVI). Remote Sens. Environ. 1988, 25, 295–309. [Google Scholar] [CrossRef]
  73. Qi, J.; Chehbouni, A.; Huete, A.R.; Kerr, Y.H.; Sorooshian, S. A modified soil adjusted vegetation index. Remote Sens. Environ. 1994, 48, 119–126. [Google Scholar] [CrossRef]
  74. Gitelson, A.A.; Merzlyak, M.N.; Chivkunova, O.B. Optical properties and nondestructive estimation of anthocyanin content in plant leaves. Photochem. Photobiol. 2001, 74, 38–45. [Google Scholar] [CrossRef] [PubMed]
  75. Gitelson, A.A.; Gritz, Y.; Merzlyak, M.N. Relationships between leaf chlorophyll content and spectral reflectance and algorithms for non-destructive chlorophyll assessment in higher plant leaves. J. Plant Physiol. 2003, 160, 271–282. [Google Scholar] [CrossRef]
  76. Gitelson, A.A.; Merzlyak, M.N. Quantitative estimation of chlorophyll-a using reflectance spectra: Experiments with autumn chestnut and maple leaves. J. Photochem. Photobiol. B Biol. 1994, 22, 247–252. [Google Scholar] [CrossRef]
  77. Sims, D.A.; Gamon, J.A. Relationships between leaf pigment content and spectral reflectance across a wide range of species, leaf structures and developmental stages. Remote Sens. Environ. 2002, 81, 337–354. [Google Scholar] [CrossRef]
  78. Otsu, N. A threshold selection method from gray-level histograms. IEEE Trans. Syst. Man Cybern. 1979, 9, 62–66. [Google Scholar] [CrossRef]
  79. Li, S.; Su, J.; Lang, X.; Huang, X.; Mou, Y.; Yang, L. Genetic Variation and Early Selection Analysis of Open-pollinated Families of Pinus kesiya var. langbianensis. For. Res. 2017, 30, 929–935. [Google Scholar] [CrossRef]
  80. Xu, J. Quantitative Genetics in Forestry; China Forestry Publishing House: Beijing, China, 2006; ISBN 9787040189513. [Google Scholar]
  81. Xu, J. Application of Repeatability in Tree Breeding. J. Beijing for. Univ. 1988, 10, 97–102. [Google Scholar]
  82. Wang, F.; Zhang, S. Calculation and application of phenotypic correlation coefficient and genetic correlation coefficient. Liaoning Agric. Sci. 1982, 1, 20–25. [Google Scholar]
  83. Wang, D. Statistical Analysis and Softw are Development of Genetic Model for Half-sib Progeny Test in Forest Trees; Nanjing Forestry University: Nanjing, China, 2015. [Google Scholar]
  84. Wang, H.; Zeng, J.; Luo, B.; Guo, J.; Wang, C.; Zhao, Z.; Zeng, J. Multiple- trait combined selection of superior Betula alnoides clones in eastern Guangdong. J. Cent. South Univ. For. Technol. 2017, 37, 72–75. [Google Scholar] [CrossRef]
  85. Xu, J.M.; Lu, Z.H.; Li, G.Y.; Bai, J.Y. Study on integrated selection of provenances-families of Eucalytus tereticornis. For. Res. 2003, 16, 1–7. [Google Scholar]
  86. Luo, S.; Jiang, X.; Yang, K.; Li, Y.; Fang, S. Multispectral remote sensing for accurate acquisition of rice phenotypes: Impacts of radiometric calibration and unmanned aerial vehicle flying altitudes. Front. Plant Sci. 2022, 13, 958106. [Google Scholar] [CrossRef]
  87. Yun, T.; Jiang, K.; Li, G.; Eichhorn, M.P.; Fan, J.; Liu, F.; Chen, B.; An, F.; Cao, L. Individual tree crown segmentation from airborne LiDAR data using a novel Gaussian filter and energy function minimization-based approach. Remote Sens. Environ. 2021, 256, 112307. [Google Scholar] [CrossRef]
  88. Kang, K.-S.; Han, M.-S.; Kim, I.-S.; Nam, S.-H. Estimation of Genetic Parameters for Growth Performance and Survival Rate in a Clonal Test of Peronema canescens. Plant Breed. Biotechnol. 2013, 1, 245–252. [Google Scholar] [CrossRef]
  89. Braga, R.C.; Paludeto, J.G.Z.; de Souza, B.M.; Aguiar, A.V.; Pollnow, M.F.M.; Carvalho, A.G.M.; Tambarussi, E.V. Genetic parameters and genotype × environment interaction in Pinus taeda clonal tests. For. Ecol. Manag. 2020, 474, 118342. [Google Scholar] [CrossRef]
  90. Baltunis, B.S.; Wu, H.X.; Dungey, H.S.; Mullin, T.J.; Brawner, J.T. Comparisons of genetic parameters and clonal value predictions from clonal trials and seedling base population trials of radiata pine. Tree Genet. Genomes 2008, 5, 269–278. [Google Scholar] [CrossRef]
  91. Pei, X.; Jiang, L.; Ahmed, A.K.M.; Yu, H.; Chong, R.; You, X.; Zhao, X. Growth variations and stability analyses of seven poplar clones at three sites in northeast China. J. For. Res. 2020, 32, 1673–1680. [Google Scholar] [CrossRef]
  92. Ignacio-Sanchez, E.; Vargas-Hernandez, J.J.; Lopez-Upton, J.; Borja-De La Rosa, A. Genetic parameters for growth and wood density in juvenile Eucalyptus urophylla S. T. Blake. Agrociencia 2005, 39, 469–479. [Google Scholar]
  93. Wang, J.; Mo, Y.; Shen, L.; Fu, C.; Li, C.; Wei, G. Genetic Variation Analysis and Selection of 23 Eucalyptus Clones in Southern Guangxi. Southwest China J. Agric. Sci. 2019, 32, 2174–2179. [Google Scholar] [CrossRef]
  94. Li, C.; Wu, B.; Chen, D.; Tang, Q.; Zhang, Z.; Wu, X.; Lan, J. Comprehensive Analysis of Multiple Traits of Eucalyptus urophylla x Eucalyptus grangdis Clones. J. West China For. Sci. 2014, 43, 37–43. [Google Scholar] [CrossRef]
  95. Santini, F.; Serrano, L.; Kefauver, S.C.; Abdullah-Al, M.; Aguilera, M.; Sin, E.; Voltas, J. Morpho-physiological variability of Pinus nigra populations reveals climate-driven local adaptation but weak water use differentiation. Environ. Exp. Bot. 2019, 166, 103828. [Google Scholar] [CrossRef]
  96. Coupel-Ledru, A.; Pallas, B.; Delalande, M.; Boudon, F.; Carrié, E.; Martinez, S.; Regnard, J.-L.; Costes, E. Multi-scale high-throughput phenotyping of apple architectural and functional traits in orchard reveals genotypic variability under contrasted watering regimes. Hortic. Res. 2019, 6, 52. [Google Scholar] [CrossRef] [PubMed]
  97. Li, C. Studies on Clone Selection and Silviculture Effect for Sawlog of E. Urophylla×E. Grangdis. Master’s Thesis, Guangxi University, Nanning, China, 2007. [Google Scholar]
  98. Natarajan, S.; Basnayake, J.; Wei, X.; Lakshmanan, P. High-Throughput Phenotyping of Indirect Traits for Early-Stage Selection in Sugarcane Breeding. Remote Sens. 2019, 11, 2952. [Google Scholar] [CrossRef]
  99. Resende, R.T.; De Resende, M.D.V.; Silva, F.F.E.; Takahashi, E.K. Acurácia preditiva de testes clonais de Eucalyptus spp. utilizando efeitos aditivos do parentesco e validação cruzada. Sci. For. 2017, 45, 39–47. [Google Scholar] [CrossRef]
  100. Henery, M.L. The constraints of selecting for insect resistance in plantation trees. Agric. For. Èntomol. 2010, 13, 111–120. [Google Scholar] [CrossRef]
  101. Gylander, T.; Hamann, A.; Brouard, J.S.; Thomas, B.R. The Potential of Aspen Clonal Forestry in Alberta: Breeding Regions and Estimates of Genetic Gain from Selection. PLoS ONE 2012, 7, e44303. [Google Scholar] [CrossRef] [PubMed] [Green Version]
  102. Zobel, B.J.; Talbert, J. Applied Forest Tree Improvement; John Wiley & Sons: Hoboken, NJ, USA, 1984. [Google Scholar]
Figure 1. Overview of the analysis workflow in this study.
Remotesensing 15 00899 g001
Figure 2. Geographical location, orthophoto and clonal plot division of eucalypt clones. (a) The geographical location of the study site in Guangxi Zhuang Autonomous Region; (b) false color synthesis orthophoto of the study site; (c) combined with the local background data of the study site, the boundary of specific blocks (black lines) and clonal plots (gray lines) were divided, and the 4 blocks were displayed in different colors.
Remotesensing 15 00899 g002
Figure 3. Canopy height model (CHM) (a) and comparison of DAP point cloud profile with backpack LiDAR point cloud profile (b). After the DAP point cloud was registered with the backpack LiDAR, the backpack LiDAR was used to extract ground points and generate a DEM, and then CHM was generated by a normalized DAP point cloud. From top to bottom on right, the profile shows normalized DAP point cloud (b-1), normalized backpack LiDAR point cloud (b-2), and their superposition (b-3). The DAP point cloud is displayed in RGB, and the backpack LiDAR point cloud is displayed in height.
Remotesensing 15 00899 g003
Figure 4. Example of segmentation results. The size of the selected area was 30 m × 30 m. (a) Original RGB orthophoto; (b) individual tree segmentation results folded on a canopy height model (CHM); (c) normalized difference vegetation index (NDVI) map after an automatic threshold segmentation. The gray lines represent the individual-tree boundaries identified by the algorithm, and the cross symbols represent the crown vertex.
Remotesensing 15 00899 g004
Figure 5. Comparison of the estimated tree height (H) and diameter at breast height (DBH) of 89 trees with the measured values on the ground, and analysis of the residuals of the estimated values. The top two figures: regression (a) and residuals (b) of H; bottom two figures: regression (c) and residuals (d) of DBH. The tree height estimates were extracted from the normalized DAP point cloud, and the DBH estimates were obtained by substituting the estimated tree height into the DBH-H model. The regression plots are labeled with the best-fit line (red solid line), a 95% confidence interval (dark gray), and prediction interval (light gray), and the values of R2 and RMSE are also shown.
Remotesensing 15 00899 g005
Figure 6. Differences of tree growth traits among 33 eucalypt clones. (a) Tree height (H); (b) diameter at breast height (DBH); (c) crown width (CW). The clones are arranged in the order of H and DBH from high to low, and the boxes are connected with dotted lines to indicate the high and low trends. The black diamond point represents the abnormal value with a coefficient of 2, the black triangle in the box represents the average value, and the solid line is the location of the median value.
Remotesensing 15 00899 g006
Figure 7. Twelve vegetation index (VI) maps in the eucalypt clonal trial site. For a better visualization, each vegetation index was normalized. The area shown is the vegetation area extracted by a DVI automatic threshold segmentation, and the gray lines are used to indicate the clonal plot boundaries.
Remotesensing 15 00899 g007
Figure 8. Genetic correlation matrix among 15 traits extracted from UAV multispectral data. The genetic correlation coefficients among all the extracted traits were positive, and the absolute values of the correlation coefficients are represented by the “red-yellow-blue” color band.
Remotesensing 15 00899 g008
Figure 9. Selection index scatter plots of clones, where the top 10%, 10–20%, and 20–30% of the superior clones are color-coded. The horizontal coordinate is the selection index value of the tree growth traits, and the vertical coordinate is the selection index value of the vegetation index.
Remotesensing 15 00899 g009
Table 1. Specifications of the DJI Phantom 4 Multispectral UAV.
CriteriaUAV
Ground sampling distance(Height/18.9) cm/pixel
Camera filter wavelength rangeBlue: 450 nm ± 16 nm
Green: 560 nm ± 16 nm
Red: 650 nm ± 16 nm
Red edge: 730 nm ± 16 nm
NIR: 840 nm ± 26 nm
FOV62.7°
Focal length5.74 mm
Aperturef/2.2
ISO range for color sensors200–800
Monochrome sensor gain1–8 times
Electronic global shutter1/100–1/20,000 s (visible light imaging)
1/100–1/10,000 s (multispectral imaging)
Table 2. Specifications of the LiBackpack DGC50.
CriteriaBackpack LiDAR
Number of lasers2
FOVVertical: 180° (−90°~90°)
Horizontal: 360°
Scanning mode16 lines repeat scanning
Laser ranging distance100 m (20% reflectance)
Number of echoes1
GNSS accuracy1 cm + 1 ppm
Table 4. Statistical results of linear mixed-effects models for 15 phenotypic traits at an individual tree level obtained based on DAP point clouds and multispectral images.
TraitANOVA F-StatisticsComponent of VarianceRcRi
BlockCloneBlock Clone *CloneBlock Clone *Error
H63.8986 **85.6103 **3.7984 **2.40110.29781.11390.96 0.63
DBH63.5232 **84.2521 **3.9086 **0.64310.0840.30220.95 0.62
CW0.153910.6119 **2.0881 **0.14840.07860.75610.78 0.15
NDVI111.7678 **159.1202 **12.4319 **0.00050.00010.00010.92 0.65
RVI95.7626 **154.6755 **10.1028 **1.16840.27040.3110.93 0.67
DVI53.2738 **120.9143 **5.0305 **0.00160.00020.00050.96 0.68
EVI100.1138 **170.6675 **6.6433 **0.00310.00040.00080.96 0.73
SAVI99.2175 **183.123 **6.8266 **0.0010.00010.00020.96 0.74
MSAVI116.0216 **197.367 **7.9924 **0.00120.00020.00030.96 0.74
NRI42.1776 **197.1244 **8.2089 **0.25760.03530.05130.96 0.75
GNDVI50.5064 **212.3308 **9.9897 **0.00090.00010.00020.95 0.74
ARI6.1389 **83.94 **6.3866 **0.50340.12350.23990.93 0.58
RECI56.287 **156.1518 **11.5513 **0.00240.00060.00060.93 0.66
NDRE59.473 **157.8481 **12.0811 **0.00020.00010.00010.92 0.66
mNDI49.9884 **145.3982 **11.9951 **0.00030.00010.00010.92 0.64
Note: “*” indicates a significant difference (p < 0.05), and “**” indicates a highly significant difference (p < 0.01). From left to right, the ANOVA F-statistics (i.e., the blocks, clones, and interactions of blocks with clones), and the variance component estimates of random effects (i.e., the clones, interactions of clones with blocks, and random errors), as well as the clonal repeatability ( R c ) and individual repeatability ( R i ) for each trait, are shown. The explanations of the abbreviations for the traits can be found in Table 3.
Table 5. Expected genetic gain of superior clones, according to the inclusion proportions of 10%, 20% and 30%.
Selection RateNumber of SelectedGenetic Gain (%)
HDBHCWNDVIRVIDVIEVISAVIMSAVINRIGNDVIARIRECINDREmNDI
Top 10%410.556.6311.303.5717.0011.177.736.897.2715.476.2010.1511.638.966.97
Top 20%79.916.2813.06−0.39−2.96−1.93−3.41−1.18−1.253.111.775.165.004.043.54
Top 30%101.871.511.262.3910.094.484.203.363.857.063.046.933.432.771.85
Note: The explanations of the abbreviations for the traits can be found in Table 3.
Disclaimer/Publisher’s Note: The statements, opinions and data contained in all publications are solely those of the individual author(s) and contributor(s) and not of MDPI and/or the editor(s). MDPI and/or the editor(s) disclaim responsibility for any injury to people or property resulting from any ideas, methods, instructions or products referred to in the content.

