Article

Recognition of Abnormal Individuals Based on Lightweight Deep Learning Using Aerial Images in Complex Forest Landscapes: A Case Study of Pine Wood Nematode

1
School of Resources and Environmental Engineering, Anhui University, Hefei 230601, China
2
Anhui Geographic Information Intelligent Technology Engineering Research Center, Hefei 230601, China
3
Anhui Engineering Research Center for Geographical Information Intelligent Technology, Hefei 230601, China
*
Author to whom correspondence should be addressed.
Remote Sens. 2023, 15(5), 1181; https://doi.org/10.3390/rs15051181
Submission received: 6 January 2023 / Revised: 15 February 2023 / Accepted: 17 February 2023 / Published: 21 February 2023

Abstract

:
Individuals with abnormalities are key drivers of subtle stress changes in forest ecosystems. Although remote sensing monitoring and deep learning have been developed for forest ecosystems, they are faced with the complexity of forest landscapes, multiple sources of remote sensing data, high monitoring costs, and complex terrain, which pose significant challenges to automatic identification. Therefore, taking pine nematode disease as an example, this paper proposes D-SCNet, an intelligent monitoring network for abnormal individuals applicable to UAV visible images. In this method, the convolutional block attention model and simplified dense block are introduced to enhance the semantic analysis ability of abnormal individual identification, use multi-level information of abnormal individuals well, enhance feature transfer as well as feature weights between network layers, and selectively focus on abnormal features of individuals while reducing feature redundancy and parameter and improving monitoring accuracy and efficiency. This method uses lightweight deep learning models through weak information sources to achieve rapid monitoring of a large range of abnormal individuals in complex environments. With the advantages of low cost, high efficiency, and simple data sources, it is expected to further enhance the practicality and universality of intelligent monitoring of anomalous individuals by UAV remote sensing.

1. Introduction

Forest ecosystems occupy one-third of the global terrestrial surface and host most of the Earth’s terrestrial biodiversity [1], providing abundant resources for human society and playing an important role in species diversity [2], carbon cycle [3], energy exchange [4], landscape patterns [5]. Large-scale and accurate forest ecological monitoring is the basis of understanding forest ecosystems. Many difficulties persist in the face of continuous patchy or large-scale tree mortality caused by deforestation [6], climate change [7], air pollution [8], and species invasion [9], such as reduced leaf area, forest climate and moisture imbalance, and loss of carbon storage function [10], which may take a long time to recover. Global warming is one of the main factors affecting forest ecosystems, causing changes in the life cycle of insects, making pests more destructive, interacting with climatic factors such as drought, and greatly increasing tree mortality [11]. Anomalous individuals are specific individuals with certain abnormal attribute values relative to the overall reference data and are key contributors to subtle sensitive pressure changes in forest ecosystems [12]. Therefore, exploring abnormal individual changes is of great significance in forest ecosystems, in addition, owing to the incomplete structure of forest ecosystems in some regions and their vulnerability to pests [13]. Pine nematode disease, for example, is a highly contagious and destructive global pine disease, spreading widely and quickly. If diseased pine trees are not found and destroyed in time, pine nematode infection will spread rapidly, so timely pine nematode disease monitoring is the basis for effective containment of pine nematode disease. The primary monitoring method is still manual on-site inspection, which has the disadvantage of high cost of manpower, material resources, and time investment. Thus, automated tools and methods are necessary for forest ecosystems, especially to provide strong support for identifying and monitoring various threats in complex forest landscapes using massive data.
At present, remote sensing of ground observation technology can provide rapid, objective, and accurate species identification and monitoring capabilities, bringing unprecedented development to the practical application of forest ecology [14]. Based on ground sampling and remote sensing data, it is possible to investigate and evaluate service function status and spatial characteristic changes, such as water conservation, soil conservation [15], and biodiversity [16]. Due to the differences in the internal physiological state and composition of different vegetation, the spectral characteristics of vegetation in different states have different information. The typical spectral characteristics of vegetation can be used to effectively identify vegetation types by the effective spectral information contained in vegetation, to directly detect vegetation growth, to monitor regional vegetation diseases, to estimate biomass, and to produce thematic maps of vegetation types. Remote sensing technology can identify different vegetation based on spectral information, analyze the spectral, texture, shape, and other characteristics of vegetation in different states based on remote sensing images, and distinguish healthy vegetation and abnormal individual distribution and other information based on the difference of these spectral characteristics [17], so remote sensing technology is the key to abnormal individual information extraction. Satellite remote sensing can obtain the distribution of vegetation on a large scale, which is conducive to comprehensive vegetation dynamic monitoring and resource survey. However, owing to the limitations of time and space imaging conditions of satellite remote sensing, it is difficult to accurately identify and monitor abnormal individuals affected by pests or human disturbance; however, this problem has gradually become one of the main threats to forest ecological health [18].
Unmanned aerial vehicle (UAV) remote sensing has gradually become the primary means of high-precision individual monitoring and identification because of its advantages in strong mobility, high timeliness, and resistance to environmental factors [19]. The orthophotos generated by drones contain rich information of feature details, which provide data support for the fine identification of regional vegetation. UAV remote sensing is gradually becoming a new method for forest land resource survey, vegetation classification, and environmental monitoring [20], which makes up for the shortage of ground-based actual survey and satellite remote sensing. As a multifunctional flight platform, UAVs are mainly equipped with active remote sensing and passive remote sensing sensors to observe the ground. Passive remote sensing includes optical sensors in visible light [21] and multispectral [22] and hyperspectral [23] imaging methods (Figure 1). In forest ecosystems, passive remote sensing can obtain its spatial distribution and geometric shape through information such as spectrum, texture, and color, combined with semantic analysis methods. Further analyses and assessments of species richness [24], invasive species research [25], and forest dynamics [26] were conducted. Although passive remote sensing is significantly affected by the external environment, such as light, rain, and snow, it has strong applicability and easy detection. Different sensors can be selected according to different purpose requirements. The image quality and information obtained by different sensors, as well as the target extraction methods used, are different.
In terms of forest remote sensing monitoring, many machine learning methods use manual selection of features and classifiers, such as decision tree (DT) [27] and support vector machine (SVM) [28], to identify abnormal individual plants, but this method usually requires expert experience and careful construction [29]. In recent years, deep learning algorithms have received extensive attention in various industries owing to their autonomous learning and powerful feature extraction capabilities. Some achievements have been made in remote sensing image target recognition and extraction [30,31]. Single-stage object detection methods based on regression and classification ideas mainly include Single-shot multibox detector (SSD) [32,33] and YOLO [34,35]. The main purpose is to obtain accurate location and category information of the object and to consider the monitoring speed under the premise of maintaining a certain effect. Semantic analysis methods have provided further insight into categories and geometric properties (length, width, area, contour, etc.). Compared with object detection methods, it has the advantage of obtaining abnormal area information, such as Mask R-CNN [36,37], Pyramid scene parsing network (PSPNet) [38,39], U-Net [40,41], and SCANet [42]. This type of method can perform deep and multilevel semantic analysis, retain detailed features, significantly improve the ability of semantic analysis, and collect individual information.
Research on the identification and monitoring of abnormal individuals in forest landscapes has made great progress. In particular, monitoring methods based on deep learning show great potential for application [43]. In forest ecosystems, the diversity of anomalous individuals and the complexity of the spatial environment have a tremendous impact on the representation among individuals and between individuals and their environment. In remote sensing images, which are affected by imaging conditions, their spatial locations and spectral distributions are also very different. This makes it difficult to consider the integrity of the target features and to accurately calculate and determine its deep-level information. At the same time, deep learning methods put forward higher requirements for the quality and quantity of sample data [44]. However, complex conditions such as imaging conditions, observation conditions, area types, and background environments make it difficult to obtain deep learning training samples and lack public sample datasets, which seriously affects the development of automated monitoring of abnormal individuals in forest ecosystems. Therefore, fully suppressing the background and enhancing the target is key to improving the monitoring performance of small targets and small samples in complex forest landscapes. At the same time, under the premise of fully learning the characteristics of the image, increasing the amount of calculation will inevitably lead to a slow detection speed, which cannot meet the needs of real-time performance, and reduce the amount of calculation, which will lead to insufficient training and errors or missed detections.
Therefore, this paper analyzes the improvement direction of fast monitoring algorithms for small objects in complex forest landscapes and designs an intelligent recognition network, D-SCNet, for abnormal individuals. Owing to the small size of abnormal individuals, the multiple down-sampling process in a deep feature extraction network often ignores small-scale objects. In addition, the collected images have background noise problems, and large-scale complex backgrounds may lead to false detections. Therefore, the convolutional block attention module and simplified dense block are introduced to improve the semantic analysis ability of abnormal individual identification and monitoring, make full use of the multilevel information of abnormal individuals, enhance feature transfer and feature weight between network layers, and selectively focus on features. Through the learning of abnormal individual characteristics, the weighted sum of weighted coefficients is used to separate the characteristics, suppress the background noise in the image, and improve the monitoring accuracy and efficiency while reducing feature redundancy and parameter calculation. Specifically, our method can efficiently select information and allocate more resources to key attention regions, resulting in a salient image that separates the objects from the background for more accurate recognition.

2. Identification of Abnormal Individuals: The Case of Pine Wood Nematode

2.1. Pine Wood Nematode

The pine wood nematode is a devastating pine disease worldwide that causes irreversible damage to the global forest ecosystem. At present, 52 countries have listed it as a quarantine pest [45]. After China first discovered the diseased black pine in Nanjing in 1982, more than 53 million trees died, 1.7 million hectares of land were affected, 30 million pine forests were directly threatened, and important ecological landscape areas such as Huangshan Mountain, the Three Gorges of the Yangtze River, Zhangjiajie, and Qiandao Lake were affected. This has caused huge losses to the country’s ecological environment, natural landscape, and social economy [46].
The pine wood nematode has many hosts, a wide distribution range, and is fast spreading. Pine trees can die within 40 days of infection. Trees infected with pine wood nematodes show certain differences from healthy trees [47]. From the invasion of pine wood nematodes to complete death, there are four stages of external and internal characteristic changes. Pine trees in general have a green crown, as in the pine tree in the red box in (a). However, after being stressed by abiotic factors such as temperature, water, nutrition, or biotic factors such as pest and disease attack, the canopy will change color to yellow, yellow-brown, or red and appear dead, as in (c) the pine tree in the yellow box. Figure a to Figure c were taken 25 days apart, and the pine trees in the red box progressed from the early stage of disease to the middle stage of disease, then to the late stage of disease, and then to complete dieback (Figure 2). Changes in the internal physiology of trees also occur at this time, such as reduction in chlorophyll and water content, and reduction in photosynthesis and transpiration [48].

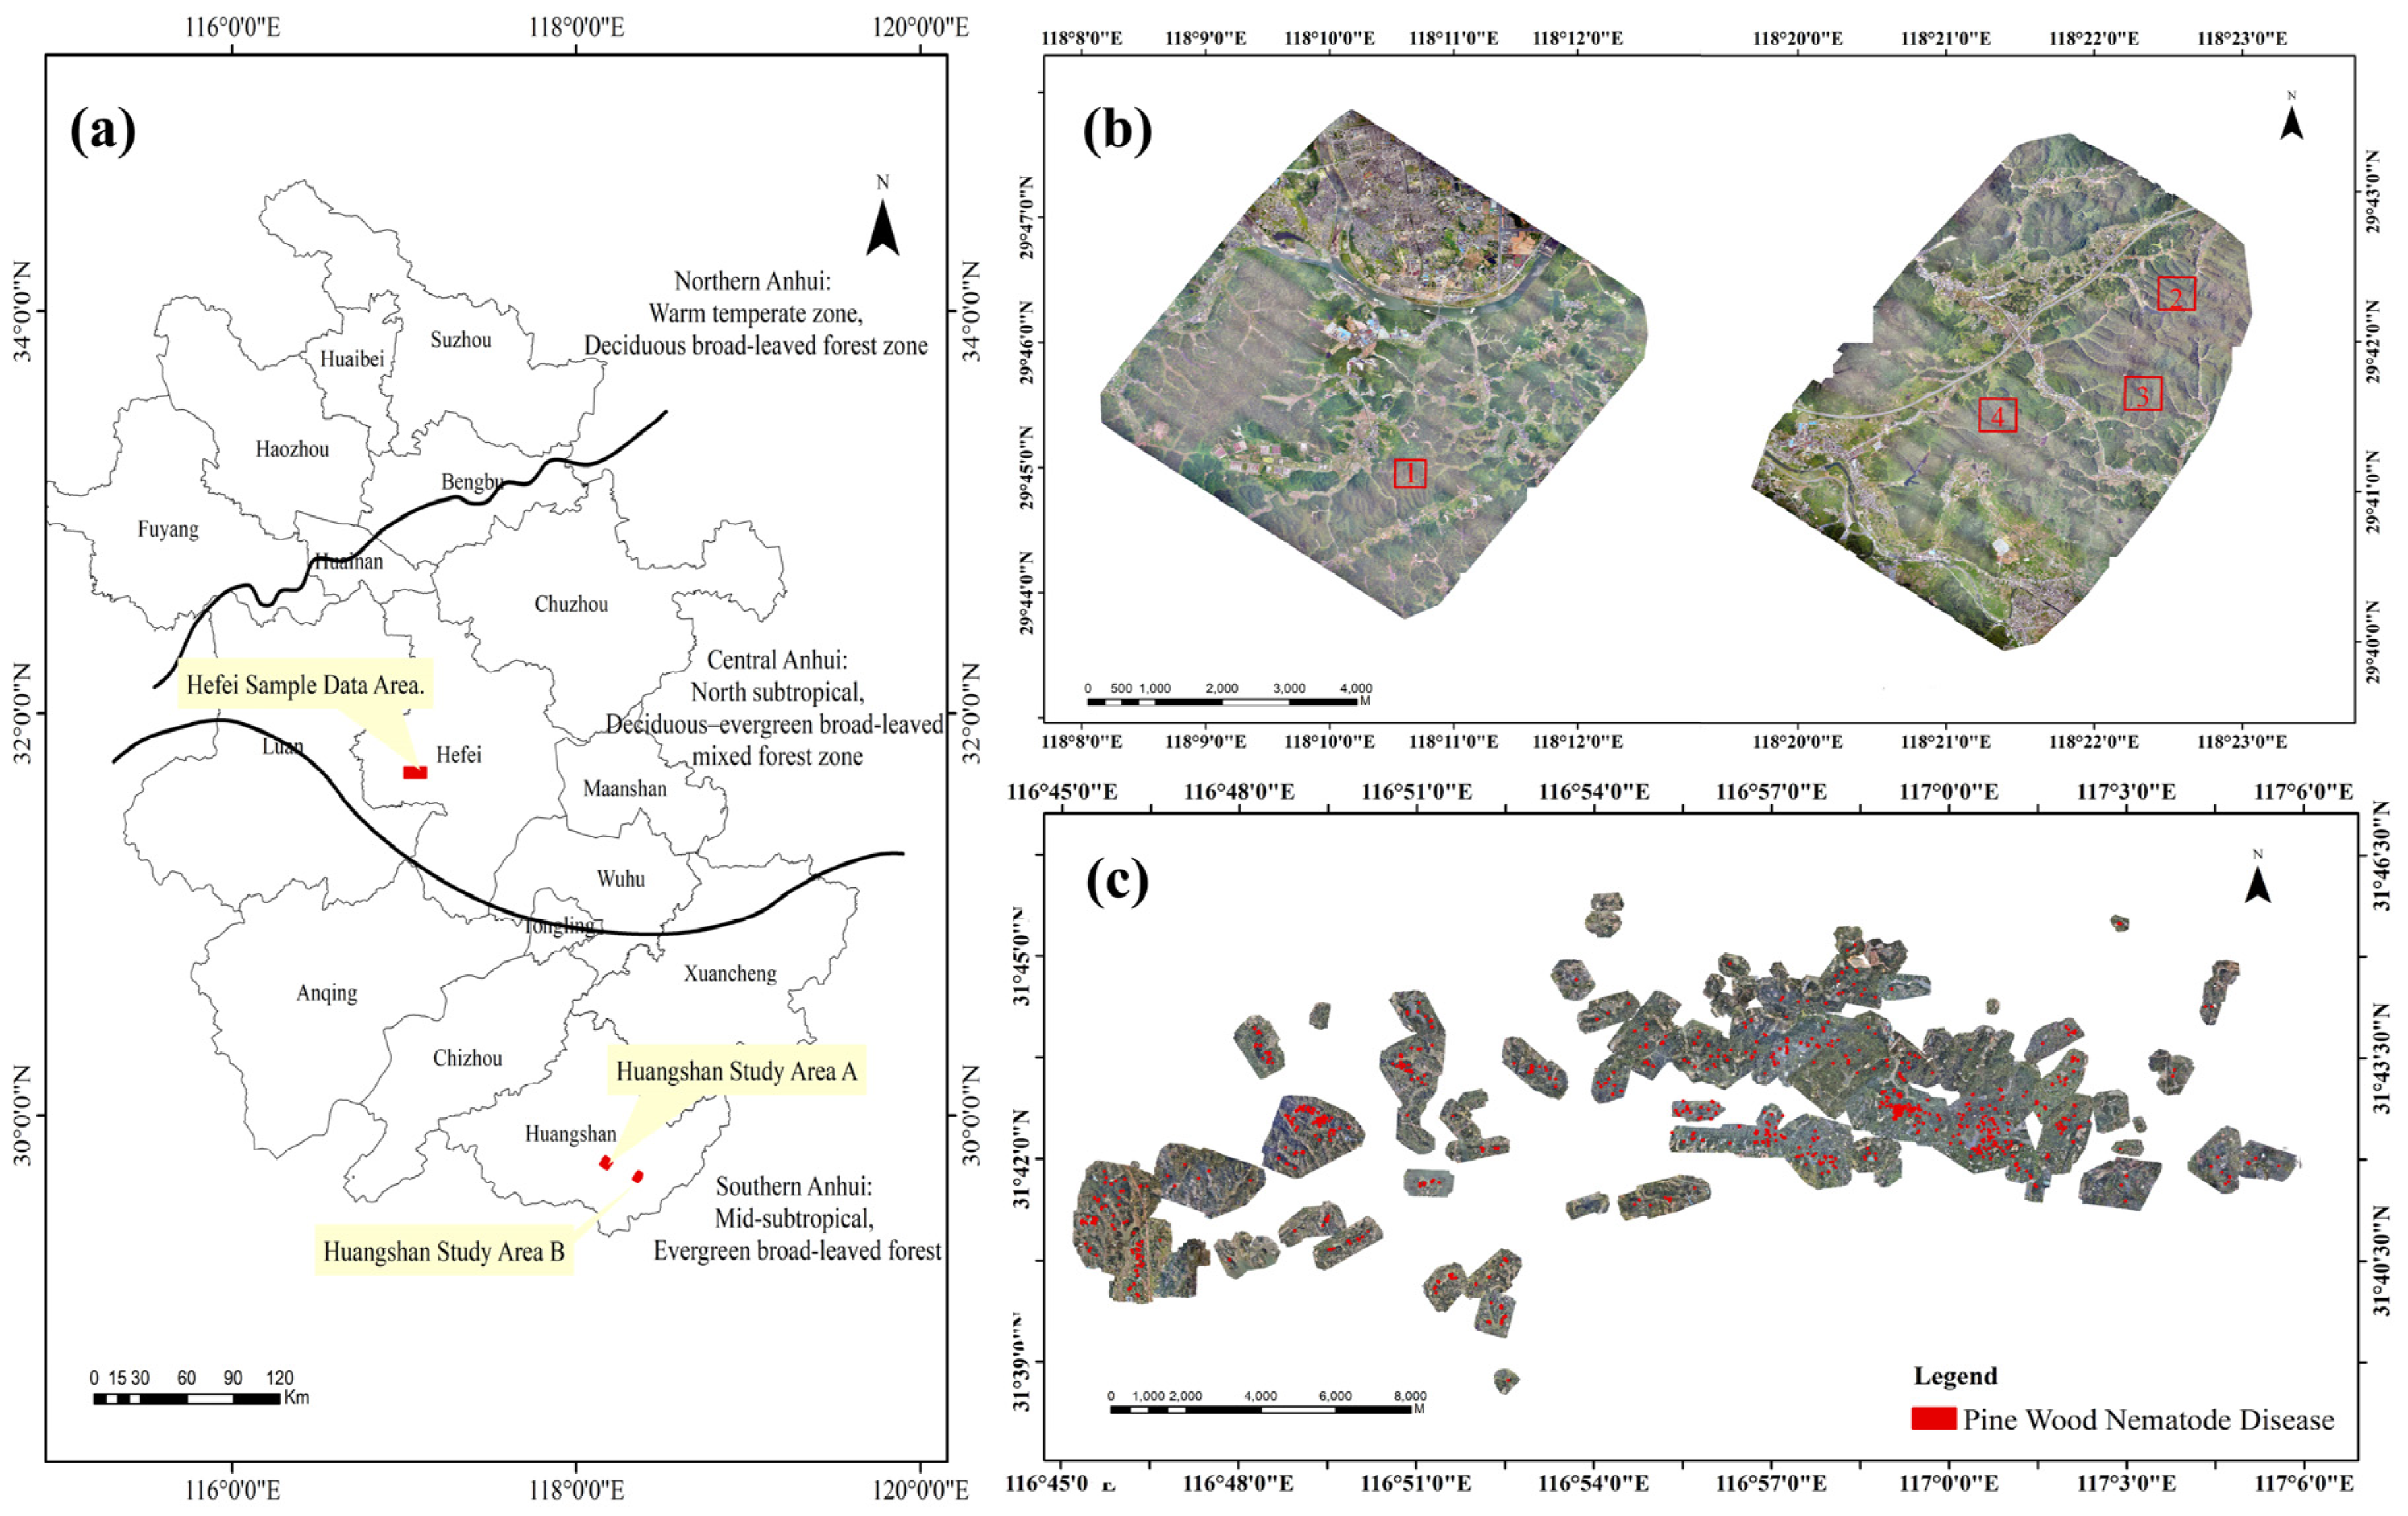
2.2. Data Area Geography and Data Collection

The experiment selected the Zipeng Mountain Scenic Area in Hefei City in central Anhui and the forest areas in Xiuning County and She County of Huangshan City in southern Anhui (Figure 3). Due to the rapid spread of pine nematode disease, a wide range of harm, Huangshan region as China’s famous scenic areas, and forest coverage of more than 70%, the prevention and control situation is very serious. Huangshan City, Anhui Province, also introduced the first municipal-level pine wilt nematode control regulations in China. The pine wilt nematode in the Huangshan area is particularly typical, so for better disease monitoring, we selected Huangshan as the experimental area. In addition, in order to verify the universality of this method and the fact that the sample collection in Huangshan region is influenced by topography, geomorphology, and policies, we selected an area in Hefei city as the sample data collection area.
Central Hefei sample data area of Anhui is in the mid-latitude region (116°40′52″–117°21′39″E, 31°30′22″–32°00′21″N), with an altitude of 15–80 m, and the terrain is flat. It belongs to the northern subtropical deciduous–evergreen broad-leaved mixed forest area, and there are more than 100 types of naturally distributed vegetation, mainly including mason pine, black pine, and slash pine. Southern Huangshan study area is located in the three provinces of Anhui, Zhejiang, and Jiangxi at the junction of the three locations (117°02′–118°55′E, 29°24′–30°24′N), with an altitude of more than 110 m and an undulating terrain, mainly mountainous. Huangshan region belongs to the subtropical evergreen broad-leaved forest belt with rich plant resources and more than 1000 tree species. There are many keys nationally protected tree species and precious tree species, such as metasequoia, ginkgo, and dendrobium, with a forest coverage rate of 73% and a timber volume of 24 million cubic meters.
According to the geographical environment and coverage of forest ecosystems, combined with the characteristics and application scope of various types of sensors, UAV visible light remote sensing monitoring can effectively solve the problems of wide coverage, complex terrain and environment, and limited costs in forest ecosystem monitoring. Therefore, we selected the visible light image as the experimental data to provide a reference for follow-up forest ecosystem monitoring.
To verify the universality of the method, Hefei sample data area adopts a multi-rotor UAV equipped with a 24 mm lens, and the image resolution is 0.04 meters. Owing to the battery performance problem of the multirotor UAV, this area is composed of multiple types of data with a total flight area of 42.3 square kilometers. Huangshan study area uses a fixed-wing industrial-grade UAV equipped with a 35 mm SLR camera. The image resolution is 0.09 meters, the coverage area of a single flight is 5 square kilometers, and there are two true color orthophotos covering an area of 51.0 square kilometers (Table 1).
After UAV data collection was completed, it was necessary to perform orthophoto preprocessing on the collected data. The basic principle of UAV remote sensing data preprocessing is a feature-matching method for UAV remote sensing images that combines location information and aerial image features. It realizes sub-pixel registration of multichannel spectral images and real-time stitching of multiview images, thereby generating orthophotos with real surface reflectivity. Data processing mainly includes band registration, aerial triangulation, single-chip digital difference, orthorectification, image stitching, and radiometric calibration. Radiometric calibration was performed using pre-flight diffuse reflectors.

2.3. Dataset Details
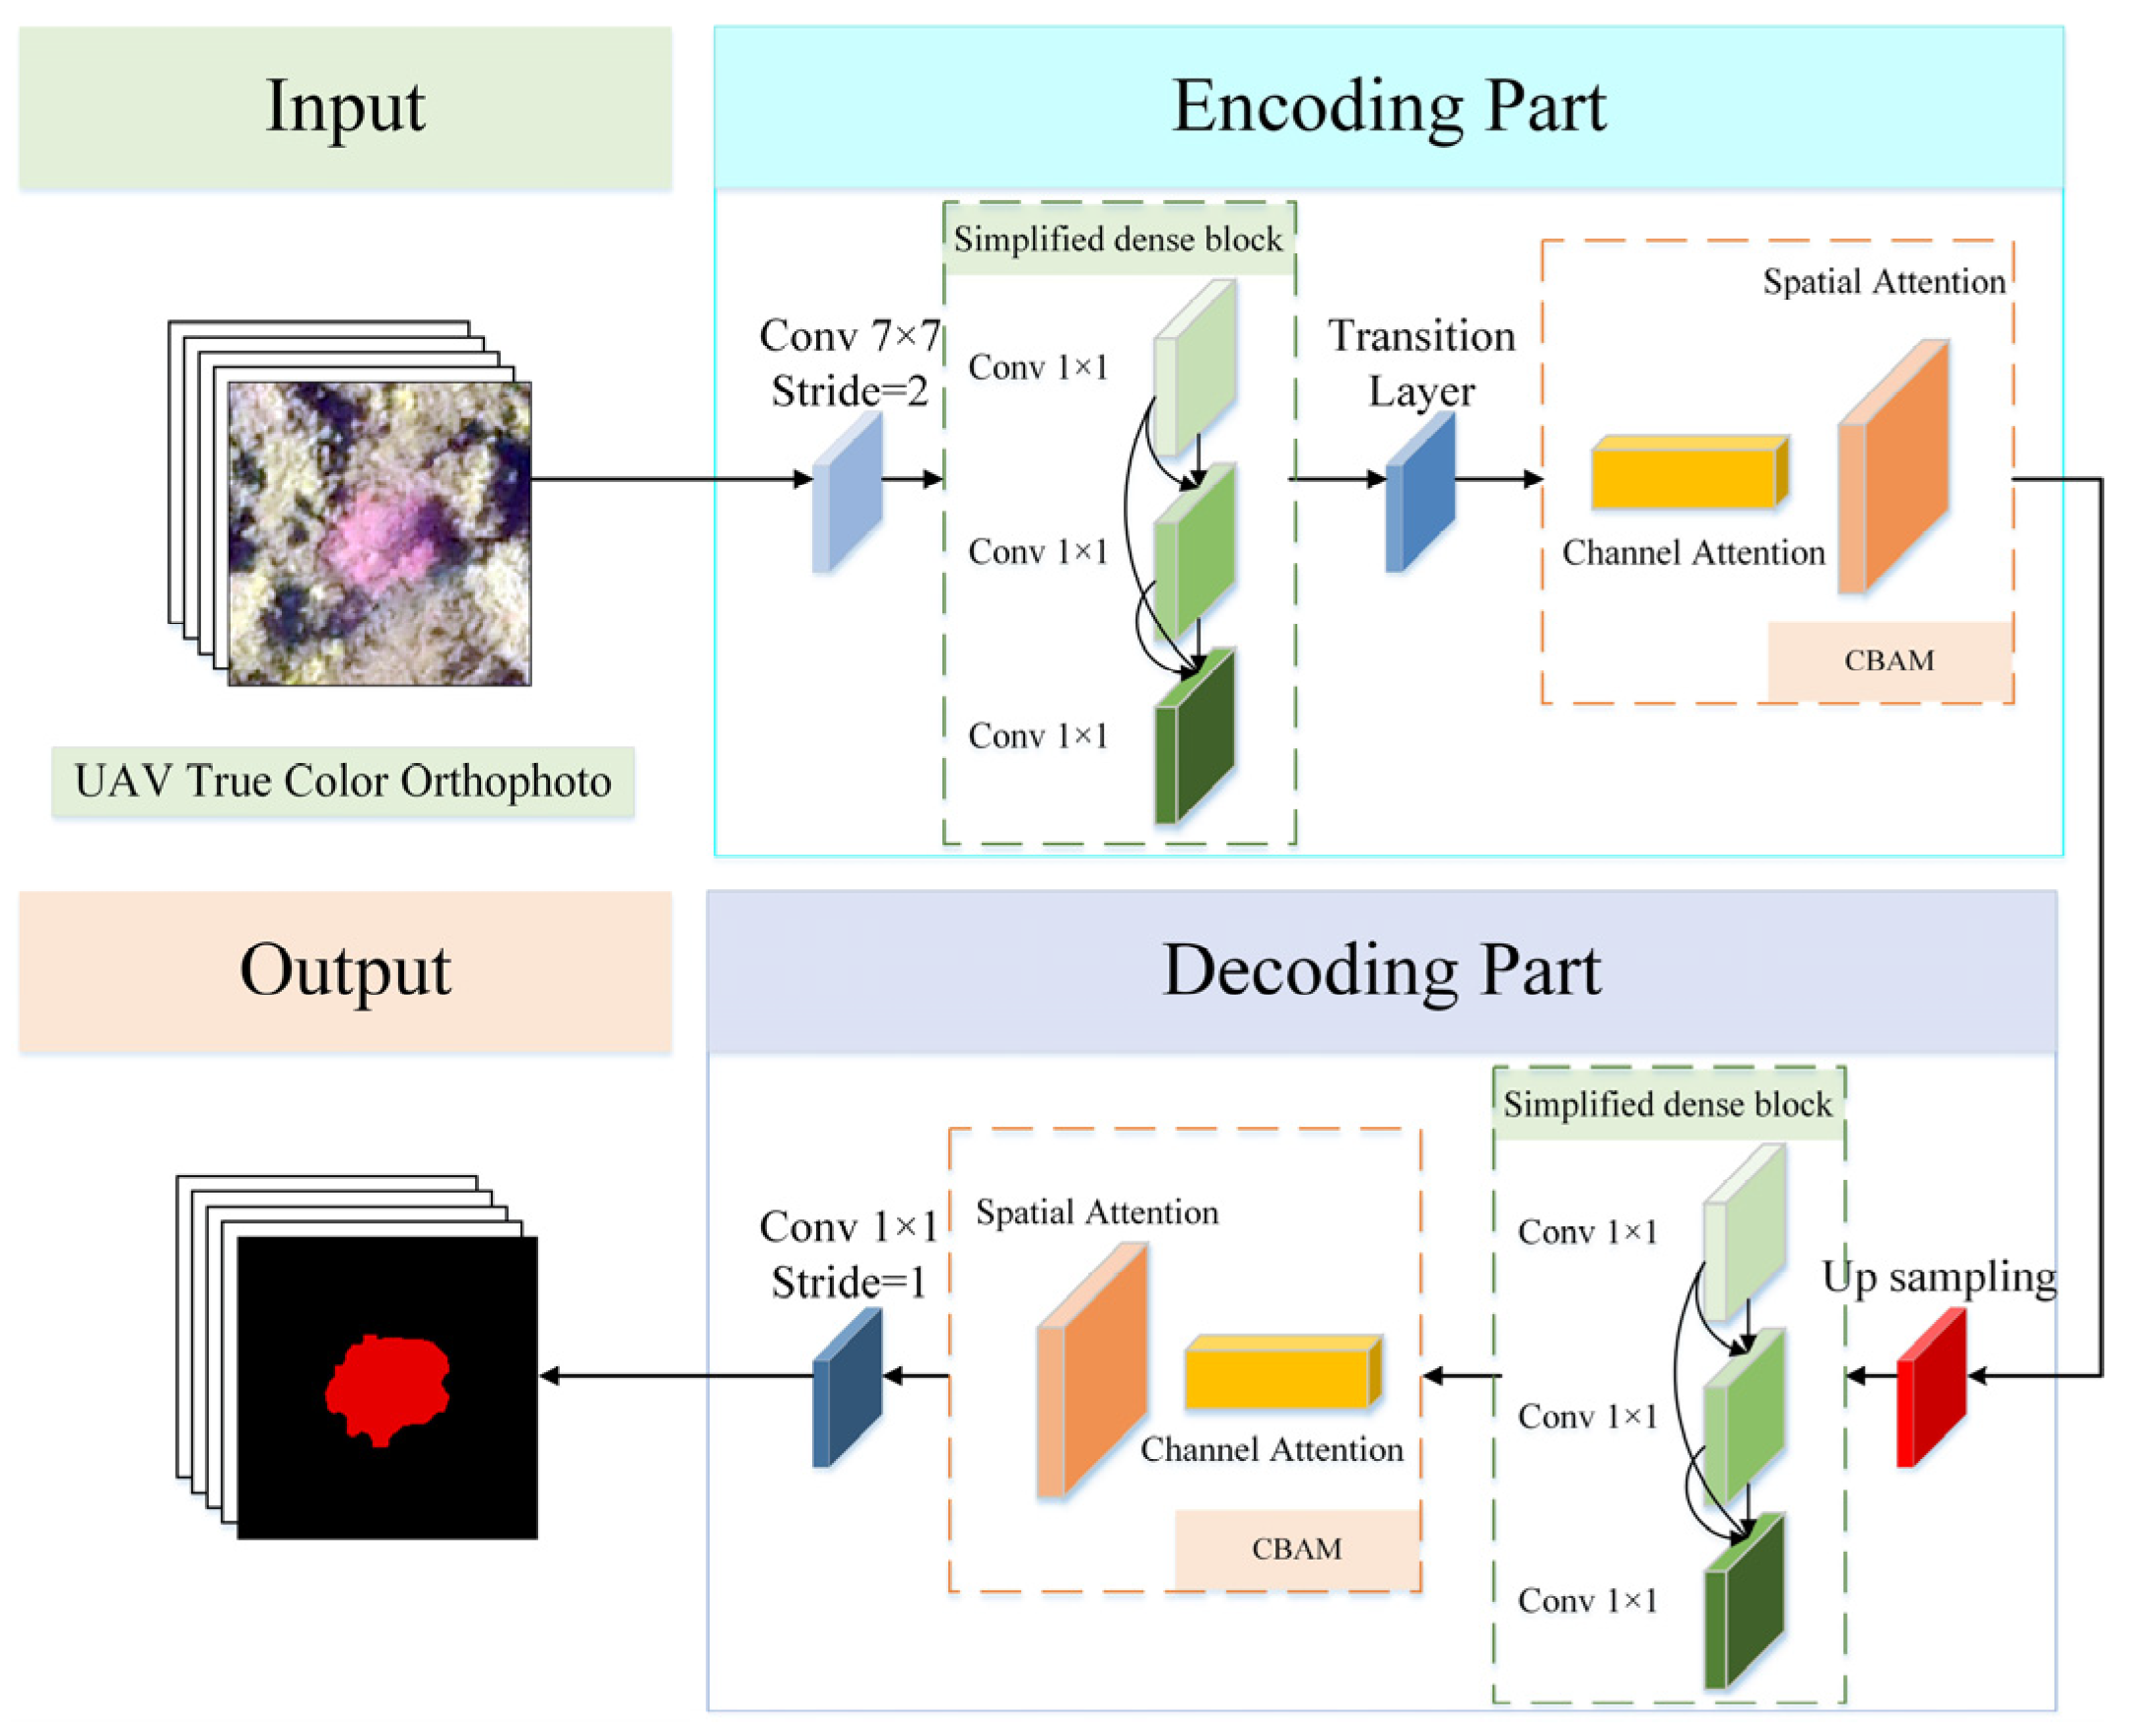
The researchers identified the discolored wood in the images through visual interpretation, and the images were identified through discussion between two researchers and verified by expert evaluators. In remote sensing images, the dynamic changes of natural light can easily affect the image quality and are accompanied by cloud occlusion, different species distribution, and other problems, which have an impact on the representation of abnormal individuals, and the phenomenon of “same object with different spectrum” is prone to occur. The color textures of the discolored wood and bare soil are similar, resulting in the phenomenon of “foreign objects in the same spectrum”. Therefore, when sampling, it is necessary to combine the data resources and achievement status from the existing vegetation extraction information and collect and supplement multi-scale sample remote sensing data in a targeted manner. The selection of samples should be representative, covering typical imaging conditions and ground landscape types (Table 2). The number of samples in various typical situations should be distributed as uniformly as possible to achieve a sufficient number. However, because of the irregular occurrence of abnormal individuals, we selected as many samples as possible to complete the identification work under the premise of implementing the algorithm.
Numerous studies have shown that external morphological or internal physiological changes lead to changes in the spectral reflectance and radiation characteristics of forests, which manifest as changes in spectral values in remote sensing images [49,50]. According to the color texture information, the shape of the crown of the pine tree, and the trend of jumping and spreading of the newly infected area of the pine wood nematode, the pine wood nematode disease showed a certain regularity in the image [51]. In the middle and late stages of infection, the visible light area could distinguish normal pine trees from diseased pine trees.
The identification of discolored wood by expert assessors was based on ecological criteria and relevant supporting information. If the diseased wood is identified in the image, it is drawn as a vector, the label is assigned a value of 1, other background data are assigned a value of 0, and the boundary error is controlled within 1–2 pixels (Figure 4). To improve the diversity of the samples and prevent the model from overfitting, a Python script was used to perform multi-scale segmentation to achieve data enhancement. The image size was divided into 256 × 256 pixels and 320 × 320 pixels to form a training recognition sample library. The datasets in the training sample database were randomly divided into training and validation sets at a ratio of 4:1. To evaluate the recognition performance of the model for discolored wood that exists across regions, we used all images from the southern area of Anhui only for testing and not for training. Training samples were collected from the central area of Anhui. A total of 1367 training sets were used for model training, and 341 validation sets were used for tuning the parameters and evaluating the model. Four regions were randomly selected from southern Anhui for the quantitative evaluation.

3. Methods

D-SCNet uses the DenseNet model as the main network framework, which consists of two parts: the encoding structure and the decoding structure. DenseNet model can make full use of features of different levels through densely connected blocks, which enhances the transfer of features, reduces the number of parameters, and enhances the feature weights [52]. In the encoding process, we adopted the simplified DenseNet densely connected block structure, using two simplified dense blocks (consisting of batch normalization, activation function, and convolutional layer) and two transposed layers (consisting of a 1 × 1 convolutional layer and a 2 × 2 pooling layer) in series with each other. All the layers in a densely connected block are connected to each other, and the input of each layer comes from the features of the outputs of all the previous layers. That is, the output result of each layer and all previous outputs are used as the feature input of the next layer to effectively reduce the gradient disappearance phenomenon and make full use of different levels of feature information. At the same time, in the lightweight model, if the down-sampling level is too deep, the edge recognition of the image will be incomplete and detailed information will be lost. If the network is too shallow for down-sampling, it is prone to overfitting. In the decoding process, we use three up-sampling layers connected by three simplified dense blocks to gradually restore the feature map to the original image size through a series of deconvolutions. Each time, the size of the feature map is up-sampled to 2 times the original size, and the number of channels is unchanged. Finally, a softmax classifier is used to output the prediction graph. Simplified dense block can alleviate the overfitting problem in the original DenseNet training process and at the same time carry out a lightweight model design to improve detection accuracy and detection speed. Convolutional block attention module (CBAM) is a comprehensive module that combines spatial and channel attention modules. We introduced a CBAM after each dense block, which can filter out important information from a large amount of information, reduce information loss, and improve the model effect [53].
D-SCNet network structure is as follows (Figure 5). After the image is input to the network, a convolutional layer with a stride of two and a convolution kernel of seven is first down-sampled. Then, two repetitions of entering the simplified dense block, transposition layer, and CBAM are performed to encode the feature map and reduce the size of the feature map. Entering the decoding structure, three repetitions of entering the up-sampling layer, simplified dense block, and CBAM. The extracted feature map is restored to its original size through continuous up-sampling operations and finally enters the softmax classifier, where the convolutional layer is used to restore the feature map to a binary map.

3.1. Simplified Dense Block

To alleviate the over-fitting problem in the original DenseNet training process, and at the same time carry out a lightweight design of the model to improve the detection accuracy and detection speed, we significantly reduced the network parameters and computation from the model architecture, including the simplified dense block and model compression, to achieve a lightweight automatic sparse method. A simplified dense block refers to three connected 1 × 1 convolutional layer. The number of fixed dense units is smaller, and multiple simplified dense blocks are connected to replace the original dense block, which reduces the dimensions of the output feature map while maintaining the grouped convolution input feature map (Figure 6). A simplified dense block consisting of three dense units was used to prevent the network from overfitting and to extract high-level semantic features. Feature vectors are mapped to simplified dense blocks for kernel learning, which is easier to train and performs better in terms of recognition accuracy, sensitivity, and specificity [54]. The automatic sparse method for model compression to achieve lightweight is to prune the dense block through reinforcement learning. Related scholars have proposed an automatic sparse method to prune redundant jump connections in DenseNet to generate a high-performance sparse network with fewer parameters and less computation [52].

3.2. Convolutional Block Attention Module

Convolutional block attention module is introduced into the network structure. CBAM is a module that focuses local information on feature images with two consecutive submodules: channel attention module and spatial attention module, to emphasize meaningful features in the two main dimensions of the channel and spatial axes. Convolutional attention module can be used to assign weights to feature images through learning. This drives computational resources more towards the focused target regions, effectively helping the flow of information in the network. From a spatial perspective, channel attention is applied globally, while spatial attention acts locally. Therefore, CBAM sequentially applies the channel and spatial attention modules so that each branch can, respectively, learn the “what” and “where” on the channel and spatial axes [55].
CBAM structure is as follows (Figure 7). First, the feature map F is used as input into the channel attention mechanism to infer a one-dimensional channel attention map Mc, which is then combined with the original input feature map by element-by-element summation to generate a weighted feature map F’. The output features F’ of the channel attention module are used as input into the spatial attention mechanism to infer the two-dimensional spatial attention map Ms, which is then combined with the weighted feature map F’ by element-by-element summation to finally obtain the refined feature map F”. Details of each attention module are described below.

3.2.1. Channel Attention Module

Considering the jumping distribution of abnormal individuals, the large degree of background information interference, and the lack of visible light spectrum channels, information redundancy is insufficient. To enhance the utilization of spectral information, we introduced a channel attention module. Channel attention module increases the attention mechanism on the channel dimension, uses a neural network to obtain the importance of each channel in the feature map, and then assigns a weight value to each feature. Initially, each channel was considered equally important. The channel attention mechanism mainly learns the feature weight automatically according to the loss through the fully connected network, such that the weight of the effective feature channel is large. After the channel attention mechanism, different colors represent different weights, causing the neural network to focus on channels with greater weights. The first step is to perform global average pooling and global maximum pooling on the input feature map to achieve feature dimension compression and then pass through a shared multi-layer perceptron (MLP). MLP converts the feature vector into a normalized weight vector between 0 and 1 through two fully connected layers and two activation functions. It is then combined with the original input feature map via element-wise summation to generate a weighted feature map (Figure 8).

3.2.2. Spatial Attention Module

To fully utilize the rich color–texture information of abnormal individuals, enhance feature transfer and feature weights between network layers, effectively select information, and allocate more resources to key feature areas while reducing feature redundancy, we added a spatial attention module to improve the spatial feature representation of key regions. Spatial attention mechanism is the complement of the channel attention mechanism, which mainly focuses on the spatial location information of the features. Aggregated features are formed by increasing the weight of key regions in the feature matrix and reducing the weight of the less-affected regions through the relationship between the internal spaces of the features. First, the output features of the channel attention module are taken as the input, and global max pooling and global average pooling are performed in a concatenated manner to generate new feature space context descriptors. Then, a 7 × 7 convolution kernel was used to perform feature fusion on the resulting matrix. Finally, through the activation function Sigmoid, the spatial attention weights are generated, and the original input feature maps are superimposed to strengthen the target area (Figure 9).

3.3. Evaluation Index

To quantitatively evaluate the overall recognition results, the evaluation indicators included the overall accuracy (OA), F1, precision, recall, and missing alarm (MA). The overall accuracy is an overall index to evaluate the identification accuracy, which refers to the ratio of the number of correctly extracted pine wood nematodes to the total number of targets. F1 is the summed average of precision and recall and is used as a measure of the accuracy of the binary classification model. Precision refers to the ratio of the number of correctly extracted pine wood nematodes to the total number of extracted patches. The recall is the ratio of correctly extracted pine wood nematodes to the true target number. Missing alarm is the ratio of the number of pine wood nematode diseases not identified to the true target number. The formulas for each evaluation index are as follows:
OA = P tp + P tn P tp + P fp + P tn + P fn
F 1 = 2 P tp 2 P tp + P fp + P fn
MA = P fn P tp + P fn
where Ptp is the number of correctly extracted targets, Pfp is the number of incorrectly extracted targets, Ptn is the number of correctly extracted negative samples, and Pfn is the number of missed targets.

4. Results

4.1. The Identification Results

The trained model method was tested in Huangshan study area to judge whether the model can correctly identify and complete the identification when it encounters the sample area that did not participate in the training. The recognition results are shown in the following figure (Figure 10).
Four test areas in Huangshan study area were randomly selected for detailed analysis, with a test area size of approximately one square kilometer. The test area was selected according to the vegetation growth state, terrain, and environmental condition change characteristics in the forest ecosystem, which can represent the natural ecological environment condition and characteristics of Anhui Province to a certain extent. We selected stable growth periods with little variation in tree height to avoid excessive shading; selected areas with some differences in topographic relief to verify experimental generalizability; selected environments with less scrub and dead grass to avoid affecting the accuracy of the experiment. Additionally, we avoided testing in areas with unclear tenure and frequent changes. The identification results were compared with the ground truth results (Figure 11). The test areas 2,3,4 show that the recognition results are more complete. Despite being affected by the same spectrum of foreign objects, for example, the spectral characteristics of bare soil are very similar to those of abnormal individuals, resulting in a minor misclassification in the segmentation results; the abnormal individuals can be completely identified and extracted. Nonetheless, in the test area 1, the recognition accuracy is diminished due to distortion and offset in some locations following image splicing; however, when compared to the ground truth, the overall recognition result is still relatively complete.
The average overall accuracy for all tested regions was 75.93%, the average F1 was 0.86, the average recall was 0.94, the average precision was 0.80, and the average missing alarm was 0.05 (Table 3). The method designed in this study, combined with high-resolution UAV visible-light images, has a good effect on the identification of abnormal individuals in complex backgrounds.

4.2. Comparison with Other Deep Learning Methods

4.2.1. Comparison with Recognition Results of Object Detection Network

YOLOv5 model treats object detection as a regression problem and only requires first-order detection to detect the object type and location. Compared with the ground truth value, the average overall accuracy of all test areas was 32.21%, the average F1 was 0.49, the average recall was 0.33, the average precision was 0.92, and the average missing alarm was 0.67 (Table 4). YOLOv5 missed more individuals during testing, resulting in a lower overall accuracy (Figure 12). This method may have room for further improvement with many samples. However, owing to the irregular occurrence of abnormal individuals, when implementing the algorithm, it is necessary to select as many samples as possible to complete the identification work. Although the precision was higher than that of the method used in this study, the overall accuracy was lower when the sample size was the same. Simultaneously, the semantic segmentation method can obtain a series of information such as the length, width, area, and outline of abnormal individuals. Further research can be conducted for subsequent assessment of the severity of pests in abnormal individuals.

4.2.2. Comparison with Recognition Results of Other Semantic Segmentation Models

To verify the advanced nature of the method for pine wood nematode identification, three advanced deep learning semantic segmentation methods, U-Net [40], PSPNet [38], and SCANet [42], were used for comparative analysis under the same conditions. U-Net has a simple structure and is easy to build. It is suitable for situations in which the amount of data is small, and the background is large. In complicated scenarios, PSPNet was used for semantic segmentation. The core structure contains a pyramid pooling module and a backbone feature network. Incorporating local and global information in the pyramid pooling module can help identify the target object, increase the receptive field of the segmentation layer, and reduce misclassifications. SCANet is a model specially designed to identify pine wood nematode diseases, and it performs well on UAV multispectral images. The method used in this study was compared with other methods in the test area, and the overall identification results were analyzed both qualitatively and quantitatively. In terms of the completeness of target recognition and the accuracy of segmentation, the method in this study achieved good recognition results on most of the test images (Figure 13). As the data select ultra-high-resolution visible-light images, it is difficult for U-Net and PSPNet to consider the balance between spatial information and the receptive field. There is no comprehensive consideration of shallow semantic information and complex deep information; therefore, the U-Net and PSPNet methods have higher misclassifications, missed classifications, and transitional segmentations. SCANet is more suitable for multispectral imaging. The method proposed in this study is far superior to other methods in terms of many evaluation indicators (Table 5).

4.3. Comparison of Ablation Experiments

To demonstrate the effectiveness of the convolutional block attention module, three changes were made to the network. The comparison experiments of removing the channel attention module (No-c), removing the spatial attention module (No-s), and removing all the above modules at the same time (No-cbam) and the methods in this paper are carried out (Figure 14). The spectral channel information of the removal channel attention module (No-c) is lost, and pine nematode disease cannot be accurately identified, resulting in numerous missed points. Despite the high precision, the recall rate was low. The removal of the spatial attention module (No-s) fails to highlight disease features and suppresses the interference of background features, resulting in serious misclassification (Table 6). The results show that the convolutional block attention module has a positive impact on the network while enhancing the target individual features. It has the advantages of less misclassification, less leakage, and higher recognition accuracy.

4.4. Comparison of Network Operation Efficiency

In order to evaluate the operational efficiency of each network, this study uses training time, testing time, parameters, and floating-point operations (FLOPs) to quantitatively evaluate the network efficiency. Training time is the time required to train a fixed sample of images. The test time is the time required to test a single image (space occupied by 167 M). Parameters are used to measure the size of the model and to calculate the spatial complexity. FLOPs represent the total number of floating-point operations performed by the network model in one forward inference and are often used to measure the computational complexity of the network model. Generally, the smaller the number of FLOPs, the faster the inference speed of the network model. The experiments verify that the overall performance of D-SCNet is better than other mainstream convolutional neural network models, with faster recognition speed, smaller number of parameters and computation, and higher recognition accuracy. The method proposed in this paper achieved better results in terms of overall efficiency and accuracy (Table 7).

5. Discussion

Large-scale and accurate forest ecological monitoring is the basis of understanding forest ecosystems. The use of remote sensing technology to explore abnormal individual changes is of great significance to forest ecosystems. Because of its superior predictive capabilities, deep learning will revolutionize the way researchers identify individuals. In this paper, a new D-SCNet structure is designed based on remote sensing images of UAV visible light to achieve automatic recognition of abnormal individuals. We describe the steps required to train a deep learning model for individual identification. To the best of our knowledge, this is one of the few cases of anomalous individual identification in complex forest landscapes and promises to address some of the limitations of the current methods.
In the automatic monitoring of forest ecosystems, the complexity and large-scale nature of forest landscapes, as well as the difficulties of cross-regional and cross-spatial scales, hinder the transferability of abnormal individual identification methods [56]. At the same time, in remote sensing images, objective conditions such as environmental status, species distribution, topography, and landforms exist, which have a huge impact on the representation of individuals with each other and between individuals and the environment. However, shallow representation changes do not change the essential properties of the target. Our data included images of different regions and different resolutions to solve the above-mentioned problems. Four evaluation indicators were obtained in the experiment; the average overall accuracy was 75.93%, the average recall rate was 0.94, the average precision rate was 0.80, and the average missed alarm rate was 0.05. Compared with the object detection network (YOLOv5) and segmentation networks (U-Net, PSPNet, SCANet), our method has a better effect on improving the individual recognition probability. Our method is simple and easy to train and test on other target individuals in different environments, which can help researchers identify desired target individuals in different environments and quantify important biological characteristics. This is of great significance to ecological development.
As deep learning methods are widely used in ecological investigations, ecological insights have advanced significantly. However, currently, deep learning methods have high requirements for the quality and quantity of sample data [44]. Meanwhile, complex conditions such as imaging and observation conditions, area types, and environments make it difficult to obtain samples or public sample datasets. This has seriously affected the automated monitoring of abnormal individuals in forest ecosystems. This method uses 835 pine wood nematode patterns to implement the algorithm to accomplish the identification, data enhancement was performed, without using data such as near infrared or LiDAR and using only visible light images. Our method effectively selects information, suppresses background noise in images, and alleviates the overfitting problem during small-sample training, achieving a better recognition effect while improving the speed.
When conducting ecological surveys, researchers often use directly captured true-color videos and images as the primary data source [57]. However, relying on manual individual identification is time-consuming and labor-intensive, resulting in a considerable lag between the massive data and the identification results, which often limits researchers to studying individuals in specific environments. Therefore, a significant advancement in our method is to take full advantage of extensive video images to automatically identify target individuals. In the experiment, we used UAV remote sensing equipped with a visible-light sensor for data collection. This method only acquires ultra-high-resolution images (spatial resolution of 2–15 cm) using devices such as SLR cameras. Data acquisition and processing are fully automatic, with long-range capability to acquire a wide range of ground information. Through the spectrum, texture, color, and other information combined with the semantic analysis method, the geometric shape of the individual is obtained. Compared with LiDAR, hyperspectral, and multispectral sensors carried by UAVs, it has strong applicability, simple operation, and low cost, although it cannot obtain rich spectral and geometric information. Generally, grassroots forestry personnel are not familiar with data formats and preprocessing requirements or lack appropriate hardware conditions and data processing capabilities. The collection and processing of sensor data, such as LiDAR, hyperspectral, and multispectral data, are complex and require professional certified personnel to operate, so they are not universal. The adoption of visible-light sensors lowers the barriers to entry into wider applications and can help improve the utilization of massive amounts of data on a global scale. Our methodology can help researchers identify desired target individuals in different environments, and quantify important biological characteristics, all of which are crucial for ecological development.

6. Conclusions

In the context of the great increase in tree mortality caused by global ecological and climate change, understanding the category and geometric attribute data (length, width, area, contour) of abnormal individuals is helpful to maintain the stability of forest ecosystems. In this paper, a D-SCN network is designed to automatically identify abnormal individuals using aerial images in complex forest landscapes. The experimental results show that the network outperforms other networks, is effective in the intelligent identification of abnormal individuals, and has good generality for rapid forest vegetation surveys. The method in this paper only uses RGB image band information to show a better accuracy effect in comparison experiments, and the recognition results are completer and more accurate, but there are still some misclassification phenomena due to insufficient information. Therefore, future research directions will consider adding more features as supporting information for this problem, as well as combining with auxiliary remote sensing data to further improve the classification accuracy.

Author Contributions

Conceptualization, B.W. and Z.Z.; methodology, J.Q.; software, Y.W.; validation, Z.Z., A.H., H.S., and P.C.; formal analysis, Z.Z., B.W., and W.C; investigation, Z.Z. and J.Q.; data curation, Z.Z.; writing—original draft preparation, Z.Z.; writing—review and editing, B.W. and W.C.; project administration, B.W. and Y.W.; funding acquisition, B.W. and Y.W. All authors have read and agreed to the published version of the manuscript.

Funding

This research was funded by the National Natural Science Foundation of China (grant numbers 41901282, 42101381 and 41971311), the National Natural Science Foundation of Anhui (grant number 2008085QD188), the Science and Technology Major Project of Anhui Province (grant No. 201903a07020014) and the International Science and Technology Cooperation Special (grant number 202104b11020022).

Data Availability Statement

The data presented in this study are available on request from the corresponding author. The data are not publicly available due to copyright issues.

Conflicts of Interest

The authors declare no conflict of interest.

References

  1. Ellison, D.; Morris, C.E.; Locatelli, B.; Sheil, D.; Cohen, J.; Murdiyarso, D.; Gutierrez, V.; van Noordwijk, M.; Creed, I.F.; Pokorny, J.; et al. Trees, forests and water: Cool insights for a hot world. Glob. Environ. Chang. 2017, 43, 51–61. [Google Scholar] [CrossRef]
  2. Grossiord, C. Having the right neighbors: How tree species diversity modulates drought impacts on forests. New Phytol. 2020, 228, 42–49. [Google Scholar] [CrossRef] [Green Version]
  3. Xiao, J.; Chevallier, F.; Gomez, C.; Guanter, L.; Hicke, J.A.; Huete, A.R.; Ichii, K.; Ni, W.; Pang, Y.; Rahman, A.F.; et al. Remote sensing of the terrestrial carbon cycle: A review of advances over 50 years. Remote Sens. Environ. 2019, 233, 111383. [Google Scholar] [CrossRef]
  4. Wu, J.; Albert, L.P.; Lopes, A.P.; Restrepo-Coupe, N.; Hayek, M.; Wiedemann, K.T.; Guan, K.; Stark, S.C.; Christoffersen, B.; Prohaska, N.; et al. Leaf development and demography explain photosynthetic seasonality in Amazon evergreen forests. Science 2016, 351, 972–976. [Google Scholar] [CrossRef] [PubMed] [Green Version]
  5. Pan, Y.; Birdsey, R.A.; Phillips, O.L.; Jackson, R.B. The Structure, Distribution, and Biomass of the World's Forests. Annu. Rev. Ecol. Evol. Syst. 2013, 44, 593–622. [Google Scholar] [CrossRef] [Green Version]
  6. Vieilledent, G.; Grinand, C.; Rakotomalala, F.A.; Ranaivosoa, R.; Rakotoarijaona, J.R.; Allnutt, T.F.; Achard, F. Combining global tree cover loss data with historical national forest cover maps to look at six decades of deforestation and forest fragmentation in Madagascar. Biol. Conserv. 2018, 222, 189–197. [Google Scholar] [CrossRef]
  7. Ramsfield, T.D.; Bentz, B.J.; Faccoli, M.; Jactel, H.; Brockerhoff, E.G. Forest health in a changing world: Effects of globalization and climate change on forest insect and pathogen impacts. Forestry 2016, 89, 245–252. [Google Scholar] [CrossRef] [Green Version]
  8. Feng, Z.; de Marco, A.; Anav, A.; Gualtieri, M.; Sicard, P.; Tian, H.; Fornasier, F.; Tao, F.; Guo, A.; Paoletti, E. Economic losses due to ozone impacts on human health, forest productivity and crop yield across China. Environ. Int. 2019, 131, 104966. [Google Scholar] [CrossRef]
  9. Poland, T.M.; Rassati, D. Improved biosecurity surveillance of non-native forest insects: A review of current methods. J. Pest Sci. 2019, 92, 37–49. [Google Scholar] [CrossRef]
  10. Forrester, D.I.; Tachauer, I.H.H.; Annighoefer, P.; Barbeito, I.; Pretzsch, H.; Ruiz-Peinado, R.; Stark, H.; Vacchiano, G.; Zlatanov, T.; Chakraborty, T.; et al. Generalized biomass and leaf area allometric equations for European tree species incorporating stand structure, tree age and climate. For. Ecol. Manag. 2017, 396, 160–175. [Google Scholar] [CrossRef]
  11. Anderegg, W.R.L.; Hicke, J.A.; Fisher, R.A.; Allen, C.D.; Aukema, J.; Bentz, B.; Hood, S.; Lichstein, J.W.; Macalady, A.K.; Mcdowell, N.; et al. Tree mortality from drought, insects, and their interactions in a changing climate. New Phytol. 2015, 208, 674–683. [Google Scholar] [CrossRef]
  12. Angiulli, F.; Fassetti, F.; Palopoli, L. Detecting outlying properties of exceptional objects. ACM Trans. Database Syst. 2009, 34, 1–62. [Google Scholar] [CrossRef]
  13. Jactel, H.; Moreira, X.; Castagneyrol, B. Tree Diversity and Forest Resistance to Insect Pests: Patterns, Mechanisms, and Prospects. Annu. Rev. Entomol. 2021, 66, 277–296. [Google Scholar] [CrossRef] [PubMed]
  14. Waser, L.T.; Küchler, M.; Jütte, K.; Stampfer, T. Evaluating the Potential of WorldView-2 Data to Classify Tree Species and Different Levels of Ash Mortality. Remote Sens. 2014, 6, 4515–4545. [Google Scholar] [CrossRef] [Green Version]
  15. Mayer, A.L.; Lopez, R.D. Use of Remote Sensing to Support Forest and Wetlands Policies in the USA. Remote Sens. 2011, 3, 1211–1233. [Google Scholar] [CrossRef] [Green Version]
  16. Oliver, T.H.; Heard, M.S.; Isaac, N.J.B.; Roy, D.B.; Procter, D.; Eigenbrod, F.; Freckleton, R.; Hector, A.; Orme, C.D.L.; Petchey, O.L.; et al. Biodiversity and Resilience of Ecosystem Functions. Trends Ecol. Evol. 2015, 30, 673–684. [Google Scholar] [CrossRef] [Green Version]
  17. Gaparovi, M.; Dobrini, D. Comparative assessment of machine learning methods for urban vegetation mapping using multitemporal Sentinel-1 imagery. Remote Sens. 2020, 12, 1952. [Google Scholar] [CrossRef]
  18. Wang, W.; Peng, W.; Liu, X.; He, G.; Cai, Y. Spatiotemporal Dynamics and Factors Driving the Distributions of Pine Wilt Disease-Damaged Forests in China. Forests 2022, 13, 261. [Google Scholar] [CrossRef]
  19. Guimarães, N.; Pádua, L.; Marques, P.; Silva, N.; Peres, E.; Sousa, J.J. Forestry Remote Sensing from Unmanned Aerial Vehicles: A Review Focusing on the Data, Processing and Potentialities. Remote Sens. 2020, 12, 1046. [Google Scholar] [CrossRef] [Green Version]
  20. Li, Z.; Yang, R.; Cai, W.; Xue, Y.; Hu, Y.; Li, L. LLAM-MDCNet for Detecting Remote Sensing Images of Dead Tree Clusters. Remote Sens. 2022, 14, 3684. [Google Scholar] [CrossRef]
  21. Onishi, M.; Ise, T. Explainable identification and mapping of trees using UAV RGB image and deep learning. Sci. Rep. 2021, 11, 903. [Google Scholar] [CrossRef] [PubMed]
  22. Deng, L.; Mao, Z.; Li, X.; Hu, Z.; Duan, F.; Yan, Y. UAV-based multispectral remote sensing for precision agriculture: A comparison between different cameras. ISPRS J. Photogramm. Remote Sens. 2018, 146, 124–136. [Google Scholar] [CrossRef]
  23. Zhong, Y.; Wang, X.; Xu, Y.; Wang, S.; Jia, T.; Hu, X.; Zhao, J.; Wei, L.; Zhang, L. Mini-UAV-Borne Hyperspectral Remote Sensing: From Observation and Processing to Applications. IEEE Geosci. Remote Sens. Mag. 2018, 6, 46–62. [Google Scholar] [CrossRef]
  24. Jactel, H.; Brockerhoff, E.G. Tree diversity reduces herbivory by forest insects. Ecol. Lett. 2007, 10, 835–848. [Google Scholar] [CrossRef]
  25. Karmezi, M.; Bataka, A.; Papachristos, D.; Avtzis, D.N. Nematodes in the Pine Forests of Northern and Central Greece. Insects 2022, 13, 194. [Google Scholar] [CrossRef]
  26. Robinson, J.M.; Harrison, P.A.; Mavoa, S.; Breed, M.F. Existing and emerging uses of drones in restoration ecology. Methods Ecol. Evol. 2022, 13, 1899–1911. [Google Scholar] [CrossRef]
  27. Olegario., T.V.; Baldovino, R.G.; Bugtai, N.T. A Decision Tree-based Classification of Diseased Pine and Oak Trees Using Satellite Imagery. In Proceedings of the 2020 IEEE 12th International Conference on Humanoid, Nanotechnology, Information Technology, Communication and Control, Environment, and Management (HNICEM), Manila, Philippines, 3–7 December 2020. [Google Scholar]
  28. Zhang, S.; Huang, H.; Huang, Y.; Cheng, D.; Huang, J. A GA and SVM Classification Model for Pine Wilt Disease Detection Using UAV-Based Hyperspectral Imagery. Appl. Sci. 2022, 12, 6676. [Google Scholar] [CrossRef]
  29. Tang, C.; Uriarte, M.; Jin, H.; Morton, D.C.; Zheng, T. Large-scale, image-based tree species mapping in a tropical forest using artificial perceptual learning. Methods Ecol. Evol. 2021, 12, 608–618. [Google Scholar] [CrossRef]
  30. Ball, J.G.C.; Petrova, K.; Coomes, D.A.; Flaxman, S. Using deep convolutional neural networks to forecast spatial patterns of Amazonian deforestation. Methods Ecol. Evol. 2022, 13, 2622–2634. [Google Scholar] [CrossRef]
  31. Borowiec, M.L.; Dikow, R.B.; Frandsen, P.B.; McKeeken, A.; Valentini, G.; White, A.E. Deep learning as a tool for ecology and evolution. Methods Ecol. Evol. 2022, 13, 1640–1660. [Google Scholar] [CrossRef]
  32. Sun, J.; Yang, Y.; He, X.; Wu, X. Northern Maize Leaf Blight Detection Under Complex Field Environment Based on Deep Learning. IEEE Access 2020, 8, 33679–33688. [Google Scholar] [CrossRef]
  33. Liu, W.; Anguelov, D.; Erhan, D.; Szegedy, C.; Reed, S.; Fu, C.Y.; Berg, A.C. Ssd: Single shot multibox detector. In European Conference on Computer Vision; Springer: Cham, Switzerland, 2016; pp. 21–37. [Google Scholar]
  34. Liu, J.; Wang, X. Tomato Diseases and Pests Detection Based on Improved Yolo V3 Convolutional Neural Network. Front. Plant Sci. 2020, 11, 898. [Google Scholar] [CrossRef] [PubMed]
  35. Redmon, J.; Farhadi, A. YOLO9000: Better, faster, stronger. In Proceedings of the IEEE Conference on Computer Vision and Pattern Recognition, Honolulu, HI, USA, 21–26 July 2017; pp. 7263–7271. [Google Scholar]
  36. Stewart, E.L.; Wiesner-Hanks, T.; Kaczmar, N.; DeChant, C.; Wu, H.; Lipson, H.; Nelson, R.J.; Gore, M.A. Quantitative Phenotyping of Northern Leaf Blight in UAV Images Using Deep Learning. Remote Sens. 2019, 11, 2209. [Google Scholar] [CrossRef] [Green Version]
  37. He, K.; Gkioxari, G.; Dollar, P.; Girshick, R. Mask r-cnn[C]. In Proceedings of the IEEE International Conference on Computer Vision, Venice, Italy, 22–29 October 2017; pp. 2961–2969. [Google Scholar]
  38. Tassis, L.M.; De Souza, J.E.T.; Krohling, R.A. A deep learning approach combining instance and semantic segmentation to identify diseases and pests of coffee leaves from in-field images. Comput. Electron. Agric. 2021, 186, 106191. [Google Scholar] [CrossRef]
  39. Zhao, H.; Shi, J.; Qi, X.; Wang, X.; Jia, J. Pyramid scene parsing network. In Proceedings of the IEEE Conference on Computer Vision and Pattern Recognition, Honolulu, HI, USA, 21–26 July 2017; pp. 2881–2890. [Google Scholar]
  40. Chen, C.; Jing, L.; Li, H.; Tang, Y. A New Individual Tree Species Classification Method Based on the ResU-Net Model. Forests 2021, 12, 1202. [Google Scholar] [CrossRef]
  41. Ronneberger, O.; Fischer, P.; Brox, T. U-net: Convolutional networks for biomedical image segmentation. In Proceedings of the International Conference on Medical Image Computing and Computer-Assisted Intervention, Munich, Germany, 5–9 October 2015; Springer: Cham, Switzerland, 2015; pp. 234–241. [Google Scholar]
  42. Qin, J.; Wang, B.; Wu, Y.; Lu, Q.; Zhu, H. Identifying Pine Wood Nematode Disease Using UAV Images and Deep Learning Algorithms. Remote Sens. 2021, 13, 162. [Google Scholar] [CrossRef]
  43. Bhujel, A.; Kim, N.E.; Arulmozhi, E.; Basak, J.K.; Kim, H.T. A Lightweight Attention-Based Convolutional Neural Networks for Tomato Leaf Disease Classification. Agriculture 2022, 12, 228. [Google Scholar] [CrossRef]
  44. Jia, S.; Jiang, S.; Lin, Z.; Li, N.; Xu, M.; Yu, S. A survey: Deep learning for hyperspectral image classification with few labeled samples. Neurocomputing 2021, 448, 179–204. [Google Scholar] [CrossRef]
  45. Wu, W.; Zhang, Z.; Zheng, L.; Han, C.; Wang, X.; Xu, J.; Wang, X. Research Progress on the Early Monitoring of Pine Wilt Disease Using Hyperspectral Techniques. Sensors 2020, 20, 3729. [Google Scholar] [CrossRef]
  46. Hao, Z.; Huang, J.; Li, X.; Sun, H.; Fang, G. A multi-point aggregation trend of the outbreak of pine wilt disease in China over the past 20 years. For. Ecol. Manag. 2022, 505, 119890. [Google Scholar] [CrossRef]
  47. Li, M.; Li, H.; Ding, X.; Wang, L.; Wang, X.; Chen, F. The Detection of Pine Wilt Disease: A Literature Review. Int. J. Mol. Sci. 2022, 23, 10797. [Google Scholar] [CrossRef]
  48. Fukuda, K. Physiological Process of the Symptom Development and Resistance Mechanism in Pine Wilt Disease. J. For. Res. 1997, 2, 171–181. [Google Scholar] [CrossRef]
  49. Li, N.; Huo, L.; Zhang, X. Classification of pine wilt disease at different infection stages by diagnostic hyperspectral bands. Ecol. Indic. 2022, 142, 109198. [Google Scholar] [CrossRef]
  50. Wu, D.; He, Y.; Nie, P.; Cao, F.; Bao, Y. Hybrid variable selection in visible and near-infrared spectral analysis for non-invasive quality determination of grape juice. Anal. Chim. Acta 2010, 659, 229–237. [Google Scholar] [CrossRef] [PubMed]
  51. Choi, W.I.; Song, H.J.; Kim, D.S.; Lee, D.S.; Lee, C.Y.; Nam, Y.; Kim, J.B.; Park, Y.S. Dispersal Patterns of Pine Wilt Disease in the Early Stage of Its Invasion in South Korea. Forests 2017, 8, 411. [Google Scholar] [CrossRef] [Green Version]
  52. Li, T.; Jiao, W.; Wang, L.N.; Zhong, G. Automatic DenseNet Sparsification. IEEE Access 2020, 8, 62561–62571. [Google Scholar] [CrossRef]
  53. Chen, J.; Wan, L.; Zhu, J.; Xu, G.; Deng, M. Multi-Scale Spatial and Channel-wise Attention for Improving Object Detection in Remote Sensing Imagery. IEEE Geosci. Remote Sens. Lett. 2020, 17, 681–685. [Google Scholar] [CrossRef]
  54. Zhou, T.; Ye, X.; Lu, H.; Zheng, X.; Qiu, S.; Liu, Y. Dense Convolutional Network and Its Application in Medical Image Analysis. BioMed Res. Int. 2022, 2022, 1–22. [Google Scholar] [CrossRef] [PubMed]
  55. Woo, S.; Park, J.; Lee, J.Y.; Kweon, I.S. Cbam: Convolutional block attention module. In Proceedings of the European Conference on Computer Vision (ECCV), Munich, Germany, 8 September 2018; pp. 3–19. [Google Scholar]
  56. Young, D.J.N.; Koontz, M.J.; Weeks, J. Optimizing aerial imagery collection and processing parameters for drone-based individual tree mapping in structurally complex conifer forests. Methods Ecol. Evol. 2022, 13, 1447–1463. [Google Scholar] [CrossRef]
  57. Tabak, M.A.; Norouzzadeh, M.S.; Wolfson, D.W.; Sweeney, S.J.; Vercauteren, K.C.; Snow, N.P.; Halseth, J.M.; di Salvo, P.A.; Lewis, J.S.; White, M.D.; et al. Machine learning to classify animal species in camera trap images: Applications in ecology. Methods Ecol. Evol. 2019, 10, 585–590. [Google Scholar] [CrossRef] [Green Version]
Figure 1. UAV Optical Sensor Features.
Remotesensing 15 01181 g001
Figure 2. Photographs of the process of pine trees infected with pine wood nematode. (a) Photographed on the first day. (b) Photographed on the tenth day. (c) Photographed on the twenty-fifth day.
Remotesensing 15 01181 g002
Figure 3. The experimental data. (a) Anhui Province regional map. (b) Huangshan study area. (c) Hefei sample data area.
Remotesensing 15 01181 g003
Figure 4. Sample database.
Remotesensing 15 01181 g004
Figure 5. D-SCNet network structure.
Remotesensing 15 01181 g005
Figure 6. The network structure of simplified dense block.
Remotesensing 15 01181 g006
Figure 7. The structure of CBAM.
Remotesensing 15 01181 g007
Figure 8. The structure of channel attention module.
Remotesensing 15 01181 g008
Figure 9. The structure of spatial attention module.
Remotesensing 15 01181 g009
Figure 10. Results map of southern Anhui study area. (a) Huangshan study area A. (b) Huangshan study area B.
Remotesensing 15 01181 g010
Figure 11. Test area identification results.
Remotesensing 15 01181 g011
Figure 12. YOLOv5 model test results.
Remotesensing 15 01181 g012
Figure 13. Test results of other comparison methods.
Remotesensing 15 01181 g013
Figure 14. Comparative results of ablation experiments.
Remotesensing 15 01181 g014
Table 1. Flight parameters.
ImagesHefei Sample Data AreaHuangshan Study Area AHuangshan Study Area B
Flight altitude414 m1060 m1060 m
Spatial resolution0.04 m0.09 m0.09 m
Flight time2021-09-282022-02-012022-02-01
Number of photos8962614347
Center coordinatesE116°56′50″
N31°45′8″
E118°10′1″
N29°44′53″
E118°22′1″
N29°41′56″
Number of spectral channelsBlue: 475 nm
Green: 560 nm
Red: 670 nm
Table 2. Remote sensing images of typical features.
Images
Typical features of pine wood nematodeRemotesensing 15 01181 i001Remotesensing 15 01181 i002Remotesensing 15 01181 i003Remotesensing 15 01181 i004
Other typical featuresRemotesensing 15 01181 i005Remotesensing 15 01181 i006Remotesensing 15 01181 i007Remotesensing 15 01181 i008
Table 3. The accuracy identification using D-SCNet.
Test AreaTotal Visual InterpretationTotal Number of IdentificationsCorrect NumberOverall AccuracyF1PrecisionRecallMissing Alarm
113917712464.58%0.780.700.890.11
226930925578.95%0.880.830.940.06
314416313982.73%0.900.850.960.04
420324619677.47%0.880.800.970.03
Table 4. The accuracy identification using YOLOv5.
Test AreaTotal Visual InterpretationTotal Number of IdentificationsCorrect NumberOverall AccuracyF1PrecisionRecallMissing Alarm
1139514329.25%0.450.840.310.69
22691039132.38%0.490.880.340.66
3144454430.34%0.470.980.310.69
4203797636.89%0.530.960.370.63
Table 5. The accuracy identification using other comparison methods.
Test AreaModelsTotal Visual InterpretationTotal Number of IdentificationsCorrect NumberOverall AccuracyF1PrecisionRecallMissing Alarm
1D-SCNet13917712464.58%0.780.700.890.11
SCANet139605134.46%0.520.850.370.63
U-Net13969313519.37%0.320.190.970.03
PSPNet139171611.43%0.210.940.120.88
2D-SCNet26930925578.95%0.880.830.940.06
SCANet269979032.61%0.490.930.330.67
U-Net26960525641.42%0.580.420.950.05
PSPNet269615821.32%0.360.950.220.78
3D-SCNet14416313982.73%0.900.850.960.04
SCANet144555437.24%0.550.980.380.63
U-Net14447114129.75%0.460.300.980.02
PSPNet144292819.31%0.320.970.190.81
4D-SCNet20324619677.47%0.880.800.970.03
SCANet203696632.04%0.490.960.330.67
U-Net20363919830.74%0.470.310.980.02
PSPNet203383718.13%0.300.970.180.82
Table 6. Accuracy evaluation of ablation experiments.
Test AreaModelsTotal Visual InterpretationTotal Number of IdentificationsCorrect NumberOverall AccuracyF1PrecisionRecallMissing Alarm
1D-SCNet13917712464.58%0.780.700.890.11
No-c139917548.39%0.650.820.540.46
No-s13923212955.31%0.690.550.930.07
No-cbam13919112057.14%0.730.630.860.14
2D-SCNet26930925578.95%0.880.830.940.06
No-c26915513747.74%0.650.880.510.49
No-s26945225655.05%0.710.570.950.05
No-cbam26932523266.85%0.800.730.880.12
3D-SCNet14416313982.73%0.900.850.960.04
No-c144858255.78%0.720.960.570.43
No-s14424013654.84%0.710.570.940.06
No-cbam14414211563.54%0.780.760.800.20
4D-SCNet20324619677.47%0.880.800.970.03
No-c20315214669.86%0.820.960.720.28
No-s20332718754.52%0.700.570.920.08
No-cbam20325317160.00%0.750.680.840.16
Table 7. Accuracy evaluation of this method test results.
ModelsTest Image Space Usage/MImage ResolutionParameters/MFLOPs/MTraining Time/minTest Time/minComputer Configuration
D-SCNet1670.09 m3.93183.13424All models run on Windows 10 64-bit operating system. The hardware configuration is Inter Core (TM) i9-10900F CPU and NVIDIA GeForce RTX 2070 SUPER graphics card and 64 GB of memory.
U-Net3.36189.90741
PSPNet2.90177.3305
YOLOv552130012000.5
Disclaimer/Publisher’s Note: The statements, opinions and data contained in all publications are solely those of the individual author(s) and contributor(s) and not of MDPI and/or the editor(s). MDPI and/or the editor(s) disclaim responsibility for any injury to people or property resulting from any ideas, methods, instructions or products referred to in the content.

