Technical Note

Methodology and Results of Satellite Monitoring of Karenia Microalgae Blooms, That Caused the Ecological Disaster off Kamchatka Peninsula

by
Anatoly Alexanin
1,2,
Vasilii Kachur
1,2,*,
Anastasiya Khramtsova
2 and
Tatiana Orlova
3
1
Institute of Automation and Control Processes, Far Eastern Branch of Russian Academy of Sciences, 690041 Vladivostok, Russia
2
Institute of Mathematics and Computer Technologies, Far Eastern Federal University, 690922 Vladivostok, Russia
3
National Scientific Center of Marine Biology, Far East Branch of the Russian Academy of Sciences, 690041 Vladivostok, Russia
*
Author to whom correspondence should be addressed.
Remote Sens. 2023, 15(5), 1197; https://doi.org/10.3390/rs15051197
Submission received: 20 December 2022 / Revised: 20 February 2023 / Accepted: 20 February 2023 / Published: 22 February 2023
(This article belongs to the Section Ocean Remote Sensing)

Abstract

:
The environmental disaster in Kamchatka in the autumn of 2020 was caused by an extensive bloom of harmful microalgae of the genus Karenia. A spectral shape algorithm was used to detect algae on satellite imagery. The algorithm calibration of in situ species composition data made it possible to identify areas where harmful algae dominated in biomass. The algorithm allowed evaluation of the dynamics of the distribution of the algae. The state of phytoplankton was estimated based on images of the specific capacity of photosynthesis. Specific fluorescence is the ratio of the height of the fluorescence line (flh) to the concentration of chlorophyll-a (chl-a). The parameter was used to recognize the stages of the algal bloom: intensive growth, blooming, and change in the dominant algal species. In addition, an increase in the concentration of harmful substances in the coastal zone due to wind impact was analyzed. After analyzing the available data, the events that caused the ecological disaster can be summarized as follows. After the stage of intensive growth of microalgae, nutrient deficiency stimulated the production of metabolites that have a harmful effect on the environment. The change of the dominant alga species in the second half of September and the past storm contributed to a sharp increase in the concentration of metabolites and dead organic matter in the coastal zone, which caused an ecological disaster. The subsequent mass bloom of alga species of the same genus, and the regular wind impact leading to the concentration of harmful substances in the coastal zone, contributed to the development of this catastrophic phenomenon.

1. Introduction

The environmental disaster off the coast of the Kamchatka Peninsula at the end of September and into October 2020 was accompanied by the mass death of marine aquatic organisms. Apparently, the pronounced harmful effects of blooms were first noted on September 20, when a surfer suffered serious eye damage after contact with seawater in the Avacha Gulf (accessed 2 November 2021 from https://greenpeace.ru/news/2020/10/02/na-kamchatke-proizoshla-jekologicheskaja-katastrofa/). A reasonable hypothesis explaining the phenomenon was the hypothesis of an extensive harmful phytoplankton bloom [1], which is recorded in the HEADAT international list of HABs [2]. Algal blooms, including harmful ones, occur annually in the waters off the Kamchatka coast. Satellite monitoring is the main tool for analyzing the causes of the disaster due to rare field observations in this region.
Detection of harmful algae blooms (HAB) is urgent for the ecological control of water areas. This phenomenon causes significant economic damage to coastal maritime farms. It leads to the death of fish and benthic aquatic organisms, as well as the accumulation of toxins in shellfish. Effective methods for detecting HAB, monitoring, and prediction techniques are required to successfully solve the problem. Significant efforts have been made to solve the problem based on satellite remote sensing data. Detailed reviews of modern satellite remote sensing methods are given, for example, in [3,4,5]. The methods are based on the spectral characteristics of the sea brightness Rrs (remote sensing reflectance) for the recognition of blooming alga species. The key products of color data processing are also usually used: chlorophyll-a concentration, turbidity, fluorescence, etc. However, there are not many successful examples of solving the problem. The solution requires recognition of the species of blooming algae; identification of blooming stages causing harmful effects; improving the accuracy of atmospheric correction of satellite images, especially in the northern regions; and detection of the conditions leading to the increase in the concentration of harmful substances in the coastal zone.
Recognition of a harmful blooming alga species on remote sensing reflectance is the main task. Features of the Rrs spectrum are formed as a result of the interaction of solar radiation with all components of seawater: phytoplankton, detritus, dissolved organic matter, and terrigenous suspensions. The similarity of the Rrs spectra is shown for different species compositions of phytoplankton [6]. Thus, in general, it is difficult to recognize algae from the Rrs spectra. Therefore, current advances in species identification of algal blooms are related to the blooms of a particular alga species in a particular season and area.
The list of successfully recognized algal bloom species is small [7,8], and algae of the genus Karenia are included. A review of methods for detecting blooms of the algae Karenia brevis, and assessing the probability of detection, are discussed in detail in [9]. Six algorithms for the detection of the karenia alga were tested on the data of the MODIS/AQUA radiometer. The algorithms used different detection techniques. The algae were detected by anomalies in the concentration of chlorophyll-la-a, backscattering values (bbp ratio), values of the upward normalized radiation (nLw ratio), red band differences, and spectral shape. A database collected off the west coast of Florida was used for verification. The concentrations of all identified Karenia spp. (e.g., K. brevis, Karenia mikimotoi, Karenia papilionacea, Karenia selliformis) in each sample were aggregated. The goal was to evaluate the performance of the algorithms at the lowest end possible, which is 5 × 10⁴ cells L−1. Testing was carried out in four regions of the shelf. The methods showed different results. The authors provide a list of recommendations on how to best apply the various techniques. We chose the spectral shape algorithm.
Algae of the genus Karenia have a high level of light absorption in the blue spectral range. This is used to recognize them. Algorithms that determine the bloom species are adjusted in accordance with the general species composition of phytoplankton. Ground truthing of the cell abundance is used for algorithm verification. Algorithms verified based on cell density in samples have a significant drawback. The species composition is heterogeneous; a significant number of cells in a sample may belong to several species. At the same time, the volumes of cells of different species can differ by several orders of magnitude. Satellite measurements depend not so much on the number of algae cells, but on the density of the algae biomass and its share in the samples. Therefore, the indicator of algal blooming used for setting up satellite algorithms in the form of cell density does not guarantee the dominance of radiation reflection by cells of a given species and, accordingly, high detection quality. If we use algae biomass for the satellite algorithm verification, then the problem becomes significantly simpler. Our research has shown the domination of a single alga species in most of the species composition samples [10]. On average, the single dominant species accounts for about 60% of the biomass in the samples, and four dominant species account for more than 90% of the biomass of a sample. This was used to confirm the assumption of the phenomenon of HABs off the coast of Kamchatka in the autumn of 2020.
Harmful substances are mainly metabolites produced by microalgae. They have a wide range of effects on living organisms. Harmful substances tend to both accumulate and decompose over time. There may not be a direct correlation between such a key parameter as chlorophyll-a and the concentration of harmful substances [11,12]. A harmful effect can also be observed in cases when microalgae do not produce specific phycotoxins. It is usually assumed that the algal bloom cycle has the following stages: intensive growth, blooming, and death of algae [13]. Dying off is accompanied by the decomposition of the mass of organic matter, which can lead to the death of fish and benthic aquatic organisms. There are works describing the physiology of phytoplankton and their life stages [14,15]. However, these features are rarely used in satellite monitoring of HABs.
There are a number of unsolved problems in satellite data processing, in addition to the biological features of harmful phytoplankton blooms that complicate its monitoring. First is the atmospheric correction of the data. The main algorithm used is near-infrared (NIR)-based correction of the atmosphere’s influence. It is based on the assumption that there is no diffuse radiation rising from the water in the near-infrared spectral range. The algorithm operates well in open seawater (no river runoff and no reflection of rays from the bottom) at a chlorophyll-a concentration of up to 10 mg m−3 [16]. It is recommended to use the Management Unit Mathematics Model’s (MUMM) correction algorithm [17] at higher concentrations of chlorophyll-a. The algorithm is based on a stable spectral shape of sea radiance in the NIR range. MUMM and NIR correction algorithms show close results already at a chlorophyll-a concentration of about 1 mg/m3 or more [18], provided that the aerosol is marine and the sun angle above the horizon is high. A number of problems of atmospheric correction of satellite images have not yet been solved, which does not allow us to hope for obtaining high-quality products under arbitrary observation conditions [19], in particular, because of the small angles of the sun above the horizon, a characteristic of Kamchatka in autumn. Formally, it is not recommended to calculate bioparameters, when the zenith angle of the sun is more than 75° [20]. However, errors in calculations also appear at lower angles of the sun above the horizon. For this reason, for example, the data from the GOCI radiometer located on a geostationary satellite, which makes it possible to survey the Sea of Japan every hour, are not used at observation times earlier than 9:00 or later than 16:00 local time. Even for this time interval, though, it is necessary to make measurement corrections depending on the local time [21]. Errors in bioparameter calculations using NIR correction at low sun angles can be significant. The concentration of chlorophyll-a in northern seas can be grossly overestimated [22]. The sun angle at the beginning of November is already at the 75° limit in the area of the Kamchatka Peninsula. It is preferable to use the MUMM correction under these conditions, since it is based on the physical properties of water leaving radiance and, in some cases, gives more accurate results [23,24].
To successfully recognize the blooming algal species, it is necessary to restore the optical properties of all water components. There are methods that calculate the absorption and backscatter spectra for each component together with the main bio-optical parameters [25,26,27]. This task is more challenging than the assessment of a specific bio-optical parameter by color indices. The number of bands used should be greater than, or equal to, the number of parameters estimated. Therefore, it is necessary to reduce the number of model coefficients by introducing simple relationships between unknown parameters, or by setting some of them as optimal constants. These algorithms are more sensitive to errors of atmosphere correction than empirical ones [28]. However, knowledge about the optical properties of recognizable harmful algae makes it possible to successfully detect their blooms [29].
Significant errors arising from the atmospheric correction of satellite data have led to the development of algorithms that use only part of the visible spectral range. These include the SS algorithm, which analyzes the shape of the spectrum in the near-infrared range [30]; the MCI algorithm, which calculates the maximum chlorophyll index [31]; and the RBD algorithm, which analyzes channel differences in the red spectral range [32]. Since the spectral range is small, atmospheric correction errors and the presence of DOM have little effect on the results. However, such algorithms do not allow the identification of the species of blooming algae without a priori information about the dominant algae in a given region and season.
Harmful algal blooms do not always lead to significant ecological disasters. Conditions are required that lead to an increase in the concentration of harmful substances in the coastal zone. The waste products of phytoplankton are usually lighter than seawater. Surface current convergence leads to an increased concentration of harmful substances. A large-scale concentration of harmful substances near the coastline is usually due to the wind effect on the sea surface. These are wind-induced surges and downwelling [33]. A number of works note the significant effect of wind on an increase in the concentration of harmful substances in the coastal zone [34,35].
The main problem is the low accuracy of sea bioparameter calculations due to the low angles of the sun above the horizon. The main purpose of this work is to develop a methodology for using satellite data to detect harmful algae and the conditions for the occurrence of catastrophic events in the coastal zone. We consider the dynamics of the variability of sea bioparameters calculated from satellite data in the vicinity of the Kamchatka Peninsula in September–October 2020, assess the stages of blooming, determine the dominant species of phytoplankton and mechanisms to concentrate harmful substances in the coastal zone, and identify the main causes of the environmental disaster.

2. Materials and Methods

The main sources of satellite data were moderate-resolution imaging spectroradiometer (MODIS) images of the AQUA satellite (spatial resolution: 1 km). The MODIS data of level 0 were obtained from the NASA Goddard Space Flight Center and processed using the SeaDAS package (OCSSW package 7.5).
The MUMM atmospheric correction algorithm was used. Images of the following parameters were built: chlorophyll-a concentration, calculated by the OC3 algorithm; sea surface temperature (SST); turbidity characteristic—the attenuation coefficient of radiation with depth for a wavelength of 488 nm (Kd490); normalized fluorescence line height (flh); and remote sensing reflectance (Rrs). RGB images of SkySat-C satellites (Planet Labs Inc.) were used for coastal foam detection. Surface wind computed from WindSat satellite data taken from the website http://www.remss.com/missions/windsat (accessed on 20 January 2023). The data for September and October were analyzed.
To verify satellite algorithms, measurements of the species composition of water samples were used. Phytoplankton 1 L samples were collected using a bathometer from September 4 to November 4, 2020 and fixed with Lugol’s solution or formalin (2% final concentration) for phytoplankton enumeration. Samples were counted in a 1 mL Sedgewick Rafter chamber under an Olympus BX-41 light microscope (Tokyo, Japan). The wet biomass of phytoplankton (mg∙m−3) was determined by the volumetric method based on the original published data on the geometric shape and dimensions of the cells [36]. There were 13 samples that corresponded to satellite images with a one-day time interval (Table 1). It is a part of Table 1 presented in [37]. The last three columns of the table indicate the percentage composition of the samples: the proportion of Karenia spp. in the sample, their proportion of biomass in the sample, and the proportion of particular algae among the Karenia algae.
The research was carried out in the Avacha Gulf. The variability of the water bio-optical parameters was computed for zone 1, which covers the main part of the gulf and does not include the waters of the open ocean. Figure 1 shows an image of the light attenuation coefficient at a wavelength of 488 nm, which characterizes the turbidity of the water. Coastal and open ocean waters had a clear boundary corresponding to a sharp change in the values of bioparameters.
The zenith angle of the sun in the region reached significant values, which can lead to errors in the calculations of bio-optical parameters due to inaccuracies in the atmospheric correction procedure. Therefore, to control the accuracy of calculations, zone 2 was used in the area of the open ocean. Bio-optical parameters in zone 2 had small variations in time. Significant variability in bioparameters in this area may indicate inaccuracies in the atmospheric correction of satellite images.
In the coastline zone, the border of the area was separated from the coast at a certain distance to reliably exclude pixels, into which parts of the land and shallow water may fall. The position and size of zone 1 were steady (Figure 1). The location of zone 2 could change due to cloudiness. To analyze the state of phytoplankton, we used image fragments of the Avacha Gulf located in the central part of the satellite images, which is recommended in [38].
To detect the phytoplankton state, we used the normalized fluorescence line height flh, the calculation algorithm that is described in the SeaDAS package document ATBD_MOD22 [39]. Flh characterizes the intrinsic fluorescence of phytoplankton in the near-infrared band. The efficiency of phytoplankton photosynthesis is inversely proportional to the fluorescence value [40]. It is mentioned in [41] that photochemical energy conversion is physiologically limited by nutrients, and the flh value reflects the photophysiological state of phytoplankton. Fluorescence is affected by nutrient deficiency [42]. The deficiency leads to an increase in fluorescence. To monitor the state of phytoplankton, the SeaDAS package has an algorithm for calculating the photosynthesis efficiency (chlorophyll fluorescence efficiency), but the algorithm is not included in the list of standard products and shows low accuracy. Instead, we used specific fluorescence—the ratio of the height of the fluorescence line (flh) to the concentration of chlorophyll-a (chl-a). A low value indicates that the cell is actively using the incoming light for photosynthesis.
The bloom species can be successfully recognized by satellite data when the alga is dominant in the species composition samples. The authors of [9] provide an overview and detailed analysis of satellite algorithms for recognizing a Karenia brevis algal bloom. The brightness spectra of the sea surface Rrs during the bloom of the alga Karenia brevis are presented in [43]. A specific spectral shape in the blue band is observed when the algae concentration is high. The Rrs value for a wavelength of 488 nm is less than the neighboring ones. To identify this kind of algae, we used a spectral shape algorithm [44], written in a dimensionless form with other spectral channels (a wider spectral range is used):
Fλ = (Rrs(λ2) ∙ (λ − λ1) + Rrs(λ1) ∙ (λ2 − λ))/(λ2 − λ1)/Rrs(λ),
where λ = 488 nm, λ1 = 412 nm, λ2 = 555 nm.

3. Results

3.1. Bloom Scale

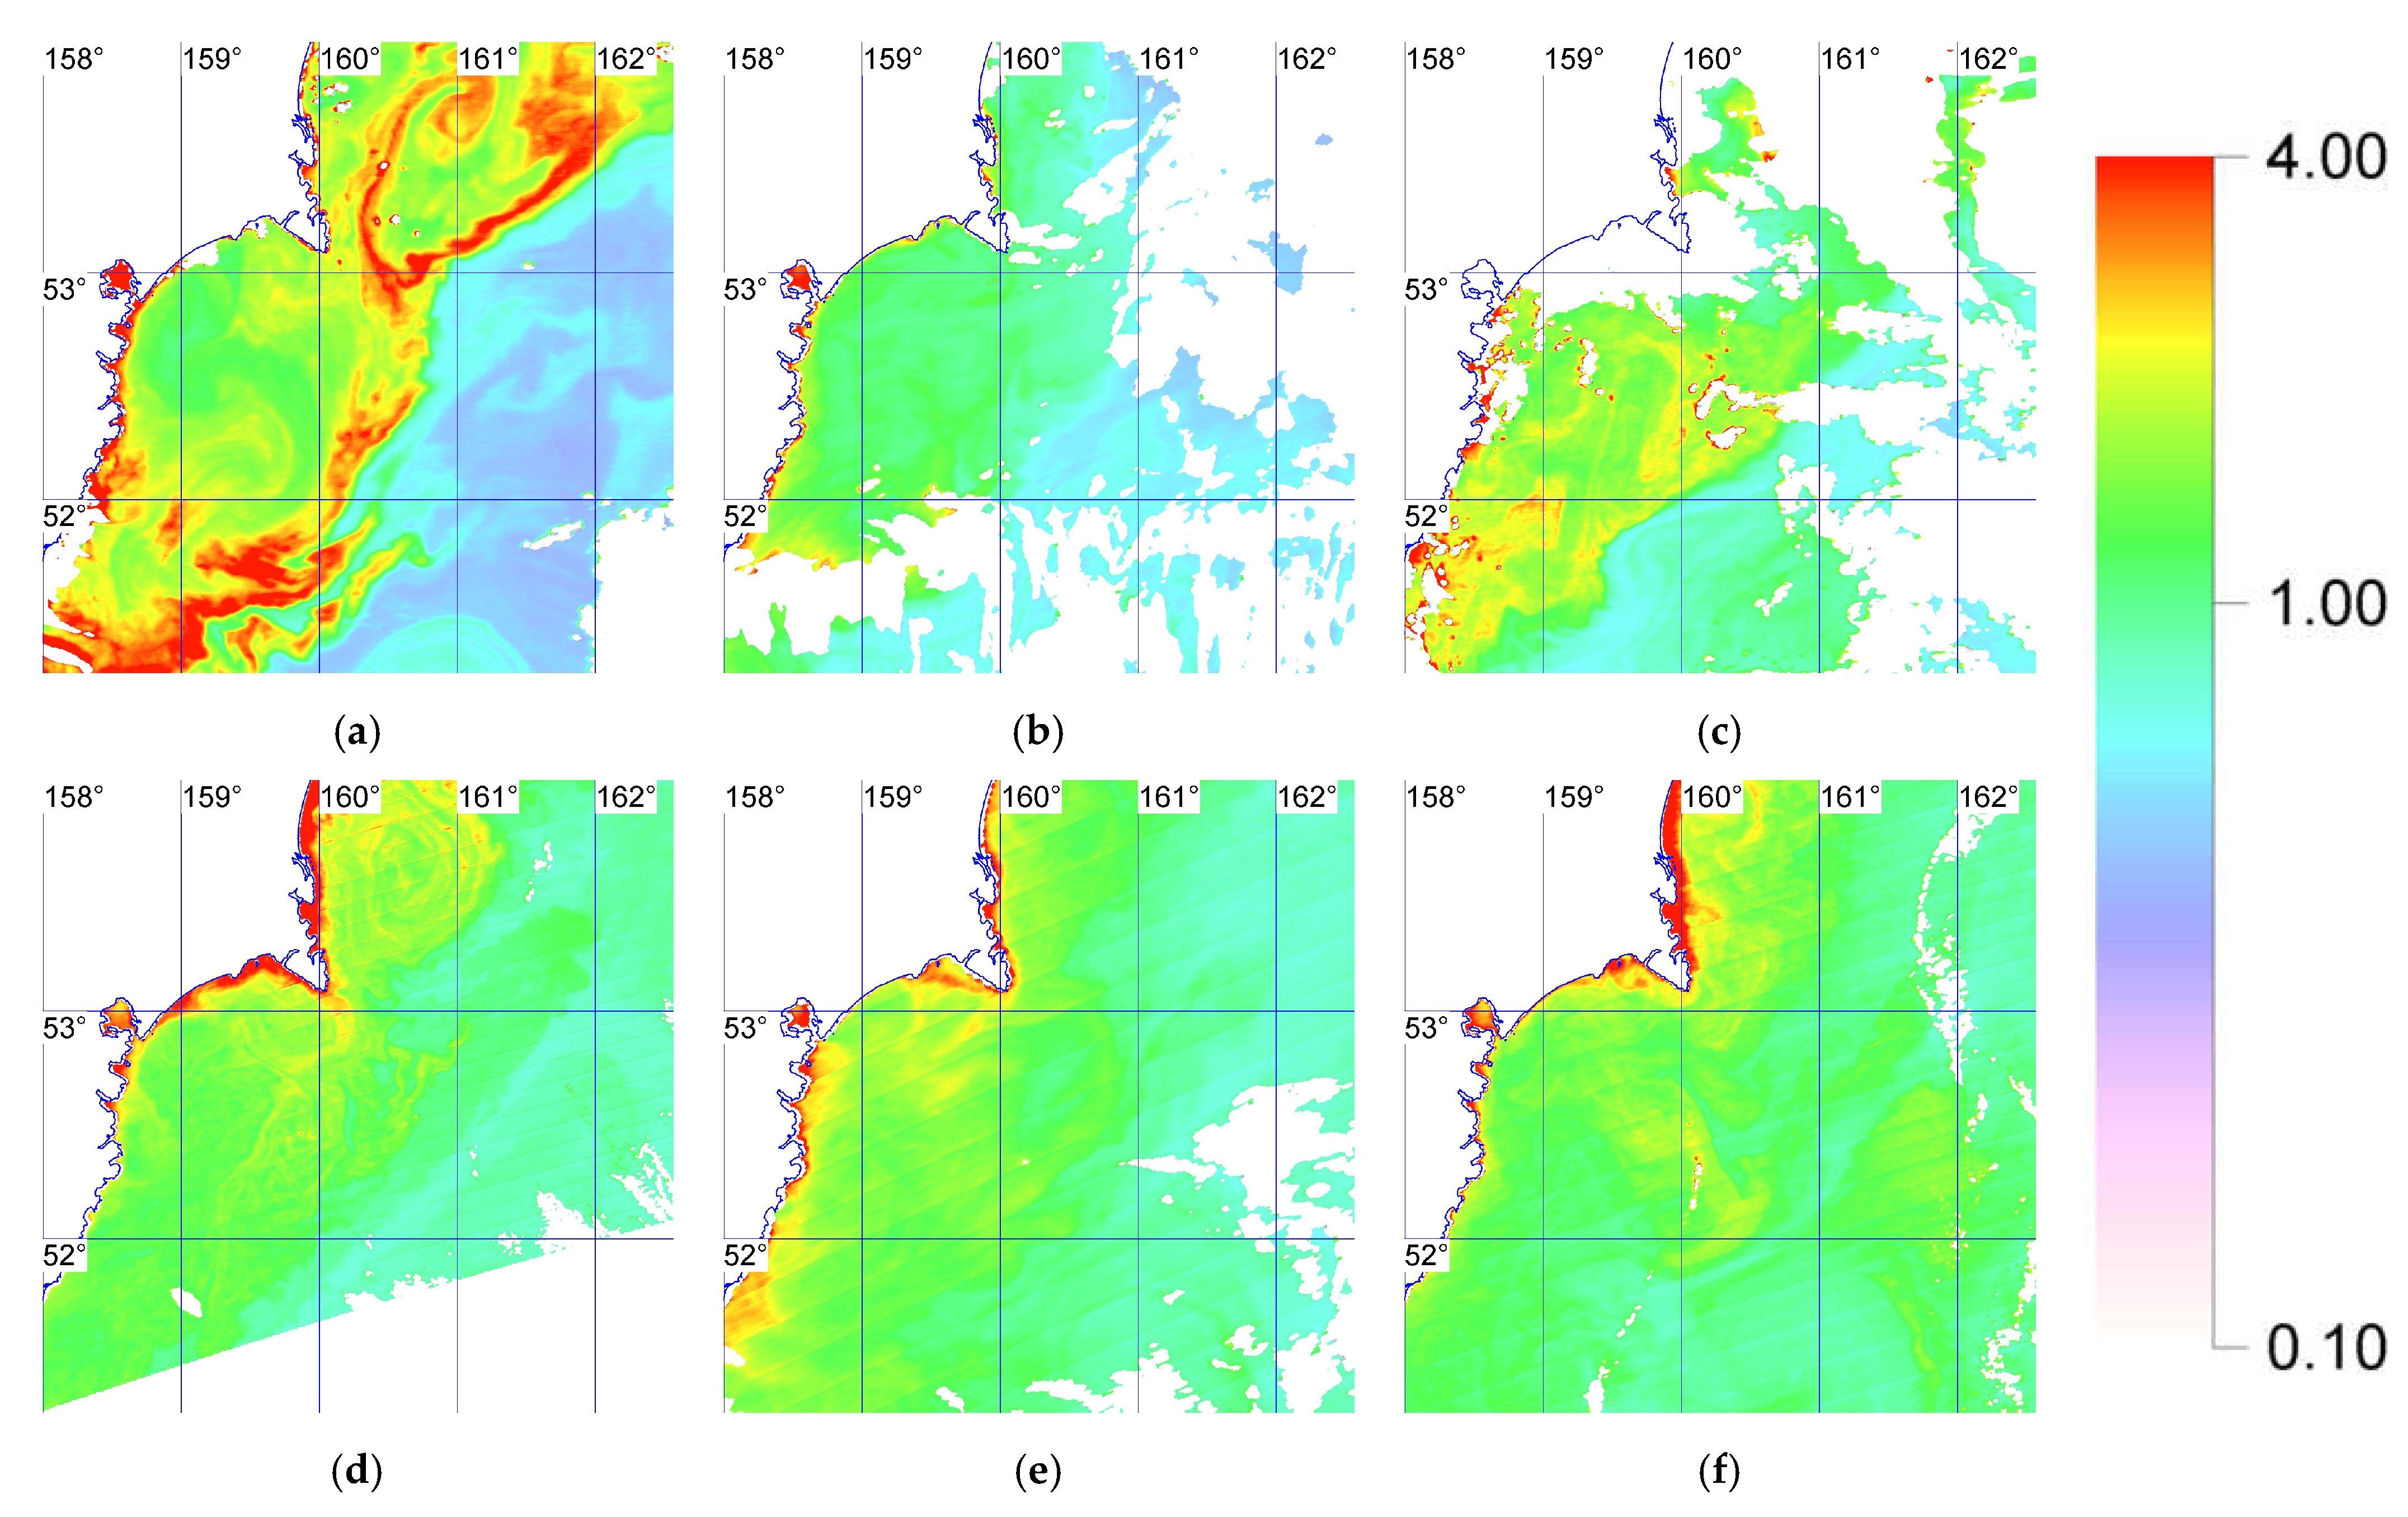
The phytoplankton bloom in the autumn of 2020 occurred over a vast extensive coastal zone with a cross-section of about 100 km. It covered the waters of the Kamchatka, Kronotsky, and Avacha Gulfs and the southern bays of the peninsula. Figure 2 shows the concentration of chlorophyll-a in Avacha Gulfs. The average values and their variance of the chlorophyll-a concentration and the turbidity parameter in the water area of the Avacha Gulf are shown in Table 2. The concentrations changed over the month, but not dramatically. It can be noted that, for the observation period, there was no high chlorophyll-a concentration [45], which could be associated with catastrophic events in the coastal zone. On the contrary, it can be noted that on September 21, there was a significant drop in the concentration of chlorophyll-a (near 30%) with the stable turbidity parameter Kd490.
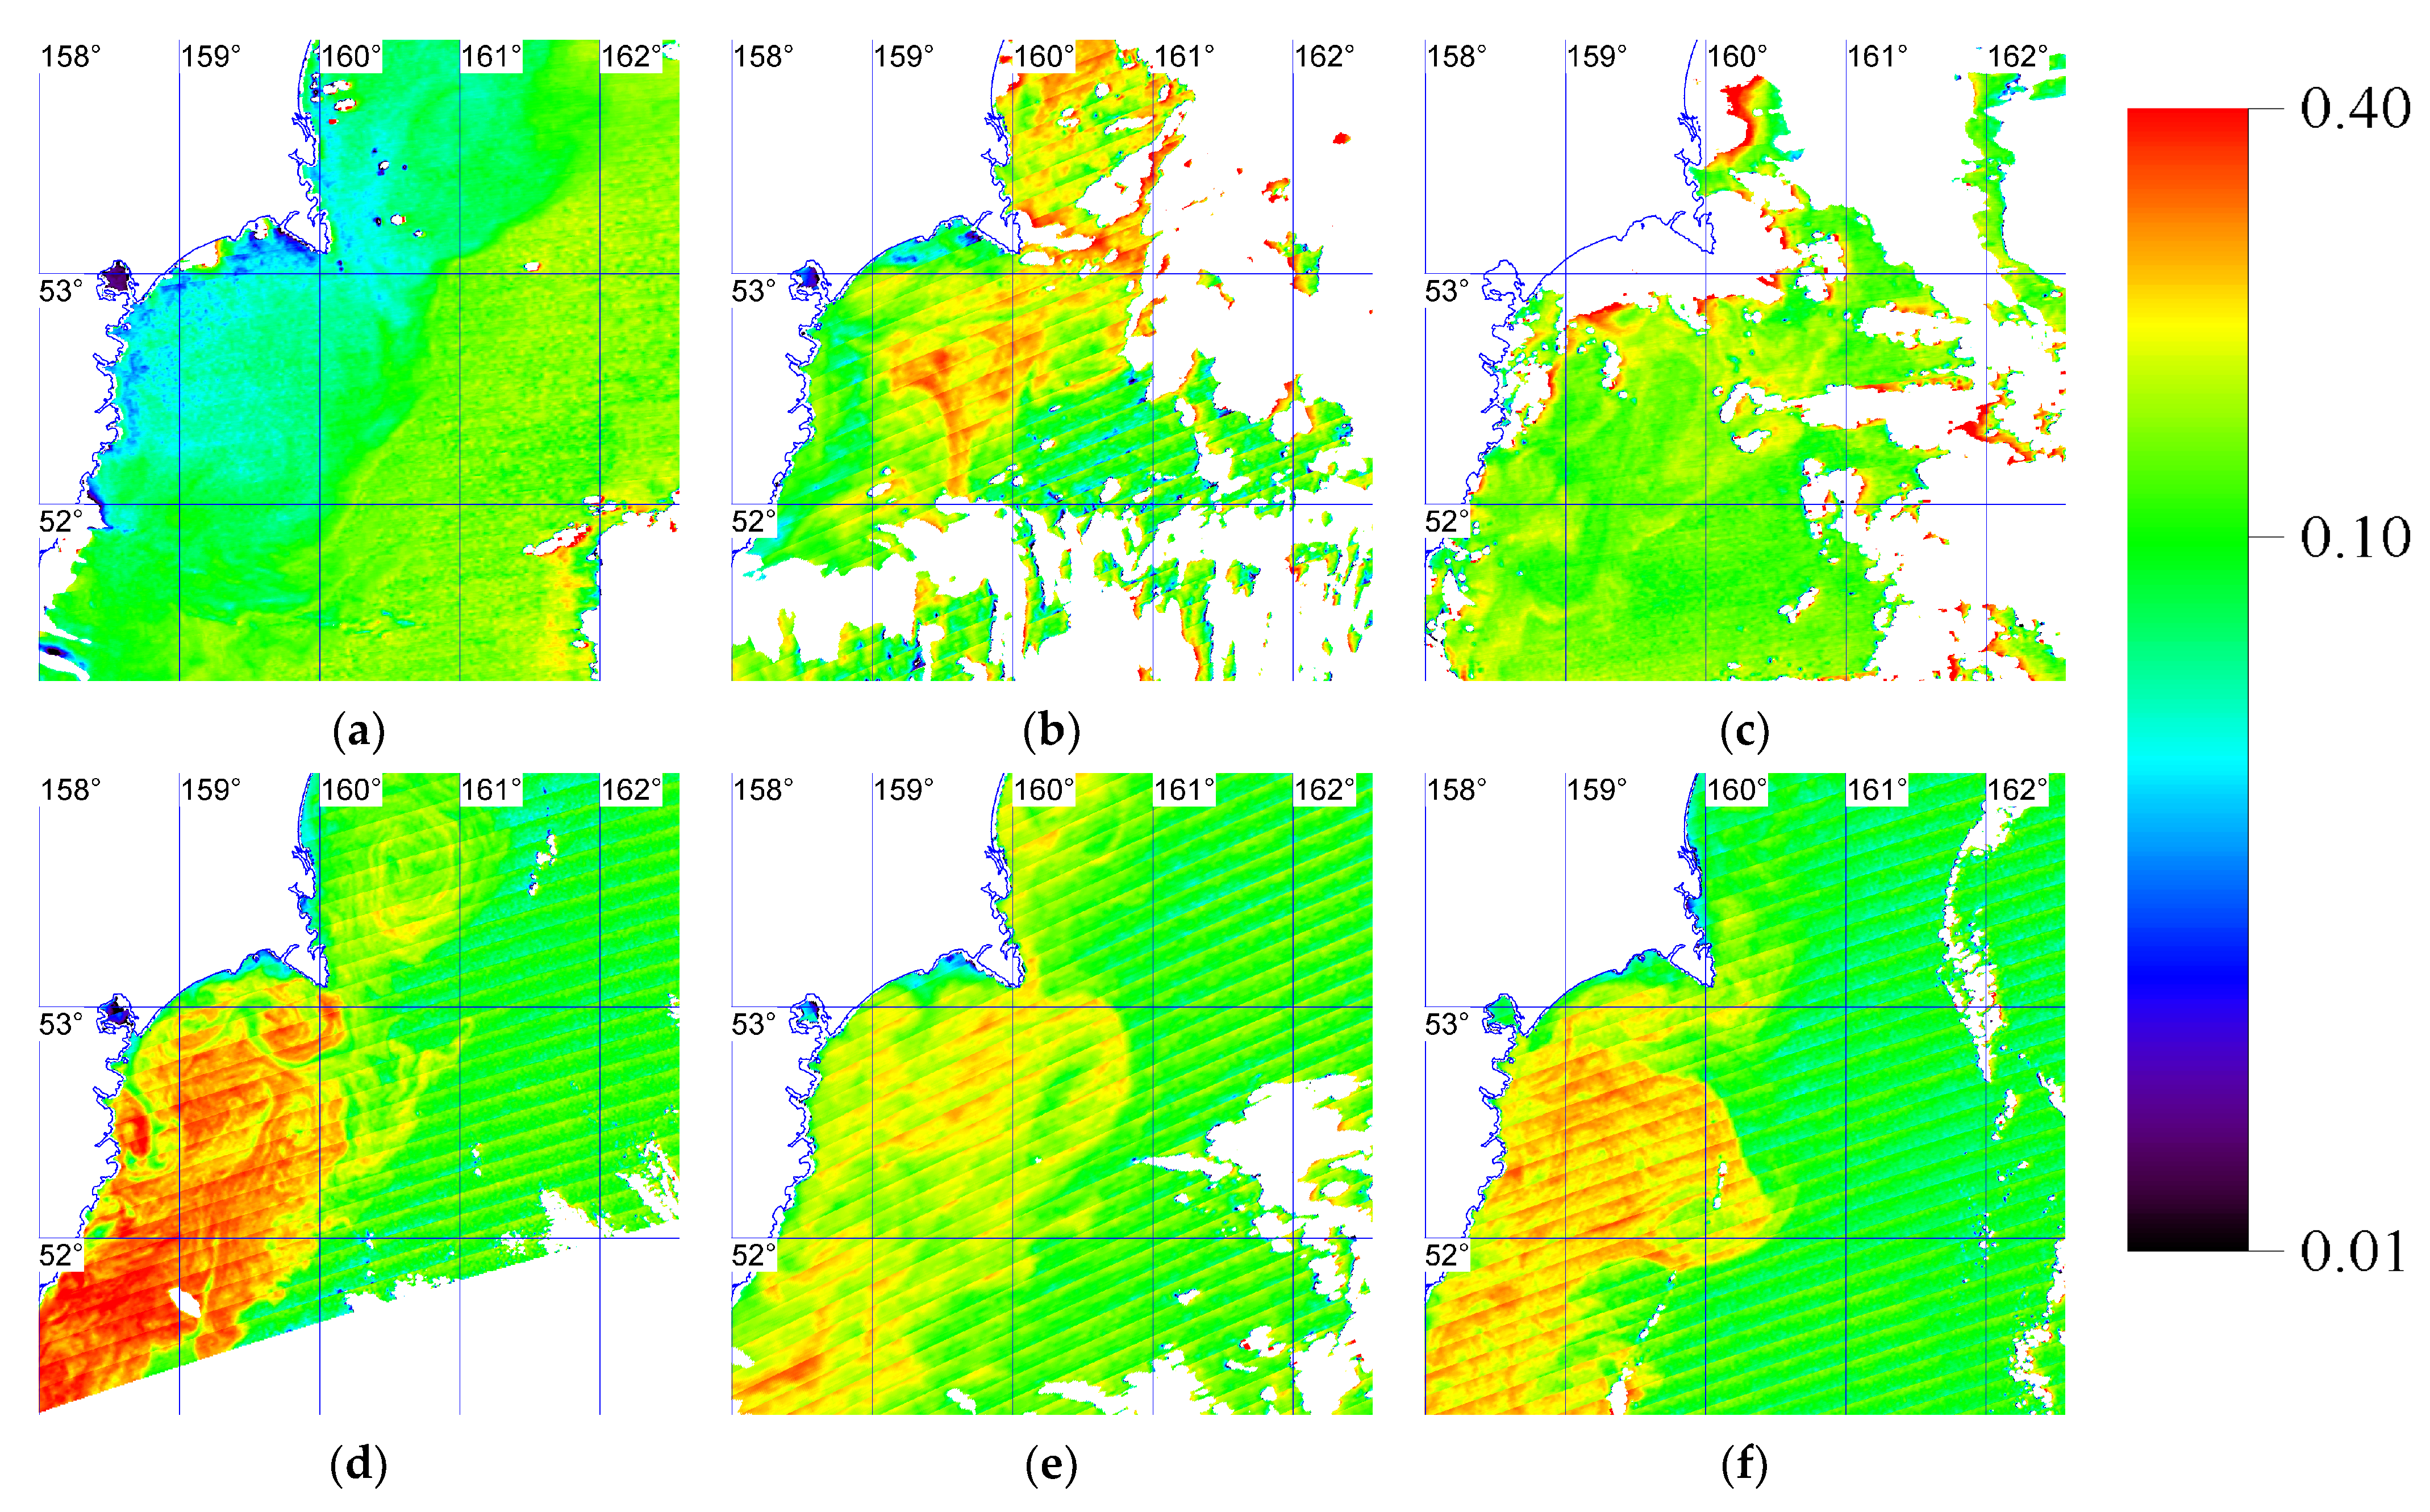
Figure 3 shows the specific fluorescence, which will be used to estimate the intensity of photosynthesis in the phytoplankton cells. Comparing the dynamics of the variability of chlorophyll-a concentration with specific fluorescence, the following features can be noted. In open waters, phytoplankton is usually in stagnation, where the fluorescence per unit of chlorophyll-a concentration fluctuates in the range of 0.09–0.14 (Table 2). Specific fluorescence in the Avacha Gulf was significantly less than in the open ocean in early September, especially in the coastal parts of the gulf. On September 9, low values of specific fluorescence were observed. On September 21, immediately after the passage of a cyclone with a storm wind, favorable conditions for the growth of phytoplankton biomass were observed in a narrow strip along the coast only. High values were observed in the main part of the coastal zone. On October 3 and the following days, the specific fluorescence in the Avacha Gulf was higher than in the open waters.

3.2. Karenia spp. Monitoring

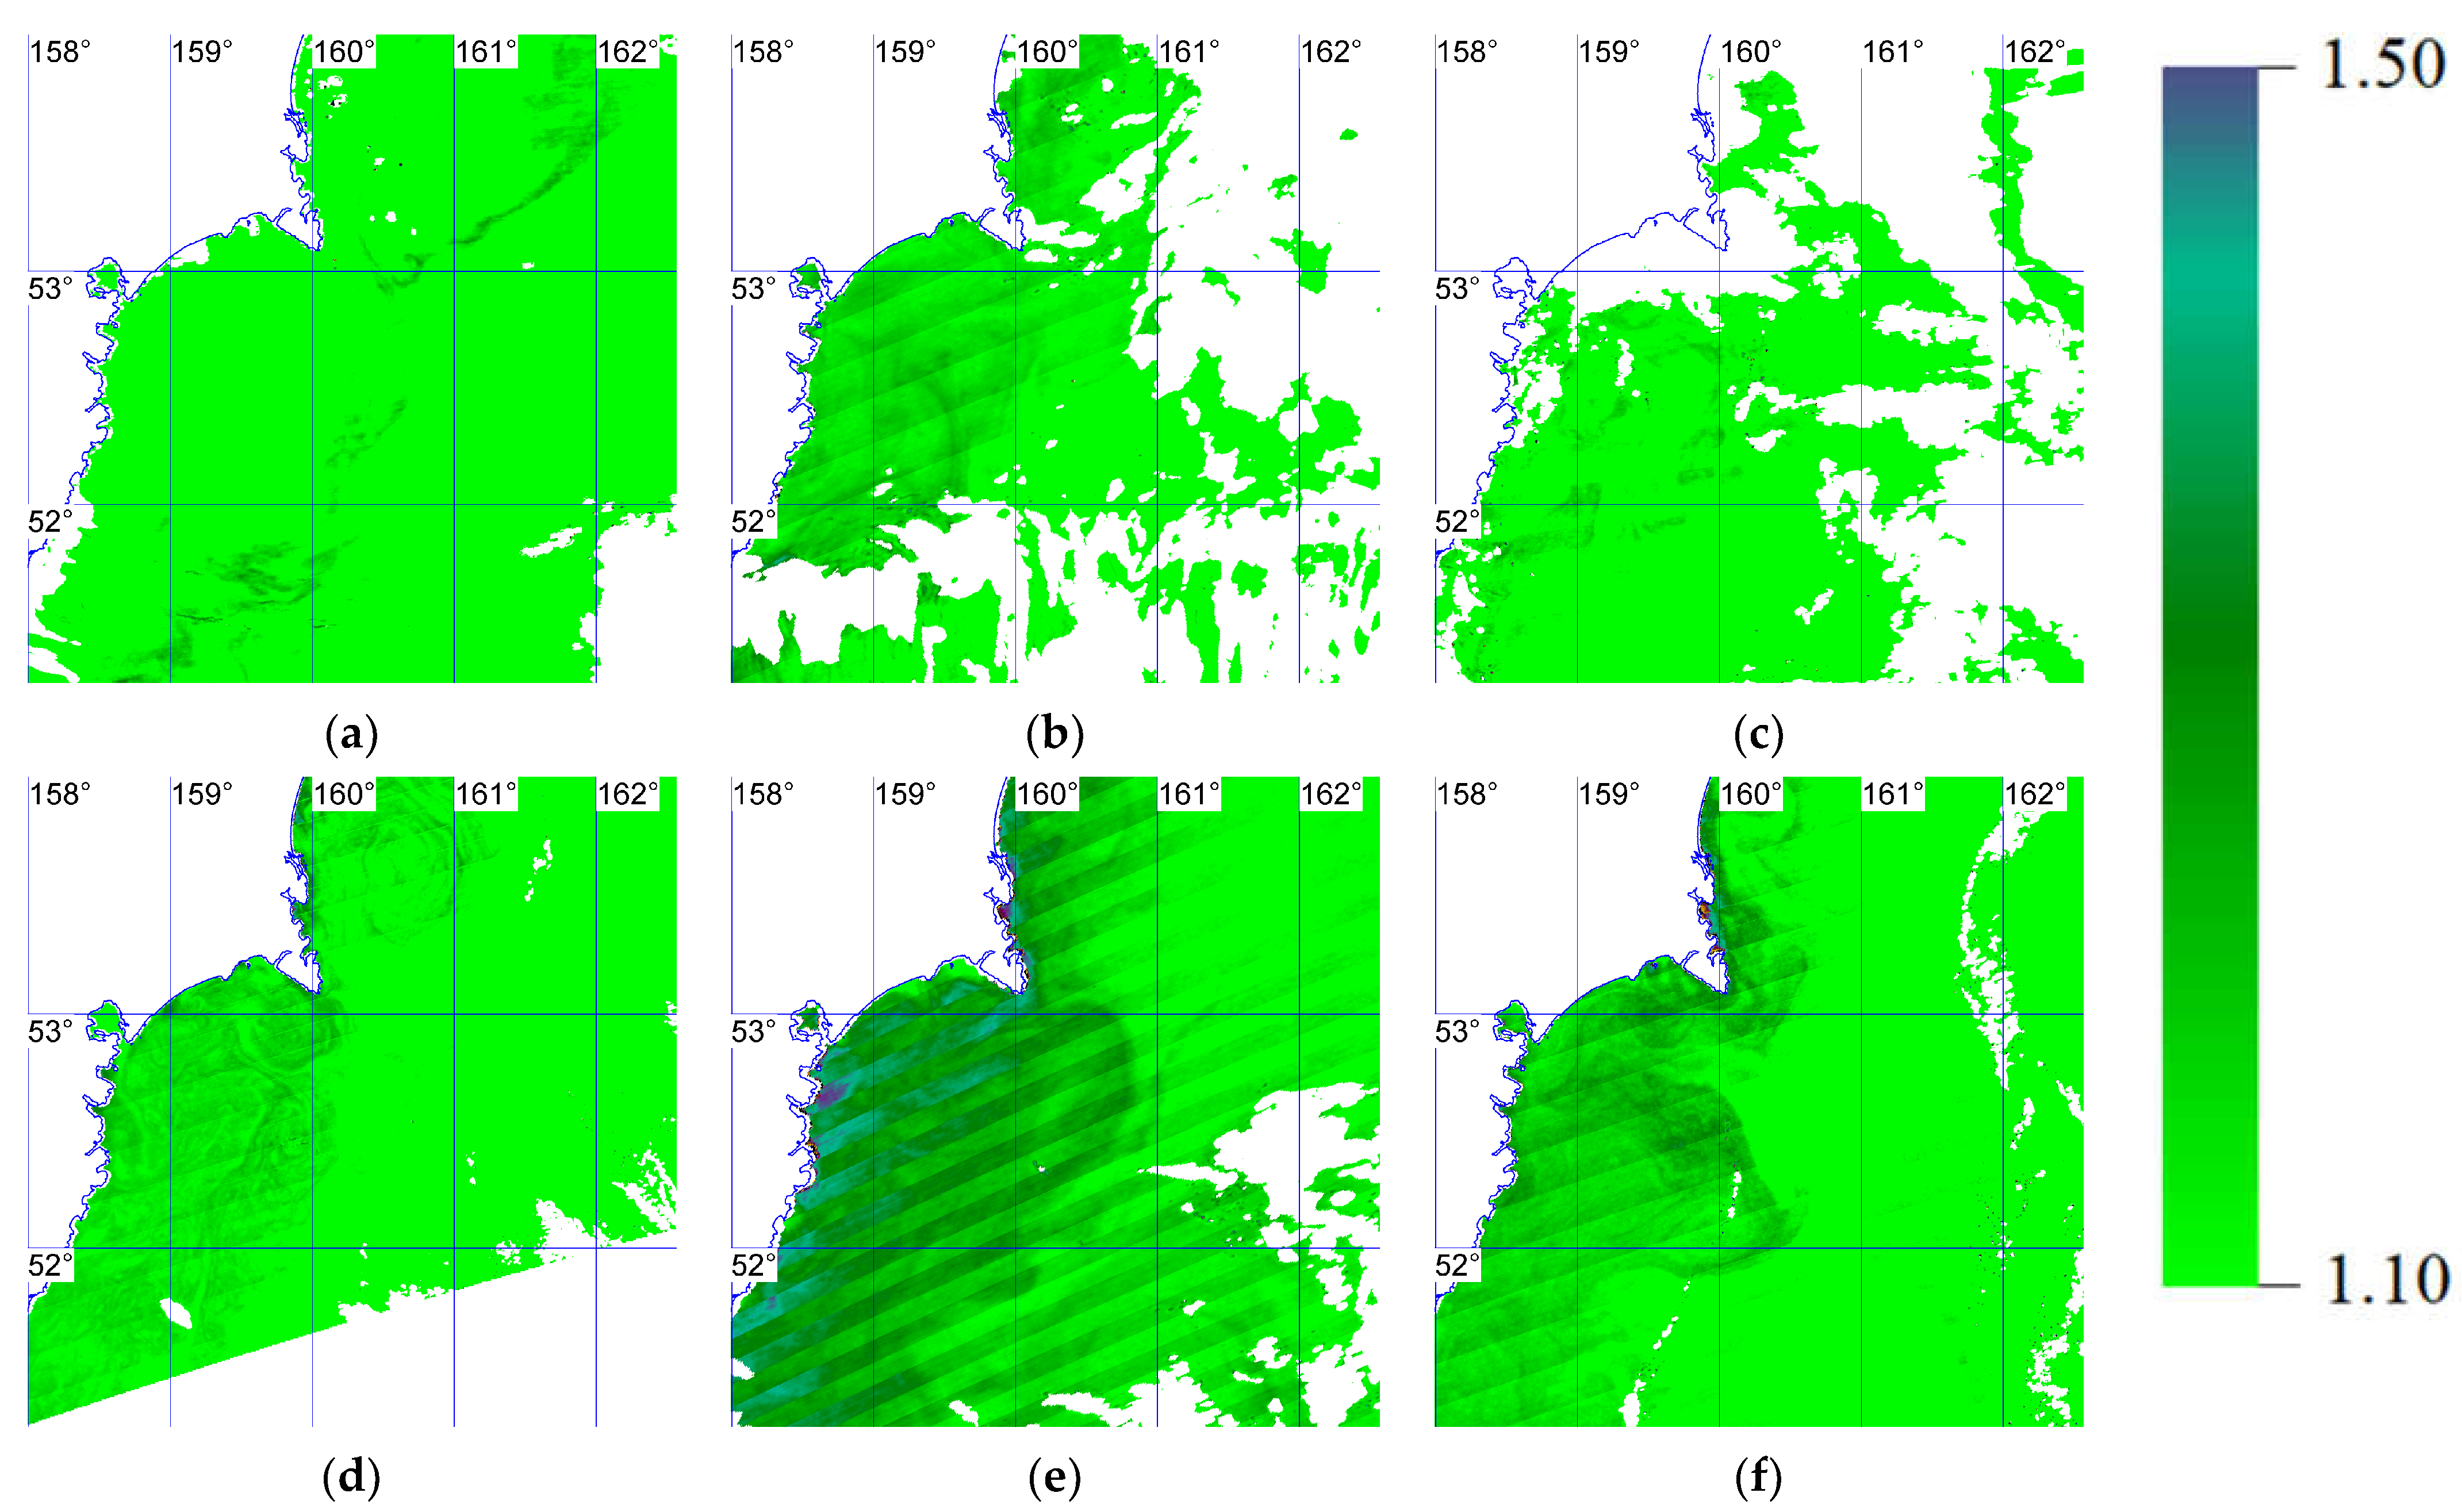
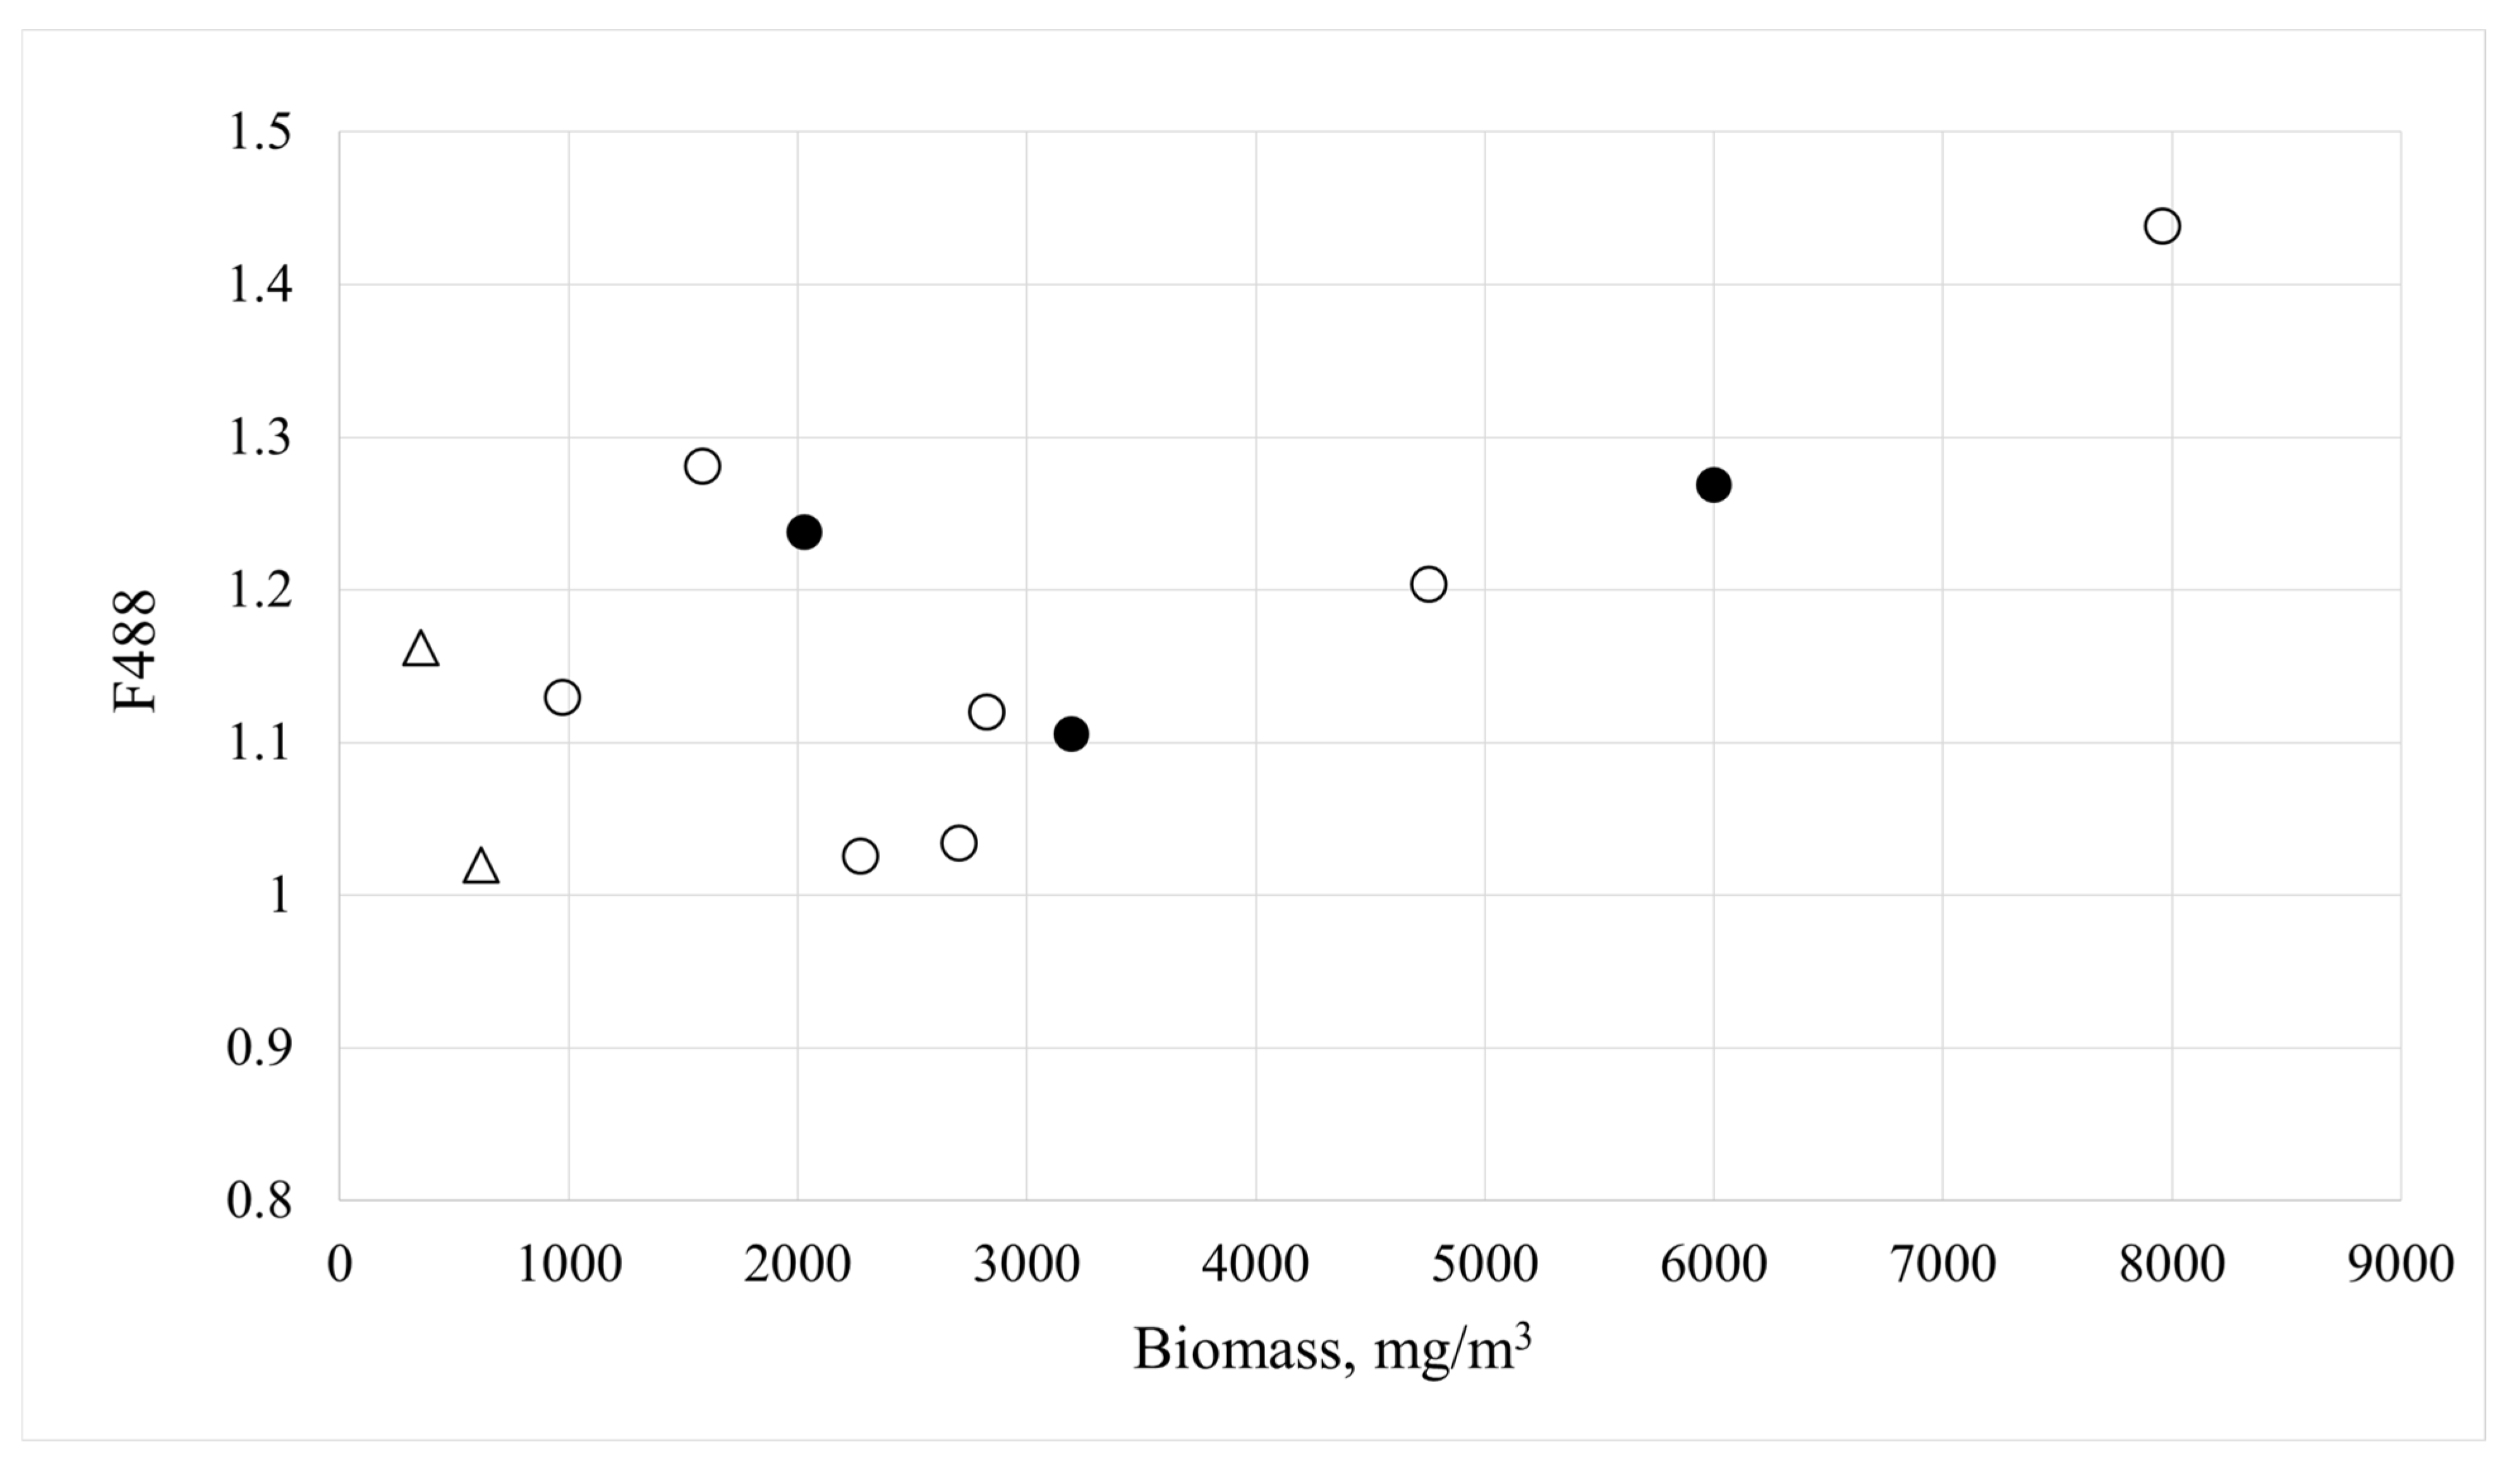
To monitor the Karenia spp, we used the deflection of the diffuse scattering brightness spectrum above the water surface F488. Figure 4 shows the variability of the F488 parameter. The parameter value ranged from 0.7 to 1.5. The images have some “banding”, which leads to fluctuations in the parameter in the range of 0.1. The suitability of the parameter for monitoring was verified using the species composition of the water samples. Samples were taken that had a time mismatch with satellite data of about a day (Table 1). Only three samples coincided with the satellite measurements in space and time. The rest of the samples were taken a day later or in the vicinity of the station locations. A relationship between F488 and Karenia biomass was considered to assess the threshold by which the presence of the Karenia spp. in water can be determined. Figure 5 shows that, when the F488 parameter exceeds 1.1 and the biomass is more than 1000 mg m−3, the Karenia spp. are confidently identified and present in significant quantities (above 50% of the sample biomass). It should be noted that different species of algae of the genus Karenia dominate in the samples. This indicates the closeness of the optical characteristics of different species of Karenia. Approximately the same results are obtained if we use the data presented in [43], where Figure 5a,b shows the spectra of the Rrs parameters of the MODIS at the points of the Karenia brevis alga blooming at different concentrations. In situ measurements presented in the article were taken from the NOAA HABSOS database. At a cell density of 62 cells mL−1, F488 = 1.06, which corresponds to a Karenia biomass of 770 mg m−3, and at a density of 245 cells mL−1 F488 = 1.2, which corresponds to a biomass of 3040 mg m−3. An analysis of field measurements of Rrs obtained in the Far Eastern seas of Russia (nearly 350 samples), and available to the authors, showed that the F488 parameter rarely exceeds 1.1—in less than 5% of cases. The Rrs measurements were carried out on an ASD spectroradiometer and processed using a technique close to that in [16] and described in [17]. Thus, a 1.1 threshold of the F488 parameter was used for the Karenia spp. monitoring.
It should be noted that the beginning of the algal bloom in September was in the seaward zone of the coastal waters. There is a complex vortex circulation of water in the Avacha Gulf, mainly of anticyclonic character [43]. The parameter F488 corresponds to this circulation. It shows the increase in Karenia spp. biomass concentration from the beginning of September to September 21. We see a drop in F488 on September 25 and an increase in October.

3.3. “Beer Tide” Observations

The event, after which the harmful influence of the bloom began to be noted, most likely occurred on September 19. There was a storm with a wind speed of 25 m s−1. The storm was caused by a cyclone passing from west to east. The center of the cyclone moved along 53°N latitude. The wind force is usually the main factor in phytoplankton transport to the coast [33,34,35].
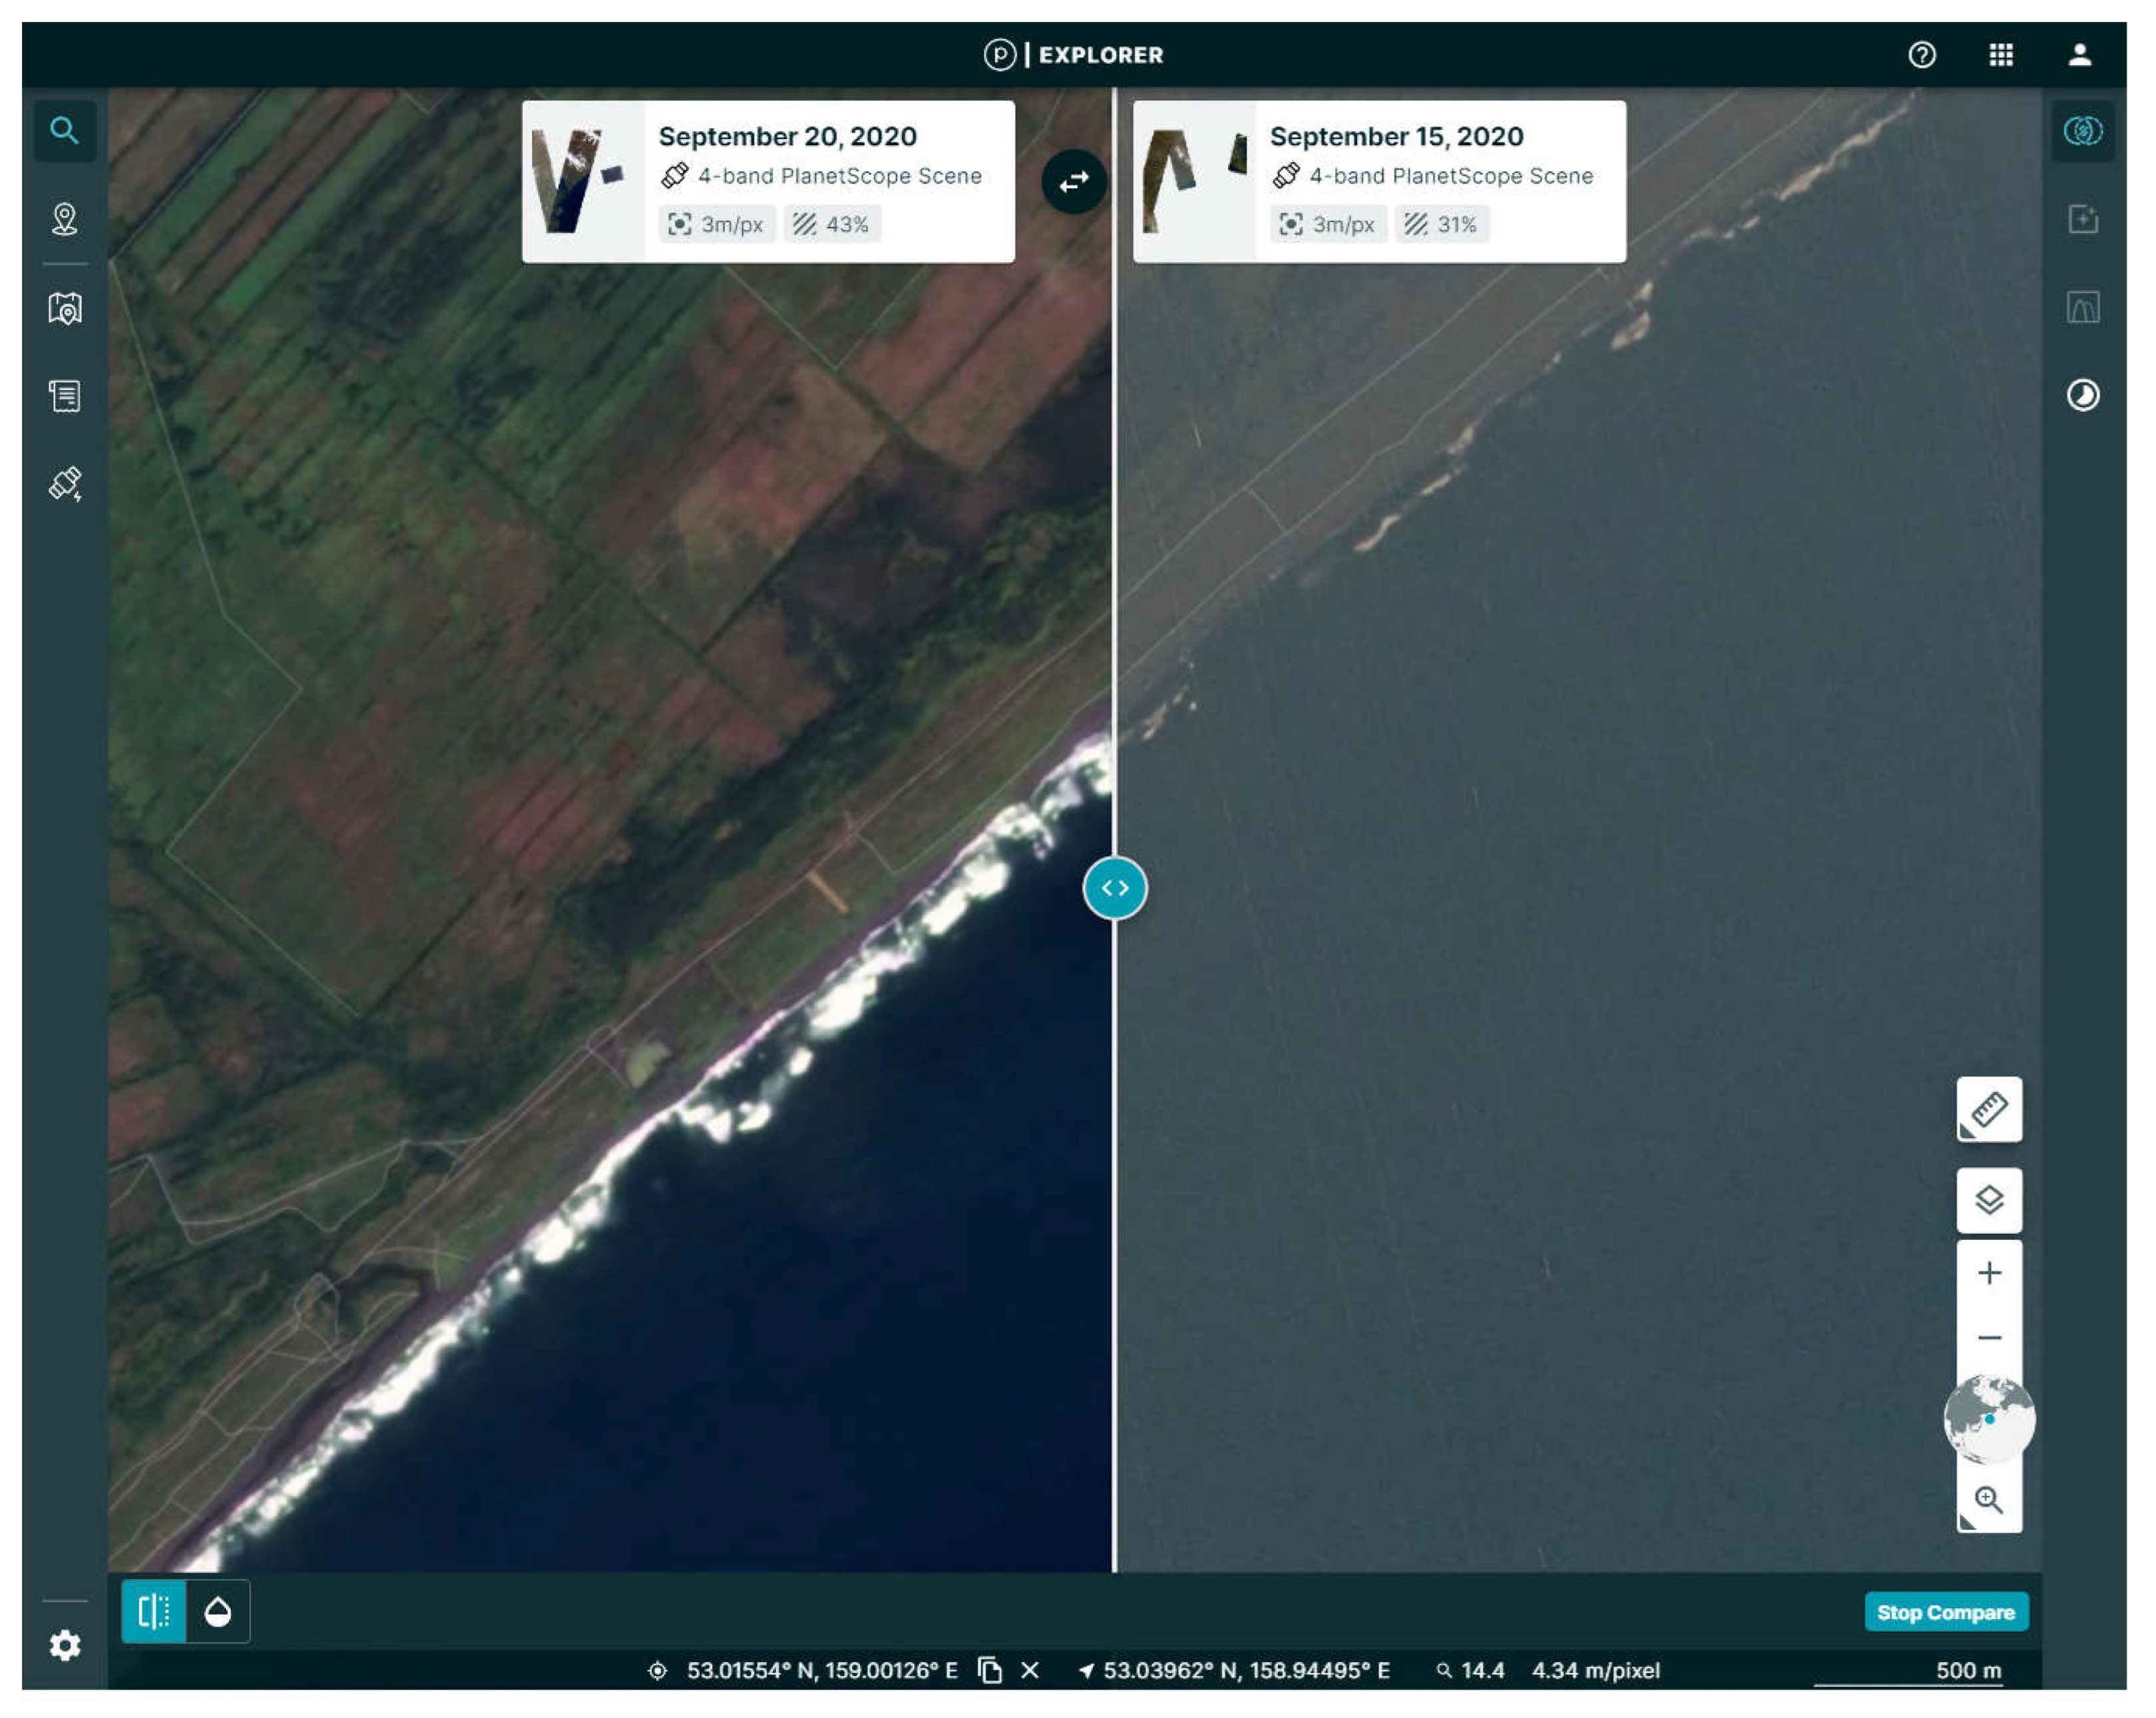
Algae of the genus Karenia generate a significant amount of foam. In particular, in [46], the bloom of the species Karenia mikimotoi in Kachemak Bay, Alaska, is called “beer tide” due to the large amount of foam formed. Other researchers [15,47] have noted the harmful effects of Karenia blooms. In the later stages of blooming, due to a lack of oxygen in the water, various harmful substances are released, including ammonia and hydrogen sulfide gases. Foam produced during a bloom of Karenia algae may be an indicator of the harmful effects of the bloom. To detect the foam, images of SkySat-C satellites were used, which clearly show the coastal white stripe. Figure 6 shows two images of Khalaktyrsky Beach, immediately after the storm and before it, at approximately the same near-surface wind speed. The second image was used to estimate the area of surf that could be confused with phytoplankton foam. Since the white strip can be both from the vital activity of phytoplankton and the surf strip, the width of the strip was estimated depending on the characteristic wind magnitude. A surf strip is generated by waves whose amplitude is proportional to the wind speed. The characteristic strip width was usually 0–20 m, rarely 30 m. The strip was not continuous but consisted of fragments, the positions of which were apparently determined by the bottom topography (Figure 6, right). The location of these fragments was stationary. The exception was a few days in September and October when the foam was observed off the coast. The strip was continuous and reached a width of 100 m. Such a phenomenon was observed on September 20, from September 30 to October 2, and on October 7 and 14.

4. Discussion

It is noted in [48] that the average monthly concentration of chlorophyll-a in Avacha Bay in 2020 exceeded the characteristic concentrations calculated over the past 20 years by 5–8-fold. At the same time, an analysis of the interannual variability of chlorophyll-a showed that such concentrations are typical in recent years [45]. An upward trend in the average monthly concentration has been observed since 2012. The authors suggest that the increase in concentrations is due to changes in atmospheric circulation. Since no anomalously intense rains causing an increase in river runoff or atmospheric dust transport were observed in this area, upwelling may be the main source of the nutrients.
In [37], the distribution dynamics of the Karenia algae in the bays of the Kamchatka Peninsula were analyzed. The key role of the East Kamchatka current in the distribution of harmful algae is shown. The results obtained allow us to make the following assumptions about the development of a catastrophic harmful bloom in the waters of Kamchatka. In early September, from the seaward zone, the East Kamchatka current brought waters containing significant concentrations of harmful algae of the genus Karenia into the Avacha Gulf (Figure 4a). At this time, low values of the specific fluorescence parameter were observed in the coastal region, which indicates the intensity of photosynthesis by phytoplankton cells. By mid-September, the algae filled the water area of the Avacha Gulf and dominated a huge area. At the same time, an increase in specific fluorescence was observed, which indicates a decrease in the biomass growth rate. A drop in the concentration of chlorophyll-a with constant turbidity of the water (September 21) indicates the start of a change in the dominant algal species. The subsequent drop in the F488 parameter (September 25) confirms the change. A change in the dominant species of algae is usually accompanied by the death of its cells. Thus, in mid-September, a situation developed when a significant amount of harmful substances and dying cells accumulated in the water. On September 18–19, the storm brought an atmospheric cyclone. The southern part of the cyclone passed over Avacha Gulf. The direction of the wind changed from southeast to northeast. The configuration of the coastline of the bay contributes to the fact that the wind generates upwelling. Detailed information on the influence of this phenomenon can be found in [35]. Due to upwelling, the cold waters of higher density came to the surface near the coast. This led to the instability of water stratification, which was maintained by the wind. The cessation of the storm contributed to the reverse process, downwelling. As a result of coastal downwelling, water sinks, which causes the movement of phytoplankton waste products to the coast. Since these substances are lighter than water and cannot sink, they are concentrated near the coast. This concentration of harmful substances led to an ecological disaster. The presence of foam in the coastal strip confirms this situation.
In early October, algae of the genus Karenia again began to dominate in the waters of the Avacha Gulf. Their concentration was even higher. At the same time, the wind regime was favorable for the intensification of catastrophic phenomena. After the storm on September 29, a wide strip of coastal foam was again observed, which lasted three days. The foam also appeared near the shore on October 7 and 14. Furthermore, the Karenia bloom decreased both in terms of the concentration of algae in the samples, and according to satellite data, blooming was observed until early November. The large zenith angle of the sun did not allow for reliable monitoring in November, since already in early November the zenith angle exceeded 75°, the limiting angle for satellite calculations of bioparameters.
We used a non-standard MUMM atmospheric correction algorithm. The MUMM algorithm usually underestimates the concentration of chlorophyll-a. Attempts to use NIR atmospheric correction at low angles of the sun above the horizon lead to hundreds of percent errors in the calculation of chlorophyll-a concentration. For example, Carswell et al. [49] compared satellite estimates of chlorophyll-a concentrations with in situ measurements. The study area is the Salish Sea near Vancouver (48–50 degrees north latitude). The bias in calculating the concentration of chlorophyll-a according to the OC3 algorithm exceeded 400%, and the obtained values exceeded 40 mg m−3. It’s not typical of these waters. At the same time, the use of the modified MUMM atmospheric correction gives a bias of about 20%. Avacha Gulf is located north of the Salish Sea, and the blooming was in autumn. Images taken from the NASA site (https://oceancolor.gsfc.nasa.gov/ (accessed on 10 February 2023) show even higher pigment concentrations. For example, the image “A2020277015500.L2_LAC_OC.nc” dated October 03, 2020, obtained at 01:55 GMT shows concentration values of about 100 mg m−3 in Avacha Bay, and sea brightness Rrs for wavelengths of 412, 443, and 469 nm takes zero or even negative values. For the Kamchatka region, the use of the MUMM correction algorithm also has its limit. During the observation period, the turbidity of open waters (zone 2, Table 2) changed insignificantly. After mid-October, the turbidity of open waters changed significantly, so such images were not analyzed.
It can be seen that a linear increase in the F488 parameter is observed with the increase in the biomass of algae, starting from a biomass of 2500 mg m−3 (Figure 5). It becomes possible to estimate the biomass of algae by this parameter. However, these measurements were mainly carried out when the phytoplankton was in the stagnation stage. An analysis of the variability of the F488 parameter in the zones of the dominance of the Karenina alga was carried out. It turned out that the dependence is more complicated. The shape of the Rrs spectrum at the same concentration of chlorophyll-a depends on the stage of phytoplankton. Depending on the stage of life, the concentration of chlorophyll-a in the cell can vary several times. The concentration of dissolved organic matter also changes. How this affects the Rrs spectrum has not been studied.
At the stage of cell growth with an excess of nutrients, significant concentrations of other algae species can be expected. There is a problem with estimating the concentration of the dominant algae. It can also be expected that under nutrient deficiency, the relative concentration of the dominant algae will be proportional to the values of specific fluorescence. Establishing such dependencies will make it possible both to create an algorithm for calculating the concentration of blooming algae biomass and to determine the places and times of its intensive generation of harmful substances.

5. Conclusions

Efficient satellite monitoring of HABs is possible provided that the features of the formation of an ecological disaster are taken into account. This requires a number of techniques that would allow us to determine the dominant species of phytoplankton; assess the stages of blooming (intensive growth, blooming, and change in dominant alga species); monitor the evolution; and analyze the mechanisms of concentration of harmful substances in the coastal area. An ecological disaster occurs with a certain combination of high concentrations of algae, the stage of its blooming, and wind action, leading to the accumulation of harmful substances near the coast. We have attempted to demonstrate a technique for using satellite data to detect harmful algae and the conditions for the occurrence of catastrophic events in the coastal zone. From the example of an ecological catastrophe in the waters of the Kamchatka Peninsula (Russia), caused by a bloom of algae of the genus Karenia, similar methods are considered. The use of the remote sensing reflectance (Rrs) spectrum analysis algorithm, and its calibration according to the data of samples of the species composition of algae, made it possible to confidently identify areas where algae of the genus Karenia dominated in terms of biomass. The specific fluorescence of phytoplankton allows us to assess the stages of blooming. High specific fluorescence may indicate a lack of nutrients, which usually accompanies an increase in the excretion of metabolites (harmful substances). The wide variability of chlorophyll concentration at stable water turbidity, as well as the variability of the shape of the Rrs spectrum, makes it possible to determine the periods of the change of the dominant species. Analysis of near-surface wind and monitoring of the coastal zone allows us to determine the moments of concentration of harmful substances near the coast.

Author Contributions

Investigation, A.A., V.K., T.O. and A.K.; Project administration, A.A. All authors have read and agreed to the published version of the manuscript.

Funding

This research was funded by the Far Eastern Federal University Program “PRIORITY 2030”: Digital Science and the “Integrated monitoring of microalgae causing blooms and producing phycotoxins off the Kamchatka coast and in adjacent waters” (FWFE 2022-0001) grant no. 1022022400001-0-1.6.16.

Data Availability Statement

All satellite data used in this research can be accessed from the NASA Ocean Biology Processing Group site: https://oceancolor.gsfc.nasa.gov/ (accessed on 10 February 2023). All in situ data used in this research are shown in the Table 1. Complete in situ data collected during red tide off Kamchatka peninsula in 2020 are presented in the [37].

Conflicts of Interest

The authors declare no conflict of interest.

References

  1. Orlova, T. Kamchatka Event, Harmful Algal Blooms in the Bering/Chukchi Seas//Looking across the Border: US-Russia Science Corner. Alaska Ocean Observing System& World Wildlife Fund Arctic Program (AOOS&WWF). Available online: https://www.youtube.com/watch?v=wJpq0YE02Qg (accessed on 5 January 2022).
  2. Harmful Algal Event Database. Available online: http://haedat.iode.org/ (accessed on 20 January 2021).
  3. Ogashawara, I. Advances and Limitations of Using Satellites to Monitor Cyanobacterial Harmful Algal Blooms. Acta Limnol. Bras. 2019, 31, e103. [Google Scholar] [CrossRef] [Green Version]
  4. Zohdi, E.; Abbaspour, M. Harmful Algal Blooms (Red Tide): A Review of Causes, Impacts and Approaches to Monitoring and Prediction. Int. J. Environ. Sci. Technol. 2019, 16, 1789–1806. [Google Scholar] [CrossRef]
  5. Hill, P.R.; Kumar, A.; Temimi, M.; Bull, D.R. HABNet: Machine Learning, Remote Sensing-Based Detection of Harmful Algal Blooms. IEEE J. Sel. Top. Appl. Earth Obs. Remote Sens. 2020, 13, 3229–3239. [Google Scholar] [CrossRef]
  6. Dierssen, H.M.; Kudela, R.M.; Ryan, J.P.; Zimmerman, R.C. Red and Black Tides: Quantitative Analysis of Water-Leaving Radiance and Perceived Color for Phytoplankton, Colored Dissolved Organic Matter, and Suspended Sediments. Limnol. Oceanogr. 2006, 51, 2646–2659. [Google Scholar] [CrossRef] [Green Version]
  7. Blondeau-Patissier, D.; Gower, J.F.R.; Dekker, A.G.; Phinn, S.R.; Brando, V.E. A Review of Ocean Color Remote Sensing Methods and Statistical Techniques for the Detection, Mapping and Analysis of Phytoplankton Blooms in Coastal and Open Oceans. Prog. Oceanogr. 2014, 123, 123–144. [Google Scholar] [CrossRef] [Green Version]
  8. Wolny, J.L.; Tomlinson, M.C.; Schollaert Uz, S.; Egerton, T.A.; McKay, J.R.; Meredith, A.; Reece, K.S.; Scott, G.P.; Stumpf, R.P. Current and Future Remote Sensing of Harmful Algal Blooms in the Chesapeake Bay to Support the Shellfish Industry. Front. Mar. Sci. 2020, 7, 337. [Google Scholar] [CrossRef]
  9. Soto, I.M.; Cannizzaro, J.; Muller-Karger, F.E.; Hu, C.; Wolny, J.; Goldgof, D. Evaluation and Optimization of Remote Sensing Techniques for Detection of Karenia Brevis Blooms on the West Florida Shelf. Remote Sens. Environ. 2015, 170, 239–254. [Google Scholar] [CrossRef]
  10. Aleksanin, A.I.; Kim, V.; Orlova, T.Y.; Stonik, I.V.; Shevchenko, O.G. Phytoplankton of the Peter the Great Bay and Its Remote Sensing Problem. Oceanology 2012, 52, 219–230. [Google Scholar] [CrossRef]
  11. Seubert, E.L.; Gellene, A.G.; Howard, M.D.A.; Connell, P.; Ragan, M.; Jones, B.H.; Runyan, J.; Caron, D.A. Seasonal and Annual Dynamics of Harmful Algae and Algal Toxins Revealed through Weekly Monitoring at Two Coastal Ocean Sites off Southern California, USA. Environ. Sci. Pollut. Res. 2013, 20, 6878–6895. [Google Scholar] [CrossRef]
  12. Stonik, I.V.; Orlova, T.Y.; Chikalovets, I.V.; Aizdaicher, N.A.; Aleksanin, A.I.; Kachur, V.A.; Morozova, T.V. Pseudo-Nitzschia Species (Bacillariophyceae) and the Domoic Acid Concentration in Pseudo-Nitzschia Cultures and Bivalves from the Northwestern Sea of Japan, Russia. Nova Hedwig. 2019, 108, 73–93. [Google Scholar] [CrossRef]
  13. Shen, L.; Xu, H.; Guo, X. Satellite Remote Sensing of Harmful Algal Blooms (HABs) and a Potential Synthesized Framework. Sensors 2012, 12, 7778–7803. [Google Scholar] [CrossRef] [Green Version]
  14. Al-Ghelani, H.M.; AlKindi, A.Y.A.; Amer, S.; Al-Akhzami, Y.K. Harmful Algal Blooms: Physiology, Behavior, Population Dynamics and Global Impacts- A Review. Sultan Qaboos Univ. J. Sci. 2005, 10, 1–30. [Google Scholar] [CrossRef] [Green Version]
  15. Li, X.; Yan, T.; Yu, R.; Zhou, M. A Review of Karenia Mikimotoi: Bloom Events, Physiology, Toxicity and Toxic Mechanism. Harmful Algae 2019, 90, 101702. [Google Scholar] [CrossRef] [PubMed]
  16. Mueller, J.L.; Fargion, G.S.; McClain, C.R. Ocean optics protocols for satellite ocean color sensor validation, Rev. 1., Vol. III: Radiometric measurements and data analysis protocols. In NASA/TM-2003-21641/Rev-Vol. III; NASA Goddard Space Flight Center: Greenbelt, MD, USA, 2003; p. 78. Available online: https://oceancolor.gsfc.nasa.gov/docs/technical/protocols_ver4_voliii.pdf (accessed on 11 February 2022).
  17. Ruddick, K.G.; De Cauwer, V.; Park, Y.-J.; Moore, G. Seaborne Measurements of near Infrared Water-Leaving Reflectance: The Similarity Spectrum for Turbid Waters. Limnol. Oceanogr. 2006, 51, 1167–1179. [Google Scholar] [CrossRef] [Green Version]
  18. Aleksanin, A.I.; Kachur, V.A. Specificity of Atmospheric Correction of Satellite Data on Ocean Color in the Far East. Izv. Atmos. Ocean. Phys. 2017, 53, 996–1006. [Google Scholar] [CrossRef]
  19. Palmer, S.C.J.; Kutser, T.; Hunter, P.D. Remote Sensing of Inland Waters: Challenges, Progress and Future Directions. Remote Sens. Environ. 2015, 157, 1–8. [Google Scholar] [CrossRef] [Green Version]
  20. Bailey, S.W.; Werdell, P.J. A Multi-Sensor Approach for the on-Orbit Validation of Ocean Color Satellite Data Products. Remote Sens. Environ. 2006, 102, 12–23. [Google Scholar] [CrossRef]
  21. Concha, J.; Mannino, A.; Franz, B.; Kim, W. Uncertainties in the Geostationary Ocean Color Imager (GOCI) Remote Sensing Reflectance for Assessing Diurnal Variability of Biogeochemical Processes. Remote Sens. 2019, 11, 295. [Google Scholar] [CrossRef] [Green Version]
  22. Kopelevich, O.V.; Burenkov, V.I.; Sheberstov, S.V. Development and use of regional algorithms for calculating the bio-optical characteristics of the seas of Russia according to the data of satellite color scanners. Mod. Probl. Remote Sens. Earth Space 2006, 2, 99–105. [Google Scholar]
  23. Bramich, J.M.; Christopher, J.S.; Fischer, B.A.M. Evaluation of atmospheric correction and high-resolution processing on SeaDAS-derived chlorophyll-a: An example from mid-latitude mesotrophic waters. Int. J. Remote Sens. 2018, 39, 2119–2138. [Google Scholar] [CrossRef]
  24. Ma, L.L.; Liu, Y.; Zhang, B.; Lu, l.; Sun, G.; Wang, D.; Liu, Z.; Li, B.; Wang, Y.; Zhang, Y.; et al. Remotely sensed short-term changes in noctilucent algae blooms in the Bohai Sea. Int. J. Remote Sens. 2021, 42, 8661–8674. [Google Scholar] [CrossRef]
  25. Carder, K.L.; Chen, F.R.; Lee, Z.P.; Hawes, S.K.; Cannizzaro, J.P.; MODIS Ocean Science Team Algorithm Theoretical Basis Document. ATBD 19, Case 2 Chlorophyll a, Version 7. 2003. Available online: http://modis.gsfc.nasa.gov/data/atbd/atbd_mod19.pdf (accessed on 5 January 2022).
  26. Maritorena, S.; Siegel, D.A.; Peterson, A.R. Optimization of a semianalytical ocean color model for global-scale applications. Appl. Opt. 2002, 41, 2705–2714. [Google Scholar] [CrossRef]
  27. Lee, Z.; Carder, K.L.; Arnone, R.A. Deriving Inherent Optical Properties from Water Color: A Multiband Quasi-Analytical Algorithm for Optically Deep Waters. Appl. Opt. 2002, 41, 5755–5772. [Google Scholar] [CrossRef]
  28. Salyuk, P.; Bukin, O.; Alexanin, A.; Pavlov, A.; Mayor, A.; Shmirko, K.; Akmaykin, D.; Krikun, V. Optical Properties of Peter the Great Bay Waters Compared with Satellite Ocean Color Data. Int. J. Remote Sens. 2010, 31, 4651–4664. [Google Scholar] [CrossRef]
  29. Feng, C.; Ishizaka, J.; Saitoh, K.; Mine, T.; Yamashita, H. A Novel Method Based on Backscattering for Discriminating Summer Blooms of the Raphidophyte (Chattonella Spp.) and the Diatom (Skeletonema Spp.) Using MODIS Images in Ariake Sea, Japan. Remote Sens. 2020, 12, 1504. [Google Scholar] [CrossRef]
  30. Wynne, T.T.; Stumpf, R.P.; Tomlinson, M.C.; Warner, R.A.; Tester, P.A.; Dyble, J.; Fahnenstiel, G.L. Relating Spectral Shape to Cyanobacterial Blooms in the Laurentian Great Lakes. Int. J. Remote Sens. 2008, 29, 3665–3672. [Google Scholar] [CrossRef]
  31. Gower, J.; King, S.; Goncalves, P. Global Monitoring of Plankton Blooms Using MERIS MCI. Int. J. Remote Sens. 2008, 29, 6209–6216. [Google Scholar] [CrossRef]
  32. Amin, R.; Zhou, J.; Gilerson, A.; Gross, B.; Moshary, F.; Ahmed, S. Novel Optical Techniques for Detecting and Classifying Toxic Dinoflagellate Karenia Brevis Blooms Using Satellite Imagery. Opt. Express 2009, 17, 9126–9144. [Google Scholar] [CrossRef] [PubMed]
  33. Li, Y.; Stumpf, R.P.; McGillicuddy, D.J., Jr.; He, R. Dynamics of an Intense Alexandrium Catenella Red Tide in the Gulf of Maine: Satellite Observations and Numerical Modeling. Harmful Algae 2020, 99, 101927. [Google Scholar] [CrossRef] [PubMed]
  34. Mcgillicuddy, D.J.; Signell, R.P.; Stock, C.A.; Keafer, B.A.; Keller, M.D.; Hetland, R.D.; Anderson, D.M. A Mechanism for Offshore Initiation of Harmful Algal Blooms in the Coastal Gulf of Maine. J. Plankton Res. 2003, 25, 1131–1138. [Google Scholar] [CrossRef]
  35. Hetland, R.D.; Campbell, L. Convergent Blooms of Karenia Brevis along the Texas Coast. Geophys. Res. Lett. 2007, 34, 474. [Google Scholar] [CrossRef]
  36. Hillebrand, H.; Dürselen, C.-D.; Kirschtel, D.; Pollingher, U.; Zohary, T. Biovolume calculation for pelagic and benthic microalgae. J. Phycol. 1999, 35, 403–424. [Google Scholar] [CrossRef]
  37. Orlova, T.Y.; Aleksanin, A.I.; Lepskaya, E.V.; Efimova, K.V.; Selina, M.S.; Morozova, T.V.; Stonik, I.V.; Kachur, V.A.; Karpenko, A.A.; Vinnikov, K.A.; et al. A massive bloom of Karenia species (Dinophyceae) off the Kamchatka coast, Russia, in the fall of 2020. Harmful Algae 2022, 120, 102337. [Google Scholar] [CrossRef]
  38. IOCCG. Atmospheric Correction for Remotely-Sensed Ocean-Color Products; Reports of the International Ocean-Color Coordinating Group, No. 10; Wang, M., Ed.; IOCCG: Dartmouth, NS, Canada, 2010; 78p. [Google Scholar] [CrossRef]
  39. Abbott, M.R.; Ricardo, M.; Letelier, R.M. Algorithm Theoretical Basis Document Chlorophyll Fluorescence (MODIS Product Number 20). 1999. Available online: https://eospso.nasa.gov/sites/default/files/atbd/atbd_mod22.pdf (accessed on 5 January 2022).
  40. Falkowski, P.G.; Kolber, Z. Variation of chlorophyll fluorescence yields in the phytoplankton in the world oceans. Aust. J. Plant Physiol. 1995, 22, 341–355. [Google Scholar] [CrossRef]
  41. Lin, H.; Kuzminov, F.I.; Park, J.; Lee, S.; Falkowski, P.G.; Gorbunov, M.Y. The Fate of Photons Absorbed by Phytoplankton in the Global Ocean. Science 2016, 351, 264–267. [Google Scholar] [CrossRef]
  42. Wolanin, A.; Rozanov, V.V.; Dinter, T.; Noël, S.; Vountas, M.; Burrows, J.P.; Bracher, A. Global Retrieval of Marine and Terrestrial Chlorophyll Fluorescence at Its Red Peak Using Hyperspectral Top of Atmosphere Radiance Measurements: Feasibility Study and First Results. Remote Sens. Environ. 2015, 166, 243–261. [Google Scholar] [CrossRef] [Green Version]
  43. El-Habashi, A.; Duran, C.M.; Lovko, V.; Tomlinson, M.C.; Stumpf, R.P.; Ahmed, S. Satellite Retrievals of Karenia Brevis Harmful Algal Blooms in the West Florida Shelf Using Neural Networks and Impacts of Temporal Variabilities. J. Appl. Remote Sens. 2017, 11, 032408. [Google Scholar] [CrossRef] [Green Version]
  44. Tomlinson, M.C.; Wynne, T.T.; Stumpf, R.P. An evaluation of remote sensing techniques for enhanced detection of the toxic dinoflagellate, Karenia brevis. Remote Sens. Environ. 2009, 113, 598–609. [Google Scholar] [CrossRef]
  45. Tskhay, Z.R.; Shevchenko, G.V. Distribution features of chlorophyll a concentration off the east coast of Kamchatka in autumn 2020 from satellite data. Sovremenie Probl. Distancionnogo Zondirovaniya Zemli Cosm. 2022, 19, 226–238. [Google Scholar] [CrossRef]
  46. Vandersea, M.; Tester, P.; Holderied, K.; Hondolero, D.; Kibler, S.; Powell, K.; Baird, S.; Doroff, A.; Dugan, D.; Meredith, A.; et al. An Extraordinary Karenia Mikimotoi “Beer Tide” in Kachemak Bay Alaska. Harmful Algae 2020, 92, 101706. [Google Scholar] [CrossRef]
  47. Robin, R.S.; Kanuri, V.V.; Muduli, P.R.; Mishra, R.K.; Jaikumar, M.; Karthikeyan, P.; Suresh Kumar, C.; Saravana Kumar, C. Dinoflagellate Bloom of Karenia Mikimotoi along the Southeast Arabian Sea, Bordering Western India. J. Ecosyst. 2013, 2013, 463720. [Google Scholar] [CrossRef] [Green Version]
  48. Bondur, V.; Zamshin, V.; Chvertkova, O.; Matrosova, E.; Khodaeva, V. Detection and Analysis of the Causes of Intensive Harmful Algal Bloom in Kamchatka Based on Satellite Data. J. Mar. Sci. Eng. 2021, 9, 1092. [Google Scholar] [CrossRef]
  49. Carswell, T.; Costa, M.; Young, E.; Komick, N.; Gower, J.; Sweeting, R. Evaluation of MODIS-Aqua atmospheric correction and chlorophyll products of Western North American coastal waters based on 13 years of data. Remote Sens. 2017, 9, 1063. [Google Scholar] [CrossRef] [Green Version]
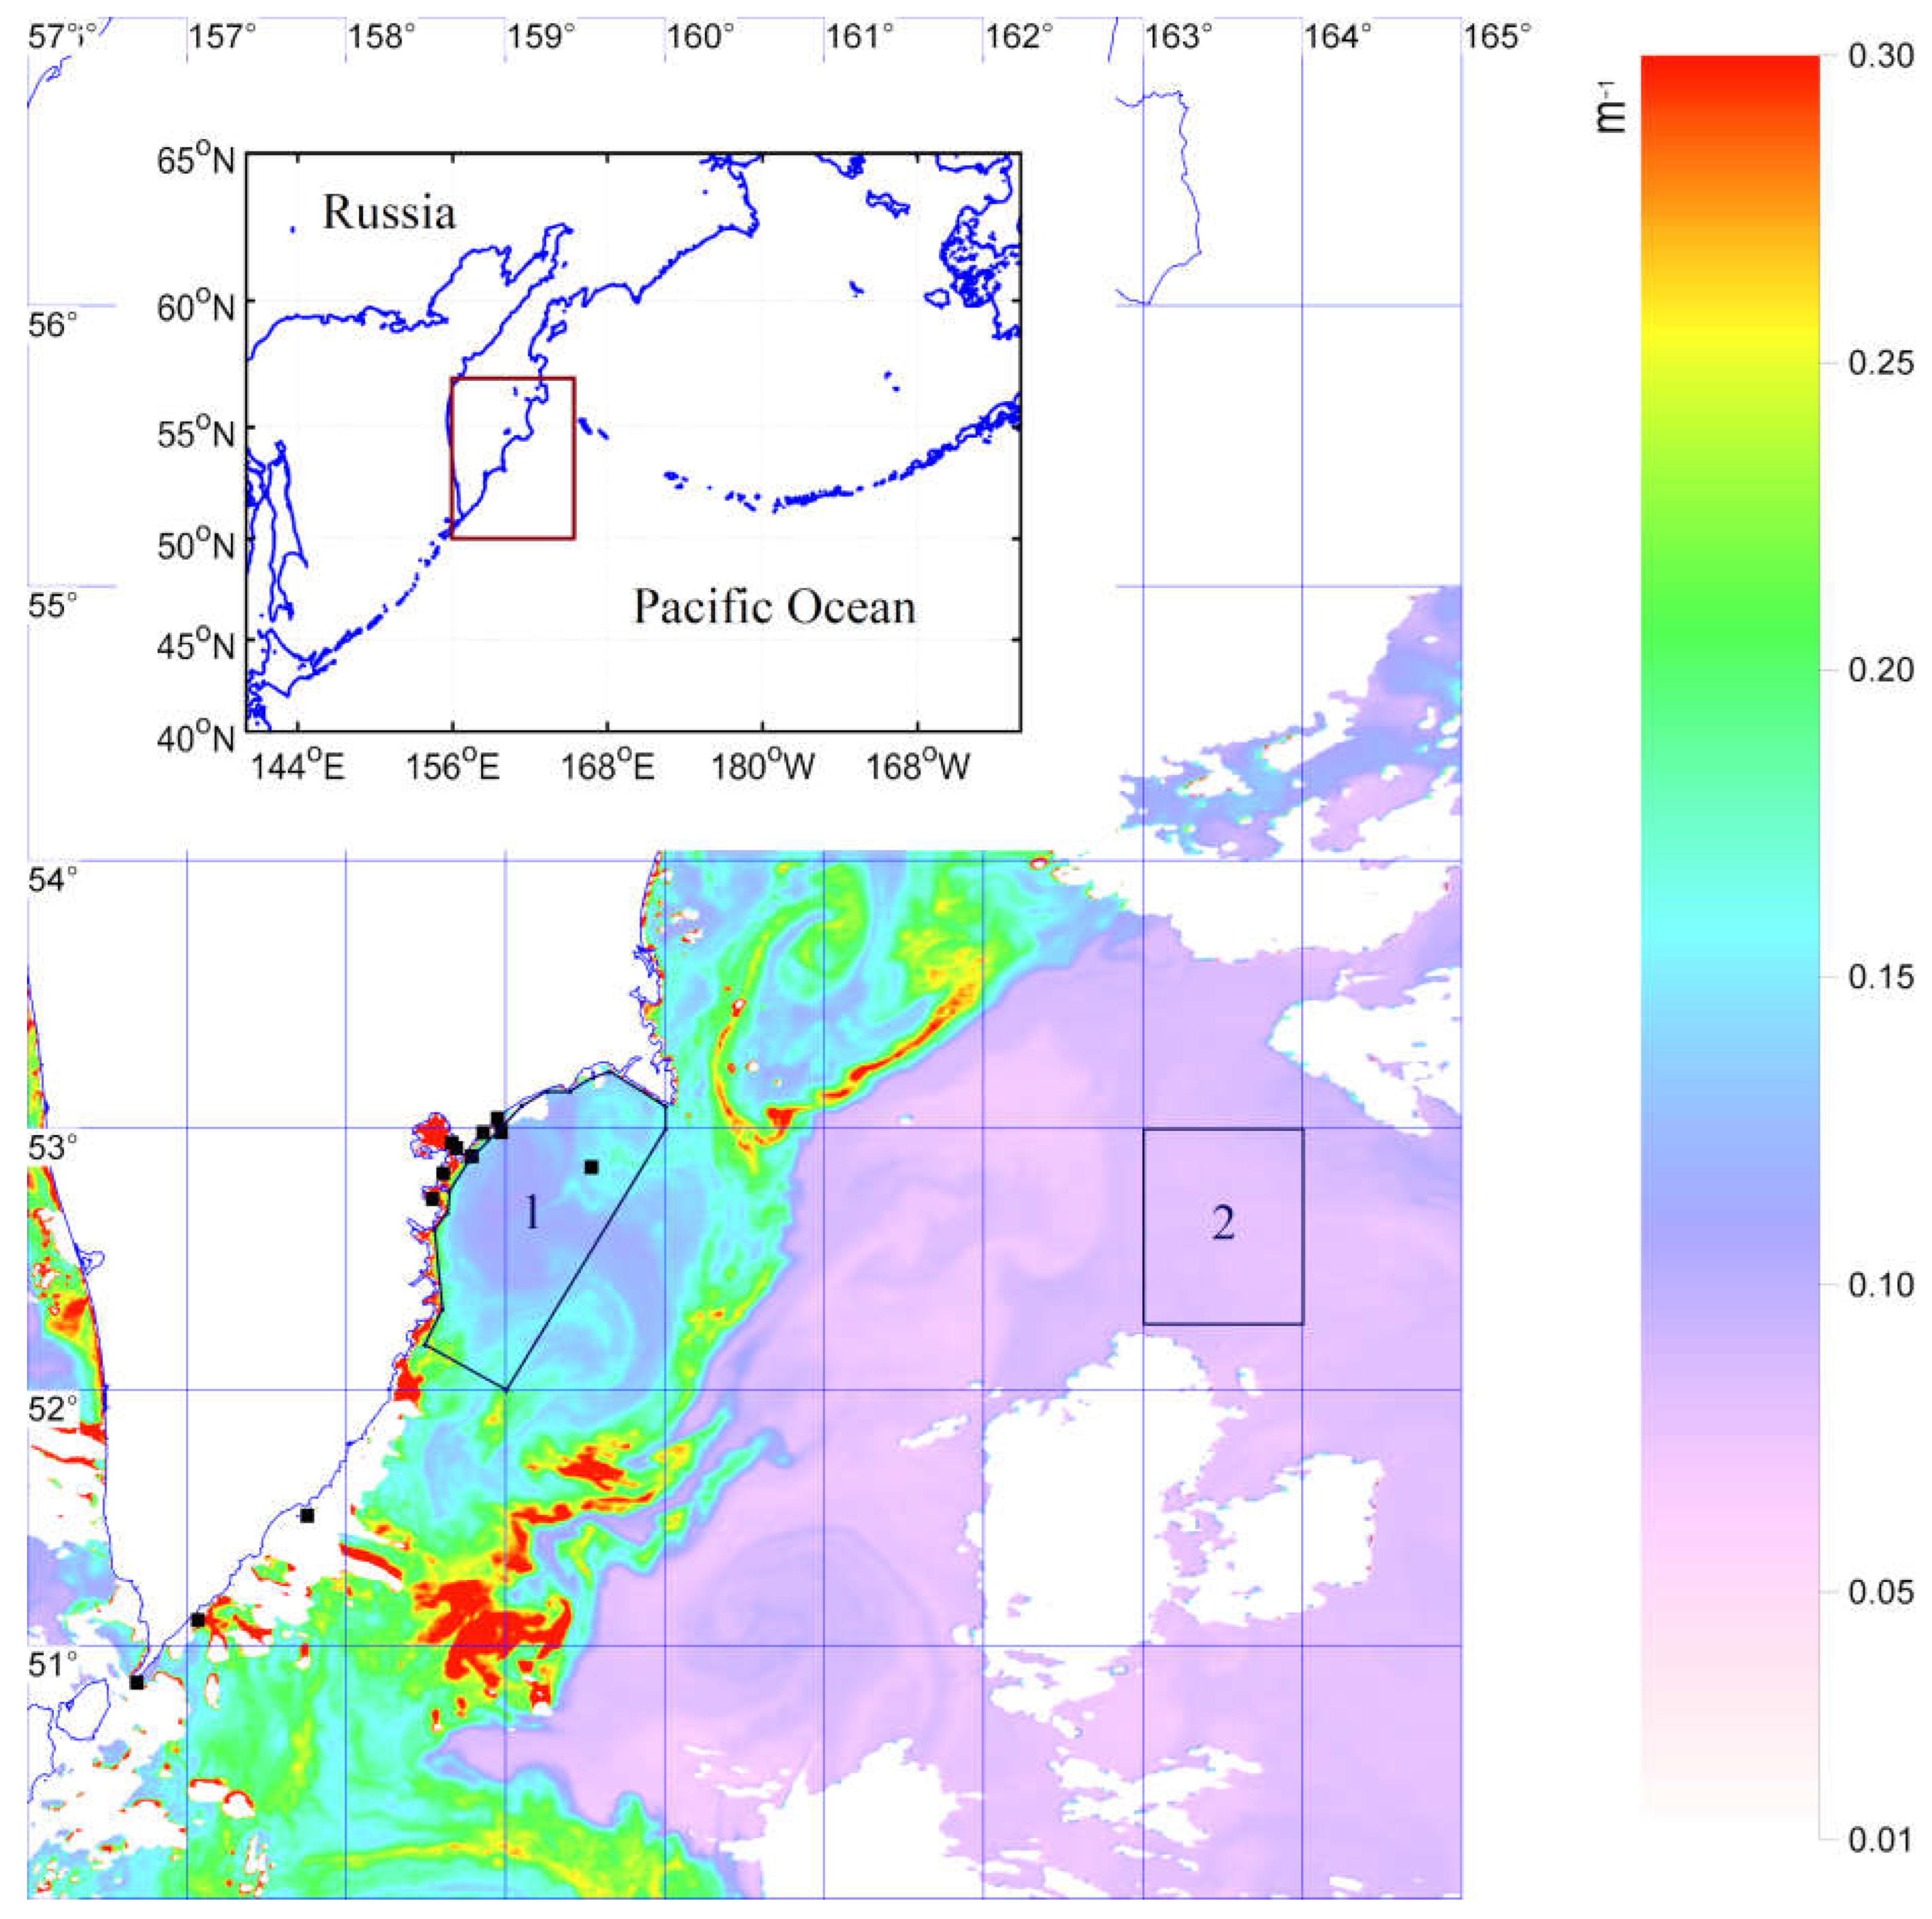
Figure 1. A characteristic of water turbidity— light attenuation coefficient (Kd490) MODIS/AQUA, Sept. 9. Boxes = zones for assessing the average values of bio-optical parameters for coastal (1) and open ocean waters (2); black dots = station locations. Here and later in the paper, pixels that are not related to the water surface are in white.
Remotesensing 15 01197 g001
Figure 2. Chlorophyll-a concentration (mg∙m−3) in the Avacha Gulf for the following dates: (a) September 9, (b) September 21, (c) September 25, (d) October 3, (e) October 9, (f) October 12. MODIS/AQUA.
Remotesensing 15 01197 g002
Figure 3. Specific fluorescence (mW cm−2 µm−1 sr−1 mg−1∙m3) in the Avacha Gulf for the following dates: (a) September 9, (b) September 21, (c) September 25, (d) October 3, (e) October 9, (f) October 12. MODIS/AQUA.
Remotesensing 15 01197 g003
Figure 4. The variability of the F488 parameter in Avacha Bay for the following dates: (a) September 9, (b) September 21, (c) September 25, (d) October 3, (e) October 9, (f) October 12.
Remotesensing 15 01197 g004
Figure 5. Relationship between spectrum shape parameter F488 and biomass of Karenia spp. Circle = biomass of Karenia spp. >50% in total phytoplankton. Triangle = <50%. Filled circles = coincidence measurements in space and time.
Remotesensing 15 01197 g005
Figure 6. The width of the foam stripe on September 20 compared to the stripe width of a randomly selected image before the storm at the same characteristic near-surface wind speed. View of Khalaktyrsky beach on two SkySat-C satellite images docked along an arbitrarily chosen vertical line for September 20 (left) and September 15 (right).
Remotesensing 15 01197 g006
Table 1. Sampling stations (1 m level). Abundance and biomass of total phytoplankton and percentage of Karenia spp. ones off the east coast of Kamchatka in autumn 2020.
StationDateCoordinatesF488Total PhytoplanktonKarenia spp.
Abundance
(cells L−1)
Biomass
(mg m−3)
Abundance
(cells L−1)
Biomass
(mg m−3)
Species 1
2September 2252°51.095′N, 159°32.190′E1.20434,0004755369,000 (85%)4551 (96%)KA (98%), Kp (1%), Ks (0.5%), Km (0.5%)
3September 2253°01.531′N, 158°57.354′E1.12647,0002825203,000 (31%)2499 (88%)Kp (98%), Km (1.5%), KA (0.5%)
4September 2252°59.095′N, 158°51.594′E1.03299,0002705187,000 (63%)2319 (86%)Km (98%), Kp (1.5%), KA (0.5%)
5October 452°59.717′N, 158°57.450′E1.28125,0001585105,000 (84%)1302 (82%)Kl (90%), Kp (10%)
6October 452°55.600′N, 158°41.333′E1.0273,00061720,000 (27%)248 (40%)Kl (100%)
7October 452°55.991′N, 158°41.151′E1.03247,0002274152,000 (61%)1885 (83%)Kl (98%), KC (1.5%), KB (0.5%)
8October 452°49.737′N, 158°36.567′E1.1383,00097466,000 (79%)819 (84%)Kl (100%)
12October 953°12.900′N, 159°33.420′E0.868320181.53039 (36%)24.3 (13%)Km (5%), Ks (95%)
13October 953°11.220′N, 159°26.040′E1.1627,512354.911,477 (42%)94.7 (27%)Km (92%), Kp (8%)
14October 1250°51.067′N, 156°41.100′E1.24165,0002028162,000 (98%)2004 (99%)Ks (100%)
15October 1251°06.117′N, 157°04.067′E1.27485,0005999482,000 (99%)5981 (99%)Ks (100%)
16October 1251°30.730′N, 157°44.870′E1.11262,0003194254,000 (97%)3146 (98%)Ks (99%), KD (1%)
17October 1352°43.930′N, 158°32.653′E1.4968,0007959622,000 (64%)7715 (97%)Ks (99%), KC (1%)
1Karenia species identified based on morphological characters are K. cf. cristata (Kc), K. cf. longicanalis (Kl), K. mikimotoi (Km), K. papilionacea (Kp), K. selliformis (Ks), Karenia sp. A. (KA), Karenia sp. B (KB), Karenia sp. C (KC), and Karenia sp. D (KD).
Table 2. Variability of average values of bio-parameters in the Avacha Gulf in coastal and open-ocean zones.
Date and Time (UTC) Month.Day (Hours:Minutes)
Parameter09.09 (02:40)09.21 (1:30)09.25 (2:40)10.03 (01:55)10.09 (01:15)10.12 (01:45)
Zone 1Chl-a (mg m−3)1.60 ± 10−31.14 ± 4 × 10−41.80 ± 4 × 10−31.62 ± 9 × 10−41.82 ± 10−31.45 ± 7 × 10⁻⁴
Kd490 (m−1)0.14 ± 10−40.14 ± 4 × 10−50.17 ± 3 × 10−40.17 ± 5 × 10−50.18 ± 2 × 10−40.17 ± 4 × 10⁻⁵
F4880.84 ± 10−41.17 ± 6 × 10−51.07 ± 2 × 10−41.16 ± 7 × 10−51.37 ± 2 × 10−41.22 ± 9 × 10⁻⁵
flh/chl-a (mW cm−2 µm−1 sr−1 mg−1∙m3)0.06 ± 8*10−50.15 ± 10−40.16 ± 3 × 10−40.23 ± 10−40.17 ± 7 × 10−50.20 ± 9 × 10⁻⁵
Zone 2Chl-a (mg m−3)0.58 ± 10−40.74 ± 3 × 10−40.74 ± 10−40.89 ± 2 × 10−40.74 ± 9 × 10−50.81 ± 10−4
Kd490 (m−1)0.08 ± 2 × 10−50.10 ± 2 × 10−50.10 ± 10−50.11 ± 10−50.10 ± 10−50.09 ± 8 × 10⁻⁶
F4880.89 ± 4 × 10−50.98 ± 9 × 10−50.96 ± 6 × 10−50.95 ± 7 × 10−51.01 ± 7 × 10−50.92 ± 8 × 10⁻⁵
flh/chl-a (mW cm−2 µm−1 sr−1 mg−1∙m3)0.14 ± 3 × 10−50.09 ± 8 × 10−50.16 ± 3 × 10−50.11 ± 3 × 10−50.09 ± 6 × 10−50.09 ± 3 × 10⁻⁵
Disclaimer/Publisher’s Note: The statements, opinions and data contained in all publications are solely those of the individual author(s) and contributor(s) and not of MDPI and/or the editor(s). MDPI and/or the editor(s) disclaim responsibility for any injury to people or property resulting from any ideas, methods, instructions or products referred to in the content.