Article

An Algorithm to Retrieve Precipitable Water Vapor from Sentinel-2 Data

1
Engineering Research Center of Ministry of Education for Mine Ecological Restoration, China University of Mining and Technology, Xuzhou 221116, China
2
Engineering Research Center for Coal Mining Subsided Land and Goaf Treatment of Shandong, Jining 272000, China
3
Jinan Geotechnical Investigation and Surveying Research Institute, Jinan 250000, China
4
Inner Mongolia Zhungeer Banner Mining Area Career Development Center, Ordos 017100, China
*
Author to whom correspondence should be addressed.
Remote Sens. 2023, 15(5), 1201; https://doi.org/10.3390/rs15051201
Submission received: 15 December 2022 / Revised: 15 February 2023 / Accepted: 19 February 2023 / Published: 22 February 2023

Abstract

:
As one of the most important greenhouse gases, water vapor plays a vital role in various weather and climate processes. In recent years, a near-infrared ratio technique based on satellite images has become a research hotspot in the field of precipitable water vapor (PWV) monitoring. This study proposes a Level 2A PWV data retrieval method based on Sentinel-2 images (S2-L2A), which considers land-cover types and is more suitable for local areas. The radiative transfer model MODTRAN 5 is used to simulate the atmospheric radiative transfer process and obtain lookup tables (LUTs) for PWV retrieval. The spatial distribution of S2-L2A PWV is validated using Global Positioning System (GPS), Terra-MODIS PWV product (MOD05), and Level 2A product provided by ESA (ESA-L2A), while the time series results are evaluated using MOD05. Results show that the PWV retrieved by S2-L2A is both highly correlated and has low bias with the three PWV products, and is closer to the reference data than the MOD05 and ESA-L2A PWV. The relative PWV value in the morning is: bare soil > vegetation-covered area > construction land; as the elevation increases, the PWV value decreases. This study also analyzes the error distribution of the PWV data retrieved by S2-L2A, and finds that inversion error increases with AOT value, but decreases with elevation and normalized difference vegetation index (NDVI). Compared with the three water vapor products, the PWV data retrieved by the proposed method has high accuracy and can provide large-scale and high-spatial-resolution PWV data for many research fields, such as agriculture and meteorology.

1. Introduction

Water vapor is an important greenhouse gas that affects weather changes [1,2,3,4]. Water vapor is also a critical factor in studying various parameters, such as the Earth’s radiation budget, global climate changes, cloud formation, and the hydrological cycle [5,6,7]. Precipitable water vapor (PWV) refers to the total amount of water vapor per unit column from the ground to the top of the atmosphere, which represents the amount of precipitation formed by converting all water vapor contained into rain and snow [8]. Accurate estimation of the PWV value is of great significance for both achieving efficient use of water resources and climate-related research.
Radiosonde has been the most basic means to measure upper-air meteorological parameters [9,10,11]. It provides information on the air pressure, temperature, and relative humidity needed to calculate the PWV value from the Earth’s surface to the top of the atmosphere [12]. Radiosonde data have high accuracy and vertical resolution but are expensive to obtain and have few stations. These data are usually used to evaluate the accuracy of other water vapor products [13,14]. The Global Positioning System (GPS) is another way to retrieve PWV based on the delayed signal between GPS satellites and receivers [15,16]. PWV retrieval using GPS is widely used due to its all-weather coverage, high temporal resolution, and easy operation [17,18]. In addition, a sun photometer can retrieve PWV with high temporal resolution from solar radiation transmittance [19,20,21]. It measures the extinction effect of the atmosphere on direct solar radiation through a water vapor absorption channel and uses the radiative transfer model to realize PWV inversion [22].
The above-mentioned methods all monitor PWV values at a single point, which cannot meet application requirements on a large scale. In recent years, the development of satellite remote sensing has provided a new means of studying water vapor in continuous space [23,24,25]. Inversion methods include the near-infrared ratio and split window algorithms [7,26,27]. Remote sensing data have been obtained by satellites that include moderate resolution imaging spectroradiometer (MODIS) [28,29,30], visible and infrared radiometer (VIRR) [31,32], and medium resolution spectrum imager (MERSI) [33,34]. Bennouna et al. [35] used the near-infrared and thermal infrared bands of MODIS to retrieve PWV values and compared accuracy at different bands. Khaniani et al. [36] used GPS and MODIS to estimate PWV in Iran, and used PWV retrieved from GPS to correct the MODIS PWV. Abbasi et al. [37] improved the PWV estimation algorithm based on radiance ratio technology, and used the FengYun 3D Medium Resolution Spectral Imager 2 (FY-3D MERSI-2) as an example to verify the proposed algorithm’s accuracy.
Although these satellite data have been successfully applied to PWV monitoring, their spatial resolution is low (1 km), which makes it challenging to provide high-resolution water vapor products. The Sentinel-2 is a cluster of satellites launched by the European Space Agency (ESA), and consists of two satellites in the same group: 2A launched in 2015, and 2B launched in 2017 [38]. The multispectral instrument (MSI) has a near-infrared water vapor absorption channel (B9, with a spatial resolution of 60 m) and an adjacent atmospheric window channel (B8A, with a spatial resolution of 20 m), which allows PWV detection with an extensive range and high spatial resolution. ESA provides Level-2A products (ESA-L2A) based on an implementation of the Sen2Cor algorithm, and also provides an offline version of the Sen2Cor L2A processor (S2C-L2A) to produce Level-2A products. Both ESA-L2A and S2C-L2A products include bottom of the atmosphere (BOA) reflectance images, maps of the aerosol optical thickness (AOT), and PWV, among others [39]. PWV is retrieved by the atmospheric precorrected differential absorption (APDA) algorithm, which simulates the total radiance and path radiance received by B8A and B9, and constructs the relationship between PWV and the radiance ratio after removing the path radiance. Obregón et al. [40] validated the AOT and PWV provided by ESA-L2A using the data from 94 Aerosol Robotic Network (AERONET) stations over Europe and adjacent regions. Djamai et al. [39] compared the AOT, PWV, and surface reflectance from ESA-L2A products and S2C-L2A outputs. Makarau et al. [41] constructed a relationship between radiance ratios and PWV using the APDA algorithm, and compared the Sentinel-2 retrieved PWV with the AERONET measurements. The above methods have good performance, but these PWV retrieval models are built for a global scale, and may not obtain optimal results for local areas. Moreover, these algorithms ignore the reflectance difference of multiple land-cover types. It is necessary to propose a Sentinel-2 PWV retrieval method that considers multiple land-cover types and is more suitable for specific areas.
The objective of this paper is to develop an algorithm for retrieving Level 2A PWV data using Sentinel-2 images (S2-L2A), which considers land-cover types and is more suitable for local areas. First, the radiative transfer process is simulated using the radiative transfer model MODTRAN 5, and lookup tables (LUTs) for PWV retrieval are constructed. Next, the PWV products of GPS, Terra-MODIS PWV product (MOD05), and ESA-L2A are used to validate the accuracy of the S2-L2A PWV. Then, the spatial distribution features of S2-L2A PWV are analyzed. In order to present the study logically, we structured the remainder of the paper as follows: Section 2 introduces the materials and methods; Section 3 presents the validation and spatial distribution results; Section 4 discusses the advantages, errors and transferability of the proposed algorithm; and the last section provides some conclusions. This study provides technical support for large-scale accurate prediction of PWV and offers a data source for remote sensing applications, such as meteorological forecasts and ecological management.

2. Materials and Methods
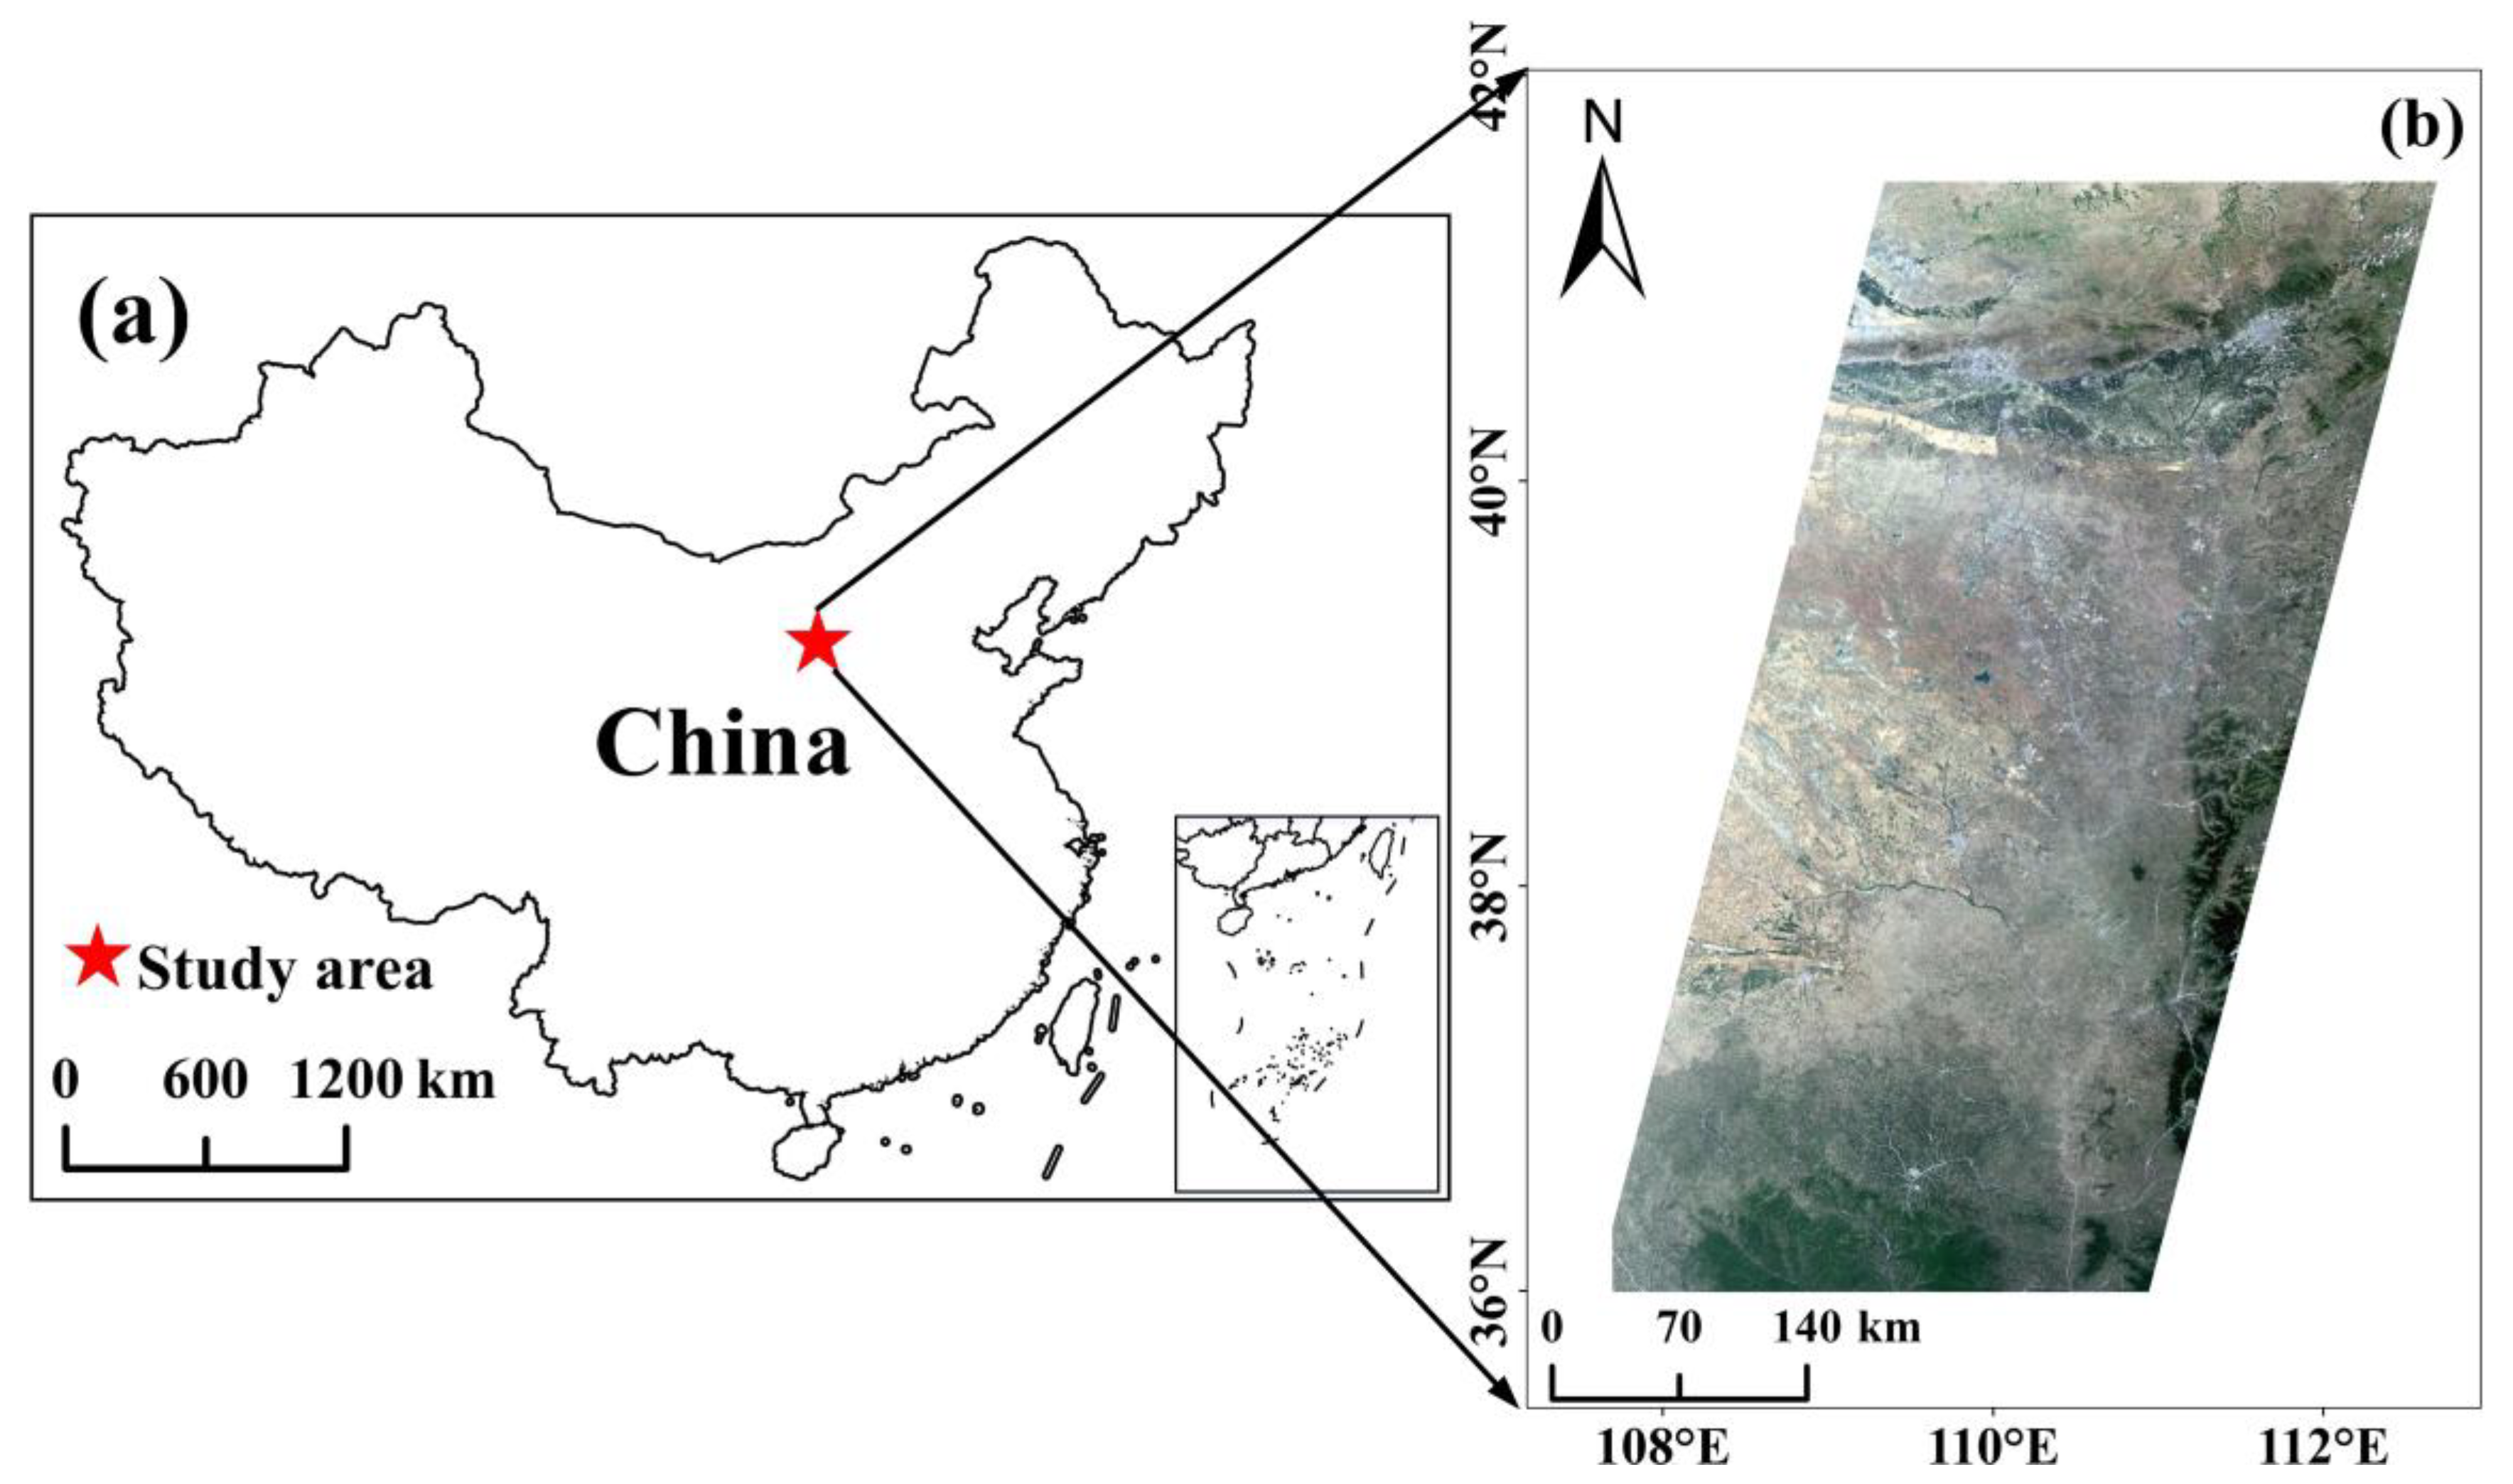
2.1. Study Area

The study area is located at the border of Shanxi, Shaanxi, and Inner Mongolia in China. The geographical coordinates of the study area are 107°28′48″–112°45′52″E, 36°02′41″–41°34′03″N, as shown in Figure 1. The study area has a typical arid and semi-arid continental climate with little rainfall, and the rainfall is mainly concentrated between June and September. The average annual rainfall is approximately 360 mm, the average annual sunshine hours are 2875.9 h, and the average yearly temperature is 7.29 °C. The evaporation is approximately 2000 mm, and the average annual humidity is 56%. The soil type is sandy, primarily soil with loose structure, strong water permeability, poor water, fertilizer retention capacity, and poor soil. The main vegetation types include steppe, deciduous broad-leaved shrub, and sandy vegetation.

2.2. Sentinel-2 Data and Preprocessing

Sentinel-2 denotes a group of polar-orbiting observation satellites launched under the European Copernicus program. They are multispectral instruments with a spectral range of 400–2400 nm, including 13 bands ranging from visible and near-infrared to short-wave infrared. The swath width is 290 km, and the spatial resolution is 10 m for B2–B4 and B8, 60 m for B1 and B9, and 20 m for the remaining bands. The repeat cycle of one satellite is ten days, and the two satellites use a co-orbit operation mode, which shortens the repeat cycle to five days.
The Level-1C (apparent reflectance) product provided by ESA was used in this study. Band B8A was selected as an atmospheric window channel, and band B9 was selected as a water vapor absorption channel. For B8A to have the same spatial resolution as B9, it is necessary to either downsample the spatial resolution of B8A to 60 m or upsample B9 to 20 m. Since upsampling does not increase spatial information and may result in checkerboard artifacts, the Sentinel Application Platform (SNAP) was used to downsample B8A to the same spatial resolution as B9, and the apparent reflectance of the two bands was converted to radiance.

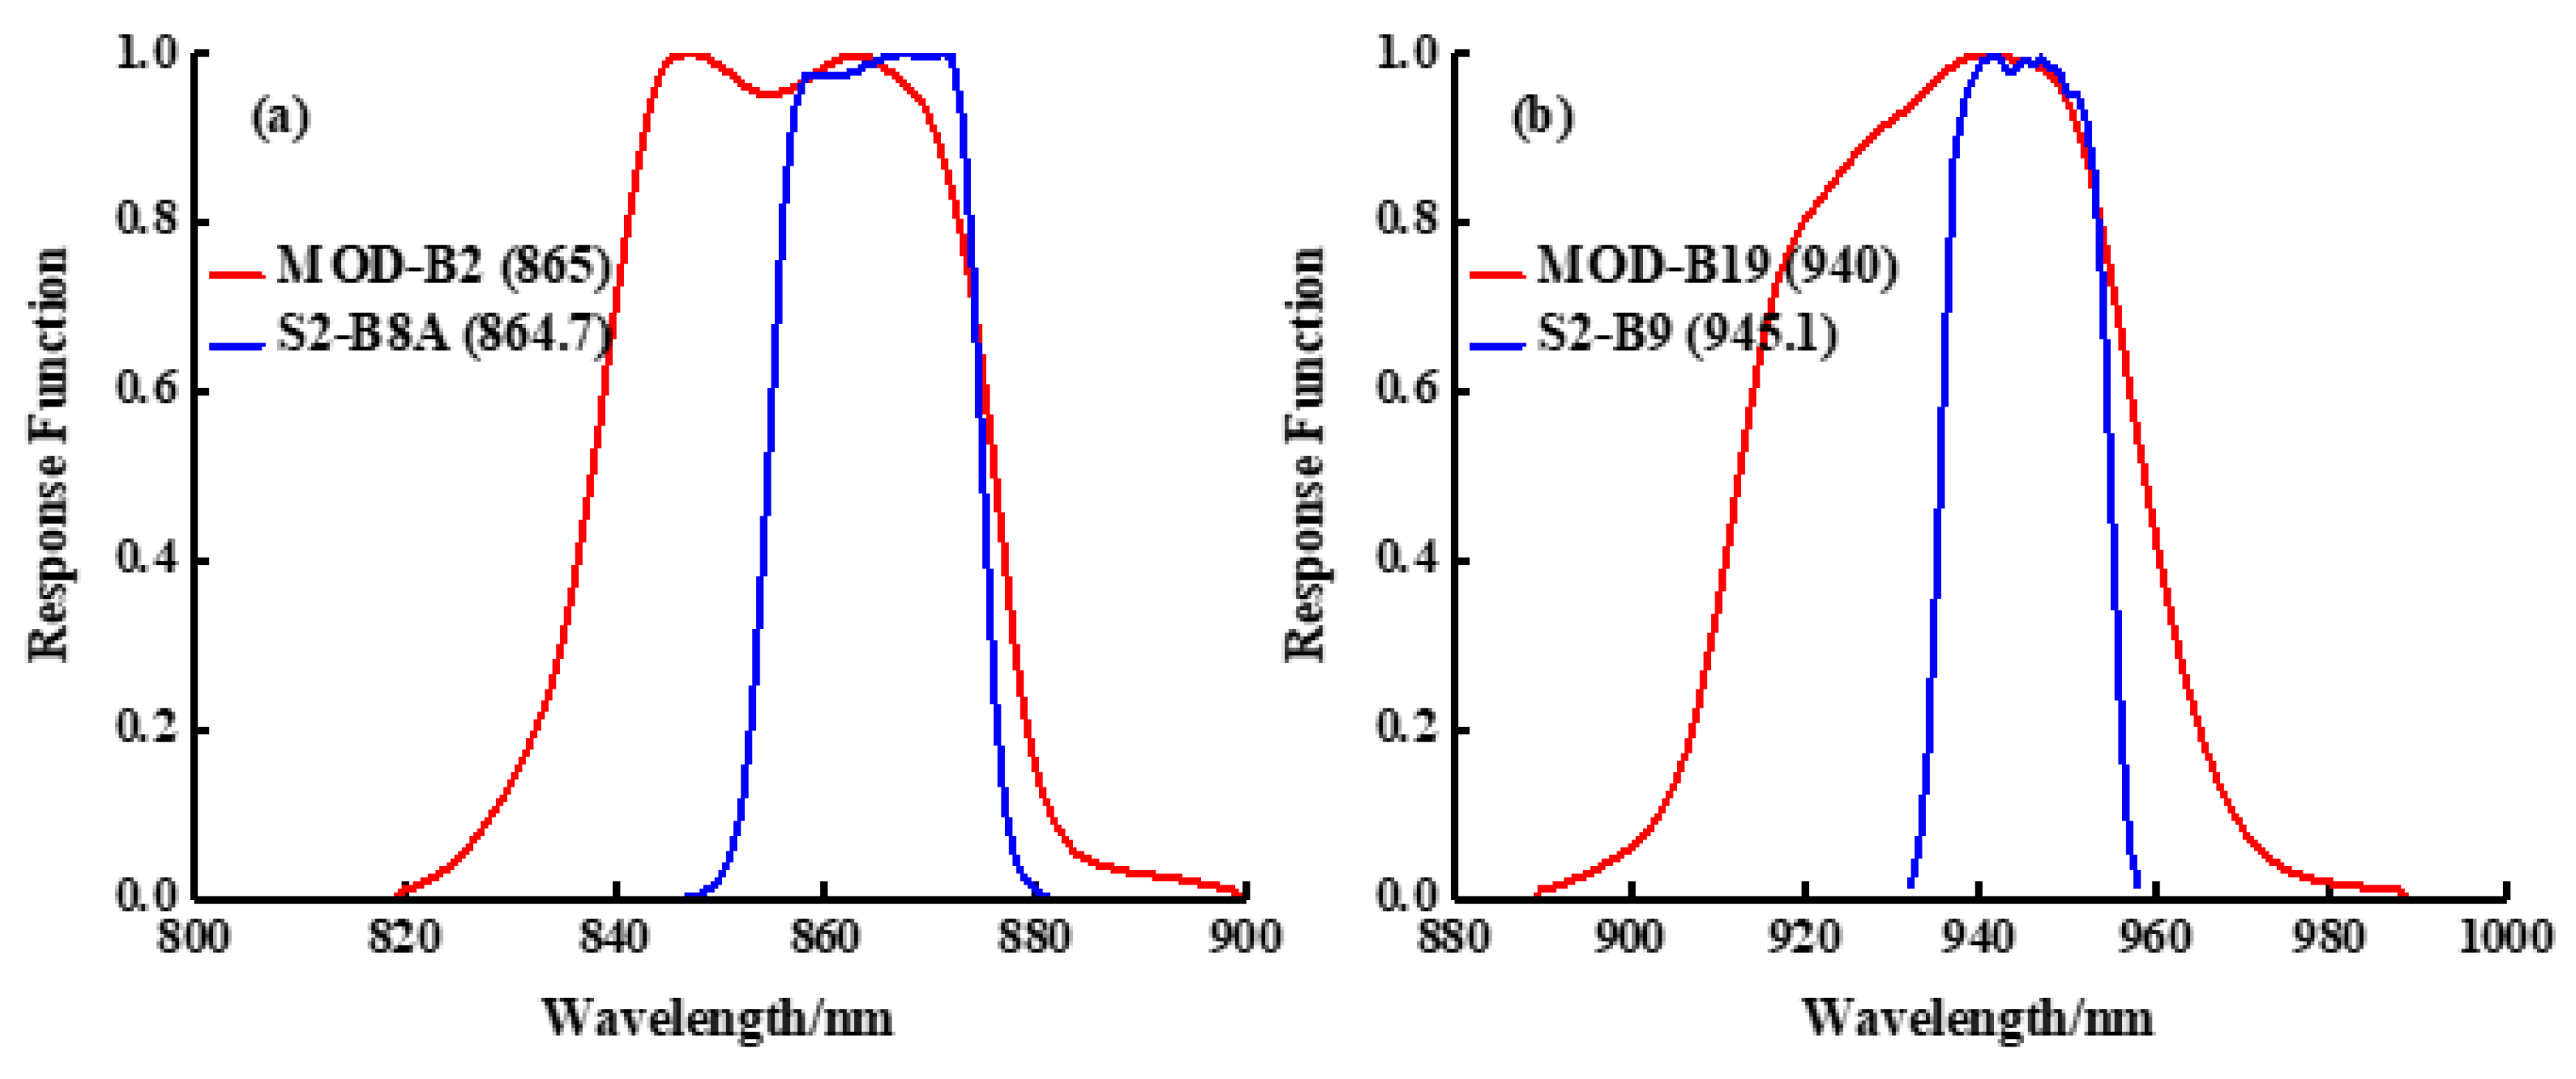
2.3. Theoretical Basis of PWV Inversion

Solar radiation passes through the atmosphere and is either partially absorbed or scattered by the atmosphere before reaching a satellite sensor. For a homogeneous Lambertian surface, if the proximity effect is not considered, the radiance received by a satellite sensor includes mainly the direct reflection of the surface and the solar radiation scattered by the atmosphere (path radiance) [25,42,43], which can be expressed by Equation (1).
L S e n s o r ( λ ) = L S u n ( λ ) τ ( λ ) ρ ( λ ) + L p a t h ( λ )
where λ is the wavelength, L S e n s o r ( λ ) is the total radiance that reached the sensor, L S u n ( λ ) is the above atmosphere solar radiance, τ ( λ ) is the total transmittance, ρ ( λ ) is the ground reflectance, and L p a t h ( λ ) is the path radiance.
Atmospheric transmittance is affected by gas components, such as carbon monoxide, carbon dioxide, ozone, methane, and water vapor. The amounts of carbon monoxide, carbon dioxide, and other gases are relatively fixed, while water vapor content changes significantly and is the main factor affecting transmittance. The relationship between atmospheric transmittance and water vapor content can be constructed, and PWV can be estimated through the transmittance calculated by remote sensing images. So, Equation (1) can be written as:
τ ( λ ) = L S e n s o r ( λ ) L p a t h ( λ ) L g r o u n d ( λ )
where L g r o u n d = L S u n ( λ ) ρ ( λ ) is the total ground reflected radiance.
The transmittance ratio between the water vapor absorption channel and the atmospheric window channel is:
τ ( λ 1 ) τ ( λ 2 ) = L S e n s o r ( λ 1 ) L p a t h ( λ 1 ) L g r o u n d ( λ 1 ) × L g r o u n d ( λ 2 ) L S e n s o r ( λ 2 ) L p a t h ( λ 2 )
where λ 1 is the water vapor absorption channel, and λ 2 is the atmospheric window channel.
Previous studies have shown that in the range of 865–1240 nm, surface reflectance is almost the same or linear with the wavelength [44]. Assuming that the reflectance and total ground reflected radiance of each channel are roughly equal, and that the transmittance of the atmospheric window channel is approximately equal to 1, Equation (3) can be simplified as follows:
τ ( λ 1 ) = L S e n s o r ( λ 1 ) L p a t h ( λ 1 ) L S e n s o r ( λ 2 ) L p a t h ( λ 2 )
Therefore, in this study, MODTRAN 5 was used to simulate the atmospheric radiative transfer process and obtain the path radiance, and the relationship between transmittance and water vapor was fitted to build the PWV estimation model. The spatial distribution map of PWV was obtained based on the radiance ratio of the water vapor absorption channel to that of the atmospheric window channel of Sentinel-2.

2.4. PWV Inversion Model Design

Atmospheric conditions in summer and winter differ greatly, and the study area is located at 36°02′41″–41°34′03″N. Therefore, two atmospheric models of mid-latitude summer and mid-latitude winter, respectively, were selected to construct PWV retrieval models. The retrieval model consists of 7-D LUTs composed of sensor zenith angle, solar zenith angle, relative azimuth angle, land-cover type, water vapor column, visibility, and elevation. For carbon monoxide, carbon dioxide, ozone, methane, and other gases, the default standard atmospheric profiles of MODTRAN 5 were used as the input parameters. The important input parameters of MODTRAN 5 are shown in Table 1. An example of the relationship between transmittance and PWV is shown in Figure 2, and can be expressed by Equation (5).
W = ( ( a l n τ ) / b ) c
where W is the PWV value, τ is the transmittance, and a, b and c are the regression coefficients between W and τ.

2.5. Retrieval Algorithm Validation

In this study, the PWV data retrieved from the GPS, MOD05, and ESA-L2A were used to validate the precision of the S2-L2A PWV. The principle of GPS inversion of PWV data is that electromagnetic waves are affected by atmospheric delay when passing through the Earth’s atmosphere [16,45]. The zenith total delay (ZTD) consisted of zenith hydrostatic delay (ZHD) and ZWD. The ZHD was calculated by the Saastamoinen model using data on station latitude, geodetic height, and atmospheric pressure, and the ZWD was obtained by subtracting the ZHD from the ZTD. The relationship between the ZWD and PWV is expressed by:
P W V = 10 6 ρ w R v ( k 2 + k 3 / T m ) Z W D = Z W D
where ∏ is a dimensionless scale factor, which is used to convert the proportional relationship between ZWD and water vapor; ρw is the density of water, where the value is 1 × 10³ kg/m3; Rv is the gas constant of the water-vapor ratio, with a value of 461 J·kg−1·K−1; k2 and k3 are physical constants obtained from the experiment, with values of 16.48 K·hPa−1 and (3.776 ± 0.014) × 105 K2·hPa−1 respectively; and Tm is the weighted average temperature related to local meteorological elements, in a unit of K.
MOD05 is a PWV product calculated based on the MODIS data. This product assumes that the underlying surface is single and uses the radiative transfer equation to calculate and establish LUTs for various data, such as water vapor content and transmittance. PWV was retrieved using the 940-nm water vapor absorption channel [42]. Data similar to the Sentinel-2 transit times were downloaded from LAADS DAAC (https://ladsweb.modaps.eosdis.nasa.gov/search/). For a fair comparison, the spatial resolution of S2-L2A PWV was resampled to 1000 m, the same as the MOD05.
ESA-L2A products downloaded from ESA SciHub (https://scihub.copernicus.eu/dhus/#/home) included BOA reflectance, PWV, AOT, and so on. The PWV’s spatial resolution was resampled to 60 m using SNAP.
Statistical metrics used to validate the precision of S2-L2A PWV included the correlation coefficient (R), root mean square error (RMSE), and overall bias (Bias), which were respectively calculated by:
R = i = 1 n ( P W V S i P W V S ¯ ) ( P W V R i P W V R ¯ ) i = 1 n ( P W V S i P W V S ¯ ) 2 ( P W V R i P W V R ¯ ) 2
R M S E = i = 1 n ( P W V S i P W V R i ) 2 n
B i a s = i = 1 n ( P W V S i P W V R i ) n
where P W V S i is the estimated PWV, P W V S ¯ is the mean value of estimated PWV, P W V R i is the reference PWV, and P W V R ¯ is the mean value of reference PWV.

3. Results

3.1. Validation of Various PWV Products

Since 16 GPS receivers were deployed in this experiment on 1 August 2021 and 6 August 2021, only a small range of PWV could be validated. GPS PWV observations have high temporal resolution and high accuracy, and are often used as reference data to evaluate PWV measurements retrieved from satellite instruments [17]. Therefore, in the first step, in addition to validating the S2-L2A PWV, the accuracy of PWV retrieved from ESA-L2A and MOD05 was also verified using GPS measurements, to in turn verify the accuracy of S2-L2A PWV over a wide range using these two PWV products in the second step.

3.1.1. PWV Comparison of S2-L2A, MOD05, and ESA-L2A with GPS

To make the measured spatial range consistent, this study compared the GPS PWV with the mean value of 17 × 17 pixels on the Sentinel-2 image. Table 2 shows the PWV comparison of S2-L2A, MOD05, and ESA-L2A with GPS. S2-L2A estimates show a strong correlation with GPS retrievals (0.929) and low bias (RMSE = 0.114 cm and Bias = −0.005 cm). This result demonstrated that the S2-L2A PWV had high accuracy and could meet the requirements of quantitative remote sensing. A negative Bias value indicated that S2-L2A underestimated PWV. Although the bias values of MOD05 and ESA-L2A products were slightly larger (RMSE values were 0.343 cm and 0.346 cm, respectively; Bias values were 0.292 cm and −0.319 cm, respectively), they were still highly correlated with GPS-retrieved PWV (R were 0.947 and 0.908, respectively), indicating that these two PWV products could be used to evaluate the accuracy of S2-L2A PWV over a large range. In addition, compared with MOD05 and ESA-L2A, the PWV retrieved by S2-L2A was closest to the reference data and had the highest accuracy.

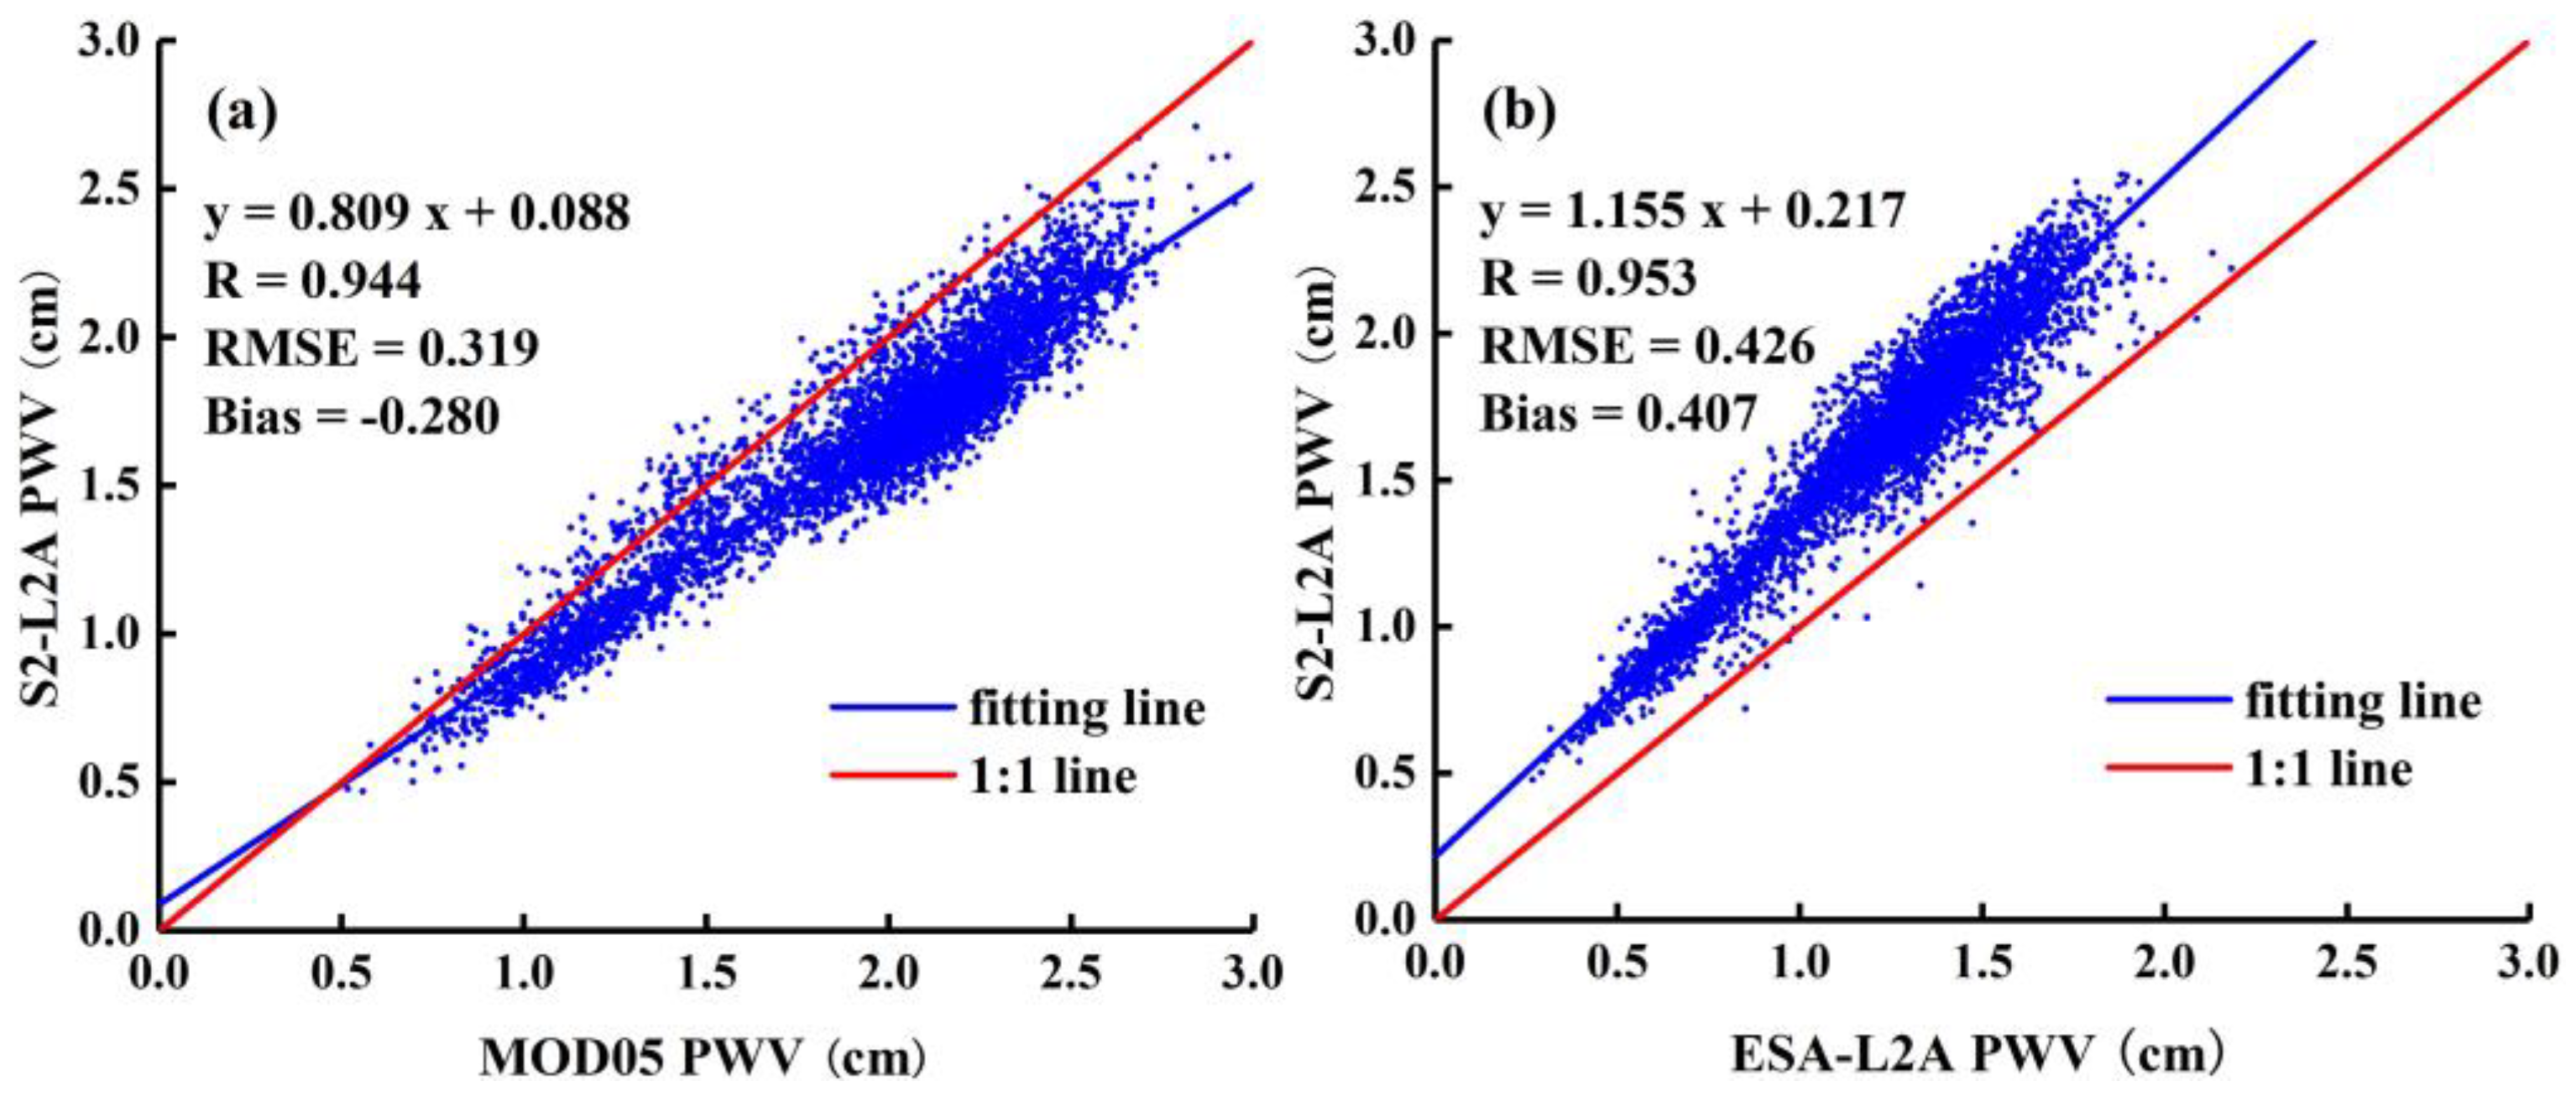
3.1.2. PWV Comparison of MOD05, ESA-L2A with S2-L2A

To verify the performance of the proposed method of PWV prediction over a large area, on 1 August 2021 24 Sentinel-2 images that covered an area of 185,000 km2 were selected. After calculating PWV for the whole region, the value was compared to the MOD05 and ESA-L2A products. Considering the scale effect among different products with different spatial resolutions, the spatial resolution of S2-L2A PWV was resampled to 1000 m to perform the comparison with MOD05. The scatterplots of S2-L2A PWV with MOD05 and ESA-L2A products are presented in Figure 3. The S2-L2A PWV shows high consistency with MOD05, reflected in its strong correlation (0.944), low RMSE (0.319 cm), and Bias (−0.280 cm). The Bias value was negative, meaning that the S2-L2A underestimated the PWV compared to the MOD05. The PWV of S2-L2A was higher than that of ESA-L2A, showing that the fitting line was much higher than the 1:1 line. Even so, the two products still showed good consistency, and the R, RMSE, and Bias values were 0.953, 0.426 cm, and 0.407 cm, respectively.
The statistical results of the three PWV products are presented in Table 3. The PWV data retrieved by S2-L2A (0.282–3.600 cm) were distributed over a larger range than MOD05 (0.484–3.549 cm), while the products of ESA-L2A (0.161–3.005 cm) were generally lower. The standard deviation of MOD05 was the largest, followed by S2-L2A and ESA-L2A, indicating that most of the PWV values obtained from MOD05 were different from the mean value, and that their distribution was the most discrete.

3.2. Validation of Time Series S2-L2A PWV

To study the temporal stability of the proposed algorithm, MOD05 and S2-L2A products from 11 days in 2020 were selected; the comparison results are shown in Figure 4. S2-L2A had a lower PWV value than MOD05, which was the same as the result in Section 3.1. As shown in Figure 4, there was a strong correlation between the two sets of PWV measurements. The R value ranged from 0.802 to 0.977, with a mean value of 0.862. The RMSE between S2-L2A and MOD05 PWV varied from 0.044 cm to 0.249 cm, with a mean value of 0.129 cm. The Bias value between S2-L2A and MOD05 PWV varied from −0.242 cm to 0.003 cm. Except for a positive Bias value on the last day, all other values were negative, indicating that S2-L2A underestimated PWV compared with MOD05. The results showed that all PWV data retrieved by S2-L2A had good agreement with MOD05, indicating that the algorithm provided an effective and accurate way to retrieve PWV.

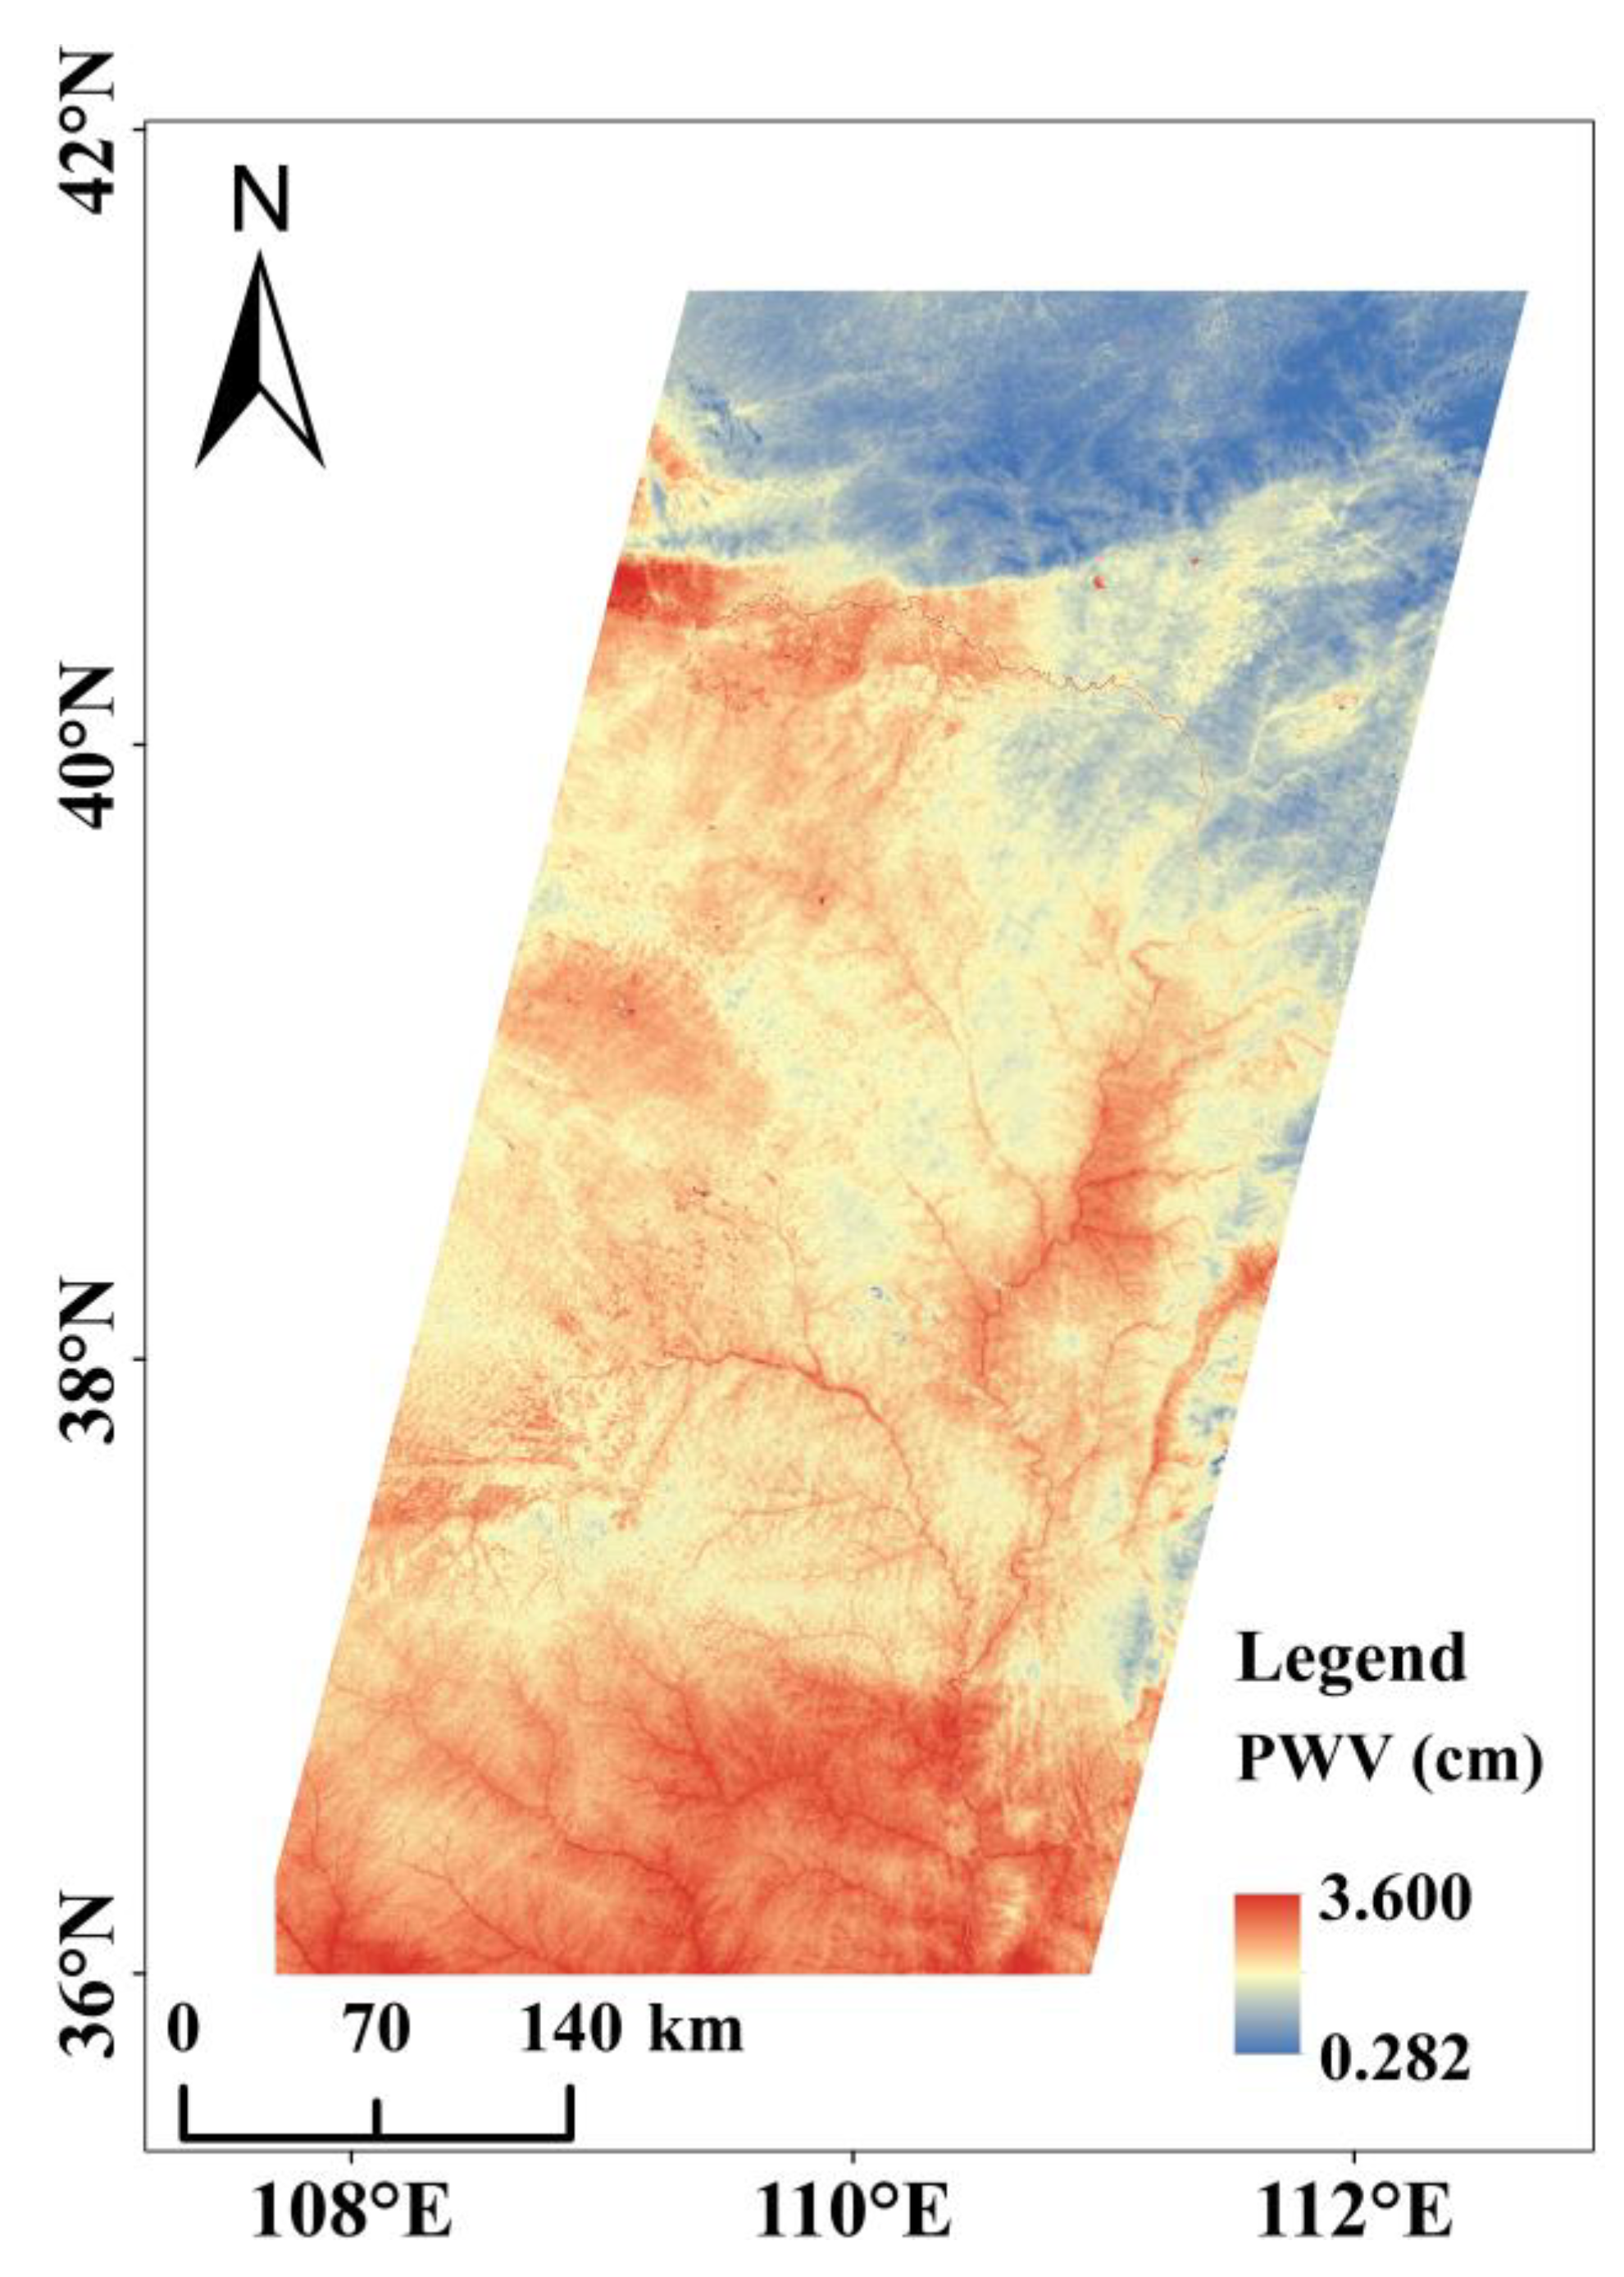
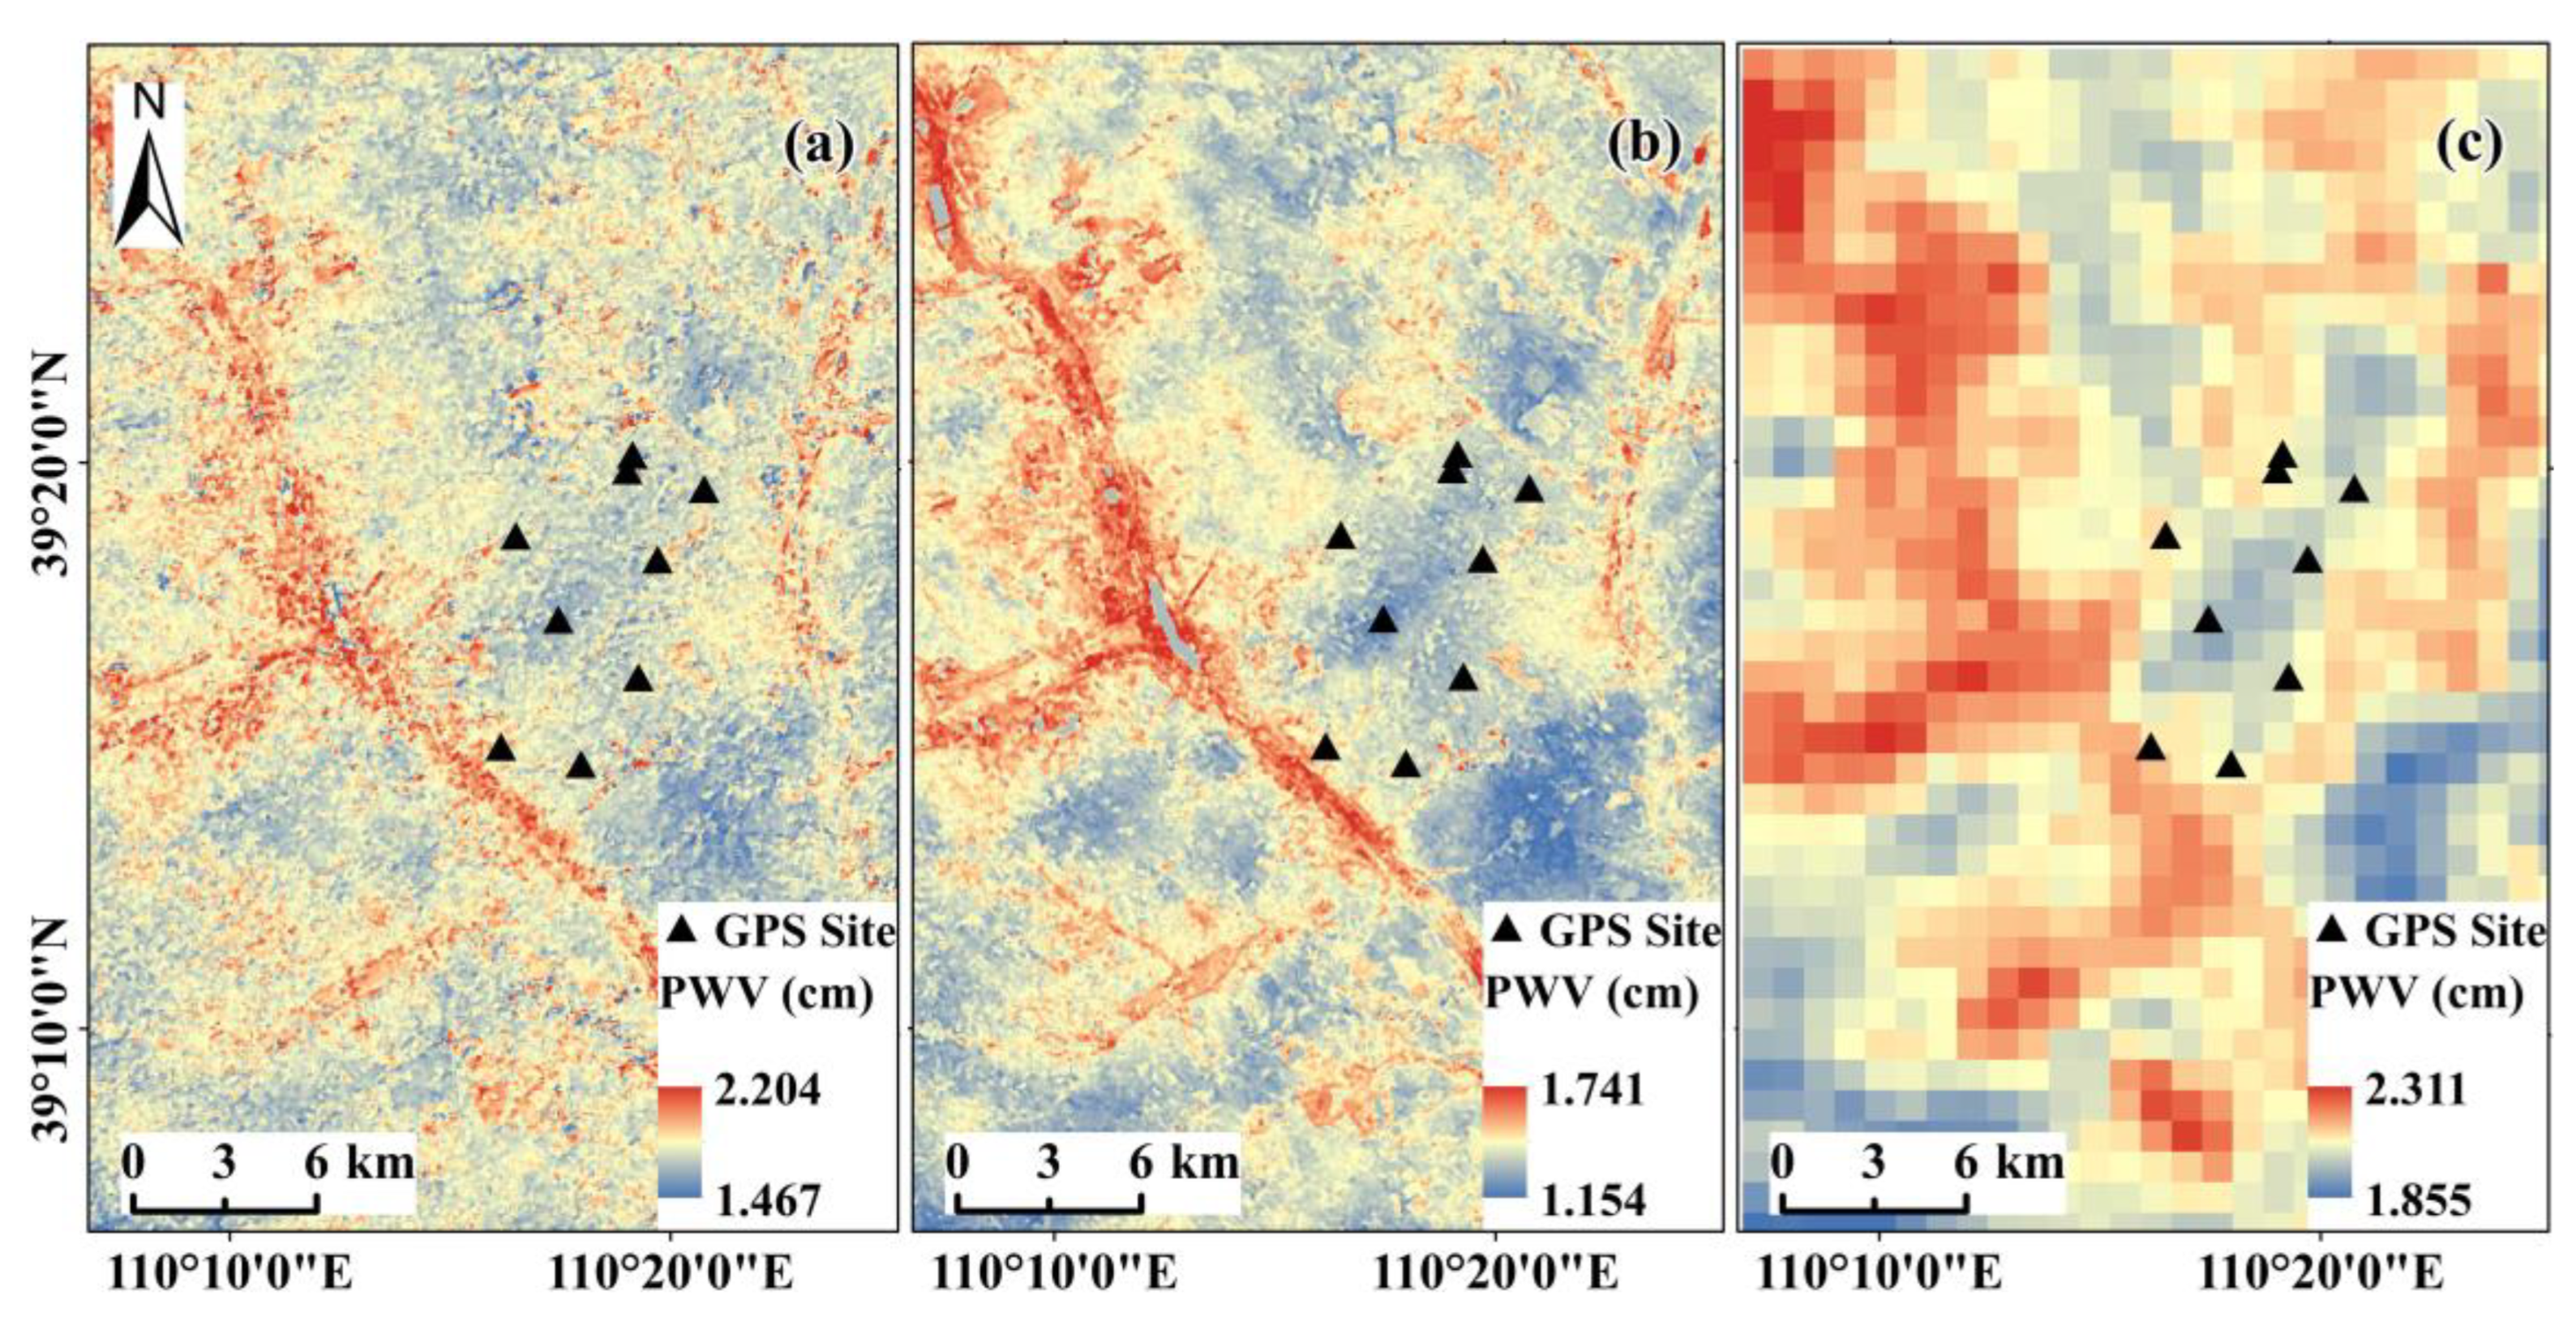
3.3. Spatial Distribution of S2-L2APWV

The PWV data retrieved from the 24 Sentinel-2 images are shown in Figure 5. The image coverage area had an extensive elevation range (391–2807 m), and the land-use types were complex, including forest land, grass land, cultivated land, construction land, and bare soil. The aggregation and movement of water vapor was observed, showing a gradual decrease from south to north. It should be noted that the PWV distribution map was closely related to land-use type and elevation. The relative PWV value among different land-use types was: bare soil > vegetation-covered area > construction land. This was because the satellite transit time was 11:25 a.m.; at this time, a large amount of water in the soil evaporated, and PWV increased significantly. The transpiration of vegetation was not the strongest, so the PWV value in the vegetation-covered area was second. There were fewer water vapor sources on construction land, so this area had the lowest PWV. Results indicated that with an increase in elevation, PWV generally decreased, which was consistent with the research conclusions of Cheng et al. [46] and Khaniani et al. [36]. This was because high-altitude areas had a certain barrier effect on PWV. Moreover, the atmospheric column shortened as elevation increased, and the water vapor content decreased in turn.

4. Discussion

4.1. Advantages of the Algorithm

PWV is an important variable that determines the dynamics of atmospheric motion. This study proposes a PWV retrieval method based on Sentinel-2 data, which can provide products with high accuracy, spatial continuity, and high spatial resolution. It can be seen from Section 3.1 that the PWV retrieved by S2-L2A was different from the products of MOD05 and ESA-L2A. The reasons for the differences between S2-L2A and MOD05 include the following points. First, MOD05 was calculated using apparent reflectance, while the proposed method used radiance. Second, MOD05 used the three-channel algorithm; that is, PWV was calculated from two atmospheric window channels and one water vapor absorption channel. In contrast, S2-L2A used only one atmospheric window channel and one water vapor absorption channel. Third, the transit times of the Sentinel-2 and MODIS differed by tens of minutes. Fourth, although the channels’ central wavelength of the Sentinel-2 was close to that of the MODIS, the channels of the Sentinel-2 were narrower and the spectral response functions were slightly different, as shown in Figure 6. The reason for the PWV difference between S2-L2A and ESA-L2A was that ESA-L2A did not distinguish land-cover types and constructed a global PWV inversion model. However, S2-L2A constructed the PWV inversion model considering land-cover types and aiming at local areas.
The GPS sites deployed on 1 August 2021, and parts of PWV retrieved from S2-L2A, ESA-L2A, and MOD05 are shown in Figure 7. The GPS sites were sparse and only monitored PWV values at a few locations, which could not provide full coverage inversion results. The PWV retrieved by S2-L2A and ESA-L2A had similar spatial distribution to MOD05 but provided more vital details. The spatial resolution of MOD05 was rather coarse, and only a limited number of PWV values could be detected. In addition, spatial variations in the S2-L2A and ESA-L2A PWV tended to be smoothly varying, which removed the mutation in the MOD05. Section 3.1 confirmed that the accuracy of S2-L2A PWV was better than those of MOD05 and ESA-L2A. In general, the spatial performance of S2-L2A PWV was better than that of the other three products.

4.2. Error Analysis of the Algorithm

Section 3 analyzed the overall accuracy of the PWV retrieved by S2-L2A. However, before applying remote sensing data, it is necessary to analyze the error distribution and its causes in different regions to determine whether the data can be used for quantitative analysis. Five factors (AOT, sensor zenith angle, solar zenith angle, elevation, and normalized difference vegetation index (NDVI)) were selected and divided into eight grades according to the natural breaks classification. RMSE between S2-L2A PWV and MOD05 at different grades was compared; the grading table is presented in Table 4. As shown in Figure 8a,b, there was no significant difference in RMSE among different grades of sensor zenith angle and solar zenith angle. Although the study area reaches 185,000 km2, the range of sensor zenith angle and solar zenith angle is small. Therefore, these two factors have little influence on the PWV results.
As shown in Figure 8a, the RMSE between S2-L2A and MOD05 PWV increased with AOT. This is because as the AOT value increased, the deviation of simulated path radiance increased, resulting in a higher PWV estimation error. It can be seen from Figure 8d that the RMSE between S2-L2A and MOD05 PWV decreased with elevation. This was because as elevation increased, the atmospheric column shortened and PWV reduced, so the corresponding error decreased. As shown in Figure 8e, the RMSE between S2-L2A and MOD05 PWV decreased as the NDVI value increased. In this study, standard plant and soil spectra were selected and mixed in different proportions to represent the spectra of varying vegetation coverage. The reflectance ratio of B9 and B8A is shown in Figure 9, where the horizontal axis represents the ratio of bare soil to plants, and vegetation coverage increases gradually from left to right. As shown in Figure 9, as vegetation coverage increased, the reflectance ratio changed from higher than one to lower than one, and the absolute values of ratios higher than one were generally larger than those of ratios lower than one. The proposed method was based on the equal reflectance of the atmospheric window channel and the water vapor absorption channel. Namely, when the reflectance ratio was higher than one, atmospheric transmittance was overestimated, resulting in an underestimation of the PWV value; but when the reflectance ratio was lower than one, transmittance was underestimated, resulting in an overestimated PWV value. Based on the results in Figure 9, when NDVI was low over sparsely vegetated regions, PWV was underestimated, but as the vegetation coverage increased, PWV changed from being underestimated to overestimated, and the degree of underestimation was generally larger than the degree of overestimation. MOD05 showed consistent overestimation. Therefore, the PWV inversion error decreased as the NDVI value increased. According to the above analysis, S2-L2A-retrieved PWV data is suited to PWV monitoring in a dense-vegetation region with high NDVI, but its accuracy in a barren-vegetation region with low NDVI needs further improvement.

4.3. The Transferability of the Proposed Method

The repeat cycle of Sentinel-2 satellites is five days, which means that PWV data cannot be retrieved using Sentinel-2 images on most days. Therefore, it is necessary to analyze the transferability of applying this method to other satellites to generate complementary PWV products. The key to PWV inversion is that the satellite sensor needs at least one water vapor absorption channel and an adjacent atmospheric window channel. GaoFen-5 (02) is one of the satellites of China’s GaoFen Special Project, and the multi-view polarization camera Directional Polarimetric Camera (DPC) is one of the main payloads. Since DPC has a water vapor absorption channel at 910 nm and an atmospheric window channel at 865 cm, the proposed method can be applied to PWV inversion with DPC. Zhuhai-1 is the first satellite constellation built and operated by a privately listed company in China. The hyperspectral satellite has a water vapor absorption channel (B32 centered at 940 nm) and an atmospheric window channel (B27 centered at 866 nm). The method presented in this paper can also be used to retrieve PWV with this satellite. In addition, this method works not only with high-resolution satellites, but also medium-resolution satellites, such as FY-3D MERSI-2, which has one atmospheric window channel (B4 centered at 865 nm) and three water vapor absorption channels (B16 centered at 905 nm, B17 centered at 936 nm and B18 centered at 940 nm, respectively). Each water vapor absorption channel has a different sensitivity to the same atmospheric conditions. For example, B16 is most sensitive to humid conditions due to its weak absorption, while B17 has strong absorption and is most sensitive to dry conditions [37]. Depending on the study area’s characteristics, different channel ratios can be selected, or the PWV of the three channel ratios can be weighted and summed to obtain comprehensive results.

5. Conclusions

This study presents a method for retrieving Level 2A PWV data from Sentinel-2 images (S2-L2A), which considers land-cover types and is more suitable for local areas. First, the theoretical basis of retrieving PWV from remote sensing images is presented, and lookup tables (LUTs) for PWV retrieval are constructed. Second, the accuracy of the S2-L2A PWV data is validated using the PWV data obtained from the GPS, MOD05, and ESA-L2A. Third, the spatial distribution features of S2-L2A PWV are analyzed. The results show that the PWV retrieved by S2-L2A has a strong correlation and low bias with the three PWV products, and is closer to the reference data than the MOD05 and ESA-L2A PWV. PWV data distribution is affected by land-use type and elevation, and it shows obvious aggregation and gradual change. The relative PWV value in the morning is: bare soil > vegetation-covered area > construction land; however, as elevation increases, the PWV value tends to decrease. In addition, inversion error increases with AOT value, but decreases with elevation and NDVI. The proposed algorithm can provide PWV data with a high spatial resolution for various applications, such as climate change, hydrologic cycle, and so on in various regions.

Author Contributions

Conceptualization, Y.Z.; Formal analysis, Y.Z.; Funding acquisition, S.L.; Investigation, Y.Z., G.Z., Y.S., C.W., Y.L., Z.S. and W.W.; Methodology, Y.Z.; Project administration, S.L.; Supervision, S.L.; Validation, S.L.; Writing—original draft, Y.Z.; Writing—review & editing, S.L. All authors have read and agreed to the published version of the manuscript.

Funding

This research was funded by Green exploitation of coal resources and its environmental effects in Xinjiang (U1903209) and Major projects of Ordos scientific and technological cooperation (2021EEDSCXQDFZ010).

Acknowledgments

We would like to thank Yangnan Guo and Kunlei Wang for their help with the data collection process. The authors greatly appreciate the anonymous reviewers’ excellent comments in improving the manuscript quality.

Conflicts of Interest

The authors declare no conflict of interest.

References

  1. Solomon, S.; Rosenlof, K.H.; Portmann, R.W.; Daniel, J.S.; Davis, S.M.; Sanford, T.J.; Plattner, G. Contributions of stratospheric water vapor to decadal changes in the rate of global warming. Science 2010, 327, 1219–1223. [Google Scholar] [CrossRef] [Green Version]
  2. Lovell-Smith, J.W.; Feistel, R.; Harvey, A.H.; Hellmuth, O.; Bell, S.A.; Heinonen, M.; Cooper, J.R. Metrological challenges for measurements of key climatological observables. Part 4: Atmospheric relative humidity. Metrologia 2015, 53, R40. [Google Scholar] [CrossRef]
  3. Li, X.; Zhang, L.; Cao, X.; Quan, J.; Wang, T.; Liang, J.; Shi, J. Retrieval of precipitable water vapor using MFRSR and comparison with other multisensors over the semi-arid area of northwest China. Atmos. Res 2016, 172, 83–94. [Google Scholar] [CrossRef]
  4. Held, I.M.; Soden, B.J. Water vapor feedback and global warming. Annu. Rev. Energy Environ. 2000, 25, 441–475. [Google Scholar] [CrossRef] [Green Version]
  5. Trenberth, K.E.; Fasullo, J.; Smith, L. Trends and variability in column-integrated atmospheric water vapor. Clim. Dyn 2005, 24, 741–758. [Google Scholar] [CrossRef]
  6. Karl, T.R.; Trenberth, K.E. Modern global climate change. Science 2003, 302, 1719–1723. [Google Scholar] [CrossRef] [Green Version]
  7. He, J.; Liu, Z. Comparison of satellite-derived precipitable water vapor through near-infrared remote sensing channels. IEEE Trans. Geosci. Remote Sens. 2019, 57, 10252–10262. [Google Scholar] [CrossRef]
  8. Yang, L.; Kong, J.; Wang, Y.; Li, J.; Zhang, W. Research on remote sensing retrieval of atmospheric water vapor content in arid region. Sci. Surv. Mapp. 2020, 45, 95–100. [Google Scholar]
  9. Pérez Ramírez, D.; Whiteman, D.N.; Smirnov, A.; Lyamani, H.; Holben, B.N.; Pinker, R.; Andrade, M.; Alados Arboledas, L. Evaluation of AERONET precipitable water vapor versus microwave radiometry, GPS, and radiosondes at ARM sites. J. Geophys. Res. Atmos. 2014, 119, 9596–9613. [Google Scholar] [CrossRef] [Green Version]
  10. Wang, J.; Dai, A.; Mears, C. Global water vapor trend from 1988 to 2011 and its diurnal asymmetry based on GPS, radiosonde, and microwave satellite measurements. J. Clim 2016, 29, 5205–5222. [Google Scholar] [CrossRef]
  11. Park, C.; Roh, K.; Cho, J. Radiosonde sensors bias in precipitable water vapor from comparisons with global positioning system measurements. J. Astron. Space Sci. 2012, 29, 295–303. [Google Scholar] [CrossRef] [Green Version]
  12. Wang, Y.; Liu, Y.; Li, J.; Liu, L. The Correlation Between the Variation of PM2.5/PM10 and Precipitable Water Vapor Based on GPS and Radiosonde. Geomat. Inf. Sci. Wuhan Univ. 2016, 41, 1626–1631. [Google Scholar]
  13. Liu, H.; Tang, S.; Zhang, S.; Hu, J. Evaluation of MODIS water vapour products over China using radiosonde data. Int. J. Remote Sens. 2015, 36, 680–690. [Google Scholar] [CrossRef]
  14. Ccoica-López, K.L.; Pasapera-Gonzales, J.J.; Jimenez, J.C. Spatio-temporal variability of the precipitable water vapor over Peru through MODIS and ERA-Interim time series. Atmosphere 2019, 10, 192. [Google Scholar] [CrossRef] [Green Version]
  15. Bevis, M.; Businger, S.; Chiswell, S.; Herring, T.A.; Anthes, R.A.; Rocken, C.; Ware, R.H. GPS meteorology: Mapping zenith wet delays onto precipitable water. J. Appl. Meteorol. (1988–2005) 1994, 33, 379–386. [Google Scholar] [CrossRef]
  16. Bevis, M.; Businger, S.; Herring, T.A.; Rocken, C.; Anthes, R.A.; Ware, R.H. GPS meteorology: Remote sensing of atmospheric water vapor using the global positioning system. J. Geophys. Res. Atmos. 1992, 97, 15787–15801. [Google Scholar] [CrossRef]
  17. Xu, J.; Liu, Z. A Linear Regression of Differential PWV Calibration Model to Improve the Accuracy of MODIS NIR All-Weather PWV Products Based on Ground-Based GPS PWV Data. IEEE J. Sel. Top. Appl. Earth Observ. Remote Sens 2022, 15, 7929–7951. [Google Scholar] [CrossRef]
  18. Niell, A.E.; Coster, A.J.; Solheim, F.S.; Mendes, V.B.; Toor, P.C.; Langley, R.B.; Upham, C.A. Comparison of measurements of atmospheric wet delay by radiosonde, water vapor radiometer, GPS, and VLBI. J. Atmos. Ocean. Technol. 2001, 18, 830–850. [Google Scholar] [CrossRef]
  19. Li, C.; Huang, Q.; Qin, Z. Comparison of Water Vapor Content Product Retrieved by CE-318 Sun-photometer, Radiosonde Data and MODIS Near Infrared Data. J. Geo-Inf. Sci. 2017, 19, 994–1000. [Google Scholar]
  20. Gong, S. Evaluation of maritime aerosol optical depth and precipitable water vapor content from the Microtops II Sun photometer. Optik 2018, 169, 1–7. [Google Scholar] [CrossRef]
  21. Torres, B.; Cachorro, V.E.; Toledano, C.; Ortiz De Galisteo, J.P.; Berjón, A.; De Frutos, A.M.; Bennouna, Y.; Laulainen, N. Precipitable water vapor characterization in the Gulf of Cadiz region (southwestern Spain) based on Sun photometer, GPS, and radiosonde data. J. Geophys. Res. Atmos. 2010, 115. [Google Scholar] [CrossRef] [Green Version]
  22. Xu, Q.; Li, X.; Li, C.; Hu, H. Retrieval of Atmospherical Aerosol Optical Depths and Precipitable Water from Ground-based Extinction Measurements in Beijing Area. Chin. J. Process Eng. 2006, 6, 20–24. [Google Scholar]
  23. Bennartz, R.; Fischer, J. Retrieval of columnar water vapour over land from backscattered solar radiation using the Medium Resolution Imaging Spectrometer. Remote Sens. Environ. 2001, 78, 274–283. [Google Scholar] [CrossRef]
  24. Wang, X.; Zhao, D.; Su, X.; Yang, J.; Ma, Y. Retrieving precipitable water vapor based on FY-3A near-IR data. J. Infrared Millim. Waves 2012, 31, 550–555. [Google Scholar] [CrossRef]
  25. Gao, B.; Kaufman, Y.J. Water vapor retrievals using Moderate Resolution Imaging Spectroradiometer (MODIS) near-infrared channels. J. Geophys. Res. Atmos. 2003, 108, 4389. [Google Scholar] [CrossRef]
  26. Liu, H.; Tang, S.; Hu, J.; Zhang, S.; Deng, X. An improved physical split-window algorithm for precipitable water vapor retrieval exploiting the water vapor channel observations. Remote Sens. Environ. 2017, 194, 366–378. [Google Scholar] [CrossRef]
  27. Moradizadeh, M.; Momeni, M.; Saradjian, M.R. Estimation and validation of atmospheric water vapor content using a MODIS NIR band ratio technique based on AIRS water vapor products. Arab. J. Geosci. 2014, 7, 1891–1897. [Google Scholar] [CrossRef]
  28. Li, X.; Long, D. An improvement in accuracy and spatiotemporal continuity of the MODIS precipitable water vapor product based on a data fusion approach. Remote Sens. Environ. 2020, 248, 111966. [Google Scholar] [CrossRef]
  29. Kaufman, Y.J.; Gao, B. Remote sensing of water vapor in the near IR from EOS/MODIS. IEEE Trans. Geosci. Remote Sens. 1992, 30, 871–884. [Google Scholar] [CrossRef]
  30. He, J.; Liu, Z. Water vapor retrieval from MODIS NIR channels using ground-based GPS data. IEEE Trans. Geosci. Remote Sens. 2020, 58, 3726–3737. [Google Scholar] [CrossRef]
  31. Hu, J.; Tang, S.; Liu, H.; Zheng, J. Production and validation of FY-3C VIRR total precipitable water products. J. Remote Sens. 2017, 21, 842–852. [Google Scholar]
  32. Shi, F.; Xin, J.; Yang, L.; Cong, Z.; Liu, R.; Ma, Y.; Wang, Y.; Lu, X.; Zhao, L. The first validation of the precipitable water vapor of multisensor satellites over the typical regions in China. Remote Sens. Environ. 2018, 206, 107–122. [Google Scholar] [CrossRef]
  33. Zhao, Q.; Du, Z.; Yao, W.; Yao, Y. The MERSI/FY-3A PWV correction method based on GNSS. Acta Geod. Cartogr. Sin. 2022, 51, 159–168. [Google Scholar]
  34. He, J.; Liu, Z. Water vapor retrieval from MERSI NIR channels of Fengyun-3B satellite using ground-based GPS data. Remote Sens. Environ. 2021, 258, 112384. [Google Scholar] [CrossRef]
  35. Bennouna, Y.S.; Torres, B.; Cachorro, V.E.; Ortiz De Galisteo, J.P.; Toledano, C. The evaluation of the integrated water vapour annual cycle over the Iberian Peninsula from EOS-MODIS against different ground-based techniques. Q. J. R. Meteorol. Soc 2013, 139, 1935–1956. [Google Scholar] [CrossRef]
  36. Khaniani, A.S.; Nikraftar, Z.; Zakeri, S. Evaluation of MODIS Near-IR water vapor product over Iran using ground-based GPS measurements. Atmos. Res. 2020, 231, 104657. [Google Scholar] [CrossRef]
  37. Abbasi, B.; Qin, Z.; Du, W.; Fan, J.; Zhao, C.; Hang, Q.; Zhao, S.; Li, S. An Algorithm to Retrieve Total Precipitable Water Vapor in the Atmosphere from FengYun 3D Medium Resolution Spectral Imager 2 (FY-3D MERSI-2) Data. Remote Sens. 2020, 12, 3469. [Google Scholar] [CrossRef]
  38. Liu, T.; Zhao, Z.; Shi, T. An Extraction Method of Plastic Greenhouse Based on Sentinel-2. Agric. Eng. 2021, 11, 91–98. [Google Scholar]
  39. Djamai, N.; Fernandes, R. Comparison of SNAP-derived Sentinel-2A L2A product to ESA product over Europe. Remote Sens. 2018, 10, 926. [Google Scholar] [CrossRef] [Green Version]
  40. Obregón, M.Á.; Rodrigues, G.; Costa, M.J.; Potes, M.; Silva, A.M. Validation of ESA Sentinel-2 L2A aerosol optical thickness and columnar water vapour during 2017–2018. Remote Sens. 2019, 11, 1649. [Google Scholar] [CrossRef] [Green Version]
  41. Makarau, A.; Richter, R.; Schläpfer, D.; Reinartz, P. APDA water vapor retrieval validation for Sentinel-2 imagery. IEEE Geosci. Remote Sens. Lett. 2016, 14, 227–231. [Google Scholar] [CrossRef]
  42. Zhang, T.; Wei, J.; Gan, J.; Zhu, Q.; Yang, D. Precipitable Water Vapor Retrieval with MODIS Near Infrared Data. Spectrosc. Spectr. Anal. 2016, 36, 2378–2383. [Google Scholar]
  43. Gao, B.; Kaufman, Y.J. The MODIS Near-IR Water Vapor Algorithm: Product ID: MOD05-Total Precipitable Water; Algorithm Technical Background Document, Remote Sensing Division, Code 7212; Naval Research Laboratory: Washington, DC, USA, 1998. [Google Scholar]
  44. Zhang, J.; Yu, X.; Lv, H.; Zhu, J. Analysis of Atmospheric Precipitable Water Vapor over Wuhan Based on MODIS Data in Recent Ten Years. Acta Photonica Sin. 2014, 43, 108–113. [Google Scholar]
  45. Zhang, W.; Zhang, S.; Zheng, N.; Ding, N.; Liu, X.; Ma, P. Tightly coupled water vapor tomography algorithm for combining GNSS and MODIS signals. Acta Geod. Cartogr. Sin. 2021, 50, 496–508. [Google Scholar]
  46. Cheng, H.; Liang, F.; Li, S.; Lin, Y. Spatial clustering analysis of atmospheric precipitable water in the Tianshan Mountains. Remote Sens. Nat. Resour. 2017, 29, 116–121. [Google Scholar]
Figure 1. Geographic location of the study area. (a) The location of the study area in China, (b) Sentinel-2A image and RGB color composition using B4, B3, B2.
Remotesensing 15 01201 g001
Figure 2. An example of the relationship between transmittance and PWV. (a) Mid-latitude summer, (b) Mid-latitude winter.
Remotesensing 15 01201 g002
Figure 3. Scatterplots of PWV retrieved by S2-L2A versus PWV estimated from (a) MOD05 and (b) ESA-L2A.
Remotesensing 15 01201 g003
Figure 4. Comparison of PWV time series between S2-L2A and MOD05.
Remotesensing 15 01201 g004
Figure 5. PWV inversion results of the 24 Sentinel-2 images.
Remotesensing 15 01201 g005
Figure 6. Spectral response functions of Sentinel-2 and MODIS PWV retrieval channels. (a) atmospheric window channel, (b) water vapor absorption channel.
Remotesensing 15 01201 g006
Figure 7. GPS site deployed on 1 August 2021, and parts of PWV retrieved from (a) S2-L2A, (b) ESA-L2A, and (c) MOD05.
Remotesensing 15 01201 g007
Figure 8. RMSE between S2-L2A PWV and MOD05 at different grades of (a) AOT, (b) sensor zenith angle, (c) solar zenith angle, (d) elevation, and (e) NDVI.
Remotesensing 15 01201 g008
Figure 9. The reflectance ratios of B9/B8A mixed with bare soil and plants in different proportions.
Remotesensing 15 01201 g009
Table 1. Important input parameters of MODTRAN 5.
ParameterValueInstruction
MODEL2, 3Mid-Latitude Summer (MLS), Mid-Latitude Winter (MLW)
ITYPE2Vertical path between two altitudes
IEMSCT2Radiance/scattering model
TPTEMP298.15Temperature (Kelvins)
IMULT1Multiple scattering
VISIBILITY10–200, step 20Visibility (km), corresponding to an aerosol optical thickness of 0.70–0.05 at 550 nm
CSALB1, 2, 3, 4, 7spectral albedo curve (snow cover, forest, farm, desert, old grass)
H2OSTR0.2–5.0, step 0.2Defined column water vapor value (g/cm2)
LLFLTNMSentinel2.fltSpectral response function of Sentinel-2
IHAZE1RURAL extinction, default VIS = 23 km
H1786Sensor Altitude (km)
H20–3.0, step 0.5Ground Elevation (km)
ANGLE164–180, step 4Sensor zenith angle (°)
PARM10–180, step 30Relative azimuth angle (°)
PARM220–60, step 10Solar zenith angle (°)
Table 2. Comparison of various PWV products.
PWVRRMSE (cm)Bias (cm)
S2-L2A0.9290.114−0.005
MOD050.9470.3430.292
ESA-L2A0.9080.346−0.319
Table 3. Statistical results (unit: cm) of PWV retrieved from S2-L2A, MOD05, and ESA-L2A.
PWVMaximumMinimumMeanStandard Deviation
S2-L2A3.6000.2821.6490.391
MOD053.5490.4841.9310.450
ESA-L2A3.0050.1611.2310.314
Table 4. Grading table of AOT, sensor zenith angle, solar zenith angle, elevation, and NDVI.
LevelAOTSensor Zenith Angle (°)Solar Zenith Angle (°)Elevation (m)NDVI
10.050–0.064167.822–169.32723.062–23.979391–9120–0.173
20.064–0.079169.327–170.58023.979–24.569912–10740.173–0.249
30.079–0.099170.580–171.87524.569–25.1181074–12000.249–0.325
40.099–0.115171.875–173.25325.118–25.6471200–13160.325–0.412
50.115–0.133173.253–174.63125.647–26.1771316–14390.412–0.505
60.133–0.151174.631–176.01026.177–26.7261439–15830.505–0.602
70.151–0.160176.010–177.34626.726–27.3161583–17800.602–0.703
80.160–0.183177.346–178.51627.316–28.2731780–28070.703–0.884
Disclaimer/Publisher’s Note: The statements, opinions and data contained in all publications are solely those of the individual author(s) and contributor(s) and not of MDPI and/or the editor(s). MDPI and/or the editor(s) disclaim responsibility for any injury to people or property resulting from any ideas, methods, instructions or products referred to in the content.

