Article

Characterization of Bias in Fengyun-4B/AGRI Infrared Observations Using RTTOV

National Meteorological Information Centre, Beijing 100081, China
*
Author to whom correspondence should be addressed.
Remote Sens. 2023, 15(5), 1224; https://doi.org/10.3390/rs15051224
Submission received: 3 February 2023 / Revised: 21 February 2023 / Accepted: 21 February 2023 / Published: 22 February 2023
(This article belongs to the Special Issue Advances in Infrared Observation of Earth’s Atmosphere II)

Abstract

:
As China’s first operational second-generation geostationary satellite, Fengyun-4B carries the newly developed Advanced Geostationary Radiation Imager (AGRI), which adds a low-level water vapor detection channel and an adjusted spectrum range of four channels to improve the quality of observation. To characterize biases of the infrared (IR) channels of Fengyun-4B/AGRI, RTTOV was applied to simulate the brightness temperature of the IR channels during the period of Fengyun-4B trial operation (from June to November 2022) under clear-sky conditions based on ERA5 reanalysis, which may provide beneficial information for the operational applications of Fengyun-4B/AGRI, such as data assimilation and severe weather monitoring. The results are as follows: (1) due to the sun’s influence on the satellite instrument, the brightness temperature observations of the Fengyun-4B/AGRI 3.75 μm channel were abnormally high around 1500 UTC in October, although the data producer made efforts to eliminate abnormal data; (2) the RTTOV simulations were in good agreement with the observations, and the absolute mean biases of the RTTOV simulations were less than 1.39 K over the ocean, and less than 1.77 K over land, for all IR channels under clear-sky conditions, respectively; (3) for the variation of spatial distribution bias over land, channels 12–15 were more obvious than channels 9–11, which indicates that the skin temperature of ERA-5 reanalysis and surface emissivity may have greater spatial uncertainty than the water vapor profile; (4) the biases and standard deviations of Fengyun-4B/AGRI channels 9–15 had negligible dependence on the satellite zenith angles over the ocean, while the standard deviation of channels 8 and 12 had a positive correlation with satellite zenith angles when the satellite zenith angles were larger than 30°; and (5) the biases and standard deviations of Fengyun-4B/AGRI IR channels showed scene brightness temperature dependence over the ocean.

1. Introduction

As China’s first operational second-generation geostationary satellite, Fengyun-4B was launched on 3 June 2021, and after 1 year of in-orbit testing, it entered trial operation status on 1 June 2022, positioned at 133°E above the equator [1,2]. Fengyun-4B carries four instruments, including the newly developed Advanced Geosynchronous Radiation Imager (AGRI), the newly developed Geostationary Interferometric Infrared Sounder (GIIRS), the Geo High-speed Imager (GHI) and the Space Environment Monitoring Instrument Package (SEP). As one of the primary payloads, Fengyun-4B/AGRI has 15 channels, including 3 visible (VIS) channels, 3 near-infrared (NIR) channels, 2 mid-wave infrared (IR) channels, 3 water vapor channels and 4 long-wave IR channels. As the successor to Fengyun-4A/AGRI, Fengyun-4B/AGRI adds a 7.42 μm channel to detect low-level water vapor and adjusted spectrum range of 1.379 μm, 6.95 μm, 8.55 μm and 13.3 μm, which may provide better observation for data assimilation and weather monitoring.
The observations of geostationary imagers can be used to produce quantitative retrieval products [3], such as land surface temperature [4,5,6], quantitative precipitation estimation [7,8,9] and cloud top height [10,11], which are essential in severe weather monitoring and warning. Another important application of geostationary imager observations is assimilating the radiance of IR channels into Numerical Weather Prediction (NWP) system to improve the accuracy of prediction. Wang et al. [12] assimilated the radiance of Himawari-8/AHI water vapor channels at convective scales, and found improvement in not only analyses and forecasts of wind and humidity fields, but also the horizontal and vertical distribution of features in the humidity fields after assimilation. Niu et al. [13] achieved the direct assimilation of Fengyun-4A/AGRI water vapor channels, indicating the improvement of the quantitative precipitation forecasts of a Meiyu rainfall event. Other studies [14,15,16,17] have also demonstrated the positive impact of IR radiance assimilation on humidity and precipitation forecasts.
For quantitative retrieval and data assimilation, it is essential to analyze the characterization of bias in geosynchronous imager observations. A commonly used approach is comparing the observations with the simulations of a radiative transfer model using NWP product as input. Lu et al. [18] compared the radiance of the Fengyun satellite instruments with those simulated from the operational global NWP field using the radiative transfer model and monitor the performance of the satellite instruments. Zou et al. [19] analyzed the characterization of bias in Himawari-8/AHI based on the Community Radiative Transfer Model (CRTM) and the Radiative Transfer for TIROS Operational Vertical Sounder (RTTOV). Tang et al. [20] applied the Advanced Radiative Transfer Modeling System (ARMS) to characterize the performance of Fengyun–4A/AGRI. Another commonly used approach is to compare the observations of a geosynchronous imager with another imager or hyperspectral infrared sounder. Xie et al. [21] performed a cross-comparison of radiation response characteristics between FY-4B/AGRI and GK-2A/AMI. He et al. [22] compared the observations of FY-4A/AGRI thermal IR channels with two hyperspectral infrared sounders.
Although the bias characteristics of Fengyun-4A/AGRI IR channels have been analyzed by researchers [20,23], the characteristics of Fengyun-4B/AGRI and Fengyun-4A/AGRI are not exactly the same, which means that it is important to analyze the characteristics of bias in Fengyun-4B/AGRI IR channels to promote data assimilation. To date, no publications have compared the brightness temperature of Fengyun-4B/AGRI IR channels using radiative transfer model simulation. In this study, RTTOV is used to simulate the brightness temperature of Fengyun-4B/AGRI IR channels under clear-sky conditions based on ERA-5 reanalysis, and characterizations of bias between brightness temperature observation and the RTTOV simulation are preliminarily analyzed, which can be used as preparation for assimilating Fengyun-4B/AGRI observations into a NWP system. Furthermore, after 6 months of trial operation, Fengyun-4B become officially operational on 1 December 2022, and by characterizing bias in Fengyun-4B/AGRI IR channels in the period of trial operation, beneficial information can be provided for the operational application of Fengyun-4B/AGRI.
This paper is organized as follows: Section 2 introduces the characteristics of the Fengyun-4B/AGRI instrument and data (including L1 and cloud mask product). Section 2 also introduces RTTOV, which is one of the most commonly used fast radiative transfer models, and the simulation strategy for the Fengyun-4B/AGRI IR channels, including the quality control method and input variables for RTTOV. Section 3 demonstrates the quality problem existing in Fengyun-4B/AGRI channel 8, and details the biases and standard deviations of the Fengyun-4B/AGRI IR channels over ocean and land, as well as their dependence on the satellite scan angles and scene temperature. Discussions and conclusions are provided in Section 4 and Section 5, respectively.

2. Data, Model and Simulation Strategy

2.1. Fengyun-4B/AGRI Instrument

Fengyun-4B is the first operational China’s second-generation geostationary satellite, located at 133°E above the equator. Fengyun-4B carries four instruments, including a newly developed AGRI, and the characteristics of Fengyun-4B/AGRI are shown in Table 1, including central wavelength, wavelength range, spatial resolution, NEdT and primary application of each channel. Channels 1–3 are visible channels, and the spatial resolutions are 0.5 km for channel 1 and 1 km for channels 2–3, respectively. Channels 4–6 are NIR channels, with a spatial resolution of 2 km. Channels 7–8 are mid-wave IR channels. Channels 9–11 are water vapor channels, which are designed to be sensitive to the water vapor of different troposphere levels. Channels 12–14 are long-wave IR channels, which can be used to identify cloud pixels, and the brightness temperature observations of channels 13–14 are often used to produce land temperature products based on a split-window algorithm [24]. Channel 15 is also a long-wave IR channel, which is affected by carbon dioxide in the troposphere. In this study, we only focus on the Fengyun-4B/AGRI IR channels 8–15.
Figure 1 shows the Jacobians of Fengyun-4B/AGRI IR channels for temperature and water vapor using the U.S. standard atmospheric profile as the input. The vertical distribution of the Jacobians represents the contribution of temperature and water vapor in each layer to the Fengyun-4B/AGRI IR channels’ brightness temperature. As shown in Figure 1a, the Jacobian peaks of channels 8, 12, 13, 14 and 15 for temperature are located near Earth’s surface, which means that the observations of these channels mainly reflect the information of atmospheric radiation on land surface and the observations of these channels can be used to retrieve land surface temperature and sea surface temperature. The Jacobian peaks of channel 9 and 10 for temperature are located between 350 hPa and 450 hPa, reflecting the atmospheric radiation between 350 and 450 hPa. Channels 9–11 are sensitive to water vapor, as shown in Figure 1b. Channels 9 and 10 mainly reflect upper-level and mid-level water vapor information, and the Jacobian peaks of these channels for water vapor are distributed between 100 hPa and 600 hPa, while the Jacobian peaks of channel 11 are mainly distributed between 250 hPa and 800 hPa. The observations of Fengyun-4B/AGRI IR channels can be used to monitor changes of water vapor in the atmosphere and land surface temperature, which can help improve the accuracy of short-range weather forecasts.

2.2. Fengyun-4B/AGRI Data

In this study, we used a 4 km spatial resolution, full-disk Fengyun-4B/AGRI L1 geometry and cloud mask product [25], which was released to the public by the National Satellite Meteorological Center (NSMC) on 1 June 2022. Fengyun-4B/AGRI L1 and the geometry data are released in HDF format after radiometric calibration and geolocation process, and the cloud mask product is released in NETCDF format. The Fengyun-4B/AGRI geometry product includes the satellite azimuth angle, satellite zenith angle, solar azimuth angle and solar zenith angle, which are used as input for RTTOV. The Fengyun-4B cloud mask product is used to identify clear-sky pixels.

2.3. Fast Radiative Transfer Model

Satellite observations make crucial contributions to the accuracy of the NWP systems. To achieve satellite observation assimilation, fast radiative transfer model was developed as an observation operator, which has become one of the essential components in the NWP systems [26]. The fast radiative transfer model uses the NWP atmospheric profile and surface variables as input and produces the brightness temperature simulations of the satellite instruments as output. Before a new satellite observation is assimilated into the NWP systems, its bias characteristics should be analyzed by comparing the observation and simulation of a fast radiative transfer model.
RTTOV is one of the most commonly used fast radiative transfer models, developed by the European Centre for Medium-Range Weather Forecasts (ECMWF) and widely used in satellite data assimilation operations. RTTOV was launched in the 1990s, firstly designed to simulate the microwave brightness temperature of the TIROS Operational Vertical Sounder (TOVS), and after more than 20 years’ development, its simulation capacity has expanded to major satellite instruments, including VIS, IR and microwave [27]. In this paper, RTTOV v13.1 was used to simulate the clear-sky brightness temperature of the Fengyun-4B/AGRI IR channels.

2.4. Simulation Strategy for Fengyun-4B/AGRI IR Channels

Due to the uncertainty of the radiative transfer model in the cloud region and large deformation when the satellite zenith is above 60° [28], only the brightness temperature of clear-sky pixels with satellite zenith angles less than 60° are simulated and assessed, which can be identified based on Fengyun-4B geometry and cloud mask product. In this paper, the brightness temperature of the Fengyun-4B/AGRI 4 km-resolution IR channels 8–15 under clear-sky conditions were simulated using RTTOV.
Table 2 shows the input variables for RTTOV, including atmosphere variables, surface variables, geometry data and static data. Atmosphere and surface variables were obtained from ERA5 reanalysis. ERA5 is the latest reanalysis dataset released by ECMWF with a resolution of 0.25° [29]. By using the four-dimensional variational assimilation method, ERA5 can provide hourly atmosphere and surface analysis, up to 1 hPa. Geometry data were provided by NSMC, including latitude, longitude, solar zenith angle, solar azimuth angle, satellite zenith angle and satellite azimuth angle for every pixel. Although RTTOV can calculate land surface emissivity within the model, Zhuge et al. [30] indicate that the High Spectral Resolution Emissivity (CAMEL_HSRemis) [31] dataset may have better accuracy, especially over desert. Therefore, we calculated the land surface emissivity of Fengyun-4B/AGRI IR channels based on the CAMEL_HSRemis dataset, and the result of the calculations served as input for RTTOV. Ocean surface emissivity was calculated within RTTOV [32,33]. Surface type input was calculated based on MODIS land cover product (MCD12C1) [34], and defined every pixel as land type or ocean type, which determined whether to use land or ocean surface emissivity in RTTOV.
Since we only focused on the bias characters under clear-sky conditions, the Fengyun-4B cloud mask product was used to identify clear-sky pixels. The Fengyun-4B cloud mask product divides pixel condition into four categories: cloudy, probably cloudy, probably clear and clear, and only pixels flagged as clear were considered in this study. Spatial distribution of clear-sky Fengyun-4B/AGRI pixel counts from June to November 2022 with satellite zenith angles less than 60° are presented in Figure 2. Over 80% of pixels had more than 500 clear-sky samples in the Fengyun-4B/AGRI full disk area.

3. Results

3.1. Quality Analysis of Fengyun-4B/AGRI Channel 8

Figure 3 shows the valid data counts for the Fengyun-4B/AGRI 3.75 μm channel from June to November 2022. Due to the sun’s influence on the satellite instrument, NSMC used the strategy of retaining unaffected pixels and giving a missing value to affected pixels, to ensure that reliable data were released. After processing, valid data counts around the Autumnal Equinox were less than other times, as shown in Figure 3. However, after analysis, we still found abnormal observations in the released data, which indicates flaws in the NSMC processing strategy.
The standard deviations of the Fengyun-4B/AGRI 3.75 μm brightness temperature observations and simulation based RTTOV over the ocean from 27 July to 31 July, and from 27 October to 31 October 2022, were calculated as shown in Figure 4. From 27 July to 31 July, standard deviations were mainly distributed between 0.8 K and 1.8 K, but at 1500 UTC from 27 October to 31 October, standard deviation increased rapidly to more than 3 K, while at other times standard deviations remained mainly between 0.8 K and 1.8 K. Similar phenomena can be found in the Fengyun-4A/AGRI 3.75 μm brightness temperature observations and simulations at 1700 UTC from 27 October to 31 October 2022 (figures omitted).
We compared the brightness temperature spatial distribution of the Himawari-8/AHI, Fengyun-4B/AGRI and Fengyun-4A/AGRI ~3.75 μm channel at 0600 UTC, 1500 UTC and 1700 UTC on 31 October 2022, as shown in Figure 5. It can be seen that at 0600 UTC, the brightness temperature observations of the Fengyun-4B/AGRI and Fengyun-4A/AGRI ~3.75 μm channels matched well with those of the Himawari-8/AHI ~3.75 μm channel in the overlapping region, although the brightness temperature observations of Fengyun-4B/AGRI and Fengyun-4A/AGRI were slightly higher in the cloudy region. However, at 1500 UTC, the brightness temperature observations of the Fengyun-4B/AGRI ~3.75 μm channel were about 10–20 K higher than those of Himawari-8/AHI from 0° to 50°S, and a similar phenomenon occurred when comparing the brightness temperature observations of the Fengyun-4A/AGRI ~3.75 μm channel with those of the Himawari-8/AHI ~3.75 μm channel at 1700 UTC.
Furthermore, the frequency of the Himawari-8/AHI, Fengyun-4B/AGRI and Fengyun-4A/AGRI ~3.75 μm channel brightness temperature observations at 1400, 1500, 1600, 1700 and 1800 UTC from 26 July to 31 July, and from 26 October to 31 October 2022, are analyzed as shown in Figure 6. It can be seen that in July, the ~3.75 μm brightness temperature observations of the three instruments had a similar frequency distribution pattern: brightness temperature observations were mainly distributed within 300 K, frequency increased with the increase in brightness temperature and reached a summit when the brightness temperature was around 295 K, then suddenly decreased to nearly 0. In October, Himawari-8/AHI had a basically consistent frequency distribution pattern, but the frequency summit of Fengyun-4B/AGRI 3.75 μm brightness temperature observations at 1500 UTC shifted to 300 K, and frequency between 300 K and 305 K rose from nearly 0 to more than 0.0065. A similar phenomenon occurred for Fengyun-4A/AGRI 3.75 μm brightness temperature observations at 1700 UTC.
One possible reason is that, with the change of the relative position of the Sun and Earth, the Sun shines directly at around 133°E, 0°N (the sub-satellite point of Fengyun-4B) at 1500 UTC and around 104.7°E, 0°N (the sub-satellite point of Fengyun-4A) at 1700 UTC before and after the Autumnal Equinox, which will cause rapid temperature rise in satellite instruments, leading to abnormally high brightness temperature observations in the Fengyun-4B/AGRI and Fengyun-4A/AGRI 3.75 μm channels. Although some efforts have been made to eliminate erroneous observations by giving a missing value to affected pixels, incorrect brightness temperature observations still existed in the Fengyun-4B/AGRI L1 products. By contrast, brightness temperature observations of the Himawari-8/AHI ~3.75 μm channel show a consistent frequency distribution pattern, which suggests a technical gap between Himawari-8/AHI and Fengyun-4B/AGRI.
In order to correctly analyze the performance of Fengyun-4B/AGRI IR channels, abnormal observations of the Fengyun-4B/AGRI 3.75 μm channel were excluded from our study below.

3.2. Biases and Standard Deviations over the Ocean

Figure 7 shows the spatial distribution of biases of Fengyun-4B/AGRI channels 8–15 brightness observation and RTTOV simulation over the ocean. These biases are calculated by using observation minus RTTOV simulation under clear-sky conditions with satellite zenith angles less than 60°. For channel 8, there were large negative biases from 20°S to 5°S in the Indian Ocean and the south edge of the observations, and mainly slightly positive biases elsewhere. The biases of channels 9–10 were mainly around 0.5 K, and for the newly added channel 11, biases were mainly within ±1 K. For the surface-sensitive channels, the biases of channels 12–14 in the North Pacific were mainly slightly negative, around -1 K, while in most areas of the Southern Hemisphere, biases were around −2 K. Channels 12–14 were more sensitive to the accuracy of ocean surface emissivity and sea surface temperature than channels 9–11. In this paper, ocean surface emissivity was calculated by using zenith angle, wind speed and skin temperature within RTTOV, and ERA5 skin temperature was used as the RTTOV input. The uncertainty of the ocean surface emissivity calculation method and ERA5 skin temperature may lead to systematically negative biases in the Fengyun-4B/AGRI channels 8–14 brightness temperature simulations. The biases spatial distribution of channel 15 over the ocean was similar to that of channel 14.
Table 3 presents the biases and standard deviations of the Fengyun-4B/AGRI IR channels brightness temperature observations and RTTOV simulations under clear-sky conditions, spatially and temporally averaged over the ocean from June to November 2022. Overall, the biases of all IR channels were within −1.4 K to 0.7 K. The biases of channels 11–15 were negative while the biases of the remaining channels were positive over the ocean. The bias of the surface-sensitive channel 14 was −1.39 K, which is the largest bias of all the IR channels. The second-largest bias was −1.3 K for channel 15. The biases of water vapor-sensitive channels 9–11 were between −0.15 K and 0.62 K, which were less than those of the surface-sensitive channels 12–14, implying that surface variables in ERA5 reanalysis have more uncertainty than water vapor profile. Channel 8 showed the biggest difference between bias and standard deviation, which indicates that the bias distribution of channel 8 was more dispersed than other channels. Standard deviation for the low water vapor sensitive channel 11 was 0.71 K, which was the lowest standard deviation of all IR channels. Standard deviations for the surface-sensitive channels 12–14 were over 1.2 K, which were larger than those of the water vapor-sensitive channels 9–11. For comparison, the brightness temperature of the FY-4A/AGRI IR channels in the same period (from June to November 2022) were simulated with a similar strategy, except that Fengyun-4A/AGRI geometry and cloud mask product were used. Standard deviations for the FY-4A/AGRI surface-sensitive channels 11–13 were 1.74 K, 1.41 K and 1.27 K, which are also over 1.2 K and larger than those of the FY-4A/AGRI water vapor-sensitive channels 9–10 (0.91 K and 0.84 K, respectively).
Figure 8 shows the biases and standard deviations of the Fengyun-4B/AGRI channel 8 brightness temperature observations and RTTOV simulations with respect to solar zenith angles. Since Fengyun-4B/AGRI channel 8 is a mid-wave IR channel, there was a stronger solar effect on channel 8 than the other IR channels, which may lead to different bias characteristics with respect to solar zenith angle. As shown in Figure 8a, there was a strong relationship between biases and solar zenith angles. When solar zenith angles were less than about 90°, biases were mainly positive, and when solar zenith angles were more than about 90°, biases were mainly negative, which may be caused by the solar radiation interference filtering module of RTTOV not being accurate enough. However, standard deviations only varied from 0.84 K to 1.42 K with the change of solar zenith angle. This phenomenon may explain the difference between bias and standard deviation of Fengyun-4B/AGRI channel 8 brightness temperature observations and RTTOV simulations shown in Table 3.

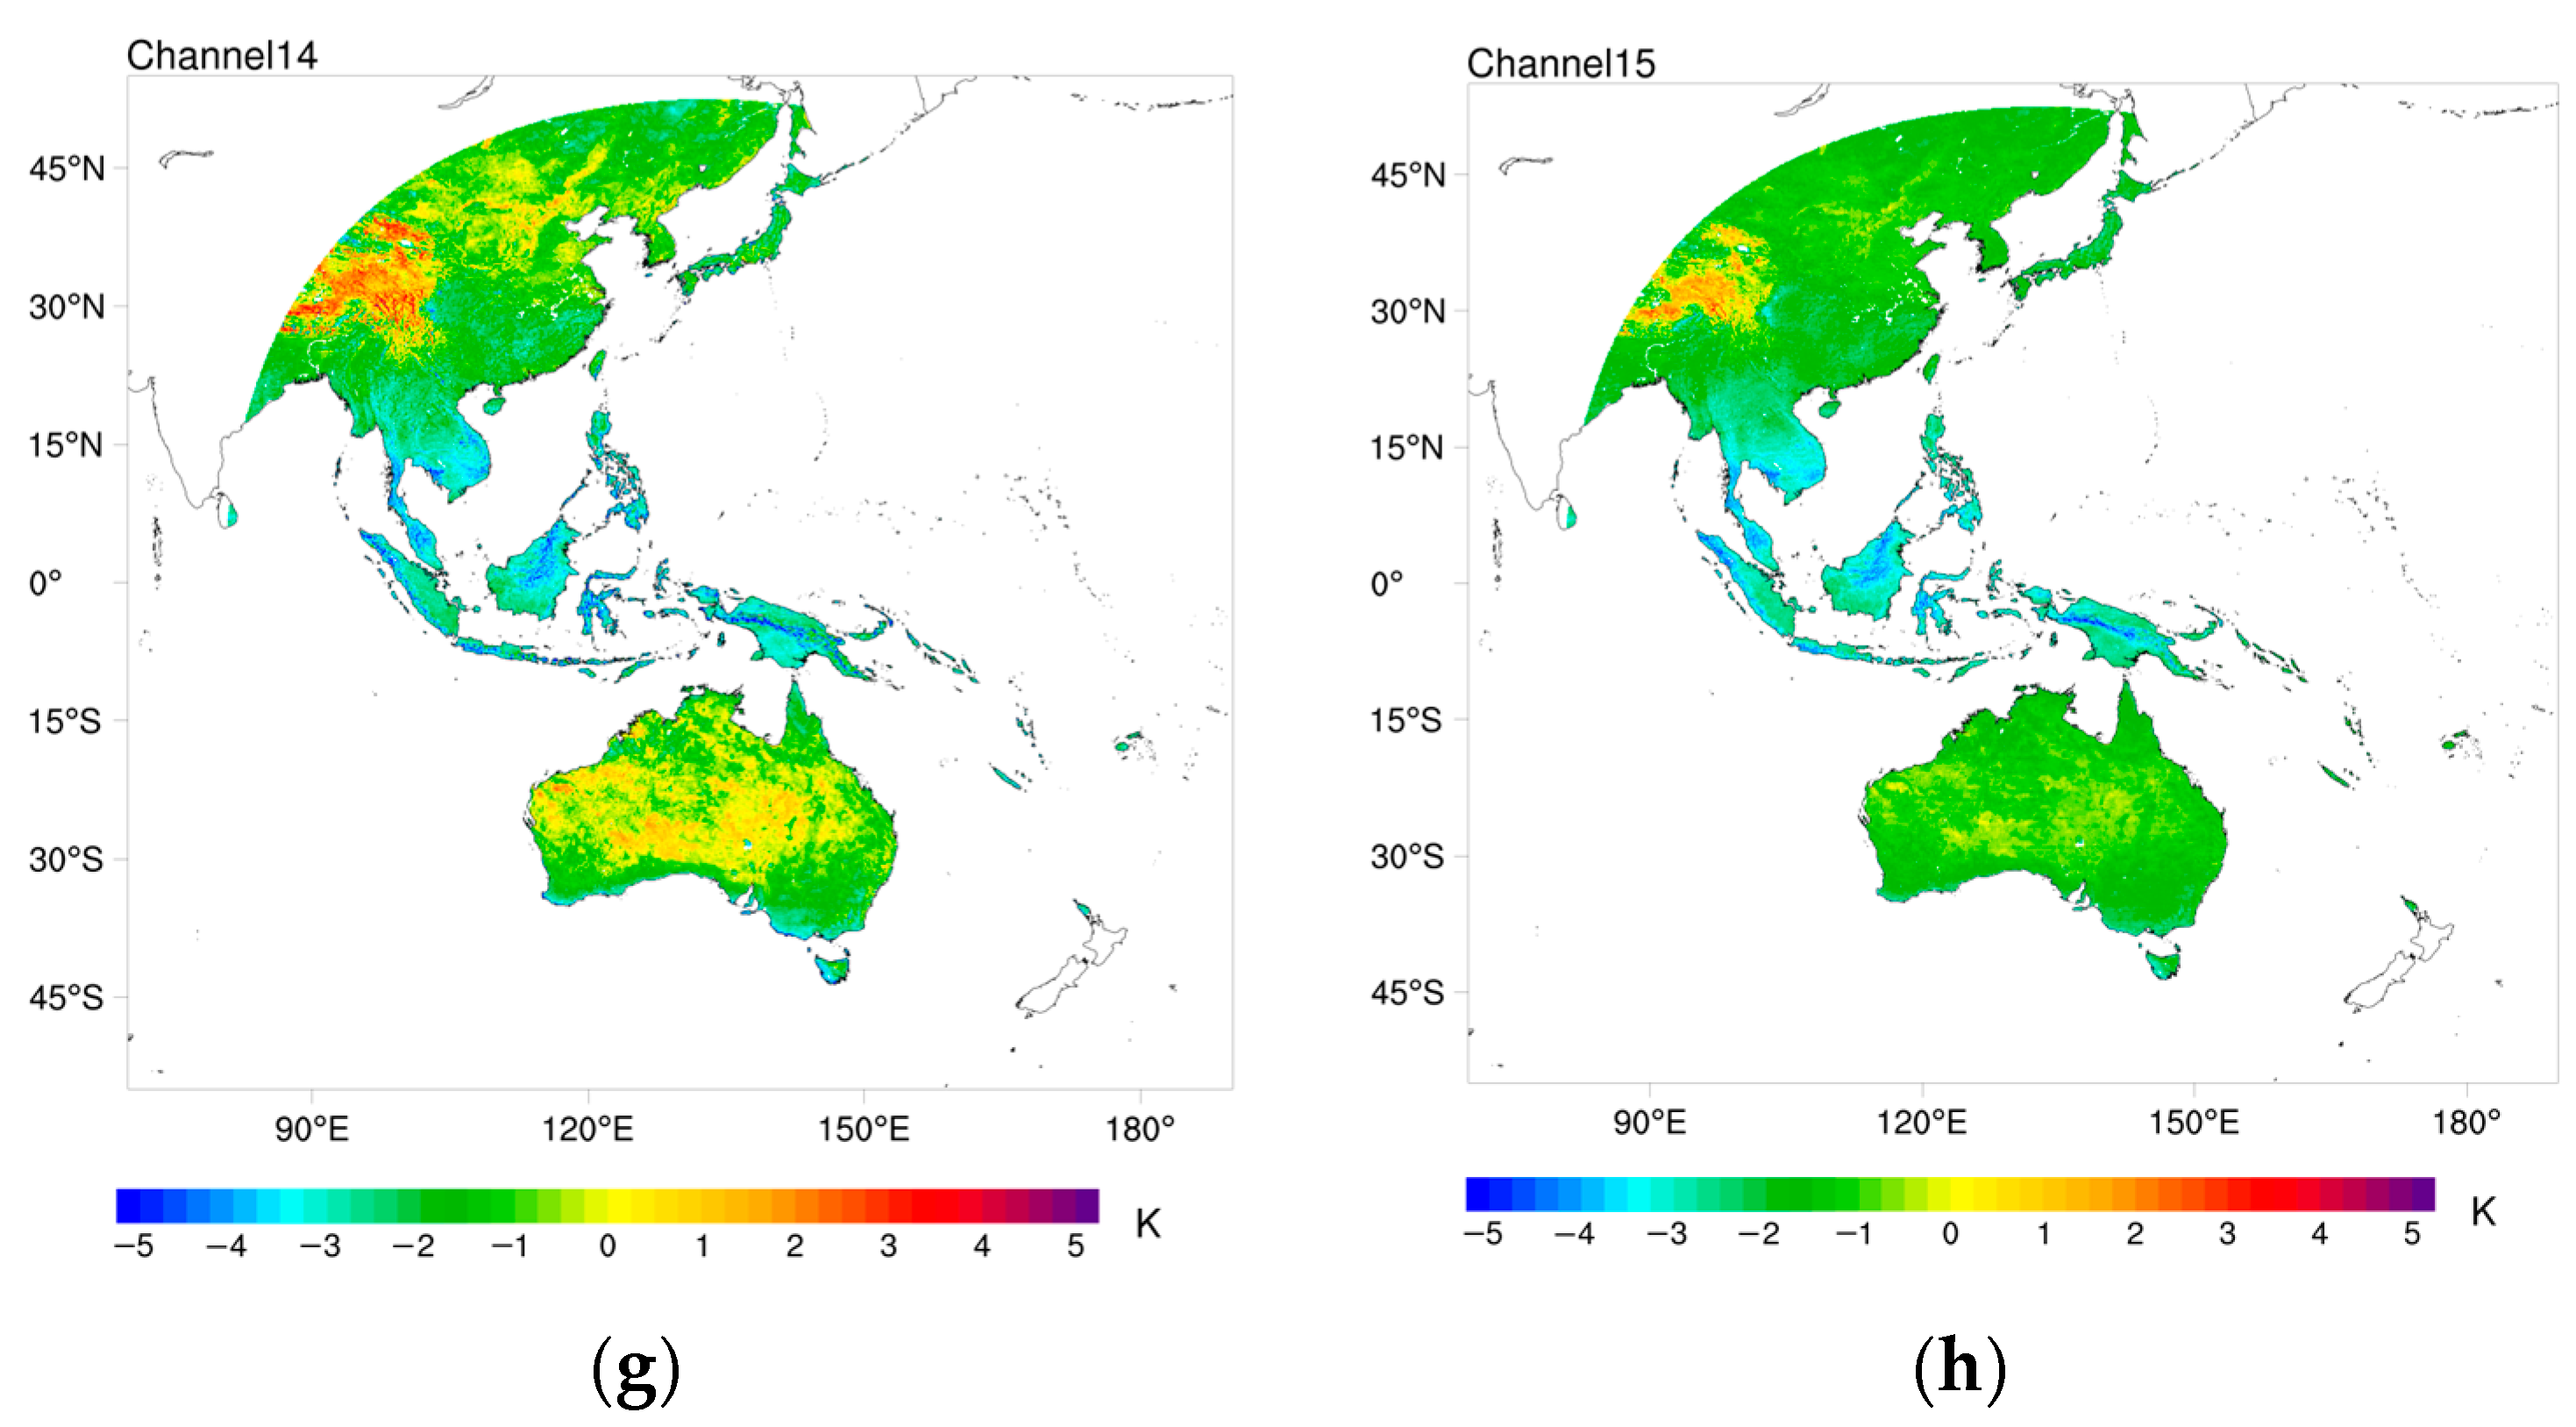
3.3. Biases and Standard Deviations over Land

For brightness temperature simulation of the Fengyun-4B/AGRI IR channels, land surface emissivity was calculated based on CAMEL_HSRemis datasets. Figure 9 shows the spatial distribution of the biases of Fengyun-4B/AGRI channels 8–15 brightness observations and RTTOV simulations over land. Channel 8 is a mid-wave IR channel, which is influenced by surface reflectance, and there were large positive biases in regions of complex topography, such as the Qinghai–Tibet Plateau. The uncertainty of ERA5 skin temperature and surface emissivity in regions of complex topography may be the cause of these positive biases. In other regions, biases were mainly between −2 K and 2 K. For the water vapor-sensitive channels, the biases of channels 8–9 were mainly between 0 K and 1 K, indicating a small overestimation in high- and middle-level water vapor of ERA-5 reanalysis over land. The biases of channel 10 were larger than those of channels 8–9, especially in the Qinghai-Tibet Plateau, implying systematical overestimation of ERA-5 low-level water vapor. For the surface-sensitive channels, the biases of channels 12–14 were mainly negative, except in the Qinghai-Tibet Plateau. From a comparison of Figure 4 and Figure 5, the biases of channels 12–14 over land were larger than those over the ocean. The cause of this difference is that surface conditions over the ocean are relatively simpler than those over land, and that surface conditions (surface emissivity and skin temperature) over the ocean are more accurate, leading to a more accurate simulation of brightness temperature over the ocean.
Table 4 presents the biases and standard deviations of the Fengyun-4B/AGRI IR channels’ brightness temperature observations and RTTOV simulations under clear-sky conditions, spatially and temporally averaged over land from June to November 2022. Similar to biases over the ocean, the biases of channels 8–10 were positive, while the biases of channels 11–15 were negative. Standard deviations of all IR channels over land were larger than those over the ocean, which indicates that bias distribution over land was more dispersed than that over the ocean. From the comparison of standard deviations of different IR channels over land and ocean, differences in standard deviations of the surface-sensitive channels 12–14 were much larger than those of the water vapor-sensitive channels 9–11. The standard deviations of the surface-sensitive channels 12–14 were around 3 K, while standard deviations for the water vapor-sensitive channels 9–11 were between 1.1 K and 1.3 K. The standard deviation of channel 8 was 3.61 K, which was the largest standard deviation of all IR channels. For comparison, a similar strategy was applied to simulate the brightness temperature of the FY-4A/AGRI IR channels in the same period (from June to November 2022) with ERA5 reanalysis as input. Standard deviation of FY-4A/AGRI channel 8 was 3.60 K, which was also the largest standard deviation of all FY-4A/AGRI IR channels.

3.4. Analysis of Bias and Standard Deviation’s Dependence on Satellite Scan Angle

With the increase in Fengyun-4B/AGRI scan angle, the optical depth between satellite instrument and earth also increases, which may lead to uncertainty in RTTOV simulations, so it is necessary to analyze the dependence of biases and standard deviations on satellite scan angles. Because of the uncertainty in simulation over land, only data over the ocean were considered. Figure 10a,b present variations in biases and standard deviations of the Fengyun-4B/AGRI IR channels brightness temperature observation and RTTOV simulation with respect to satellite zenith angle, and pixel numbers calculated at 1° intervals are shown in Figure 10c. As shown in Figure 10a, the biases of channel 8 decrease gradually when satellite zenith angles are less than 4°; they then change from −0.06 K to 0.12 K with the increase in satellite zenith angles. The biases of channels 9–10 maintained a positive value and the biases of channel 11 maintained a negative value at any satellite zenith angle. The biases of channel 11 gradually increased from −0.57 K to −1.28 K when satellite zenith angles increased from 0 to 60°. The biases of channels 12–15, which increased at first and then decreased with the increase in satellite zenith angles, show similar variation patterns. Overall, the biases of all IR channels had a negligible relationship with satellite zenith angles. As shown in Figure 10b, apart from channels 8 and 12, standard deviations of other IR channels have no significant relationship with satellite zenith angles. The standard deviations of channel 8 were maintained around 1 K when satellite zenith angles were less than 30°, then increased significantly with the increase in satellite zenith angles. The main reason is that Fengyun-4B/AGRI channel 8 is a mid-wave IR channel, which can be easily affected by solar radiation when the satellite zenith angle is large. The standard deviations of channel 12 maintained around 1.15 K when satellite zenith angles were less than 30°, then increased significantly with the increase in satellite zenith angles. Channel 12 is sensitive to total atmospheric vapor, and when the satellite zenith angle is large, it may be affected by atmospheric vapor in the optical depth between the satellite instrument and Earth. Previous research [23] studied the effect of satellite scan angles on the biases and standard deviations of the Fengyun-4A/AGRI IR channels’ brightness temperature observations and RTTOV simulations, indicating that a small amount of data may lead to abnormally large standard deviations when satellite zenith angles are less than 10°. In this paper, hourly Fengyun-4B cloud mask products from June to November 2022 were used to identify clear-sky pixels, which can provide much more statistical samples to calculate standard deviations, so the standard deviations of all Fengyun-4B/AGRI IR channels remained stable when satellite zenith angles were less than 10°.

3.5. Analysis of Bias and Standard Deviation’s Dependence on Scene Temperature

For on-board calibration, Fengyun-4B/AGRI uses the built-in blackbody as the heat target and space as the cold target. This on-board calibration method is based on the assumption that the response of the instrument to incident radiation is linear, which may not be absolutely linear in the process of actual observation. Therefore, it is necessary to analyze the dependence of biases and standard deviations on scene temperature. Because of the uncertainty in simulation over land, only data over the ocean were considered. Figure 11a–d present the variations in biases and standard deviations of the Fengyun-4B/AGRI IR channels brightness temperature observations and RTTOV simulations with respect to scene temperature, and the pixel numbers calculated at 1 K intervals are shown in Figure 11e. As shown in Figure 11a,b, the biases of channel 8 changed from −2.7 K to 0 K when scene brightness temperature was less than 300 K. When scene brightness temperature increased from 300 K to 320 K, the bias of channel 8 changed from 0 K to −1.8 K at first, then changed back. For the surface-sensitive channels 12–14, biases changed from negative to positive with the increase in scene brightness temperature, showing an obvious upward trend. For the water vapor-sensitive channels 9–11, biases became smaller at first and then were maintained around 0 K with the increase in scene brightness temperature. The standard deviations of channels 8 and 12–14 showed a similar variation pattern: an initial decrease, followed by increasing to a rather stable value. For channel 9, standard deviations were mainly around 1 K. The standard deviations of channels 10 and 11 decreased at first, then maintained around 1 K with the increase in scene brightness temperature. Overall, biases and standard deviations of all IR channels were dependent on the scene brightness temperature. Zou et al. [19] indicate that the nonlinear response of an instrument to incident radiation is the main reason for this dependence.

4. Discussion

Based on RTTOV, the characterization of biases in Fengyun-4B/AGRI IR channels in the period of Fengyun-4B’s trial operation (from June to November 2022) was preliminarily analyzed in this study, and the results may help to achieve the operational application of Fengyun-4B/AGRI. However, further study can be carried out as follows:
(1)
In this study, we compared the Fengyun-4B/AGRI IR channels’ brightness temperature observation and RTTOV simulation, and analyzed spatial distribution variation of biases and standard deviations over ocean and land. The results show that there are more uncertainties in surface-sensitive channels 12–14, and that uncertainty in land surface temperature [35] and land surface emissivity may be the main reason, which suggest that the accuracy of the simulation can be improved by improving the quality of surface condition. Furthermore, brightness temperature observations of the Fengyun-4B/AGRI IR channels should be compared with other similar instruments (Fengyun-4A/AGRI, Himawari-9/AHI et al.) or hyperspectral infrared sounders to better clarify instrument characteristics and characterize bias in Fengyun-4B/AGRI IR channel observations.
(2)
The characterization of biases in the period of Fengyun-4B’s trial operation (from June to November 2022) was analyzed in this study, but did not include analysis for spring and winter. Analysis for a period of longer time (such as a year) should be performed for more comprehensive conclusions.
(3)
With the development of fast radiative transfer models, ARMS has been developed by the China Meteorological Administration Earth System Modeling and Prediction Centre, which aims to support the assimilation of the Fengyun series satellites [36,37]. The ARMS program initiated in 2018, and after 4 years of development, ARMS has updated from version 1.0 to version 1.2. One of its significant improvements is the integration of two radiative transfer solvers (Doubling Adding Method [38] and Discrete Ordinate Adding Method [39]), and users can choose which solver to use by changing configuration. To promote the development of fast radiative transfer models, a comprehensive comparison of ARMS and RTTOV should be performed, which can provide meaningful information to model developers.

5. Conclusions

As China’s first operational second-generation geostationary meteorological satellite, Fengyun-4B carries the newly developed AGRI instrument, which was improved from the previous Fengyun-4A/AGRI. Compared to Fengyun-4A/AGRI, after adding a low-level water vapor detection channel and adjusting the spectrum of four channels, Fengyun-4B/AGRI can provide more useful information to improve the prediction accuracy of the NWP systems through direct and indirect data assimilation. To achieve Fengyun-4B/AGRI data assimilation, the characterization of biases in Fengyun-4B/AGRI should be analyzed in advance. To characterize biases in Fengyun-4B/AGRI IR channels, we used RTTOV to simulate clear-sky brightness temperature with ERA5 reanalysis as the input in the period of Fengyun-4B’s trial operation (from June to November 2022). Our major conclusions are as follows:
(1)
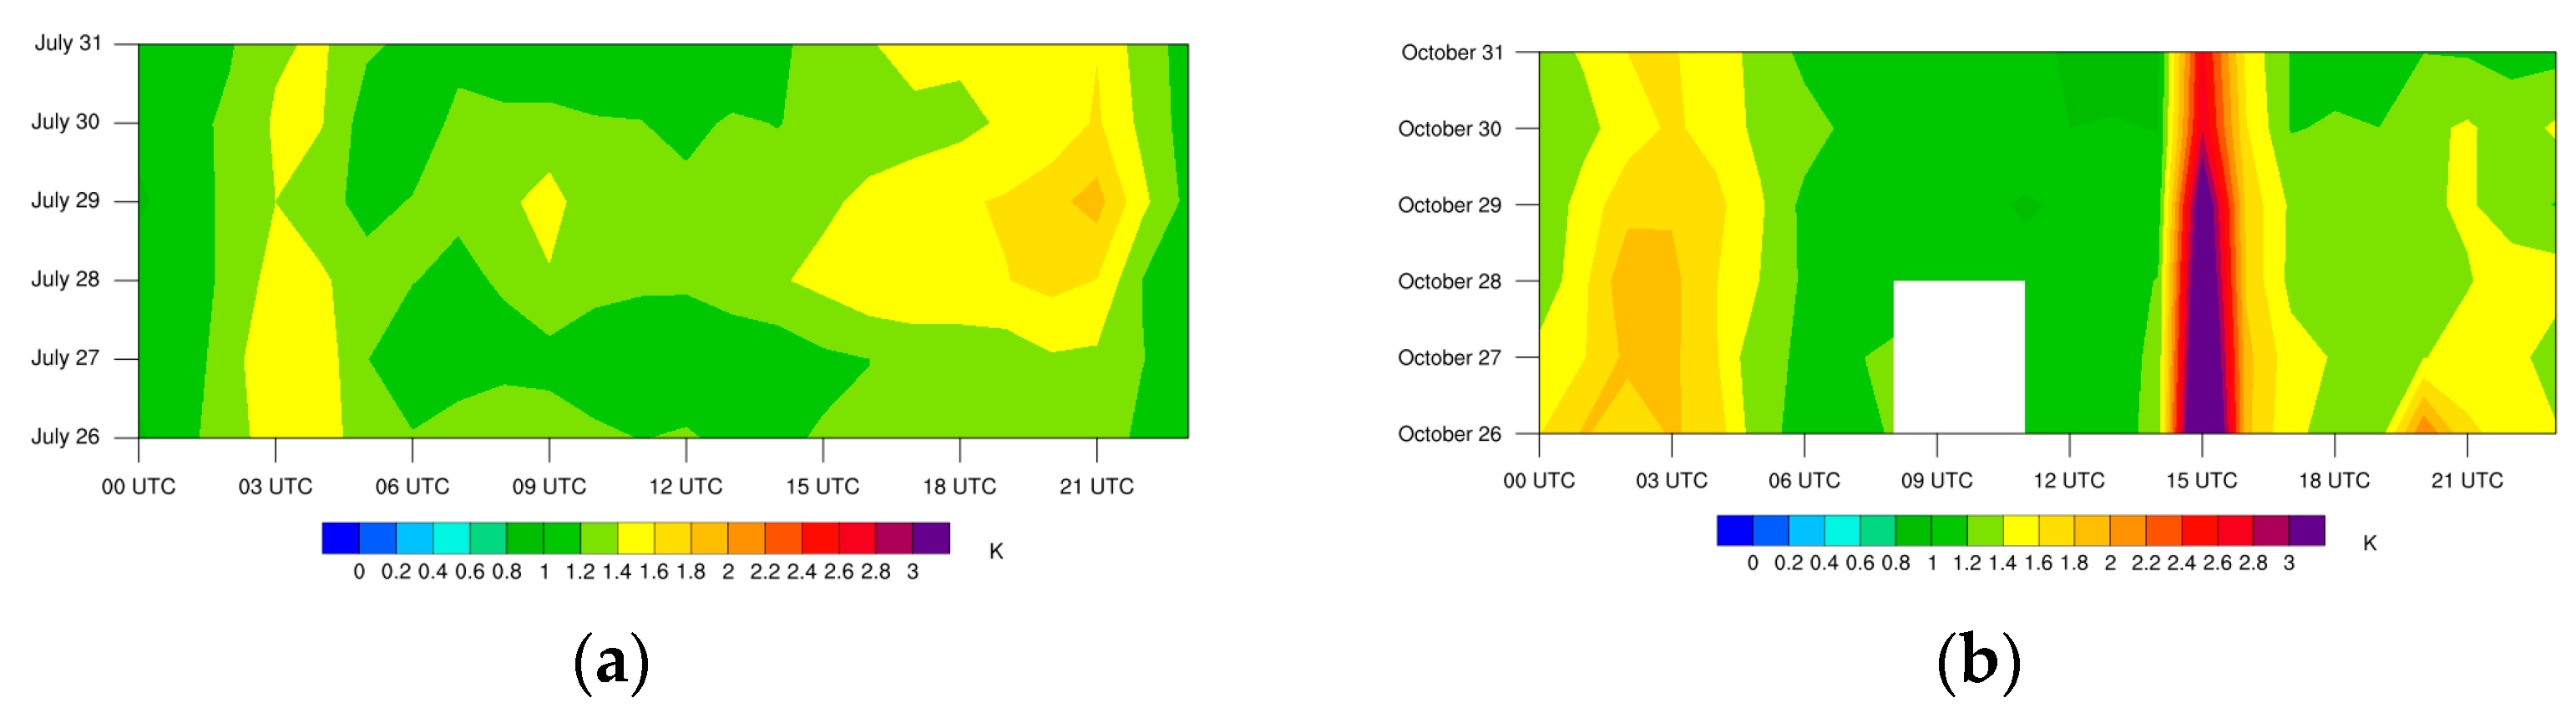
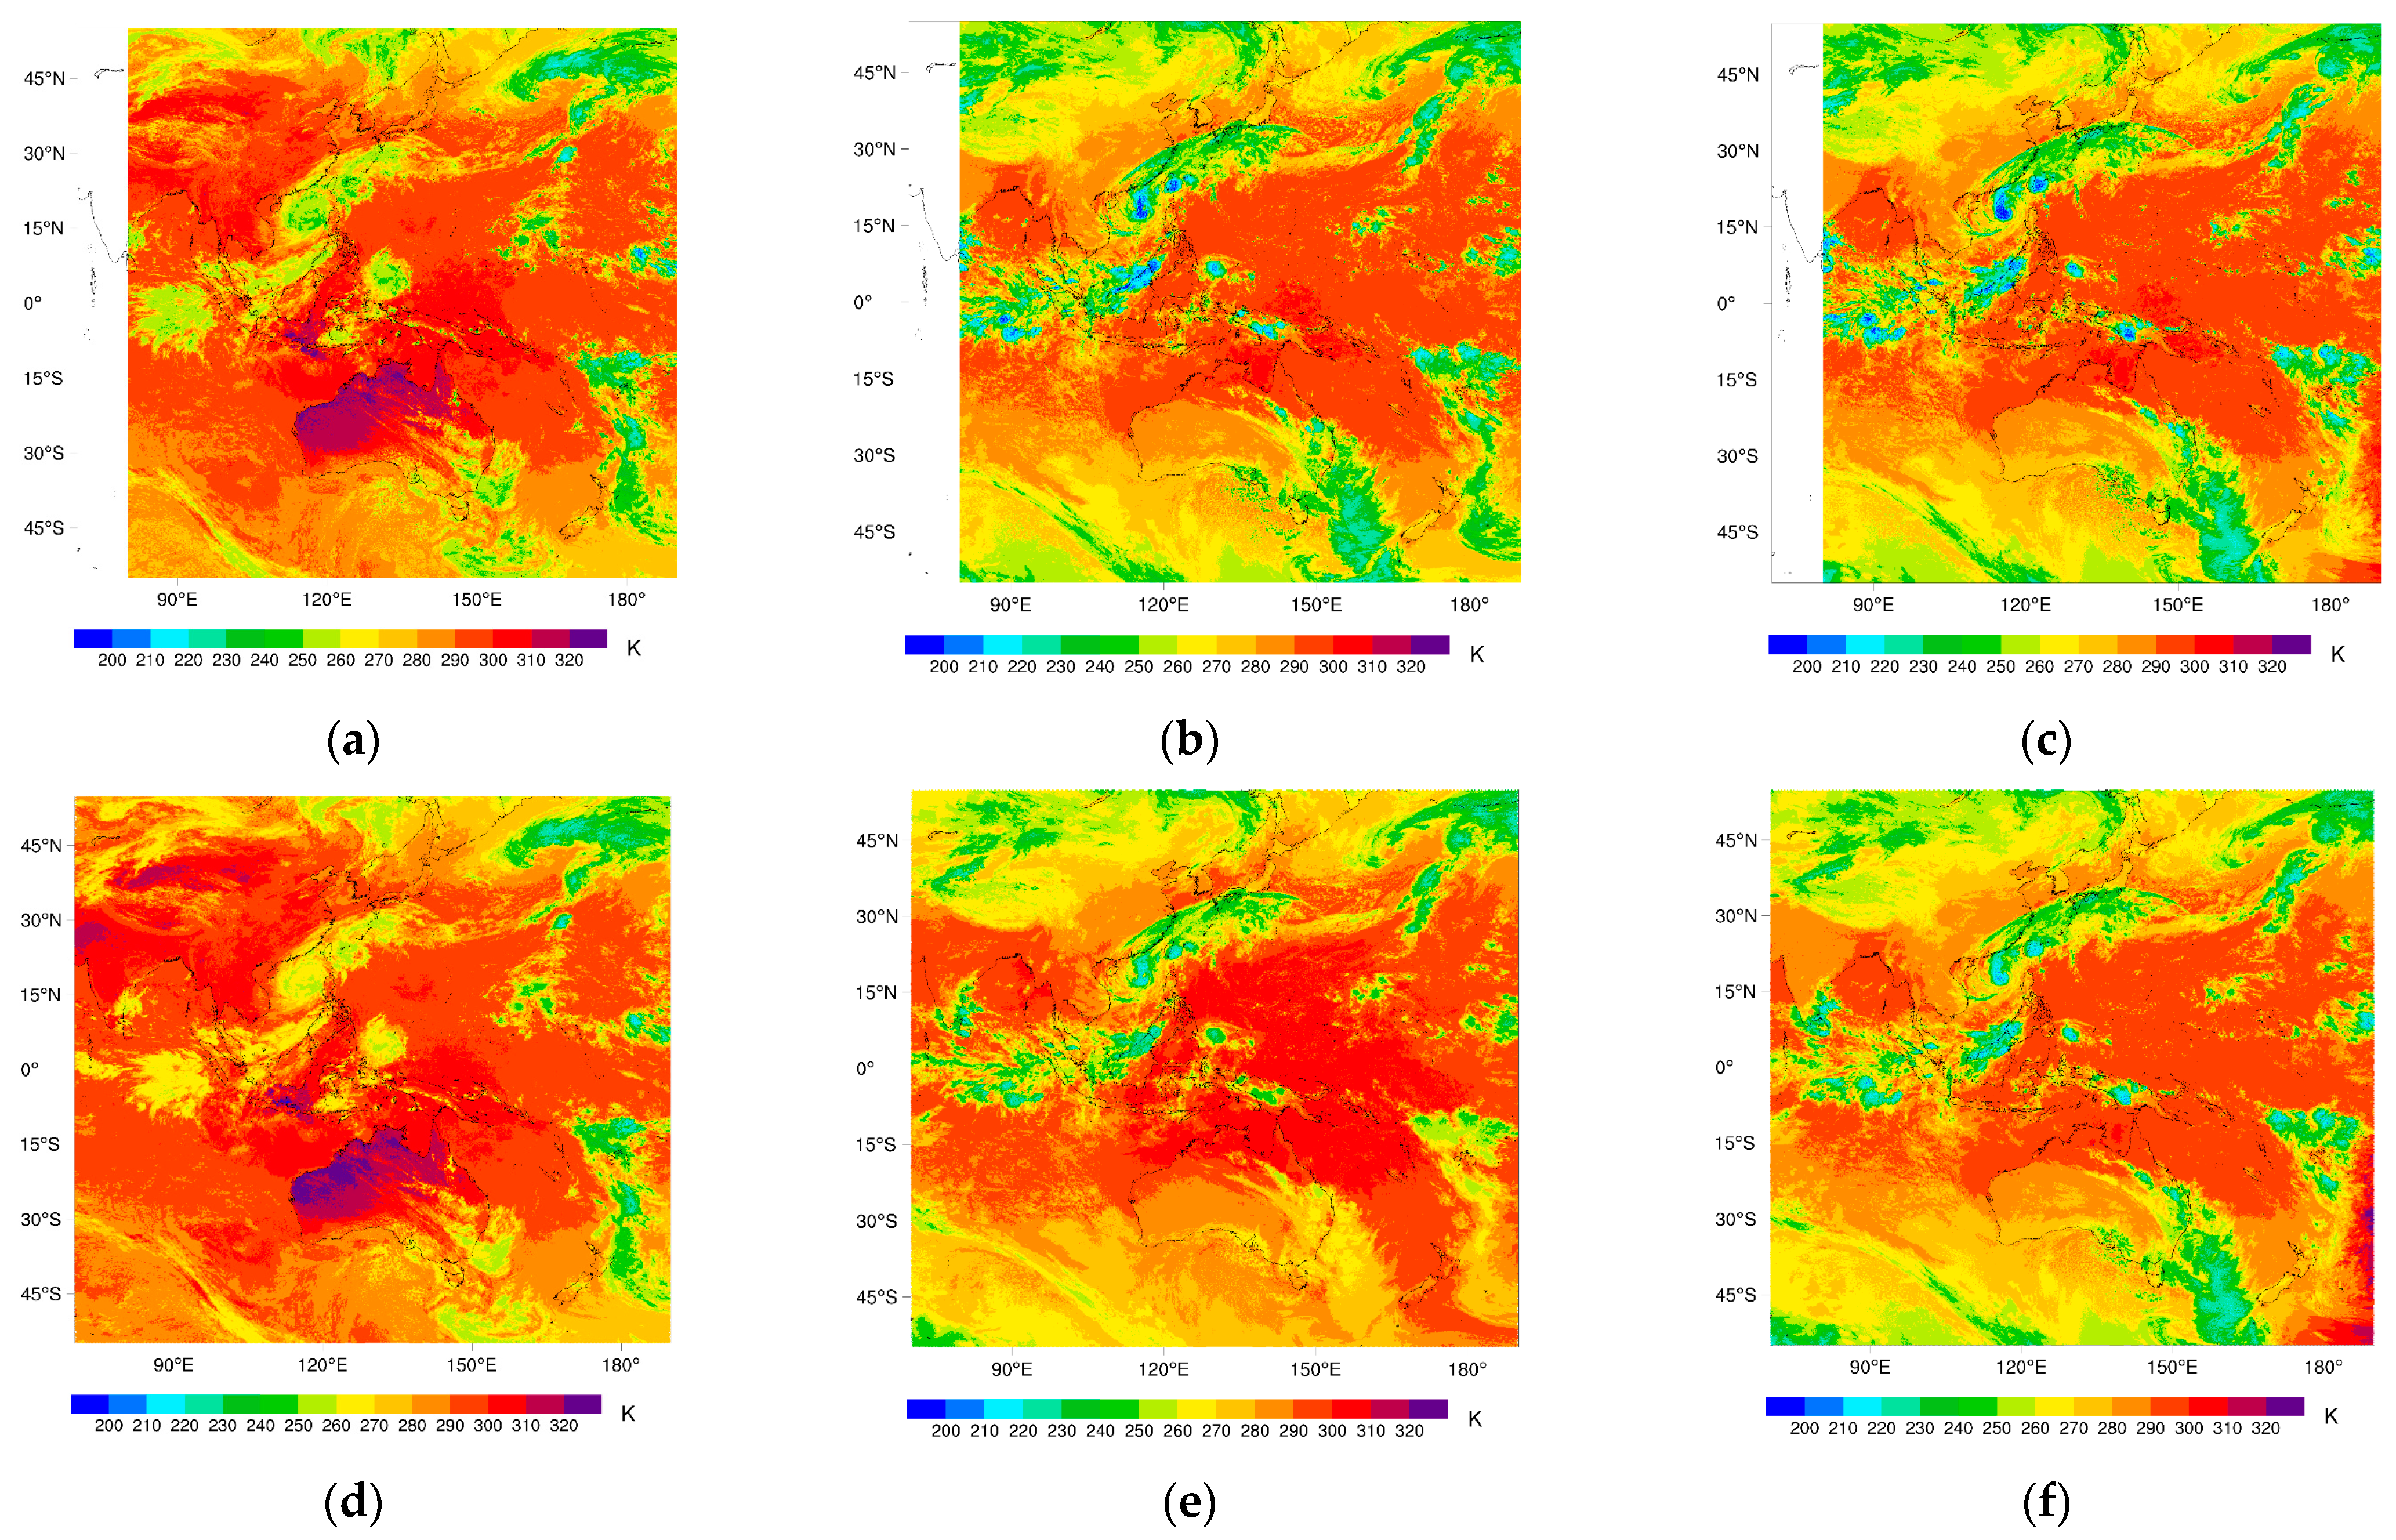
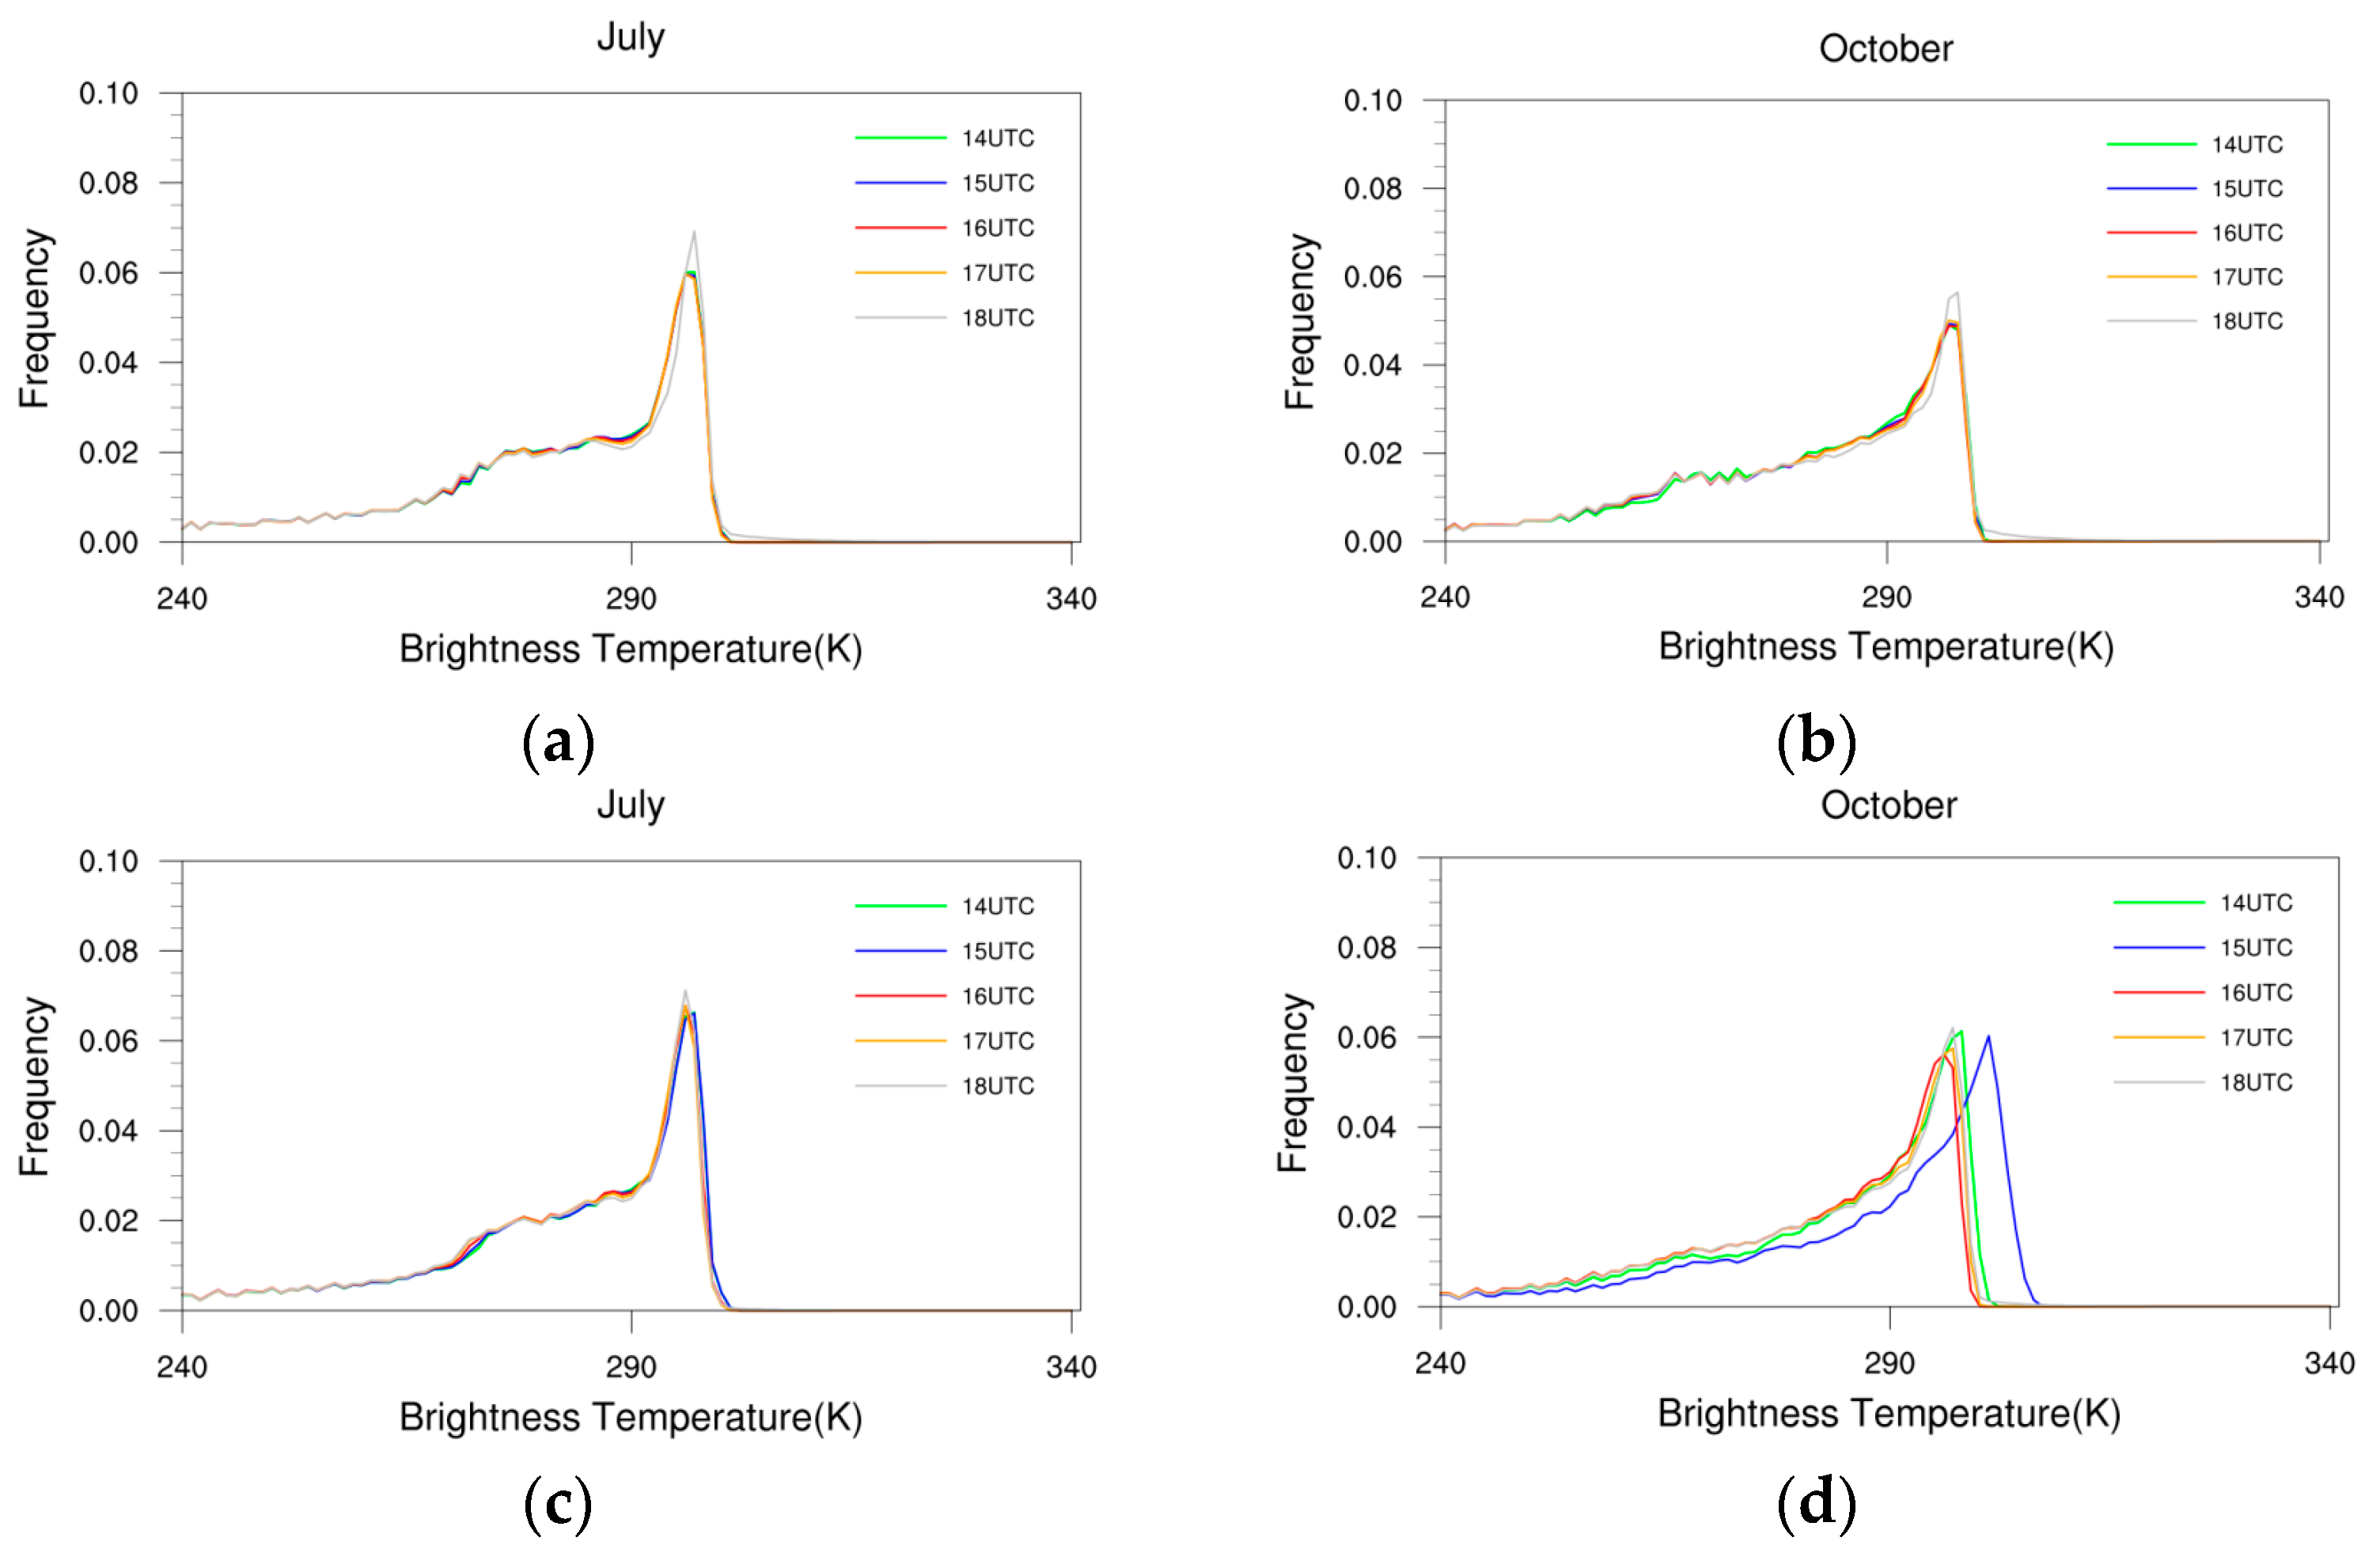
Compared to the simulation of RTTOV and observations from instruments of the same kind (Fengyun-4A/AGRI, Himwari-8/AHI), brightness temperature observations of Fengyun-4B/AGRI 3.75 μm channel were abnormally high around 1500 UTC in October, which may be caused by the Sun’s influence on satellite instruments. Although the data producer noticed the anomalies and used the processing strategy of giving a missing value to the affected pixels, abnormal observations still exist in the released data of the Fengyun-4B/AGRI 3.75 μm channel. For data assimilation, quality control should be specially performed for the Fengyun-4B/AGRI 3.75 μm channel.
(2)
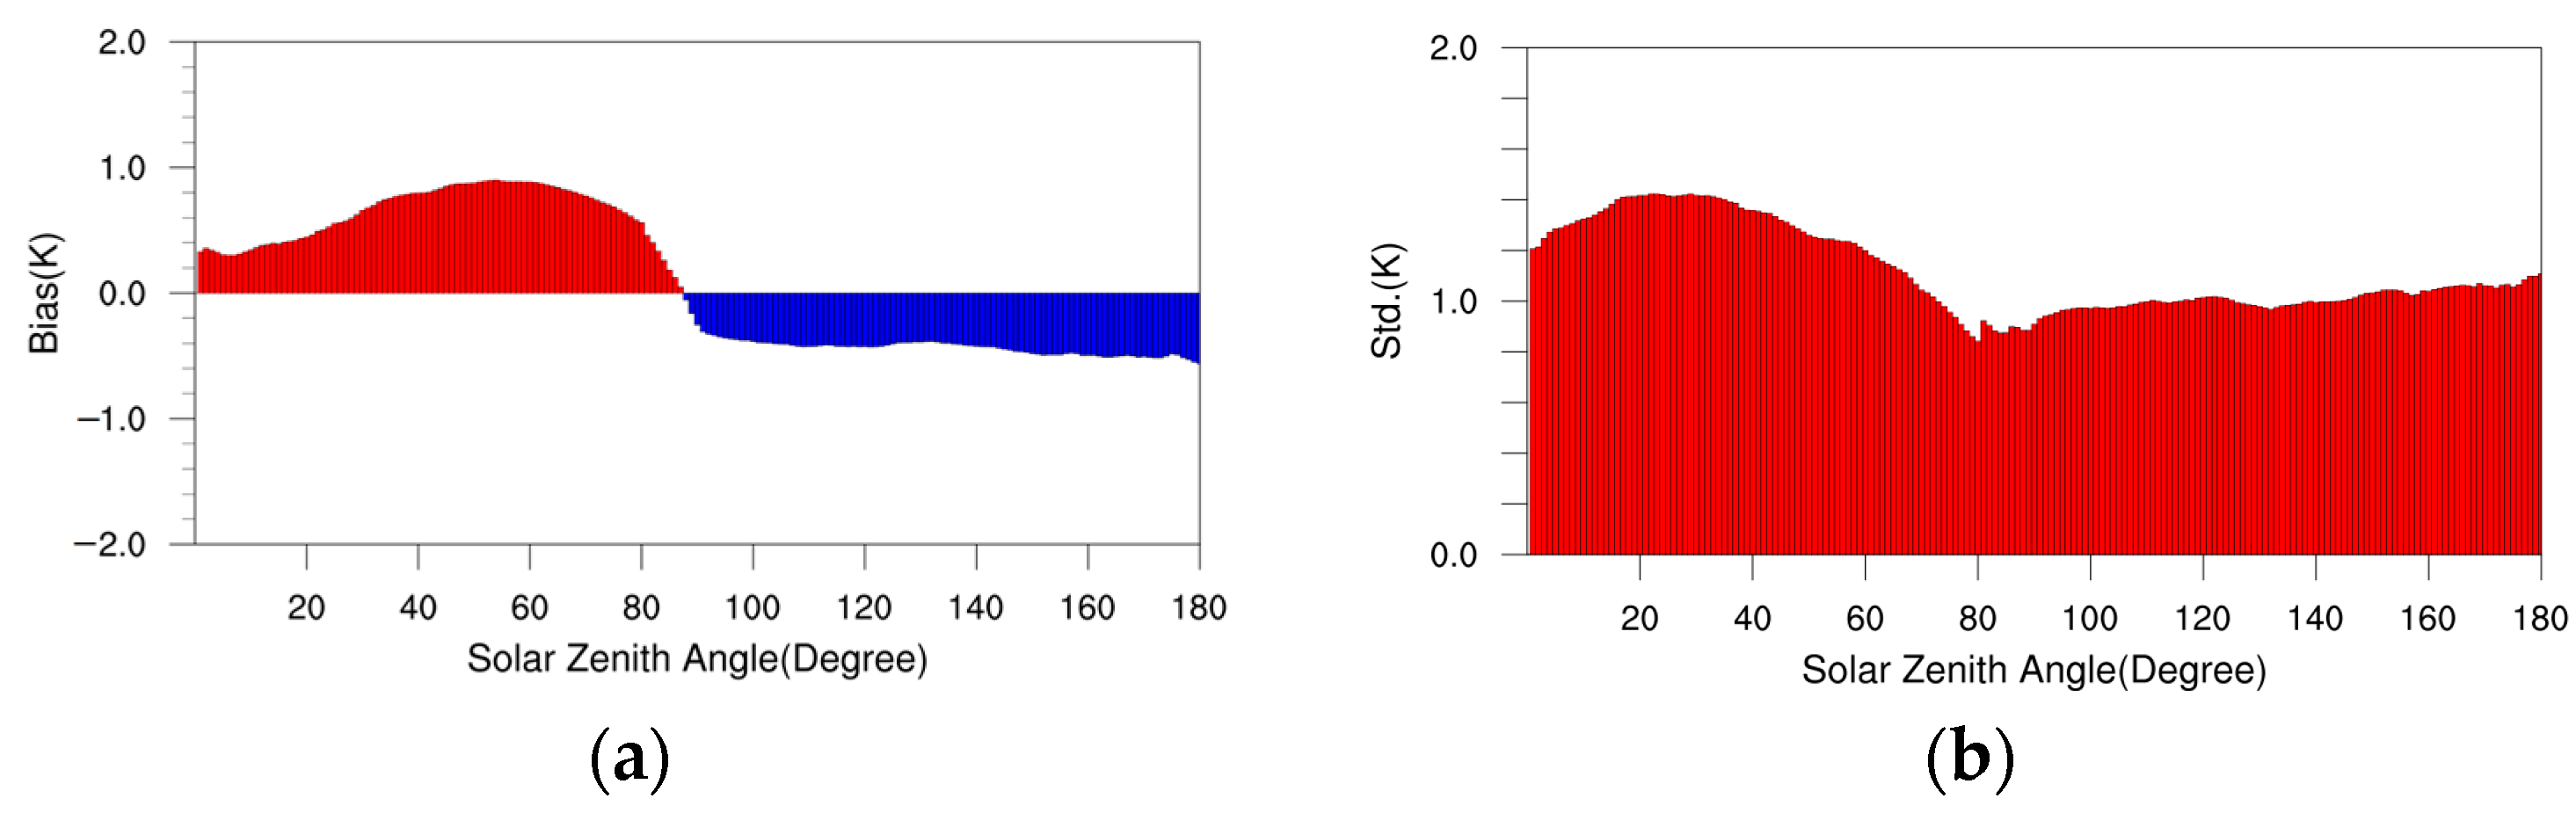
Overall, RTTOV simulations were in good agreement with the Fengyun-4B/AGRI IR channels brightness temperature observations. The mean biases of RTTOV simulations for all IR channels were less than 1.4 K over the ocean and 1.8 K over land, respectively. For the surface-sensitive channels 12–14, variations of bias spatial distribution over land were more obvious than those over ocean, while variations of bias spatial distribution for water vapor channels 9–11 were more constant, regardless of surface conditions, which indicates that surface conditions more complex to accurately describe over land. In addition, the differences between the bias and standard deviation of channel 8 was relatively large because of the Sun’s influence on the mid-wave IR channel, making biases mainly positive when solar zenith angles were less than about 90°, while biases were mainly negative when solar zenith angles were more than about 90°.
(3)
Apart from channels 8 and 12, the biases and standard deviations of the other Fengyun-4B/AGRI IR channels had insignificant dependence on the satellite zenith angles. For channels 8 and 12, standard deviations seemed to have a positive correlation with satellite zenith angles when satellite zenith angles are larger than 30°, which suggests that bias correction should be performed specially for channels 8 and 12 before assimilating into the NWP system.
(4)
Biases and standard deviations of all Fengyun-4B/AGRI IR channels over the ocean had non-negligible dependence on screen brightness temperature. Apart from channel 8, the biases of other Fengyun-4B/AGRI IR channels seemed to have a positive correlation with screen brightness temperature. For channel 8, biases had a positive correlation with screen brightness temperature when screen brightness temperature is less than 300 K or more than 310 K, while biases had a negative correlation with screen brightness temperature when screen brightness temperature was between 300 K and 310 K. Dependences of the surface-sensitive channels 12–14 were more evident than the water vapor-sensitive channels 9–11.

Author Contributions

Conceptualization, Z.Z. and C.S.; methodology, Z.Z. and J.G.; writing—original draft preparation, Z.Z.; writing—review and editing, Z.Z. All authors have read and agreed to the published version of the manuscript.

Funding

This research was supported by the National Natural Science Foundation of China (Grant No. 92037000), the Balance Funding Project of National Meteorological Information Centre (Grant No. NMICJY202104, NMICJY202106) and the Fengyun Application Pioneering Project (Grant No. FY-APP-2021.0207, FY-APP-2022.0608).

Institutional Review Board Statement

Not applicable.

Informed Consent Statement

Not applicable.

Data Availability Statement

Not applicable.

Acknowledgments

The authors would like to thank the NSMC of the CMA for providing Fengyun-4B/AGRI and Fengyun-4A/AGRI data (http://satellite.nsmc.org.cn/, accessed on 20 December 2022), the Japan Aerospace Exploration Agency for providing Himawari-8/AHI data (ftp://ftp.ptree.jaxa.jp/, accessed on 20 December 2022), the ECMWF for providing ERA5 reanalysis (https://cds.climate.copernicus.eu, accessed on 25 December 2020) and RTTOV source code (https://nwp-saf.eumetsat.int/, accessed on 1 December 2022), the University of Wisconsin-Madison for providing CAMEL_HSRemis dataset (ftp://ftp.ssec.wisc.edu/pub/ICI/MEASURES_V002/, accessed on 5 December 2022) and the National Aeronautics and Space Administration for providing MODIS land cover product (https://www.earthdata.nasa.gov/, accessed on 5 December 2022). The authors also would like to thank the three anonymous reviewers for their valuable comments and constructive suggestions, which were greatly helpful for us to improve the quality of the manuscript.

Conflicts of Interest

The authors declare no conflict of interest.

References

  1. Yang, J.; Zhang, Z.; Wei, C.; Lu, F.; Guo, Q. Introducing the new generation of Chinese geostationary weather satellites, FengYun 4. Bull. Am. Meteorol. 2017, 98, 1637–1658. [Google Scholar] [CrossRef]
  2. Fengyun 4B, Sencond Generation Geostationary Meteorogical Satellite. Available online: http://fy4.nsmc.org.cn/nsmc/en/theme/FY4B.html (accessed on 5 December 2022).
  3. Min, M.; Wu, C.; Li, C.; Liu, H.; Xu, N.; Wu, X.; Chen, L.; Wang, F.; Sun, F.; Qin, D.; et al. Developing the Science Product Algorithm Testbed for Chinese Next-Generation Geostationary Meteorological Satellites: Fengyun-4 Series. J. Meteor. Res. 2017, 31, 708–719. [Google Scholar] [CrossRef]
  4. Choi, Y.-Y.; Suh, M.-S. Development of Himawari-8/Advanced Himawari Imager (AHI) Land Surface Temperature Retrieval Algorithm. Remote Sens. 2018, 10, 2013. [Google Scholar] [CrossRef] [Green Version]
  5. Zhou, S.; Cheng, J. An Improved Temperature and Emissivity Separation Algorithm for the Advanced Himawari Imager. IEEE Trans. Geosci. Remote Sens. 2020, 58, 7105–7124. [Google Scholar] [CrossRef]
  6. Ge, N.; Zhong, L.; Ma, Y.; Fu, Y.; Zou, M.; Cheng, M.; Wang, X.; Huang, Z. Estimations of Land Surface Characteristic Parameters and Turbulent Heat Fluxes over the Tibetan Plateau Based on FY-4A/AGRI Data. Adv. Atmos. Sci. 2021, 38, 1299–1314. [Google Scholar] [CrossRef]
  7. Min, M.; Bai, C.; Guo, J.; Sun, F.; Liu, C.; Wang, F.; Xu, H.; Tang, S.; Li, B.; Di, D.; et al. Estimating Summertime Precipitation from Himawari-8 and Global Forecast System Based on Machine Learning. IEEE Trans. Geosci. Remote Sens. 2019, 57, 2557–2570. [Google Scholar] [CrossRef]
  8. Chen, H.; Chandrasekar, V.; Cifelli, R.; Xie, P. A Machine Learning System for Precipitation Estimation Using Satellite and Ground Radar Network Observations. IEEE Trans. Geosci. Remote Sens. 2020, 58, 982–994. [Google Scholar] [CrossRef]
  9. Zhu, S.; Ma, Z. PECA-FY4A: Precipitation Estimation using Chromatographic Analysis methodology for full-disc multispectral observations from FengYun-4A/ AGRI. Remote Sens. Environ. 2022, 282, 113234. [Google Scholar] [CrossRef]
  10. Dong, Y.; Sun, X.; Li, Q. A Method for Retrieving Cloud-Top Height Based on a Machine Learning Model Using the Himawari-8 Combined with Near Infrared Data. Remote Sens. 2022, 14, 6367. [Google Scholar] [CrossRef]
  11. Tan, Z.; Ma, S.; Zhao, X.; Yan, W.; Lu, W. Evaluation of Cloud Top Height Retrievals from China’s Next-Generation Geostationary Meteorological Satellite FY-4A. J. Meteor. Res. 2019, 33, 553–562. [Google Scholar] [CrossRef]
  12. Wang, Y.B.; Liu, Z.Q.; Yang, S.; Min, J.Z.; Chen, L.Q.; Chen, Y.D.; Zhang, T. Added Value of Assimilating Himawari-8 AHI Water Vapor Radiances on Analyses and Forecasts for “7.19” Severe Storm Over North China. J. Geophys. Res. Atmos. 2018, 123, 3374–3394. [Google Scholar] [CrossRef]
  13. Niu, Z.; Zhang, L.; Dong, P.; Weng, F.; Huang, W.; Zhu, J. Effects of Direct Assimilation of FY-4A AGRI Water Vapor Channels on the Meiyu Heavy-Rainfall Quantitative Precipitation Forecasts. Remote Sens. 2022, 14, 3484. [Google Scholar] [CrossRef]
  14. Ma, Z.; Maddy, E.S.; Zhang, B.; Zhu, T.; Boukabara, S.A. Impact Assessment of Himawari-8 AHI Data Assimilation in NCEP GDAS/GFS with GSI. J. Atmos. Ocean. Technol. 2017, 34, 797–815. [Google Scholar] [CrossRef]
  15. Yang, C.; Liu, Z.; Gao, F.; Childs, P.P.; Min, J. Impact of assimilating GOES imager clear-sky radiance with a rapid refresh assimilation system for convection-permitting forecast over Mexico. J. Geophys. Res. Atmos. 2017, 122, 5472–5490. [Google Scholar] [CrossRef] [Green Version]
  16. Xu, D.; Liu, Z.; Fan, S.; Chen, M.; Shen, F. Assimilating All-sky Infrared Radiances from Himawari-8 Using the 3DVar Method for the Prediction of a Severe Storm over North China. Adv. Atmos. Sci. 2021, 38, 661–676. [Google Scholar] [CrossRef]
  17. Zhang, X.; Xu, D.; Liu, R.; Shen, F. Impacts of FY-4A AGRI Radiance Data Assimilation on the Forecast of the Super Typhoon “In-Fa” (2021). Remote Sens. 2022, 14, 4718. [Google Scholar] [CrossRef]
  18. Lu, Q.F.; Hu, J.Y.; Wu, C.Q.; Qi, C.L.; Wu, S.L.; Xu, N.; Sun, L.; Li, X.Q.; Liu, H.; Guo, Y.; et al. Monitoring the performance of the Fengyun satellite instruments using radiative transfer models and NWP fields. J. Quant. Spectrosc. Radiat. Transf. 2020, 255, 107239. [Google Scholar] [CrossRef]
  19. Zou, X.; Zhuge, X.; Weng, F. Characterization of Bias of Advanced Himawari Imager Infrared Observations from NWP Background Simulations Using CRTM and RTTOV. J. Atmos. Ocean. Technol. 2016, 33, 2553–2567. [Google Scholar] [CrossRef]
  20. Tang, F.; Zhuge, X.; Zeng, M.; Li, X.; Dong, P.; Han, Y. Applications of the Advanced Radiative Transfer Modeling System (ARMS) to Characterize the Performance of Fengyun-4A/AGRI. Remote Sens. 2021, 13, 3120. [Google Scholar] [CrossRef]
  21. Xie, L.; Wu, S.; Wu, R.; Chen, J.; Xu, Z.; Cao, L. Cross-Comparison of Radiation Response Characteristics between the FY-4B/AGRI and GK-2A/AMI in China. Remote Sens. 2023, 15, 779. [Google Scholar] [CrossRef]
  22. He, X.; Xu, N.; Feng, X.; Hu, X.; Xu, H.; Peng, Y. Assessing Radiometric Calibration of FY-4A/AGRI Thermal Infrared Channels Using CrIS and IASI. IEEE Trans. Geosci. Remote Sens. 2022, 60, 1–12. [Google Scholar] [CrossRef]
  23. Zhu, J.; Shu, J.; Guo, W. Biases Characteristics Assessment of the Advanced Geosynchronous Radiation Imager (AGRI) Measurement on Board Fengyun-4A Geostationary Satellite. Remote Sens. 2020, 12, 2817. [Google Scholar] [CrossRef]
  24. Wang, L.; Guo, N.; Wang, W.; Zuo, H. Optimization of the Local Split-Window Algorithm for FY-4A Land Surface Temperature Retrieval. Remote Sens. 2019, 11, 2016. [Google Scholar] [CrossRef] [Green Version]
  25. Wang, X.; Min, M.; Wang, F.; Guo, J.; Li, B.; Tang, S. Intercomparisons of Cloud Mask Products Among Fengyun-4A, Himawari-8, and MODIS. IEEE Trans. Geosci. Remote Sens. 2019, 57, 8827–8839. [Google Scholar] [CrossRef]
  26. Weng, F. Advances in radiative transfer modeling in support of satellite data assimilation. J. Atmos. Sci. 2007, 64, 3799–3807. [Google Scholar] [CrossRef]
  27. Saunders, R.; Hocking, J.; Turner, E.; Rayer, P.; Rundle, D.; Brunel, P.; Vidot, J.; Roquet, P.; Matricardi, M.; Geer, A.; et al. An update on the RTTOV fast radiative transfer model (currently at version 12). Geosci. Model Dev. 2018, 11, 2717–2732. [Google Scholar] [CrossRef] [Green Version]
  28. Ren, L. A case study of GOES-15 imager bias characterization with a numerical weather prediction model. Front. Earth Sci. 2016, 10, 409–418. [Google Scholar] [CrossRef]
  29. Hersbach, H.; Bell, B.; Berrisford, P.; Hirahara, S.; Horanyi, A.; Munoz-Sabater, J.; Nicolas, J.; Peubey, C.; Radu, R.; Schepers, D.; et al. The ERA5 global reanalysis. Q. J. R. Meteorol. Soc. 2020, 146, 1999–2049. [Google Scholar] [CrossRef]
  30. Zhuge, X.; Zou, X.; Weng, F.; Sun, M. Dependence of Simulation Biases at AHI Surface-Sensitive Channels on Land Surface Emissivity over China. J. Atmos. Ocean. Technol. 2018, 35, 1283–1298. [Google Scholar] [CrossRef]
  31. Borbas, E.; Hulley, G.; Knuteson, R.; Feltz, M. MEaSUREs Unified and Coherent Land Surface Temperature and Emissivity (LST&E) Earth System Data Record (ESDR): The Combined ASTER and MODIS Emissivity Database Over Land (CAMEL) Version 2 Users’ Guide. 2019. Available online: https://lpdaac.usgs.gov/documents/219/cam5k30_v2_user_guide_atbd.pdf (accessed on 7 November 2022).
  32. Newman, S.M.; Smith, J.A.; Glew, M.D.; Rogers, S.M.; Taylor, J.P. Temperature and salinity dependence of sea surface emissivity in the thermal infrared. Q. J. R. Meteorol. Soc. 2005, 131, 2539–2557. [Google Scholar] [CrossRef]
  33. Masuda, K. Infrared sea surface emissivity including multiple reflection effect for isotropic Gaussian slope distribution model. Remote Sens. Environ. 2006, 103, 488–496. [Google Scholar] [CrossRef]
  34. Sulla-Menashe, D.; Gray, J.M.; Abercrombie, S.P.; Friedl, M.A. Hierarchical mapping of annual global land cover 2001 to present: The MODIS Collection 6 Land Cover product. Remote Sens. Environ. 2019, 222, 183–194. [Google Scholar] [CrossRef]
  35. Trigo, I.F.; Boussetta, S.; Viterbo, P.; Balsamo, G.; Beljaars, A.; Sandu, I. Comparison of model land skin temperature with remotely sensed estimates and assessment of surface-atmosphere coupling. J. Geophys. Res. Atmos. 2015, 120, 12096–12111. [Google Scholar] [CrossRef] [Green Version]
  36. Weng, F.; Yu, X.; Duan, Y.; Yang, J.; Wang, J. Advanced Radiative Transfer Modeling System (ARMS): A New-Generation Satellite Observation Operator Developed for Numerical Weather Prediction and Remote Sensing Applications. Adv. Atmos. Sci. 2020, 37, 131–136. [Google Scholar] [CrossRef] [Green Version]
  37. Yang, J.; Ding, S.; Dong, P.; Bi, L.; Yi, B. Advanced radiative transfer modeling system developed for satellite data assimilation and remote sensing applications. J. Quant. Spectrosc. Radiat. Transf. 2020, 251, 107043. [Google Scholar] [CrossRef]
  38. Liu, Q.; Weng, F. Advanced doubling-adding method for radiative transfer in planetary atmospheres. J. Atmos. Sci. 2006, 63, 3459–3465. [Google Scholar] [CrossRef]
  39. Shi, Y.-N.; Yang, J.; Weng, F. Discrete Ordinate Adding Method (DOAM), a new solver for Advanced Radiative transfer Modeling System (ARMS). Opt. Express 2021, 29, 4700–4720. [Google Scholar] [CrossRef]
Figure 1. Vertical distribution of Fengyun-4B/AGRI IR channel brightness temperature Jacobians for (a) temperature and (b) water vapor by using U.S. standard atmospheric profile as input.
Remotesensing 15 01224 g001
Figure 2. Spatial distribution of clear-sky pixel counts over (a) ocean and (b) land with satellite zenith angles less than 60° from June to November 2022.
Remotesensing 15 01224 g002
Figure 3. Valid data counts of Fengyun-4B/AGRI 3.75 μm channel from June to November 2022.
Remotesensing 15 01224 g003
Figure 4. Standard deviation between Fengyun-4B/AGRI 3.75 μm brightness temperature observation and RTTOV simulation over ocean (a) from 26 July to 31 July and (b) from 26 October to 31 October 2022 (white color indicates missing data).
Remotesensing 15 01224 g004
Figure 5. Spatial distribution of ~3.75 μm brightness temperature for (ac) Himawari-8/AHI, (df) Fengyun-4B/AGRI and (gi) Fengyun-4A/AGRI (a,d,g) at 0600 UTC, (b,e,h) 1500 UTC and (c,f,i) 1700 UTC on 31 October 2022.
Remotesensing 15 01224 g005aRemotesensing 15 01224 g005b
Figure 6. Frequency distribution of ~3.75 μm brightness temperature with satellite zenith angles less than 60° for (a,b) Himawari-8/AHI, (c,d) Fengyun-4B/AGRI and (e,f) Fengyun-4A/AGRI at 1400, 1500, 1600, 1700 and 1800 UTC in (a,c,e) from 26 July to 31 July and (b,d,f) from 26 October to 31 October 2022.
Remotesensing 15 01224 g006aRemotesensing 15 01224 g006b
Figure 7. Spatial distributions of biases of Fengyun-4B/AGRI channels (ah) 8–15 brightness temperature observations and RTTOV simulations over the ocean under clear-sky conditions and with satellite zenith angles less than 60° from June to November 2022.
Remotesensing 15 01224 g007aRemotesensing 15 01224 g007b
Figure 8. (a) Biases and (b) standard deviations of Fengyun-4B/AGRI channel 8 brightness temperature observations and RTTOV simulations with respect to solar zenith angles calculated at 1° intervals over the ocean under clear-sky conditions and with satellite zenith angles less than 60° from June to November 2022.
Remotesensing 15 01224 g008
Figure 9. Spatial distributions of biases of the Fengyun-4B/AGRI channels (ah) 8–15 brightness temperature observations and RTTOV simulations over land under clear-sky conditions and with satellite zenith angles less than 60° from June to November 2022.
Remotesensing 15 01224 g009aRemotesensing 15 01224 g009b
Figure 10. Biases (a) and standard deviations (b) of Fengyun-4B/AGRI IR channels’ brightness temperature observations and RTTOV simulations with respect to satellite zenith angles calculated at 1° intervals over the ocean under clear-sky conditions and with satellite zenith angles less than 60° from June to November 2022. Pixel numbers calculated at 1° intervals are shown in (c).
Remotesensing 15 01224 g010
Figure 11. (a,b) Biases and (c,d) standard deviations of Fengyun-4B/AGRI IR channels’ brightness temperature observations and RTTOV simulations with respect to scene temperature calculated at 1° intervals over ocean under clear-sky conditions and with satellite zenith angles less than 60° from June to November 2022. Pixel numbers calculated at 1 K intervals are shown in (e).
Remotesensing 15 01224 g011
Table 1. Characteristics of Fengyun-4B/AGRI.
Channel No.Central Wavelength (μm)Wavelength RangeSpatial Resolution (km)NEdTPrimary Application
10.470.45–0.491S/N ≥ 90 (ρ = 100%)Aerosol
20.650.55–0.750.5S/N ≥ 150 (ρ = 100%)Vegetation
30.8250.75–0.901S/N ≥ 200 (ρ = 100%)Vegetation, aerosol
41.3791.371–1.3862S/N ≥ 120 (ρ = 100%)Cirrus
51.611.58–1.642S/N ≥ 200 (ρ = 100%)Snow, cloud phase
62.2252.10–2.352S/N ≥ 200 (ρ = 100%)Cirrus, aerosol
73.753.50–4.002≤0.7 K (315 K)Fire
83.753.50–4.0040.2 K (300 K)Land surface temperature
96.255.80–6.7040.2 K (300 K)Upper-level water vapor
106.956.75–7.1540.25 K (300 K)Mid-level water vapor
117.427.24–7.6040.25 K (300 K)Low-level water vapor
128.558.3–8.840.2 K (300 K)Cloud
1310.8010.3–11.340.7 K (300 K)Cloud, land surface temperature
1412.0011.5–12.540.7 K (300 K)Cloud, land surface temperature
1513.312.00–13.6040.7 K (00 K)Cloud, water vapor
Data were provided by [2].
Table 2. Input variables and parameters for clear-sky simulations with RTTOV v13.1.
CategoryParameterUnitsData Source
Atmosphere VariablesPressurehPaERA5 Reanalysis
TemperatureK
Specific Humiditykg/kg
O3 Mass Mixing Ratiokg/kg
CO2 Mass Mixing RatioppmvConstant
(376 ppmv)
Surface Variables2 m TemperatureKERA5 Reanalysis
Skin TemperatureK
Surface PressurehPa
10 m v-component of Windm/s
10 m u-component of Windm/s
GeometryLatitudedegreeNational Satellite Meteorological Center
Longitudedegree
Solar Zenith Angledegree
Solar Azimuth Angledegree
Satellite Zenith Angledegree
Satellite Azimuth Angledegree
Static DataLand Surface Emissivity-Calculated based on CAMEL_HSRemis
Ocean Surface Emissivity-Calculated within RTTOV
Surface Type-Calculated based on MODIS land cover product(MCD12C1)
Table 3. Biases and standard deviations of Fengyun-4B/AGRI IR channels brightness temperature observations and RTTOV simulations over the ocean under clear-sky conditions and with satellite zenith angles less than 60° from June to November 2022.
Channel NumberBias (K)Std. (K)
80.021.11
90.621.16
100.521.00
11−0.150.71
12−1.011.25
13−1.171.45
14−1.391.65
15−1.301.55
Table 4. Biases and standard deviations of Fengyun-4B/AGRI IR channels brightness temperature observations and RTTOV simulations over land under clear-sky conditions and with satellite zenith angles less than 60° from June to November 2022.
Channel NumberBias (K)Std. (K)
80.483.61
90.471.24
100.421.18
11−0.261.13
12−1.773.16
13−0.882.91
14−1.022.92
15−1.422.31
Disclaimer/Publisher’s Note: The statements, opinions and data contained in all publications are solely those of the individual author(s) and contributor(s) and not of MDPI and/or the editor(s). MDPI and/or the editor(s) disclaim responsibility for any injury to people or property resulting from any ideas, methods, instructions or products referred to in the content.

