
Mapping the Distribution and Dynamics of Coniferous Forests in Large Areas from 1985 to 2020 Combining Deep Learning and Google Earth Engine

 , ,
, ,  and
and
Abstract
:
1. Introduction
2. Materials
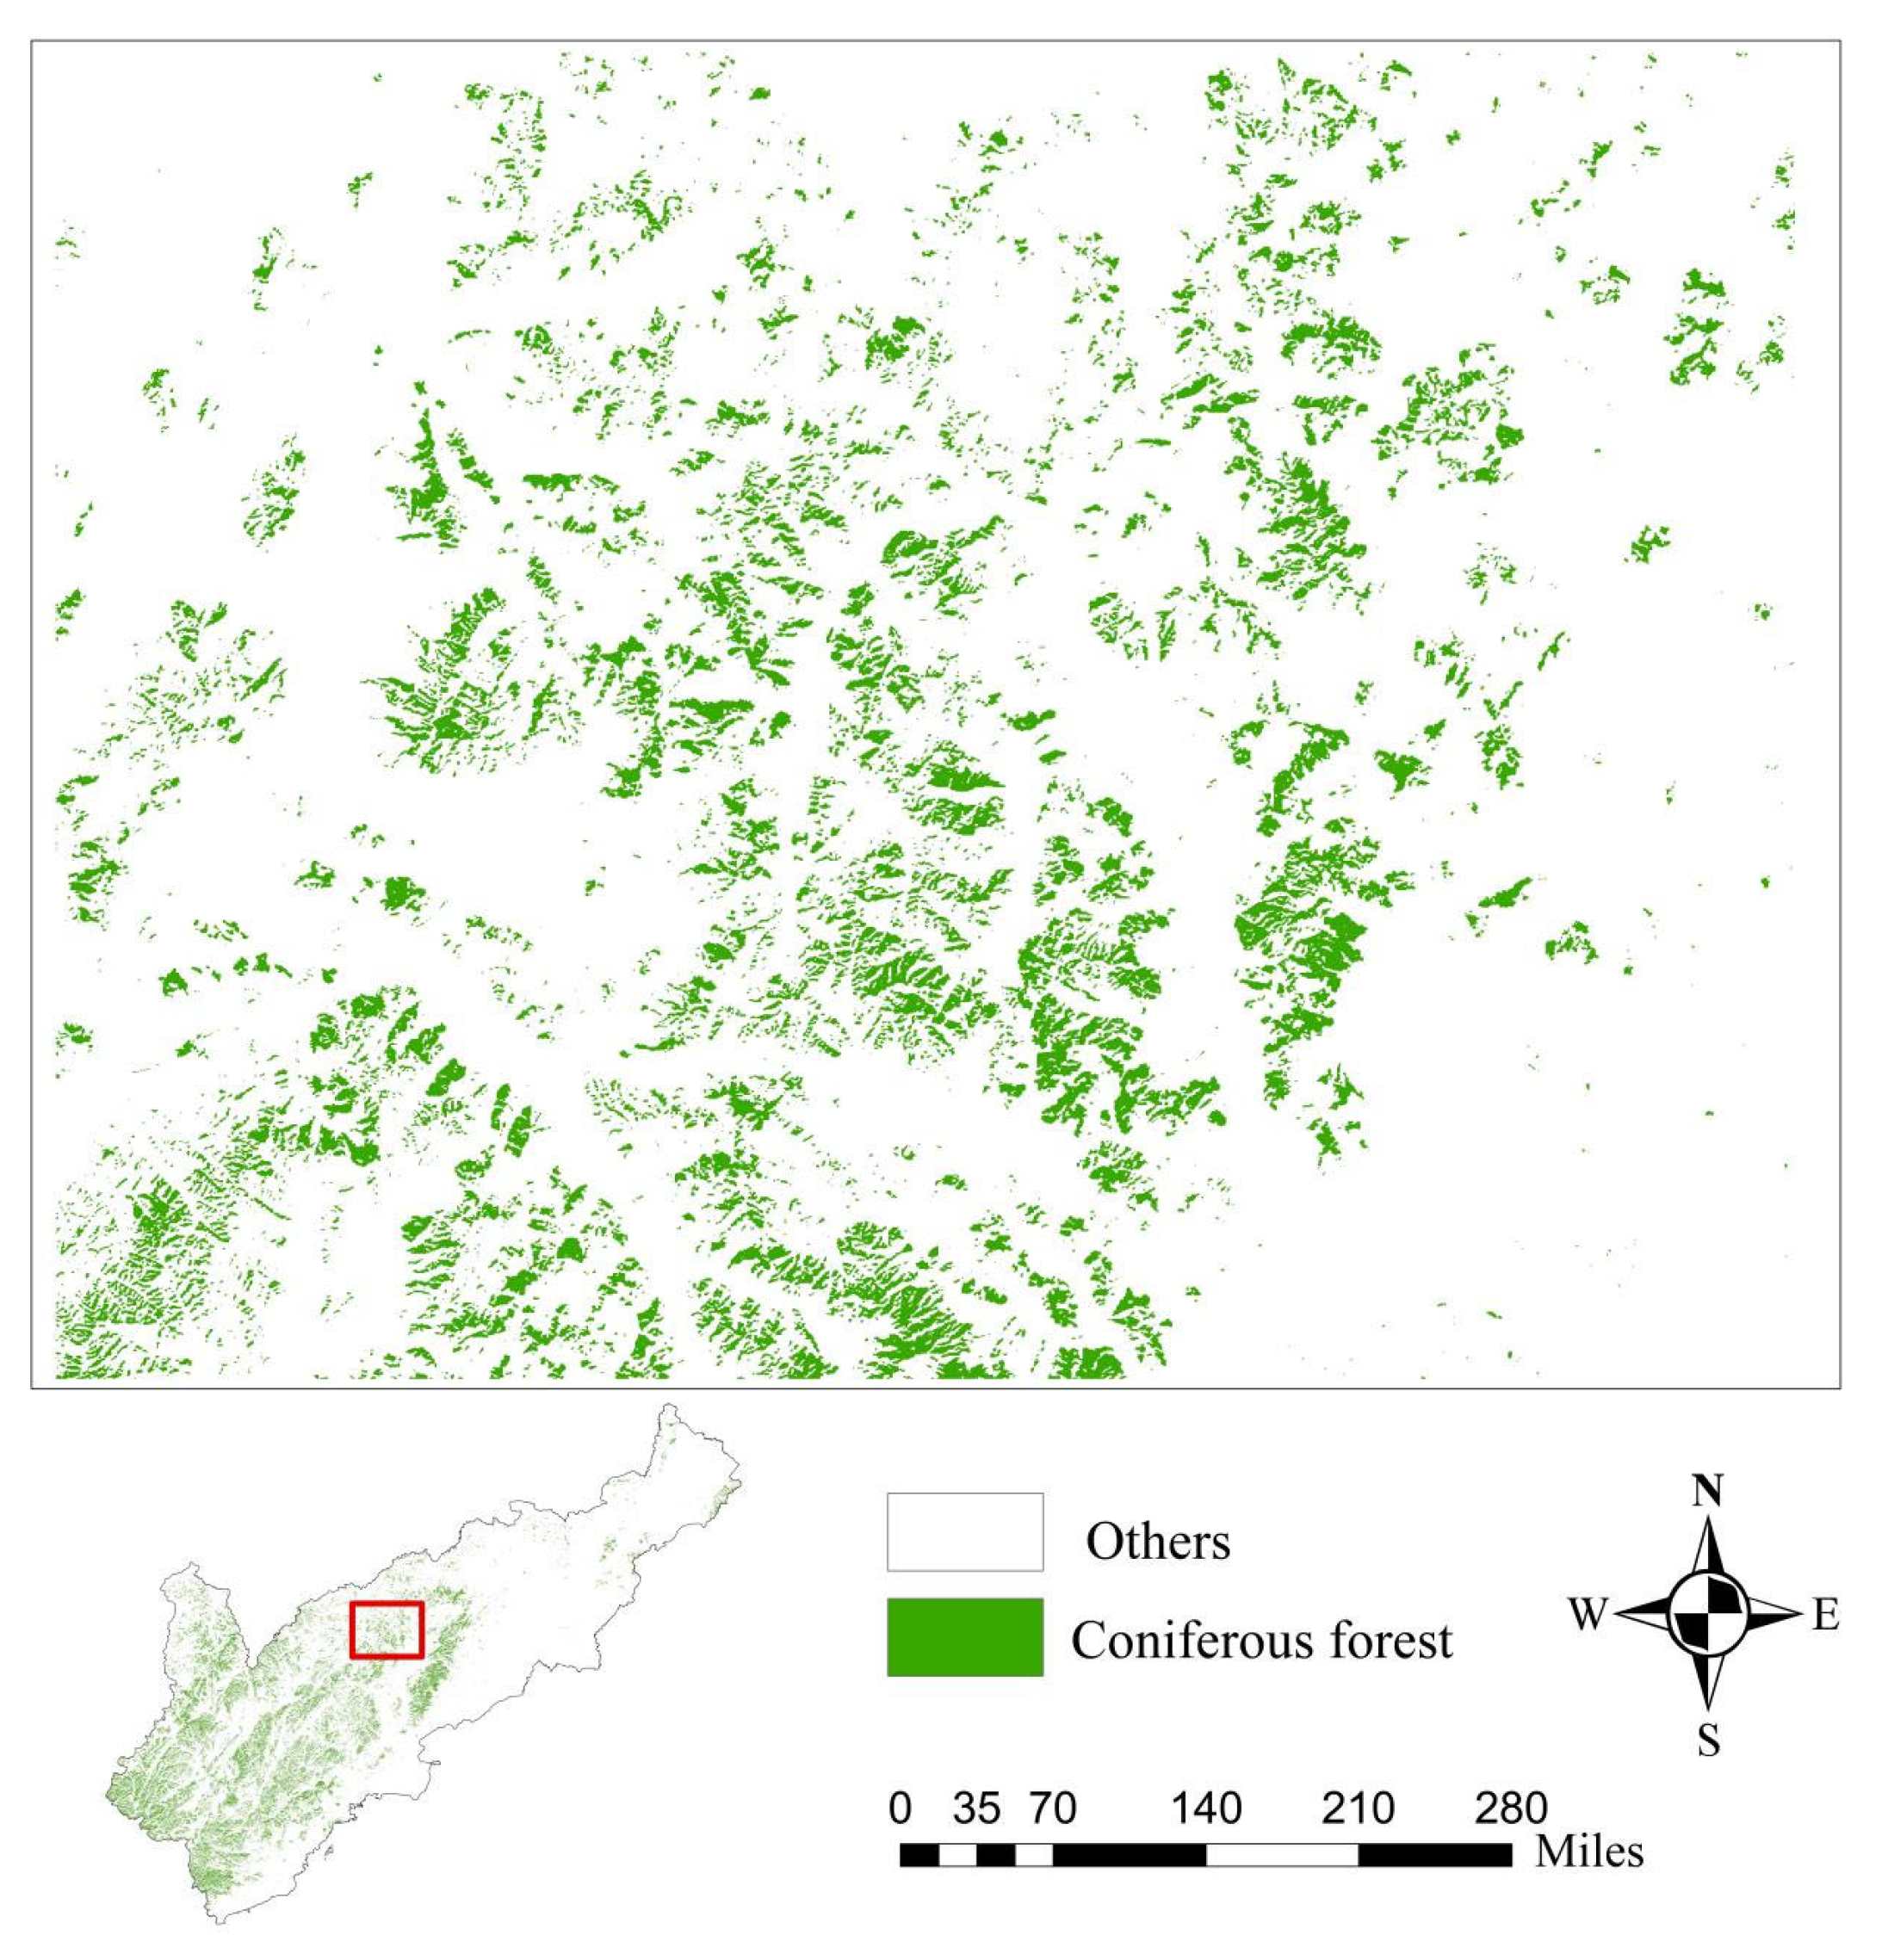
2.1. Study Area
2.2. Landsat Images and Pre-Processing
2.3. Training and Validation Sample Blocks for Deep Learning Models
2.4. Test Sample Points
3. Methods
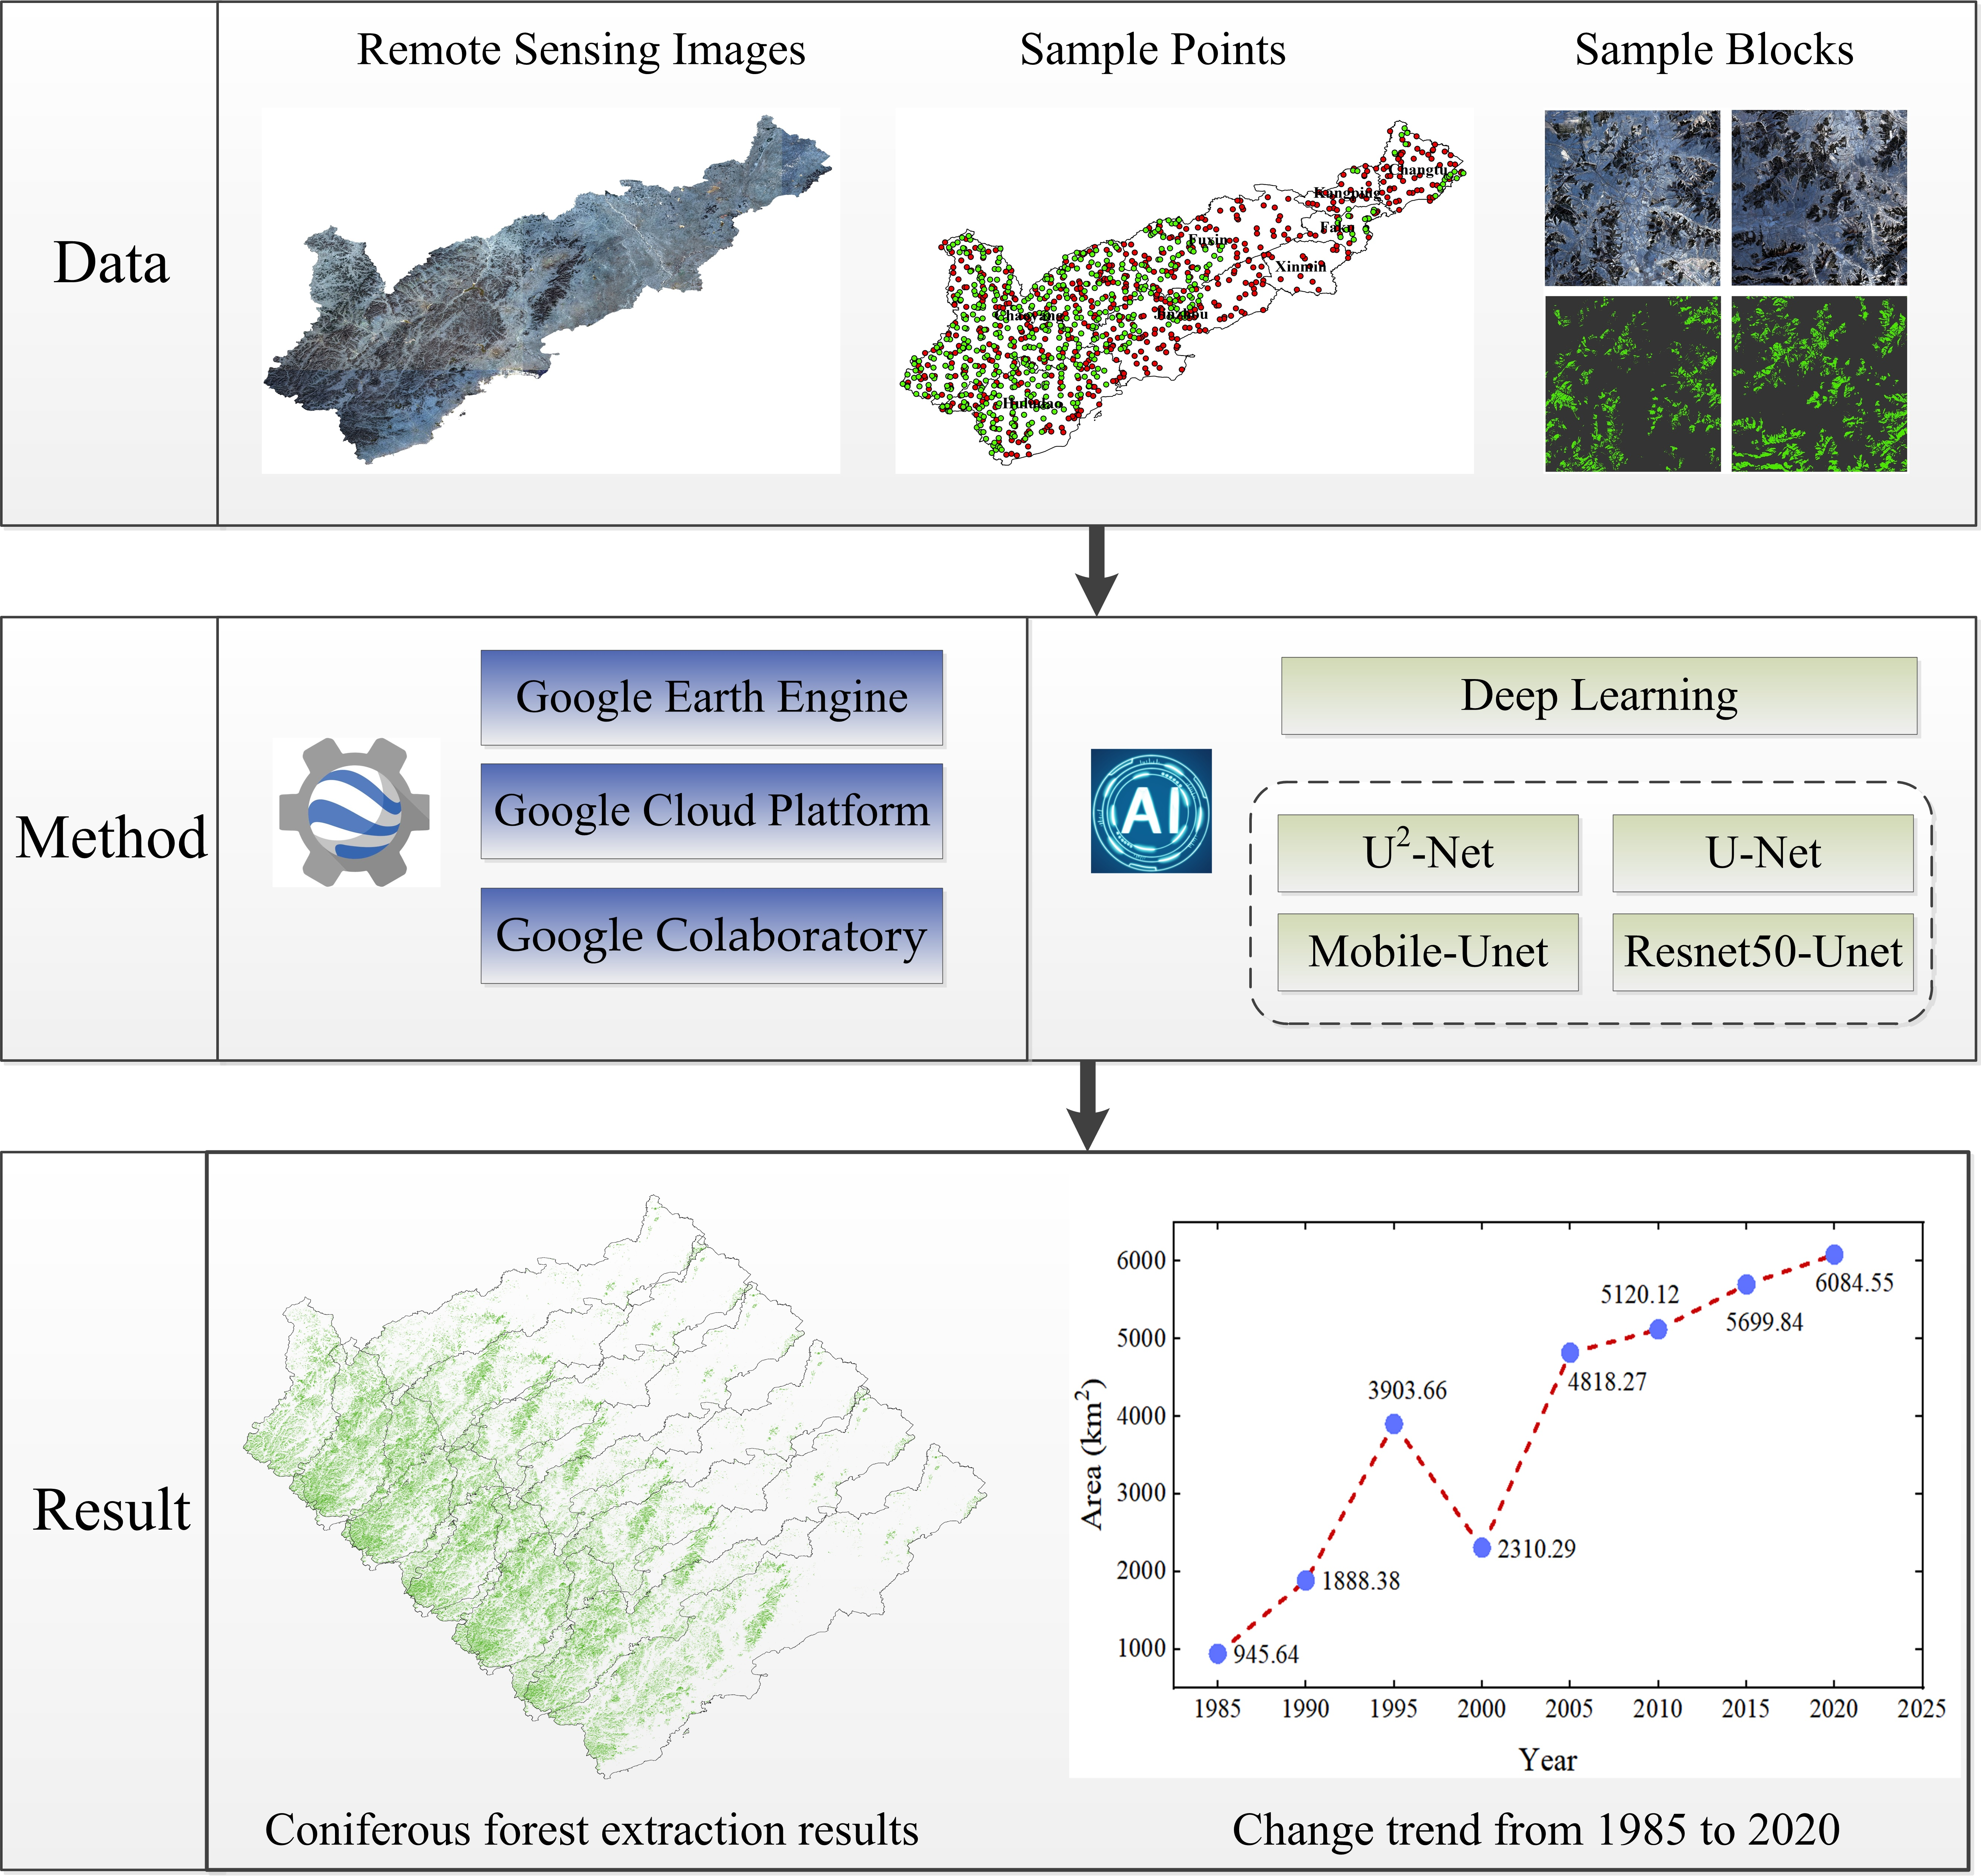
3.1. Workflow Description
3.2. U2-Net
3.2.1. The Architecture of U2-Net
3.2.2. Residual U-Blocks
3.3. Unet Architecture Variants
3.3.1. U-Net
3.3.2. Resnet50-Unet
3.3.3. Mobile-Unet
3.4. Accuracy Assessment
4. Results and Analysis
4.1. Validation of the Models’ Performance
4.2. Temporal Transferability Evaluation of U2-Net
4.3. Comparison with Other Datasets
4.4. The Distribution and Dynamics of Coniferous Forests
5. Discussion
5.1. The Combination of GEE with Deep Learning
5.2. The Performance of U2-Net Model for Coniferous Forest Mapping
5.3. The Distribution and Dynamics of Coniferous Forests
5.4. Limitations and Future Work
6. Conclusions
Author Contributions
Funding
Data Availability Statement
Acknowledgments
Conflicts of Interest
References
- State of the World’s Forests 2020. Available online: https://www.fao.org/state-of-forests/en/ (accessed on 10 November 2022).
- Guimarães, N.; Pádua, L.; Marques, P.; Silva, N.; Peres, E.; Sousa, J.J. Forestry remote sensing from unmanned aerial vehicles: A review focusing on the data, processing and potentialities. Remote Sens. 2020, 12, 1046. [Google Scholar] [CrossRef] [Green Version]
- Pugh, T.A.; Arneth, A.; Kautz, M.; Poulter, B.; Smith, B. Important role of forest disturbances in the global biomass turnover and carbon sinks. Nat. Geosci. 2019, 12, 730–735. [Google Scholar] [CrossRef] [PubMed]
- Bolyn, C.; Lejeune, P.; Michez, A.; Latte, N. Mapping tree species proportions from satellite imagery using spectral–spatial deep learning. Remote Sens. Environ. 2022, 280, 113205. [Google Scholar] [CrossRef]
- Engelmark, O.; Hytteborn, H. Coniferous forests. Acta Phytogeogr. Suec. 1999, 84, 55–74. [Google Scholar]
- Goeking, S.A.; Tarboton, D.G. Forests and water yield: A synthesis of disturbance effects on streamflow and snowpack in western coniferous forests. J. For. 2020, 118, 172–192. [Google Scholar] [CrossRef] [Green Version]
- Bhardwaj, K.; Silva, A.S.; Atanassova, M.; Sharma, R.; Nepovimova, E.; Musilek, K.; Sharma, R.; Alghuthaymi, M.A.; Dhanjal, D.S.; Nicoletti, M. Conifers phytochemicals: A valuable forest with therapeutic potential. Molecules 2021, 26, 3005. [Google Scholar] [CrossRef]
- Farjon, A. A Handbook of the World’s Conifers (2 Vols.); Brill: Leiden, The Netherlands, 2010; Volume 1. [Google Scholar]
- Chen, C.; Condron, L.; Xu, Z. Impacts of grassland afforestation with coniferous trees on soil phosphorus dynamics and associated microbial processes: A review. For. Ecol. Manag. 2008, 255, 396–409. [Google Scholar] [CrossRef]
- Zhang, Q.; Zhang, J.; Wang, C.; Cui, L.; Yan, D. Risk early warning of maize drought disaster in northwestern liaoning province, china. Natural hazards. 2014, 72, 701–710. [Google Scholar] [CrossRef]
- Xie, G.; Li, W.; Xiao, Y.; Zhang, B.; Lu, C.; An, K.; Wang, J.; Xu, K.; Wang, J. Forest ecosystem services and their values in beijing. Chin. Geogr. Sci. 2010, 20, 51–58. [Google Scholar] [CrossRef]
- Yang, X.; Rost, K.T.; Lehmkuhl, F.; Zhenda, Z.; Dodson, J. The evolution of dry lands in northern china and in the republic of mongolia since the last glacial maximum. Quat. Int. 2004, 118, 69–85. [Google Scholar] [CrossRef]
- Jiao-Jun, Z.; Zhi-Ping, F.; De-Hui, Z.; Feng-qi, J.; Takeshi, M. Comparison of stand structure and growth between artificial and natural forests of pinus sylvestiris var. Mong. Sandy Land. J. For. Res. 2003, 14, 103–111. [Google Scholar] [CrossRef]
- Heshmati, G.A. Successful biological methods for combating desertification at degraded areas of China. In Combating Desertification in Asia, Africa and the Middle East: Proven Practices; Springer: Berlin/Heidelberg, Germany, 2013; pp. 49–71. [Google Scholar] [CrossRef]
- Yu, D.; Zhou, L.; Zhou, W.; Ding, H.; Wang, Q.; Wang, Y.; Wu, X.; Dai, L. Forest management in northeast china: History, problems, and challenges. Environ. Manag. 2011, 48, 1122–1135. [Google Scholar] [CrossRef] [PubMed]
- Stanturf, J.A.; Mansourian, S. Forest landscape restoration: State of play. R. Soc. Open Sci. 2020, 7, 201218. [Google Scholar] [CrossRef]
- Qi, S.; Song, B.; Liu, C.; Gong, P.; Luo, J.; Zhang, M.; Xiong, T. Bamboo forest mapping in china using the dense landsat 8 image archive and google earth engine. Remote Sens. 2022, 14, 762. [Google Scholar] [CrossRef]
- Xie, B.; Cao, C.; Xu, M.; Duerler, R.S.; Yang, X.; Bashir, B.; Chen, Y.; Wang, K. Analysis of regional distribution of tree species using multi-seasonal sentinel-1&2 imagery within google earth engine. Forests 2021, 12, 565. [Google Scholar] [CrossRef]
- Luo, H.-X.; Dai, S.-P.; Li, M.-F.; Liu, E.-P.; Zheng, Q.; Hu, Y.-Y.; Yi, X.-P. Comparison of machine learning algorithms for mapping mango plantations based on gaofen-1 imagery. J. Integr. Agric. 2020, 19, 2815–2828. [Google Scholar] [CrossRef]
- Wulder, M.A.; White, J.C.; Loveland, T.R.; Woodcock, C.E.; Belward, A.S.; Cohen, W.B.; Fosnight, E.A.; Shaw, J.; Masek, J.G.; Roy, D.P. The global landsat archive: Status, consolidation, and direction. Remote Sens. Environ. 2016, 185, 271–283. [Google Scholar] [CrossRef] [Green Version]
- Qin, Y.; Xiao, X.; Wigneron, J.-P.; Ciais, P.; Brandt, M.; Fan, L.; Li, X.; Crowell, S.; Wu, X.; Doughty, R. Carbon loss from forest degradation exceeds that from deforestation in the brazilian amazon. Nat. Clim. Change 2021, 11, 442–448. [Google Scholar] [CrossRef]
- Finzi, A.C.; Giasson, M.A.; Barker Plotkin, A.A.; Aber, J.D.; Boose, E.R.; Davidson, E.A.; Dietze, M.C.; Ellison, A.M.; Frey, S.D.; Goldman, E. Carbon budget of the harvard forest long-term ecological research site: Pattern, process, and response to global change. Ecol. Monogr. 2020, 90, e01423. [Google Scholar] [CrossRef]
- McDowell, N.G.; Allen, C.D.; Anderson-Teixeira, K.; Aukema, B.H.; Bond-Lamberty, B.; Chini, L.; Clark, J.S.; Dietze, M.; Grossiord, C.; Hanbury-Brown, A. Pervasive shifts in forest dynamics in a changing world. Science 2020, 368, eaaz9463. [Google Scholar] [CrossRef]
- Senf, C.; Seidl, R. Mapping the forest disturbance regimes of europe. Nat. Sustain. 2021, 4, 63–70. [Google Scholar] [CrossRef]
- Brovelli, M.A.; Sun, Y.; Yordanov, V. Monitoring forest change in the amazon using multi-temporal remote sensing data and machine learning classification on google earth engine. ISPRS Int. J. Geo-Inf. 2020, 9, 580. [Google Scholar] [CrossRef]
- Hirschmugl, M.; Gallaun, H.; Dees, M.; Datta, P.; Deutscher, J.; Koutsias, N.; Schardt, M. Methods for mapping forest disturbance and degradation from optical earth observation data: A review. Curr. For. Rep. 2017, 3, 32–45. [Google Scholar] [CrossRef] [Green Version]
- Hua, J.; Chen, G.; Yu, L.; Ye, Q.; Jiao, H.; Luo, X. Improved mapping of long-term forest disturbance and recovery dynamics in the subtropical china using all available landsat time-series imagery on google earth engine platform. IEEE J. Sel. Top. Appl. Earth Obs. Remote Sens. 2021, 14, 2754–2768. [Google Scholar] [CrossRef]
- Chen, S.; Woodcock, C.E.; Bullock, E.L.; Arévalo, P.; Torchinava, P.; Peng, S.; Olofsson, P. Monitoring temperate forest degradation on google earth engine using landsat time series analysis. Remote Sens. Environ. 2021, 265, 112648. [Google Scholar] [CrossRef]
- Wu, L.; Li, Z.; Liu, X.; Zhu, L.; Tang, Y.; Zhang, B.; Xu, B.; Liu, M.; Meng, Y.; Liu, B. Multi-type forest change detection using bfast and monthly landsat time series for monitoring spatiotemporal dynamics of forests in subtropical wetland. Remote Sens. 2020, 12, 341. [Google Scholar] [CrossRef] [Green Version]
- Reygadas, Y.; Spera, S.; Galati, V.; Salisbury, D.S.; Silva, S.; Novoa, S. Mapping forest disturbances across the southwestern amazon: Tradeoffs between open-source, landsat-based algorithms. Environ. Res. Commun. 2021, 3, 091001. [Google Scholar] [CrossRef]
- Sumsion, G.R.; Bradshaw, M.S.; Hill, K.T.; Pinto, L.D.; Piccolo, S.R. Remote sensing tree classification with a multilayer perceptron. PeerJ 2019, 7, e6101. [Google Scholar] [CrossRef] [Green Version]
- Raczko, E.; Zagajewski, B. Comparison of support vector machine, random forest and neural network classifiers for tree species classification on airborne hyperspectral apex images. Eur. J. Remote Sens. 2017, 50, 144–154. [Google Scholar] [CrossRef] [Green Version]
- Liu, L.; Guo, Y.; Li, Y.; Zhang, Q.; Li, Z.; Chen, E.; Yang, L.; Mu, X. Comparison of machine learning methods applied on multi-source medium-resolution satellite images for chinese pine (Pinus tabulaeformis) extraction on google earth engine. Forests 2022, 13, 677. [Google Scholar] [CrossRef]
- Zhang, B.; Zhao, L.; Zhang, X. Three-dimensional convolutional neural network model for tree species classification using airborne hyperspectral images. Remote Sens. Environ. 2020, 247, 111938. [Google Scholar] [CrossRef]
- Guo, Y.; Li, Z.; Chen, E.; Zhang, X.; Zhao, L.; Xu, E.; Hou, Y.; Liu, L. A deep fusion unet for mapping forests at tree species levels with multi-temporal high spatial resolution satellite imagery. Remote Sens. 2021, 13, 3613. [Google Scholar] [CrossRef]
- Liu, B.; Chen, S.; Huang, H.; Tian, X. Tree species classification of backpack laser scanning data using the pointnet++ point cloud deep learning method. Remote Sens. 2022, 14, 3809. [Google Scholar] [CrossRef]
- Qin, X.; Zhang, Z.; Huang, C.; Dehghan, M.; Zaiane, O.R.; Jagersand, M. U2-net: Going deeper with nested u-structure for salient object detection. Pattern Recognit. 2020, 106, 107404. [Google Scholar] [CrossRef]
- Gorelick, N.; Hancher, M.; Dixon, M.; Ilyushchenko, S.; Thau, D.; Moore, R. Google earth engine: Planetary-scale geospatial analysis for everyone. Remote Sens. Environ. 2017, 202, 18–27. [Google Scholar] [CrossRef]
- Mutanga, O.; Kumar, L. Google earth engine applications. Remote Sens. 2019, 11, 591. [Google Scholar] [CrossRef] [Green Version]
- Kandekar, V.U.; Pande, C.B.; Rajesh, J.; Atre, A.; Gorantiwar, S.; Kadam, S.; Gavit, B. Surface water dynamics analysis based on sentinel imagery and google earth engine platform: A case study of jayakwadi dam. Sustain. Water Resour. Manag. 2021, 7, 44. [Google Scholar] [CrossRef]
- Pande, C.B. Land use/land cover and change detection mapping in rahuri watershed area (ms), india using the google earth engine and machine learning approach. Geocarto Int. 2022, 1–15. [Google Scholar] [CrossRef]
- Jin, Z.; Azzari, G.; You, C.; Di Tommaso, S.; Aston, S.; Burke, M.; Lobell, D.B. Smallholder maize area and yield mapping at national scales with google earth engine. Remote Sens. Environ. 2019, 228, 115–128. [Google Scholar] [CrossRef]
- Gxokwe, S.; Dube, T.; Mazvimavi, D. Leveraging google earth engine platform to characterize and map small seasonal wetlands in the semi-arid environments of South Africa. Sci. Total Environ. 2022, 803, 150139. [Google Scholar] [CrossRef]
- Zhang, H. Analysis of Farmland Drought Index and Landscape Index in Northwest Liaoning Province Based on Remote Sensing Data. Master’s Thesis, Shenyang Agricultural University, Shenyang City, China, 2022. (In Chinese) [Google Scholar] [CrossRef]
- Liaoning. Available online: https://en.wikipedia.org/wiki/Liaoning (accessed on 20 June 2022).
- Liu, X.; Zhang, J.; Ma, D.; Bao, Y.; Tong, Z.; Liu, X. Dynamic risk assessment of drought disaster for maize based on integrating multi-sources data in the region of the northwest of liaoning province, china. Nat. Hazards 2013, 65, 1393–1409. [Google Scholar] [CrossRef]
- Kong, T.; Liu, Z.-W.; Shen, H.-O.; Wang, Z.-Y.; Wang, D.-L.; Sun, P.-F.; Wang, Y.-X. Effects of apple-soybean intercropping on soil nutrient and microbial biomass distribution in sandy land of northwest Liaoning province. Chin. J. Ecol. 2021, 40, 340. [Google Scholar] [CrossRef]
- Lv, J. Ecological Characteristics and Effect of Artificial Apocynum in Wind-Sand Land of Northwest Liaoning Province. Master’s Thesis, Liaoning Technical University, Fuxin City, China, 2020. (In Chinese) [Google Scholar] [CrossRef]
- Great Green Wall (China). Available online: https://en.wikipedia.org/wiki/Great_Green_Wall_(China) (accessed on 15 July 2022).
- Zhang, T.; Li, Y.; Ma, Y.; Dong, L.; Zhan, J.; Zhou, Y. Four main afforestation tree species in the wind erosion area of Northwest Liaoning for wind protection and sand fixation Functional difference and suitable site analysis. Jiangsu Agric. Sci. 2019, 47, 112–116. (In Chinese) [Google Scholar] [CrossRef]
- Song, Y. Soil Chemical Properties and Thei rRelations with Stand Growth of Typical Afforestation Tree Species in Northwest Liaoning Province. J. Northwest For. Univ. 2017, 3, 18–24. (In Chinese) [Google Scholar] [CrossRef]
- Zheng, L. Management Techniques of noncommercial forest of Pinus tabuliformis in northwest Liaoning. Prot. For. Sci. Technol. 2019, 6, 91–92. (In Chinese) [Google Scholar] [CrossRef]
- Ma, W. Research Report on Degradation and Renewal of Sanbei Protective Forest Stands. For. Sci. Technol. 2016, 3, 10–15. [Google Scholar] [CrossRef]
- Xue, J.; Su, B. Significant remote sensing vegetation indices: A review of developments and applications. J. Sens. 2017, 2017, 1353691. [Google Scholar] [CrossRef] [Green Version]
- Zarro, C.; Cerra, D.; Auer, S.; Ullo, S.L.; Reinartz, P. Urban sprawl and covid-19 impact analysis by integrating deep learning with google earth engine. Remote Sens. 2022, 14, 2038. [Google Scholar] [CrossRef]
- Ye, Z.; Wei, J.; Lin, Y.; Guo, Q.; Zhang, J.; Zhang, H.; Deng, H.; Yang, K. Extraction of olive crown based on uav visible images and the u2-net deep learning model. Remote Sens. 2022, 14, 1523. [Google Scholar] [CrossRef]
- Wei, X.; Li, X.; Liu, W.; Zhang, L.; Cheng, D.; Ji, H.; Zhang, W.; Yuan, K. Building outline extraction directly using the u2-net semantic segmentation model from high-resolution aerial images and a comparison study. Remote Sens. 2021, 13, 3187. [Google Scholar] [CrossRef]
- Zou, Z.; Chen, C.; Liu, Z.; Zhang, Z.; Liang, J.; Chen, H.; Wang, L. Extraction of aquaculture ponds along coastal region using u2-net deep learning model from remote sensing images. Remote Sens. 2022, 14, 4001. [Google Scholar] [CrossRef]
- Shao, J.; Zhou, K.; Cai, Y.-H.; Geng, D.-Y. Application of an improved u2-net model in ultrasound median neural image segmentation. Ultrasound Med. Biol. 2022, 48, 2512–2520. [Google Scholar] [CrossRef] [PubMed]
- Zhao, F.; Sun, R.; Zhong, L.; Meng, R.; Huang, C.; Zeng, X.; Wang, M.; Li, Y.; Wang, Z. Monthly mapping of forest harvesting using dense time series sentinel-1 sar imagery and deep learning. Remote Sens. Environ. 2022, 269, 112822. [Google Scholar] [CrossRef]
- Dong, S.; Wang, P.; Abbas, K. A survey on deep learning and its applications. Comput. Sci. Rev. 2021, 40, 100379. [Google Scholar] [CrossRef]
- Ronneberger, O.; Fischer, P.; Brox, T. U-net: Convolutional networks for biomedical image segmentation. In Proceedings of the International Conference on Medical Image Computing and Computer-Assisted Intervention, Munich, Germany, 5–9 October 2015; pp. 234–241. [Google Scholar] [CrossRef] [Green Version]
- He, K.; Zhang, X.; Ren, S.; Sun, J. Deep residual learning for image recognition. In Proceedings of the IEEE Conference on Computer Vision and Pattern Recognition, Las Vegas, NV, USA, 27–30 June 2016; pp. 770–778. [Google Scholar] [CrossRef] [Green Version]
- Hu, F.; Santagostino, S.F.; Danilenko, D.M.; Tseng, M.; Brumm, J.; Zehnder, P.; Wu, K.C. Assessment of skin toxicity in an in vitro reconstituted human epidermis model using deep learning. Am. J. Pathol. 2022, 192, 687–700. [Google Scholar] [CrossRef] [PubMed]
- Lefkovits, S.; Lefkovits, L. U-net architecture variants for brain tumor segmentation of histogram corrected images. Acta Univ. Sapientiae Inform. 2022, 14, 49–74. [Google Scholar] [CrossRef]
- Sandler, M.; Howard, A.; Zhu, M.; Zhmoginov, A.; Chen, L.-C. Mobilenetv2: Inverted residuals and linear bottlenecks. In Proceedings of the IEEE Conference on Computer Vision and Pattern Recognition, Salt Lake City, UT, USA, 18–23 June 2018; pp. 4510–4520. [Google Scholar] [CrossRef] [Green Version]
- Jing, J.; Wang, Z.; Rätsch, M.; Zhang, H. Mobile-unet: An efficient convolutional neural network for fabric defect detection. Text. Res. J. 2022, 92, 30–42. [Google Scholar] [CrossRef]
- Poortinga, A.; Thwal, N.S.; Khanal, N.; Mayer, T.; Bhandari, B.; Markert, K.; Nicolau, A.P.; Dilger, J.; Tenneson, K.; Clinton, N. Mapping sugarcane in thailand using transfer learning, a lightweight convolutional neural network, nicfi high resolution satellite imagery and google earth engine. ISPRS Open J. Photogramm. Remote Sens. 2021, 1, 100003. [Google Scholar] [CrossRef]
- Yoon, H.-S.; Park, S.-W.; Yoo, J.-H. Real-time hair segmentation using mobile-unet. Electronics 2021, 10, 99. [Google Scholar] [CrossRef]
- Chen, J.; Chen, J.; Liao, A.; Cao, X.; Chen, L.; Chen, X.; He, C.; Han, G.; Peng, S.; Lu, M. Global land cover mapping at 30 m resolution: A pok-based operational approach. ISPRS J. Photogramm. Remote Sens. 2015, 103, 7–27. [Google Scholar] [CrossRef] [Green Version]
- Zhang, X.; Liu, L.; Chen, X.; Gao, Y.; Xie, S.; Mi, J. Glc_fcs30: Global land-cover product with fine classification system at 30 m using time-series landsat imagery. Earth Syst. Sci. Data 2021, 13, 2753–2776. [Google Scholar] [CrossRef]
- Gong, P.; Wang, J.; Yu, L.; Zhao, Y.; Zhao, Y.; Liang, L.; Niu, Z.; Huang, X.; Fu, H.; Liu, S. Finer resolution observation and monitoring of global land cover: First mapping results with landsat tm and etm+ data. Int. J. Remote Sens. 2013, 34, 2607–2654. [Google Scholar] [CrossRef] [Green Version]
- Wang, C.; Du, P.; Wu, H.; Li, J.; Zhao, C.; Zhu, H. A cucumber leaf disease severity classification method based on the fusion of deeplabv3+ and u-net. Comput. Electron. Agric. 2021, 189, 106373. [Google Scholar] [CrossRef]
- Junjie, Z.; Ling, W.; Yuan, L.; Chengyuan, W.; Xuegang, M. Assessing the effects of china’s three-north shelter forest program over 40 years. Sci. Total Environ. 2022, 857, 159354. [Google Scholar] [CrossRef]
- Zhao, L.; Zhang, J.; Duan, R.; Xu, C. Development and challenges of china’s ecological non-commercial forest certification policy. Forests 2023, 14, 214. [Google Scholar] [CrossRef]
- Wang, Y.; Guo, C.-H.; Chen, X.-J.; Jia, L.-Q.; Guo, X.-N.; Chen, R.-S.; Zhang, M.-s.; Chen, Z.-Y.; Wang, H.-D. Carbon peak and carbon neutrality in china: Goals, implementation path and prospects. China Geol. 2021, 4, 720–746. [Google Scholar] [CrossRef]
- Udali, A.; Lingua, E.; Persson, H.J. Assessing forest type and tree species classification using sentinel-1 c-band sar data in southern sweden. Remote Sens. 2021, 13, 3237. [Google Scholar] [CrossRef]
- Immitzer, M.; Atzberger, C.; Koukal, T. Tree species classification with random forest using very high spatial resolution 8-band worldview-2 satellite data. Remote Sens. 2012, 4, 2661–2693. [Google Scholar] [CrossRef] [Green Version]
- Uspenskaya-Cadoz, O.; Alamuri, C.; Wang, L.; Yang, M.; Khinda, S.; Nigmatullina, Y.; Cao, T.; Kayal, N.; O’Keefe, M.; Rubel, C. Machine learning algorithm helps identify non-diagnosed prodromal alzheimer’s disease patients in the general population. J. Prev. Alzheimer’s Dis. 2019, 6, 185–191. [Google Scholar] [CrossRef]
- Yang, X.; Zhang, Y.; Lv, W.; Wang, D. Image recognition of wind turbine blade damage based on a deep learning model with transfer learning and an ensemble learning classifier. Renew. Energy 2021, 163, 386–397. [Google Scholar] [CrossRef]
- Zhu, L.; Liu, X.; Wu, L.; Tang, Y.; Meng, Y. Long-term monitoring of cropland change near dongting lake, china, using the landtrendr algorithm with landsat imagery. Remote Sens. 2019, 11, 1234. [Google Scholar] [CrossRef] [Green Version]
- Long, X.; Li, X.; Lin, H.; Zhang, M. Mapping the vegetation distribution and dynamics of a wetland using adaptive-stacking and google earth engine based on multi-source remote sensing data. Int. J. Appl. Earth Obs. Geoinf. 2021, 102, 102453. [Google Scholar] [CrossRef]
- Xu, H.; Qi, S.; Li, X.; Gao, C.; Wei, Y.; Liu, C. Monitoring three-decade dynamics of citrus planting in southeastern china using dense landsat records. Int. J. Appl. Earth Obs. Geoinf. 2021, 103, 102518. [Google Scholar] [CrossRef]


| Satellites | Sensors | Bands | Time | Spatial Resolution |
|---|---|---|---|---|
| Landsat 5 | TM | B1, B2, B3, B4, B5, B7 | 1985, 1990, 1995 | 30 m |
| Landsat 7 | ETM+ | B1, B2, B3, B4, B5, B7 | 2000, 2005, 2010 | 30 m |
| Landsat 8 | OLI | B2, B3, B4, B5, B6, B7 | 2015, 2020 | 30 m |
| Spectral Indices | Calculation Formula |
|---|---|
| NDVI | (BNIR − BRed)/(BNIR + BRed) |
| NDWI | (BGreen − BNIR)/(BGreen + BNIR) |
| EVI | 2.5 × (BNIR − BRed)/(BNIR + 6 × BRed − 7.5 × BBlue + 1) |
| MSAVI | (2 × BNIR + 1 − sqrt((2 × BNIR + 1)2 – 8 × (BNIR − BRed)))/2 |
| Periods | Coniferous Forests | Other Types | Total | ||
|---|---|---|---|---|---|
| Chinese Pine, Pinus sylvestris var. mongolica | Water | Building | Farmland, Grassland, Bare Land, Other Vegetation | ||
| 1990 | 531 | 200 | 212 | 256 | 1199 |
| 2010 | 520 | 200 | 232 | 278 | 1230 |
| 2020 | 501 | 200 | 207 | 298 | 1206 |
| Models | F1-Score | Precision | Recall | OA | Kappa |
|---|---|---|---|---|---|
| U2-Net | 0.954 | 0.942 | 0.966 | 0.955 | 0.94 |
| Resnet50-Unet | 0.943 | 0.923 | 0.964 | 0.946 | 0.921 |
| Mobile-Unet | 0.932 | 0.904 | 0.952 | 0.932 | 0.893 |
| U-Net | 0.928 | 0.896 | 0.899 | 0.933 | 0.897 |
| Years | Increased Area (km2) | Reduced Area (km2) | Net Increased Area (km2) | Percentage of Net Increased Area (%) | Percentage of Disturbed Area (%) | Average Annual Growth Rate (%) |
|---|---|---|---|---|---|---|
| 1985–1990 | 1179 | 236.6 | 942.4 | 1.50 | 2.27 | 0.30 |
| 1990–1995 | 2101.66 | 86.38 | 2015.28 | 3.20 | 3.50 | 0.65 |
| 1995–2000 | 263.45 | 1856.45 | −1593.00 | −2.53 | 3.39 | −0.51 |
| 2000–2005 | 2662.53 | 154.55 | 2507.98 | 3.99 | 4.51 | 0.80 |
| 2005–2010 | 818.88 | 516.97 | 301.91 | 0.48 | 2.14 | 0.10 |
| 2010–2015 | 1359.43 | 779.74 | 579.69 | 0.92 | 3.43 | 0.19 |
| 2015–2020 | 1020.48 | 635.88 | 384.60 | 0.61 | 2.66 | 0.12 |
Disclaimer/Publisher’s Note: The statements, opinions and data contained in all publications are solely those of the individual author(s) and contributor(s) and not of MDPI and/or the editor(s). MDPI and/or the editor(s) disclaim responsibility for any injury to people or property resulting from any ideas, methods, instructions or products referred to in the content. |
© 2023 by the authors. Licensee MDPI, Basel, Switzerland. This article is an open access article distributed under the terms and conditions of the Creative Commons Attribution (CC BY) license (https://creativecommons.org/licenses/by/4.0/).
Share and Cite
Liu, L.; Zhang, Q.; Guo, Y.; Chen, E.; Li, Z.; Li, Y.; Wang, B.; Ri, A. Mapping the Distribution and Dynamics of Coniferous Forests in Large Areas from 1985 to 2020 Combining Deep Learning and Google Earth Engine. Remote Sens. 2023, 15, 1235. https://doi.org/10.3390/rs15051235
Liu L, Zhang Q, Guo Y, Chen E, Li Z, Li Y, Wang B, Ri A. Mapping the Distribution and Dynamics of Coniferous Forests in Large Areas from 1985 to 2020 Combining Deep Learning and Google Earth Engine. Remote Sensing. 2023; 15(5):1235. https://doi.org/10.3390/rs15051235
Chicago/Turabian StyleLiu, Lizhi, Qiuliang Zhang, Ying Guo, Erxue Chen, Zengyuan Li, Yu Li, Bing Wang, and Ana Ri. 2023. "Mapping the Distribution and Dynamics of Coniferous Forests in Large Areas from 1985 to 2020 Combining Deep Learning and Google Earth Engine" Remote Sensing 15, no. 5: 1235. https://doi.org/10.3390/rs15051235
APA StyleLiu, L., Zhang, Q., Guo, Y., Chen, E., Li, Z., Li, Y., Wang, B., & Ri, A. (2023). Mapping the Distribution and Dynamics of Coniferous Forests in Large Areas from 1985 to 2020 Combining Deep Learning and Google Earth Engine. Remote Sensing, 15(5), 1235. https://doi.org/10.3390/rs15051235