Article

The Dynamic Simulation and Potential Hazards Analysis of the Yigong Landslide in Tibet, China

1
Institute of Geomechanics, Chinese Academy of Geological Sciences, Beijing 100081, China
2
Key Laboratory of Active Tectonics and Geological Safety, Ministry of Natural Resources, Beijing 100081, China
3
China Institute of Geological Environment Monitoring, Beijing 100081, China
4
School of Geological Engineering and Geomatics, Chang’an University, Xi’an 710054, China
*
Author to whom correspondence should be addressed.
Remote Sens. 2023, 15(5), 1322; https://doi.org/10.3390/rs15051322
Submission received: 17 December 2022 / Revised: 24 February 2023 / Accepted: 24 February 2023 / Published: 27 February 2023
(This article belongs to the Section Remote Sensing in Geology, Geomorphology and Hydrology)

Abstract

:
High-altitude and long-runout landslides, commonly forming chains of secondary disasters, frequently occur in the Yigong Zangbo Basin, which has a complex geologic background. Identifying the potential hazards posed by disaster chains plays a vital role in assessing geohazards. Analysis of the potential hazards related to a landslide that occurred on 9 April 2000, in Tibet, China, known as the Yigong landslide, is studied using remote sensing technology and numerical simulations. Due to the warming of the climate, more extreme dry–wet cycles, and frequent earthquakes, the Yigong landslide area became extremely fragile and more sensitive to perturbations. Based on multiphase optical remote sensing and InSAR (Interferometric Synthetic Aperture Radar) technology, risk monitoring and identification of the Yigong landslide was conducted. The results show that there are two displacement deformation areas. These areas have a maximum displacement deformation rate of 60 mm/year and a maximum accumulative displacement of 160 mm and are likely to reoccur. Additionally, the risks of deformation areas collapsing and blocking the river, which would likely form a disaster chain, were analyzed by prediction simulation based on the numerical back-analysis associated with the 2000 Yigong landslide. The results show that if only one displacement deformation area collapses, the maximum accumulation height would reach 76 m; if the displacement deformation areas both collapse, the maximum accumulation height would reach 106 m. Both conditions would set off disaster chains resulting in river blockages and subsequent flood disasters. Therefore, this work demonstrates that prediction analysis based on remote sensing technology and numerical simulations are effective methods for identifying potential geohazards.

1. Introduction

On 9 April 2000, the disaster chain of a landslide-debris flow-blocked dam flood occurred in Yigong village, Tibet, China. A rock mass of approximately 9.60 × 10⁷ m3 collapsed from an elevation of 5200 m and formed a dam 4.6 km long, 3 km wide, and 60 to 110 m high, with a total accumulated volume of approximately 3.00 × 10⁸ m3. On 10 June 2000, the dam broke and initiated a huge flooding event. The outburst flood entered the Yigong Zangpo River, flowed into the Yarlung Zangpo River, passed through Motuo County, and flowed into India. The flood destroyed roads, bridges, farmland, houses, communication facilities, and vegetation within its path. More than 4000 people were affected, causing a direct economic loss of more than 140 million yuan.
High-altitude and long-runout landslides are a difficult challenge in geohazards studies because they endanger areas situated far from the landslide source. This kind of disaster can cover long distances at high speeds, can have high energy, and can impact large areas. Therefore, they have become the object of extensive research, aimed not only at characterizing their mechanisms and dynamics but also at evaluating future trends [1,2,3,4,5]. On the Qinghai–Tibet Plateau, the characteristics of disasters are particularly important and often result in disaster chains (e.g., a landslide-debris flow-blocked dam flood). Because the vertical descent experienced by landslides in this area may exceed 1500 m and because these landslides may also traverse lateral distances as large as 5 km, these landslides are categorized as ultrahigh-altitude and ultralong-runout disasters. Furthermore, this area has experienced several catastrophic debris avalanches throughout its history [6,7,8]. Under the effect of global warming, glacial retreat and degradation is occurring at an accelerated pace, and the cycle of dry–wet conditions is intensifying. Additionally, the Qinghai–Tibet Plateau has strong tectonic activity and experiences frequent earthquakes, causing rapid and long-runout landslide disaster chains to occur frequently [9,10,11]. For example, after the Milin earthquake in 2017, two river-blocking events occurred successively in the Sedongpu Gully, reflecting a situation that frequently occurs [12,13]. When considering high-altitude and long-runout landslides, the research focus remains on analysis of past events. However, for frequent and recurrent disaster chains, it is necessary to focus on reasonably predicting and analysing the future risk posed by these events.
The identification of potential sources of risk in high-altitude mountains and the prediction of long-runout disaster chains are the key issues of concern when studying disaster chains in the Qinghai–Tibet Plateau. Remote sensing (RS) is an efficient method widely used to analyze landslide displacement deformations over large mountain regions, which are difficult to access by ground surveys [14,15,16]. Remote sensing can monitor the displacement deformation area of landslides effectively and obtain time series on displacement data and displacement rate data, which allow the user to accurately assess the size and risk posed by a given potential main sliding body [17,18,19]. Numerical simulation based on landslide dynamics is an effective method to assess the future disaster chain risks. Among them, DAN3D, based on smooth particle hydrodynamics (SPH), can successfully simulate landslide disasters through remote sensing-based inversions and is widely used in the back-analysis of landslides [20,21,22].
The risks of the Yigong landslide collapsing again and blocking the river to form a deposits dam, which would likely form a disaster chain, are analyzed by combining INSAR and numerical simulation techniques. Firstly, the earthquake, rainfall, and temperature change of the Yigong landslide are analyzed as the geological factors that could cause the recurrence. Furthermore, combined with multiphase optical satellite remote sensing data and InSAR data, the characteristics of the potential displacement deformation areas are interpreted. Finally, using numerical simulation back-analysis, the motion and accumulation process after the collapse of the displacement deformation areas are predicted. The results show that if the displacement deformation areas collapse, they will cause the recurrence of the 2000 Yigong landslide event, or an even more serious event. Therefore, we should pay sufficient attention to the displacement deformation areas of the Yigong landslide. Simultaneously, this methodology provides preliminary data and scientific references for the study of landslide disaster chains.

2. Background

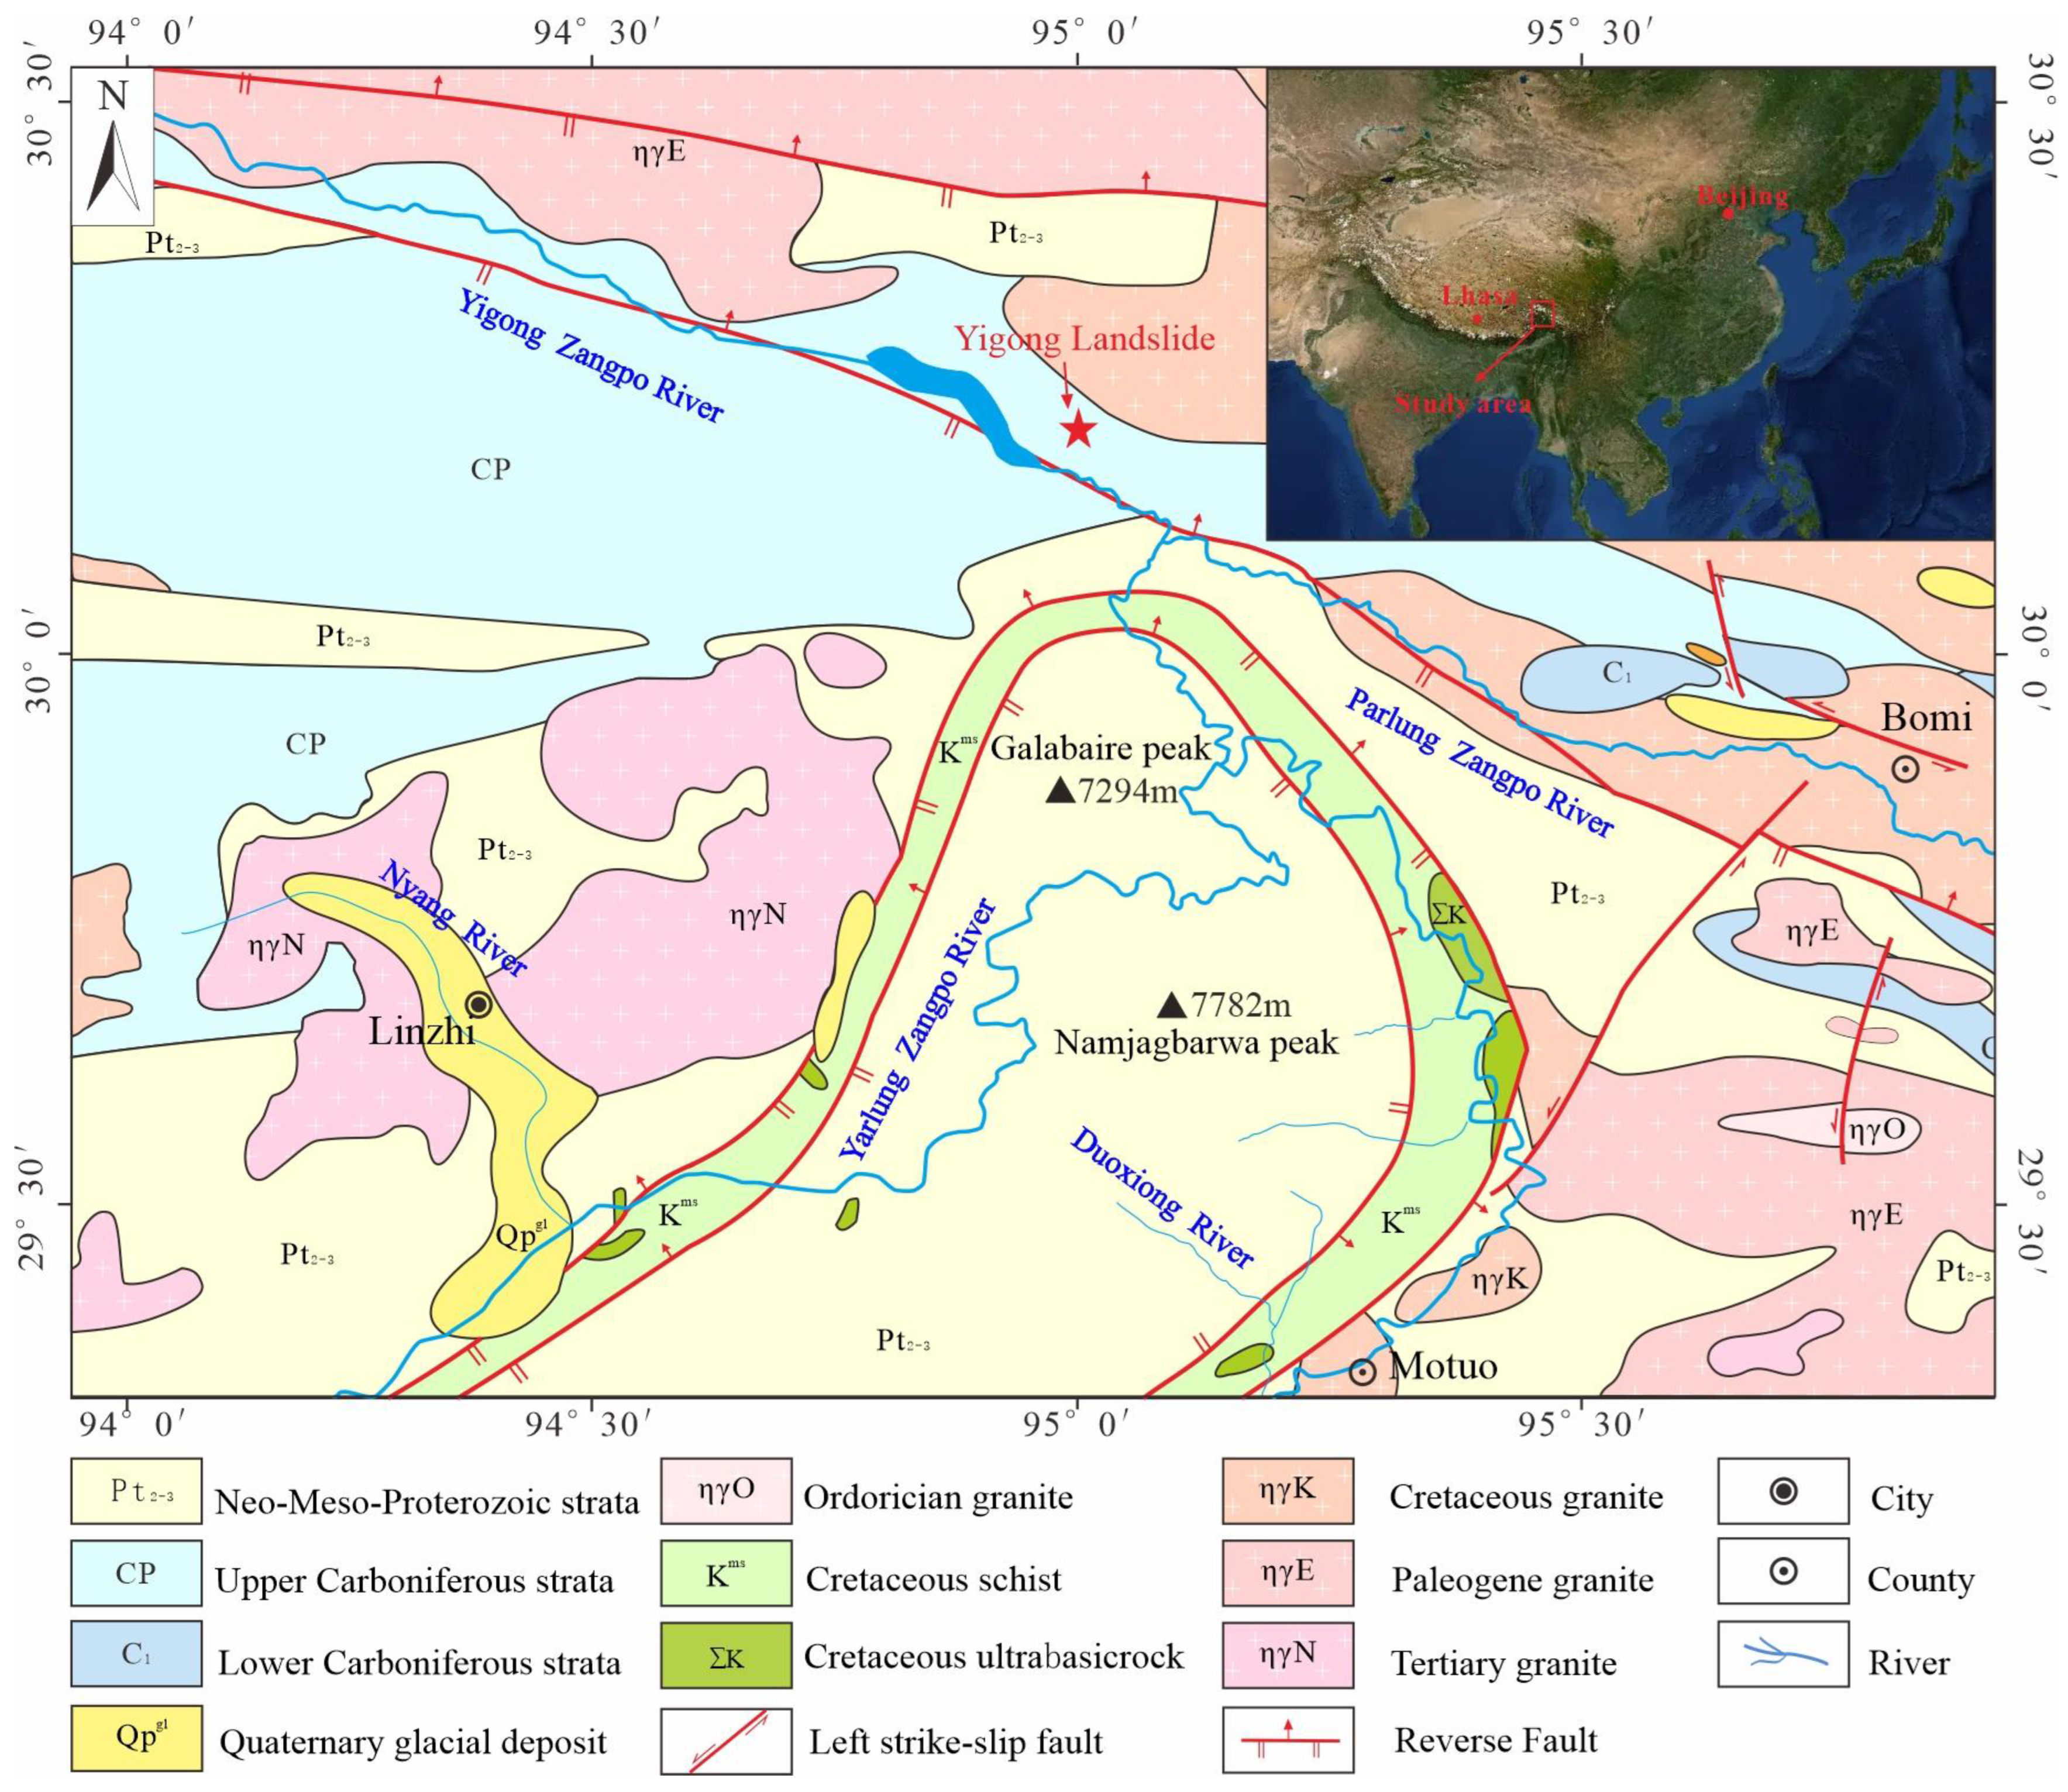
2.1. Regional Geology

The Yigong landslide occurred on the left bank of the Yigong Zangbo River in Yigong Town, Bomi County, Tibet, China. The coordinates at the mouth of the gully are 94°59′10″E, 30°13′20″N (Figure 1).
The Yigong gully has a spoon-like geometry, with a narrow gully mouth that opens into a wider area. The bottom width of the gully is only approximately 150 m, and the mountains on both sides of the gully mouth are approximately 1500–2000 m above the gully floor. The highest elevation is ~5200 m on the summit, and the lowest elevation is ~2200 m at the Yigong River. The slope is steep, and a large number of landslide deposits have accumulated in the gully. The bedrock above 4100 m in the gully is mainly Cretaceous granite, and below 4100 m it is mainly Carboniferous Nuo Formation (C1n) marble and limestone. In addition to the bedrock, there are loose Quaternary deposits widely distributed in the landslide channel, which are mainly composed of large rocks, debris, and sandy slope deposits.

2.2. Earthquakes

Earthquakes have a great influence on landslide disaster chains. Tectonically, the Yarlung Zangbo River Great Gorge is located on the eastern Himalayan syntaxis, which formed due to the collision of the Indian and Eurasian plates. This area has the highest tectonic stresses in the Himalayas, resulting in frequent earthquakes in the region. The Jiali fault zone passes in front of the Yigong gully. Over the past 50 years, there have been as many as nine strong earthquakes of magnitude six or above and more than 40 earthquakes of magnitude 4.7 to 5.9 (Figure 2a). Historically, the earthquakes that had a great impact on Yigong were the Chayu Ms 8.6 earthquake in 1950 and the Dangxiong Ms 8.0 earthquake in 1951. The intensities of the two earthquakes reached IX and VI degrees, respectively. Since 1990, there have been 14 earthquakes with an acceleration greater than 5 gal (Figure 2b). Therefore, the Yigong landslide is strongly affected by earthquake action.

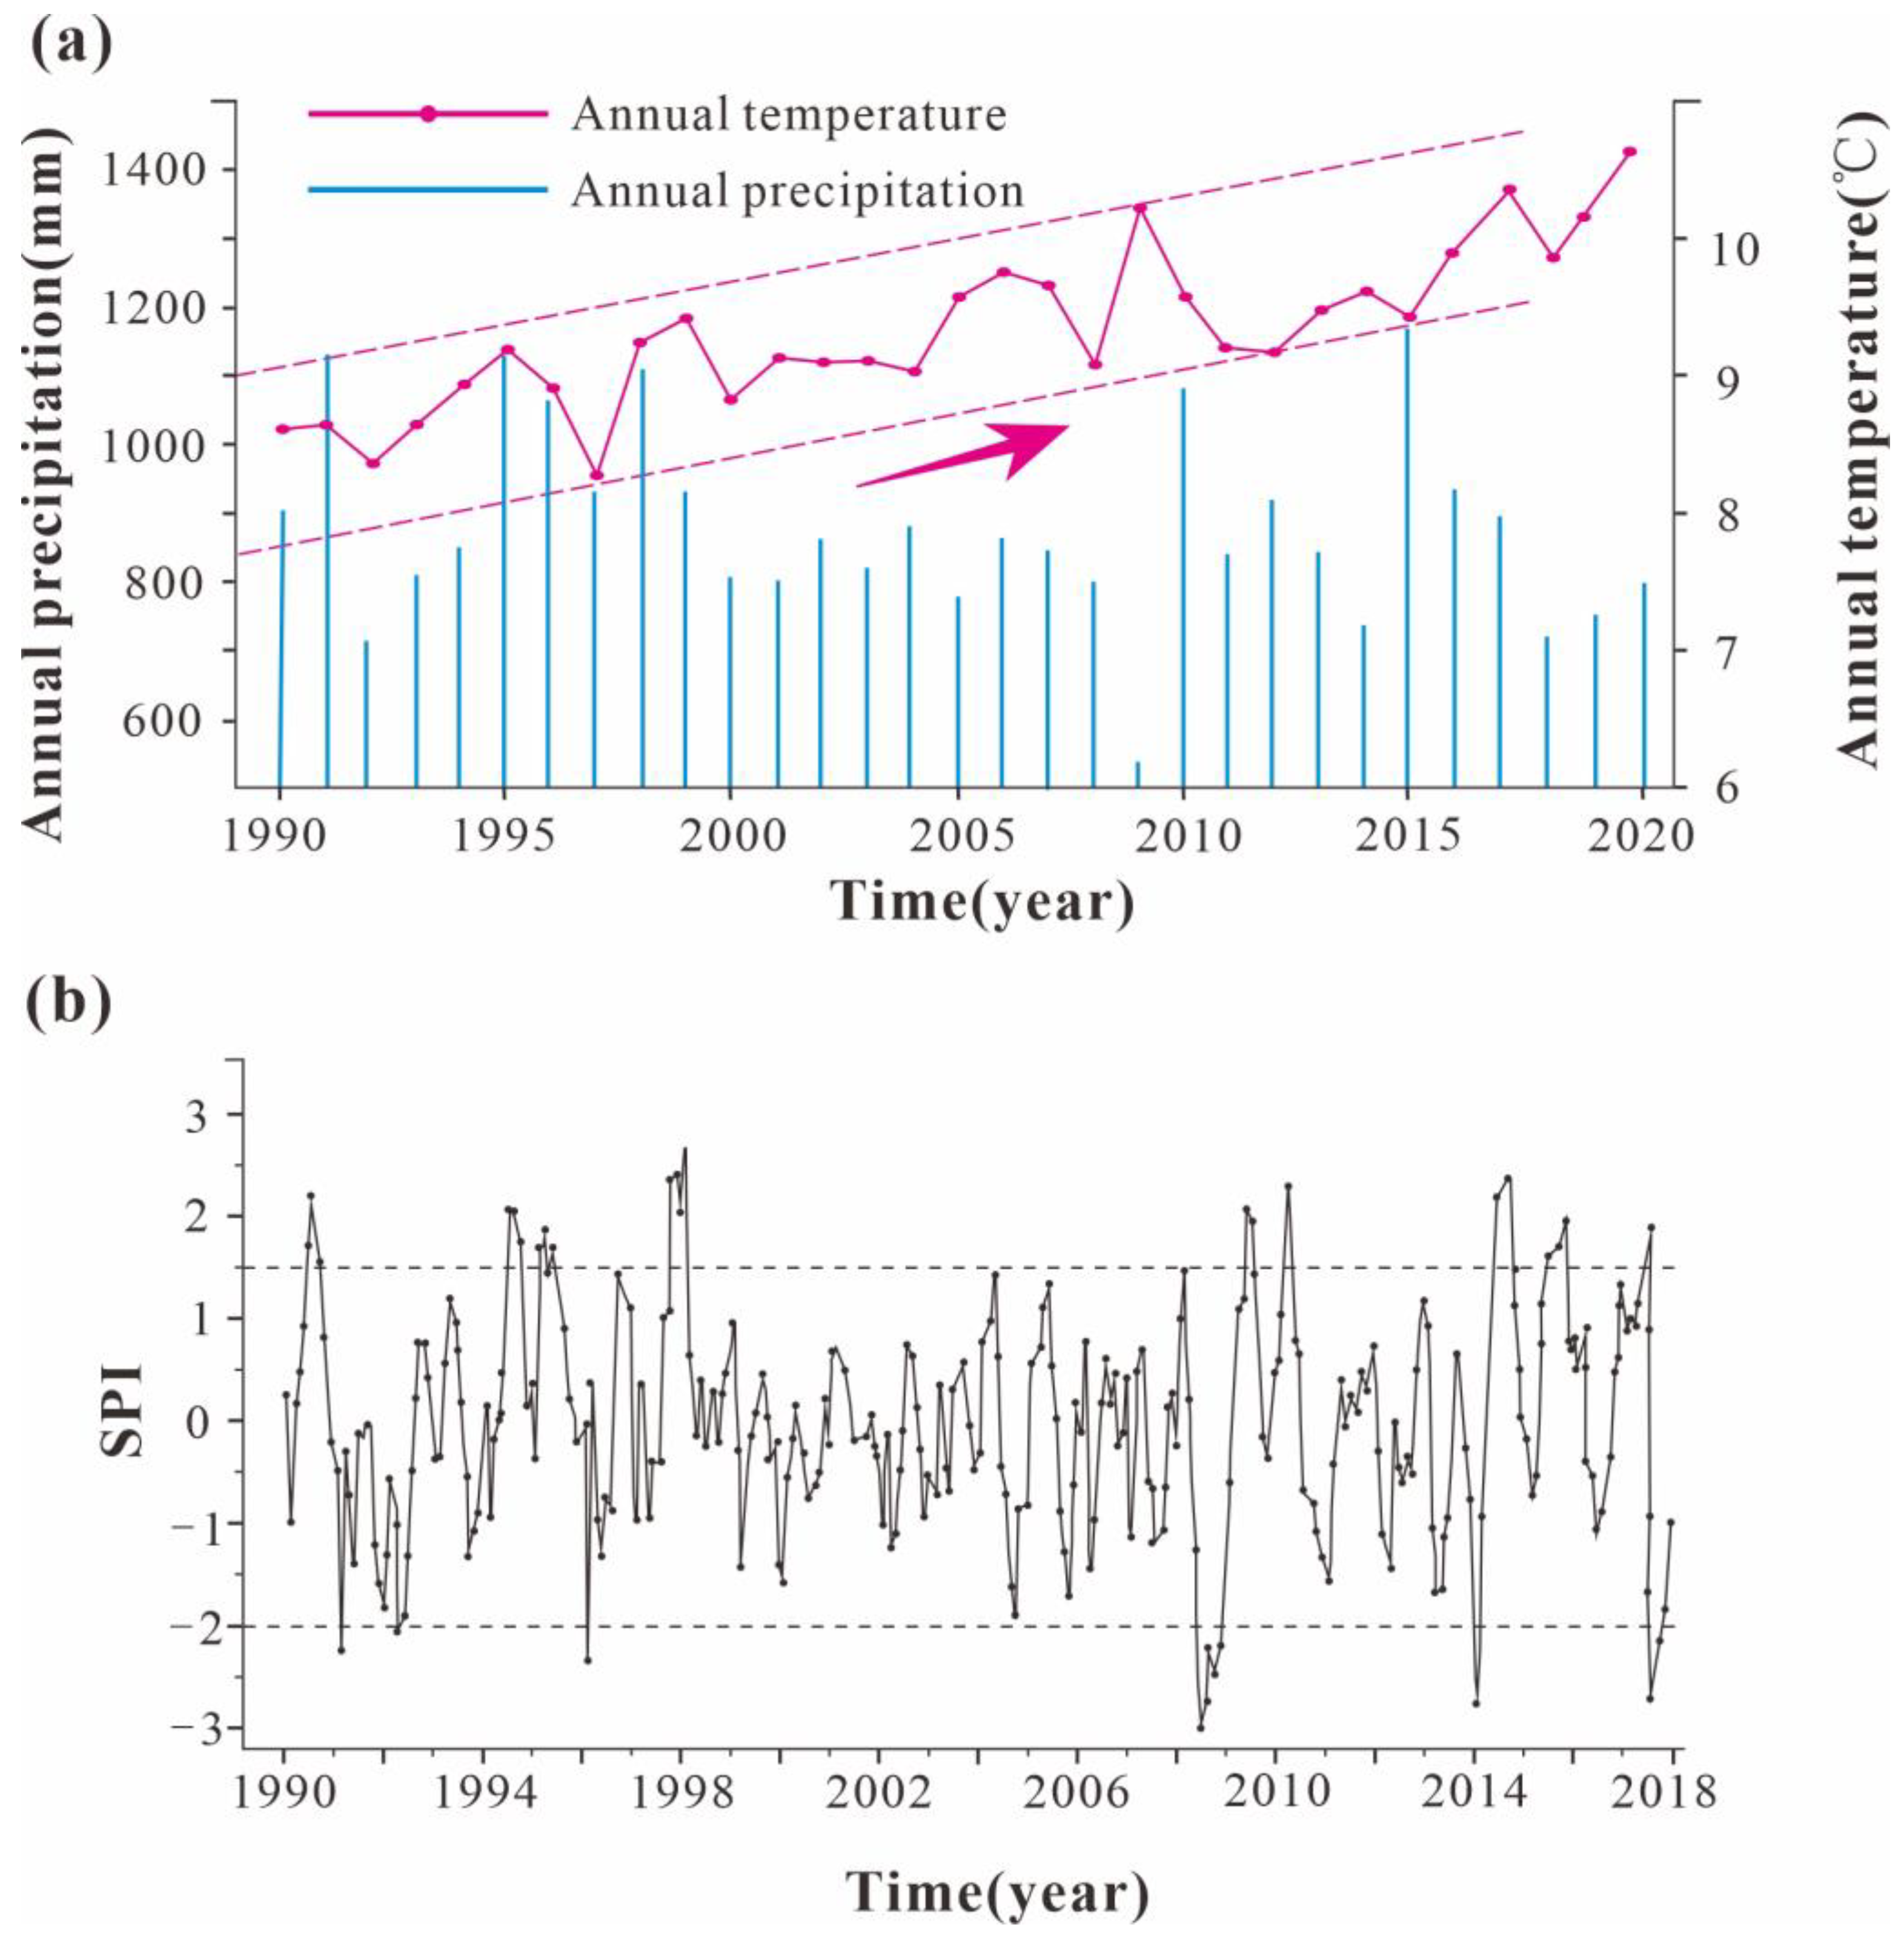
2.3. Temperature and Precipitation

The region where Yigong is located has a typical plateau subhumid monsoon climate, with annual precipitation of 810–1250 mm and an average temperature of 8.9 °C (Figure 3a). However, due to the influence of extreme climate, the temperature has increased in recent years. In the past three decades, the annual average temperature has increased by approximately 1.6 °C. Due to the change in temperature, the seasonal freezing–thawing damage of bedrock at 4500–5200 m has been more intense. Moreover, there are distinct vertical climate zones and seasonal changes in the area. The yearly rainfall is unevenly distributed temporally and spatially, with 70% of the rainfall occurring during the wet season (between June and September). Especially under the influence of extreme climate variability, the precipitation difference between the wet season and dry season has shown an increasing trend, and the SPI (Standardized Precipitation Index) fluctuated between −2 and 1.5 from 1990 to 2014 (Figure 3b), indicating that the dry–wet cycle had become increasingly variable. Therefore, the dry–wet and freezing–thawing cycles were more intense, which intensified the weathering of Yigong bedrock and increased the possibility of the recurrence of the Yigong landslide.

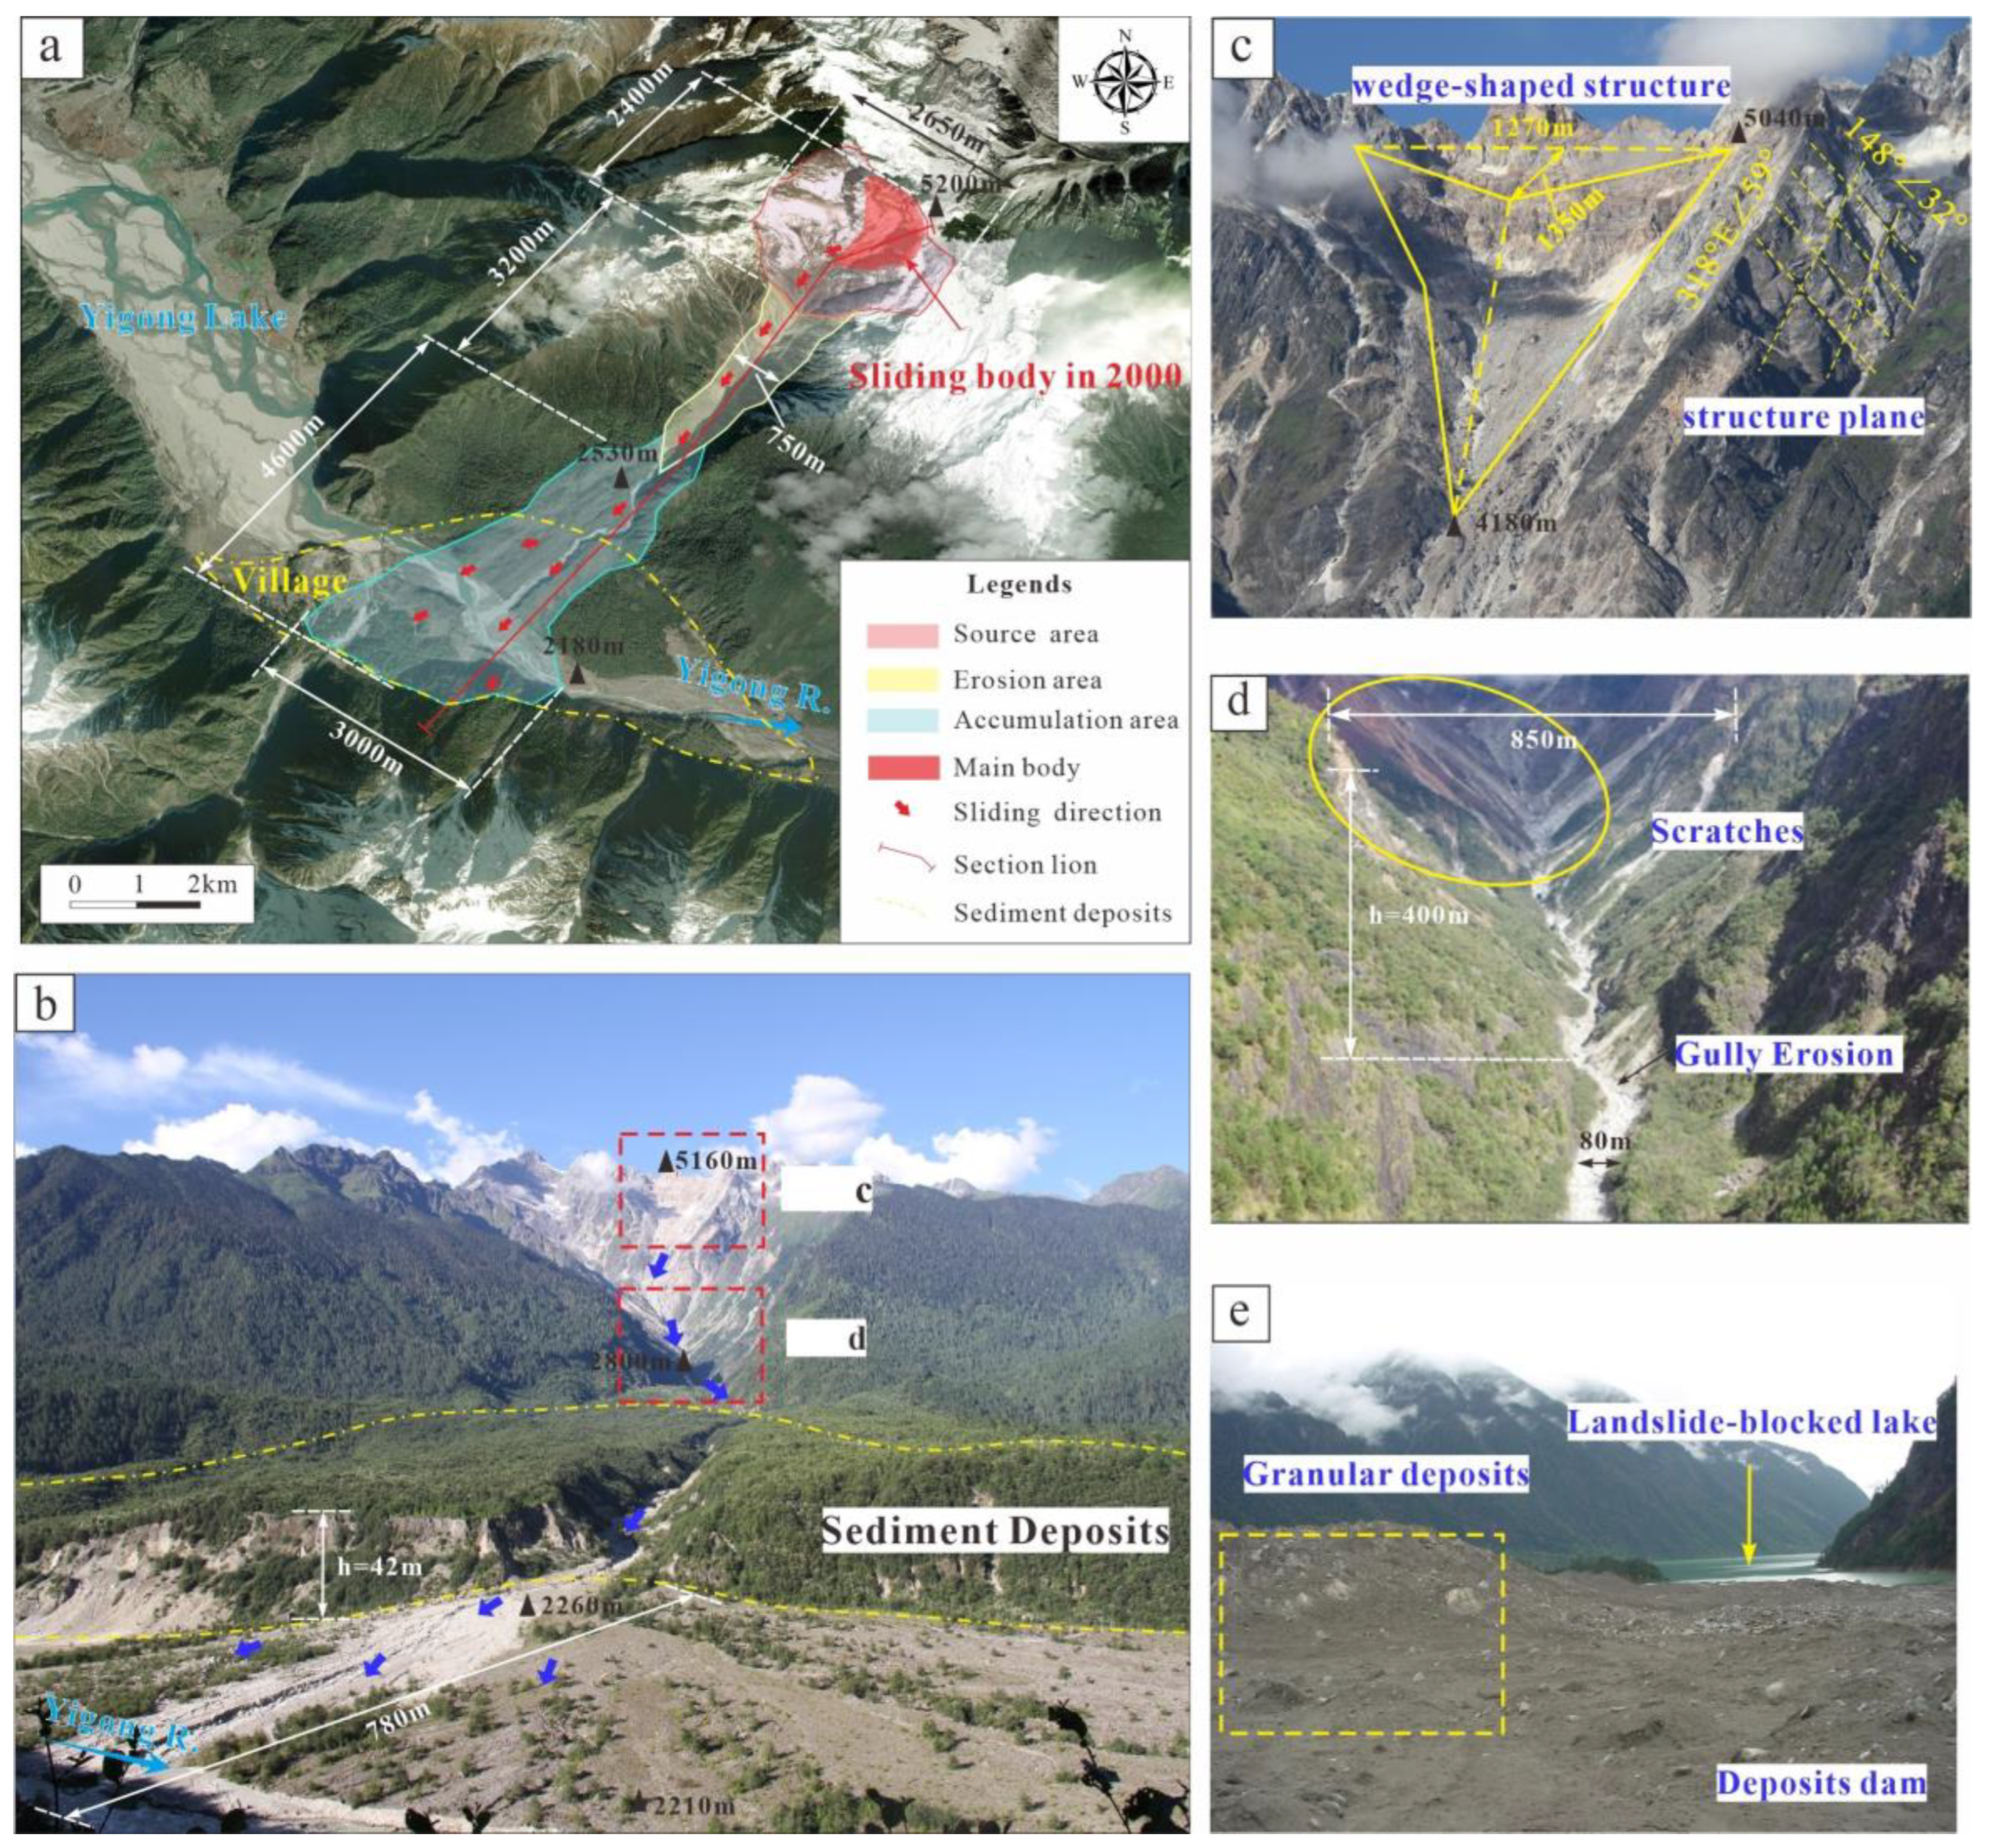
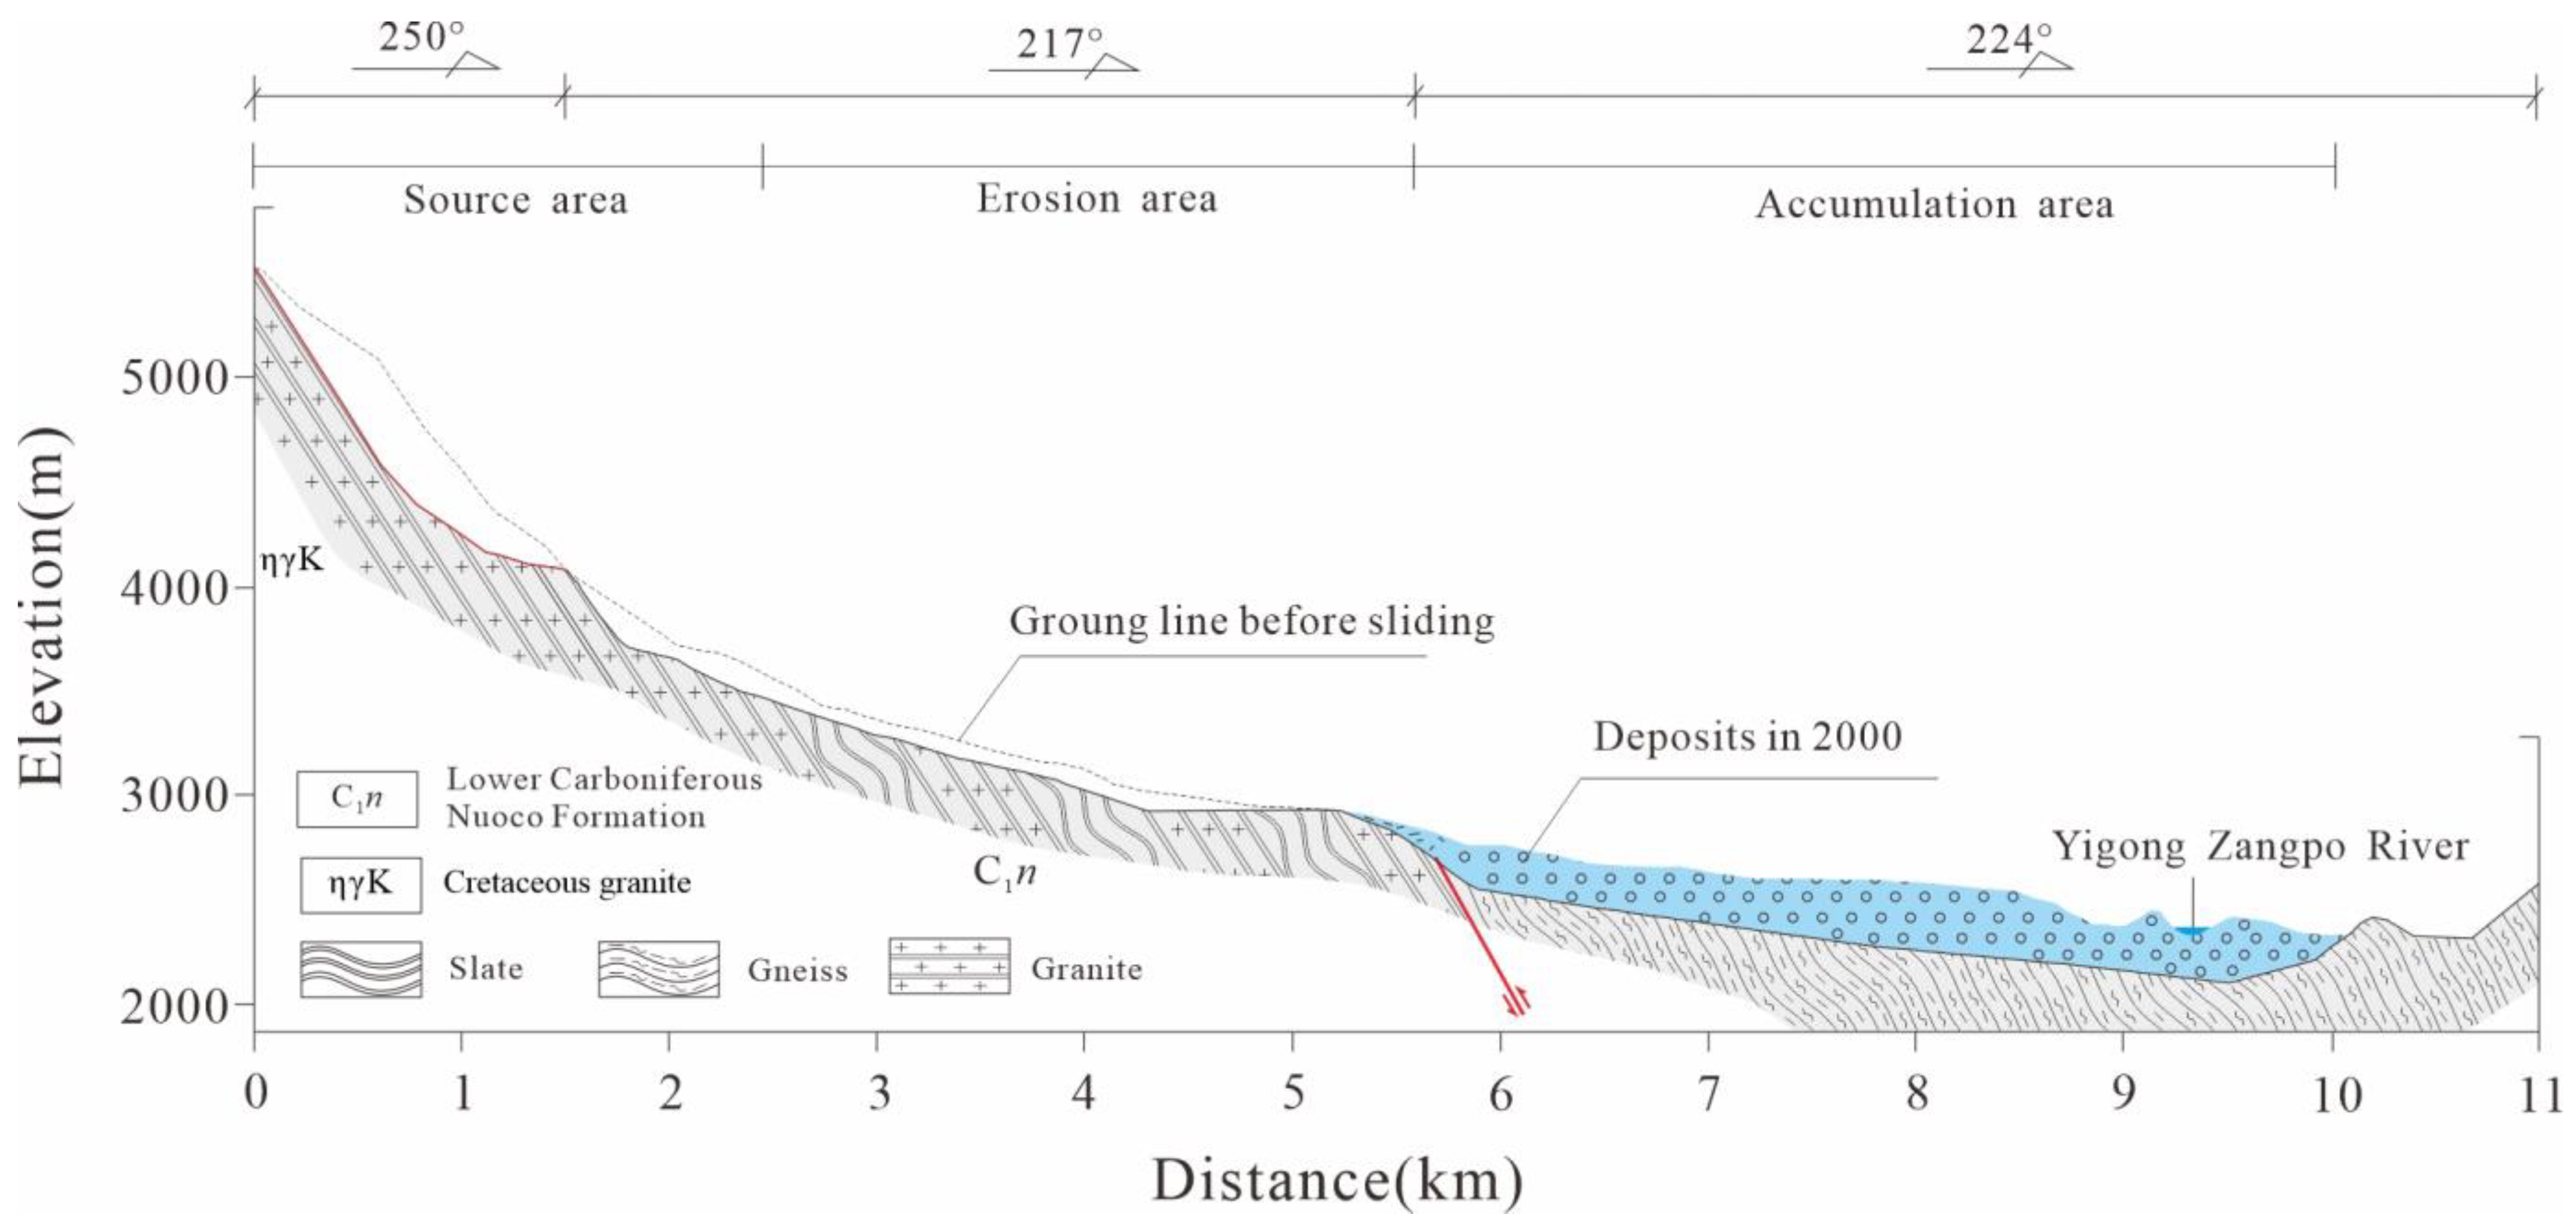
3. Yigong Landslide Characteristics

Based on analysis of the landslide movement and accumulation characteristics, we divide the landslide into three areas: the source area, the erosion area, and the accumulation area (Figure 4a).

3.1. Source Area

The altitude of the source area is between 3800 and 5200 m and is mainly composed of Cretaceous granite. The whole area is about 2400 m long and 2650 m wide (Figure 4a). Two sets of joints, located at 48°N, 32°E/SE, and 318°NNW, were formed in the rock mass due to strong tectonics. After the Yigong landslide in 2000, a wedge-shaped structure was formed with steep, straight, and smooth planar structure on both sides. The wedge-shaped collapse is the sliding body of the Yigong landslide in 2000, which is controlled by the two groups of “X” shear joints. Below the structural planes are valleys oriented from NE to SW with a slope angle of more than 25°. The length of the wedge-shaped collapse is estimated to be approximately 1350 m, while the width is approximately 1270 m. The rear edge elevation of the collapse is approximately 5040 m while the front edge elevation is approximately 4180 m, and the average height is 860 m (Figure 4c). The volume of the collapsed wedge-shaped rock mass is approximately (0.8–0.9) × 108 m3.

3.2. Erosion Area

There is a 1000 m elevation difference in the erosion area and the rear edge elevation is approximately 3800 m while the front edge elevation is approximately 2800 m. The total length is approximately 3200 m, and width of the middle part of the Yigong landslide in 2000 is approximately 750 m (Figure 4a). The erosion area is oriented NE–SW, and at the bottom of the erosion area is a perennial gully approximately 150 m wide and 160 m high. In 2000, the width of the gully could reach the width of the entire erosion area, about 850 m, and the height could reach 400 m (Figure 4d). The slope on both sides of the gully is steep, with angles between 45° and ~70°, and is shaped like an inverted trapezoid. There are a large number of deposits in this area which provide a large number of provenances. After the collapse was initiated, it moved along the area at a high speed and eroded the surface material, forming a debris flow. Almost all the deposits in the gully were carried away by the debris flow, and obvious scratches can be seen on the steep slope on both sides of the gully (Figure 4d).

3.3. Accumulation Area

The accumulation area is located at the mouth of the gully, which is about 2260 m. The altitude of the accumulation area is between 2800 and 2200 m. It is 4600 m long, 3000 m wide, and the area is 6.6 km2 with a fan-like geometry (Figure 4a). The accumulation area is generally flat, with an average slope angle of 8°. The Yigong Zangpo River flows from the accumulation area from west to east. The river level is the lowest in the whole area at 2200 m. In 2000, the Yigong landslide formed a 60–110 m barrier dam, which was mainly composed of a mix of granular deposits and which blocked the Yigong River. The dam completely blocked the Yigong Zangpo River, causing the water level of Yigong Lake to rise by nearly 60 m, forming a landslide-blocked lake (Figure 4e). After the dam failed, most of the deposits were washed away, but many deposits remained on both sides of the river. The entire rupture of the dam is about 780 m. There are numerous clay components within the deposits, most of the gravels are angular, and the gravel content is 40–50%. At present, a large number of deposits can still be seen in the accumulation area, with a height of about 42 m.
To show the profile characteristics of the Yigong landslide, a profile along the section line is shown in Figure 4a. Figure 5 shows that when the rock mass collapses from the source area to the rear edge of the erosion area, the height difference is approximately 1400 m. This height difference generates a considerable amount of kinetic energy that is then applied to the movement of the landslide, which gives the rock mass a huge impact force. More importantly, the impact force provides energy sufficient for rock mass disintegration and erosion, which converts the rock mass into a debris flow. When the debris flow moves through the erosion area, the deposits in the gully are eroded, and the volume of the sliding body continues to increase, which is an important reason for the increase in volume. The volume of the debris flow multiplies as it passes through an erosion area about 3600 m long. When the debris flow enters the accumulation area, the slope of the terrain becomes flat and the debris flow accumulates rapidly and crosses to the other side of the river, thus blocking the entire river channel and forming a deposits dam with an average height of about 75 m and average length of about 4600 m.

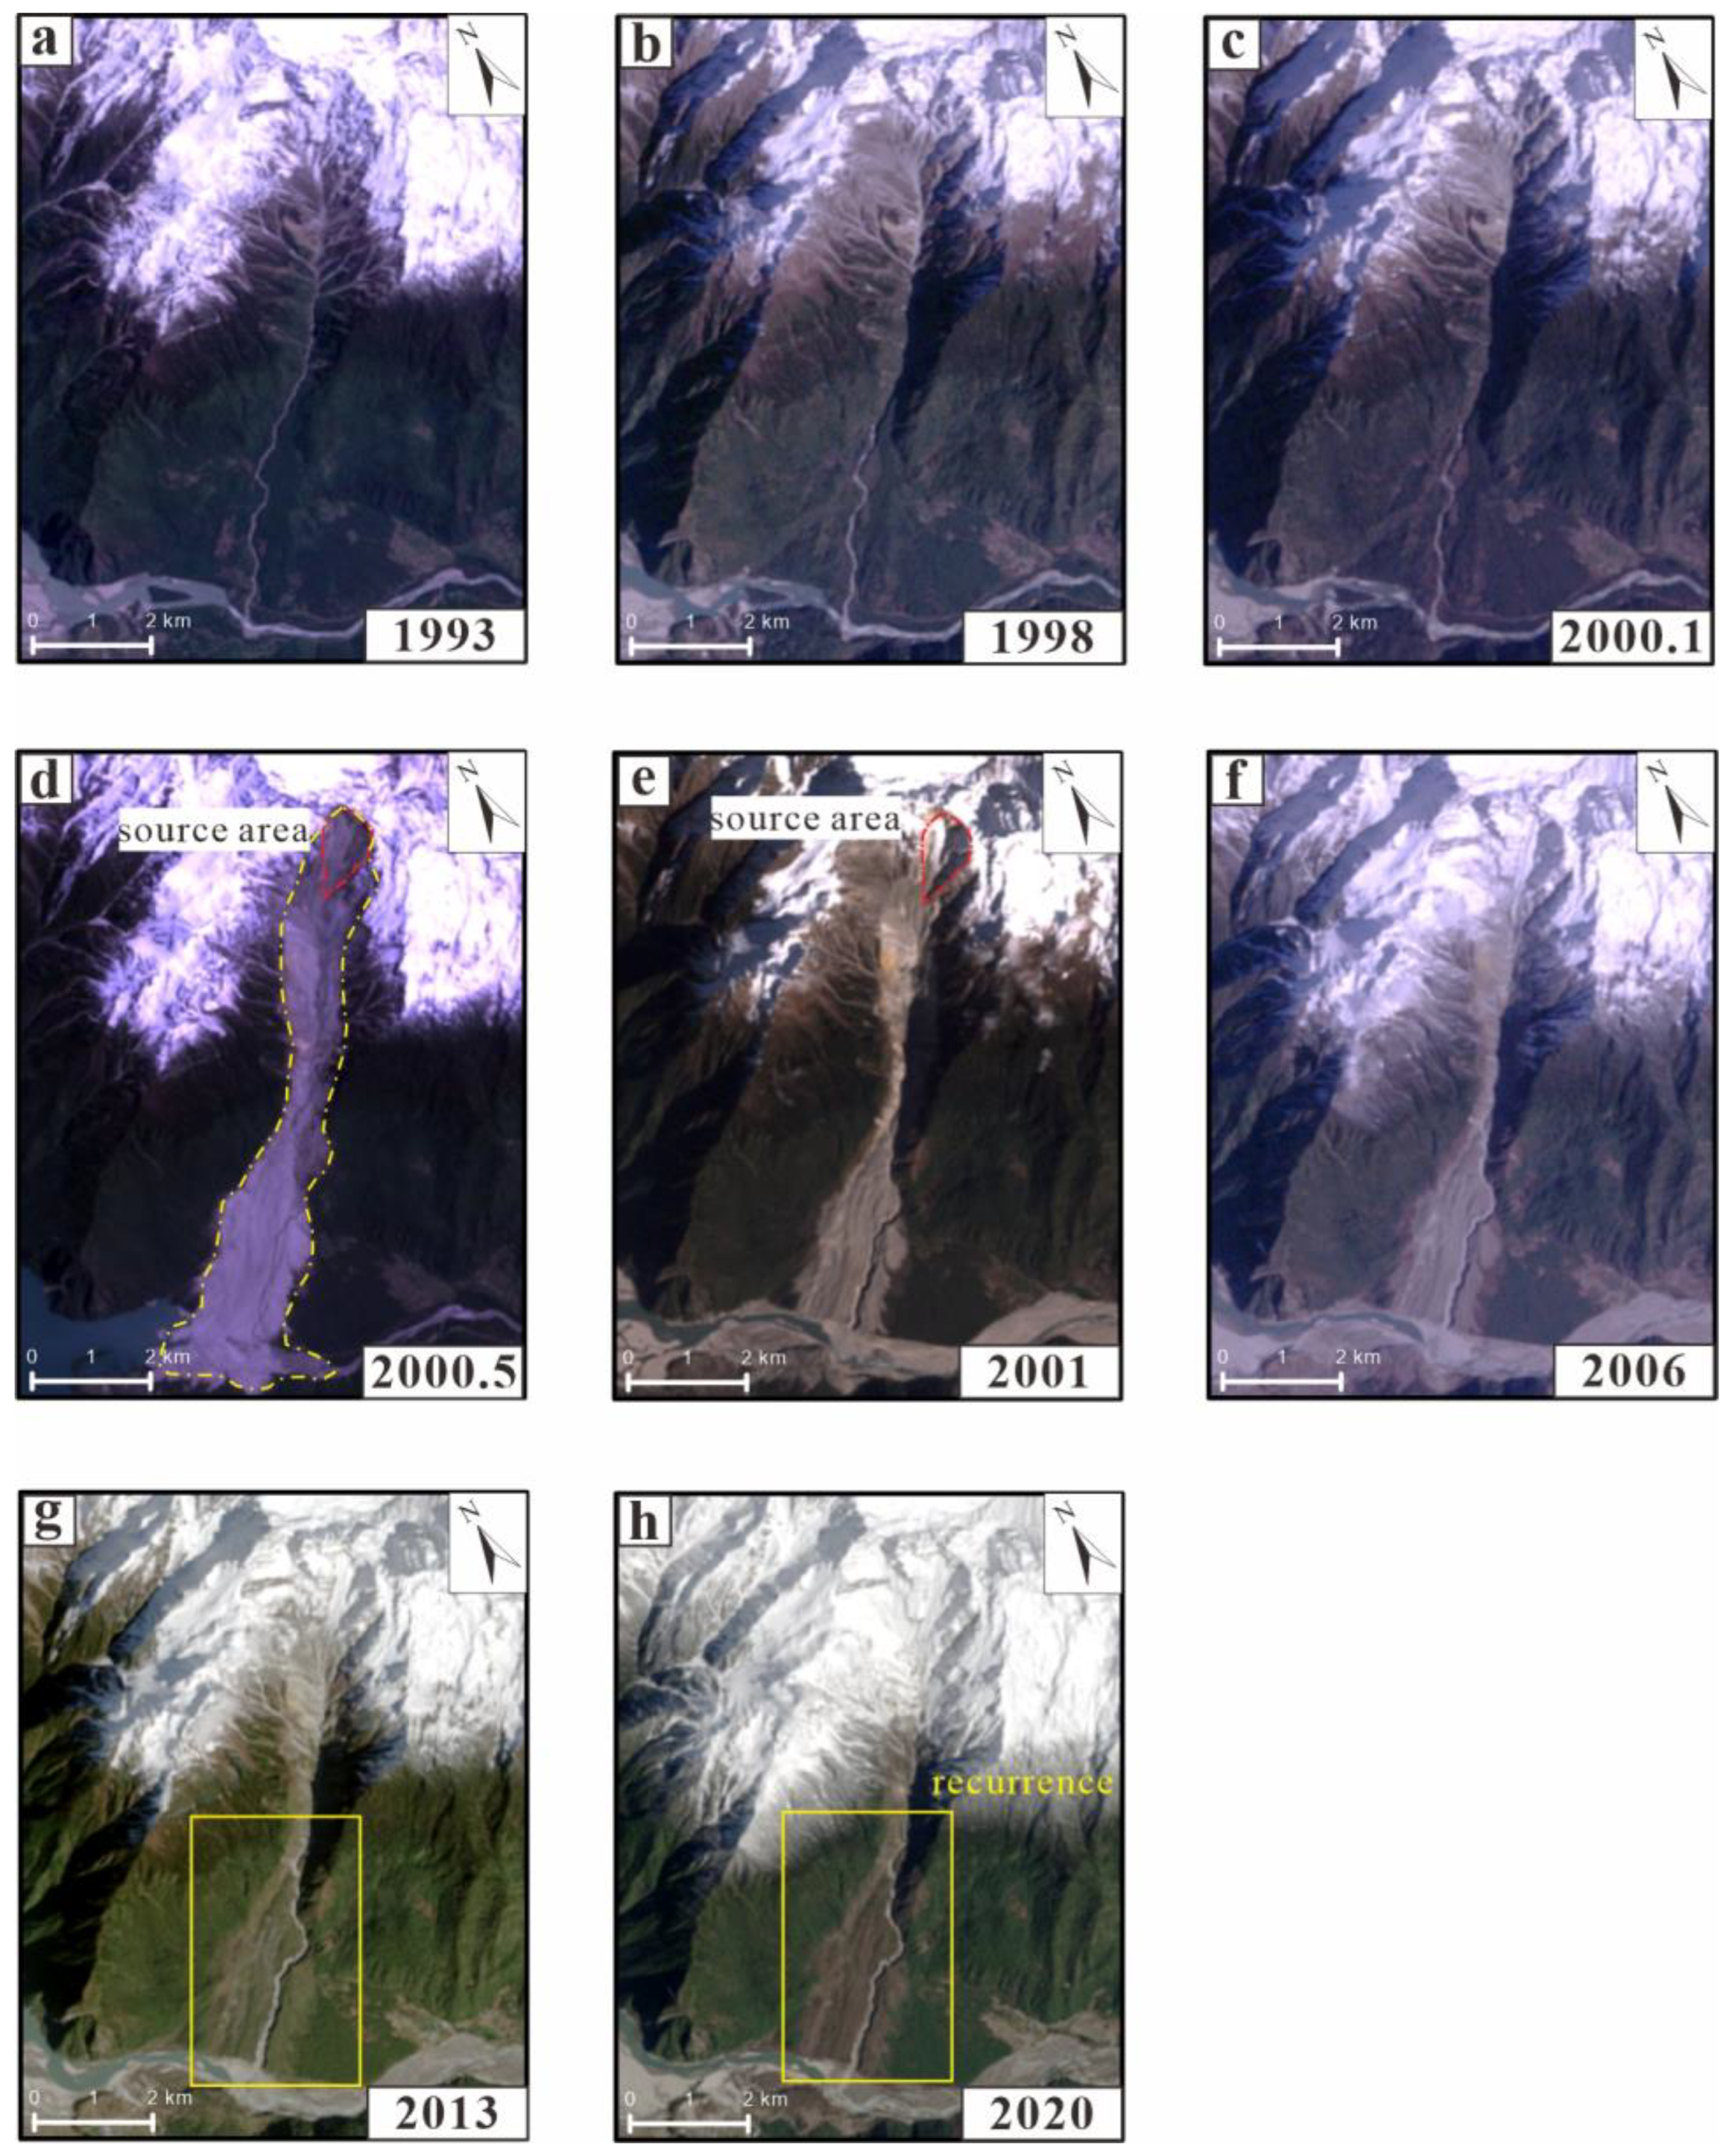
3.4. Historical Development

The morphological historical development of the Yigong landslide was interpreted by optical remote sensing technology (Figure 6a–h) using eight scenes acquired from 1993 to January 2020. Optical satellite data sources include Landsat-5, Landsat-7, and Landsat-8. They have a resolution of 30 m. The details of the satellite data are shown in Table 1. According to the remote sensing images, before the 2000 landslide occurred in Yigong gully (Figure 6a–c), which is now covered with dense vegetation, dangerous rock forms were clearly visible. The remote sensing image in Figure 6d shows the source area after the occurrence of the Yigong landslide. The sliding surface of the rock mass can be seen in the source area. The vegetation and deposits in the erosion area are carried away by entrainment, forming a dam that blocks the Yigong River in the accumulation area. When the barrier dam burst, the channel of the Yigong River widened, and the rock mass in the source area was covered with ice and snow again (Figure 6e). By 2013, the accumulation area was covered by vegetation, indicating that no large-scale landslides occurred between 2000 and 2013 (Figure 6e–g). However, comparisons of images acquired in 2013 and 2020 shows that the vegetation in the accumulation area had disappeared, indicating that a large amount of debris may have been flushed out of the gully during this period, which denuded the landscape of vegetation. Therefore, the Yigong landslide remains a potential hazard.

4. Methods

4.1. InSAR

4.1.1. InSAR Monitoring Method

Only through optical and radar-based remote sensing images can the stability of the rock mass in the source area be determined. In this case, InSAR technology is an effective method of monitoring the displacement of the rock mass with high precision to obtain the displacement information of the rock mass. InSAR technology has the capability of acquiring data at any time of day, in any weather conditions, and over large areas. Therefore, InSAR data have been widely used in investigations of large-scale geohazards. The commonly used InSAR methods can be divided into differential InSAR (D-InSAR), small baseline subset InSAR (SBAS-InSAR), distributed scatterers (DS), the persistent scatterer InSAR (PS-InSAR) method, and SAR offset-tracking technology. The main purpose of InSAR/SAR technology is to retrieve information regarding surface deformations over the study area.
InSAR technology is sensitive to line-of-sight deformation but has a weak ability to detect north-to-south deformation. The geometric distortion within the radar image cannot identify the point target; therefore, the deformation information cannot be extracted. To solve this problem, the SAR data covering the lifting rail can be combined to increase the visual range of the data. The errors caused by the orbital ramp were modeled by using a quadratic polynomial function, and the errors resulting from topographic undulation were removed through the operation of DEM-assisted ortho-rectification of SAR images [23].
The Yigong gully is steep, and the terrain fluctuates abruptly, which can easily cause serious geometric distortion of single-track SAR images, including overlapping, shadowing, and perspective distortions, which can result in blind spots within SAR images. To avoid the effects of the geometric distortions and time decoherence of SAR images on landslide monitoring, we collected long wavelength ALOS/PALSAR-2 images for two tracks. This method improves the reliability and accuracy of landslide detection. Among these, there were 10 ascending ALOS/PALSAR-2 images, which covered the period from 18 August 2016 to 26 September 2019, with a central incident angle of 31.4°, and 4 descending ALOS/PALSAR-2 images in total, covering the period from 3 June 2015 to 14 June 2017, with a central incident angle of 40.6°. The azimuth and range resolutions of the two tracks of SAR images were 3.2 m and 4.3 m, respectively. An automated/semi-automated SAR processing procedure [24] was used to process these SAR images in order to overcome the related errors and generate highly accurate landslide displacement images. First, all possible interferograms were automatically generated using a small baseline subset strategy, were filtered using an adaptive filtering function based on the local fringe spectrum [25], and were unwrapped using the minimum cost flow (MCF) algorithm [26]. Then, after correcting the errors related to DEM, atmospheric delays, and phase unwrapping, we selected the high-quality interferograms to estimate the displacements by dropping noisy interferograms to retrieve any useful signals. Phase unwrapping errors are inevitable for some interferograms in case studies with low coherence; in this study, the phase unwrapping errors were corrected using either phase compensation, which involves subtracting or adding an integer number of phase cycle (s) at the phase jump pixels, or unwrapping a phase at pixels with high coherence. Additionally, areas that include SAR geometrical distortions (i.e., layover and shadow) in the interferograms were masked to avoid misleading information.

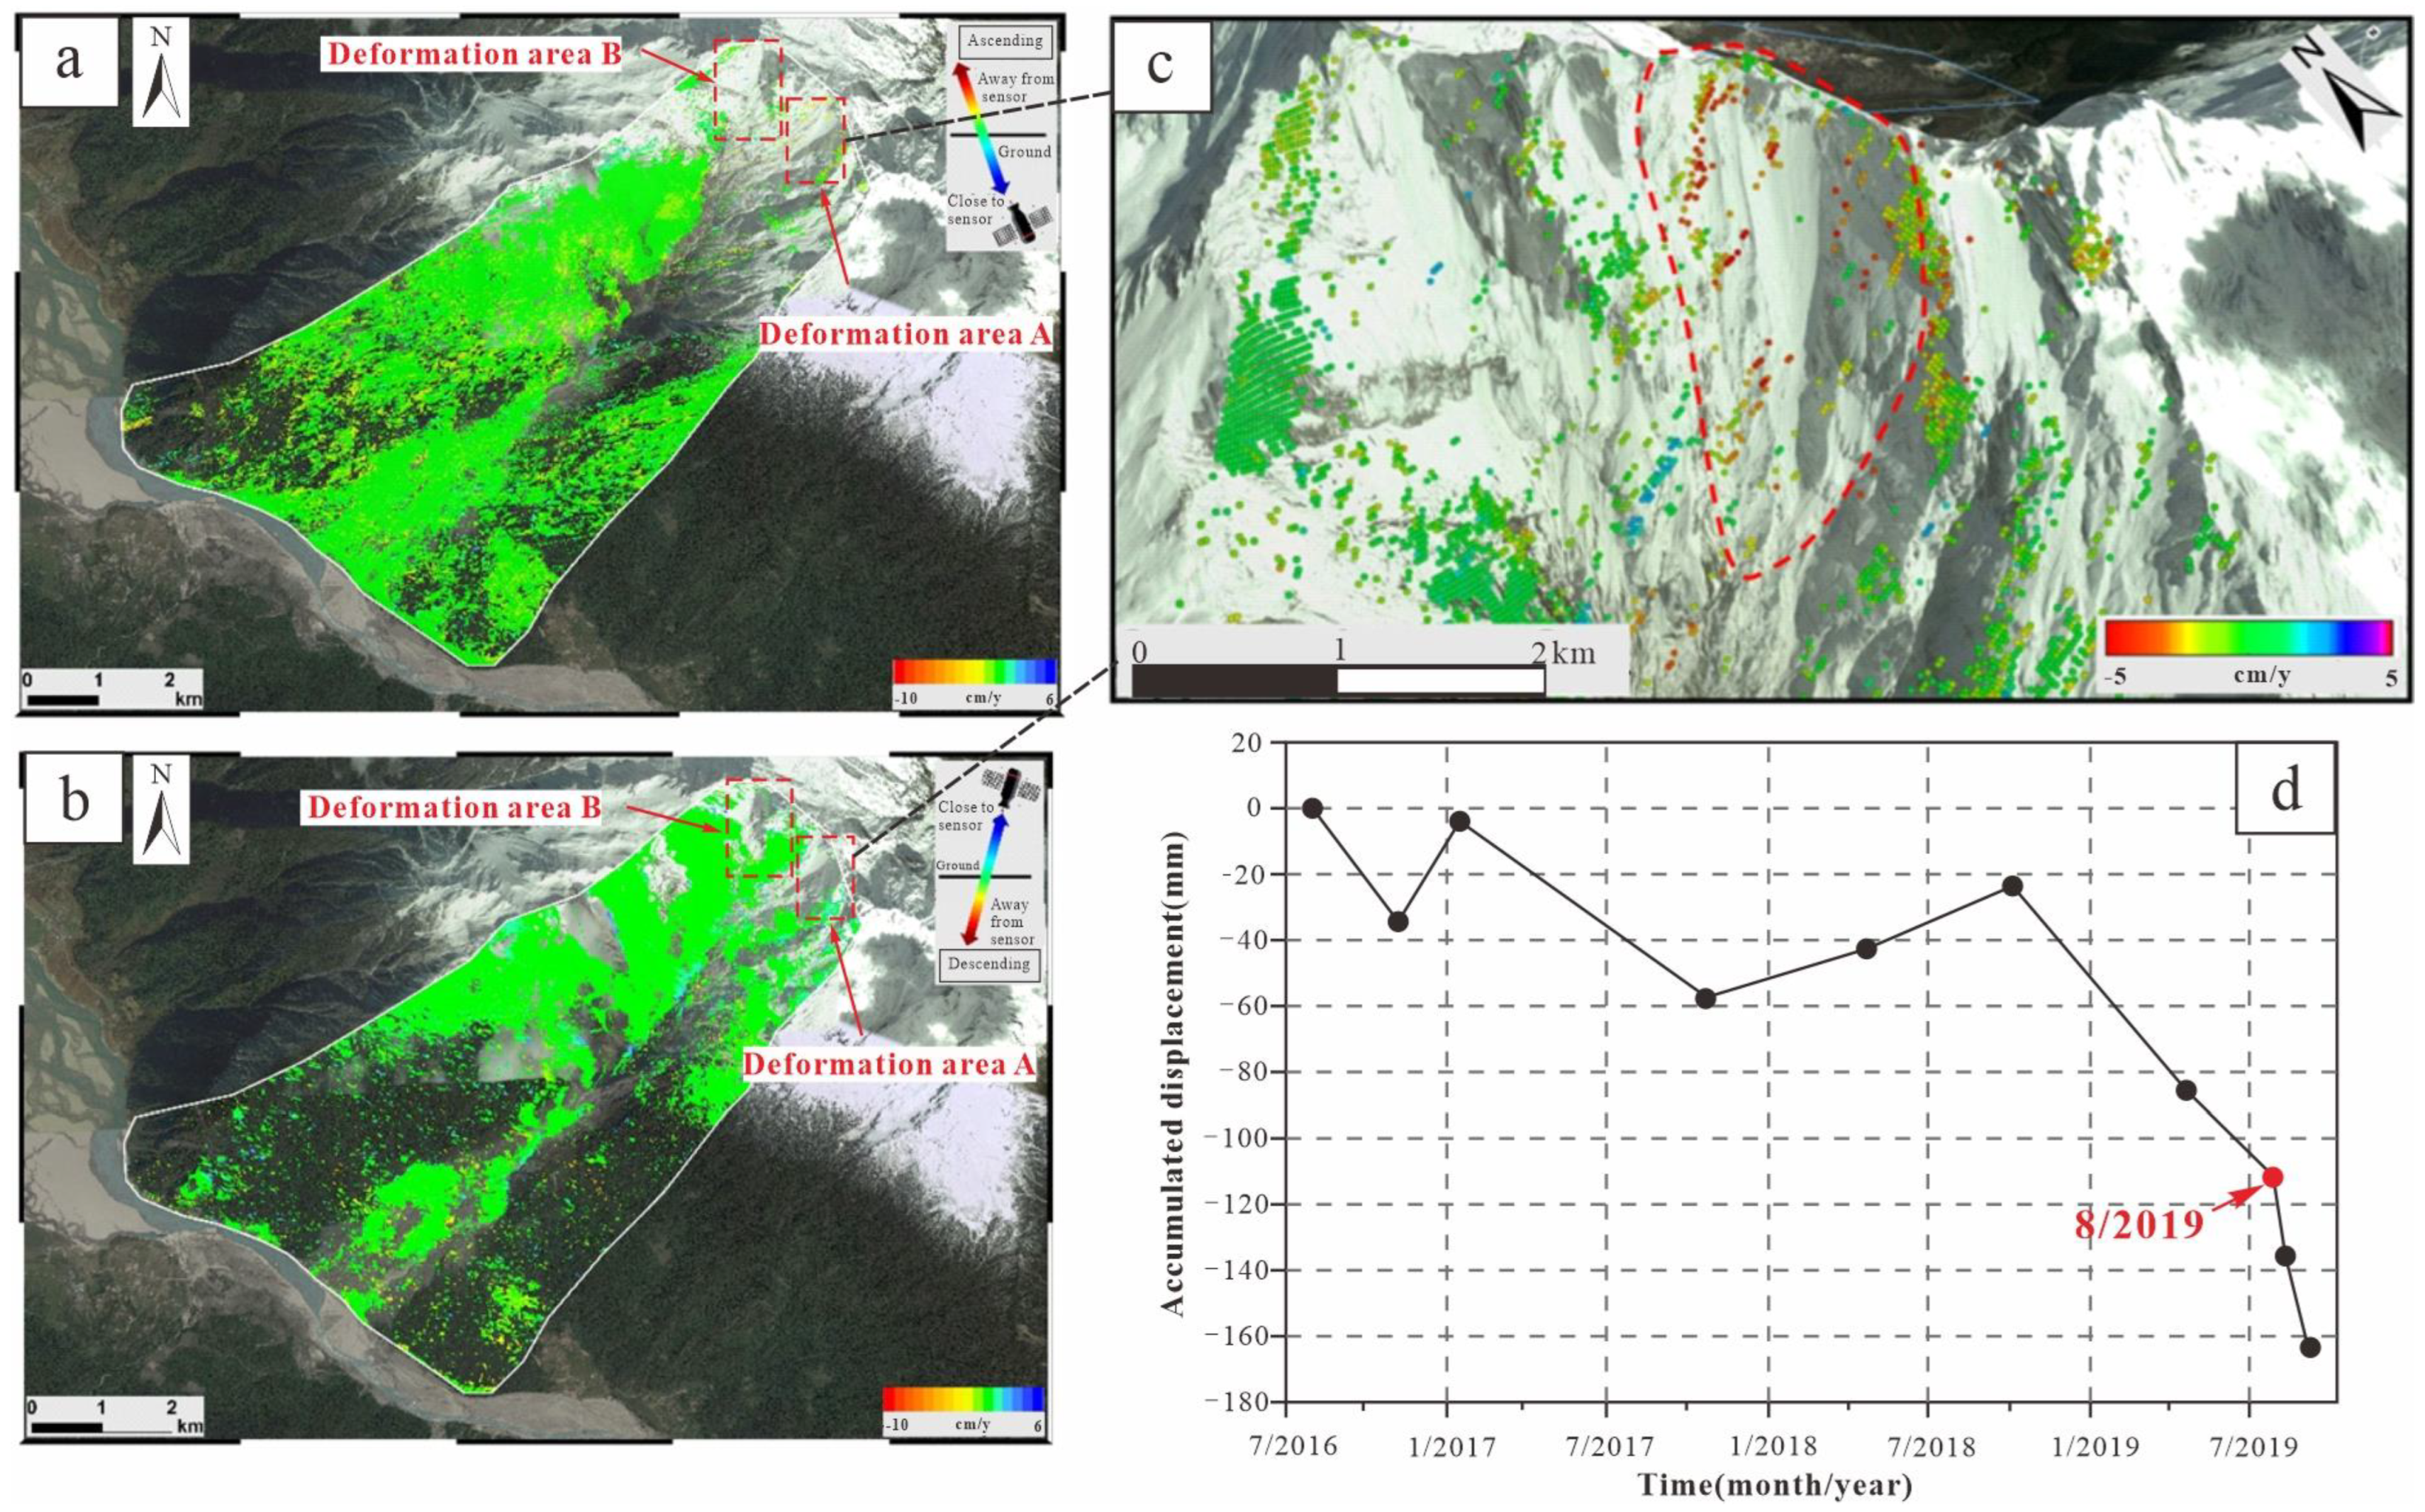
4.1.2. InSAR Monitoring Results

Figure 7a shows the annual average surface displacement deformation rate from August 2016 to October 2019 obtained by image calculation from the ALOS/PALSAR-2 ascending track; Figure 7b shows the annual average surface displacement deformation rate from June 2015 to June 2017 obtained by image calculation from the ALOS/PALSAR-2 descending-track. The image shows that the Yigong landslide is generally stable, and the displacement rate is between −10 mm/year and 10 mm/year. However, two deformation areas were observed, with the maximum annual average displacement rate reaching −50 mm/year in the ascending image and −60 mm/year in the descending image.
Between the two areas, deformation area A has the larger volume and greater annual deformation rate, with a length of approximately 1520 m and a width of approximately 790 m. The maximum annual displacement rate is approximately −50 mm/year, which was detected from the effective monitoring points (Figure 7c). Furthermore, this is the source area of the Yigong landslide in 2000. To further analyze the spatiotemporal evolution characteristics of the detected deformation area, time series displacement deformation analysis was carried out using the images from the ascending and descending tracks from ALOS/PALSAR-2. The accumulated displacement is shown in Figure 7d. The results show that the deformed area exhibits a trend of nonlinear motion during InSAR observations. However, the accumulated displacement shows an increasing trend in general. From October 2018 to August 2019, the accumulated displacement changed from −20 mm to −110 mm, and an obvious displacement acceleration was observed in August 2019. From 2016 to 2019, the accumulated displacement of the radar line of sight reached −166 mm. If the displacement continues to increase, another disaster may be possible.
It is estimated that the source volumes of deformation area A and deformation area B are 9.2 × 10⁷ m3 and 9.4 × 10⁷ m3, respectively. They have a relative elevation difference of 3500 m, with extremely high potential energy. When a landslide occurs, it may induce a disaster chain and easily block the Yigong River once more. Therefore, it is important to assess the risk of potential deformation areas and provide early hazard warning.

4.2. Dynamic Numerical Simulation

Because the elevation of high-altitude and long-runout landslides is largely inaccessible, it is difficult to gather field data on these landslides. As such, researchers often study high-altitude landslides using numerical simulations [27,28]. The SPH method discretizes the landslide into multiple particles and solves the Navier–Stokes equation by summing particles in the small and supported domain using the smooth kernel function to simulate landslide motion. DAN3D software has successfully simulated several landslide events based on the SPH method [29,30]. The Yigong landslide was numerically modelled using the dynamic DAN3D model developed by McDougall and Hungr [20].
To simulate the current potential deformation areas, the Yigong landslide in 2000 was reconstructed by the back-analysis method. The simulation model and parameters were calibrated and determined by multiple inversion simulations. Then, the back-analysis simulation parameters were used for prediction simulation.

4.2.1. Parameters Setting

The model is governed by internal and basal rheological relationships. The rheology models that have been found to represent recorded events most accurately are the frictional model and the Voellmy model [31]. In the frictional model and Voellmy model, the parameters include the unit weight γ (kN/m3), the ratio of pore fluid pressure ru, the friction coefficient f, the bulk basal friction angle φ (°), the maximum erosion depth (m), and the turbulence parameter ξ (m/s2).
In the source area, the simulated volume is 9.0 × 10⁷ m3 [32]. The failure type is ice and rock collapse, which is consistent with the frictional model since that model can reflect the frictional behaviour. Meanwhile, the lithology of the rock is mainly granite and gneiss, the selection range of unit weight is between 22 kN/m3 and 28 kN/m3, φ is between 16° and 22°, and the friction coefficient is between 0.15 and 0.4. Due to the high altitude of the source area, water is stored as ice; consequently, the pore water pressure coefficient is selected to be between 0 and 0.2. In the erosion area, the landslide disintegrated, obtaining huge kinetic energy and showing the characteristics of fluid movement. Therefore, the Voellmy model, which can reflect variations in velocity, was selected. At the same time, the sliding body is disintegrated and eroded with a large amount of moraine, causing the unit weight and friction coefficient to decrease, which was selected to be 18 kN/m3–24 kN/m3 and 0.05–0.1, respectively. Based on the software manual, ξ was selected to be between 200 m/s2 and 500 m/s2, which increases with increasing fluidization strength. According to the imagery, the maximum erosion depth can reach 300 m, and the average is 65 m; therefore, an erosion depth of 65 m was selected as the simulation parameter. In the accumulation area, the speed gradually decreases, and friction is the main dynamic behavior; thus, the frictional model was selected. The material composition is mainly granite fragments and soil, and φ was selected to be between 16° and 22°. After the long-runout, due to the ice and snow melting within the slide body, to the influence of entrained river water, and to the water content in general, the pore pressure increases again, which is between 0.2 and 0.5. Finally, after many simulations and calibrations, the simulation parameters were finalized; these are shown in Table 2.
The range of simulation results is basically consistent with that of the Yigong landslide in 2000; the thickness and scope of the final dam are similar to those of the Yigong landslide in 2000. Therefore, this simulation approximately reconstructs the movement and accumulation processes of the 2000 Yigong landslide, and we applied this simulation parameter to the prediction simulation.
Using InSAR data, we calculated the cumulative displacement in the Yigong area from 18 August 2016 to 26 September 2019, which is shown in Figure 7. To determine the likelihood that a potential landslide would occur, we considered two scenarios: normal conditions (only used to predict the results of failure in deformation area A) and extreme conditions (used to predict the results of failure in deformation areas A and B). The estimated volume of potential deformation area A is 9.2 × 10⁷ m3; the volume of the extreme condition is the combined volume of potential deformation areas A and B, about 1.86 × 10⁸ m3. Back-analysis parameters were used for simulation parameters, as shown in Table 2.
There are four main internal control parameters. These are the number of particles (N) in the numerical simulation; the particle smoothing coefficient (B), which influences the smoothness of the interpolated flow depth; the velocity smoothing coefficient (C), which appears to smooth out strong shocks while increasing stability and reducing the tendency for particles to line up in the downstream direction in channelized reaches of the path; and the dimensionless stiffness coefficient (D), which is assumed to be spatially and temporally constant. The range of N is from 2000 to 4000, and it has little effect on the simulation of the moving processes. To reduce the calculation time, we chose N = 2000. B and C are the default values given in the DAN3D-user manual, defaulted to B = 4 and C = 0.02 (dimensionless), respectively. DAN3D is not very sensitive to the specified value of D, but it is possible that the incremental approach can aid numerical stability, and after many comparative analyses, D = 400 was determined to be the best choice.

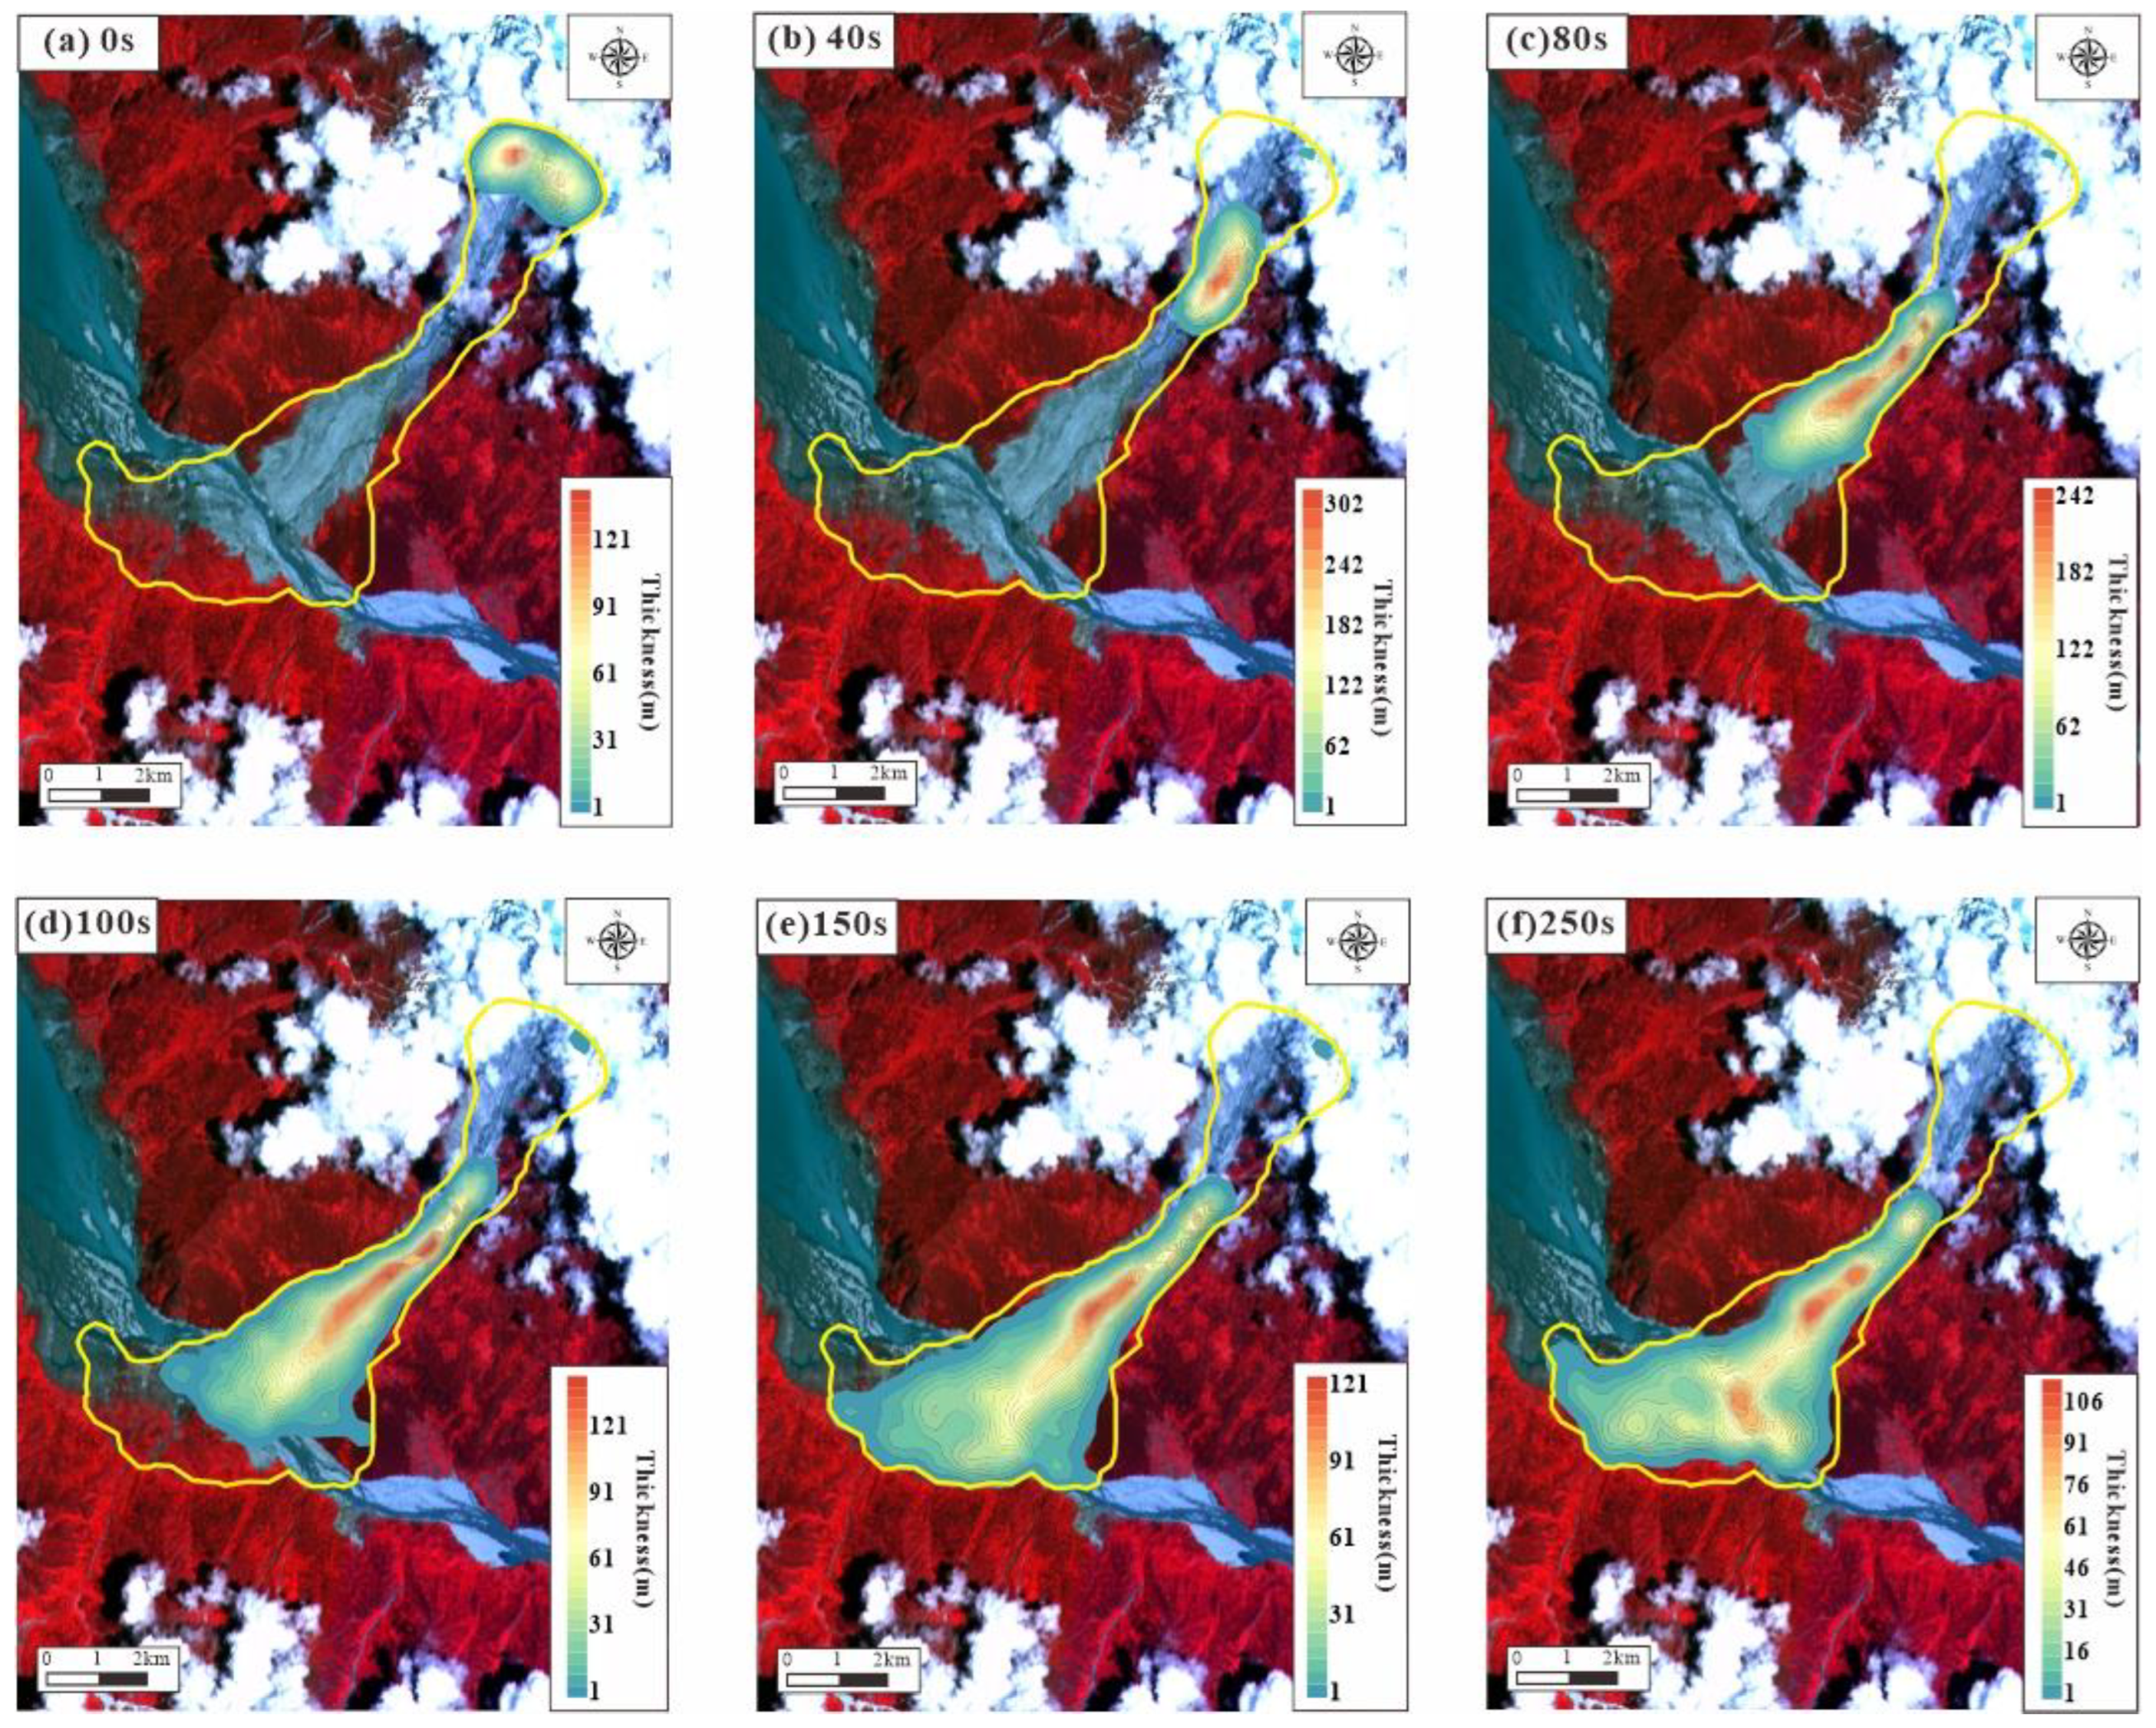
4.2.2. Inversion Simulation of Yigong Landslide in 2000

The simulation results show that the landslide occurred over a time interval of 180 s and travelled a maximum distance of 10.6 km (Figure 8). The initial landslide volume of 9.0 × 10⁷ m3 had increased to a volume of 2.6 × 10⁸ m3 by the time the landslide material came to rest.
Between 0 s and 40 s, the gravitationally unstable rock mass began collapsing from a high altitude. Potential energy was converted into kinetic energy as the rock mass fell.
Between 40 s and 80 s, the material in the rock mass disintegrated, transforming the main sliding body into a debris flow. The volume of the debris increased as it passed through the erosion area by continuously entraining the debris in the gully. Then it entered the accumulation area.
Between 80 s and 100 s, the debris flow reached the mouth of the gully and began to spread on both sides as the terrain became flat, then entered the Yigong river.
Between 100 s and 150 s, the flowing debris easily blocked and formed a landslide dam in the narrow channel of the Yigong River. The rear part of the debris continued to move forward and block both ends of the channel. At this time, the maximum debris accumulation height reached 60 m.
Between 150 s and 180 s, the debris flow material eventually came to rest. As in the previous time interval, the debris accumulation height in the river valley reached a maximum value of 75 m.
Contour maps of the debris accumulation height throughout this landslide are shown in Figure 8f.

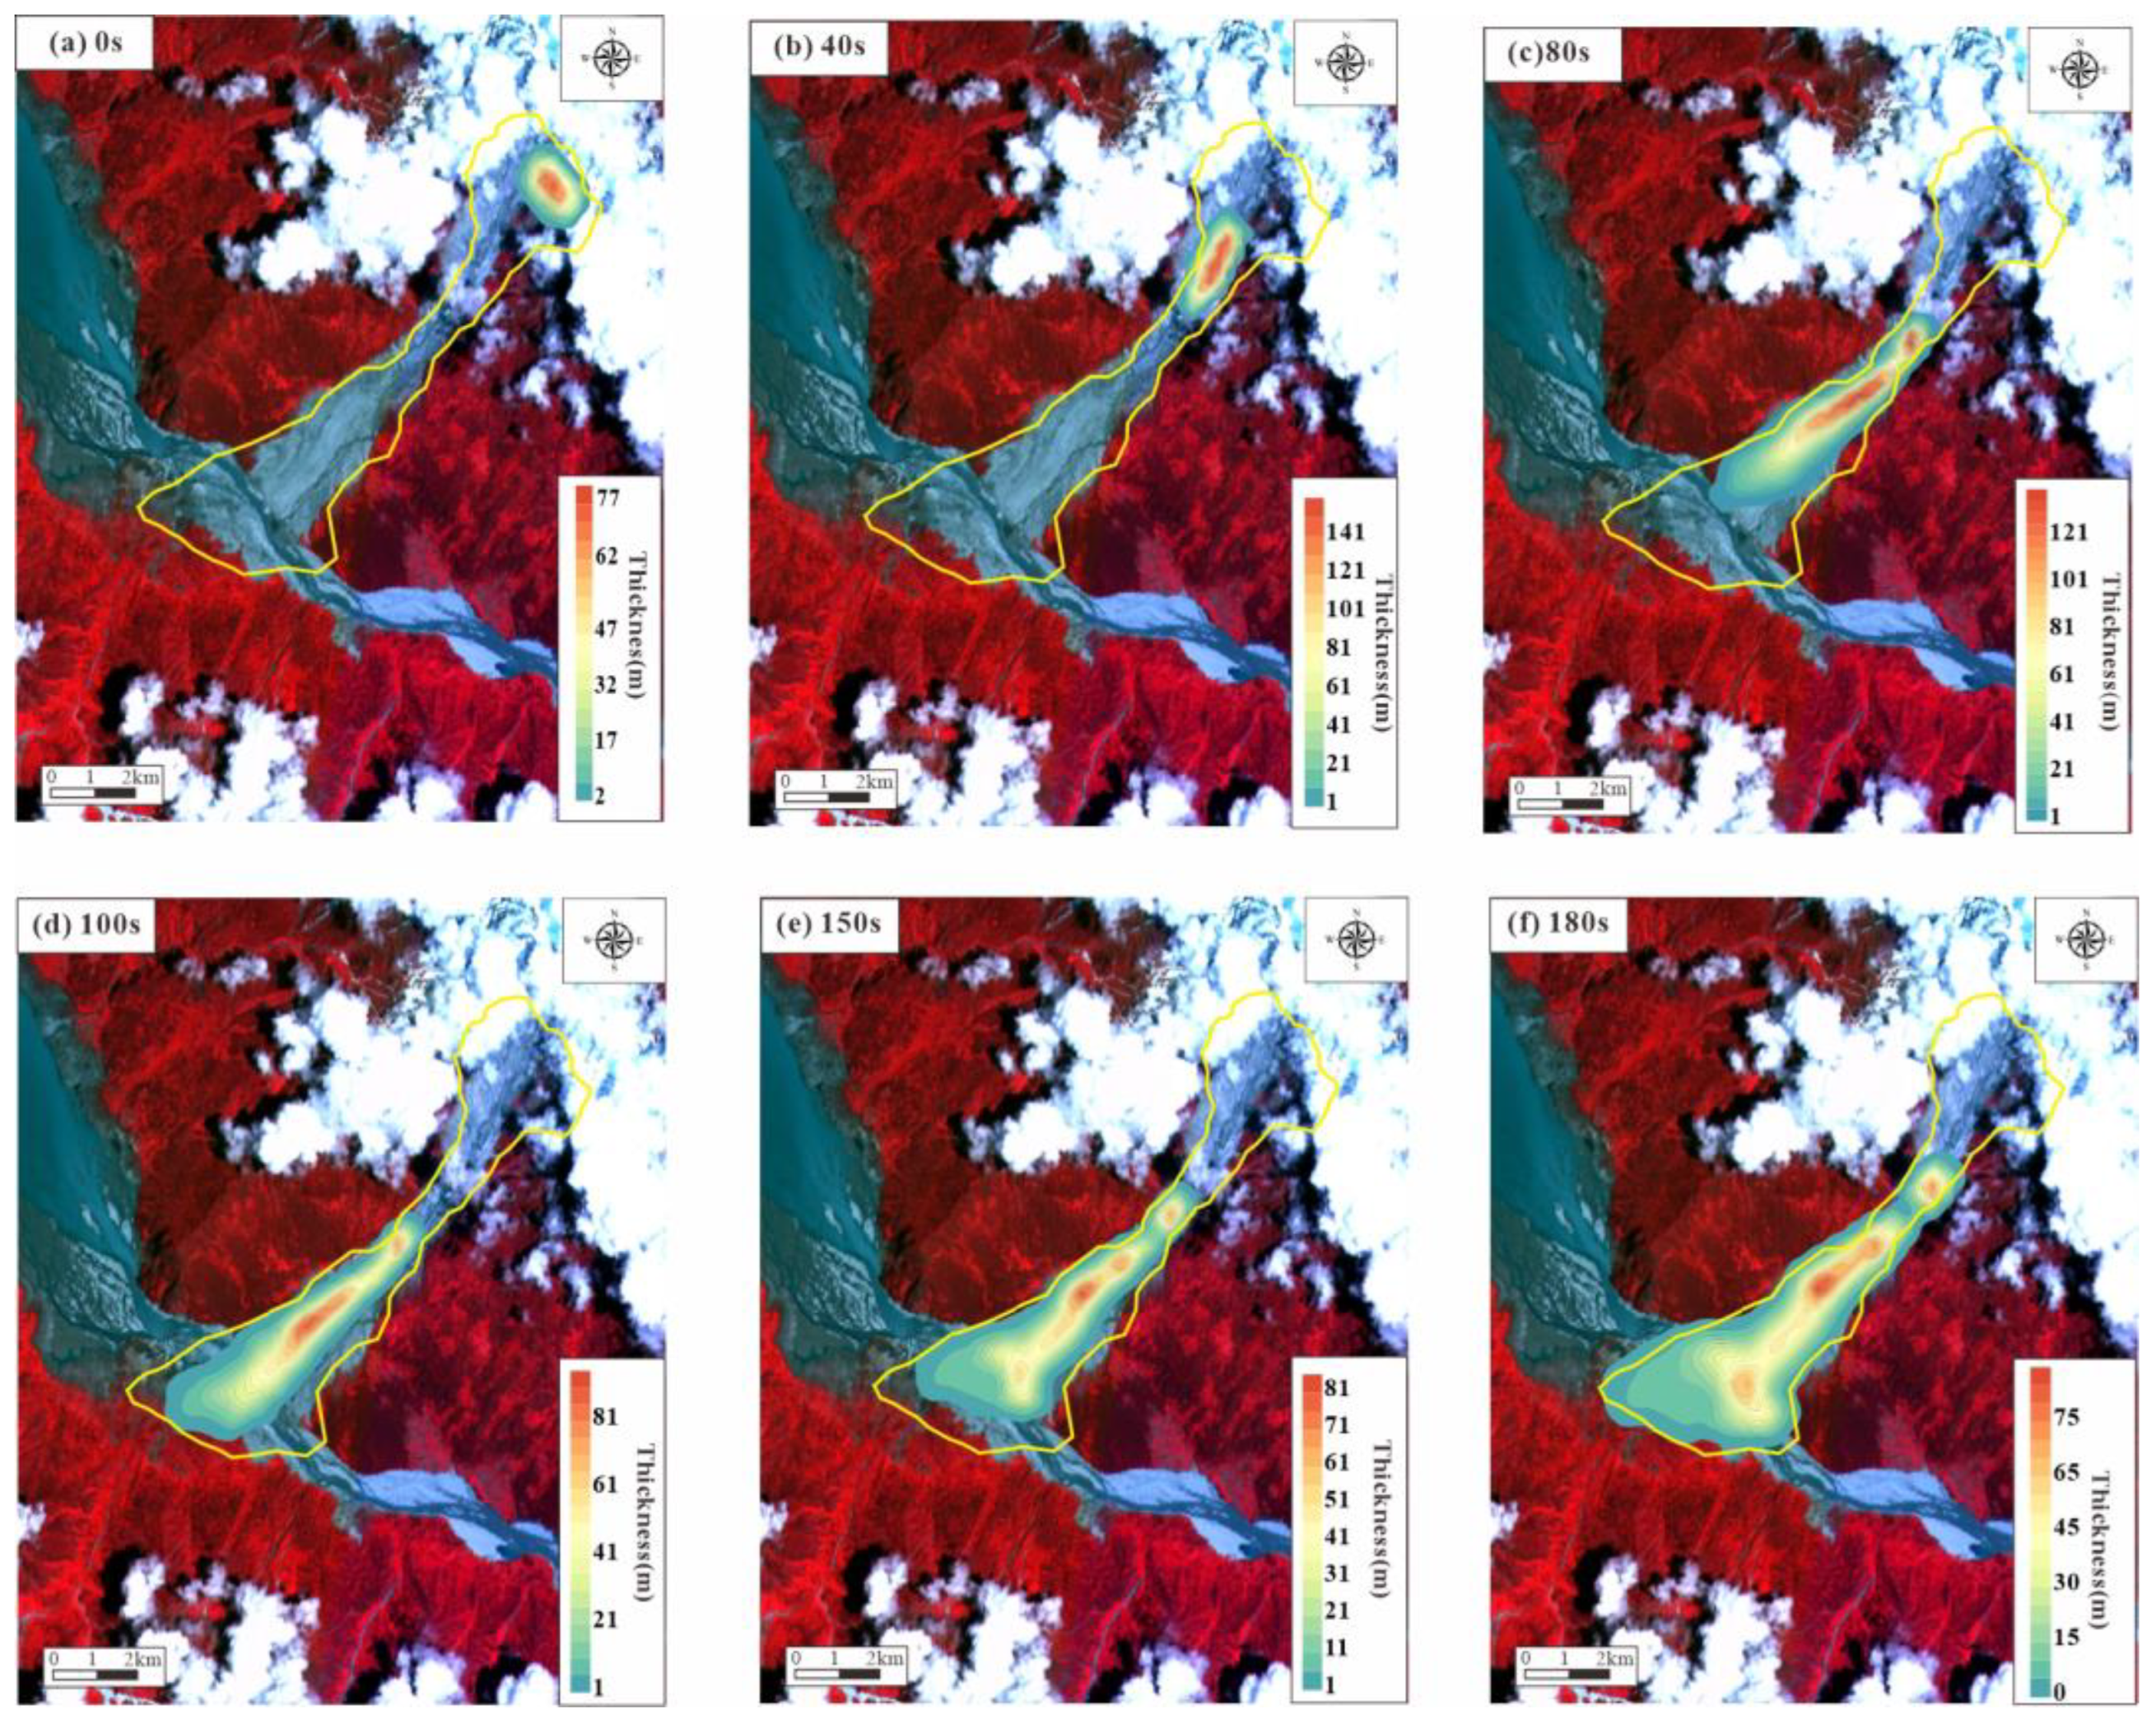
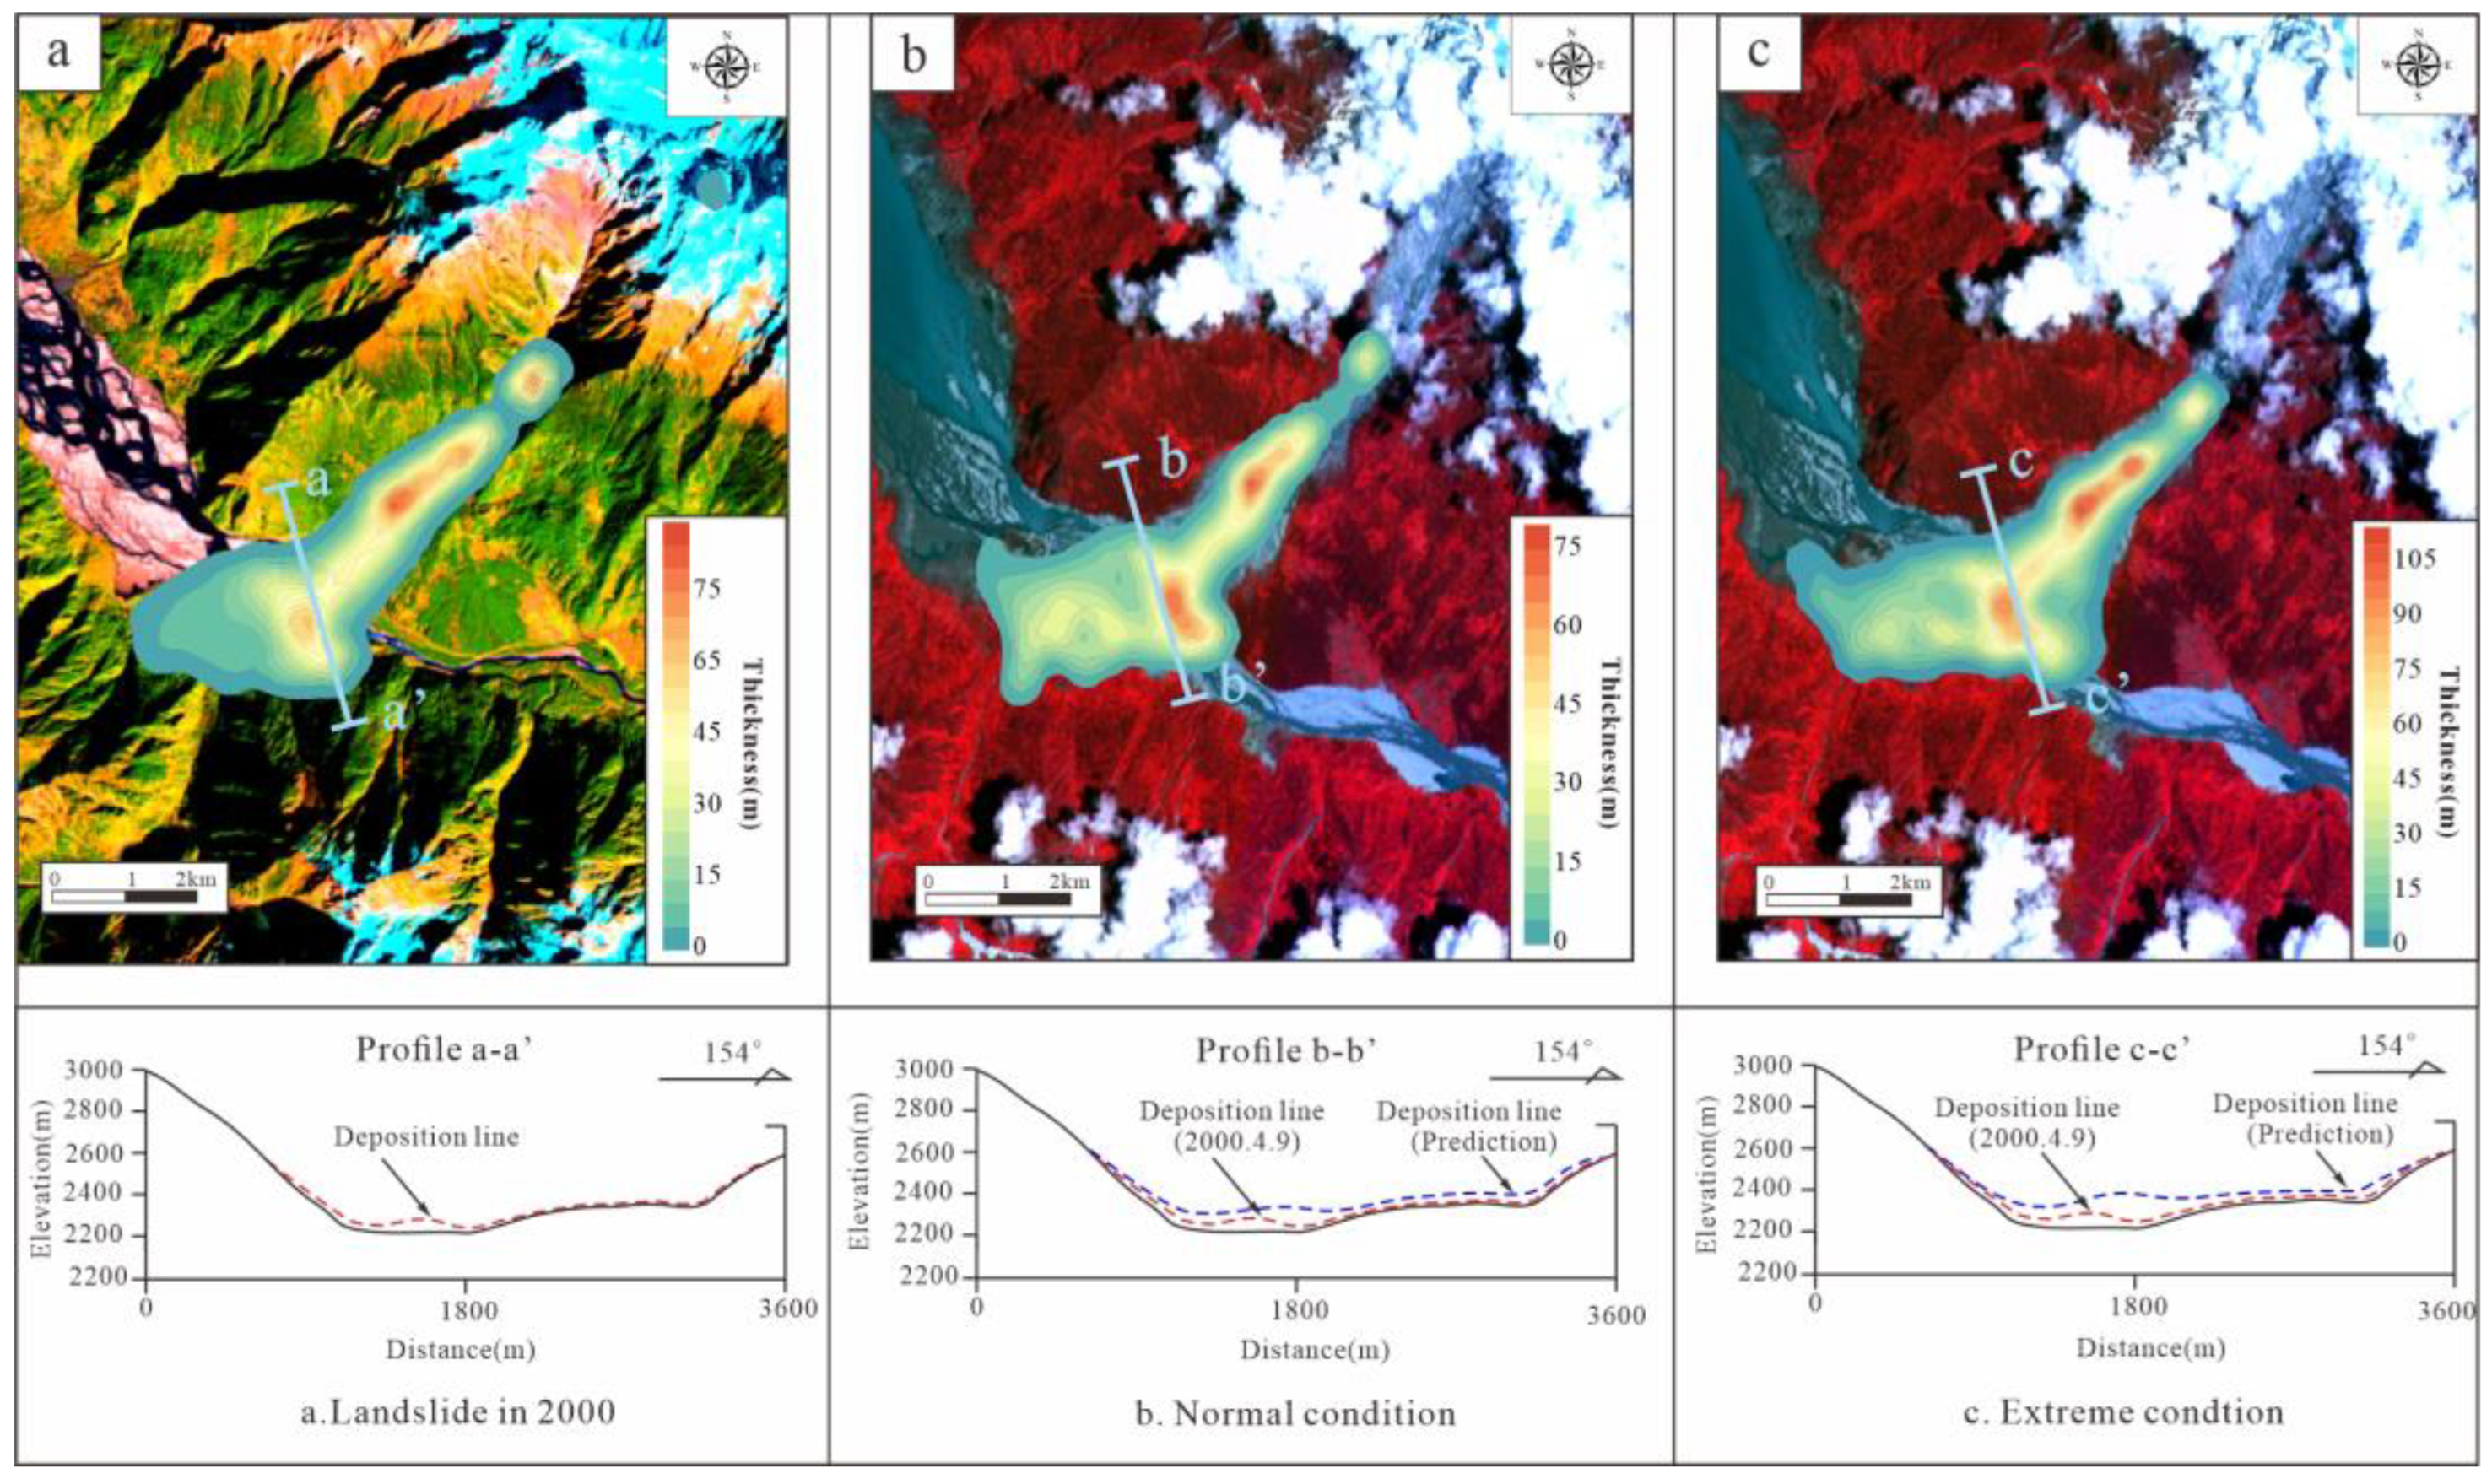
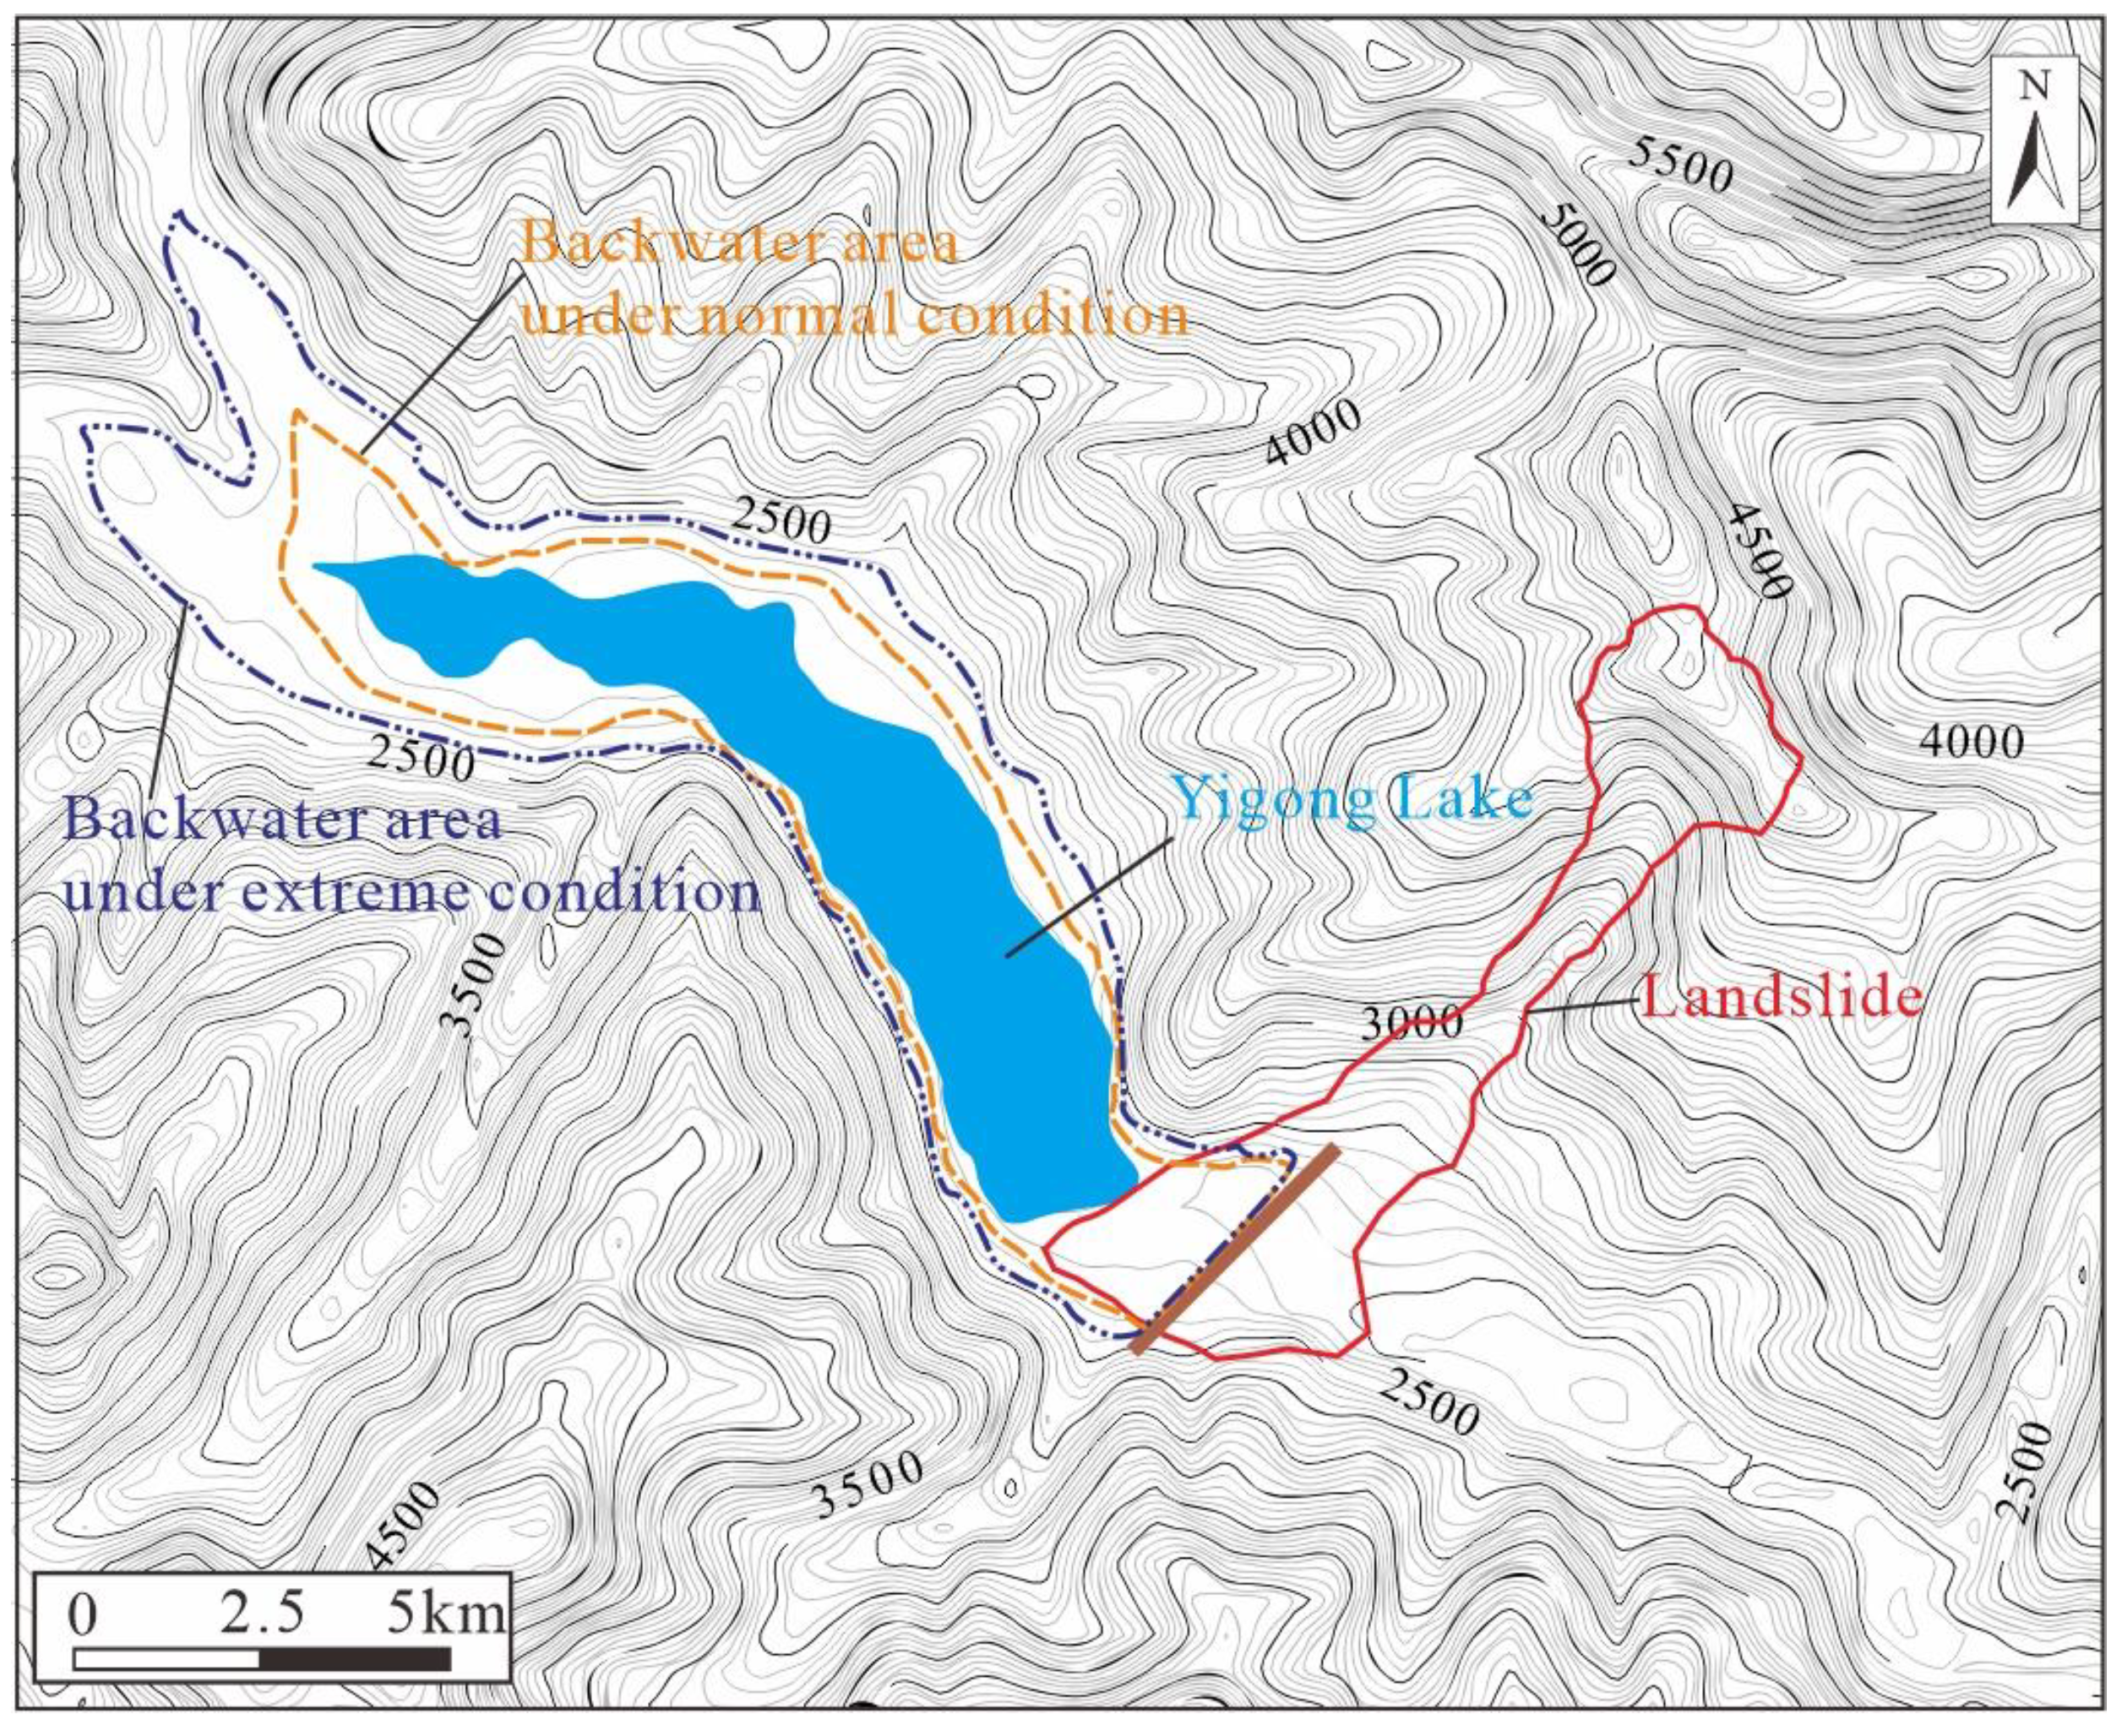
4.2.3. Simulation of Normal Condition

The normal conditions simulation results show that the landslide occurred over a time interval of 220 s and travelled a maximum distance of 10.8 km. The initial landslide volume of 9.2 × 10⁷ m3 had increased to a volume of 2.72 × 10⁸ m3 by the time the landslide material came to rest. Contour maps of the debris accumulation height throughout this landslide are shown in Figure 9.
The debris accumulation height in the river valley reached a maximum value of 76 m, and the average accumulation thickness reached 58 m.
Under normal conditions, the initial volume of the landslide and the final volume of the accumulation were similar to the landslide that occurred in 2000, and the maximum height of the dam reached 75 m and 76 m, respectively. Therefore, if the deformation area A of the interpretation is damaged, it will be possible to reproduce the 2000 landslide event.

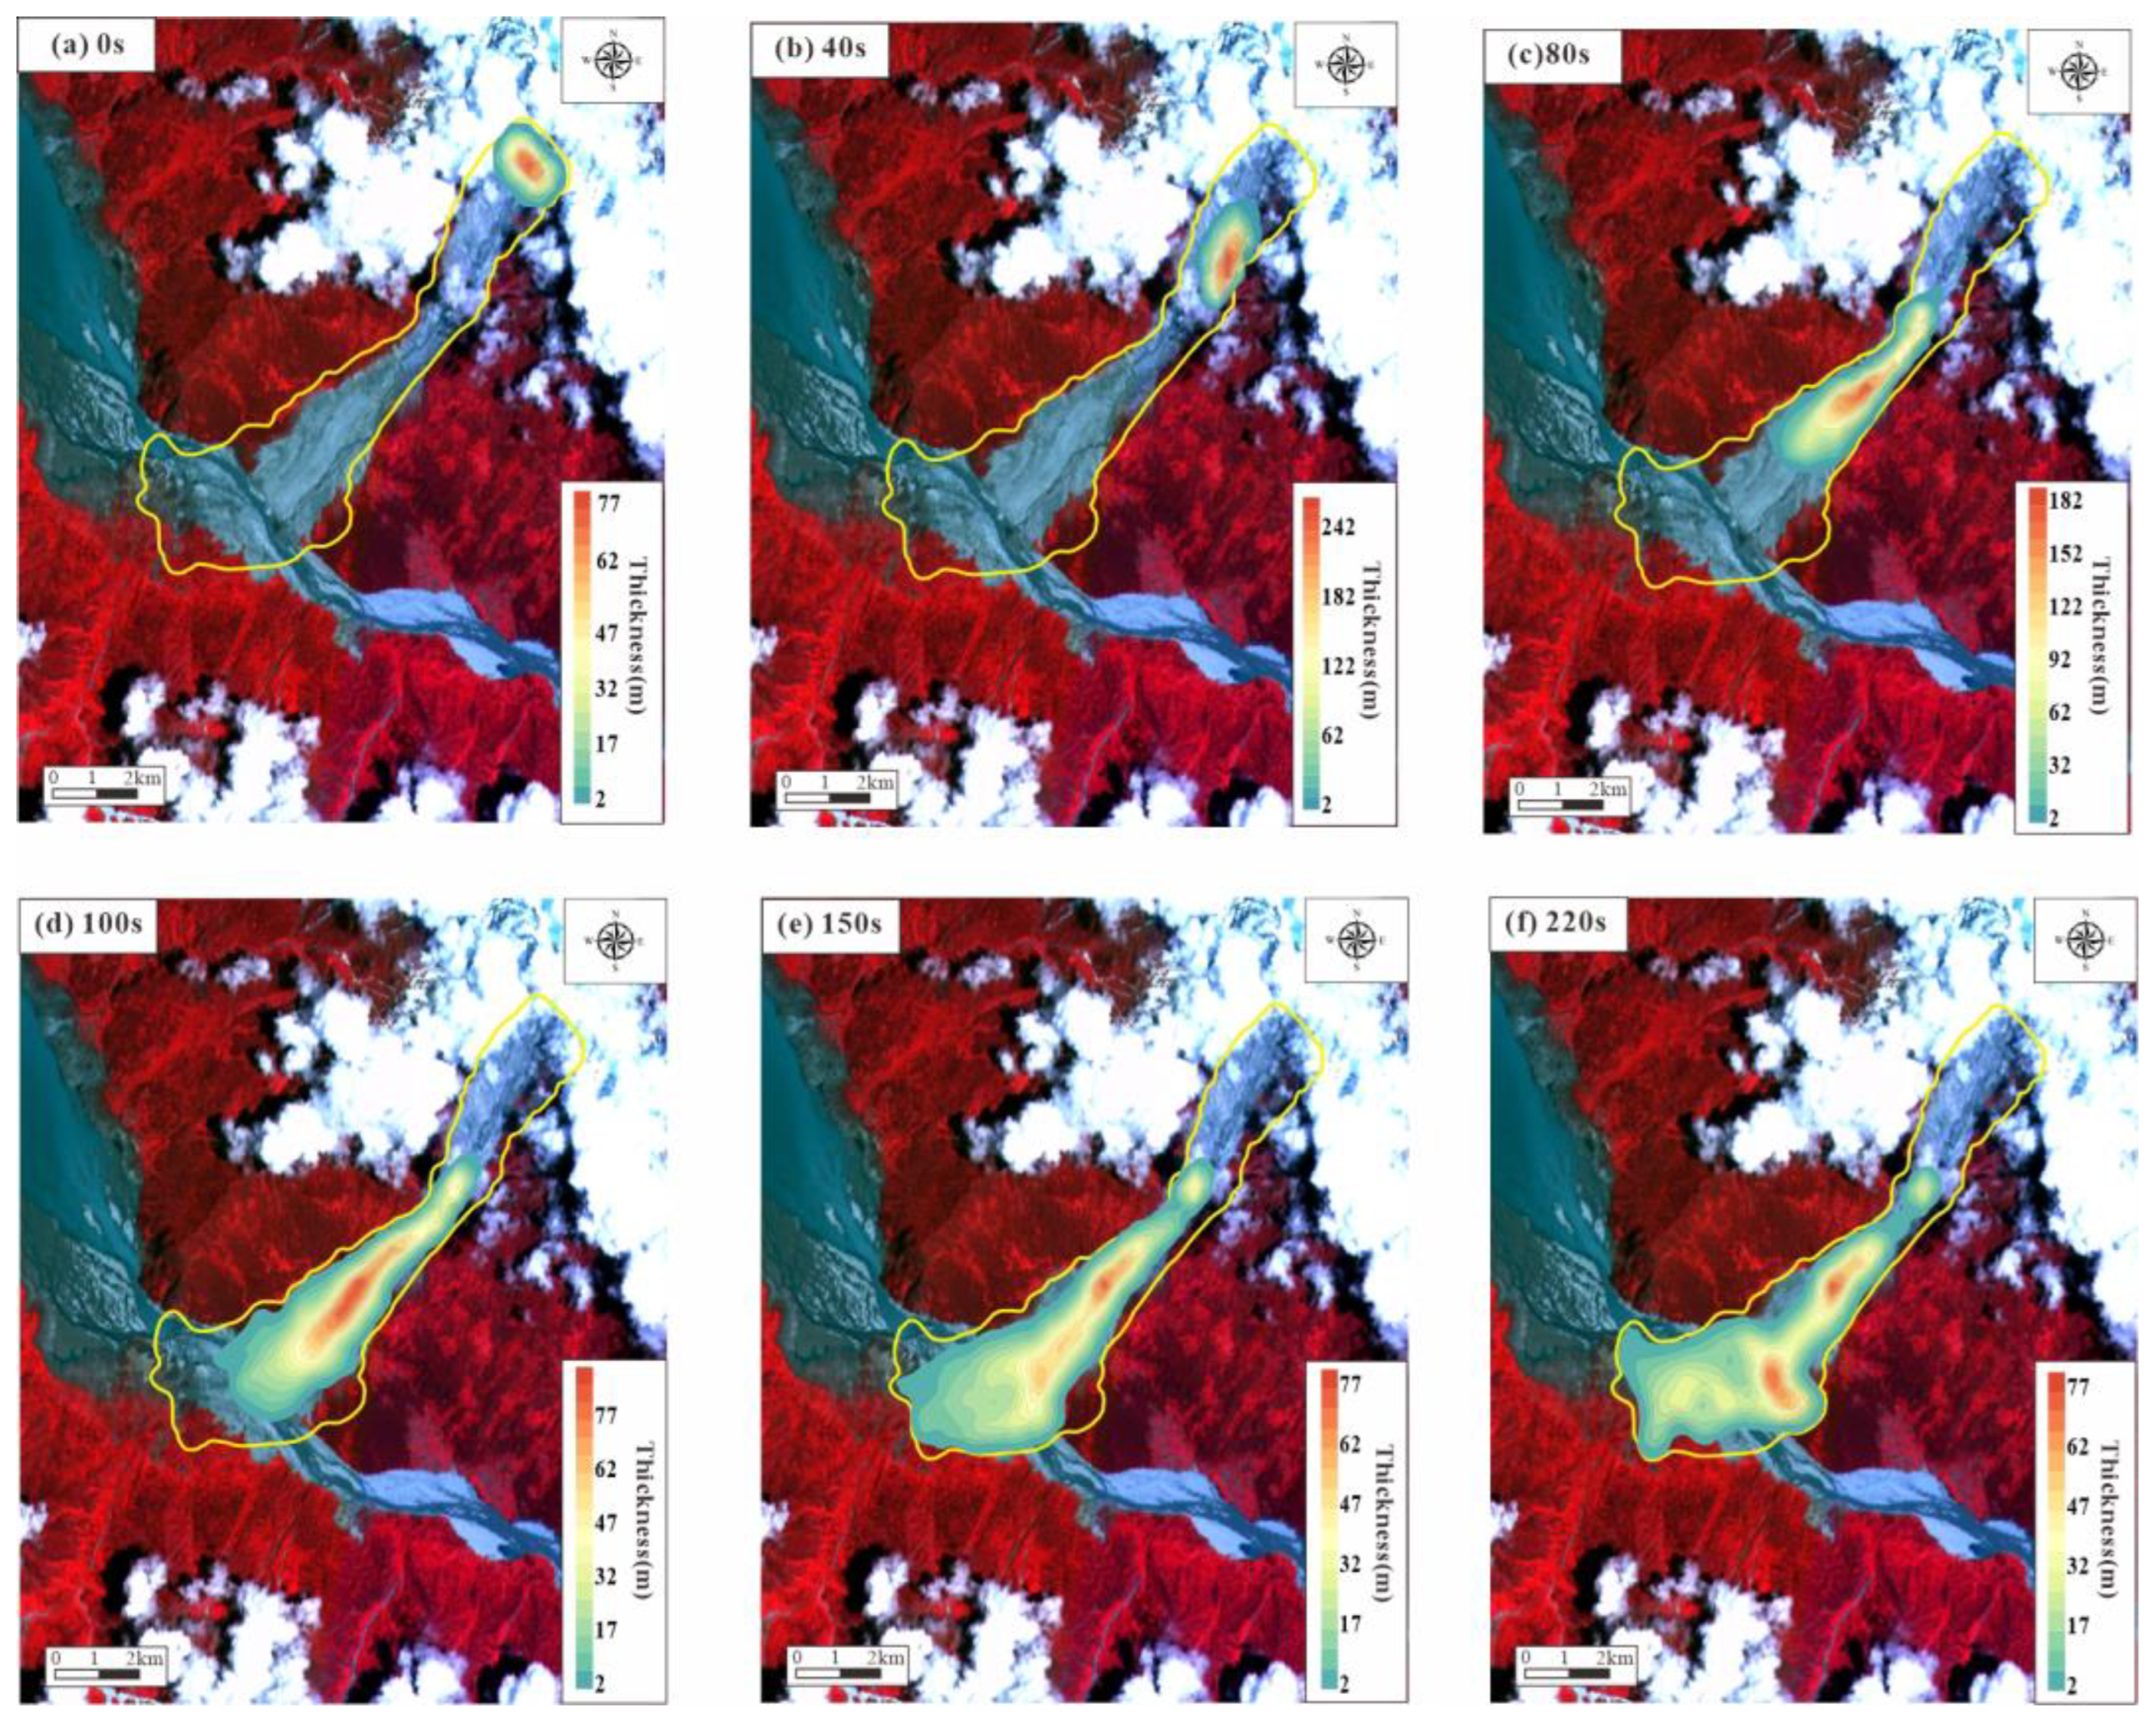
4.2.4. Simulation of Extreme Condition

The extreme conditions simulation results show that the landslide occurred over a time interval of 250 s and travelled a maximum distance of 11.2 km. The initial landslide volume of 1.86 × 10⁸ m3 had increased to a volume of 4.9 × 10⁸ m3 by the time the landslide material came to rest. Contour maps of the debris accumulation height throughout this landslide are shown in Figure 10.
The debris accumulation height in the river valley reached a maximum value of 106 m, and the average accumulation thickness reached 76 m.
Under extreme conditions, the initial volume was about twice as large as the 2000 landslide, and the accumulation volume was about 1.8 times larger. The maximum height of the dam reached 105 m, which is 1.4 times higher than the 75 m of the 2000 landslide. Therefore, if the decomposed deformation areas A and B collapse simultaneously, they will cause a more serious disaster event than the 2000 landslide.

5. Discussion

In the Qinghai–Tibet Plateau, landslides that occur at high altitudes and with long runouts can lead to a disaster chain. Additionally, the damage related to these events is often not the direct result of the ice and rockfall themselves but stems from the secondary disasters caused by the landslide-debris flow-blocked dam flood sequence [33]. The geologic conditions that contribute to the disaster chain are found on both sides of the deep gully, and the sequence of disasters easily affects the river due to large-scale blocking events or long-term material accumulation, which results in the formation of a dam across the river [1,13]. After the water behind the dam accumulates to a certain volume, the dam breaks. The ensuing flood disaster causes serious harm to downstream areas. Therefore, when evaluating the risk of high-altitude and long run-out landslides, the focus should be on evaluating the potential for river blockages.
Landslides in the Yigong gully frequently create landslide dams that block the Yigong Zangpo River; when the dams fail or when the reservoir overflows the dam, local communities may experience flooding. Using the constraints provided by the 2000 landslide and current InSAR displacement deformation data, we simulated the movement and accumulation processes of potential deformation areas under normal and extreme conditions. Based on the simulation results, the accumulation results under the two conditions are compared, and the accumulation profiles under different conditions are shown in Figure 11. The maximum height of the 2000 landslide dam is 75 m, with an average height of 56 m. Under normal conditions, the projected maximum height of the dam is 76 m, and the projected average height of the dam is 58 m. Under extreme conditions, the projected maximum height of the dam is 106 m, and the average height of the dam is 85 m.
To assess the increment of water after river blockage, backwater area was marked and measured (Figure 12). It is assumed that the reservoir water level line reaches the average height of the dam and that it will not break during the water rise. The section of the channel is generalized as rectangular and the maximum reservoir capacity is estimated. The scale of the backwater area is shown in Figure 11. Under normal conditions, it was determined that the backwater area is 36 km2. The average height of the dam is 58 m at an average elevation of 2330 m, and the reservoir capacity behind the dam exceeds 2.1 × 10⁹ m3. Under extreme conditions, the landslide dam has an average height of 85 m at an average elevation of 2365 m. With a backwater area of 49.5 km2, the reservoir capacity in these circumstances reaches 4.2 × 10⁹ m3. Hence, the landslide dams pose a significant flood risk to the surrounding communities.
The disaster chains are huge in volume and damage, which poses a great challenge for prevention and damage control. After the Yigong landslide occurred on 9 April 2000, the dam completely blocked the Yigong Zangbo River. In order to reduce the flooding hazard after the dam failure, a comprehensive consideration of factors including time, economics, technology, and human resources was taken. The development of the drainage trench diversion of water accelerated the collapse of the dam (Figure 13). The dam collapsed 62 days after the landslide occurred. Nevertheless, it still caused great damage. The case of the Yigong landslide gives us a huge warning that how to prevent and control the huge volume of the disaster chain is the next scientific problem that needs to be urgently solved.
It is believed that the following aspects should be mainly considered:
  • Reduce the volume of the landslide. From the volume data, the difference between the source area volume and the final accumulation volume is huge, reaching as much as three times, and erosion is an important factor leading to the increase in volume. How to reduce erosion is the key to reducing the volume of the landslide;
  • Conduct dam failure studies. For naturally occurring dams, research on methods to accelerate dam failure based on the nature of the dam material, dam morphology, to-pography, etc., is needed to reduce the damage caused by flooding;
  • Research on new control techniques and equipment. The original landslide prevention and control techniques and equipment for small landslides can no longer meet the prevention and control needs of huge disaster chains. How to prevent and control huge dams and balance the time, economic, and human factors is a difficult problem for research.
The research of new control techniques and equipment is an important scientific problem needed to solve the problem of disaster chains.

6. Conclusions

The recurrence of Yigong landslides is closely related to the conditions of global warming, frequent earthquakes, and the dry–wet and freezing–thawing cycles. The occurrence is likely to cause a chain effect, which inevitably pose a serious threat to infrastructure safety. Remote sensing is a key technology for studying landslide areas that are inaccessible to field investigation, which is useful and suitable for early recognition and evolution determination of disasters. According to InSAR data, there are currently two deformation areas in the source area of the Yigong landslide, of which the maximum displacement rate is 60 mm/year and the maximum displacement of the radar line of sight reaches 166 mm. According to the DAN3D simulation results, if only the displacement deformation area A collapses, the maximum accumulation height would reach 76 m, the average height of the dam would be 58 m, and the reservoir capacity behind the dam would exceed 2.1 × 10⁹ m3. If the displacement deformation areas A and B both collapse, the maximum debris accumulation height would reach 106 m, the projected average height of the dam would be 85 m, and the reservoir capacity in these circumstances would reach 4.2 × 10⁹ m3. As such, it is necessary to establish a high-altitude and long-runout landslides disaster monitoring and early warning system and a risk assessment system through remote sensing technology and numerical simulation technology. This research assessed the risk of recurrence of the Yigong landslide, providing a new idea for studying high-altitude and long-runout landslides. More broadly, research is also needed to explore potential risk mitigation and protection management techniques related to disaster chains.

Author Contributions

Writing—original draft preparation and editing, H.G.; methodology, B.L., Y.G., and Y.Y.; software, H.G. and Y.G.; resources, C.Y.; supervision, Y.Y., T.Z. and J.W. All authors have read and agreed to the published version of the manuscript.

Funding

This research was funded by the National Natural Science Foundation of China, grant numbers 42177172 and 41907257, the National Key R&D Program of China, grant number 2022YFC3004301, and the China Geological Survey Project, grant number DD20221816.

Data Availability Statement

The optical remote sensing images acquired by Landsat5, Landsat7, and Landsat8 were downloaded from NASA Landsat Science (https://landsat.gsfc.nasa.gov, accessed on 20 December 2021). Geological map data and elevation data from are from the China Geological Survey (https://www.cgs.gov.cn, accessed on 20 December 2021). Meteorological and hydrological data are from the China Meteorological Administration (https://www.cma.gov.cn, accessed on 20 December 2021). The seismic data came from the China Earthquake Administration (https://www.cea.gov.cn, accessed on 20 December 2021).

Acknowledgments

The authors would like to thank all the reviewers for their valuable suggestions.

Conflicts of Interest

The authors declare no conflict of interest.

References

  1. Delaney, K.B.; Evans, S.G. The 2000 Yigong landslide (Tibetan Plateau), rockslide-dammed lake and outburst flood: Review, remote sensing analysis, and process modelling. Geomorphology 2015, 246, 377–393. [Google Scholar] [CrossRef]
  2. Dunning, S.A.; Rosser, N.J.; McColl, S.T.; Reznichenko, N.V. Rapid sequestration of rock avalanche deposits within glaciers. Nat. Commun. 2015, 6, 7964. [Google Scholar] [CrossRef] [PubMed] [Green Version]
  3. Laha, S.; Kumari, R.; Singh, S.; Mishra, A.; Sharma, T.; Banerjee, A.; Nainwal, H.C.; Shankar, R. Evaluating the contribution of avalanching to the mass balance of Himalayan glaciers. Ann. Glaciol. 2017, 58, 110–118. [Google Scholar] [CrossRef] [Green Version]
  4. Tian, L.; Yao, T.; Gao, Y.; Thompson, L.; Mosley-Thompson, E.; Muhammad, S.; Zong, j.; Wang, C.; Jing, S.; Li, Z. Two glaciers collapse in western Tibet. J. Glaciol. 2017, 63, 194–197. [Google Scholar] [CrossRef] [Green Version]
  5. Kääb, A.; Leinss, S.; Gilbert, A.; Bühler, Y.; Gascoin, S.; Evans, S.G.; Bartelt, P.; Berthier, E.; Brun, F.; Chao, W.; et al. Massive collapse of two glaciers in western Tibet in 2016 after surge-like instability. Nat. Geosci. 2018, 11, 114–120. [Google Scholar] [CrossRef] [Green Version]
  6. Yin, Y.; Xing, A. Aerodynamic modeling of the Yigong gigantic rock slide-debris avalanche, Tibet, China. Bull. Eng. Geol. Environ. 2012, 71, 149–160. [Google Scholar] [CrossRef]
  7. Zhou, J.; Cui, P.; Hao, M. Comprehensive analyses of the initiation and entrainment processes of the 2000 Yigong catastrophic landslide in Tibet, China. Landslides 2016, 13, 39–54. [Google Scholar] [CrossRef]
  8. Martha, T.R.; Roy, P.; Jain, N.; Kumar, K.V.; Reddy, P.S.; Nalini, J.; Sharma, S.V.S.P.; Shukla, A.K.; Rao, K.H.V.D.; Narender, B.; et al. Rock avalanche induced flash flood on 07 February 2021 in Uttarakhand, India-a photogeological reconstruction of the event. Landslides 2021, 2021, 2881–2893. [Google Scholar] [CrossRef]
  9. Lovell, A.M.; Carr, J.R.; Stokes, C.R. Spatially variable glacier changes in the annapurna conservation area, Nepal, 2000 to 2016. Remote Sens. 2019, 11, 1452. [Google Scholar] [CrossRef] [Green Version]
  10. Guo, L.; Li, J.; Wu, L.; Li, Z.; Liu, Y.; Li, X.; Miao, Z.; Wang, W. Investigating the recent surge in the Monomah Glacier, Central Kunlun Mountain Range with multiple sources of remote sensing data. Remote Sens. 2020, 12, 966. [Google Scholar] [CrossRef] [Green Version]
  11. Herreid, S.; Pellicciotti, F. The state of rock debris covering Earth’s glaciers. Nat. Geosci. 2020, 13, 621–627. [Google Scholar] [CrossRef]
  12. Li, Z.; Sun, J.; Gao, M.; Fu, G.; An, Z.; Zhao, Y.; Fang, L.; Guo, X. Evaluation of horizontal ground motion waveforms at Sedongpu Glacier during the 2017 M6. 9 Mainling earthquake based on the equivalent Green’s function. Eng. Geol. 2022, 306, 106743. [Google Scholar] [CrossRef]
  13. Li, W.; Zhao, B.; Xu, Q.; Scaringi, G.; Lu, H.; Huang, R. More frequent glacier-rock avalanches in Sedongpu gully are blocking the Yarlung Zangbo River in eastern Tibet. Landslides 2022, 19, 589–601. [Google Scholar] [CrossRef]
  14. Havenith, H.B.; Torgoev, I.; Meleshko, A.; Alioshin, Y.; Torgoev, A.; Danneels, G. Landslides in the Mailuu-Suu Valley, Kyrgyzstan—Hazards and impacts. Landslides 2006, 3, 137–147. [Google Scholar] [CrossRef]
  15. Mergili, M.; Schneider, J.F. Regional-scale analysis of lake outburst hazards in the southwestern Pamir, Tajikistan, based on remote sensing and GIS. Nat. Hazards Earth Syst. Sci. 2011, 11, 1447–1462. [Google Scholar] [CrossRef] [Green Version]
  16. Yao, X.; Li, L.; Zhang, Y.; Zhou, Z.; Liu, X. Types and characteristics of slow-moving slope geo-hazards recognized by TS-InSAR along Xianshuihe active fault in the eastern Tibet Plateau. Nat. Hazard 2017, 88, 1727–1740. [Google Scholar] [CrossRef]
  17. Bozzano, F.; Cipriani, I.; Mazzanti, P.; Prestininzi, A. Displacement patterns of a landslide affected by human activities: Insightsfromground-based InSAR monitoring. Nat. Hazards 2011, 59, 1377–1396. [Google Scholar] [CrossRef]
  18. Hu, X.; Wang, T.; Pierson, T.C.; Lu, Z.; Kim, J.; Cecere, T.H. Detecting seasonal landslide movement within the cascade landslide complex (Washington) using time-series SAR imagery. Remote Sens. Environ. 2016, 187, 49–61. [Google Scholar] [CrossRef] [Green Version]
  19. Armaș, I.; Gheorghe, M.; Silvaș, G.C. Shallow Landslides Physically Based Susceptibility Assessment Improvement Using InSAR. Case Study: Carpathian and Subcarpathian Prahova Valley, Romania. Remote Sens. 2021, 13, 2385. [Google Scholar] [CrossRef]
  20. McDougall, S.; Hungr, O. A model for the analysis of rapid landslide motion across three-dimensional terrain. Can. Geotech. J. 2004, 41, 1084–1097. [Google Scholar] [CrossRef]
  21. Hungr, O.; Evans, S.G. Entrainment of debris in rock avalanches: An analysis of a long run-out mechanism. Geol. Soc. Am. Bull. 2004, 116, 1240–1252. [Google Scholar] [CrossRef] [Green Version]
  22. Gao, Y.; Li, B.; Gao, H.; Chen, L.; Wang, Y. Dynamic characteristics of high-elevation and long-runout landslides in the Emeishan basalt area: A case study of the Shuicheng “7.23” landslide in Guizhou, China. Landslides 2020, 17, 1663–1677. [Google Scholar] [CrossRef]
  23. Yin, Y.; Liu, X.; Zhao, C.; Tomás, R.; Zhang, Q.; Lu, Z.; Li, B. Multi-dimensional and long-term time series monitoring and early warning of landslide hazard with improved cross-platform SAR offset tracking method. Sci. China Tech. Sci. 2022, 65, 1891–1912. [Google Scholar] [CrossRef]
  24. Liu, X.J.; Zhao, C.Y.; Zhang, Q.; Lu, Z.; Li, Z.; Yang, C.S.; Zhu, W.; Zeng, J.L.; Chen, L.Q.; Liu, C. Integration of Sentinel-1 and ALOS/PALSAR-2 SAR datasets for mapping active landslides along the Jinsha River corridor, China. Eng. Geol. 2021, 284, 106033. [Google Scholar] [CrossRef]
  25. Costantini, M. A novel phase unwrapping method based on network programming. IEEE Trans. Geosci. Remote Sens. 1998, 36, 813–821. [Google Scholar] [CrossRef]
  26. Goldstein, R.M.; Werner, C.L. Radar interferogram fltering for geophysical applications. Geophys. Res. Lett. 1998, 25, 4035–4038. [Google Scholar] [CrossRef] [Green Version]
  27. Yin, Y.; Xing, A.; Wang, G.; Feng, Z.; Li, B.; Jiang, Y. Experimental and numerical investigations of a catastrophic long-runout landslide in Zhenxiong, Yunnan, southwestern China. Landslides 2017, 14, 649–659. [Google Scholar] [CrossRef]
  28. Gao, Y.; Yin, Y.; Li, B. Characteristics and numerical runout modeling analysis of the Jiweishan landslide, Chongqing. China Environ. Eng. Geosci. 2018, 24, 1–11. [Google Scholar]
  29. McDougall, S. A New Continuum Dynamic Model for the Analysis of Extremely Rapid Landslide Motion across Complex 3D Terrain. Ph.D. Dissertation, University of British Columbia, Vancouver, BC, Canada, 2006. [Google Scholar]
  30. Gao, Y.; Yin, Y.; Li, B.; Feng, Z.; Wang, W.; Zhang, N.; Xing, A.G. Characteristics and Numerical Runout Modeling of the Heavy Rainfall-Induced Catastrophic Landslide debris Flow at Sanxicun, Dujiangyan, China, following the Wenchuan Ms 8.0 Earthquake. Landslides 2017, 14, 1361–1374. [Google Scholar] [CrossRef]
  31. Evans, S.G.; Hungr, O.; Clague, J.J. Dynamics of the 1984 rock avalanche and associated distal debris flow on Mount Cayley, British Columbia, Canada; implications for landslide hazard assessment on dissected volcanoes. Eng. Geol. 2001, 61, 29–51. [Google Scholar] [CrossRef]
  32. Xu, Q.; Shang, Y.; van Asch, T.; Wang, S.; Zhang, Z.; Dong, X. Observations from the large rapid Yigong rockslide debris avalanche, southeast Tibet. Can. Geotech. J. 2012, 49, 589–606. [Google Scholar] [CrossRef]
  33. Zhang, S.L.; Yin, Y.P.; Hu, X.W.; Wang, W.P.; Zhang, N.; Zhu, S.N.; Wang, L.Q. Dynamics and emplacement mechanisms of the successive Baige landslides on the Upper Reaches of the Jinsha River, China. Eng. Geol. 2020, 278, 105819. [Google Scholar] [CrossRef]
Figure 1. Geological map of the study area. (Geological map data from China Geological Survey; The upper right corner remote sensing map is from Google Earth in 2022).
Remotesensing 15 01322 g001
Figure 2. Earthquake distribution and acceleration around Yigong landslide. (a) The epicenter distribution around the Yigong landslide since 1970; (b) The curve of acceleration since 1990.
Remotesensing 15 01322 g002
Figure 3. Temperature, rainfall, and dry and wet curves of Yigong landslide. (a) The curve of annual average temperature and annual average precipitation; (b) The curve of SPI in Yigong landslide.
Remotesensing 15 01322 g003
Figure 4. Major features of different areas in the Yigong gully. (a) the optical remote sensing images of the Yigong landslide in 2020 by Landsat 8; (b) general view of the Yigong landslide, taken in August 2019; (c) the photo of the source area; (d) the feature photo of the erosion area; (e) the feature photo of the accumulation area, taken in April 2000.
Remotesensing 15 01322 g004
Figure 5. Geological profile of the Yigong landslide.
Remotesensing 15 01322 g005
Figure 6. Historical remote sensing image of the Yigong landslide. (ah) show the optical remote sensing images of Yigong landsldie from 1993 to 2020.
Remotesensing 15 01322 g006
Figure 7. InSAR monitoring results of the Yigong landslide. (a) the annual average surface diplacement rate of the ALOS/PALSAR-2 image radar ascending track image; (b) the annual average surface displacement rate of the ALOS/PALSAR-2 image radar descending track image; (c) the ascending annual average surface displacement rate of potential deformation area A; (d) the ascending accumulation displacement curve of potential deformation area A.
Remotesensing 15 01322 g007
Figure 8. Contour map of the inversion simulation process of the 2000 Yigong landslide. (af) show six typical contour maps selected from the simulation process of 0 s–180 s. The yellow line represents the actual landslide range in 2000.
Remotesensing 15 01322 g008
Figure 9. Contour map of the simulation process under normal simulation condition. (af) show six typical contour maps selected from the simulation process of 0 s–220 s. The yellow line represents the maximum range of landslide in the simulation process.
Remotesensing 15 01322 g009
Figure 10. Contour map of the simulation process under extreme simulation condition. (af) show six typical contour maps selected from the simulation process of 0 s–250 s. The yellow line represents the maximum range of landslide in the simulation process.
Remotesensing 15 01322 g010
Figure 11. Simulation profile of the deposits dam under different simulation conditions. (a) the simulation contour map and deposits dam profile of Yigong landslide in 2000; (b) the simulation contour map and deposits dam profile of normal condition; (c) the simulation contour map and deposits dam profile of extreme condition.
Remotesensing 15 01322 g011
Figure 12. Range of backwater area under different simulation conditions.
Remotesensing 15 01322 g012
Figure 13. The drainage trench in 2000 Yigong landslide. (a) the route of the drainage trench in the accumulation area after the 2000 Yigong Landslide; (b) the exit of the drainage trench over the dam body.
Remotesensing 15 01322 g013
Table 1. Remote Sensing Image Satellite Type Data.
YearDay/MonthSatellite TypeSensor TypeResolution
199325/05Landsat5TM30 m
199805/12Landsat5TM30 m
200005/011Landsat5TM30 m
200012/05Landsat5TM30 m
200101/12Landsat7ETM+30 m
200606/02Landsat5TM30 m
201324/11Landsat8OLI30 m
202029/02Landsat8OLI30 m
Table 2. Simulation parameters for the landslide that occurred on 9 April 2000.
ZoneRheologyγ (kN/m3)φ (°)fruMax Erosion Depth (m)
Source areaFrictional2419.8-0.20
Erosion areaVoellmy20-0.08-65
Accumulation areaFrictional2020-0.30
Disclaimer/Publisher’s Note: The statements, opinions and data contained in all publications are solely those of the individual author(s) and contributor(s) and not of MDPI and/or the editor(s). MDPI and/or the editor(s) disclaim responsibility for any injury to people or property resulting from any ideas, methods, instructions or products referred to in the content.

