Technical Note

Development of a Radiometric Calibration Method for Multispectral Images of Croplands Obtained with a Remote-Controlled Aerial System

1
Department of Applied Plant Science, Chonnam National University, Gwangju 61186, Republic of Korea
2
Satellite Application Division, Korea Aerospace Research Institute, Daejeon 34133, Republic of Korea
*
Author to whom correspondence should be addressed.
These authors contributed equally to this work.
Remote Sens. 2023, 15(5), 1408; https://doi.org/10.3390/rs15051408
Submission received: 10 December 2022 / Revised: 8 February 2023 / Accepted: 27 February 2023 / Published: 2 March 2023

Abstract

:
A remote sensing (RS) platform consisting of a remote-controlled aerial vehicle (RAV) can be used to monitor crop, environmental conditions, and productivity in agricultural areas. However, the current methods for the calibration of RAV-acquired images are cumbersome. Thus, a calibration method must be incorporated into RAV RS systems for practical and advanced applications. Here, we aimed to develop a standalone RAV RS-based calibration system without the need for calibration tarpaulins (tarps) by quantifying the sensor responses of a multispectral camera, which varies with light intensities. To develop the standalone RAV-based RS calibration system, we used a quadcopter with four propellers, with a rotor-to-rotor length of 46 cm and height of 25 cm. The quadcopter equipped with a multispectral camera with green, red, and near-infrared filters was used to acquire spectral images for formulating the RAV RS-based standardization system. To perform the calibration study process, libraries of sensor responses were constructed using pseudo-invariant tarps according to the light intensities to determine the relationship equations between the two factors. The calibrated images were then validated using the reflectance measured in crop fields. Finally, we evaluated the outcomes of the formulated RAV RS-based calibration system. The results of this study suggest that the standalone RAV RS system would be helpful in the processing of RAV RS-acquired images.

1. Introduction

Remote-controlled aerial vehicle (RAV)-based remote sensing systems (RSSs) are user-friendly and provide a convenient means for the geospatial characterization of crop and ecophysiological information during growing seasons. Therefore, this approach has been widely used in the agricultural field [1,2]. Moreover, a RAV RSS allows for the frequent acquisition of image data at a lower cost and with a better spatial resolution than any other aviation RS platform [3,4,5]. Due to these advantages, RAV platforms are used in many agricultural studies as spatial and temporal resolution RS tools to monitor crop growth and field conditions [6,7,8].
However, an appropriate radiometric calibration method for multispectral image data is essential to obtain reliable crop growth information before an RAV RSS can be used. Radiometric calibration not only converts the digital numbers (DN) from a RAV RSS into physical units such as reflectance but also ensures the reliability of RAV-based RS imagery data. RAV images are often calibrated using invariant reference tarpaulins (tarps), as this approach is not only accurate but also straightforward [5,9,10]. Nevertheless, calibration tarps cannot be easily applied to multiple sections of a large field requiring various images. Additionally, using calibration parameters from tarps measured a single time for multiple aerial photograph data can cause errors due to differences in image acquisition time. To address this issue, images of tarps with invariant reflection values can be taken at the same time or before/after the flight. Nevertheless, this approach can result in some errors in the case of compositing multiple images for a large area due to changes in light intensity between the tarp image and the other images taken during flights once the tarps are excluded [11]. Moreover, employing this approach is inefficient because the reference tarps should always be carried or included in multiple images using many replicas of the tarps. Additionally, the reference reflectance of the tarps may inevitably change over time due to dust contamination or color fading [12]. In turn, this can negatively affect the quality of the calibrated image. These limitations highlight the need for the development and integration of a calibration method into RAV RSSs.
An alternative calibration technology has been recently developed, which consists of measuring incident solar radiation using a compact spectrum sensor comprised of a built-in set coupled with a commercially available camera [4,11,13]. This approach can directly correct the reflectance of objects without calibration tarps. However, the calibrated image also contains too many uncertainties caused by atmospheric effects and noise. The sensor mounted on an RAV may also acquire noisy data due to the vibration and tilt of the RAS in natural flight conditions such as solar radiation and wind [14,15]. Additionally, RAS systems with built-in cameras cannot be easily adapted or equipped with other cameras.
The most critical issue in radiometric calibration for RAV RSS images is the constant fluctuation in light intensity. Radiometric calibration could be possible without reference tarps if a change in DN can be quantified according to light intensity variations. Therefore, a new approach that can be employed universally (i.e., not with a specific camera or RAV RSS) is needed to overcome the aforementioned limitations. This study aimed to develop an efficient RAV image calibration technology that can be applied to obtain crop growth information in croplands. The specific objectives of this study were to (1) quantify sensor responses of a multispectral camera that varies with light intensities, (2) define equations for radiometric calibration that can always obtain constant reflectance without reference tarps, and (3) apply and evaluate the accuracy of the developed radiometric calibration method in agricultural fields using the estimated tarp reflectance (TR) and vegetation indices.

2. Materials and Methods

2.1. RAV RSS Configuration

This study was conducted using a 3DR Solo quadcopter (3D Robotics, Berkeley, CA, USA) (Figure 1a), which is relatively stable compared to other types of RAVs such as helicopters or fixed-wing RAVs. The RAV can hover for 20 min using a rechargeable 5200 mAh battery. The 3DR SOLO weighs 1.5 kg, and its rotor-to-rotor length is 46 cm. The 3DR Solo can automatically control both copter and camera positioning in flight.
A Micro agricultural digital camera (ADC) (Tetracam Inc., Chatsworth, CA, USA) was used to obtain multispectral images in the field. The three multispectral sensors acquire images in the green (520–600 nm), red (630–690 nm), and near-infrared (760–900 nm) wavelengths, with a total wavelength detection capacity range of 520–900 nm (Figure 1b). The camera weighs 90 g and spans 75 × 59 × 33 mm. Mounted on the camera are three band sensors, each measuring 6.55 × 4.92 mm. The camera can be adjusted to control the exposure level, capture speed, and file format to suit the user’s field environment. Each sensor can take images at a pixel resolution of 3.12 microns. Additionally, the images can be combined using the PixelWrench2 software (Tetracam Inc., Chatsworth, CA, USA). This camera has been widely used in other studies, making it suitable for almost any RAV platform [16]. The camera images were taken at approximately 12:00 ± 35 min (local time) to minimize errors caused by changes in sun angles. Furthermore, the camera exposure was set to 50% with a shutter speed of 1 millisecond to obtain consistent DN under the same light intensities. Finally, we acquired the aerial image with a single shot at a fixed hovering speed of 0 m s−1 because we captured the image in a more perfect orthoimage and stable hovering state. The camera image size was 2048 × 1536 with a spatial resolution of 1.9 cm at 50 m above the ground and 3.8 cm at 100 m. The RAV RSS images were processed using the PixelWrench2 (Tetracam Inc., Chatsworth, CA, USA) and ENVI (Geospatial Solutions, Inc., Broomfield, CO, USA) software. The projected images used in this study were resampled to a pixel resolution of 0.5 m for better readability.

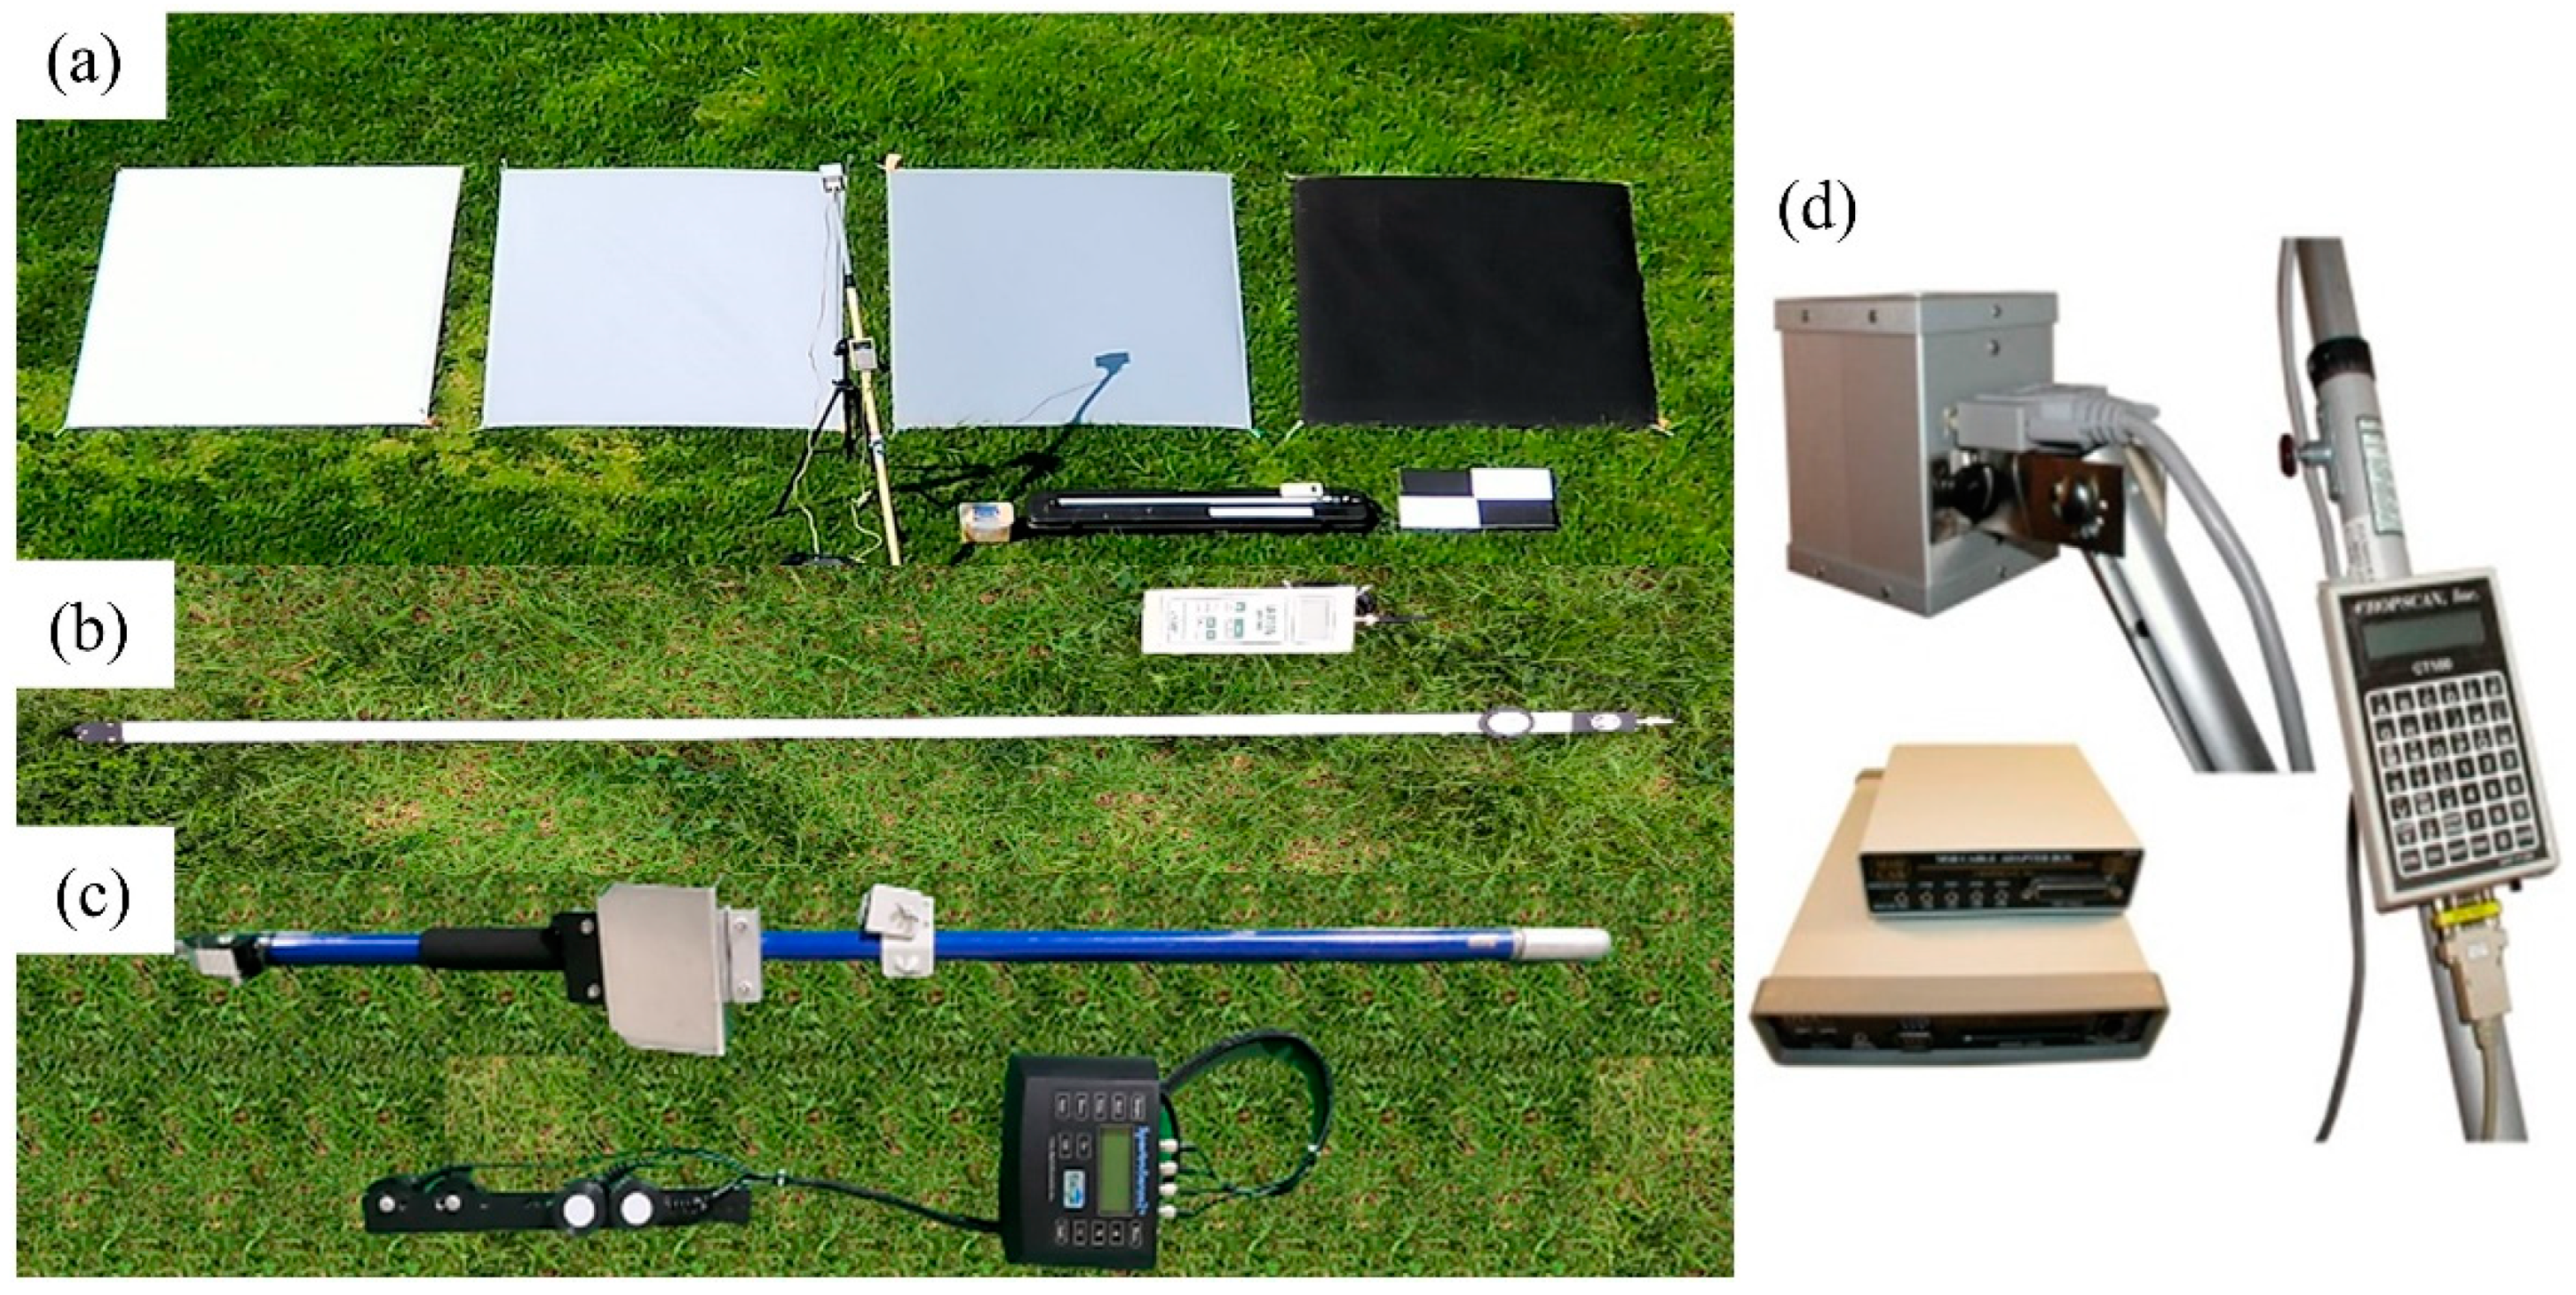
2.2. Reference Tarps

Reference tarps were used to define standard equations to convert the DNs of the camera images into reflectance (Figure 2). Once the equations were initially defined, they were no longer used for radiometric calibration. The tarps were chemically treated to ensure the homogeneous reflectance needed for the calibration. Each tarp measured 1.0 × 2.0 m and had constant reflectance values of 0.031, 0.21, 0.32, and 0.51 (Figure A1). Redundant tarps were used to accurately obtain the images of a camera targeting a reference tarp in a changing incident light environment.

2.3. Multispectral Radiometer

A hand-held multispectral radiometer (CropScan, Rochester, MN, USA) was used to measure the reflectance of the reference tarps. The radiometer can accommodate up to 16 bands in the 450–1750 nm region to measure incident and reflected radiations. The radiometer had a 28° field of view for the reflected irradiation sensors and had a vertical resolution of 1 m in height above the reference tarp to measure a 0.5 m diameter. Another multispectral radiometer, a SpectroSense2+ (Skye Instruments, Llandrindod Wells, UK), was used to characterize the relationship between the light intensities and the DN of the tarps measured with the multispectral camera. The equipment consisted of four wavebands with upward and downward sensors from 440 to 870 nm. The down sensors recorded blue (440 nm), green (560 nm), red (670 nm), and near-infrared (870 nm) bands together with the up sensors. The hand-held multispectral radiometer was operated simultaneously with the RAS-based multispectral camera mentioned above. Measurements were made at three replications close to the field environment where the reference tarp was installed.

2.4. Quantum Sensor

The LI-191R line quantum sensor (LI-COR Inc., Lincoln, NE, USA) measures light in the Photosynthetic Photon Flux Density (PPFD) unit expressed as μmol s−1 m−2 in the wavelength range of 400–700 nm. Photosynthetically active radiation (PAR) was measured to quantify the light intensity using the line quantum sensor. The sensor uses a 1 m long rod under a diffuser. The diffuser essentially integrates infinite points over its surface into a single value, representing light from the entire 1 m length to provide a stable quantum response. The correlation between light intensity and multispectral bands was confirmed by comparing the PAR value measured from incident light with the sensor value of the SpectroSense2+ meter. Upon confirming this significant correlation, a line quantum sensor was used for the correction system of a multispectral camera according to the incident light. The light intensities were measured simultaneously when the RAS acquired the aerial images using the abovementioned line quantum sensor. The LI-190R quantum sensor (LI-COR Inc., Lincoln, NE, USA) was also used. PAR was measured at three replications at the location where the reference tarps were installed when the solar irradiance of the field environment was stabilized.

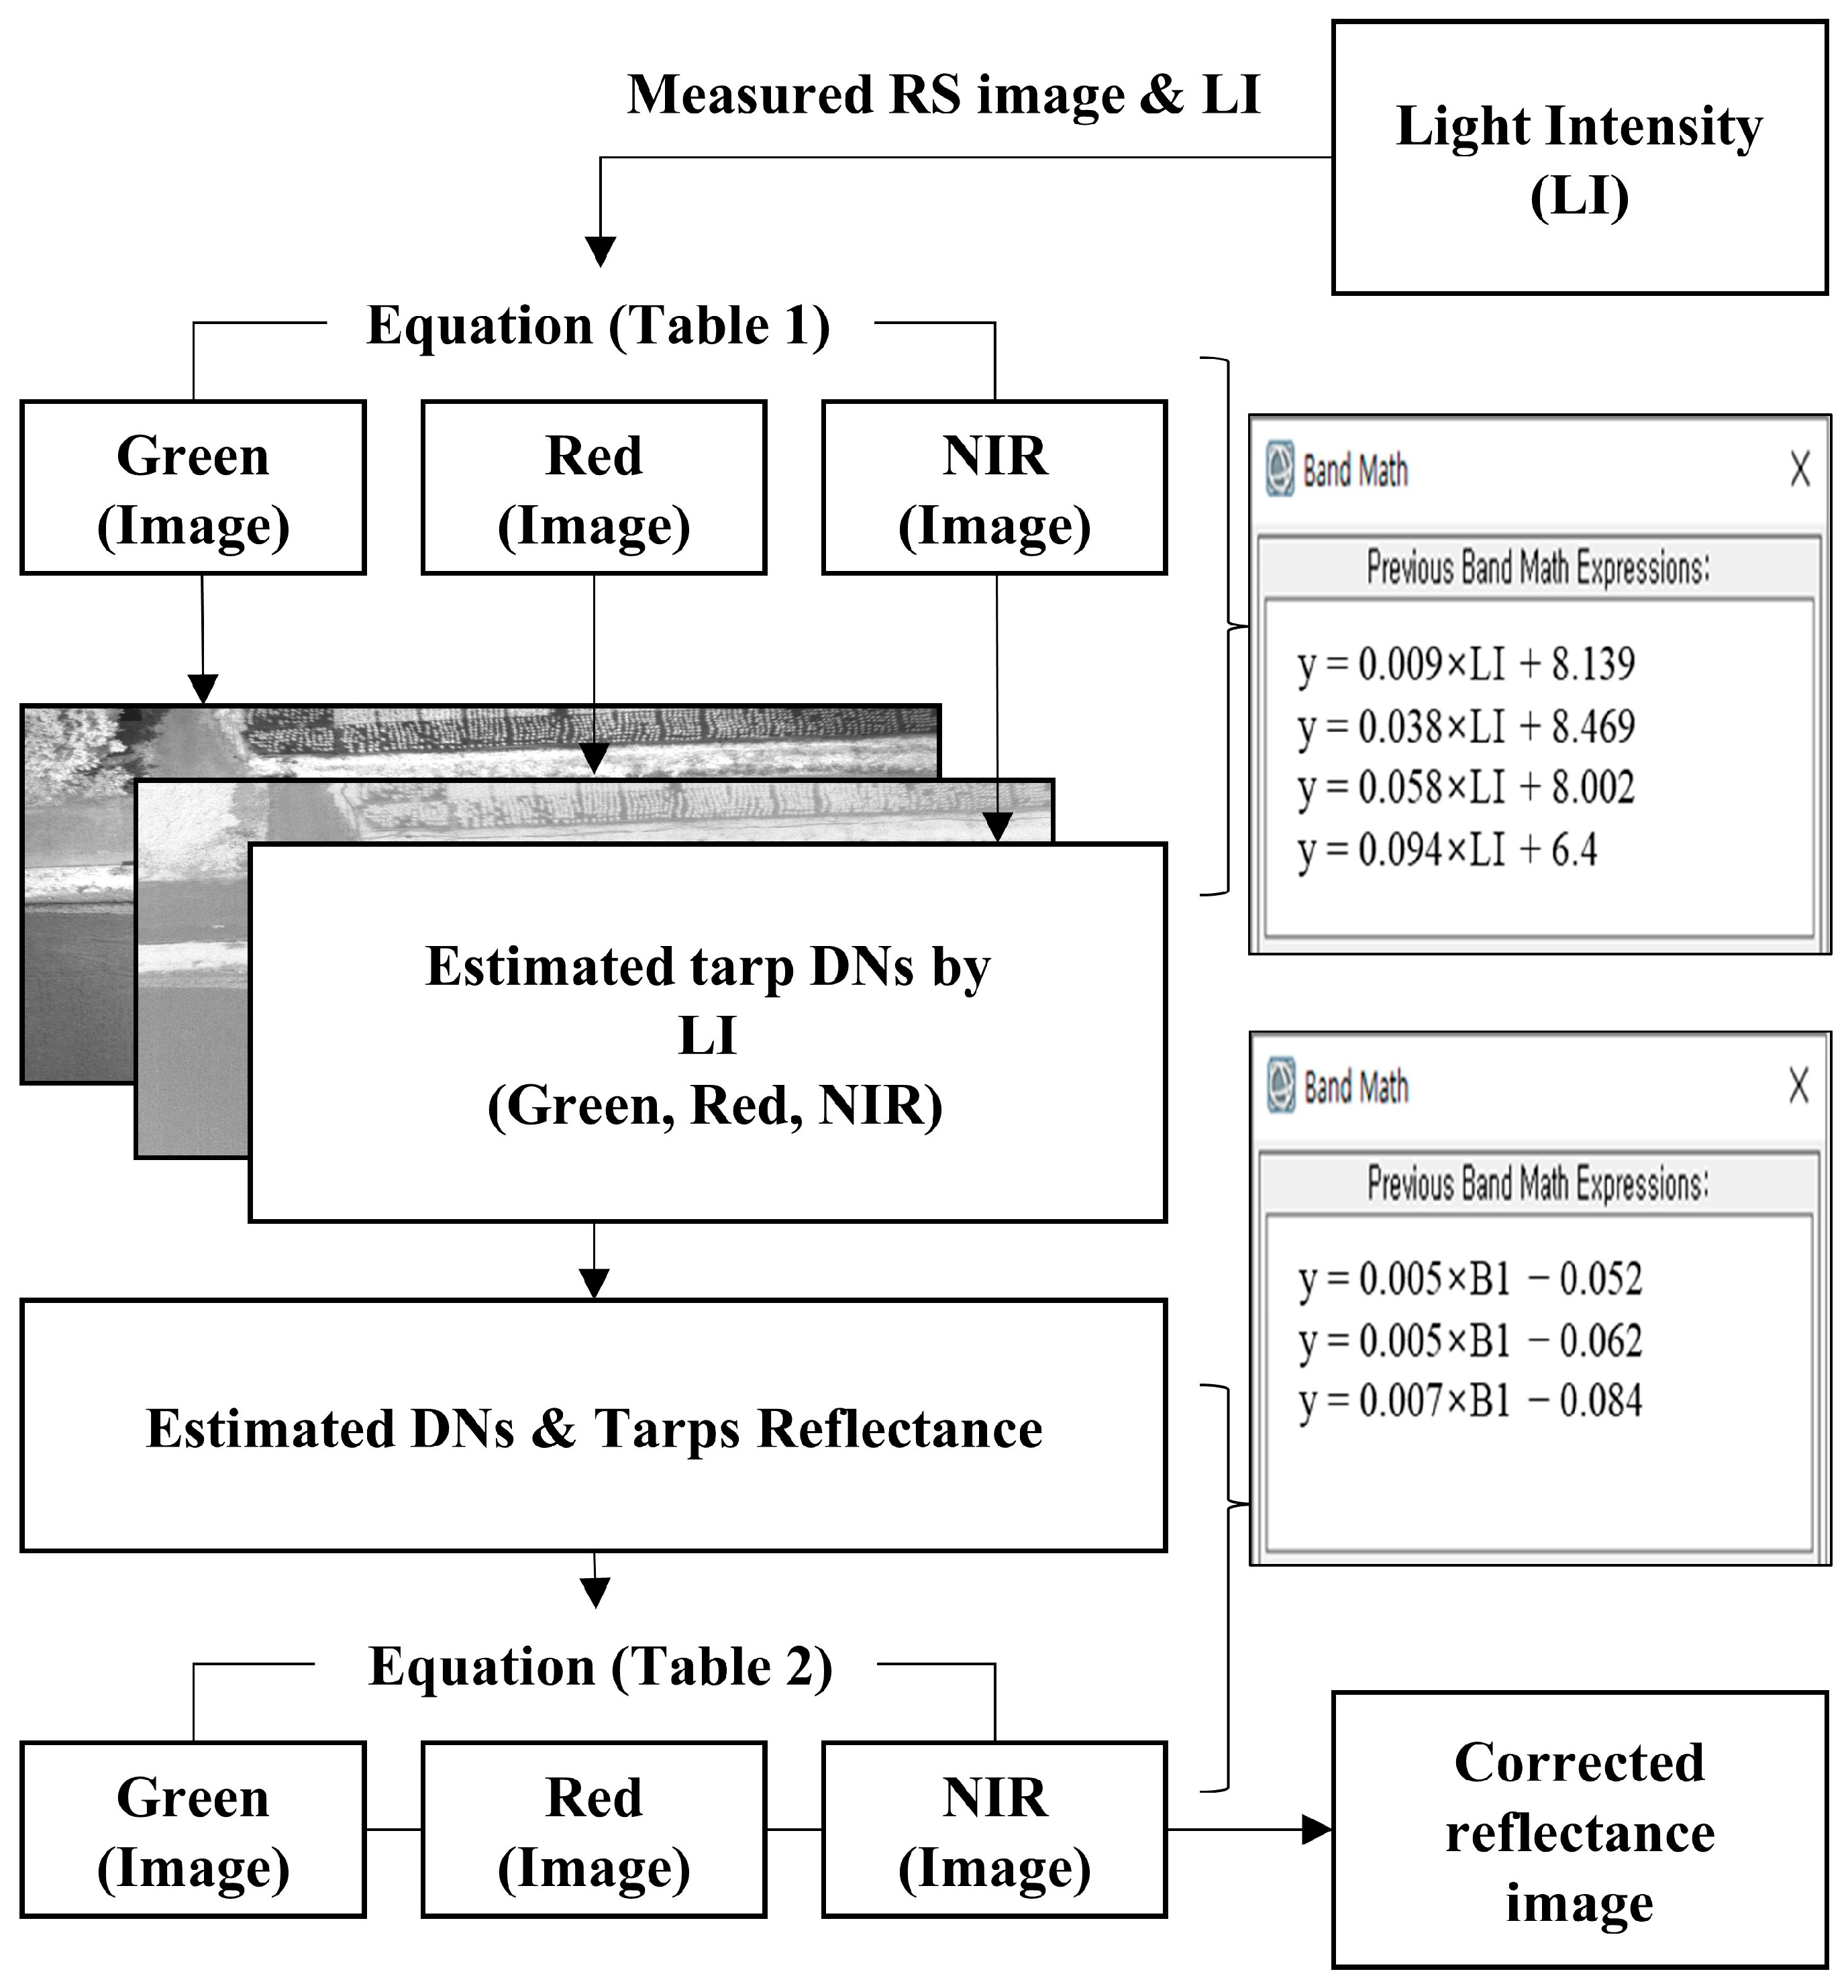
2.5. Radiometric Calibration

In this study, the key objective of the radiometric calibration was to quantify the DN changes of four standard tarps with different light intensities in advance. In turn, this enabled the estimation of the tarp DNs without the tarps by measuring only the light intensities. Since the reflectance of the tarps does not vary, the camera reflectance image can be estimated through the relationship between the estimated tarp DNs (ETDNs) and TRs. In other words, a calibrated reflectance image can be obtained with the light intensities only. For radiometric calibration of the RAV RSS images, the two types of equations were defined.
The first equations were the relationship between the tarp DN and light intensities (see Table 1). The DNs of the four tarps were obtained at various light intensity levels, which were determined with fixed values of the camera sensor exposure and the shutter speed. The same region of interest selected commonly covered more than 250 pixels starting from the center of each tarp. While shooting with the multispectral camera, the light intensities were measured on the ground using the line quantum sensor. We defined equations based on the relationships between the tarp DNs obtained using the multispectral camera and the light intensities measured using the line quantum sensor. Therefore, the equation was obtained by quantifying between DN values of each reference tarp according to the change in light intensity. These linear equations were obtained at various altitudes from 50 m to 100 m above the ground surface and in environments on heavy cloudy, mild cloudy, and sunny days. We assumed that the linear equations obtained in such diverse environments could represent images taken in unspecified environments.
The second equations were the relationship between the estimated DN from the first equation and the reflectance from the multispectral radiometer for the four tarps (see Table 2). Based on the tarp DN and the light intensity, the solar radiation intensity information from the RAV RSS images was used to create correction equations for each multispectral camera band. The reflectance of each multispectral band image was calculated by applying the determined equations. Comparisons were made between the DN of the tarps from the multispectral camera and light intensity from the line quantum sensor to estimate tarp DN. These calibration equations can quantify the DN from any camera through a simple illuminance sensor. The differences between reflectances were compared by applying this correction equation and an actual tarp correction to the crop field environment.

2.6. Data Processing

Figure 3 shows the radiometric calibration processing steps involved in the RAV RS images acquired. These image data were processed using the PixelWrench2 software (Tetracam Inc., Chatsworth, CA, USA) and the ENVI software (Geospatial Solutions, Inc., Broomfield, CO, USA). The raw data were converted to each Tagged Image File Format, or TIF, using the PixelWrench2 software. The ENVI software was used to apply the equations to multispectral image bands in an image using the Band Math tool.

2.7. Experimental Study Sites

Field campaigns were conducted at the paddy rice (Oryza sativa) fields of the National Institute of Crop Science (NICS; 35°50′N, 127°02′E), Wanju, Chonnbuk, as well as in the paddy rice and soybean (Glycine max) fields of Chonnam National University (CNU; 35°10′N, 126°53′E), Gwangju. The campaigns were conducted in the spring of 2021 and 2022 (Figure 4). Experimental fields were determined as open areas with no obstacles around them to minimize the effect of scattering light. Data were acquired from the field at Chonnam National University to quantify the DN for each tarp according to the light intensities required for the development of the correction equation. The developed correction equation was applied and evaluated using 2021 and 2022 data from the CNU and NICS fields.

3. Results

3.1. Definition of the Equations for Radiometric Calibration

The light intensities and the DN of four tarps were highly correlated in three multispectral bands (Figure 5). The Pearson’s correlation coefficient (r) values for the green, red, and NIR bands ranged from 0.988 to 0.999, 0.988 to 0.999, and 0.974 to 0.998, respectively (Table 1). Based on these relationships, linear equations were defined to estimate the tarp DN from light intensities without using actual tarps (Figure 6). With light intensities of 1179 μmol at the NICS sites and 1100 and 1230 μmol at the CNU sites, the estimated DN and reflectance for the four tarps showed high correlations, with r values ranging from 0.995 to 1 (Table 2). Two types of equations were defined from these correlations, the first described the relationship between the light intensities and the TDN, and the second was the ETDN to TR conversion equations.

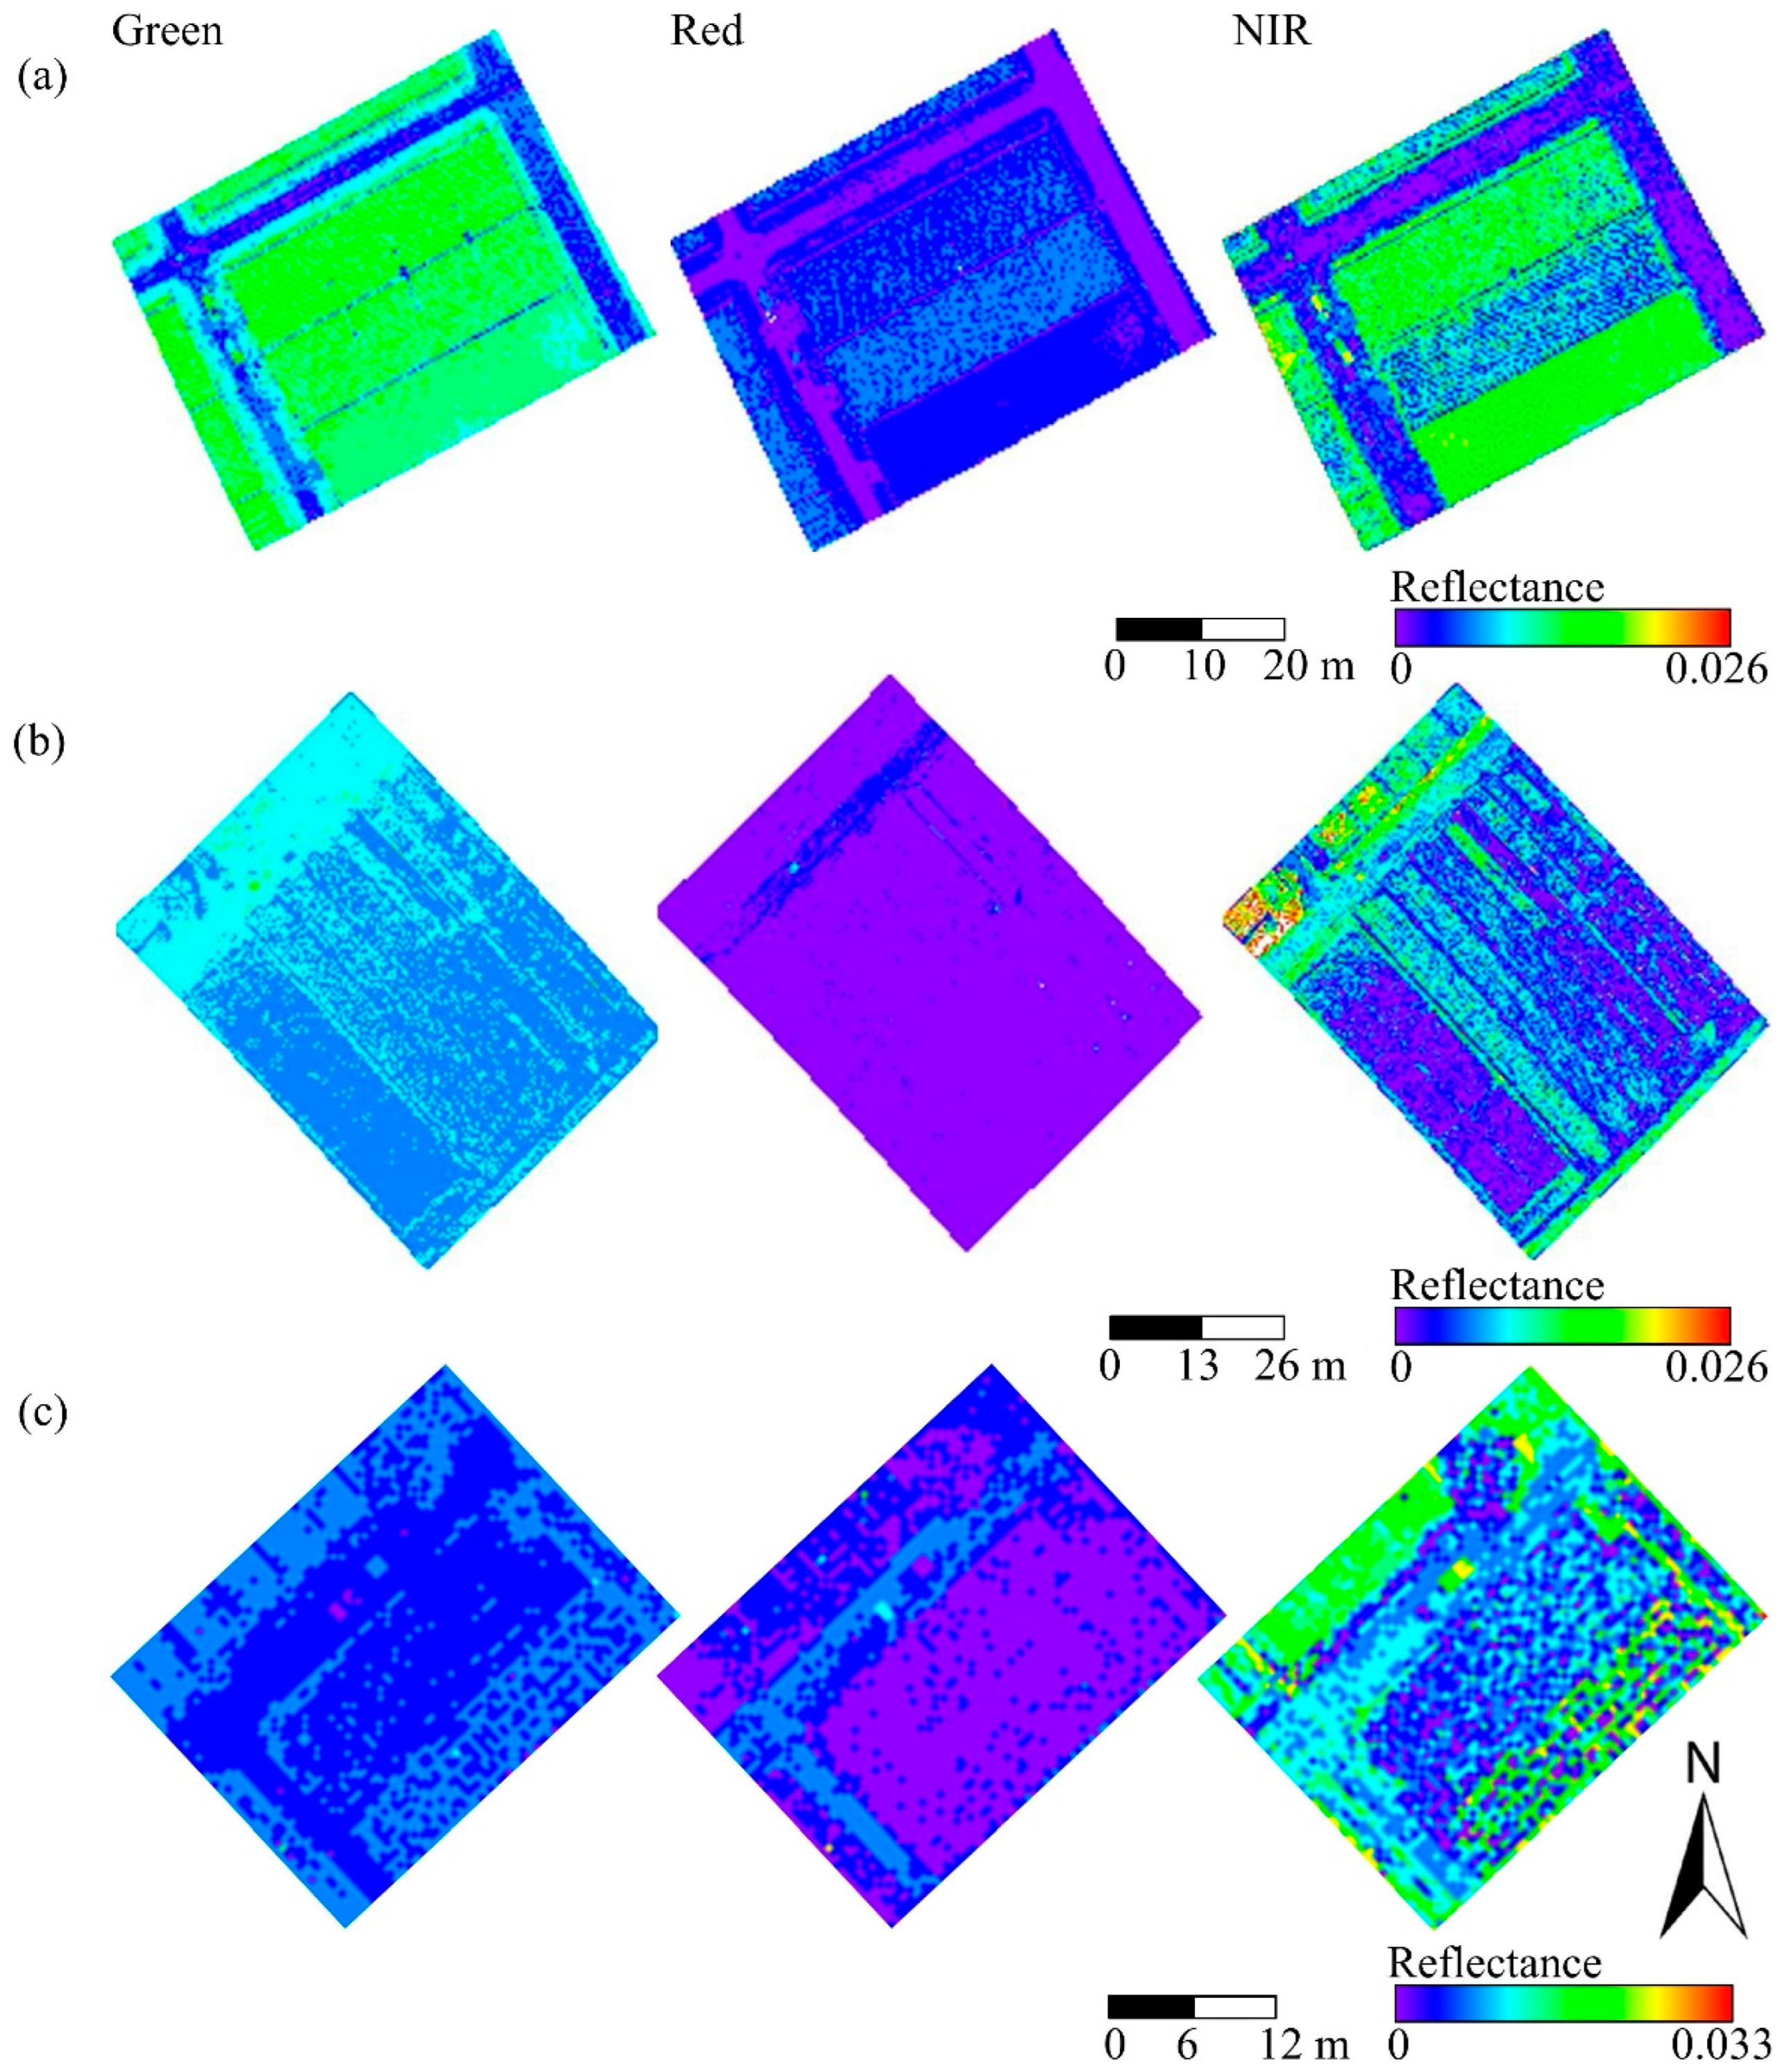
3.2. Assessment of the Calibrated RAS Images

The radiometric calibration through the two types of equations defined above was applied to the RAV RS images. The calibrated RAV RS images closely agreed with the corresponding reference images calibrated using the tarps at the light intensities of 1179, 1100, and 1230 μmol. Figure 7 illustrates the comparisons in the reflectance values. The coefficient of determination (R2) values between the estimated and measured tarp reflectances were 1.000 unanimously, whereas the RMSE values were for the green, red, and NIR bands ranged from 0.003 to 0.013, 0.002 to 0.01, and 0.006 to 0.017, respectively (Table 3).
The reflectance values of the DNs in response to the different incident radiation conditions were estimated and applied to the aerial images. As expected, the estimated and corrected reflectances showed close agreement (Figure 8). The R2 values between the estimated and corrected reflectances for the field images at different light intensities of 1179 μmol at NICS and 1100 μmol and 1230 μmol at CNU were all 1.000 (Table 4). Moreover, the RMSE values were 0.01, 0.01, and 0.04, respectively. We also found that the estimated aerial images for each waveband closely matched the corrected aerial images. This was especially noticeable in the red wavelength range compared to the green and NIR ranges (Figure 9).

4. Discussion

The present study demonstrated that our proposed approach can be used to more conveniently and stably acquire reflectance images using an RAV RSS without having to use reference tarps whenever an RAV RS image is taken. Light intensity variations constitute the most critical challenge in the radiometric calibration of RAV RS images and most RS data measured in the field [17,18,19,20,21]. In this study, we quantified the changes in camera DNs in response to different light intensities. Unless the atmosphere is completely cloudless, the incoming light intensities will vary with time. Particularly, in the study sites evaluated in our experiments, very few days were completely cloud-free during the crop growing season, which was attributed to the summer monsoon season [22,23]. In the previous radiometric calibration using the reference tarps, several tarps had to be measured simultaneously, and the time was recorded when the RAV RS image was taken [18,24,25,26]. Theoretically, the intrinsic reflectance of tarps does not change, but the original tarp colors fade depending on the management condition and time [17]. However, it is inefficient to carry the tarps all the time considering the faded colors. To address these limitations, our approach can respond to changes in light intensities and solve the color fading problem of calibration tarps by estimating the DN of the tarps through equations by analyzing the relationship between the intrinsic DN of the tarps and the light intensities at the study sites in advance.
A line quantum sensor was used in the present study to obtain light intensities, but the camera lacked sensitivity in the NIR range (approximately 800 nm). Nevertheless, reliable results were obtained because the spectral response according to the light intensity was similar for the same target [27]. The NIR spectral range used in this study was 760−900 nm. The LI-191R line quantum sensor measures the solar radiation with the PPFD unit of μmol s−1 m−2 in the wavelength range of 400−700 nm. Since the spectral bands of green (520−600 nm) and red (630−690 nm) are included in the wavelength range of the line quantum sensor, they were closely matched. However, we assume that accuracy was somewhat lower than the other bands in the case of the light intensity of 1230 μmol at CNU since the NIR band was not enclosed within the measurement wavelength range of the LI-191R line quantum sensor. Furthermore, PAR sensors are widely utilized in the agricultural field because they can measure or estimate the fraction of absorbed PAR, photosynthesis, and the leaf area indices of crops [28]. Better results could be obtained if the user adopts sensors that can measure light intensities in all possible wavelengths or more dependable optical sensors with a wide range of wavebands. Additionally, we analyzed the relationships between PAR wavelength and radiation and found high correlations for each waveband. However, using stable reference tarps with a constant reflectance in all wavelength bands is more important than the light sensor itself. Although the reflectance of our tarps tended to decrease slightly as the wavelength increased (see Figure 6), reliable results were obtained. Better results could be obtained if an optical sensor suitable for calibration is employed and multiple reference tarps with different intrinsic reflection values are used with a library.
Although the proposed approach can be used to radiometrically calibrate RAV RS images with high efficiency, there were still some limitations or inconveniences. The RAV RS images used in this study were acquired near noon. Given that the reflected light also changes depending on the solar zenith angle [23,29], a data library must be built at various angles to further increase usability. When acquiring a large area, particularly at a time other than noon, the effect on the solar zenith angle should be considered [30,31]. Furthermore, the shutter speed and exposure of the camera were fixed to obtain a quantitative value according to the light intensities. These settings may result in dark images in low-light environments (e.g., uniform cloud atmosphere) due to the camera noise, which may reduce the sensitivity of the camera for the targets. Moreover, despite being beyond the scope of this study, the dark images could be improved by performing correction processing of the camera noise [32,33,34]. Additionally, when replacing cameras, the libraries must be updated to match the characteristics of the new camera. However, considering the situations described above, building a library in advance may require a considerable amount of time and effort. Our proposed approach could thus be used to acquire surface reflectivity more efficiently and stably than other methods that rely on tarp-based calibration.

5. Conclusions

Our study sought to develop a standalone RAV RS-based calibration system without the need to lay out reference tarps by quantifying the sensor responses of a multispectral camera. The calibrated aerial images were successfully validated and evaluated. The radiometric calibration approaches proposed herein provide a viable approach to multi-spectral camera image correction using already available equipment at a time when the utility of RAVs is increasing. Additionally, our calibration approach can be applied to other currently available multispectral cameras or multispectral sensors. Finally, our results suggest that RAV-based RS image reflectance can be quantitatively estimated using radiometric calibration based on light intensity information.

Author Contributions

Conceptualization, J.K. and T.S.; methodology, S.J. and T.S.; software, T.S.; validation, S.J. and T.S.; formal analysis, T.S.; investigation, J.K., T.S. and S.J.; resources, J.K.; data curation, S.J. and T.S.; writing—original draft preparation, T.S. and J.K.; writing—review and editing, J.K. and S.J.; visualization, T.S.; funding acquisition, J.K. All authors have read and agreed to the published version of the manuscript.

Funding

This work was supported by the Basic Science Research Program via the National Research Foundation of Korea (NRF-2021R1A2C2004459).

Data Availability Statement

Not applicable.

Conflicts of Interest

The authors declare no conflict of interest.

Appendix A

Figure A1. Measured reflectance values of the reference tarps with 3.1%, 21%, 32%, and 51% reflectances for a range of wavelengths using the CropScan multispectral radiometer.
Remotesensing 15 01408 g0a1
Figure A2. Spectral responses of the (a) green (560 nm), (b) red (670 nm), and (c) near-infrared (870 nm) wavelengths of the SpectroSense2+ multispectral radiometer to a range of photosynthetically active radiation (PAR).
Remotesensing 15 01408 g0a2

References

  1. Primicerio, J.; Di Gennaro, S.F.; Fiorillo, E.; Genesio, L.; Lugato, E.; Matese, A.; Vaccari, F.P. A flexible unmanned aerial vehicle for precision agriculture. Precis. Agric. 2012, 13, 517–523. [Google Scholar] [CrossRef]
  2. Jeong, S.; Ko, J.; Choi, J.; Xue, W.; Yeom, J.-M. Application of an unmanned aerial system for monitoring paddy productivity using the GRAMI-rice model. Int. J. Remote Sens. 2018, 39, 2441–2462. [Google Scholar] [CrossRef]
  3. Hunt, E.R.; Hively, W.D.; Fujikawa, S.; Linden, D.; Daughtry, C.S.; McCarty, G. Acquisition of NIR-Green-Blue digital photographs from unmanned aircraft for crop monitoring. Remote Sens. 2010, 2, 290. [Google Scholar] [CrossRef] [Green Version]
  4. Aasen, H.; Honkavaara, E.; Lucieer, A.; Zarco-Tejada, P.J. Quantitative Remote Sensing at Ultra-High Resolution with UAV Spectroscopy: A Review of Sensor Technology, Measurement Procedures, and Data Correction Workflows. Remote Sens. 2018, 10, 1091. [Google Scholar] [CrossRef] [Green Version]
  5. Laliberte, A.S.; Goforth, M.A.; Steele, C.M.; Rango, A. Multispectral Remote Sensing from Unmanned Aircraft: Image Processing Workflows and Applications for Rangeland Environments. Remote Sens. 2011, 3, 2529. [Google Scholar] [CrossRef] [Green Version]
  6. Gago, J.; Douthe, C.; Coopman, R.E.; Gallego, P.P.; Ribas-Carbo, M.; Flexas, J.; Escalona, J.; Medrano, H. UAVs challenge to assess water stress for sustainable agriculture. Agric. Water Manag. 2015, 153, 9–19. [Google Scholar] [CrossRef]
  7. Shin, T.; Ko, J.; Jeong, S.; Shawon, A.R.; Lee, K.D.; Shim, S.I. Simulation of wheat productivity using a model integrated with proximal and remotely controlled aerial sensing information. Front. Plant Sci. 2021, 12, 649660. [Google Scholar] [CrossRef]
  8. Maimaitijiang, M.; Sagan, V.; Sidike, P.; Daloye, A.M.; Erkbol, H.; Fritschi, F.B. Crop Monitoring Using Satellite/UAV Data Fusion and Machine Learning. Remote Sens. 2020, 12, 1357. [Google Scholar] [CrossRef]
  9. Czapla-Myers, J.; McCorkel, J.; Anderson, N.; Thome, K.; Biggar, S.; Helder, D.; Aaron, D.; Leigh, L.; Mishra, N. The Ground-Based Absolute Radiometric Calibration of Landsat 8 OLI. Remote Sens. 2015, 7, 600–626. [Google Scholar] [CrossRef] [Green Version]
  10. von Bueren, S.K.; Burkart, A.; Hueni, A.; Rascher, U.; Tuohy, M.P.; Yule, I.J. Deploying four optical UAV-based sensors over grassland: Challenges and limitations. Biogeosciences 2015, 12, 163–175. [Google Scholar] [CrossRef] [Green Version]
  11. Mamaghani, B.; Salvaggio, C. Multispectral Sensor Calibration and Characterization for sUAS Remote Sensing. Sensors 2019, 19, 4453. [Google Scholar] [CrossRef] [PubMed] [Green Version]
  12. Moran, M.S.; Bryant, R.E.; Clarke, T.R.; Qi, J. Deployment and Calibration of Reference Reflectance Tarps for Use with Airborne Imaging Sensors. Photogramm. Eng. Remote Sens. 2001, 67, 273–286. [Google Scholar]
  13. Cao, S.; Danielson, B.; Clare, S.; Koenig, S.; Campos-Vargas, C.; Sanchez-Azofeifa, A. Radiometric calibration assessments for UAS-borne multispectral cameras: Laboratory and field protocols. ISPRS J. Photogramm. Remote Sens. 2019, 149, 132–145. [Google Scholar] [CrossRef]
  14. Arroyo-Mora, J.P.; Kalacska, M.; Inamdar, D.; Soffer, R.; Lucanus, O.; Gorman, J.; Naprstek, T.; Schaaf, E.S.; Ifimov, G.; Elmer, K.; et al. Implementation of a UAV–Hyperspectral Pushbroom Imager for Ecological Monitoring. Drones 2019, 3, 12. [Google Scholar] [CrossRef] [Green Version]
  15. Li, H.; Zhang, H.; Zhang, B.; Chen, Z.; Yang, M.; Zhang, Y. A method suitable for vicarious calibration of a UAV hyperspectral remote sensor. IEEE J. Sel. Top. Appl. Earth Obs. Remote Sens. 2015, 8, 3209–3223. [Google Scholar] [CrossRef]
  16. Candiago, S.; Remondino, F.; De Giglio, M.; Dubbini, M.; Gattelli, M. Evaluating Multispectral Images and Vegetation Indices for Precision Farming Applications from UAV Images. Remote Sens. 2015, 7, 4026. [Google Scholar] [CrossRef] [Green Version]
  17. Jeong, S.; Ko, J.; Kim, M.; Kim, J. Construction of an unmanned aerial vehicle remote sensing system for crop monitoring. J. Appl. Remote Sens. 2016, 10, 026027. [Google Scholar] [CrossRef]
  18. Guo, Y.; Senthilnath, J.; Wu, W.; Zhang, X.; Zeng, Z.; Huang, H. Radiometric Calibration for Multispectral Camera of Different Imaging Conditions Mounted on a UAV Platform. Sustainability 2019, 11, 978. [Google Scholar] [CrossRef] [Green Version]
  19. Zhou, X.; Liu, C.; Xue, Y.; Akbar, A.; Jia, S.; Zhou, Y.; Zeng, D. Radiometric calibration of a large-array commodity CMOS multispectral camera for UAV-borne remote sensing. Int. J. Appl. Earth Obs. Geoinf. 2022, 112, 102968. [Google Scholar] [CrossRef]
  20. Rosas, J.T.F.; de Carvalho Pinto, F.D.A.; Queiroz, D.M.D.; de Melo Villar, F.M.; Martins, R.N.; Silva, S.D.A. Low-cost system for radiometric calibration of UAV-based multispectral imagery. J. Spat. Sci. 2022, 67, 395–409. [Google Scholar] [CrossRef]
  21. Delavarpour, N.; Koparan, C.; Nowatzki, J.; Bajwa, S.; Sun, X. A Technical Study on UAV Characteristics for Precision Agriculture Applications and Associated Practical Challenges. Remote Sens. 2021, 13, 1204. [Google Scholar] [CrossRef]
  22. Yeom, J.-M.; Jeong, S.; Deo, R.C.; Ko, J. Mapping rice area and yield in northeastern Asia by incorporating a crop model with dense vegetation index profiles from a geostationary satellite. GIScience Remote Sens. 2021, 58, 1–27. [Google Scholar] [CrossRef]
  23. Yeom, J.-M.; Deo, R.C.; Adamowski, J.F.; Park, S.; Lee, C.-S. Spatial mapping of short-term solar radiation prediction incorporating geostationary satellite images coupled with deep convolutional LSTM networks for South Korea. Environ. Res. Lett. 2020, 15, 094025. [Google Scholar] [CrossRef]
  24. Xu, K.; Gong, Y.; Fang, S.; Wang, K.; Zhiheng, L.; Wang, F. Radiometric Calibration of UAV Remote Sensing Image with Spectral Angle Constraint. Remote Sens. 2019, 11, 1291. [Google Scholar] [CrossRef] [Green Version]
  25. Mafanya, M.; Tsele, P.; Botai, J.O.; Manyama, P.; Chirima, G.J.; Monate, T. Radiometric calibration framework for ultra-high-resolution UAV-derived orthomosaics for large-scale mapping of invasive alien plants in semi-arid woodlands: Harrisia pomanensis as a case study. Int. J. Remote Sens. 2018, 39, 5119–5140. [Google Scholar] [CrossRef] [Green Version]
  26. Zhong, Y.; Wang, X.; Xu, Y.; Wang, S.; Jia, T.; Hu, X.; Zhao, J.; Wei, L.; Zhang, L. Mini-UAV-Borne Hyperspectral Remote Sensing: From Observation and Processing to Applications. IEEE Geosci. Remote Sens. Mag. 2018, 6, 46–62. [Google Scholar] [CrossRef]
  27. Ghitas, A.E. Studying the effect of spectral variations intensity of the incident solar radiation on the Si solar cells performance. NRIAG J. Astron. Geophys. 2012, 1, 165–171. [Google Scholar] [CrossRef] [Green Version]
  28. Choi, J.; Ko, J.; Ng, C.T.; Jeong, S.; Tenhunen, J.; Xue, W.; Cho, J. Quantification of CO2 fluxes in paddy rice based on the characterization and simulation of CO2 assimilation approaches. Agric. For. Meteorol. 2018, 249, 348–366. [Google Scholar] [CrossRef]
  29. Tu, Y.-H.; Phinn, S.; Johansen, K.; Robson, A. Assessing Radiometric Correction Approaches for Multi-Spectral UAS Imagery for Horticultural Applications. Remote Sens. 2018, 10, 1684. [Google Scholar] [CrossRef] [Green Version]
  30. Valencia-Ortiz, M.; Sangjan, W.; Selvaraj, M.G.; McGee, R.J.; Sankaran, S. Effect of the Solar Zenith Angles at Different Latitudes on Estimated Crop Vegetation Indices. Drones 2021, 5, 80. [Google Scholar] [CrossRef]
  31. Brede, B.; Suomalainen, J.; Bartholomeus, H.; Herold, M. Influence of solar zenith angle on the enhanced vegetation index of a Guyanese rainforest. Remote Sens. Lett. 2015, 6, 972–981. [Google Scholar] [CrossRef]
  32. Gevaert, C.; Suomalainen, J.; Tang, J.; Kooistra, L. Generation of Spectral–Temporal Response Surfaces by Combining Multispectral Satellite and Hyperspectral UAV Imagery for Precision Agriculture Applications. IEEE J. Sel. Top. Appl. Earth Obs. Remote Sens. 2015, 8, 3140–3146. [Google Scholar] [CrossRef]
  33. Kelcey, J.; Lucieer, A. Sensor Correction of a 6-Band Multispectral Imaging Sensor for UAV Remote Sensing. Remote Sens. 2012, 4, 1462–1493. [Google Scholar] [CrossRef] [Green Version]
  34. Xiang, H.; Tian, L. Development of a low-cost agricultural remote sensing system based on an autonomous unmanned aerial vehicle (UAV). Biosyst. Eng. 2011, 108, 174–190. [Google Scholar] [CrossRef]
Figure 1. Photograph of (a) the 3DR Solo quadcopter drone and (b) spectral ranges of the three multispectral sensors in the agricultural digital camera used in the study.
Remotesensing 15 01408 g001
Figure 2. Photograph of the equipment used for radiometric image calibration. (a) Four reference tarps with reflectances of 0.51, 0.32, 0.21, and 0.03 from left to right; (b) a line quantum sensor (LI-COR, Inc., NE, USA) to measure light intensity; (c) a SpectroSense2+ meter (Skye Instruments, Llandrindod Wells, UK); and (d) a CropScan radiometer (CropScan Inc., Rochester, MN, USA).
Remotesensing 15 01408 g002
Figure 3. Schematic representation of the image processing employed to correct reflectance values of the multispectral images. DNs, NIR, and RS represent digital numbers, near-infrared, and remote sensing, respectively.
Remotesensing 15 01408 g003
Figure 4. Location map and pseudo-colored aerial photographs of (a) paddy rice fields at the National Institute of Crop Science, Wanju, Chonbuk Province and (b) paddy rice and (c) soybean fields at Chonnam National University, Gwangju, Republic of Korea. The pseudo-colored aerial images were projected using green, red, and near-infrared wavebands obtained using a Micro agricultural digital camera (Tetracam Inc., Chatsworth, CA, USA).
Remotesensing 15 01408 g004
Figure 5. Relationships between the DN values of the four different reference tarps with reflectances of 3.1%, 21%, 32%, and 51% and light intensity (LI) at photosynthetically active radiation (400–700 nm). TDN: tarp digital number.
Remotesensing 15 01408 g005
Figure 6. Relationships between reference tarp reflectance values and estimated tarp digital number values (from Figure 4) of the four reference tarps for green (560 nm), red (660 nm), and NIR (830 nm) under different light intensities of (a) 1179 μmol at the National Institute of Crop Science (NICS) and (b) 1100 μmol and (c) 1230 μmol at Chonnam National University (CNU). TR: tarp reflectance; ETDN: estimated tarp digital numbers.
Remotesensing 15 01408 g006
Figure 7. Comparisons of the estimated tarp reflectances (ETR) and measured tarp reflectances (MTR) using the RAV RSS for green (560 nm), red (660 nm), and NIR (830 nm) under different light intensities of (a) 1179 μmol at the National Institute of Crop Science (NICS) and (b) 1100 μmol and (c) 1230 μmol at Chonnam National University (CNU). Four reference tarps with reflectances of 3.1%, 21%, 32%, and 51% were used.
Remotesensing 15 01408 g007
Figure 8. Estimated versus corrected reflectances for the field images obtained using the RAV RSS for green (560 nm), red (660 nm), and NIR (830 nm) under different light intensities of (a) 1179 μmol at the National Institute of Crop Science (NICS) and (b) 1100 μmol and (c) 1230 μmol at Chonnam National University (CNU).
Remotesensing 15 01408 g008
Figure 9. Deviation field map images between estimated and corrected reflectances for green (560 nm), red (660 nm), and NIR (830 nm) under different light intensities of (a) 1179 μmol at the National Institute of Crop Science (NICS) and (b) 1100 μmol and (c) 1230 μmol at Chonnam National University (CNU).
Remotesensing 15 01408 g009
Table 1. Linear regression equations and Pearson’s correlation coefficient (r) of the tarp digital numbers of the green (TDNGreen), red (TDNRed), and NIR (TDNNIR) wavelengths with the reference tarp reflectances of 3.1%, 21%, 32%, and 51% obtained using the multispectral camera.
Reference Tarp Reflectance
3.1%21%32%51%
TDNGreeny = 0.009x + 8.139
r = 0.988 **
y = 0.038x + 8.469
r = 0.999 **
y = 0.058x + 8.002
r = 0.999 **
y = 0.094x + 6.4
r = 0.998 **
TDNRedy = 0.007x + 9.773
r = 0.988 **
y = 0.034x + 10.006
r = 0.998 **
y = 0.054x + 9.671
r = 0.999 **
y = 0.083x + 10.914
r = 0.999 **
TDNNIRy = 0.01x + 9.151
r = 0.974 **
y = 0.027x + 8.075
r = 0.994 **
y = 0.045x+ 6.253
r = 0.996 **
y = 0.075x + 2.501
r = 0.998 **
** represents significance at a 95% probability level.
Table 2. Linear regression equations and Pearson’s correlation coefficient (r) of tarp reflectances at the green (TRGreen), red (TRRed), and NIR (TRNIR) wavelengths with estimated reflectances at different light intensities of 1179 μmol at the National Institute of Crop Science (NICS) and 1100 μmol and 1230 μmol at Chonnam National University (CNU).
ETDN
1179 μmol at NICS1100 μmol at CNU1230 μmol at CNU
TRGreeny = 0.005x − 0.052
r = 1.000 **
y = 0.005x − 0.055
r = 1.000 **
y = 0.005x − 0.05
r = 1.000 **
TRRedy = 0.005x − 0.062
r = 1.000 **
y = 0.006x − 0.065
r = 1.000 **
y = 0.005x − 0.06
r = 1.000 **
TRNIRy = 0.007x − 0.084
r = 0.995 **
y = 0.007x − 0.09
r = 0.995 **
y = 0.006x − 0.081
r = 0.995 **
** represents significance at a 95% probability level.
Table 3. Coefficient of determination (R2) and root mean square error (RMSE) between the estimated tarp reflectances at the green (ETRGreen), red (ETRRed), and NIR (ETRNIR) and measured tarp reflectances (MTR) at different light intensities of 1179 μmol at the National Institute of Crop Science (NICS) and 1100 μmol and 1230 μmol at Chonnam National University (CNU).
MTR
1179 μmol at NICS1100 μmol at CNU1230 μmol at CNU
ETRGreenR2 = 1.000 **
RMSE = 0.009
Bias = −0.006
R2 = 1.000 **
RMSE = 0.004
Bias = −0.004
R2 = 1.000 **
RMSE = 0.006
Bias = −0.004
ETRRedR2 = 1.000 **
RMSE = 0.003
Bias = −0.001
R2 = 1.000 **
RMSE = 0.002
Bias = 0.002
R2 = 1.000 **
RMSE = 0.007
Bias = −0.006
ETRNIRR2 = 1.000 **
RMSE = 0.013
Bias = −0.01
R2 = 1.000 **
RMSE = 0.01
Bias = 0.006
R2 = 1.000 **
RMSE = 0.017
Bias = −0.016
** represents significance at a 95% probability level.
Table 4. Coefficient of determination (R2) and root mean square error (RMSE) between the estimated reflectances at the green (ERGreen), red (ERRed), and NIR (ERNIR) and corrected reflectances (CR) for the field images obtained using the RAV RSS at different light intensities of 1179 μmol at the National Institute of Crop Science (NICS) and 1100 μmol and 1230 μmol at Chonnam National University (CNU).
CR
1179 μmol at NICS1100 μmol at CNU1230 μmol at CNU
ERGreenR2 = 1.000 **
RMSE = 0.011
Bias = −0.01
R2 = 1.000 **
RMSE = 0.008
Bias = −0.008
R2 = 1.000 **
RMSE = 0.006
Bias = −0.006
ERRedR2 = 1.000 **
RMSE = 0.004
Bias = −0.003
R2 = 1.000 **
RMSE = 0.001
Bias = −0.001
R2 = 1.000 **
RMSE = 0.004
Bias = −0.003
ERNIRR2 = 1.000 **
RMSE = 0.011
Bias = −0.009
R2 = 1.000 **
RMSE = 0.008
Bias = 0.006
R2 = 1.000 **
RMSE = 0.012
Bias = −0.007
** represents significance at a 95% probability level.
Disclaimer/Publisher’s Note: The statements, opinions and data contained in all publications are solely those of the individual author(s) and contributor(s) and not of MDPI and/or the editor(s). MDPI and/or the editor(s) disclaim responsibility for any injury to people or property resulting from any ideas, methods, instructions or products referred to in the content.

