Technical Note

Unmanned Aerial Vehicle (UAV) for Detection and Prediction of Damage Caused by Potato Cyst Nematode G. pallida on Selected Potato Cultivars

1
Agrosystems Research, Wageningen University & Research, 6708 PB Wageningen, The Netherlands
2
Hokkaido Agricultural Research Center, National Agriculture and Food Research Organization, NARO, Niigata 941-0193, Japan
3
Field Crop, Wageningen University & Research, P 430, 8200 AK Lelystad, The Netherlands
4
HLBBV, Kampsweg 27, Wijster, 9418 PD Midden-Drenthe, The Netherlands
*
Author to whom correspondence should be addressed.
Remote Sens. 2023, 15(5), 1429; https://doi.org/10.3390/rs15051429
Submission received: 15 December 2022 / Revised: 24 February 2023 / Accepted: 1 March 2023 / Published: 3 March 2023
(This article belongs to the Special Issue Remote Sensing of Agro-Ecosystems)

Abstract

:
High population densities of the potato cyst nematodes (PCN) Globodera pallida and G. rostochiensis cause substantial yield losses to potato production (Solanum tuberosum) due to the delay caused to tuber formation by the retardation of plant growth. It requires meticulous estimation of the population densities by using soil sampling and applying the right combination of nematode management to deal with the PCN problem. This study aims to assess the use of an unmanned vehicle (UAV) in detecting and estimating the effect of ranges of densities of a PCN, G. pallida, on four cultivated potato cultivars with resistance to PCN in a naturally infested potato field in The Netherlands. First, the initial population density (Pi) of G. pallida was estimated by using an intensive sampling method of collecting about 1.5 kg of soil per m2 from the center of each 3 × 5 m plot. At harvest, the fresh tuber yield of the potato cultivars (Avarna, Fontane, Sarion, and Serresta) were assessed. The Seinhorst yield loss model was used to investigate the relationship between Pi and fresh tuber yield. Secondly, the spatial data of UAV with optical and thermal sensors were analyzed to find any relationship between Pi and UAV indices. By using the classical yield loss model, all four cultivars were found to be affected by Pi with a relative minimum fresh tuber yield m, which ranged from 0.26 to 0.40. The maximum fresh tuber yield varied from 49.48 to 80.36 tons (ha)−1. The density at which the fresh tuber yield started to deteriorate was in the range of 0.62–2.16 eggs (g dry soil)−1. A regression was observed between Pi, and all UAV indices in a similar pattern to that of the fresh tuber yield by using the Seinhorst yield loss model, except for the cultivar Avarna for the two UAV indices (NDRE and NDVI). Unlike the tolerance limit, the relative minimum values of the UAV indices—except the chlorophyll index—differ when compared among each other and when compared with that of the fresh tuber yield within the same cultivar. This indicates that all indices can be useful for detection and decision making for statutory purposes but not for estimating damage (except the chlorophyll index).

1. Introduction

Potato cyst and root-knot nematodes cause yield and quality damage to cultivated potatoes (Solanum tuberosum) by impairing plant growth and deforming tubers, respectively [1,2]. Potato cyst nematodes cause yield losses mainly via growth retardation of the potato plant at low to medium population densities, which is traditionally called the first mechanism of growth reduction [3,4], which is characterized by a delay of flowering and tuber setting without any further symptoms at Pi < 64 eggs (g dry soil)−1. The second mechanism is characterized by the disturbance of mineral content and water uptake of the plant that is caused by mechanical damage to the root system by large numbers of invading nematodes. This is occasionally accompanied by early flowering and tubers setting, which can be observed at Pi > 64 eggs (g dry soil)−1. At very high densities, that is, Pi > 128 eggs (g dry soil)−1, on very rare occasions, early senescence of plants is observed. Root-knot nematodes do not cause any yield reductions at densities encountered in the field in spring but can infect and deform the potato tubers produced, causing quality damage. For decades, the two species of potato cyst nematodes (PCN: Globodera pallida and Globodera rostochiensis) have been quarantine pests of potatoes worldwide, both in temperate and tropical countries [5,6,7]. It is reported that these nematodes originally came from the Andean region in South America after co-evolving with potatoes, and they were later introduced to Europe in the 19th century [8,9]. Recently, PCN has also been reported in the potato-growing areas of the highlands of Africa [10] and Asia [7]. Yield reduction in heavily infested fields can range from 40% to 80% with an average of 60% [11].
Detecting the presence or absence of PCN is an obligatory but costly and time-consuming task in seed potato production, as this nematode is a regulated quarantine pest. This involves intensive monitoring, sampling, transport, storage, and processing of soil samples in well-equipped laboratories [12]. According to Hillnhütter et al. [13], soil processing costs for checking the presence of sugar beet nematode in Germany and for soybean cyst nematode in the U.S.A is EUR 61 and USD 60, respectively. In The Netherlands, both statutory and voluntary soil sampling are performed for PCN, including, if required, species determination. The latter costs approximately EUR 100.
In The Netherlands, which is the biggest exporter of seed potatoes worldwide, aerial government flights were used in the spring season to visually identify infestation foci before the closing of the canopy as an extra routine survey by the Dutch plant protection service (NVWA) for statutory soil sampling. Data show that over 90% of statutory soil samples come from uninfected areas in The Netherlands. As visible detection of PCN densities below 10 eggs (g dry soil)−1 already presents a challenge, only very large infestations are detected; however, an infestation may have already been present for over 20 years. Knowing whether a field is infested or not, and when yes, with what species, allows farmers to utilize customized management scenarios (resistance, nematicides, fallow, non-host, etc.) in planned rotation to control PCN. Furthermore, it is important to detect PCN infestations as early as possible to prevent spread within the field (secondary infestations) and between fields as a result of soil adhering to machinery.
Therefore, the development of early detection methods based on spectral imaging by using unmanned vehicles (UAVs) could be a valuable addition to current physical sampling methods for detecting and locating the presence of PCN in a farmer’s field or even estimating its population density, if feasible. Table 1 below provides several examples of using UAVs to detect and estimate the damage caused by potato diseases in general.
Based on this context, there exists an urgent need to explore a site-specific approach for the detection and management of PCN [17]. While a better understanding of the nematode taxonomy in the rhizosphere is important [18], utilization of state-of-the-art technology, such as sensors, poses an attractive tool also to detect and predict nematode infestation and the yield loss caused. Thus far, little information is known about aerial sensor applications for detecting PCN, while studies of other crops, including sugar beet and coffee infested with root-knot nematodes, have been conducted [19,20]. According to Joalland et al. [19], several variables measured by UAV are suitable for monitoring the tolerance of sugar beet to beet cyst nematode as expressed by canopy height, spectrally inferred chlorophyll content, biomass, and canopy temperature. Moreover, they mentioned that multivariate analysis was a strong tool to identify the genetic backgrounds of the sugar beet cultivars and their ability to tolerate nematode infections by using a diversity of spectral indices.
Integrated approaches with existing methods of nematode detection and sensing technologies are often proposed for robust diagnosis and implementation of site-specific nematode management [21,22]. However, little scientific work has been conducted regarding PCN in potato or other nematode–crop interactions.
The aim of this study is, therefore, to explore and, if possible, to develop an easy, rapid, and robust method for detecting the presence of PCN that satisfies statutory requirements and, if possible, uses spatial coverage to determine the extent of the infestation and connect it to a yield loss model for farmers. To this end, we investigate the use of UAV to identify the presence of and damage caused by PCN population density in potato crops. We compare the damage observed by using UAVs with classical and well-established models of yield loss in applied quantitative nematology. A flow chart detailing the techniques we employed to achieve some of our objectives is provided below.

2. Materials and Methods

2.1. Study Site

In 2019, an experiment was conducted to try to measure the tolerance of four potato cultivars to PCN, Globodera pallida (G. pallida). The infected field was located in Westerbork, (52050′16.74. N 6037′50.36 S, Kampsweg 27, 9418PD Wijster) close to Witteveen, Drenthe, The Netherlands. The size of the field was 33 m in width and 100 m in length. For every 30 m row, a 10 m buffer zone was created to avoid contamination from the next plot (Seen in the Supplemental Material of Figure S1). The field was then further divided by using a plot with a 3 × 5 m grid to obtain 23–25 plots for each cultivar in an attempt to obtain a complete range of population densities. The sandy soil consisted of 2% clay, 13% silt, and 80% sand. The main soil chemical properties were pH: 5.0; total organic carbon: 2.7%; total N: 4900 kg/ha; available K: 267 kg/ha; CaCO3: <0.2%. Annual precipitation and annual mean temperature for the region are 829 mm/year and 13 °C, respectively. More detailed climate information can be seen in the Supplemental Material of Table S1 including daily temperature (mean, maximum, and minimum) and relative air humidity (mean, maximum, and minimum). Within each plot (3 × 5 m), there were four rows of potato cultivated, and the samples for estimating the Pi were taken from the central square meter of each plot.

2.2. Sampling and Estimating Initial Population Densities (Pi)

Before the start of the tolerance experiment in 2019, pre-sampling was carried out twice in 2017 and in 2018 to monitor the population densities of G. pallida. This was conducted mainly to assess the presence and map the location of the range of population densities needed to estimate the yield loss parameters by using the Seinhorst model [2,23]. At the start of the experiment in April 2019, a third sampling was carried out to determine the initial population densities Pi before planting. Samples were taken from an area of 1m2 (0.75 × 1.33 m) at the center of each plot, as seen in the Supplemental Material of Figure S2. Subsequently, 23–25 Pi’s were mapped per cultivar. A bulk sample per plot consisted of 60 cores, which were approximately 25 g each, down to a depth of 21 cm. The bulk soil sample was thoroughly and homogeneously mixed. The soil was dried; then, the cysts were extracted. For determining the content, cysts were soaked for 12 h in water, then crushed, and the number of eggs was estimated by using a stereo microscope.

2.3. Potato Cultivars

Four potato cultivars—Sarion, Seresta, Avarna, and Fontana, each of which had different sources of resistance to PCN—were tested for their tolerance to G. pallida.

2.4. Field Management (Planting to Harvest)

The potato cultivars were planted on 8 May 2019, with about eight plants per m2. The space between the ridges of each plot was 75 cm. The spacing within the ridges was 30 cm. A fertilizer application of 110 kg/ha of Patentkali: (30% Potassium and 10% Magnesium) was applied on February 26. Later, 25 cubic meters/ha of pig slurry and 130 kg/ha of calcium ammonium nitrate (27%N) were applied on the 1st of April and the 17th of June, respectively. Haulm killing was carried out on 3 October 2019, and tubers were harvested on 23 October 2019. Tubers were cleaned, and their fresh weight in tons (ha)−1 was recorded at the end of October 2019. More information about the methodology has been described in a previous study [2].

2.5. Data Analysis and Modelling

In this study, two datasets originating from the field measurement and the UAV flight (one flight) were used. The chart flow of the data collection is presented in Figure 1.

2.5.1. The First Dataset

In the first dataset, the Pi and the potato fresh tuber yield have been included. The fresh tuber weight, which is expressed as “potato yield”, was recorded from each plot. The relationship between Pi and fresh tuber yield was described by using the Seinhorst model for assessing yield loss (Equation (1)). The three important parameters—the tolerance limit (T), which is the nematode density beyond which the yield starts to decline and which is measured in eggs (g dry soil)−1; the relative minimum fresh tuber yield (m), which is the ratio of the fresh tuber yield at a very high density to that of the control (Pi = 0); and the maximum fresh tuber yield (Ymax) yield at Pi = 0 eggs (g dry soil)−1 in tons (ha)−1—were estimated by using the least square methods in non-linear regression analysis. The standard errors of the parameters were estimated from the Hessian matrix, and the goodness of fit of the model was described by the coefficient of determination adjusted for degrees of freedom. The starting parameter values for the non-linear regression analysis were obtained from the data.
y = Y m a x × ( m   +   ( 1 m   )   0.95 P i / T 1 )   when   P i   >   T
y = 1   when   P i T
where:
  • y = fresh tuber yield in tons (ha)−1;
  • Ymax = yield at Pi = 0 in tons (ha)−1;
  • m = relative minimum yield when Pi → ∞;
  • T = tolerance limit, the densityin number of eggs (g dry soil)−1 above which yield starts to decline.

2.5.2. UAV Data Collection

The second dataset was collected on 18 July 2019 via a multispectral sensor mounted on the UAV of the Aurea Imaging Company, which is located at Nijverheidsweg 16b, 3534AM, Utrecht, The Netherlands. The flight altitude was approximately 75.6 m. The camera was a “multiSPEC 4C”, which provides data based on four different bands: near-infrared red (NIR), red edge, red, and green. The bands were as follows: Blue (475 nm center, 32 nm bandwidth), Green (560 nm center, 27 nm bandwidth), Red (668 nm center, 14 nm bandwidth), and near-infrared (842 nm center, 57 nm bandwidth). By using these bands, normalized difference vegetation (NDVI), weighted difference vegetation (WDVI), normalized difference red edge (NDRE), and red-edge chlorophyll index (chlorophyll) were measured with the following equations [24,25,26].
NDVI :   ( NIR     Red ) / ( NIR   +   Red )
WDVI :   NIR 1.8 × RED
NDRE :   ( NIR     RE ) / ( NIR   +   RE )
Chlorophyll : ( NIR / Red ) 1
Additionally, thermal measurement was recorded by using a thermal sensor with Altum’s thermal band of long wavelength infrared (LWIR) loaded on the UAV. The central wavelength and bandwidth of the thermal band are 11 μm (micrometer) and 6 μm, respectively. More details can be found at the following link: https://support.micasense.com/hc/en-us/categories/360000931673-Altum, accessed on 28 February 2023. Based on the G.P.S. points of the field, we matched the two datasets between field data per plot and the UAV data, which is in the sub-plot of 3.6 m2 (=1.5 m × 2.4 m). This procedure was performed via QGIS (version 3.10.1). The statistical test was conducted by using the R packages “agrocolae,” “car,” “devtools”, and “multicomp”.
The relationship between Pi and canopy temperature was established by using a logistic model Equation (6), as previously described by Teklu et al. [2,23]. The same procedure of the least squares method in non-regression analysis was used to estimate the parameter values, their standard errors, and the goodness of the fit as in that of Equation (1).
C c p t = M c p t P i / ( P i + M c p t / a c p t )
where
  • Ccpt = Canopy temperature (°C);
  • acpt = Maximum rate of canopy temperature increase;
  • Mcpt = Maximum canopy temperature reached (°C);
  • P i = Initial population density in number of eggs (g dry soil)−1.

3. Results and Discussion

3.1. The Relationship between Pre-Plant Nematodes Densities (Pi) and Yield

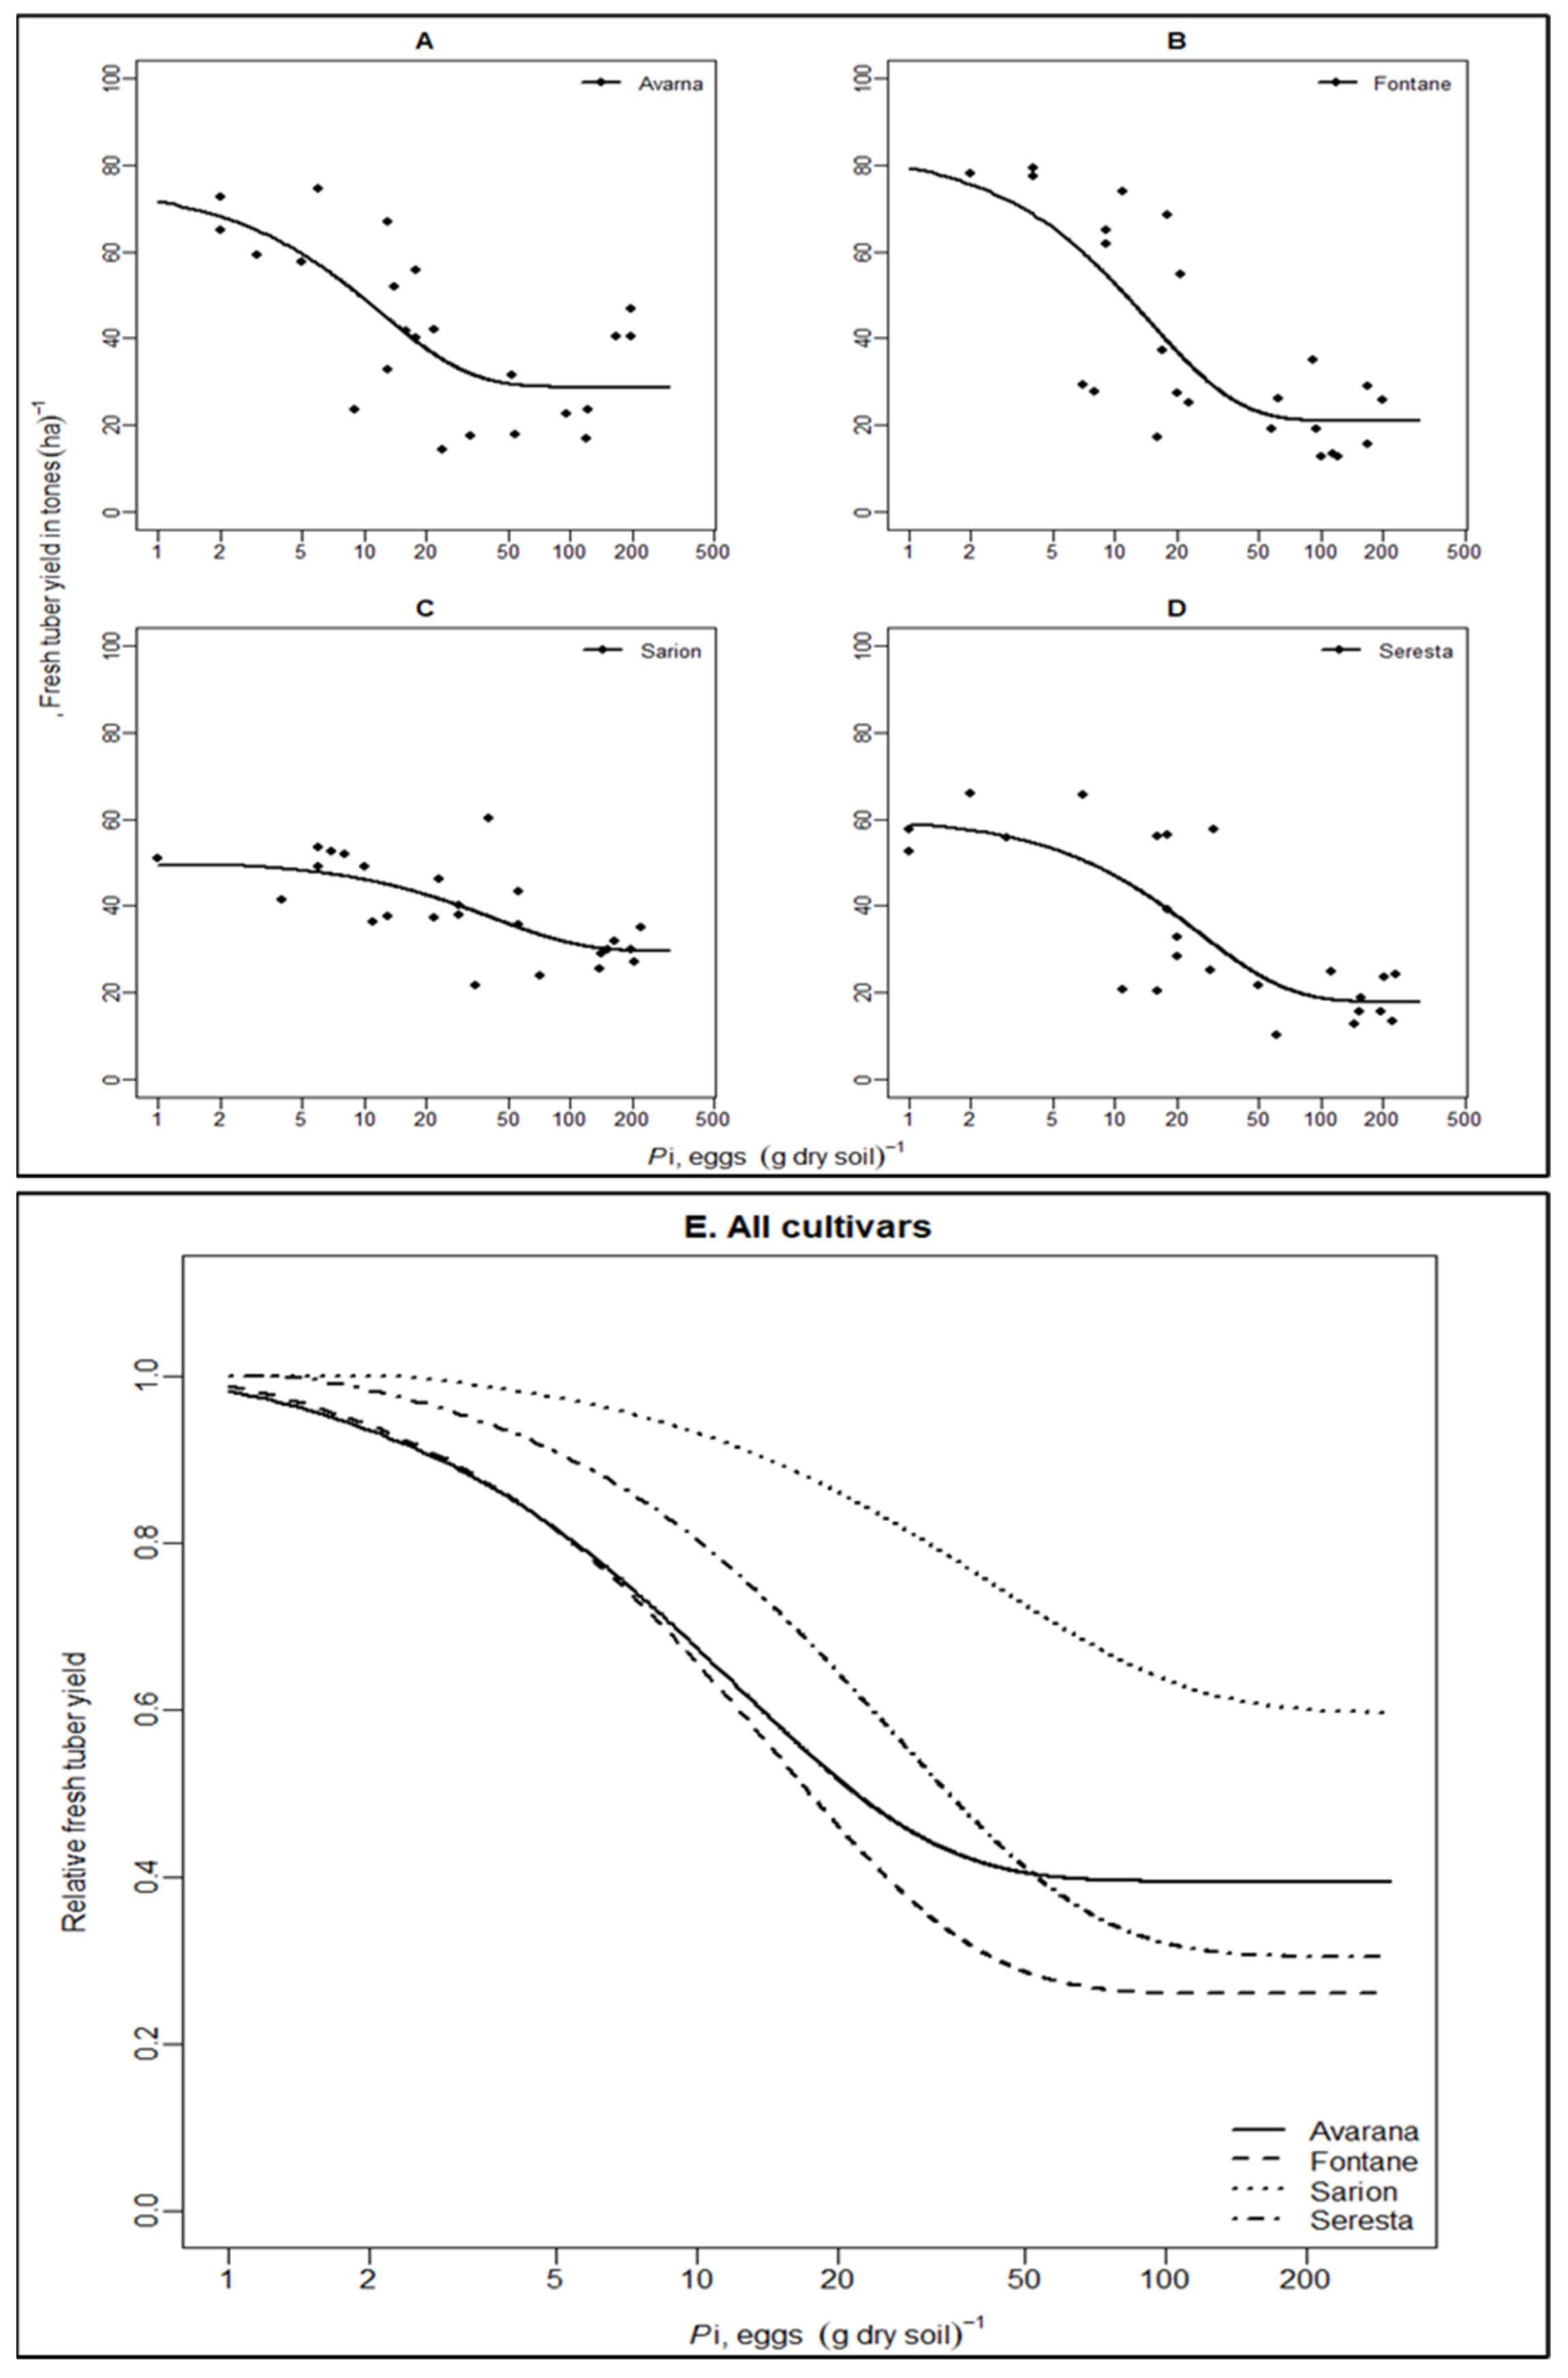
The relationship between Pi and fresh tuber yield can be seen in Figure 2. While Figure 2A–D represent the absolute value of the potato yield of each cultivar, Figure 2E shows the relative value across the four varieties. The result of the parameter values of the Seinhorst yield model can be seen in Table 2. In all four cultivars, the yield was significantly (p < 0.0001) affected by increasing Pi. Estimated yield loss ranged from 40 to 74%. Three cultivars—Avarna, Fontana, and Seresta—had similar tendencies and were not significantly different compared to each other based on m values (Figure 2E), except cv. Sarion, which had the lowest relative minimum yield (m = 0.60) of the four varieties (Table 2). The tolerance limit T of all tested cultivars ranged from 0.62 to 2.16 eggs (g dry soil)−1, and no significant difference could be discerned between the cultivars (Table 2). Although cv. Sarion had a lower maximum yield, Ymax, (Table 2), it was not statically significant compared to the other cultivars.

3.2. Correlation Matrix

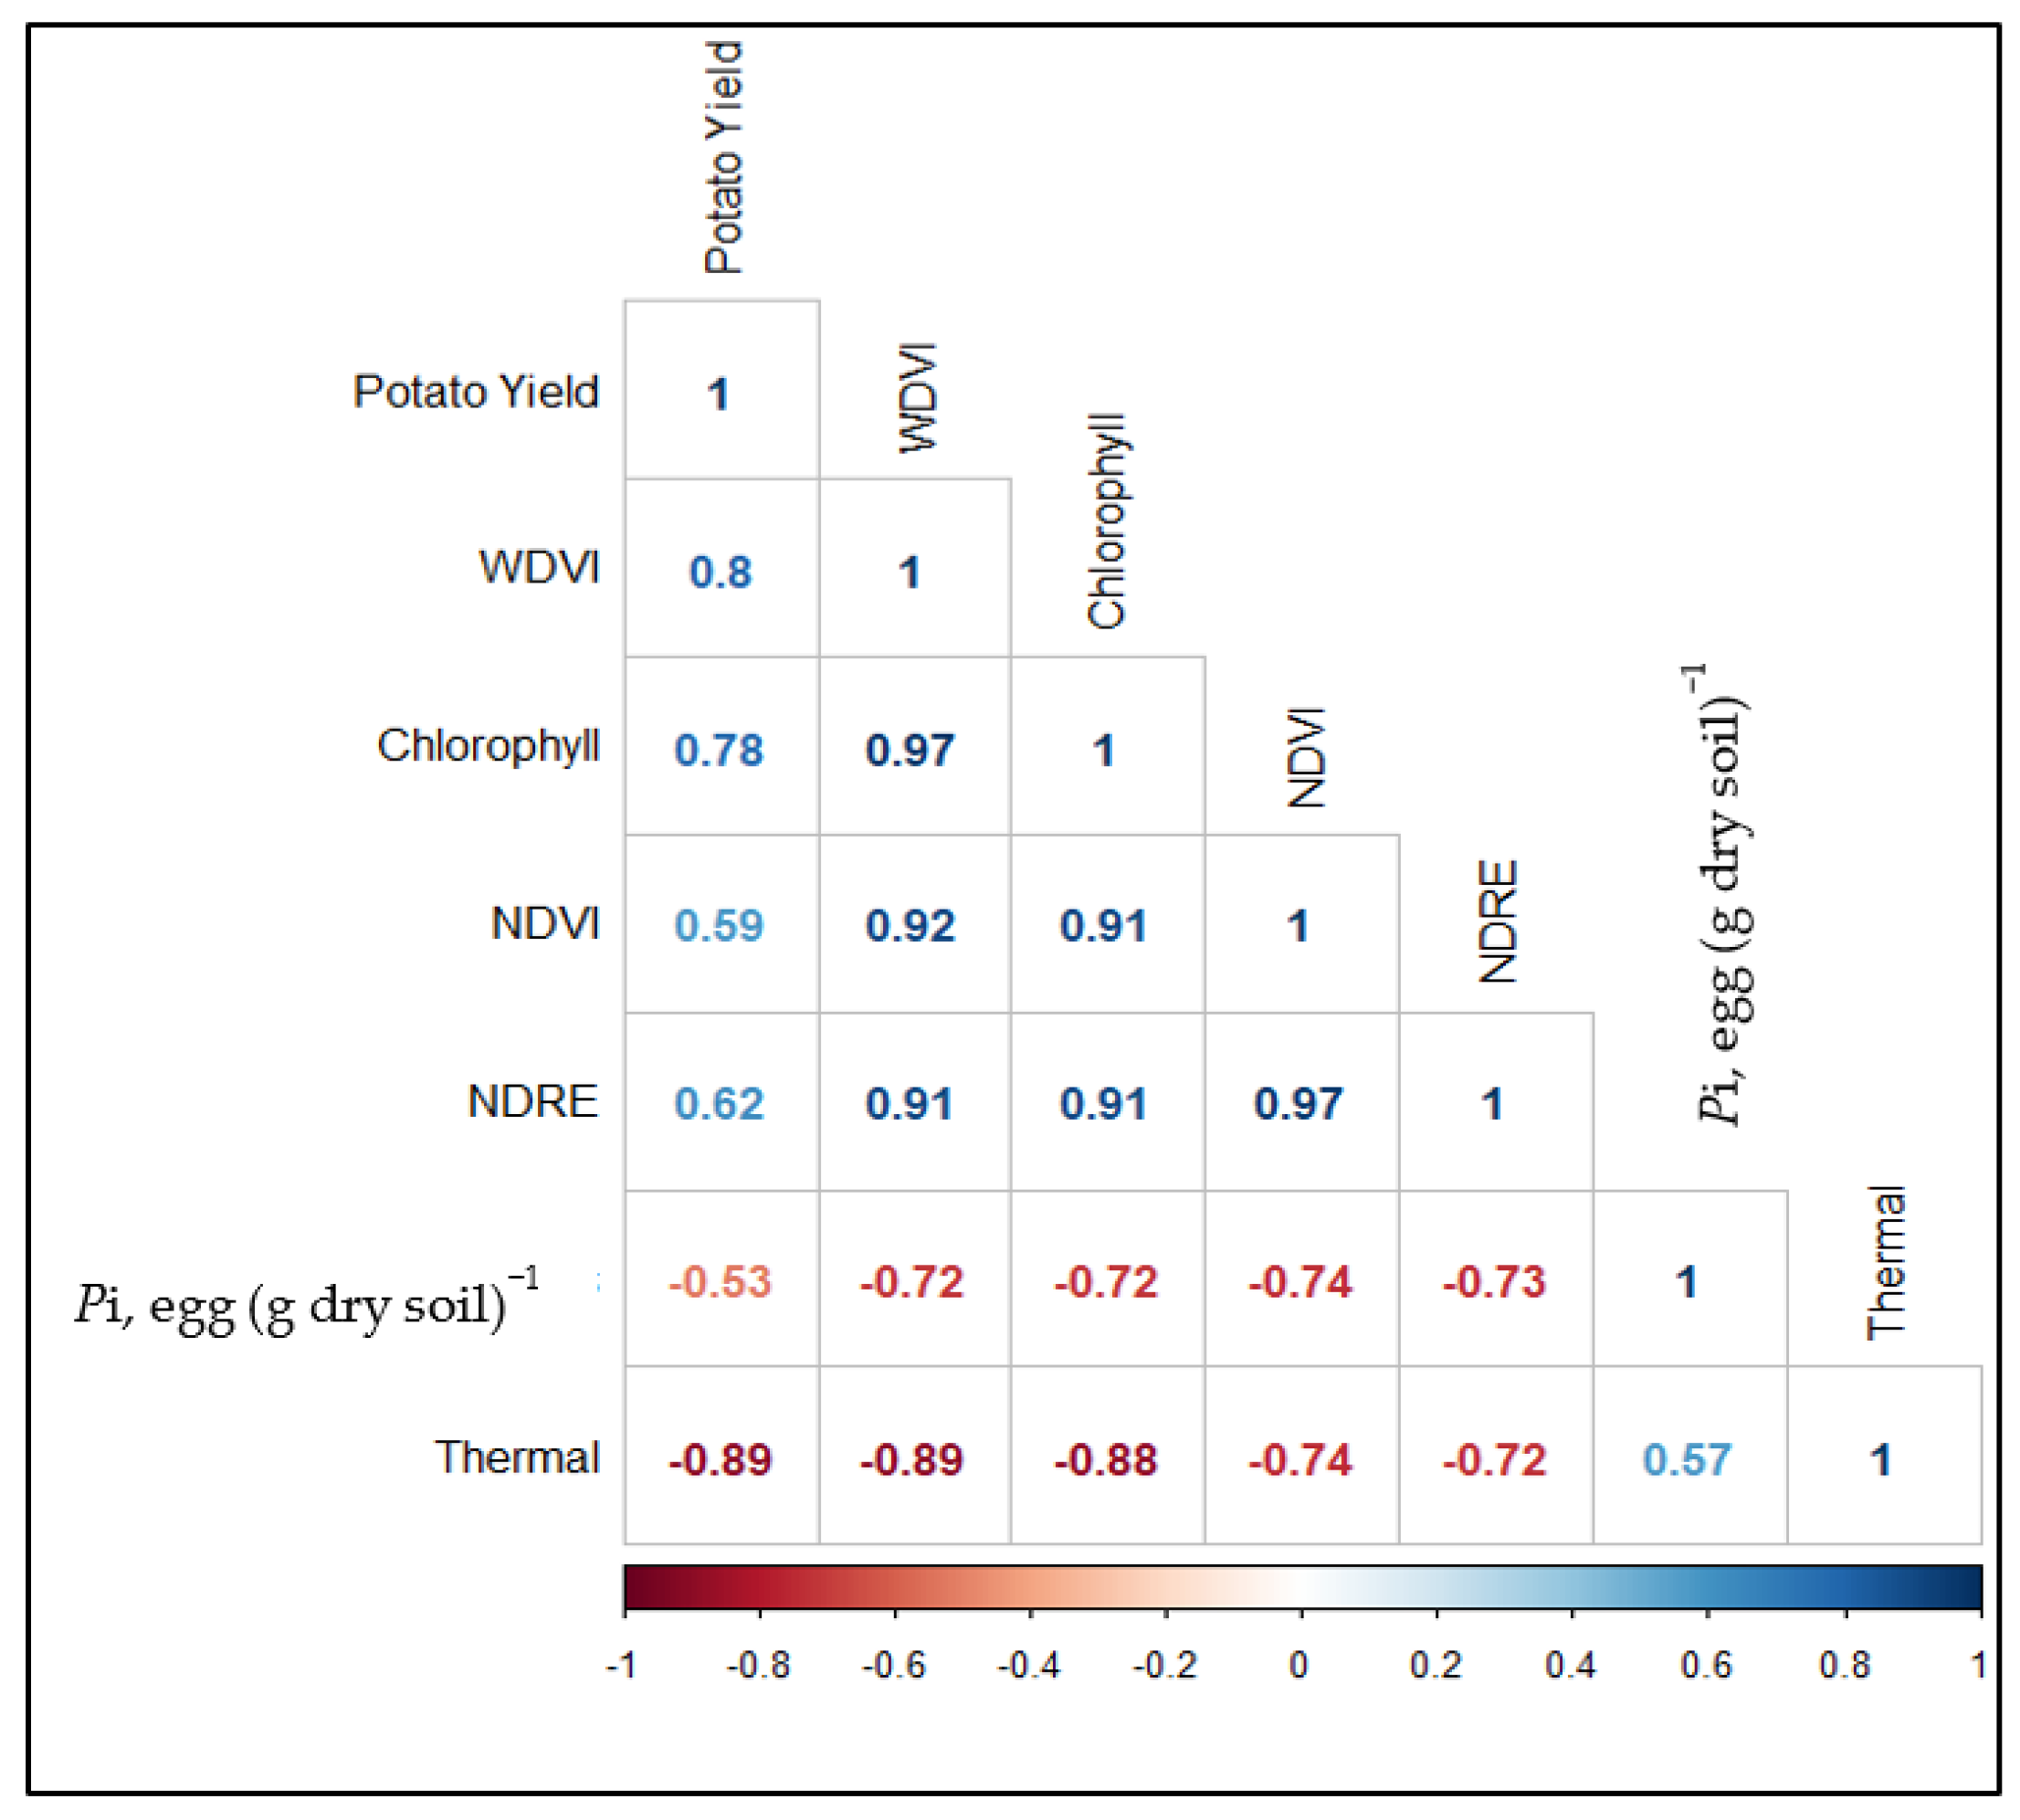
The correlation matrix allows us to observe the relationship between two variables (Figure 3). The order of the matrix is arranged based on the hierarchical clustering method, which implies that a variable is ordered in the proxy to a similar variable. The blue coefficients represent a positive correlation, while the red coefficients represent a negative correlation. A positive correlation is shown between fresh tuber yield tons (ha)−1 and UAV indices of WDVI, chlorophyll, NDVI, and NDRE. By contrast, a negative correlation is seen between Pi, eggs (g dry soil)−1, and the UAV indices. The same tendency can be observed between Thermal (the mean value of canopy temperature) and the UAV indices mentioned above. Moreover, it should be highlighted that the order of variable Pi and eggs (g dry soil)−1 is a proxy to the variable of thermal data, followed by the result of the hierarchical clustering. The more severe the biotic stress caused by the population densities, the more stomatal closure happens. Therefore, we will elaborate on the relationship of Pi and thermal canopy temperature for the following three main reasons. (i) This is a measure that cannot be observed visually compared to the other indices. (ii) It is the only single variable with a positive correlation coefficient with Pi. (iii) It is more closely clustered to Pi in the hierarchy of correlation matrix.

3.3. Relationship between Field Data and UAV Data

Figure 4 shows that the higher the Pi, the higher the canopy temperature. Stomata closure due to abiotic and biotic stress is one of the defense mechanisms of plants, and it triggers the rise of the canopy temperature [27]. Thus, infrared thermography can be useful in investigating the spatiotemporal heterogeneity of stomatal conductance for plant pathogens [28]. Our result reflects that monitoring this index by using a UAV during the cropping season allows us primarily to detect the presence of the nematode infection under the field conditions, and it could support farmers in management by preventing the spread of the nematode. The maximum rate of canopy temperature increase ranges from 46.78 of the cv. Seresta to 64.29 of the cv. Sarion (Table 3). The maximum canopy temperature ranging from 29.99 °C in the cv. Avarna to 31.11 °C in the cv. Seresta was measured. No statistical significance could be decerned when the cv. Sarion was compared with all the rest of the cultivars. This was also evident in the overlapping of the model values in Figure 4E. Generally, mean canopy temperature increased with Pi and reached a maximum when Pi was very large, that is, >50 eggs (dry soil)−1.
The magnitude of the canopy temperature gradient measured by the UAV-thermal sensors under stress conditions is affected by varied factors such as the type of crop, the time of the flight, and the experimental design of the comparative study for stress assessment. While Melandri et al. [29] mentioned that the difference in average canopy temperature between the control and the stressed rice plants was 3–4 °C, another work [30] reported a more than 10 °C increase in the temperature (between 27.1 °C and 38.9 °C) of the maize canopy recorded by the thermal sensors under different water stress conditions. Regarding the relationship between canopy temperature and sweet potato that was affected by beet cyst nematodes, Joalland et al. [19] demonstrated that the average temperature difference between susceptible and tolerant cultivars was 24.7 ± 0.1 °C versus 23.8 ± 0.1 °C. This temperature difference was also observed in our study in the maximum temperature reached by the four cultivars (Table 3).
Indeed, the accuracy of the canopy temperature estimation by the thermal sensor still needs to be explored. It should also be noted that the canopy temperature taken by UAV data varies by many factors, such as the flight altitude [31] and local conditions (e.g., air temperature) [29]. Further study should be conducted by several UAV flights during a cropping season by considering different aspects (e.g., soil, plant, and climate conditions) and the spatial dimensions of the infected spot.
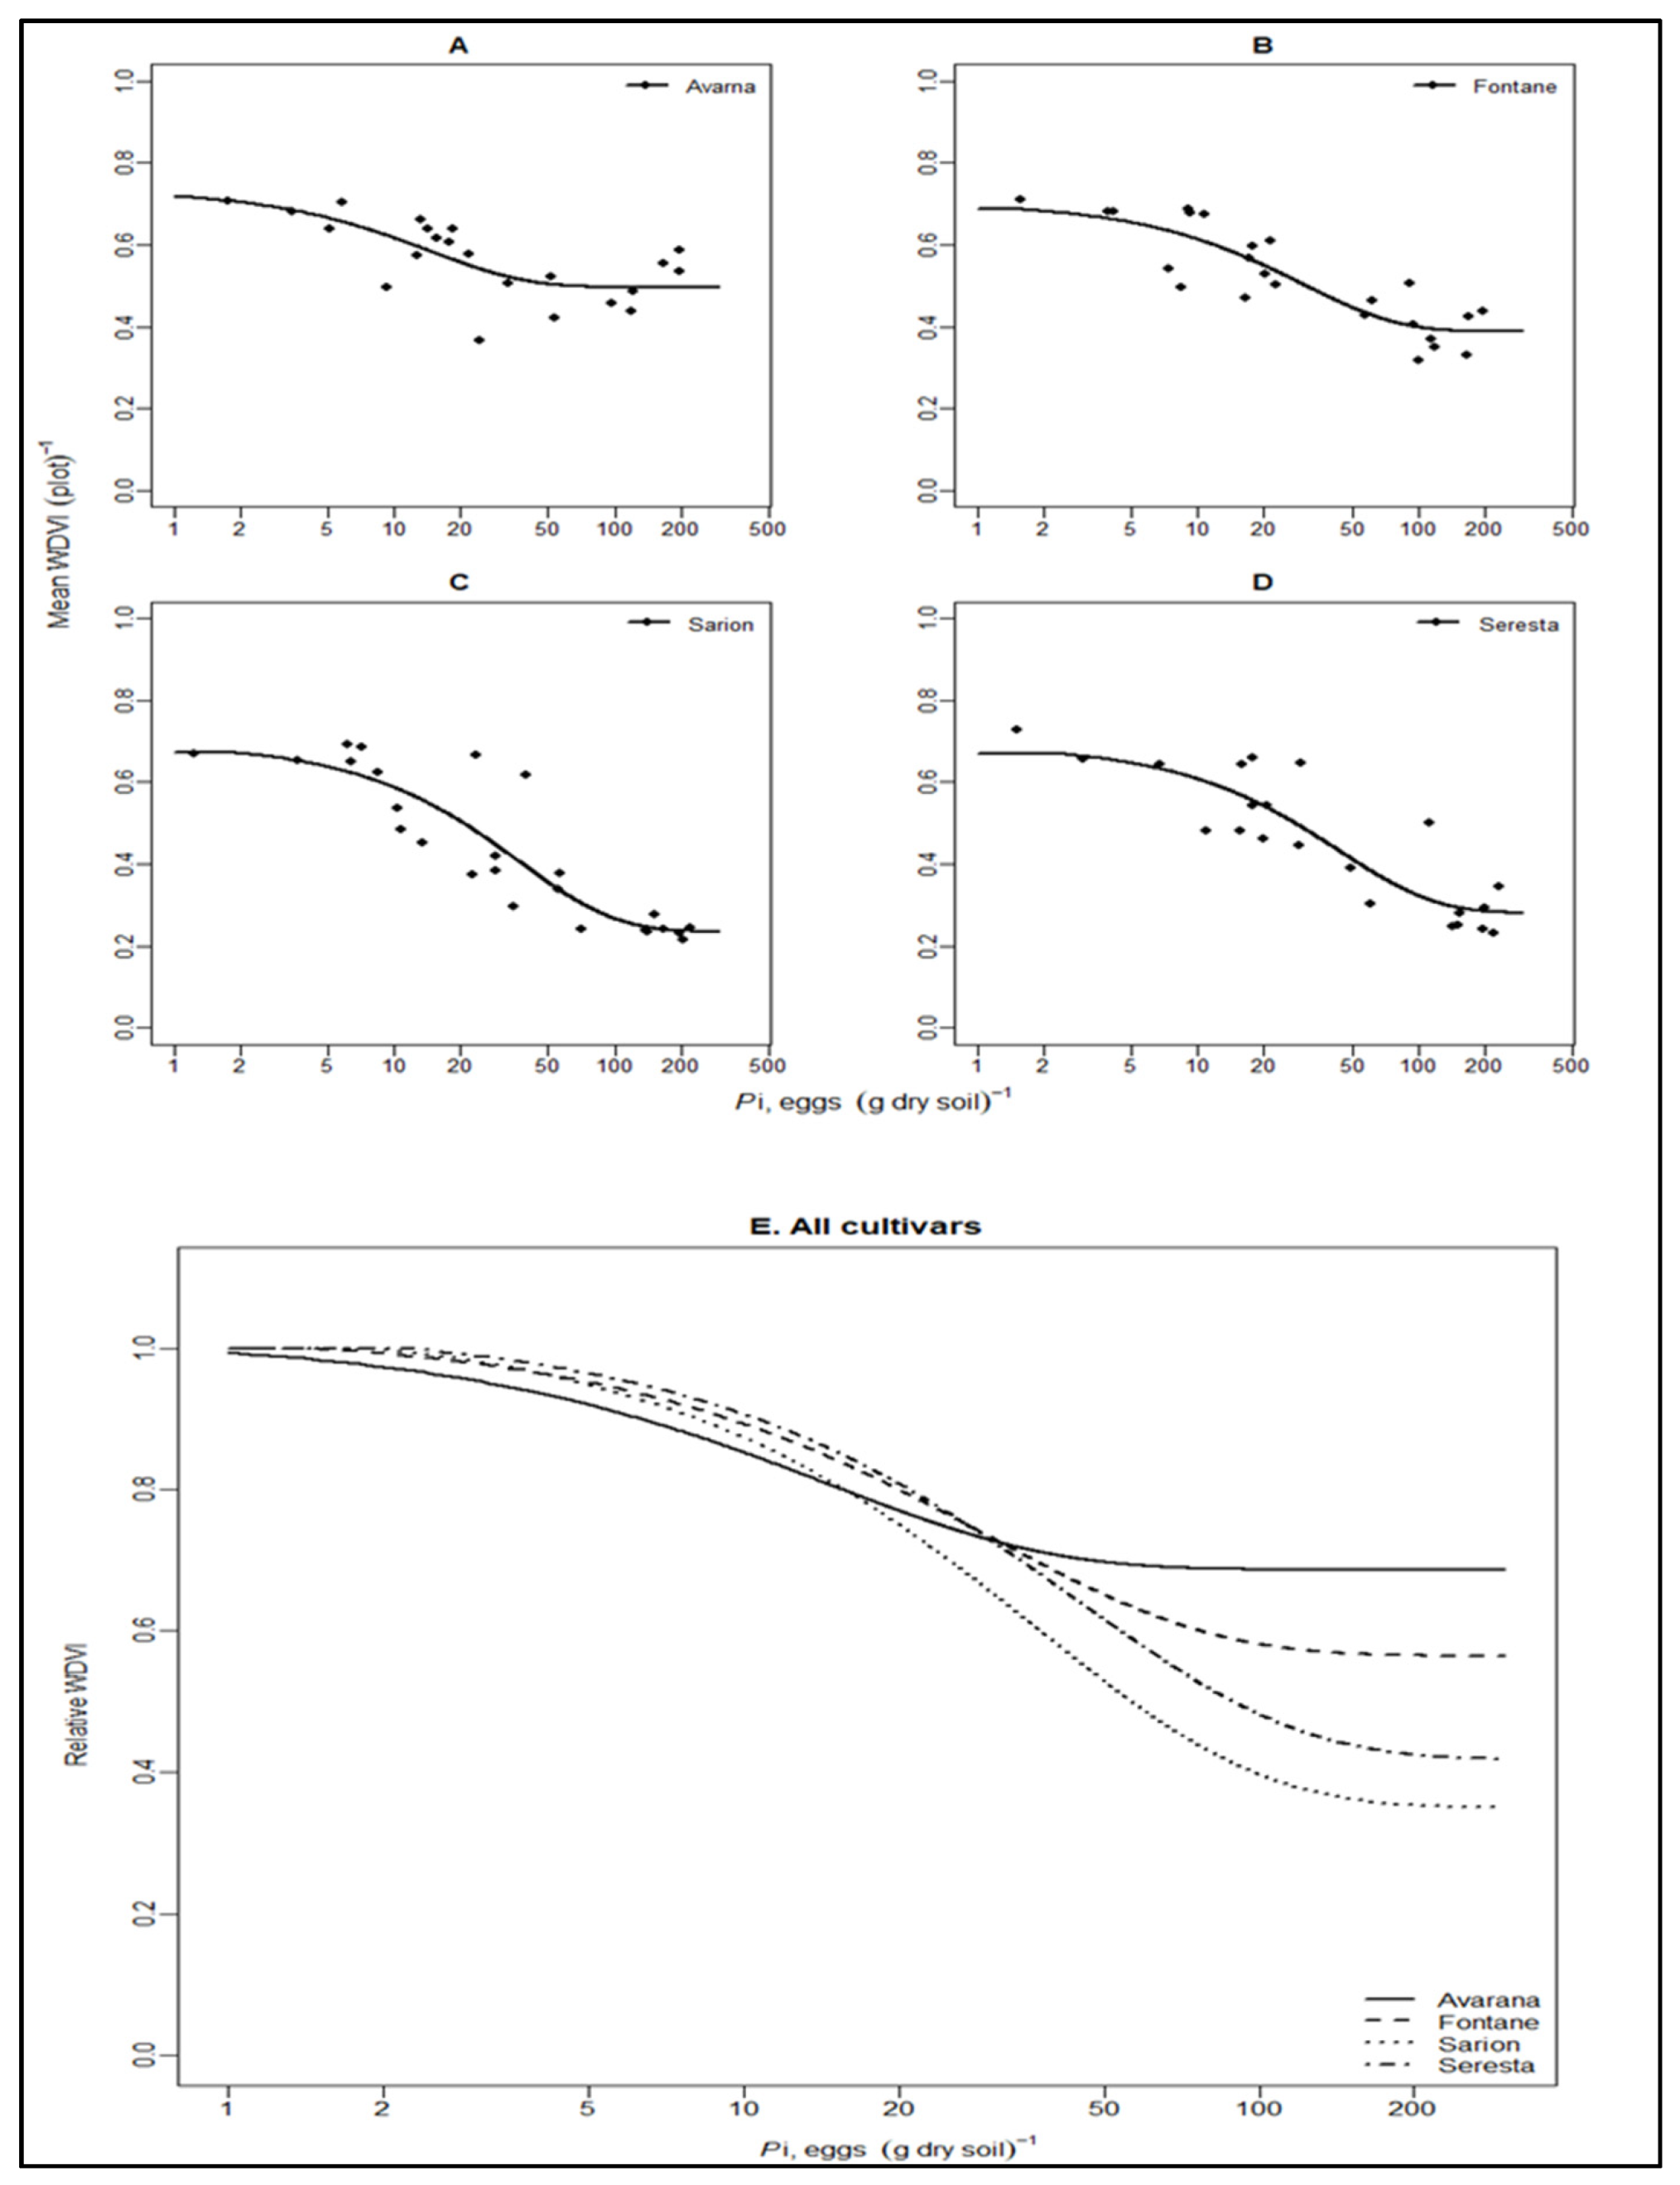
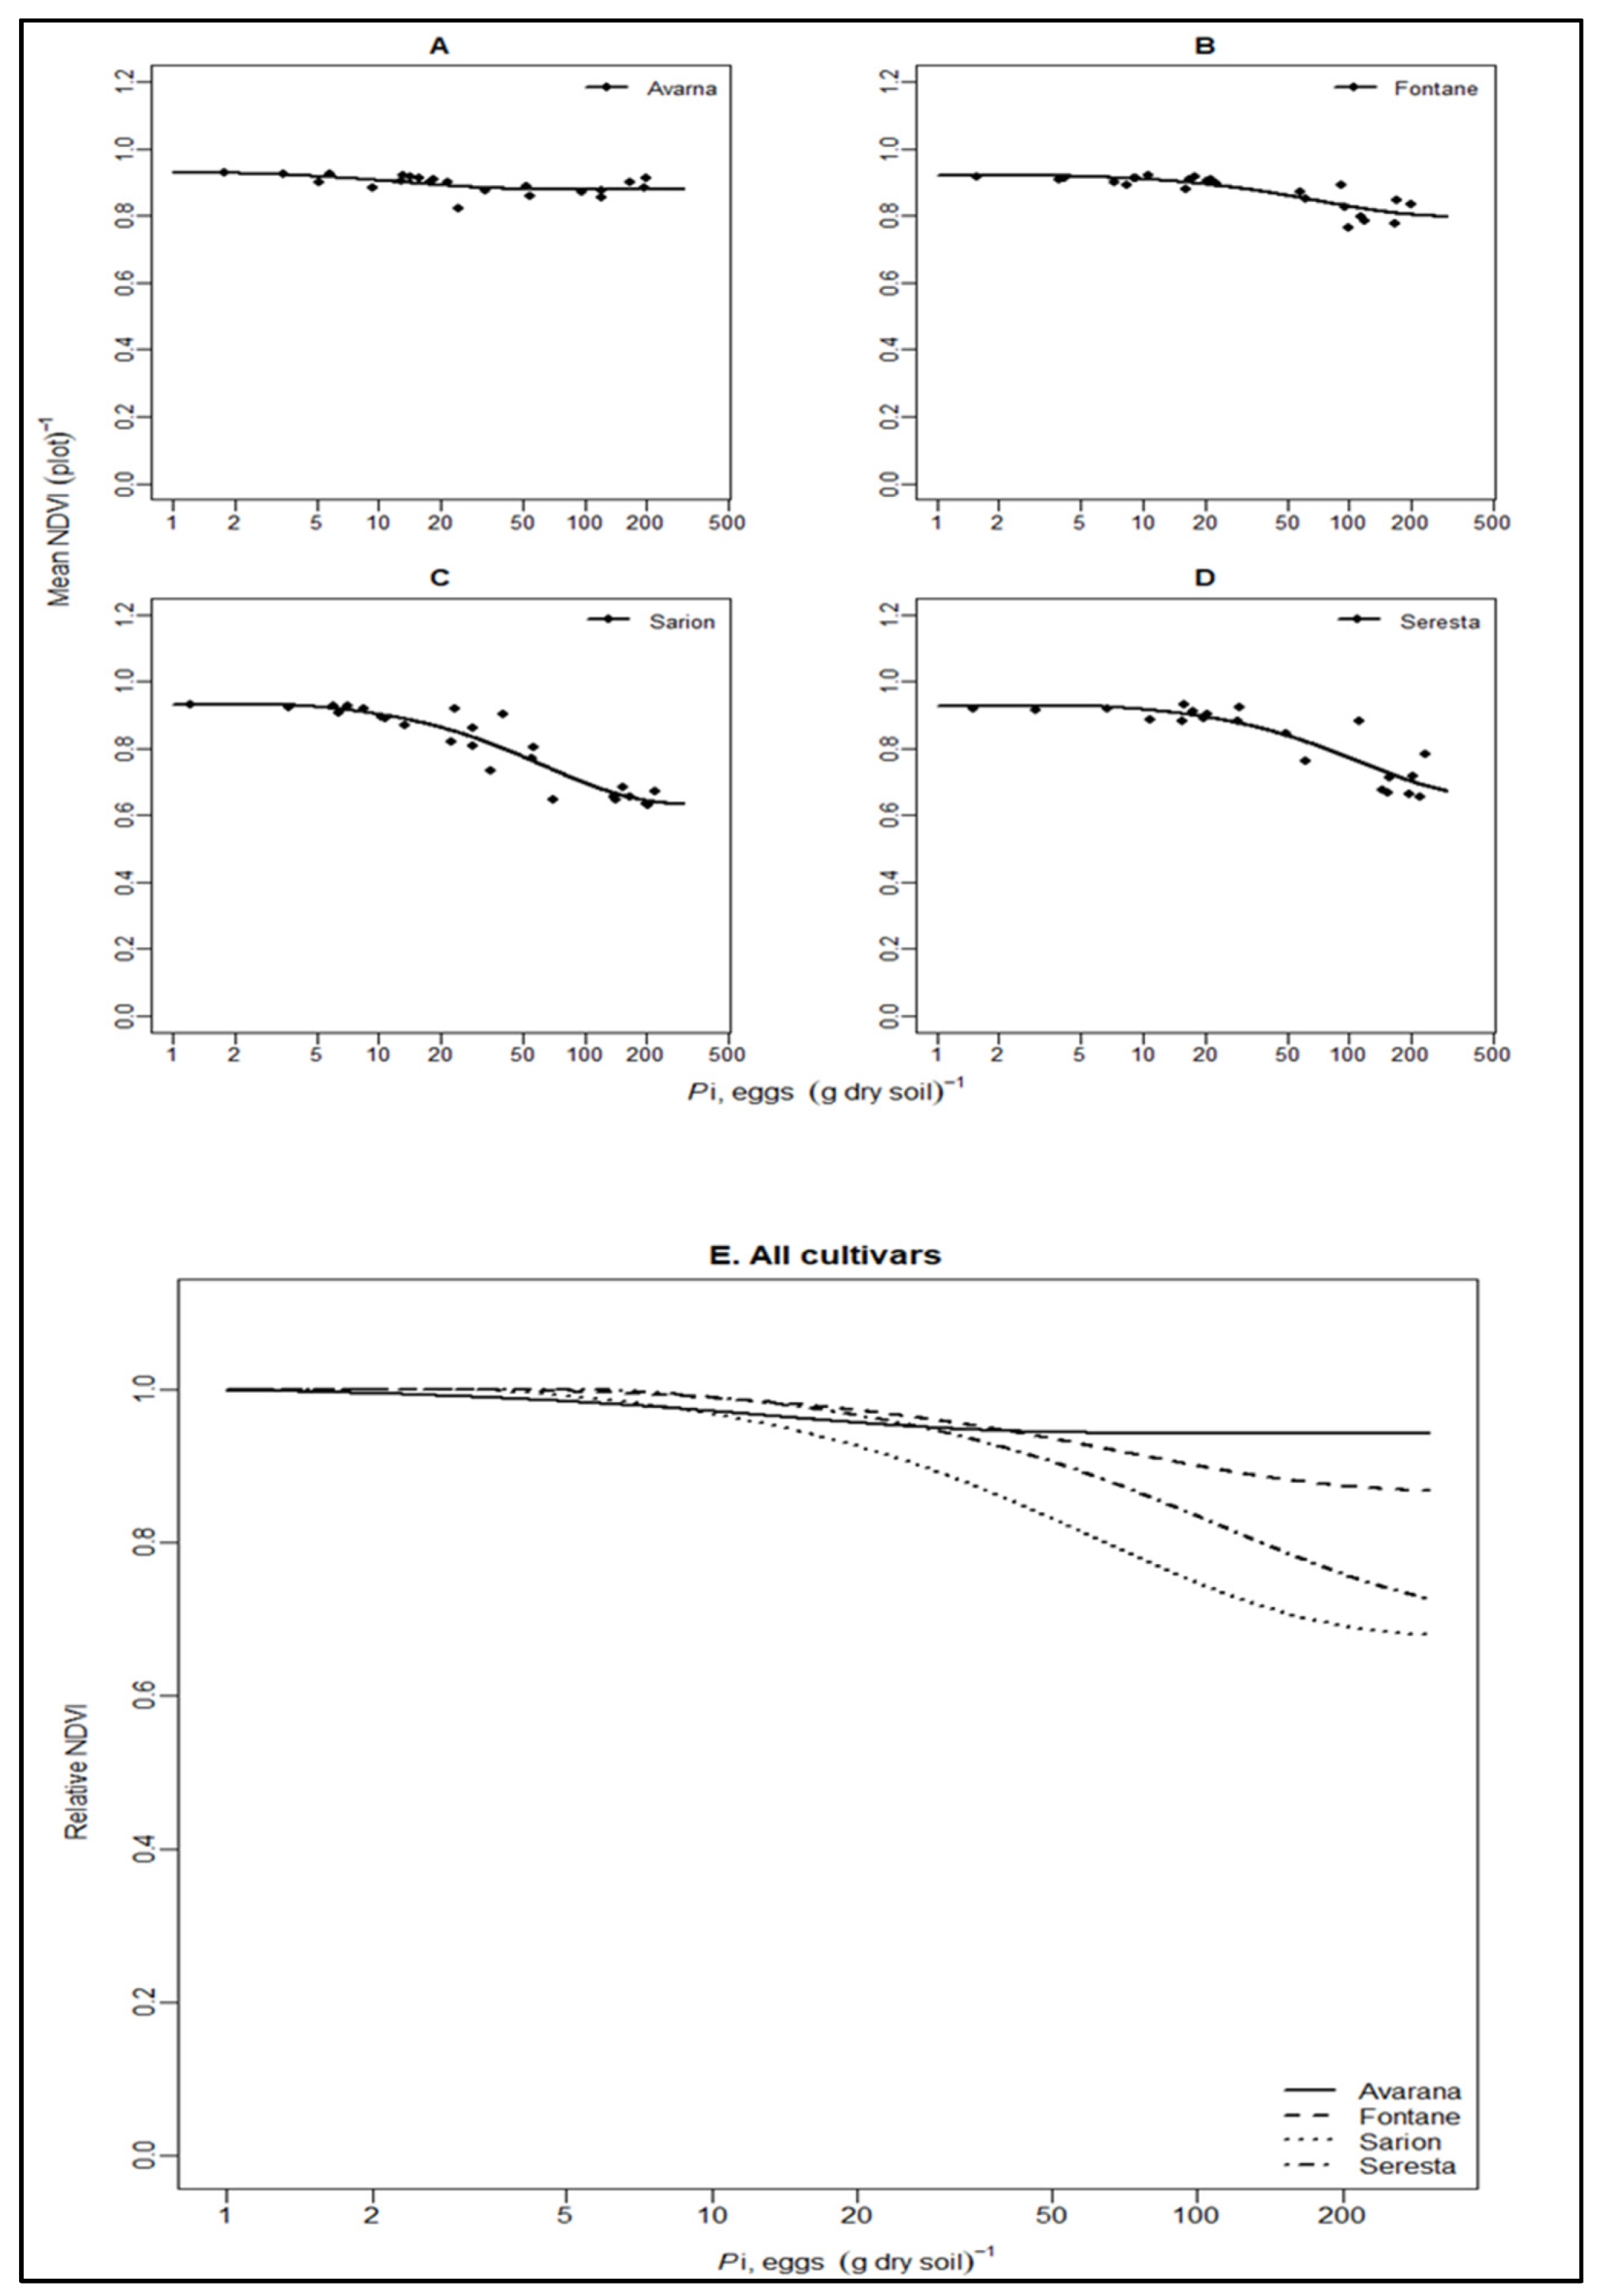
Table 4 shows the output parameters of the relationship between Pi and UAV indices: weighted difference vegetation (WDVI), red-edge chlorophyll index (chlorophyll), normalized difference in red edge (NDRE), and normalized difference vegetation index (NDVI) of the four potato cultivars compared to the output parameters of the fresh tuber yield by using Equation (1). As can be seen in Table 4 of the relationship between Pi and UAV indices, (Pi~WDVI and Pi~Chlorophyll content index) are similar. The same holds true for the relationship between (Pi~NDRE and Pi~NDVI), which are also similar. Therefore, we prefer to show the relationship between Pi and WDVI in Figure 5 and the relationship between Pi and NDVI in Figure 6. The relationship between Pi~NDRE and Pi~Chlorophyll is provided in the Supplementary Figures S3 and S4. As can be seen in Table 4, comparisons were performed between the output parameters (relative minimum UAV values and the tolerance limit) of the UAV indices and that of the fresh tuber yield per cultivar. The minimum UAV indices of all the variables, except the relative minimum chlorophyll content indices, were significantly different from that of the relative minimum fresh tuber yield. Only in one case of the cv. Sarion, the chlorophyll content index observed was significantly different. Similarly, except in the cv. Sarion (chlorophyll content index), in all other cultivars, the relative minimum UAV value of the indices increased significantly as compared to that of the relative minimum value of the fresh tuber yield.
The tolerance limit of the UAV indices, except for the NDVI indices of the cv. Fontane, is not significantly different within cultivars compared to the tolerance limit of fresh tuber yield.
The voluntary, intensive sampling method AMI 100, which detects a central population density of 100 cysts (kg soil)−1 with 90% probability, detects approximately 100 cysts × 250 eggs/cyst × 2 non-host years (×0.5)/1000 g of soil = about 10 eggs (g soil)−1. This density and higher densities, which are normally detected when statutory soil sampling is conducted, falls within the range of the exponential effect of Pi on the thermal temperature, as shown in Figure 4, and should be detectable also considering that the whole field is unaffected, except for the hotspot. Therefore, our finding provides an important insight into the potential use of the UAV thermal canopy temperature method for detecting PCN infestations for statutory use. Then, the localized hotspot, instead of the whole field, can be point-sampled to establish the presence of PCN, as well as other diseases which might have the same effect on the plant. Supplemental Table S2 presents more information about the traditional sampling methods for nematode detection. On the other hand, it becomes clear that density estimation does not seem to be a feasible option when looking at the response curve of Figure 4, and that for advisory purposes, traditional sampling remains required.
A clear regression was observed between Pi and UAV indices in all cultivars except cv. Avarna for both (NDRE and NDVI) indices. However, the relative minimum UAV index values except that of (the relative minimum chlorophyll content index) were significantly different from that of fresh tuber yield. This implies that predicting damage by using UAV indices (WDVI, NDRE, NDVI) cannot be justified using our data, even though the tolerance limit was not significantly different (in most cases, it is partly due to the higher standard error when measuring the Pi). This also concurs with the literature, as some of the indices are proven to be bad predictors of actual fresh tuber yield, such as by using NDVI [32], although also incidentally, a good prediction was reported [33].
The use of the chlorophyll content index for estimating damage is promising, as both the relative minimum chlorophyll content index and its tolerance limit are not significantly different, except in one case of the cv. Sarion. However, a confirmation of this finding is required with more data and times series measurements in the future.

4. Conclusions

Our study shows that using UAV indices, which were recorded 2.5 months before the harvest, could determine the presence of the potato cyst nematode G. pallida. The data from the thermal sensor showed a positive correlation with increasing Pi, eggs (g dry soil)−1 and significant increases at densities >10 eggs (g dry soil)−1. This is another confirmation that thermal sensor data, which monitors the plant canopy temperature under heavy nematode infestation, trigger the stomata to close and increase the canopy temperature. The negative correlation between Pi and UAV indices except (the cv. Avarna for NDRE and NDVI) were also confirmed by using a classical yield loss model that describes the effect of the Pi on fresh tuber yield at harvest. Based on the current observations, only the chlorophyll content index might be useful to estimate the effect of Pi on yield, which is comparable to that of the effect observed by estimating fresh tuber yield.
If the efficacy of using UAV indices to determine the presence of PCN were confirmed, it would be theoretically possible to assume an equivalent detection probability of 90% to that of the intensive sampling method, AMI 100, in The Netherlands. Additional information regarding the size of the infestation detected by the thermal sensor could be linked to the actual size of the infestation. Then, this technique might provide new avenues to feeding advisory systems. Further work should aim to confirm the results, the detection with an acceptable level of variation, and the prediction of the effect of Pi on yield by using chlorophyll content indices. Additionally, future studies should investigate the effect of potato development stages on the growth index response by using UAV data as a time-series over the growth period. A more comprehensive approach that combines various types of datasets, such as microclimate [30], soil properties [34], plant phenotyping [35], and existing molecular methods [36,37], could lead to more precise and robust monitoring.

Supplementary Materials

The following supporting information can be downloaded at: https://www.mdpi.com/article/10.3390/rs15051429/s1.

Author Contributions

Conceptualization, M.G.T., K.J. and T.H.B.; methodology, M.G.T. and T.H.B.; software, M.G.T. and K.J.; validation, M.G.T., K.J., L.P.G.M., E.S. and T.H.B.; formal analysis, M.G.T., K.J. and E.S.; investigation, M.G.T., K.J. and T.H.B.; resources, K.v.B., C.K., E.S. and T.H.B.; data curation M.G.T., K.J. and E.S.; writing—original draft preparation, K.J.; writing—review and editing, M.G.T., K.J., N.S.N., T.N. and T.H.B.; visualization, M.G.T. and K.J.; supervision, C.K. and T.H.B.; project administration, C.K. and T.H.B.; funding acquisition, M.G.T., C.K. and T.H.B. All authors have read and agreed to the published version of the manuscript.

Funding

This research was funded by Ministerie van Landbouw, Natuur en Voedselkwaliteit in The Netherlands and funding agency Topsector AgriFood (TTADDA project).

Data Availability Statement

Not applicable.

Acknowledgments

Keiji Jindo wishes to acknowledge financial support from the projects of TTADDA as well as the project of “Knowledge Base Digital Data—High Tech Artificial Intelligence (KB DDHT)”. He also acknowledges the financial support from Kubota-WUR collaboration (3710473400).

Conflicts of Interest

The authors declare no conflict of interest.

References

  1. Been, T.H.; Schomaker, C.H. Quantitative Studies on the Management of Potato Cyst Nematodes (Globodera spp.) in The Netherlands. Ph.D. Thesis, Wageningen University, Wageningen, The Netherlands, 1998. [Google Scholar]
  2. Teklu, M.G.; Schomaker, C.H.; Been, T.H.; Molendijk, L.P. Tuber Yield, Quality and Infestation Levels of Potato Genotypes, Resistant to the Root-Knot Nematode, Meloidogyne chitwoodi. Potato Res. 2022, 66, 105–135. [Google Scholar] [CrossRef]
  3. Seinhorst, J. Water Consumption of Plants Attacked By Nematodes and Mechanisms of Growth Reduction. Nematologica 1981, 27, 34–51. [Google Scholar] [CrossRef] [Green Version]
  4. Seinhorst, J.W. Effect of nematode attack the growth and yield of crop plants. In Cyst Nematodes; Lamberti, F., Taylor, C.E., Eds.; Plenum Press: New York, NY, USA, 1986; pp. 191–210. [Google Scholar]
  5. Gartner, U.; Hein, I.; Brown, L.H.; Chen, X.; Mantelin, S.; Sharma, S.K.; Dandurand, L.-M.; Kuhl, J.C.; Jones, J.T.; Bryan, G.J.; et al. Resisting Potato Cyst Nematodes With Resistance. Front. Plant Sci. 2021, 12, 661194. [Google Scholar] [CrossRef] [PubMed]
  6. Asano, K.; Kobayashi, A.; Tsuda, S.; Nishinaka, M.; Tamiya, S. DNA marker-assisted evaluation of potato genotypes for potential resistance to potato cyst nematode pathotypes not yet invading into Japan. Breed. Sci. 2012, 62, 142–150. [Google Scholar] [CrossRef] [PubMed] [Green Version]
  7. Cotton, J.A.; Lilley, C.J.; Jones, L.M.; Kikuchi, T.; Reid, A.J.; Thorpe, P.; Tsai, I.J.; Beasley, H.; Blok, V.; Cock, P.J.A.; et al. The genome and life-stage specific transcriptomes of Globodera pallida elucidate key aspects of plant parasitism by a cyst nematode. Genome Biol. 2014, 15, R43. [Google Scholar] [CrossRef] [Green Version]
  8. Ochola, J.; Cortada, L.; Ng’Ang’A, M.; Hassanali, A.; Coyne, D.; Torto, B. Mediation of Potato–Potato Cyst Nematode, G. rostochiensis Interaction by Specific Root Exudate Compounds. Front. Plant Sci. 2020, 11, 649. [Google Scholar] [CrossRef]
  9. Hockland, S.; Niere, B.; Grenier, E.; Blok, V.; Phillips, M.; Den Nijs, L.; Anthoine, G.; Pickup, J.; Viaene, N. An evaluation of the implications of virulence in non-European populations of Globodera pallida and G. rostochiensis for potato cultivation in Europe. Nematology 2012, 14, 1–13. [Google Scholar] [CrossRef]
  10. Mburu, H.; Cortada, L.; Haukeland, S.; Ronno, W.; Nyongesa, M.; Kinyua, Z.; Bargul, J.L.; Coyne, D. Potato Cyst Nematodes: A New Threat to Potato Production in East Africa. Front. Plant Sci. 2020, 11, 670. [Google Scholar] [CrossRef]
  11. Zasada, I.A.; Ingham, R.E.; Baker, H.; Phillips, W.S. Impact of Globodera ellingtonae on yield of potato (Solanum tuberosum). J. Nematol. 2019, 51, 1–10. [Google Scholar] [CrossRef] [Green Version]
  12. EPPO. PM 9/26(1) National regulatory control system for Globodera pallida and Globodera rostochiensis. EPPO Bull. 2018, 48, 516–532. [Google Scholar] [CrossRef] [Green Version]
  13. Hillnhütter, C.; Schweizer, A.; Kühnhold, V.; Sikora, R.A. Remote Sensing for the Detection of Soil-Borne Plant Parasitic Nematodes and Fungal Pathogens. In Precision Crop Protection–The Challenge and Use of Heterogeneity; Oerke, E.C., Gerhards, R., Menz, G., Sikora, R., Eds.; Springer: Dordrecht, The Netherlands, 2010. [Google Scholar] [CrossRef]
  14. Polder, G.; Blok, P.M.; De Villiers, H.A.C.; Van Der Wolf, J.M.; Kamp, J. Potato Virus Y Detection in Seed Potatoes Using Deep Learning on Hyperspectral Images. Front. Plant Sci. 2019, 10, 209. [Google Scholar] [CrossRef] [Green Version]
  15. Sugiura, R.; Tsuda, S.; Tamiya, S.; Itoh, A.; Nishiwaki, K.; Murakami, N.; Shibuya, Y.; Hirafuji, M.; Nuske, S. Field phenotyping system for the assessment of potato late blight resistance using RGB imagery from an unmanned aerial vehicle. Biosyst. Eng. 2016, 148, 1–10. [Google Scholar] [CrossRef]
  16. Siebring, J.; Valente, J.; Domingues Franceschini, M.H.; Kamp, J.; Kooistra, L. Object-Based Image Analysis Applied to Low Altitude Aerial Imagery for Potato Plant Trait Retrieval and Pathogen Detection. Sensors 2019, 19, 5477. [Google Scholar] [CrossRef] [Green Version]
  17. Overstreet, C.; McGawley, E.C.; Khalilian, A.; Kirkpatrick, T.L.; Monfort, W.S.; Henderson, W.; Mueller, J.D. Site specific nematode management-development and success in cotton production in the United States. J. Nematol. 2014, 46, 309–320. [Google Scholar]
  18. Ortiz, V.; Phelan, S.; Mullins, E. A temporal assessment of nematode community structure and diversity in the rhizosphere of cisgenic Phytophthora infestans-resistant potatoes. BMC Ecol. 2016, 16, 1–23. [Google Scholar] [CrossRef] [Green Version]
  19. Joalland, S.; Screpanti, C.; Varella, H.V.; Reuther, M.; Schwind, M.; Lang, C.; Walter, A.; Liebisch, F. Aerial and Ground Based Sensing of Tolerance to Beet Cyst Nematode in Sugar Beet. Remote Sens. 2018, 10, 787. [Google Scholar] [CrossRef] [Green Version]
  20. Oliveira, A.J.; Assis, G.A.; Guizilini, V.; Faria, E.R.; Souza, J.R. Segmenting and detecting nematode in coffee crops using aerial images. In Computer Vision Systems. ICVS 2019; Tzovaras, D., Giakoumis, D., Vincze, M., Argyros, A., Eds.; Springer: Cham, Switzerland, 2014; Volume 11754. [Google Scholar] [CrossRef]
  21. Arjoune, Y.; Sugunaraj, N.; Peri, S.; Nair, S.V.; Skurdal, A.; Ranganathan, P.; Johnson, B. Soybean cyst nematode detection and management: A review. Plant Methods 2022, 18, 110. [Google Scholar] [CrossRef]
  22. Shao, H.; Zhang, P.; Peng, D.; Huang, W.; Kong, L.; Li, C.; Liu, E.; Peng, H. Current advances in the identification ofplant nematode diseases: From lab assays to in-field diagnostics. Front. Plant Sci. 2023, 14, 1106784. [Google Scholar] [CrossRef]
  23. Teklu, M.G.; Schomaker, C.H.; Been, T.H. Relative susceptibilities of five fodder radish varieties (Raphanus sativus var. Oleiformis) to Meloidogyne chitwoodi. Nematology 2014, 16, 577–590. [Google Scholar] [CrossRef]
  24. Rouse, J.W., Jr.; Haas, R.H.; Schell, J.A.; Deering, D.W. Monitoring Vegetation Systems in the Great Plains with ERTS Third ERTS-1 Symposium; NASA: Washington, DC, USA, 1974; pp. 309–317.
  25. Gong, P.; Pu, R.; Biging, G.S.; Larrieu, M.R. Estimation of forest leaf area index using vegetation indices derived from Hyperion hyperspectral data. IEEE Trans. Geosci. Remote Sens. 2003, 41, 1355–1362. [Google Scholar] [CrossRef] [Green Version]
  26. Gitelson, A.A.; Vina, A.; Ciganda, V.; Rundquist, D.C.; Arkebauer, T.J. Remote estimation of canopy chlorophyll content in crops. Geophys. Res. Lett. 2005, 32, L08403. [Google Scholar] [CrossRef] [Green Version]
  27. Pineda, M.; Barón, M.; Pérez-Bueno, M.-L. Thermal Imaging for Plant Stress Detection and Phenotyping. Remote Sens. 2021, 13, 68. [Google Scholar] [CrossRef]
  28. Shakeel, Q.; Bajwa, R.T.; Rashid, I.; Aslam, H.M.U.; Iftikhar, Y.; Mubeen, M.; Li, G.; Wu, M. Concept and application of infrared thermography for plant disease measurement. In Trends in Plant Disease Assessment; Ul Haq, I., Ijaz, S., Eds.; Springer: Singapore, 2022. [Google Scholar] [CrossRef]
  29. Melandri, G.; Prashar, A.; McCouch, S.R.; van der Linden, G.; Jones, H.C.; Kadam, N.; Jagadish, K.; Bouwmeester, H.; Ruyter-Spira, C. Association mapping and genetic dissection of drought-induced canopy temperature differences in rice. J. Exp. Bot. 2020, 71, 1614–1627. [Google Scholar] [CrossRef] [PubMed]
  30. Zhang, L.; Niu, Y.; Zhang, H.; Han, W.; Li, G.; Tang, J.; Peng, X. Maize Canopy Temperature Extracted From UAV Thermal and RGB Imagery and Its Application in Water Stress Monitoring. Front. Plant Sci. 2019, 10, 1270. [Google Scholar] [CrossRef]
  31. Ludovisi, R.; Tauro, F.; Salvati, R.; Khoury, S.; Scarascia Mugnozzaa, G.; Harfouche, A. UAV-Based Thermal Imaging for High-Throughput Field Phenotyping of Black Poplar Response to Drought. Front. Plant Sci. 2017, 8, 1681. [Google Scholar] [CrossRef]
  32. Vannoppen, A.; Gobin, A. Estimating yield from NDVI, weather data, and soil water depletion for sugar beet and potato in Northern Belgium. Water 2022, 14, 1188. [Google Scholar] [CrossRef]
  33. Newton, I.H.; Islam, T.; Saiful, I. Yield Prediction Model for Potato Using Landsat Time Series Images Driven Vegetation Indices. Remote Sens. Earth Syst. Sci. 2018, 1, 29–38. [Google Scholar] [CrossRef]
  34. Sun, C.; Zhou, J.; Ma, Y.; Xu, Y.; Pan, B.; Zhang, Z. A review of remote sensing for potato traits characterization in precision agriculture. Front. Plant Sci. 2022, 13, 871859. [Google Scholar] [CrossRef]
  35. Plumblee, M.T.; Mueller, J.D. Implementing precision agriculture concepts and technologies into crop production and site-specific management of nematodes. In Integrated Nematode Management: State-of-the-Art and Visions for the Future; CABI Books; CABI International: Wallingford, UK, 2021. [Google Scholar] [CrossRef]
  36. Gorny, A.M.; Wang, X.; Hay, F.S.; Pethybridge, S.J. Development of a species-specific PCR for detection and quantification of Meloidogyne hapla in soil using the 16D10 root-knot nematode effector gene. Plant Dis. 2019, 103, 1902–1909. [Google Scholar] [CrossRef]
  37. Takemoto, S.; Niwa, S.; Okada, H. Effect of storage temperature on soil nematode community structures as revealed by PCR-DGGE. J. Nematol. 2010, 42, 324. [Google Scholar]
Figure 1. The flow chart of the techniques used in assessing the relationship between explanatory variable Pi in eggs (g dry soil)−1, and measured dependent variables (fresh tuber yield, normalized difference vegetation index (NDVI), normalized difference red edge (NDRE), weighted difference vegetative index (WDVI), chlorophyll, and canopy temperature).
Remotesensing 15 01429 g001
Figure 2. Relationship between Pi, eggs (g dry soil)−1, and absolute fresh tuber yield in tons (ha)−1 of four potato cultivars according to Equation (1). ((A) Avarna; (B) Fontane; (C) Sarion; (D) Serresta). (E) Relative fresh tuber yield of all the cultivars combined.
Remotesensing 15 01429 g002
Figure 3. Correlation heatmap matrix of different variables taken from the field experiment (Initial population, Pi = eggs (g dry soil)−1 and fresh tuber yield) and from an unmanned vehicle (UAV) (normalized difference vegetation index (NDVI), weighted difference vegetation (WDVI), normalized difference red edge (NDRE), red-edge chlorophyll index (Chlorophyll), and the thermal sensor (Thermal)). The significance level of the Pearson correlation is α = 0.05. The blue number represents a positive correlation, while the red number represents a negative correlation.
Remotesensing 15 01429 g003
Figure 4. Relationship between the initial population Pi, eggs (g dry soil)−1 of potato cyst nematodes in a potato field and canopy temperature (°C) of potato as measured by the thermal sensor of unmanned vehicle (UAV), according to Equation (6). (A) Avarna. (B) Fontane. (C) Sarion. (D) Serresta. (E) All cultivars.
Remotesensing 15 01429 g004
Figure 5. Relationship between the Pi, eggs (g dry soil)−1 and the WDVI index of four potato cultivars according to Seinhorst Yield model Equation (1). ((A) Avarna. (B) Fontane. (C) Sarion. (D) Serresta.) (E) Relative WDVI of all the cultivars combined.
Remotesensing 15 01429 g005
Figure 6. Relationship between the Pi, eggs (g dry soil)−1 and mean NDVI index of four potato cultivars according to Seinhorst yield model Equation (1). ((A) Avarna. (B) Fontane. (C) Sarion. (D) Serresta.) (E) Relative NDVI of all the cultivars combined.
Remotesensing 15 01429 g006
Table 1. Several other studies on the utilization of unmanned vehicles (UAV) for the detection of the damage caused by potato diseases [14,15,16].
Research QuestionTechnology UtilizedReferences
Detecting potato Y-virus in seed potatoesHyperspectral images[14]
Assessment of potato late blight diseaseRed-Green-Blue (RGB) images[15]
Detecting Erwinia bacteria and potato Y-virusRGB very high-resolution imagery[16]
Table 2. The output parameter values (Equation (1)) of four potato cultivars: Avarna, Fontane, Sarion, and Seresta, where m = relative minimum yield; T = tolerance limit in eggs (g dry soil)−1; Ymax = maximum yield in tons per ha at Pi = 0 eggs (g dry soil)−1; sem = standard error of relative minimum yield; seT = standard error of tolerance limit; seYmax = standard error of maximum yield; R2 = coefficient of determination; df = degrees of freedom. * Significantly different parameter values compared to cv. Sarion at 5% level of significance. LSD = least significant difference.
CultivarsmTYmaxsemseTseYmaxR2dfLSDmLSDTLSDYmax
Avarna0.400.6273.920.090.3111.920.48210.261.6325.78
Fontane0.260.7680.360.090.4217.070.56220.25 *1.6835.64
Sarion0.602.1649.480.091.584.650.4423---
Serresta0.311.3358.510.090.627.480.59220.26 *1.5917.73
Table 3. The output parameter of the logistic model by using Equation 6 of four potato cultivars: Avarna, Fontane, Sarion, and Seresta, where acpt = maximum rate of canopy temperature increase; Mcpt = maximum canopy temperature reached (°C); seacpt = standard error of maximum rate of canopy temperature; seMcpt = standard error of maximum canopy temperature reached (°C); R2 = coefficient of determination; df = degrees of freedom. Parameter values are not significantly different compared to cv. Sarion at 5% level of significance. LSD = least significant difference.
CultivarsacptMcptseacptseMcptR2dfLSDacptLSDMcpt
Avarna47.1229.9912.10.620.45200.9630.071
Fontane52.5530.216.60.720.32221.0260.075
Sarion64.2930.427.10.860.223--
Seresta46.7831.1113.90.770.39201.0060.076
Table 4. The output parameter values according to (Equation (1)) describing the relationship between Pi and UAV indices: weighted difference vegetation (WDVI), red-edge chlorophyll index (chlorophyll), normalized difference in red edge (NDRE), normalized difference vegetation index (NDVI), and fresh tuber yield of four potato cultivars: Avarna, Fontane, Sarion, and Seresta, where m = relative minimum value of the measured UAV indices; T = tolerance limit in eggs (g dry soil)−1; Ymax = maximum value of the measured UAV indices when Pi = 0 eggs (g dry soil)−1; sem = standard error of relative minimum UAV indices; seT = standard error of tolerance limit; seYmax = standard error of the maximum value of the measured indices; R2 = coefficient of determination; df = degrees of freedom. LSD = least significant difference. * Significantly different parameter values of UAV indices compared to the parameter values of the fresh tuber yield at 5% level of significance.
CultivarsVariablemTYmaxsemseTseYmaxR2NdfLSDmLSDT
AvarnaFTWYield0.400.6273.920.090.3111.920.482421--
AvarnaWDVI0.690.750.720.070.380.070.4623200.24 *1.35
AvarnaChlorophyl0.600.6226.310.080.323.290.4523200.261.37
AvarnaNDRE0.951.050.590.041.110.020.0623200.20 *1.99
AvarnaNDVI0.940.690.930.020.440.020.2923200.20 *1.51
FontaneFTWYield0.260.7680.360.090.4217.070.562522--
FontaneWDVI0.561.540.690.050.770.050.7425220.20 *1.42
FontaneChlorophyl0.492.9121.850.091.541.300.7325220.251.45
FontaneNDRE0.802.700.580.031.300.010.7225220.19 *1.40
FontaneNDVI0.863.650.920.032.090.010.7025220.18 *1.50 *
SarionFTWYield0.602.1649.480.091.584.650.442623--
SarionWDVI0.351.910.670.060.720.050.7726230.22 *1.51
SarionChlorophyl0.261.4725.580.060.482.250.8226230.21 *1.47
SarionNDRE0.623.260.600.040.990.020.8826230.191.45
SarionNDVI0.683.280.930.031.030.020.8726230.191.45
SerrestaFTWYield0.311.3358.510.090.627.480.592522--
SerrestaWDVI0.422.270.670.071.150.060.7423200.231.32
SerrestaChlorophyl0.313.1722.900.111.862.330.7123200.291.42
SerrestaNDRE0.625.620.580.114.200.020.7423200.29 *1.62
SerrestaNDVI0.705.890.930.083.940.030.7823200.25 *1.52
Disclaimer/Publisher’s Note: The statements, opinions and data contained in all publications are solely those of the individual author(s) and contributor(s) and not of MDPI and/or the editor(s). MDPI and/or the editor(s) disclaim responsibility for any injury to people or property resulting from any ideas, methods, instructions or products referred to in the content.