Abstract
Understory vegetation plays an important ecological role in maintaining the diversity of the ecosystem, the stability of ecosystem services, and the accumulation of nutrient elements, as an important part of a forest ecosystem. In this study, a new method of recognizing areas without understory vegetation is proposed. The method makes full use of the advantages of spectral characteristics, spatial structure information and temporal resolution of UAV images, and can quickly and simply distinguish understory, without vegetation cover. Combined with fractional vegetation coverage (FVC) and vegetation dispersion, understory, with no vegetation area, can be successfully recognized, and the Pr, Re and F1 are all above 85%. The proportion of bare soil under forest in our study area is 20.40%, 19.98% and even 41.69%. The study area is located in Changting County, Fujian Province, which is a typical red soil area in China where serious soil erosion is taking place in the forest. The method provides a promising, quick and economic way of estimating understory vegetation coverage with high spatial accuracy.
1. Introduction
Understory vegetation (shrubs and grass under tree canopies in a forest system) plays an important ecological role in maintaining the diversity of an ecosystem, the stability of ecosystem services and the circulation of nutrient elements, and has a great impact on preventing soil erosion [1,2]. In southern China, the red soil region is a typical soil erosion area (Figure 1). After years of management, there is a significant increase in forest coverage, but many of the forested areas are still suffering moderate or even intense soil erosion [3]. This kind of soil erosion is characterized by barren and acid red soil, hilly landforms, significant precipitation, lack of understory vegetation, and dominant plants with poorly developed roots and canopy, sometimes showing coexistence with dense forests and serious soil erosion [4]. The reason can be traced back to the middle of the last century when human activities caused devastating damage to vegetation and almost destroyed the entire original ecosystem. Surface vegetation reduces water-induced soil erosion by intercepting runoff, increasing water infiltration, and retarding flow velocities [5]. Without the protection of vegetation, the soil humus layer is lost, leaving only barren and acid red soil [6,7]. The process of recovery is slow and full of difficulties. The barren soil in the eroded area cannot breed a healthy shrub-grass layer, and conversely, few dominant species can replenish fertility. Sorriso-Valvo et al. [8] found that ground plant cover is more effective than canopy cover in controlling runoff and erosion. Therefore, the control of soil erosion under forests now becomes one of the main tasks of soil erosion control in southern China.
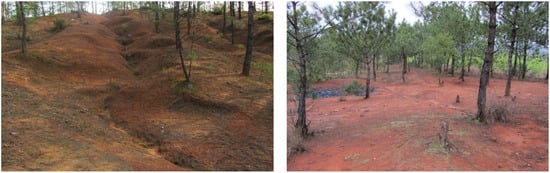
Figure 1.
Soil erosion area in red soil region.
Vegetation coverage is an important indicator to explore water and soil loss and has been widely used in most evaluation models such as the Universal Soil Loss Equation (USLE), the Revised Universal Soil Loss Equation (RUSLE), and the China Soil Loss Equation (CSLE), etc. The C-factor in RUSLE for the non-agricultural land in the soil erosion model is strongly related to the surface vegetation cover which is usually estimated by remote sensing technologies [9]. Unfortunately, due to the existence of soil erosion under forests, the vegetation coverage is usually overestimated in the evaluation model. To eliminate the overestimation and understand the real situation of water and soil loss in this region, it is necessary to develop methods for rapid estimation of understory vegetation coverage.
The traditional understory extraction method mainly relies on field surveys, which have high operability and accuracy. But in a way, it is time-consuming and labor-intensive, and thus only suitable for small-scale investigations. Remote sensing is an efficient alternative for gathering vegetation information across large areas [10]. However, in principle, the understory vegetation cannot be interpreted directly on optical images, because light cannot penetrate the canopy. For most medium-low resolution remote sensing images (such as MODIS and Landsat), phenological differences can be used to extract understory vegetation information. Mao-Ning et al. [11] successfully mapped the spatial distribution of understory bamboo using phenological characteristics derived from MODIS. This method is not time-efficient and is limited to specific species with obvious phenology. Xu et al. [12] used multispectral moderate-high spatial resolution remote sensing images, slope, fractional vegetation coverage, a nitrogen reflection index, a yellow leaf index, and a bare soil index to create the soil erosion under forest model (SEUFM), through principal components analysis (PCA). High-resolution remote sensing images contain rich texture and shape information, and therefore some spatiotemporal distribution characteristics of understory vegetation can be used to help us find new methods [13]. Zhu et al. [14] utilized the normalized red-green difference index (NGRDI), combined with the object-oriented method, to extract vegetation coverage data under forests. The studies do not fully mine the spatial information in high-resolution images. Artificial neural network (ANN) is a kind of effective model to fit the relation between images and the ground truths of understory vegetation. The spatial distribution characteristics of the canopy layer, shrub-grass layer and ground are implicitly expressed in the networks. Linderman et al. [15] used artificial neural networks that successfully detected under-story bamboo distribution with an overall accuracy of 80%. Wang et al. [16] classified an Advanced Spaceborne Thermal Emission and Reflection Radiometer (ASTER) image into three understory cover classes with a kappa statistic of 0.60, by integrating a neural network and a Geographic Information System (GIS) expert system. By this method, good results often depend on a large number of samples. Unfortunately, the understory vegetation is very difficult to label for its boundary cannot be drawn directly on the image, but needs to be determined in combination with field investigation. Another way of thinking is to consider how to use the three-dimensional structure information of vegetation. LiDAR (light detection and ranging) can distinguish the height of the canopy layer, the understory vegetation layer and the ground by using a signal sequence in the echo [17]. Sebastián M. et al. [18] utilize forest inventory plots, LiDAR-derived metrics, and the Random Forest algorithm to achieve classification accuracies of 83%, for the understory shrubs, and 86% to 88% for the different snag diameter classes. R.A. Hill et al. [19] make use of dual return LiDAR data, acquired in leaf-on and leaf-off conditions, for mapping the understory of broadleaf deciduous woodland in Britain. Nevertheless, this method also has many shortcomings, such as the local scale limit, and the high cost for large-scale and high-density cloud points.
In this paper, a method to estimate the understory vegetation coverage is proposed, based on the horizontal distribution of different vegetation layers on the image. The RGB-UAV image is chosen for its advantages of low cost, easy acquisition, and most importantly, the ultra-high ground resolution. In the red soil erosion area of southern China, poor canopy leads to low vegetation density. If the resolution is high enough, the scattered soil can be seen within and between canopies on images. Therefore, we classify the vegetated area into high vegetation(trees), and low vegetation (grasses and shrubs). There also possibly exists areas without understory vegetation, in high vegetation, where the bare soil is directly adjacent to the canopy. Moreover, where the more frequently high vegetation alternates with bare land, the greater the possibility the area is without understory vegetation. To quantify this degree of alternation, we introduce an indicator named vegetation dispersion [20]. In this paper, the formula of vegetation dispersion is optimized and the support vector machine (SVM) is used as a discriminator.
The main purpose of this study is to develop an approach to accurately measure the understory vegetation coverage using RGB-UAV ultra-high resolution images. The method provides a relatively easy-to-use way to identify the understory vegetation with a high extraction accuracy of more than 85%. The study also found a difference in vegetation coverage between taking into account of the bare soil under the forest and not doing so. The study area and data source are presented in Section 2, and a detailed description of this method is presented in Section 3. The results of a case study in Changting County are shown in Section 4, and we further discuss the choice of window size and the importance of vegetation dispersion in Section 5.
2. Study Area and Data Source
2.1. Study Area
The study area is located in Zhuotian Town, Changting County, Longyan City, Fujian Province (Figure 2). Changting County has long been a severe red soil erosion area in southern China. The county has a subtropical, marine monsoon climate with an average annual temperature of 20 °C and an annual rainfall of 1299.9 mm in 2021. (http://www.changting.gov.cn/xxgk/tjxx/tjgb/202211/t20221103_1944759.htm (accessed on 20 February 2023)). The dominant tree is the masson pine, an indicative plant in the red soil erosion area of southern China, accounting for 61.1% of the county’s stand area (http://www.changting.gov.cn/xwzx/ctxw/202206/t20220630_1908543.htm (accessed on 20 February 2023)). Furthermore, the area is characterized by rich precipitation and barren soil with a high sand content. The severe deforestation in the middle of the last century resulted in serious damage to the whole ecosystem including the understory vegetation which has not recovered for decades [21].
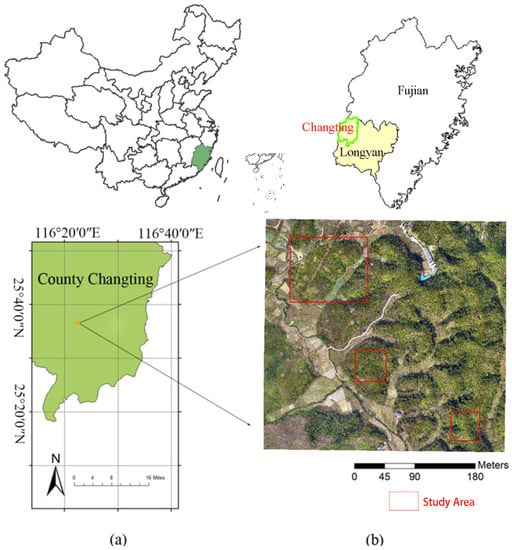
Figure 2.
Geographic location and digital orthophoto map (DOM) of the study area (a,b).
2.2. UAV Data
The flight data is obtained by the DJI M300 Purcell 102S camera in the aerial photography system of the six-rotor UAV. The UAV flight has a heading overlap rate of 75% and a side overlap rate of 65%. A single image includes three bands of red, green and blue. The data collection time is early August 2021, and the weather condition is fine. The spatial resolution is 0.03 m with a flight altitude of 300 m. We randomly selected three areas as the study area: Area 1 covers 8226 cells × 9945 cells, an area of 308 m × 274 m, Area 2 covers 4105 cells × 4114 cells, an area of 123 m × 123 m, and Area 3 covers 3840 cells × 3884 cells, an area of 115 m × 116 m. The images were processed to a digital orthophoto map (DOM), as shown in Figure 2, and a digital surface model (DSM) in Context Capture Center software (Bently Systems, Exton, PA, USA). Two months after the flight, a 3D scene model was produced to help determine the real situation on the ground.
2.3. Ground Truth Data
The boundary area, without understory vegetation, is drawn on the image through a field survey in August, after the UAV flight. While conducting the field investigation, we used ArcGIS10.2 (ESRI, Redlands, CA, USA) overlay DOM images to sketch the category area with no understory vegetation. For the area covered by vegetation, the ground truth can only be determined by field investigation. The 3D scene model is used to check the ground truth. Figure 3 shows the ground truth of Area 1, and the areas in the green closed curves represent the areas without understory vegetation.
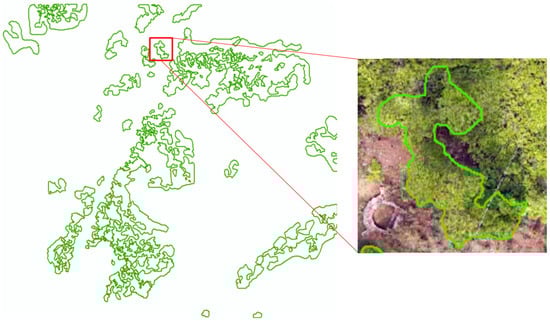
Figure 3.
Ground truth.
3. Methods
The forest vegetation structure has a great influence on water balance and rates of erosion. The understory surface of the single-layer forest is more vulnerable to precipitation [15]. According to the relevant definitions [1,2], undergrowth vegetation refers to the vegetation under trees, therefore, the first step of our method is an object-oriented classification of the vegetation structure. To avoid neglecting dotted bare soil, a segmentation algorithm for the classification of bare soil is added. Through the above two steps, the classification results include trees, bare soil and other categories.
According to Tobler’s First Law, it can be assumed that the understory vegetation coverage is similar within a certain scale. Thus, when a gap, in or between the canopies, is bare soil, the adjacent forest land can be considered a single layer, and the understory surface is bare. Conversely, when the gap, in or between canopies, is other vegetation, the adjacent forest land can be considered as multi-layer, and the understory surface is vegetated. Figure 4 provides an example for each case. Fractional vegetation coverage (FVC) is a frequently used factor to monitor soil erosion [22,23,24,25]. On the flip side, it can also be seen as a measure of the proportion of the bare soil, so we choose it as one of the factors to extract in the area without understory vegetation. Another factor is vegetation dispersion, which is used to measure the frequency of soil dotted in the canopies. The FVC and the vegetation dispersion are both used to calculate the classification features. Then, these features are input into the SVM, to discriminate the UAV images. Finally, we introduce our strategy of accuracy assessment. The overall process of the research is shown in Figure 5.
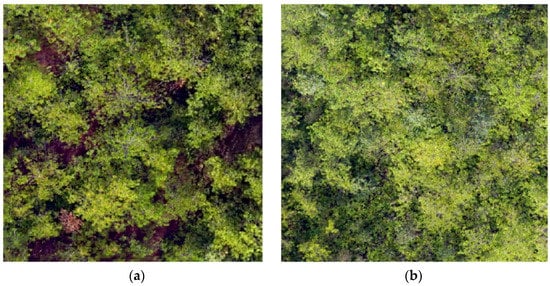
Figure 4.
Typical areas without understory vegetation and with understory vegetation. (a) is an area without understory vegetation (trees in the image). (b) is the area with understory vegetation.
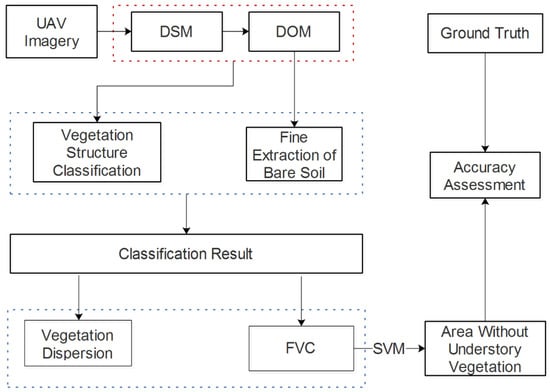
Figure 5.
Process of the research. DSM: digital surface model, DOM: digital orthophoto map, FVC: fractional vegetation coverage; SVM: support vector machine.
3.1. Object-Oriented Classification of Vegetation Structure
To determine the understory vegetation coverage, we need to mark the trees first. The method begins with a vegetation structure classification which classifies the pixels into six classes: high vegetation, low vegetation, bare soil, cropland, water, and impervious. In this paper, low vegetation refers to grasses and shrubs, while high vegetation refers to trees. The object-oriented classification method is often used to classify the forest by vegetation type [25]. Compared with the pixel-based approach, it can make use of texture structure information and reduce the impacts of isolated pixels. The process of object-oriented classification is to segment the image first and then select appropriate object features to classify the image based on the segmented object. The three parameters of segmentation, scale parameter, shape, and compactness index, are set to 30, 0.1 and 0.5, respectively. Object features can be mainly divided into spectral features, geometric features, texture features, semantic features and custom features, etc. [26]. The vegetation index reflects spectral differences [27,28]. The vegetation indices based on the red, green and blue bands of visible light include excess green index (EXG) [29], excess green-red index (EXGR) [30], visible-band difference vegetation index (VDVI) [31], normalized green-red difference index (NGRDI) [32], and red-green ratio index (RGRI), etc. Among them, EXG and NGRDI are expressed as:
where B, G, and R are the reflectivity of the ground objects in the blue, green and red bands, in the UAV images, respectively.
EXG = 2 × G − R − B
NGRDI = (G − R)/(G + R)
Gray level co-occurrence matrix (GLCM) is a classical method to extract image texture information which has been proven to be of great importance in vegetation classification. Besides, where the main difference between high vegetation and low vegetation lies in height, the DSM is chosen as one of the classification features.
In our study, the selected object features for classification are DSM, EXG, NGRDI, and GLCM, the mean value of each band and the length-width ratio, and the classifier is random forest. The RF classifier developed by Breiman [33] performs classification by extending decision trees to multiple trees rather than a single tree. Its classification performance is superior to a single decision tree, due to its ability to maximize diversity through tree ensembles. It also demonstrates greater stability, due to the synthesis of classification results from a large number of trees, and the determination of final class labels through majority voting. We choose it here for the classification, as it has better performance in stability and operation speed when used to classify forest types and tree species on UAV images [34]. The whole classification process is completed in the eCongnition Developer (Definiens Imaging, Munich, Germany).
3.2. Fine Extraction of Bare Soil
Due to the existence of under-segmentation and over-segmentation of objects, the object-oriented classification may fail to segment the scattered bare soil in or between canopies. More refined extraction results are needed to calculate forest vegetation coverage and dispersion. In this paper, the maximum likelihood model is used to extract the bare soil among the forests. This method is based on statistical theory and Bayesian criteria to determine the classification and is one of the most widely used supervised classification methods [35]. In this process, an appropriate amount of bare soil samples should be selected from the UAV image and extracted by classification, the process is completed in ENVI5.3 (Harris Crop, Bloomfield, CO, USA). After the classification, we get two categories of bare soil and non-bare soil, the bare soil category, together with other categories we get in Section 3.1, will be reserved as the final classification result for the calculation of FVC and vegetation dispersion.
3.3. Extraction of Area without Understory Vegetation
3.3.1. Calculation of Extraction Features
Forest Vegetation Coverage
Vegetation coverage is an important index to describe the distribution of surface vegetation, and also an important parameter of soil erosion evaluation. It is usually defined as the percentage of the vertical projection area of vegetation (including branches, stems and leaves) in a unit area [36]. In the high-resolution orthographic image, the mixed pixels do not need to be considered, and the forest vegetation coverage is easy to calculate. The discreteness index is defined as:
where is the pixel number of vegetation (high vegetation and low vegetation) in the window, and is the total pixel number of the window.
Vegetation Dispersion
In the high-resolution remote sensing image, we can see the exposed soil in the canopy area. This exposed soil does not distribute continuously but is discretely scattered among the forest canopy in the high vegetation area. We use the average number of change times between the bare soil and high vegetation in the neighboring area as the dispersion index. The higher the vegetation dispersion, the more likely the understory bare soil exists. The discreteness index is defined as [20]:
where is the number of pixel change times between bare soil and high vegetation in row i, is the number of changes in the pixel value in column , and respectively represent the total number of rows and columns of the window. In our preliminary study, is the number of pixel change times in row i. Considering that soil erosion, in forests, occurs in high vegetation areas, the equation has been modified to get rid of the changes between other types. Figure 6 gives an example to demonstrate how vegetation dispersion is calculated.
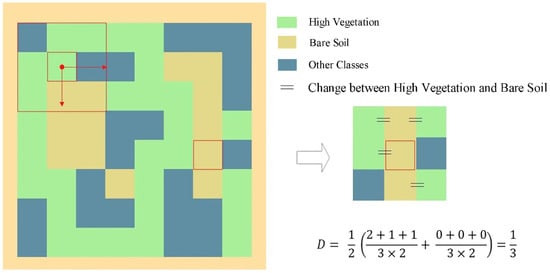
Figure 6.
Vegetation dispersion calculation.
3.3.2. Sample Selection
Per the principle of randomness and uniformity, sample points were selected covering the entire study region of the tree class. Among them, the sample points in the ground truth range are areas without understory vegetation. To mimic a case with limited available training data, 1000 pixels were randomly selected from ground truth data as an area without understory vegetation to use as sample points for training data for supervised learning. Each training sample point contains two characteristics of FVC and vegetation dispersion and, after training by SVM, the area without understory vegetation is obtained.
3.3.3. Extraction of Area without Understory Vegetation Classification
The study utilizes the SVM to extract areas, without understory vegetation, based on the factors of vegetation cover and vegetation dispersion. The SVM was first developed to deal with binary classification, and it can train and test the feature vectors and works efficiently, with unstructured and semi-structured data [27,28]. The SVM classification model training and testing were conducted with the Matlab toolbox based on the SVM framework, fitcsvm. The kernel function is polynomial. The training set and test set are divided by 10-fold cross-validation, and the crossloss is 0.013.
3.3.4. Post-Classification Processing
Because the area without understory vegetation continuously covers a certain range, rather than spatially isolated points, it is necessary to optimize the preliminary extraction results. After classification, the study filtered out small pixel patches with less than 800 connected pixels.
3.3.5. Accuracy Assessment Method
Reference areas without understory vegetation are manually digitized by a visual interpretation process of field investigation. The study evaluates the accuracy by comparing the reference data with the extraction data and evaluates the extraction performance by three metrics, including precision, recall and the F1_score. Precision, recall and the F1_Score are defined as follows [36].
where TP is True Positive: the prediction is positive, and the ground truth result is positive too; where FP is False Positive: the prediction is positive, and the ground truth result is negative; where FN is False Negative: the prediction is negative, and the ground truth result is positive; where TN is True Negative: the prediction is negative, and the ground truth result is negative too. Where the result of F1 is greater, it means that the prediction image is more similar to the ground truth provided.
3.4. Calculation of Vegetation Coverage
The conventional vegetation coverage relates the percentage of the vertical projection area of vegetation on the ground, to the total area of the statistical area, in high-resolution UAV images. The conventional vegetation coverage can be calculated as:
where is the pixel number of green vegetation pixels, and is the sum pixel number of high vegetation and low vegetation. is the total pixel number of the area.
When concerning understory bare soil, vegetation coverage can be calculated as Formula (9), and proportion of bare soil under forest (where the upper layer is canopy and the surface layer is bare soil) can be calculated as Formula (10).
where is the number of pixels whose surface layer are not covered by bare soil, is the number of pixels whose surface layer are covered by bare soil.
4. Results
4.1. Classification Result
Keeping the classification of the fine extraction of bare soil as the final result for bare soil, and using the object-oriented classification of vegetation structure as other classes’ results, we get the final classification results (Figure 7). Through the field survey of the study area, it is found that the types of ground objects in the study area can be divided into high vegetation, low vegetation, bare soil, cropland, water, and impervious. The classification category includes the most typical land types in South China and thus is applicable in other regions. The pixel-based method can extract bare soil pixels in and between canopies, while the object-oriented method can extract other categories which have strong spatial coherence and compactness. It can be seen from Figure 7 that the bare soil (except roads) extracted by the combination of object-oriented and pixel classification is fine, and scattered bare soil has been extracted, while other categories such as water, buildings and vegetation have strong integrity.
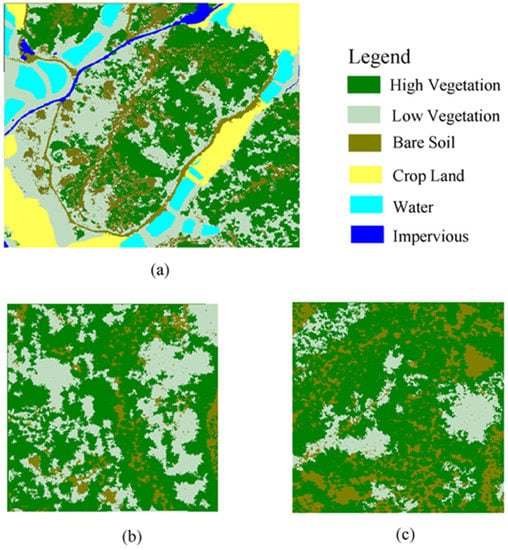
Figure 7.
Classification results of three areas. (a–c) are the classification results of study area 1, 2 and 3, respectively.
Good classification results can lead to a more accurate calculation result from extraction features, so it is necessary to verify the accuracy of classification results. By field survey, we get samples of high vegetation, low vegetation area, bare soil, cultivated land, water bodies and impervious. More than 1200 uniformly distributed sample points were randomly selected from the high-resolution map to evaluate the accuracy of the classification. The accuracy evaluation result is shown in Table 1. The overall accuracy of the classification is 89.8%. The accuracy of producer and user in high vegetation areas is 85.5% and 86.9%, respectively, and in low vegetation, areas are 83.1% and 82.2%, respectively. The classification accuracy of impervious surface and water area is 100% for both producers and users. A small amount of high vegetation is misclassified into low vegetation due to their small inter-class difference. Furthermore, vegetation shadows and other geo-objects in shadows are misclassified as bare soil in the classification process.

Table 1.
Accuracy assessment of vegetation structure classification accuracy. Unit: number of pixels.
4.2. Results of FVC and Vegetation Dispersion
To avoid the interference of non-forest land types on the extraction results, the study only extracts the vegetation coverage in forest areas. The extracted FVC reflects the surface vegetation coverage. When the vegetation around the pixel is dense, the FVC value is higher, and when there is more bare soil around the pixel, the FVC value is lower. A value of 1 indicates that all pixels in the neighborhood are vegetation, and a value of 0 indicates that all pixels in the neighborhood are bare soil. The vegetation coverage increases with vegetation density. The area with high vegetation dispersion shows violent fluctuation in FVC. Figure 8 shows the vegetation coverage and dispersion when the window size is 501. It can be seen that two factors show some differences: the pixel with high vegetation coverage may not have high vegetation dispersion. This indicates that the correlation between the two factors is not high, and they have different information that can be used to estimate the understory vegetation.
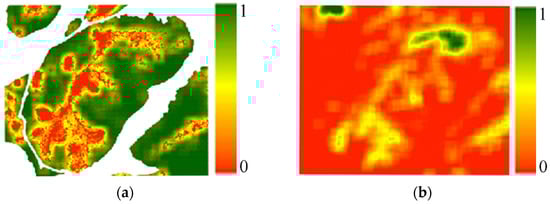
Figure 8.
FVC and vegetation dispersion results. (a) FVC result. (b) Vegetation dispersion result.
4.3. Extraction Results
4.3.1. Extraction of Area without Understory Vegetation
In this study, SVM is used to establish a two-classification model of undergrowth vegetation coverage based on spatial distribution characteristics. The values of two factors of an area with understory vegetation and an area without understory vegetation (Figure 9) show different statistical characteristics. The area with understory vegetation shows higher FVC and lower dispersion, while the area without understory vegetation shows the opposite.
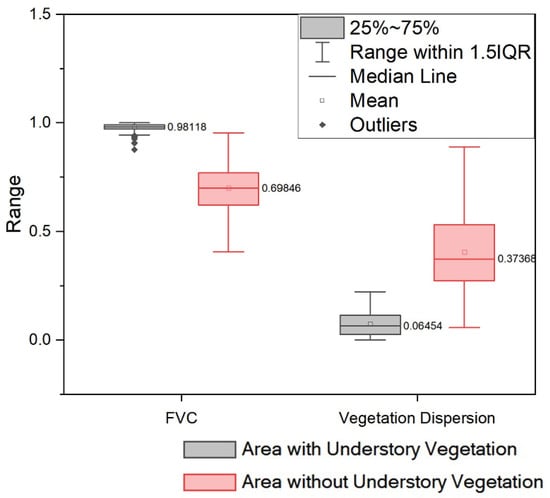
Figure 9.
Box Plots of FVC and vegetation dispersion, calculated by sample points we selected. The FVC of the area with understory vegetation and the area without understory vegetation ranged between 0.97 and 0.99, and 0.69 and 0.76, respectively, and the median of each is 0.98 and 0.70. The vegetation dispersion of area with understory vegetation and area without understory vegetation range between 0.07 and 0.11, and 0.40 and 0.53, respectively, and the median of each is 0.05 and 0.37.
The extraction result is shown in Figure 10. There is a strong spatial proximity between bare soil and the area without vegetation under the forest when the forest is high vegetation. The spatial proximity between the bare soil around the low vegetation area and the area without vegetation under the forest is not high.
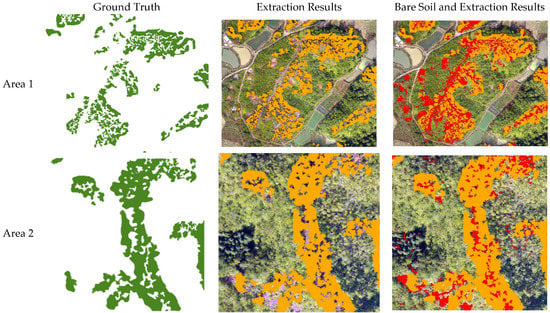
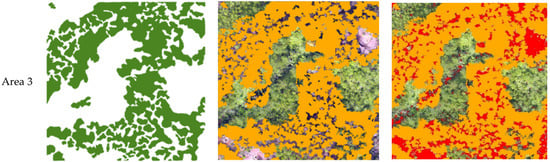
Figure 10.
Extraction result of the study area (the green, orange and red color area represents ground truth, area without understory vegetation and bare soil, respectively).
The extraction process and details when the window size is 501 are shown in Figure 11. The original UAV images to be extracted (Figure 11a) include bare soil, trees and shrubs, and the canopy contour of trees is complex. The black part of the ground truth (Figure 11b) represents the area without understory vegetation. The area with understory vegetation coverage (Figure 11c) shows a high value in the vegetation region but a low value in the area without understory vegetation.
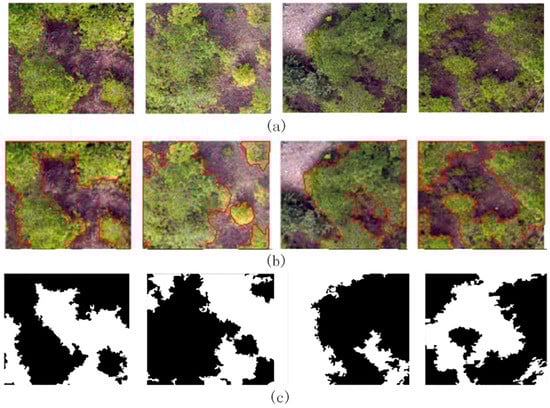
Figure 11.
Examples of extraction progress and results. (a) is the RGB images of UAV images. (b) area in the red closed curves is the ground truth. (c) black area represents area without understory vegetation extraction results.
4.3.2. Accuracy of Extraction Result
The extraction results are listed in Table 2. The Pr value of the three areas is 85.99%, 88.85%, and 90.90%, respectively. The Re value of the three areas is 89.47%, 91.02%, and 81.46%, respectively, and the F1 value of the three areas is 87.69%, 89.92%, and 91.19%, respectively.
Table 2.
Accuracy of the area without understory vegetation extraction results.
4.3.3. Coverage Vegetation Result
Vegetation coverage results are shown in Table 3. The vegetation coverage calculated by the conventional method of the three areas is 72.28%, 97.15% and 89.95%, respectively. While the vegetation coverage with undergrowth vegetation is 51.88%, 77.17% and 48.29%, respectively. Vegetation coverage without undergrowth vegetation is 20.40%, 19.98% and 41.69%, respectively.
Table 3.
Vegetation coverage results.
5. Discussion
5.1. Extraction of Area without Understory Vegetation
In this study, we developed an effective approach for extracting areas without understory vegetation. And we found the proportion of bare soil under forest is 20.40%, 19.98% and 41.69%, respectively in our study. The difference is large enough to affect the understanding of the local soil erosion situation. By taking advantage of UAV data’s high spatial resolution, we captured the spatial structure information of an area without an understory forest. UAV workflow has the potential to generate realistic old-growth forest attributes by a very complex structure and achieve similar accuracy to LiDAR products [37].
Our study identified and dealt with some critical limitations regarding understory vegetation and the overall forest vertical structure of the forest that was not easily detectable. Photogrammetry is limited to reconstructing surfaces visible from above in the image data [38]. However, by integrating environmental context areas without understory forests that may occur beside bare soil in the forest into the analysis, we get a good detection result.
5.2. Factors Impact Extraction Results
5.2.1. Window Size of FVC and Vegetation Dispersion
The window size of FVC and vegetation dispersion have a great impact on the extraction results. The window scale needs to be large enough to avoid broken results, but too large a window size will result in indistinguishable objects. By investigation, it was found that the crown of a tree was three to four meters in the study. Thus, FVC and vegetation dispersion window sizes of 167, 333, 501, 667 and 833 are tested. The five window sizes are the crown sizes of one to five trees respectively. Experiments show that the extraction effects of different window sizes are different (Figure 12). Among the five window sizes, the extraction accuracy increases when the window size is smaller than 501 and decreases when it is larger than 501. When the window size is 501, the extraction effect is relatively the best, the Pr, Re and F1 are 85.99%, 89.47% and 87.69%. When the window size is 167, 333, 667 and 833, Pr is 66.76%, 78.84%, 74.93% and 62.02%, respectively. Re is 79.46%, 82.89%, 85.59% and 83.32%, respectively. F1 is 72.56%, 80.81%, 81.61% and 73.54%, respectively.
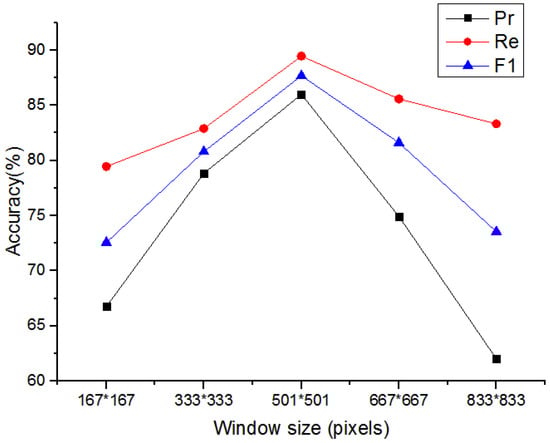
Figure 12.
Extraction accuracy of different window sizes (in the horizontal axis, 167*167, 333*333, 501*501, 667*667, and 833*833 represents pixel number of the length and width of the window are all 167, 333, 501, 667 and 833, respectively).
The above experiment proves that the extraction accuracy is relatively high when the window size is 501 and is exactly three trees’ crown diameters. Because the average canopy size of vegetation growth in different regions is different, this selected window size is probably specific to the study area and may not be suitable for other areas. However, it should be noted that the size of three crowns is considered to be the most suitable window size in this experiment. The selected factors are rooted in the concept of understory vegetation in forested areas. Therefore, if the window size is appropriate, the area without understory vegetation in other areas can be identified.
5.2.2. The Importance of Vegetation Dispersion
Vegetation dispersion reflects the dispersion degree of bare soil in the canopy, and its higher value means that the bare soil we can see in the crisscross of complicated branches. This index perfectly interprets the spatial structure of ground objects, which is conducive to the extraction of understory vegetation. To verify the effectiveness of this index, we compare the extraction results using only FVC, with using both FVC and vegetation dispersion, and we find that the extraction accuracy results (Table 4) of the area without understory vegetation in three regions is lower than two features’ extraction. The Pr’s increase in value of the three regions is 2.61%, 2.7%, and 0.69%, respectively. The Re’s increase in value of the three regions is 14.89%, 17.43%, and 9.2%, respectively. The F1′s increase in value of the three regions is 8.95%, 10.53%, and 4.69%, respectively. The accuracy of double feature classification is improved by 17.43% at most, and 0.69% at least, over that of single feature classification. According to the black labels in Figure 13, it can be seen that double feature extraction can effectively extract areas without understory vegetation with scattered bare soil hidden in the crown while single feature extraction will omit some areas without understory vegetation around a small amount of bare soil.
Table 4.
Single and double feature extraction accuracy.
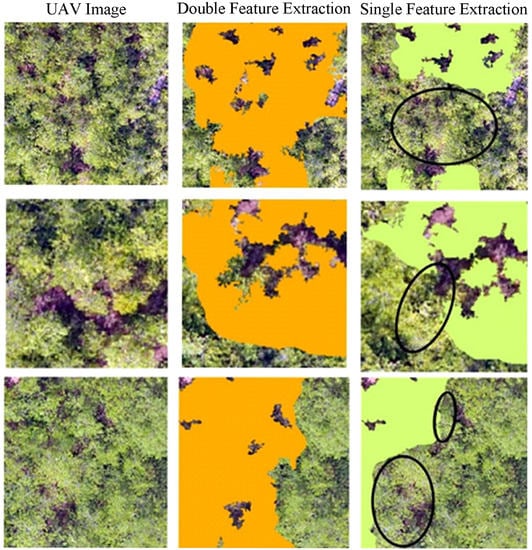
Figure 13.
Comparison of two extraction results.
5.2.3. Other Factors
FVC and vegetation dispersion of the experiment are calculated based on vegetation structure classification results, so their accuracy is very important for the extraction of understory vegetation, while the accuracy of these classifications is also affected by the spectral resolution of UAV images and classification method. Moreover, according to the above experiments, different window sizes of FVC and vegetation dispersion will have different extraction effects.
As vegetation grows higher, some bare ground surface is easily blocked by shadows, which reduces the recognition rate of understory vegetation. It should be noted that when the canopy density of the forest is very high, the canopy covers each other so there is no gap between the forests, meaning that the real understory situation may be confused.
6. Conclusions
This paper presents a method for surveying and extracting forest areas, without understory vegetation, using ultra-high-resolution UAV images. The method mainly extracts areas, under forest, based on the vegetation structure, and spatial distribution characteristics, of the bare soil. This study proves that it is feasible to extract areas under forest using UAV ultra-high-resolution images combining vegetation coverage and vegetation dispersion. The accuracy of the experimental result is more than 85%. The outcomes of this paper are useful from both a management and ecological perspective: it allows relevant managers to map the area without under forest with high spatial accuracy and a quick speed and reveals the large overestimation of vegetation coverage coming from the ignorance of understory water and soil loss by conventional methods based on remote sensing images. Furthermore, the method can provide a reference for the extraction of real vegetation coverage from remote sensing images with lower resolution. However, due to the complexity and spatial heterogeneity of the forest structure, how to more effectively separate the bare soil under forest from the canopy above the forest is still crucial to invert understory vegetation from remote sensing data. In the future, the information from multi-angle observation, forest phenology and spatial distribution characteristics of UAV images may be used together to recognize areas without understory vegetation.
Author Contributions
C.H.: Conceptualization, Methodology, Writing—original draft; J.L.: Conceptualization, Investigation, Writing—original draft; Y.D.: Conceptualization, Methodology, Investigation, writing—review & editing; P.C.: Methodology, Investigation; X.B.: writing—review & editing. All authors have read and agreed to the published version of the manuscript.
Funding
This research was funded by The Strategic Priority Research Program of the Chinese Academy of Sciences (XDA19030101) and the Fujian Water Conservancy Science and Technology Project (MSK202011).
Data Availability Statement
Not applicable.
Conflicts of Interest
The authors declare no conflict of interest.
References
- Chastain, J.R.; Currie, W.S.; Townsend, P.A. Carbon sequestration and nutrient cycling implications of the evergreen understory layer in Appalachian forests. For. Ecol. Manag. 2006, 231, 63–77. [Google Scholar] [CrossRef]
- Zhu, X.; He, Z.B.; Du, J. Function and Composition of Understory Vegetation: Recent Advances and Trends. World For. Res. 2014, 27, 7. [Google Scholar] [CrossRef]
- Li, G.; Wan, L.; Cui, M.; Wu, B.; Zhou, J. Influence of Canopy Interception and Rainfall Kinetic Energy on Soil Erosion under Forests. Forests 2019, 10, 509. [Google Scholar] [CrossRef]
- Zhang, H.; Yu, D.; Dong, L. Regional soil erosion assessment from remote sensing data in rehabilitated high density canopy forests of southern China. Catena 2014, 123, 106–112. [Google Scholar] [CrossRef]
- Gabriels, D. Slope Stabilization and Erosion Control. A Bioengineering Approach. Catena 1996, 28, 153–154. [Google Scholar] [CrossRef]
- Yuan, Z.J.; MA, D.F.; Nie, X.D.; Liao, Y.S.; Huang, B.; Zhuo, M.N. Progress in Research on Prevention and Control of Soil Erosion Under Forest in Red Soil Hilly Region of South China. Acta Pedol. Sin. 2020, 57, 12–21. [Google Scholar]
- Zhong, M.W.; Lees, B.G.; Feng, J.; Wan, N.L.; Hai, J.S. Stratified vegetation cover index: A new way to assess vegetation impact on soil erosion. Catena 2010, 83, 87–93. [Google Scholar] [CrossRef]
- Sorriso-Valvo, M.; Bryan, R.B.; Yair, A.; Iovino, F.; Antronico, L. Impact of afforestation on hydrological response and sediment production in a small Calabrian catchment. Catena 1995, 25, 89–104. [Google Scholar] [CrossRef]
- Borrelli, P.; Robinson, D.A.; Fleischer, L.R.; Lugato, E.; Ballabio, C.; Alewell, C.; Meusburger, K.; Modugno, S.; Schütt, B.; Ferro, V.; et al. An assessment of the global impact of 21st century land use change on soil erosion. Nat. Commun. 2017, 8, 2013. [Google Scholar] [CrossRef]
- Wulder, M.A.; Hall, R.J.; Coops, N.C.; Franklin, S.E. High Spatial Resolution Remotely Sensed Data for Ecosystem Characterization. BioScience 2004, 54, 511–521. [Google Scholar] [CrossRef]
- Tuanmu, M.N.; Viña, A.; Bearer, S.; Xu, W.; Ouyang, Z.; Zhang, H.; Liu, J. Mapping understory vegetation using phenological characteristics derived from remotely sensed data. Remote Sens. Environ. 2010, 114, 1833–1844. [Google Scholar] [CrossRef]
- Xu, H.; Hu, X.; Guan, H.; Zhang, B.; Wang, M.; Chen, S.; Chen, M. A remote sensing based method to detect soil erosion in forests. Remote Sens. 2019, 11, 513. [Google Scholar] [CrossRef]
- Zhou, H.; Fu, L.; Sharma, R.P.; Lei, Y.; Guo, J. A hybrid approach of combining random forest with texture analysis and VDVI for desert vegetation mapping Based on UAV RGB Data. Remote Sens. 2021, 13, 1891. [Google Scholar] [CrossRef]
- Zhu, X.; Wang, X.; Zhou, X. An identification method of understory vegetation cover using UAV remote sensing in visible light band. J. Fuzhou Univ. Nat. Sci. Ed. 2018, 46, 814–820. [Google Scholar]
- Linderman, M.; Liu, J.; Qi, J.; An, L.; Ouyang, Z.; Yang, J.; Tan, Y. Using artificial neural networks to map the spatial distribution of understorey bamboo from remote sensing data. Int. J. Remote Sens. 2004, 25, 1685–1700. [Google Scholar] [CrossRef]
- Wang, T.J.; Skidmore, A.K.; Toxopeus, A.G. Improved understorey bamboo cover mapping using a novel hybrid neural network and expert system. Int. J. Remote Sens. 2009, 30, 965–981. [Google Scholar] [CrossRef]
- Vierling, K.T.; Vierling, L.A.; Gould, W.A.; Martinuzzi, S.; Clawges, R.M. Lidar: Shedding new light on habitat characterization and modeling. Front. Ecol. Environ. 2008, 6, 90–98. [Google Scholar] [CrossRef]
- Martinuzzi, S.; Vierling, L.A.; Gould, W.A.; Falkowski, M.J.; Evans, J.S.; Hudak, A.T.; Vierling, K.T. Mapping snags and understory shrubs for a LiDAR-based assessment of wildlife habitat suitability. Remote Sens. Environ. 2009, 113, 2533–2546. [Google Scholar] [CrossRef]
- Hill, R.A.; Broughton, R.K. Mapping the understorey of deciduous woodland from leaf-on and leaf-off airborne LiDAR data: A case study in lowland Britain. ISPRS J. Photogramm. Remote Sens. 2009, 64, 223–233. [Google Scholar] [CrossRef]
- Chai, P.; Dong, J.; Liu, J.; Ding, Y. Study on the extraction method of soil erosion area under forest in southern red soil area based on UAV remote sensing image. Subtrop. Soil Water Conserv. 2022, 34, 1–5, 33. [Google Scholar]
- Blanco-Canqui, H.; Lal, R. Soil Erosion under Forests; Springer: Dordrecht, The Netherlands, 2010. [Google Scholar]
- Dai, Q.; Peng, X.; Wang, P.J. Surface erosion and underground leakage of yellow soil on slopes in karst regions of southwest China. Land Degrad. Dev. 2018, 29, 2438–2448. [Google Scholar] [CrossRef]
- Panagos, P.; Borrelli, P.; Meusburger, K.; Alewell, C.; Lugato, E.; Montanarella, L. Estimating the soil erosion cov-er-management factor at the European scale. Land Use Policy 2015, 48, 38–50. [Google Scholar] [CrossRef]
- Yang, X.H. Deriving RUSLE cover factor from time-series fractional vegetation cover for hillslope erosion modelling in New South Wales. Soil Res. 2014, 52, 253–261. [Google Scholar] [CrossRef]
- Zhang, X.; Feng, X.; Jiang, H. Object-oriented method for urban vegetation mapping using IKONOS imagery. Int. J. Remote Sens. 2010, 31, 177–196. [Google Scholar] [CrossRef]
- Benz, U.C.; Hofmann, P.; Willhauck, G. Multi-resolution, object-oriented fuzzy analysis of remote sensing data for GIS-ready information. ISPRS J. Photogramm. Remote Sens. 2004, 58, 239–258. [Google Scholar] [CrossRef]
- Feng, Q.; Liu, J.; Gong, J. UAV remote sensing for urban vegetation mapping using random forest and texture analysis. Remote Sens. 2015, 7, 1074–1094. [Google Scholar] [CrossRef]
- Bian, X.; Ma, Q.; Liu, C. Vegetation coverage calculation based on low altitude visible spectrum. Bull. Soil Water Conserv. 2017, 37, 270–275. [Google Scholar]
- Woebbecke, D.M.; Meyer, G.E.; Von, B.K.; Mortensen, D.A. Color indices for weed identification under various soil, residue, and lighting conditions. Trans. Am. Soc. Agric. Eng. 1995, 38, 259–269. [Google Scholar] [CrossRef]
- Meyer, G.E.; Netob, J.C. Verification of color vegetation indices for automated crop imaging applications. Comput. Electron. Agric. 2008, 63, 282–293. [Google Scholar] [CrossRef]
- Gitelson, A.A.; Kaufman, Y.J.; Stark, R.; Rundquist, D. Novel algorithms for remote estimation of vegetation fraction. Remote Sens. Environ. 2002, 80, 76–87. [Google Scholar] [CrossRef]
- Zhou, R.; Yang, C.; Li, E.; Cai, X.; Yang, J.; Xia, Y. Object-Based Wetland Vegetation Classification Using Multi-Feature Selection of Unoccupied Aerial Vehicle RGB Imagery. Remote Sens. 2021, 13, 4910. [Google Scholar] [CrossRef]
- Thakkar, A.K.; Desai, V.R.; Patel, A.; Potdar, M.B. Post-classification corrections in improving the classification of Land Use/Land Cover of arid region using RS and GIS: The case of Arjuni watershed, Gujarat, India. Egypt. J. Remote Sens. Space Sci. 2017, 20, 79–89. [Google Scholar] [CrossRef]
- Breiman, L. Random forests. Mach. Learn. 2001, 45, 5–32. [Google Scholar] [CrossRef]
- Jia, K.; Yao, Y.; Wei, X. A review on fractional vegetation cover estimation using remote sensing. Adv. Earth Sci. 2013, 28, 774–782. [Google Scholar]
- Zhang, L.; Niu, Y.; Zhang, H. Maize canopy temperature extracted from UAV thermal and RGB imagery and its application in water stress monitoring. Front. Plant Sci. 2019, 10, 1270. [Google Scholar] [CrossRef]
- Roşca, S.; Suomalainen, J.; Bartholomeus, H.; Herold, M. Comparing terrestrial laser scanning and unmanned aerial vehicle structure from motion to assess top of canopy structure in tropical forests. Interface Focus 2018, 8, 20170038. [Google Scholar] [CrossRef]
- Iglhaut, J.; Cabo, C.; Puliti, S.; Piermattei, L.; O’Connor, J.; Rosette, J. Structure from Motion Photogrammetry in Forestry: A Review. Curr. For. Rep. 2019, 5, 155–168. [Google Scholar] [CrossRef]


Disclaimer/Publisher’s Note: The statements, opinions and data contained in all publications are solely those of the individual author(s) and contributor(s) and not of MDPI and/or the editor(s). MDPI and/or the editor(s) disclaim responsibility for any injury to people or property resulting from any ideas, methods, instructions or products referred to in the content. |
© 2023 by the authors. Licensee MDPI, Basel, Switzerland. This article is an open access article distributed under the terms and conditions of the Creative Commons Attribution (CC BY) license (https://creativecommons.org/licenses/by/4.0/).