Article

The Construction of Ecological Security Pattern under Rapid Urbanization in the Loess Plateau: A Case Study of Taiyuan City

1
College of Urban and Rural Construction, Shanxi Agricultural University, Jinzhong 030801, China
2
College of Environmental Science and Engineering, Hunan University, Changsha 410082, China
3
Key Laboratory of Subsurface Hydrology and Ecological Effects in Arid Region, Ministry of Education, Chang’an University, Xi’an 710054, China
4
Xi’an Monitoring, Modelling and Early Warning of Watershed Spatial Hydrology International Science and Technology Cooperation Base, Chang’an University, Xi’an 710054, China
5
School of Water and Environment, Chang’an University, Xi’an 710054, China
*
Author to whom correspondence should be addressed.
Remote Sens. 2023, 15(6), 1523; https://doi.org/10.3390/rs15061523
Submission received: 17 January 2023 / Revised: 3 March 2023 / Accepted: 7 March 2023 / Published: 10 March 2023

Abstract

:
Taiyuan City in the eastern Loess Plateau has experienced severe ecological problems caused by urban expansion. For cities undergoing rapid urbanization, building an ecological security pattern (ESP) is an effective means to improve urban resilience. Here, geographic information systems (GIS) were used to analyze, manipulate, and visualize urban ecological multi-source information and remote sensing (RS) for the history of land use/land-cover (LULC) changes and the structure of the urban ecological system. Four important ecosystem service functions were estimated: soil conservation, habitat quality, water yield, and carbon storage. The minimum cumulative resistance (MCR) model was combined with the circuit theory method to determine the ecological corridors, pinch points, and barrier points. Our results showed that: (1) from 1980 to 2020, Taiyuan’s built-up area showed increased construction land and enhanced landscape fragmentation. The decline in cultivated land was mainly attributed to construction land. During the period from 2000 to 2010, a greater amount of land was changed in Taiyuan than in other periods; (2) The ecosystem service evaluation based on the LULC in 2020 revealed that the central urban area was lower than the other areas; (3) 38 ecological source sites were identified, accounting for 16% of the total study area. An area of 106 km2 was allocated to construct 79 ecological corridors. We identified 31 ecological pinch points and 6 ecological barrier points; (4) an ESP optimization governance model of “two rings, four zones, and nine corridors” was proposed. Our study provides theoretical guidance for sustainable development and ecological design in Taiyuan City and other regions.

Graphical Abstract

1. Introduction

Human activity directly affects the natural ecosystem of the Earth’s land surface through land use/land-cover (LULC) change [1,2]. Globally, LULC changes are as old as human activity [3]. Recently, the rate of changing differs from that of earlier changes [4]. Rapid urbanization has promoted the proliferation of urban space; most agricultural and ecological land areas have already been converted to construction land, and unnatural landscape elements have increased dramatically [5,6,7]. As a result, environmental problems, including ecological patch fragmentation, air pollution, biodiversity reduction, water shortages [8,9], and heat islands [10] have affected the landscape pattern and urban ecological security [11,12,13]. There is a complex interactive coupling relationship between urbanization and the ecological environment. How to regulate the relationship between urbanization and the ecological environment has become a worldwide scientific problem and a global strategic problem. In the critical transition period of China’s urbanization development from high speed to high quality, it is an urgent need to study the urbanization process and ecological environment response pattern to provide a scientific basis for regional high-quality development and ecological environment protection in the face of national strategic needs.
It is important to build ecological security patterns (ESPs) to ensure ecological security, maintain ecosystem function, and balance the relationship between economic development and ecological, environmental protection [14,15,16]. ESPs originate from the coupling method of spatial patterns and ecological processes in the research of landscape, which focuses on ecological patterns of potential landscape [17]. Some nodes, patches, corridors, and entire habitats that contribute to the maintenance and control of certain ecological processes are considered key ecological elements. ESPs construction can perform spatial identification, restoration, and reconstruction of these key ecological elements to improve landscape patterns, achieve effective regulation of specific ecological processes, and significantly enhance ecological benefits [18]. For example, Chai et al. [19] explored the relationship between ecological security and urbanization in the Wuhan City Circle during 2005–2018 using Landsat-TM/ETM and Landsat-8 images; based on a time series of multi-source RS data, Wang et al. [20] used pressure–state–response (P–S–R) model to construct Beijing ecological security assessment during 1995–2015; using multi-source RS data, Xu et al. [21] analyzed the interactive coupling mechanism between eco-environmental quality and urban development in China’s eastern regions. Through the rational allocation of regional natural resources, achieving point, line, and surface multi-category, multi-level spatial element layout optimization effectively regulates and controls the ecological process so as to maintain a sustainable ecological security state.
Currently, the construction of ESPs mainly includes ecological source identification, resistance surface construction, and ecological corridor identification [22]. The basis of building an ESPs is to identify ecological sources and extract ecological corridors. Identifying the ecological sources is mainly based on the quantification of ecological importance, and its quantitative indicators are primarily focused on a certain ecological field; thus, the indicators must be improved. The minimum cumulative resistance (MCR) model is one of the technical methods determining the ecological corridor because it can systematically consider the relationship across internal land cover units [23]. However, the MCR model is challenging to identify the key nodes in the corridor. With the support of circuit theory, the ecological flow has been compared to the current in physics, trying to simulate the movement of species in complex ecological networks. It has made certain progress in ESP research [22,24,25]. Coupling with MCR Model, the circuit theory is used to identify areas that need to be protected and restored in the ecological corridor. It is a new way for the future construction of regional ESPs.
The Loess Plateau is an important part of the ESP of China’s “two screens and three belts”, and it is also the most prominent ecology of the contradiction between humans and land. This region has been affected by human activities and climate change, with serious ecological damage, and the coordinated development of urbanization and the ecological environment has been widely concerned. In addition, the Loess Plateau is not only the key area and demonstration area of the project of converting farmland to forests but also an important part of the high-quality development of the Yellow River basin [26]. More research has been conducted on the impact of vegetation cover changes on ecosystem services [27,28,29], while less research has been conducted on the relationship between urban expansion and ESPs. Taiyuan City is located in the eastern part of the Loess Plateau. As the capital of Shanxi Province, the urban expansion of Taiyuan has severely impacted ESPs. The harsh ecological background and distinctive mountainous topography have influenced urban development trends, leading to the rapid expansion of the central area, disruption of ecological links between the east and west ends, and serious challenges for urban biodiversity conservation. Our study aimed to: (1) analyze the history of LULC changes in Taiyuan City based on RS data from 1980 to 2020; (2) identify ecological source areas based on ecosystem service evaluation results (soil conservation, habitat quality, water yield, and carbon storage); (3) perform a resistance surface based on slope, elevation, LULC, normalized difference vegetation index (NDVI), and habitat quality; and (4) build the ecological corridors using the MCR Model and circuit theory and determining the key areas of ecological security to protect. Our study provides theoretical guidance for sustainable development and ecological design in Taiyuan City and provides a theoretical reference for the study of urban landscape evolution and ecological security pattern optimization.

2. Materials and Methods

2.1. Study Area

Taiyuan City (111°30′–113°09′E, 37°27′–38°25′N) is distributed in the central part of Shanxi Province (Figure 1) and the eastern part of the Loess Plateau. Its east, west, and north are surrounded by mountains. Taiyuan City is the most important energy and heavy industry base in China, making substantial contributions to the modernization of construction in China with an important strategic position. The Fen River, as the second major tributary of the Yellow River, flows through Taiyuan City [30]. There are more tributaries, albeit with a small flow, that is evenly distributed in each administrative district. The climate in Taiyuan City is affected by monsoons. The mean annual precipitation is 450 mm. There are six districts (Yingze, Xinghualing, Jiancaoping, Wanbolin, Jinyuan, and Xiaodian), three counties in the territory (Yangqu, Loufan, and Qingxu), and a county-level city (Gujiao).

2.2. Data Description

The detailed data sources of this study are shown in Table 1. After processing by ArcGIS 10.8, the slope, elevation, and watershed data were obtained. The LULC data (Landsat-5 TM and Landsat-8 OLI) for 1980, 1990, 2000, 2010, and 2020 were classified into five categories (cultivated, woodland, grassland, water, and unused land). NDVI was calculated using Landsat bands in ArcGIS 10.8.

2.3. Methods

2.3.1. Analytical Steps

Figure 2 illustrates the technical flow of this study. We adopted an integrated workflow incorporating RS data to explore long-term LULC changes in Taiyuan City during 1980–2020, summarized the spatial evolution of LULC, and accurately identified the city’s ecological and environmental problems. LULC and ecosystem services were evaluated to identify and determine ecological sources. A comprehensive resistance surface was constructed using GIS. Furthermore, ecological corridors were built using the MCR model and circuit theory to determine the pinch and obstacle areas. Finally, we constructed an ecological security pattern for Taiyuan.

2.3.2. Landscape Transition Matrix

It is composed of rows and columns representing land types for different periods, of which the behavior is Phase I and the column is Phase II in the land use transfer matrix.
S i j = S 11   S 12 S 1 n S 21   S 22 S 2 n       S n 1   S n 2 S n n
where S stands for land area; n represents the number of LULC; i and j represent the LULC before and after the transfer, respectively; and Sij is the percentage of area converted from i to j in the total land area from Phase I to Phase II.

2.3.3. LULC Dynamic Degree

Within the study period, the single LULC dynamic degree (K) showed the amount of change in a particular type of LULC and reflected the speed of change. The higher the value is, the faster the type changes. The K is given by [31,32]:
K = U b U a U a × 1 T × 100 %
where K represents the dynamic degree of a certain LULC; Ub and Ua represent the quantity of a certain LULC at the end and beginning from 1980 to 2020, respectively; and T represents the time interval.
LULC dynamics are characterized by a change in the overall LULC over a given period of time, reflecting the changes in regional LULC [33]. The formula is:
L C = i = 1 n Δ L U i j 2 i = 1 n = L U i × 1 T × 100 %
where LC represents the comprehensive degree of LULC dynamics; LUi represents the area of class i land during the initial year; ΔLUi−j represents the absolute value of the area converted from class i to j within the study period; and T represents the time interval.

2.3.4. Soil Conservation Assessment

A modified universal soil loss equation was applied to estimate the soil conservation service function and estimate potential and actual soil erosion. The formula is:
A c = R × K × L S R × K × L S × C × P
where Ac stands for soil loss per year; R is the effect of precipitation on soil erosion; K is the soil erodibility factor; LS is the slope length (L) and steepness (S); C is the effect of cropping and management; and P is the support practice factor. We obtained C and P values from [34].
The precipitation erosion factor (R) was calculated by Wischmeier’s model. The formula used is as follows:
R = i = 1 12 1.735 × 10 1.5 lg P a 2 P 0.08188  
where P is the mean annual precipitation (mm) and Pa is the mean monthly precipitation (mm).
In this study, calculations were performed according to the characteristics of soil particle size composition and organic carbon (SOC) content. The K is given by Equation (6), as follows:
K = 1 7.6 0.2 + 0.3 e x p 0.0256 S A N 1 S I L 100 × S I L C L A + S I L 0.3 × 1 0.25 C + e x p 3.72 2.95 C × 1 0.7 S N S N + e x p 22.9 S N 5.51
where SN = 1 − SAN/100; SAN, SIL, CLA, and C represent the composition percentages of sand, silt, clay, and organic carbon in the soil, respectively.
Soil erosion is directly influenced by topography (i.e., LS). The LS factor calculations are given in Equation (7) as follows:
L = ( φ 22.1 ) m ;   m { 0.2 ,   θ 1 ° 0.3 ,   1 ° < θ 3 ° 0.4 ,   3 ° < θ 5 ° 0.5 ,   θ > 5 ° ;   S = 10.8 sin θ + 0.036 ,   θ < 5 ° 16.8 s i n θ 0.5 ,   5 ° θ < 10 °   21.9 sin θ 0.96 ,   θ 10 °
where φ represents the non-cumulative slope length (m); m represents the slope-length exponent; and θ represents the slope.

2.3.5. Habitat Quality Assessment

The habitat quality module considers the distance weights of threat factors (r) when connecting LULC with threats [35,36]. According to the following equation, the stresses level (i) is calculated:
i r x y = 1 d x y d r m a x ( i f   L i n e a r )  
i r x y = e x p 2.99 d r m a x i f   e x p o n e n t i a l
where x and y are both grids; d is the linear distance; drmax is the maximum impact distance on the habitat. Habitat degradation degree (D) is as follows:
D x j = r = 1 R y = 1 Y r ( w r r = 1 R w r ) × r y × i r x y × β x × S j r
where R represents the number of r; Yr represents the total number of r grid cells; Wr is the weight of the r; ry is the number of stress factors; β is the legal accessibility, and Sj represents the sensitivity of land use type j, ranging from 0 to 1. The larger value represents the more sensitive value.
The habitat quality index (Qxj) is as follows:
Q x j = H j 1 D x j z D x j z + K z
where x and j are the grid and LULC, respectively; H is the habitat suitability of LULC; D is the habitat degradation degree; K is the semi-saturation constant; and z is a normalization constant. Qxj range is 0–1, where a higher value indicates a better habitat quality.

2.3.6. Water Yield Assessment

Water yield is not only an important type of ecosystem service but also the basis of many ecological processes and ecological service functions. It affects ecological functions, maintains ecosystem stability, and improves human well-being [37]. According to the climate, topography, LULC, and soil type, the water yield module in the InVEST model calculates the amount of water that will be produced in each grid cell within the watershed [38]. In each grid cell, precipitation (P) is subtracted from the actual evapotranspiration (AET) to determine the amount of water produced. According to the following equation, the annual water yield Y(x) was calculated:
Y x = 1 A E T x P x × P x
The AET(x)/P(x) value was calculated as follows [39]:
A E T x P x = 1 + P E T x P x 1 + P E T x P x ω 1 ω
A E T x = M i n K c x × E T 0 x , P x
P E T x = K c x × E T 0 x
ω x = Z × A W C x P x + 1.25
A W C x = M i n R e s t . l a y e r . d e p t h , r o o t . d e p t h × P A W C  
where PET is the potential evapotranspiration (mm); x represents the plant evapotranspiration coefficient in pixels; ET0, which is calculated by Equation (18) [40], represents the reference evapotranspiration of pixels; ω(x) is the coefficient of water availability for plants in pixels; AWC(x) is the volume of water content available to plants (mm); P(x) is the annual precipitation in pixels (mm); and Z is the Zhang coefficient, which ranges from 1 to 10 and is used to reflect the seasonal distribution and hydrological characteristics of rainfall [41]. When the value was 2.5, the experimental results were more consistent with the surface runoff in the Water Resources Bulletin of Taiyuan City; therefore, the Zhang coefficient of Taiyuan City was determined to be 2.5. PAWC is the available water capacity of the plants obtained from the difference between the wilting point and field capacity [39].
E T 0 x = 0.0013 × 0.408 × R a × T m a x + T m i n 2 + 17 × T m a x T m i n 0.0123 P 0.76
where Ra is the extra-terrestrial solar radiation (MJ·m−2·day−1); Tmax and Tmin are the average maximum and minimum daily air temperature (°C), respectively.

2.3.7. Carbon Storage Assessment

Based on LULC and soil carbon pools, dead organic matter, aboveground and underground biomass, and harvested wood products, carbon storage was simulated under the current scenario in the InVEST model [42]. We included four carbon pools owing to the limited number of HWP measurements. As a result, carbon storage across a landscape can be estimated by aggregating the carbon in each pool across different LULC. The total carbon storage (C) is calculated below:
C = C a b o v e + C s o i l + C d e a d + C b e l o w
where Csoil, Cdead, Cabove, and Cbelow are the carbon storage of soil, soil dead, plant aboveground, and belowground, respectively. Considering that the proportion of the dead organic matter carbon pool in the entire evaluation was small, the change in its value did not affect the evaluation result; therefore, it was excluded from this study.

2.3.8. Extraction of Ecological Corridors

In the present study, the ecological corridors were extracted by the MCR model and circuit theory. The Linkage Mapper can identify ecological corridors and key nodes in heterogeneous landscapes based on circuit theory. Linkage Pathways directly create the environmental information necessary for tools such as Euclidean distance to run in ArcGIS software.

3. Results

3.1. Information Extraction from RS Data

LULC involves complex processes and mechanisms driven by natural and human factors [43]. This strongly influences the composition and structure of the regional landscape. It is important to understand that these changes directly affect the spatial distribution of ecosystem services and indirectly affect various ecological processes in the landscape. Land use changes can be effectively reflected in landscape patterns by analyzing their changes [44].
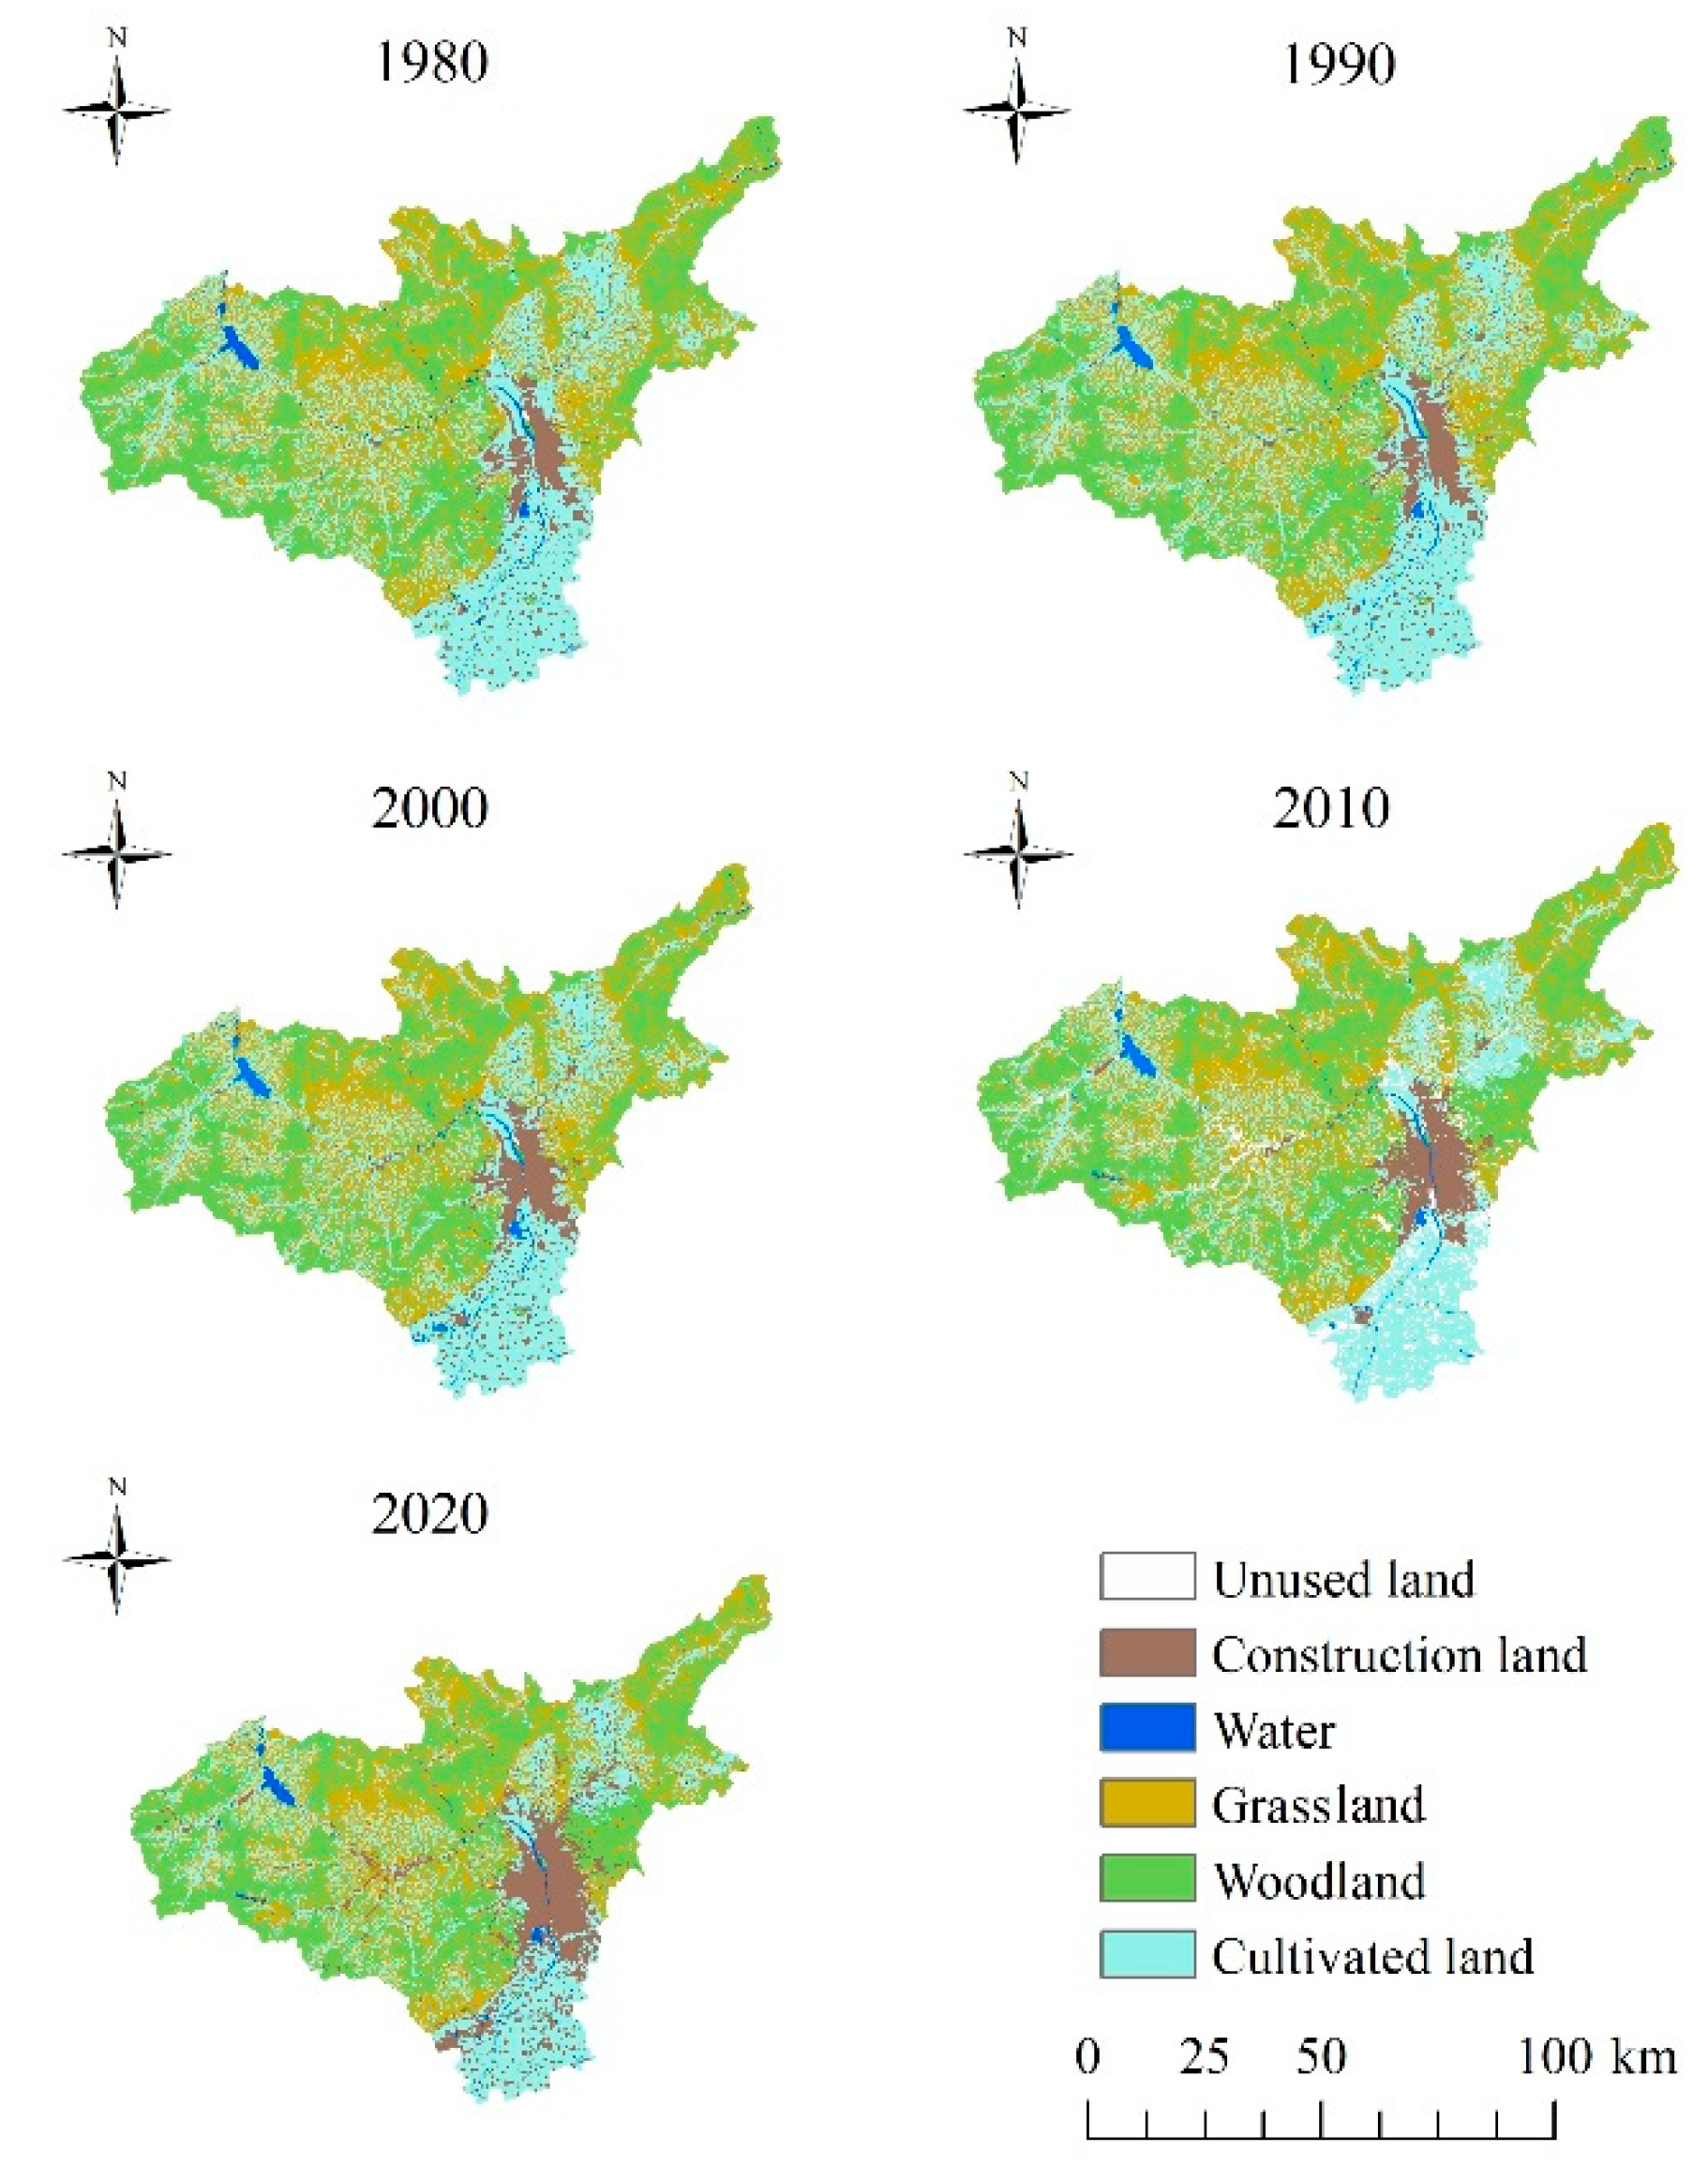
From 1980 to 2020, the landscape structure of Taiyuan City experienced the significant spatial change (Figure 3). There was a decrease in grassland, cultivated land, and unused land in Taiyuan but an increase in urban development, water, and woodland. Construction land has increased by 432.05 km2; whereas a total of 344.82 km2 of cultivated land and 146.1 km2 of grassland decreased. The proportion of woodland basically remained unchanged. Although the area of unused land in Taiyuan is small, it generally increased and then decreased, with a total reduction of approximately 1.03 km2.
There were notable numerical changes in construction land, water area, and unused land from 1980 to 1990 (Table 2): (1) the area of construction land increased by 29.73 km2, which was mainly transferred from cultivated land and grassland; (2) the total amount of cultivated land decreased by 28.32 km2 after subtracting the transferred area in 1990; it was mainly transferred to construction land; (3) water area, woodland, and unused land exhibited an increasing trend, with the area increasing by 3.1 km2, 0.39 km2, and 0.21 km2. During this period, Taiyuan City was in a slow development stage and urban development was relatively balanced. From 1990 to 2000, the areas of cultivated land, woodland, and unused land showed decreasing trends, whereas the other land areas showed increasing trends. The specific performance is as follows: (1) the construction land area has increased by 66.0 km2; (2) the cultivated land area continued to decrease. While the woodland area began to decline, with a cumulative decrease of 36.05 km2; and (3) grassland and water area increased slightly, mainly from woodland and cultivated land. At this stage, the urbanization process began to accelerate, the area of cultivated land and ecological land began to decrease significantly, and the contradiction between urban development and ecological balance began. Wood and construction land expanded from 2000 to 2010, while other types of land decreased. The specific performance is as follows: (1) the construction land increased by 268.6 km2, with a significant growth rate; (2) 228.65 km2 of cultivated land decreased, with most of the land being converted to woodland, grassland, and construction land; and 137.92 km2 of grassland decreased, with most of the land being converted to cultivated land, woodland, and construction sites; (3) woodland area increased significantly by 114.24 km2. However, since 2002, in response to the policy of “returning cultivated land to forest”, Taiyuan has actively carried out the work of returning cultivated land to forest, and ecological land has been protected to a certain extent. From 2010 to 2020, the areas of grassland and cultivated land decreased, whereas those of woodland, construction land, and water increased. The specific performance was as follows: (1) construction land area continued to increase, and the growth rate was slower than that of the previous period; (2) although cultivated land and grassland were still declining, the trend was slowing down; and (3) woodland and water areas increased. At this stage, Taiyuan entered a stable development state, the urban expansion rate slowed, and the ecological land use increased.

3.2. Characteristics of Land Use Dynamic Change

In addition to revealing the change rate of all land types, the single land use dynamic degree also reflects the intensity of regional land use change [45]. According to the single land use dynamic degree change (Table 3), the area of construction land changed the most from 1980 to 2020, followed by unused land, cultivated land, and grassland with dynamic degrees of 3.65%, −1.03%, −0.40%, and −0.2%, respectively. From 2000 to 2010, the single land use dynamic degree of all land types changed significantly, and the change rates of construction and woodland were 4.01% and 0.47%, respectively, which were much higher than those of the other periods. Unused land, water area, cultivated land, and grassland showed decreasing trends, with change rates of −6.86%, −2.08%, −1.19%, and −0.77%, respectively. This phenomenon indicates that the period was characterized by rapid economic development and urbanization in Taiyuan.

3.3. Identification of Ecological Source

Taiyuan City is surrounded by mountains on three sides, with a high coverage of natural forests and artificial forests. Moreover, it plays a key role in protecting the soil and water loss in the Yellow River basin. Therefore, in this study, four typical ecosystem service functions (soil conservation, water yield, carbon storage, and habitat quality) were selected for analysis. Then, the analytic hierarchy process (AHP) combined with expert scoring was used to assign corresponding weights to the evaluation results. The ecosystem service functions were evaluated based on their weighted importance. Finally, the evaluation results were graded, and high-value areas were selected as the basis for establishing the ecological source.

3.3.1. Soil Conservation, Water Yield, and Carbon Storage Assessment

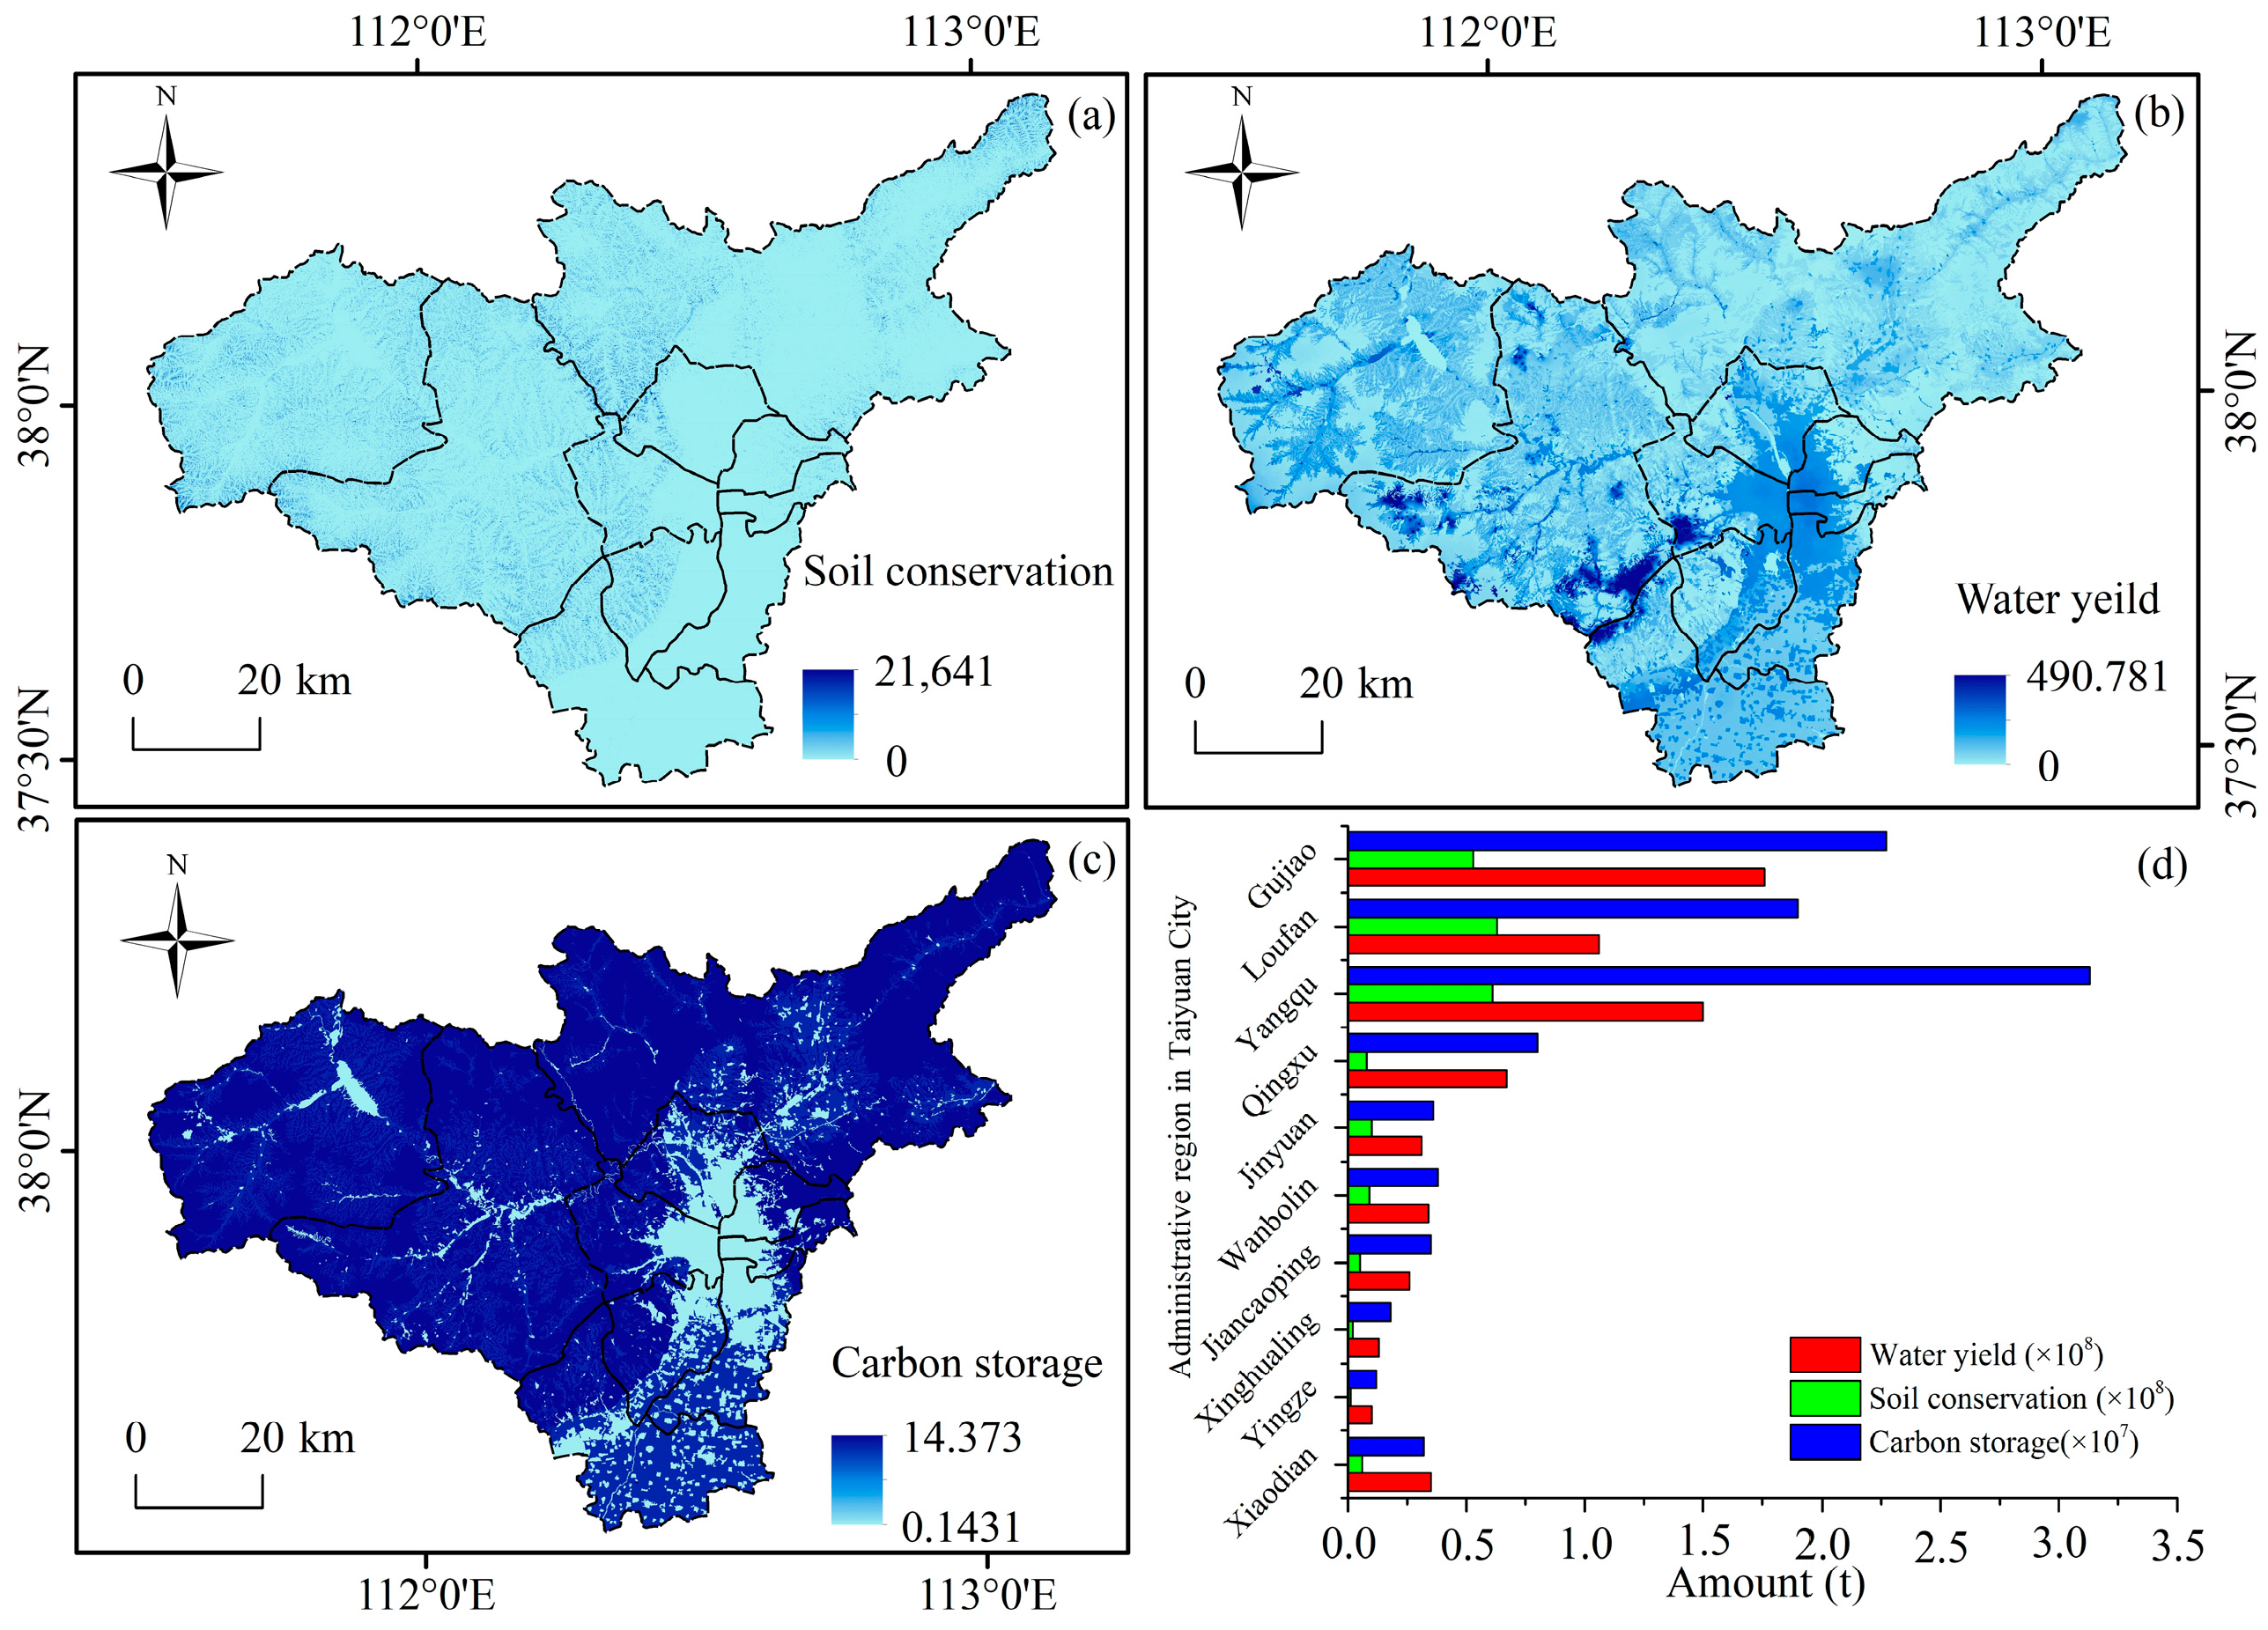
In 2020, the total amount of soil conservation in Taiyuan was 2.18 × 10⁸ t (Figure 4a), the overall soil conservation capacity was poor, and the soil conservation quantity displayed clear spatial differences. The six main city districts of Taiyuan and Qingxu County have relatively flat terrain, high urbanization levels, continuous areas, and high proportions of construction and cultivated land. Therefore, these areas were included in the overall zoning statistics in this study. Gujiao City, Loufan, and Yangqu counties had higher vegetation coverage and larger topographic fluctuations, and zoning statistics should be conducted. Soil conservation in the six main City Districts of Taiyuan and Qingxu County was 0.41 × 10⁸ t, accounting for only 19% of the soil conservation in the region (Figure 4d). The total soil conservation in Yangqu and Loufan Counties and Gujiao City was 0.61 × 10⁸ t, 0.53 × 10⁸ t, and 0.63 × 10⁸ t, respectively, accounting for 81% of the total region area. From the perspective of regional average soil conservation, the values in the central urban area of Taiyuan were significantly lower than those in Yangqu County, Gujiao City, and Loufan County, which had better vegetation coverage. Considering that most areas in the Yangqu and Loufan Counties and Gujiao City have high forest and grassland coverage and are less affected by human activities, the soil conservation capacity is correspondingly high. However, the soil conservation ability of built-up areas, with a high impact on human activities and low vegetation cover, is weak. Therefore, to enhance Taiyuan’s development planning, it is necessary to further protect the areas to retain high forest and grass coverage, restore and construct green spaces in built-up areas, and achieve regional ecological security by improving regional soil conservation capacity.
In 2020, the total water yield of Taiyuan was 6.47 × 10⁸ m3, which is close to the annual runoff of 7.15 × 10⁸ m3 in the Water Resources Bulletin of Taiyuan. Therefore, the InVEST model could better assess water yield in Taiyuan (Figure 4b). The total water production of Yangqu, Loufan Counties, and Gujiao City is relatively high, accounting for 66.8% of the total water production area of the city, with water production of 1.5 × 10⁸ m3, 1.06 × 10⁸ m3, and 1.76 × 10⁸ m3, respectively, followed by Qingxu County, which accounts for 10.23% of the city’s total water production, and Taiyuan’s “six main urban districts”, which only account for 23.01% (Figure 4d). Water yield was inversely proportional to vegetation evapotranspiration. Generally, construction land has the least vegetation and the lowest evapotranspiration; therefore, it has a higher water yield. However, most urban runoff flows through sewage pipes [46,47]. Although the water yield was high, its water retention ability was weak.
The carbon storage in Taiyuan ranges from 0.14 to 14.37 Mg/ha, with an average of 12.83 Mg/ha (Figure 4c). There is large spatial heterogeneity in carbon storage in Taiyuan. Carbon storage in urban and water areas was generally low, whereas that in cultivated land, woodland, and grassland was high. The total carbon storage of Taiyuan City was 9.81 × 10⁷ t and that of Yangqu County was 3.13 × 10⁷ t, which is 31.9% of the total carbon storage (Figure 4d). Loufan and Gujiao Counties have 2.60 × 10⁷ t and 1.90 × 10⁷ t of carbon storage, respectively, accounting for 23.10% and 19.40%, respectively. These three regions are composed of high vegetation coverage, scattered urban space, and a part of cultivated land; therefore, carbon storage is relatively high. Large areas of cultivated land and rural settlements were distributed in Qingxu County. Carbon storage reached 0.8 × 10⁷ t, which is 8.16% of the total carbon storage. The order of carbon storage was as follows: Wanbailin District > Jinyuan District > Xiaodian District > Xinghualing District > Yingze District.

3.3.2. Habitat Quality Assessment

In this study, the biodiversity module of the InVEST model was used to generate habitat quality using landscape pattern distribution and habitat threat factors. Considering the multiple objective conditions of the study area and related literature [48], we selected cultivated land, roads, rural and urban land use, and industrial and mining land as threat factors. Consulting experts investigated the threat source in Taiyuan City using the maximum distance, weight, and attenuation methods, as shown in Table 4.
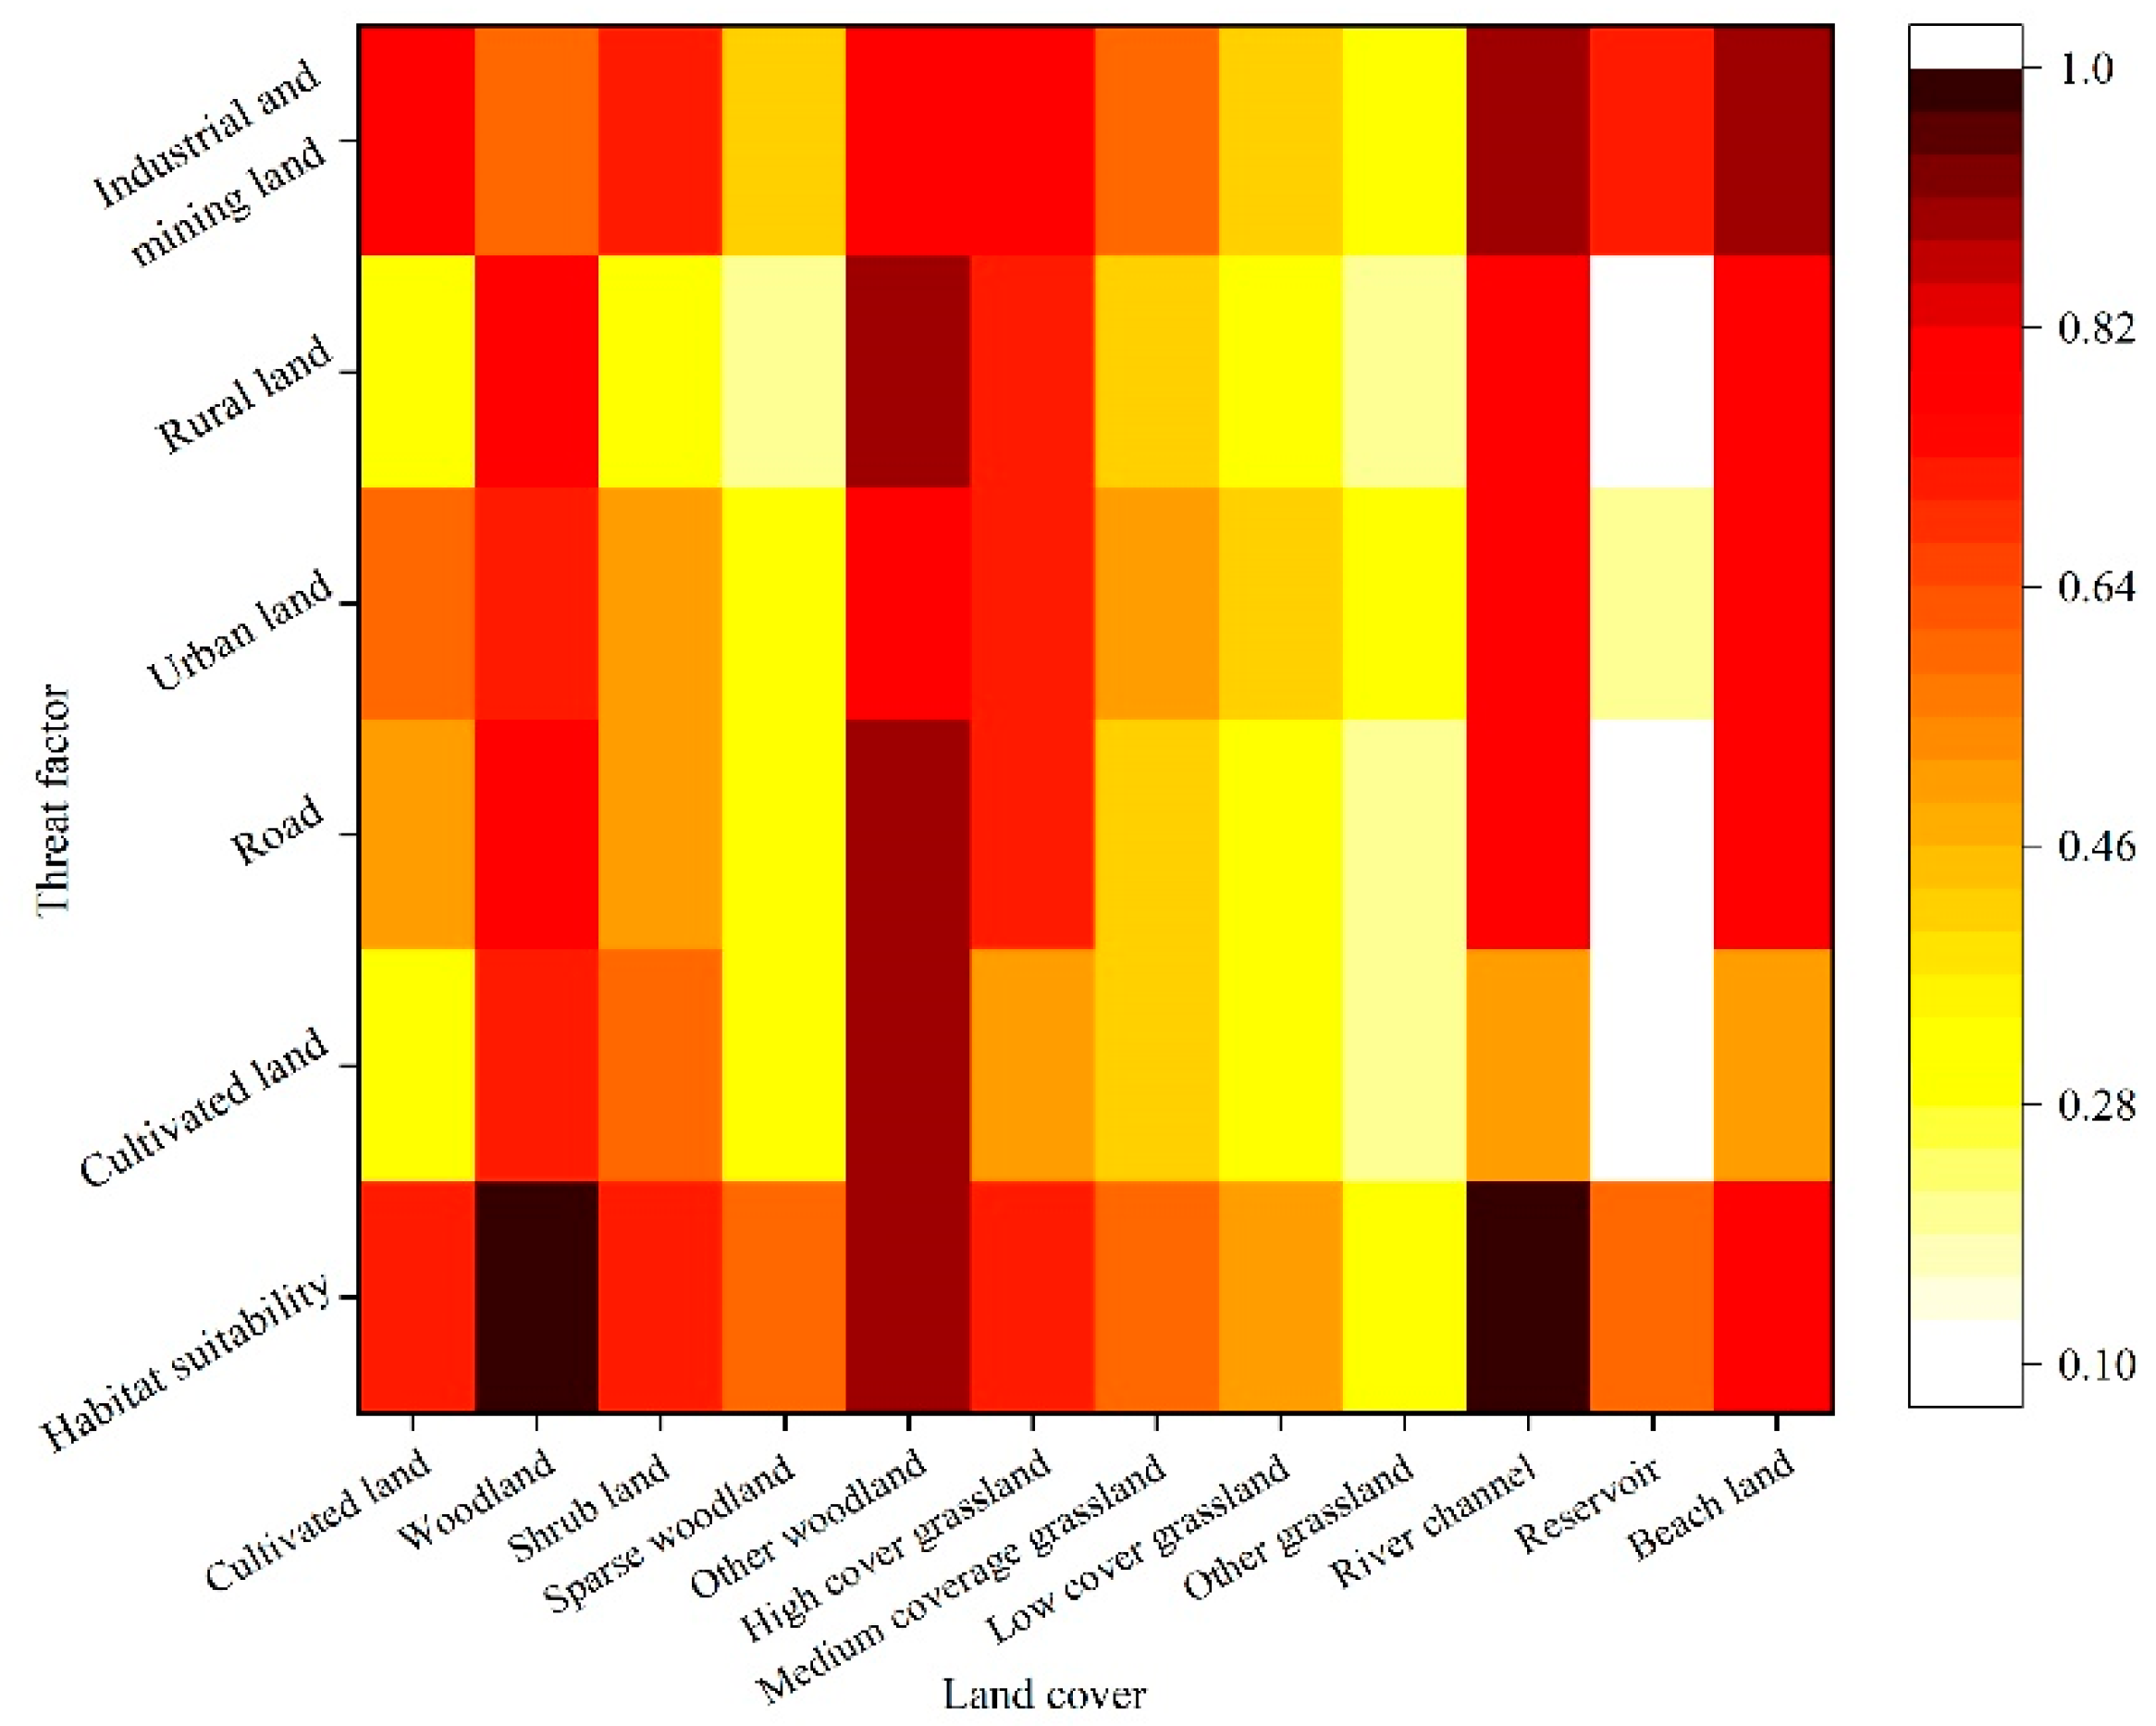
Based on the InVEST model manual and related literature [48], we defined the effects of different threat factors on land covers (Figure 5). Habitat suitability has a significant impact on land cover. Cultivated land and rural land had a lower impact on land cover, and their impact on river channels was the lowest. All threat factors had a significant effect on woodland, other woodlands, and high-cover grassland, but had a lower effect on open woodland, medium-cover grassland, low-cover grassland, other grasslands, and rivers.
Ecological lands, such as grasslands, woodlands, and water, are generally subjected to human intervention to a lesser degree and can provide long-term stable habitats and home ranges for organisms. Therefore, the habitat suitability was relatively high. The natural breakpoint method in the ArcGIS is the most appropriate grouping of similar values and maximizes the differences between classes [49]. In this study, the results of habitat quality assessments in Taiyuan were divided into five categories using the natural breakpoint method: 0.0–0.4, 0.4–0.65, 0.65–0.75, 0.75–0.85, and 0.85–1.0 (Figure 6a). The average habitat quality index for Taiyuan in 2020 is 0.56. The overall habitat quality was low, with the proportions of the five habitat quality types being 38.1, 2.5, 20.8, 13.6, and 24.8%, respectively. Areas with low habitat quality accounted for up to 38.1%, mainly concentrated in the plains of the main urban areas of Taiyuan City (Xiaodian, mean: 0.16; Yingze, mean: 0.43; Xinghualing, mean: 0.41; Jiancaoping, mean: 0.33; Wanbolin, mean: 0.46; Jinyuan, mean: 0.41) and Qingxu County (mean: 0.34) (Figure 6b). The land use types in these regions are mainly urban construction, cultivated, industrial and mining land, and rural residential areas, which are strongly disturbed by regional economic development and frequent human social activity, resulting in poor habitat quality in these regions. Areas with high habitat quality, such as Yangqu (mean value = 0.68), Loufan (mean value = 0.64), and Gujiao (mean value = 0.64), were mainly distributed in mountainous areas owing to less human disturbance and higher vegetation cover.

3.3.3. Ecological Source in Taiyuan City

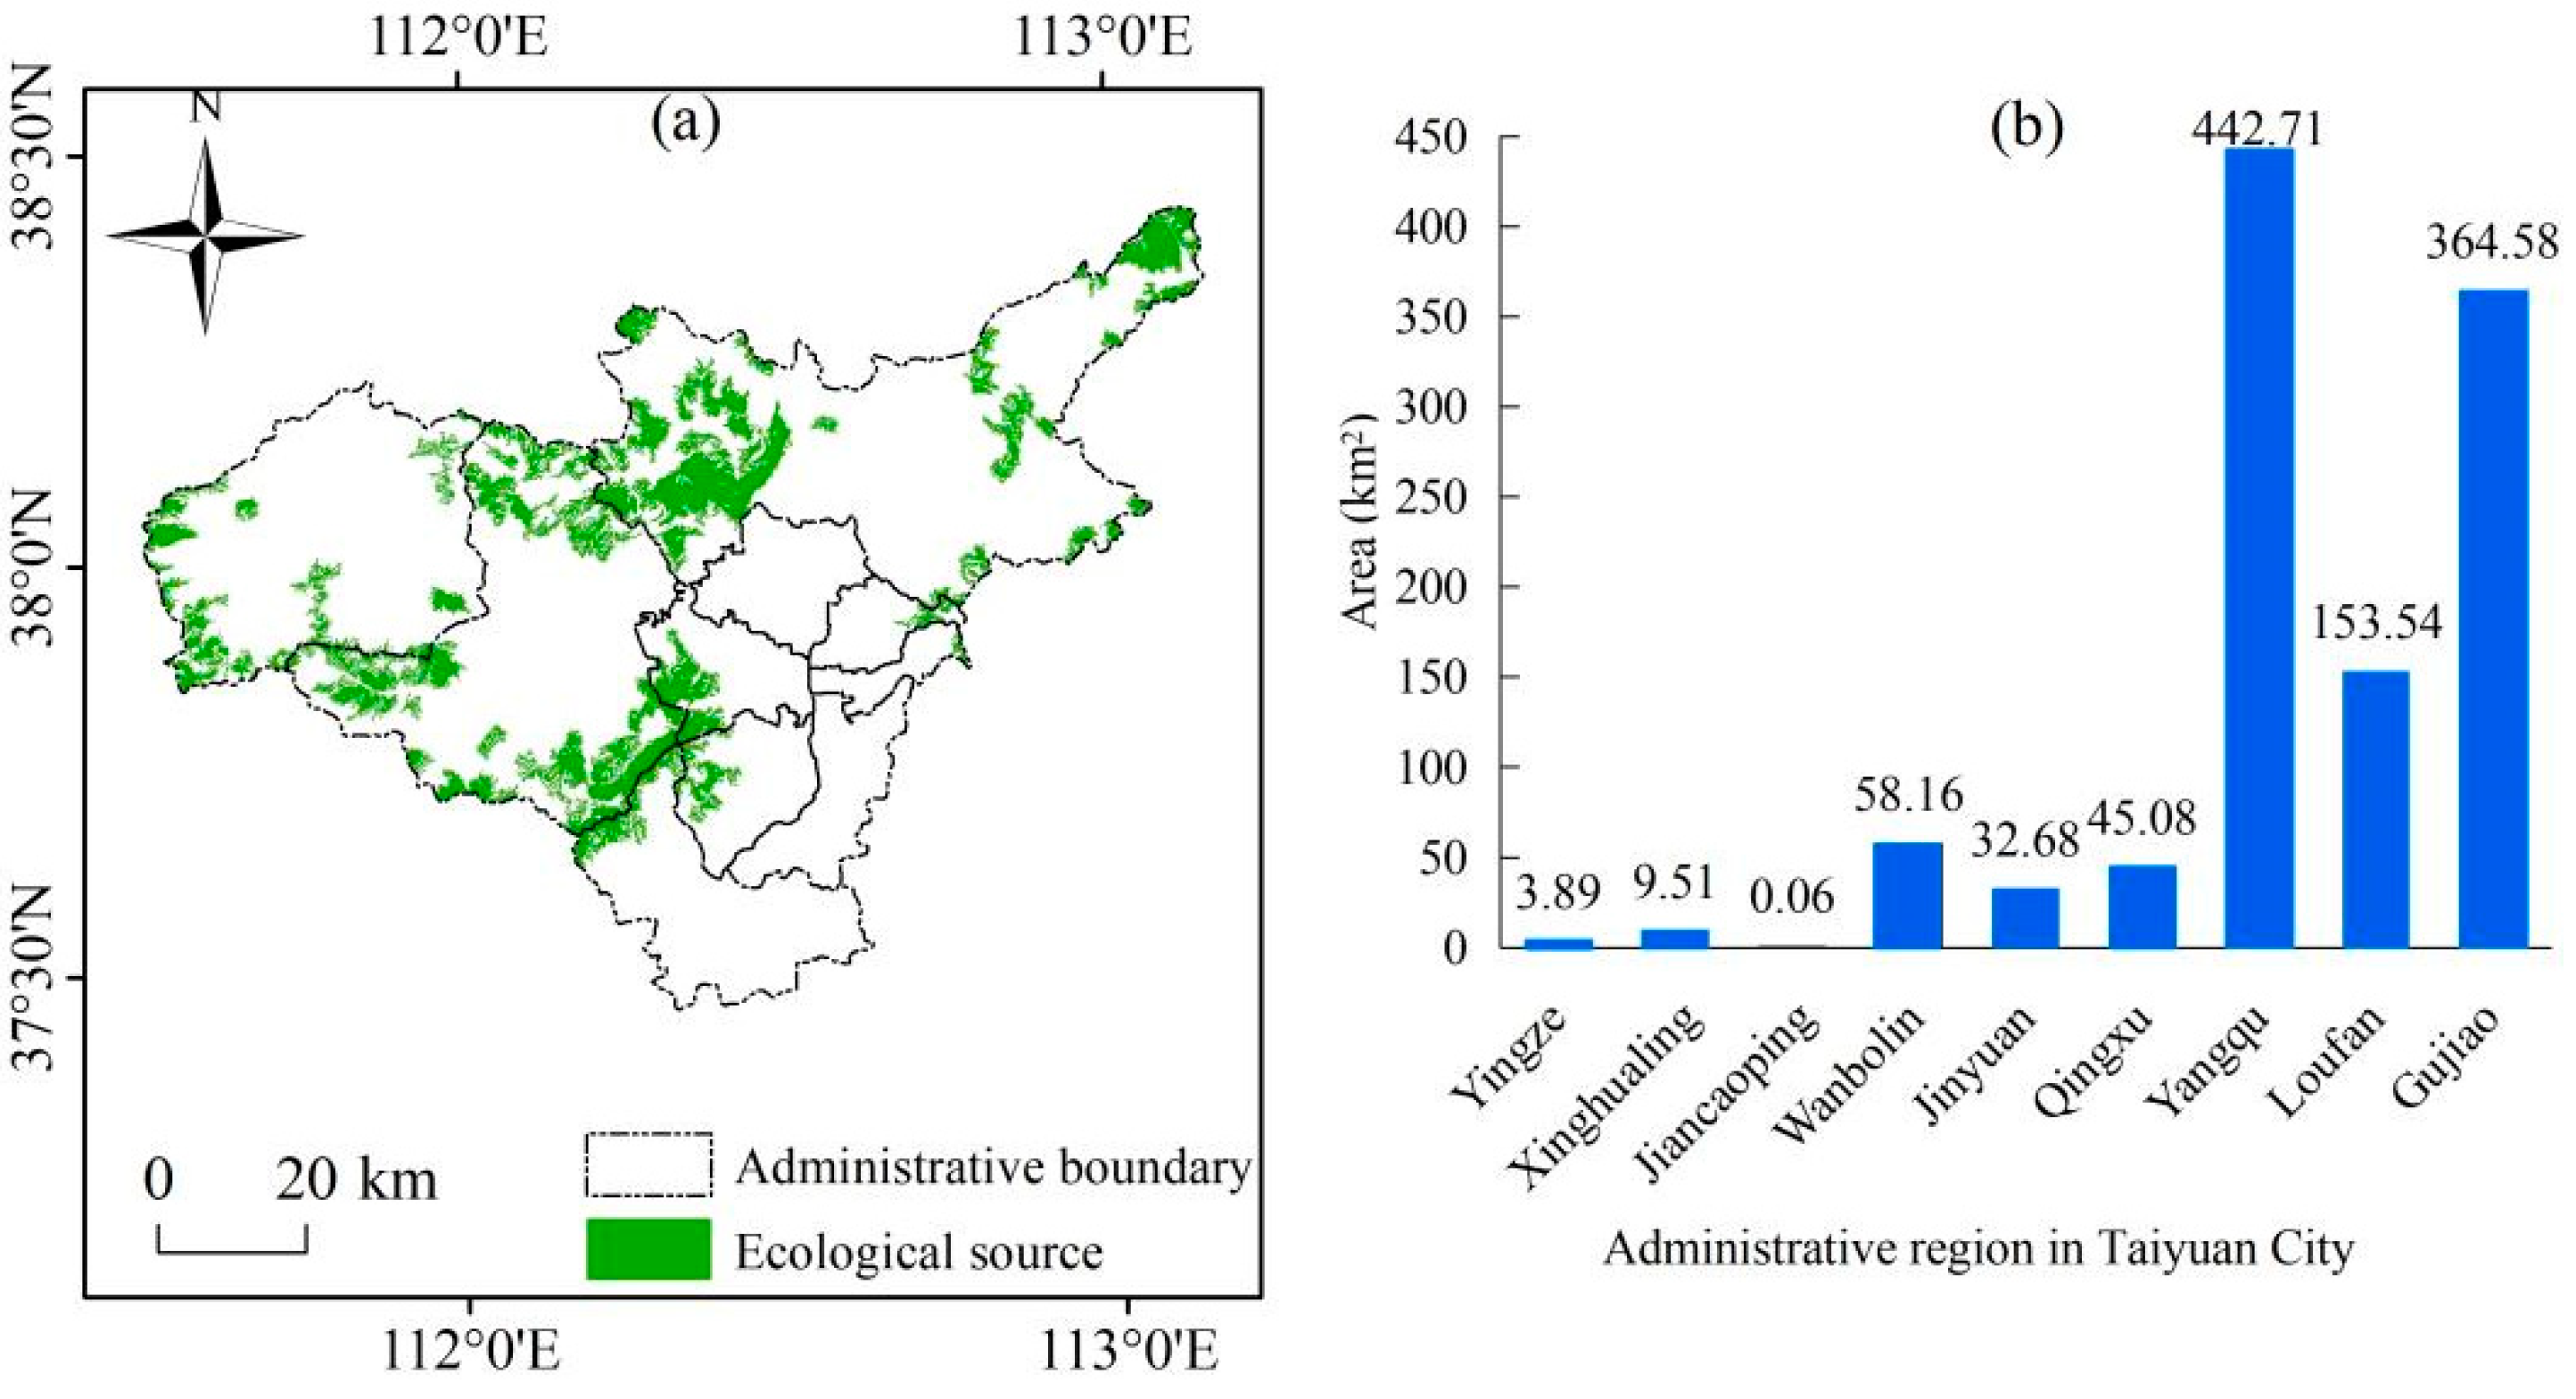
Based on the above results, habitat quality, soil conservation, water yield, and carbon sequestration storage were weighted using ArcGIS 10.8 with weights of 0.3, 0.3, 0.15, and 0.15, respectively. The natural breakpoint method was used to divide the evaluation results of ecosystem services in Taiyuan into five levels (Figure 7a). Regions with the top 25% of the extracted ecosystem services were selected as the evaluation results [50]. The areas with high ecosystem service value in Taiyuan were concentrated in the west and east of Yangqu County, north and south of Gujiao City, the southern part of Loufan County, Jinyuan District, and the southern part of Wanbolin District. These areas are generally covered by forests with large terrain fluctuations and low human intervention, thereby providing a good ecosystem service value for the region. In contrast, in the “six districts” of Taiyuan City, most areas of Qingxu County, the middle part of Yangqu County, the middle part of Gujiao City, and the middle part of Loufan County generally had low ecosystem service values. The ecological sources of Taiyuan were identified by removing patches with an area of less than 4 km2. There are 38 ecological source areas, with a total area of 1110.2 km2, accounting for 16.13% of the area of Taiyuan City (Figure 7b). Woodland and grassland were the main components of the ecological source areas, with a total area of 95%. The results showed that Yangqu County, Gujiao City, and Loufan County contributed 442.71 km2, 364.58 km2, and 153.54 km2, respectively, of ecological sources, accounting for 86.5% of the total ecological sources.

3.4. Construction of Resistance Surface

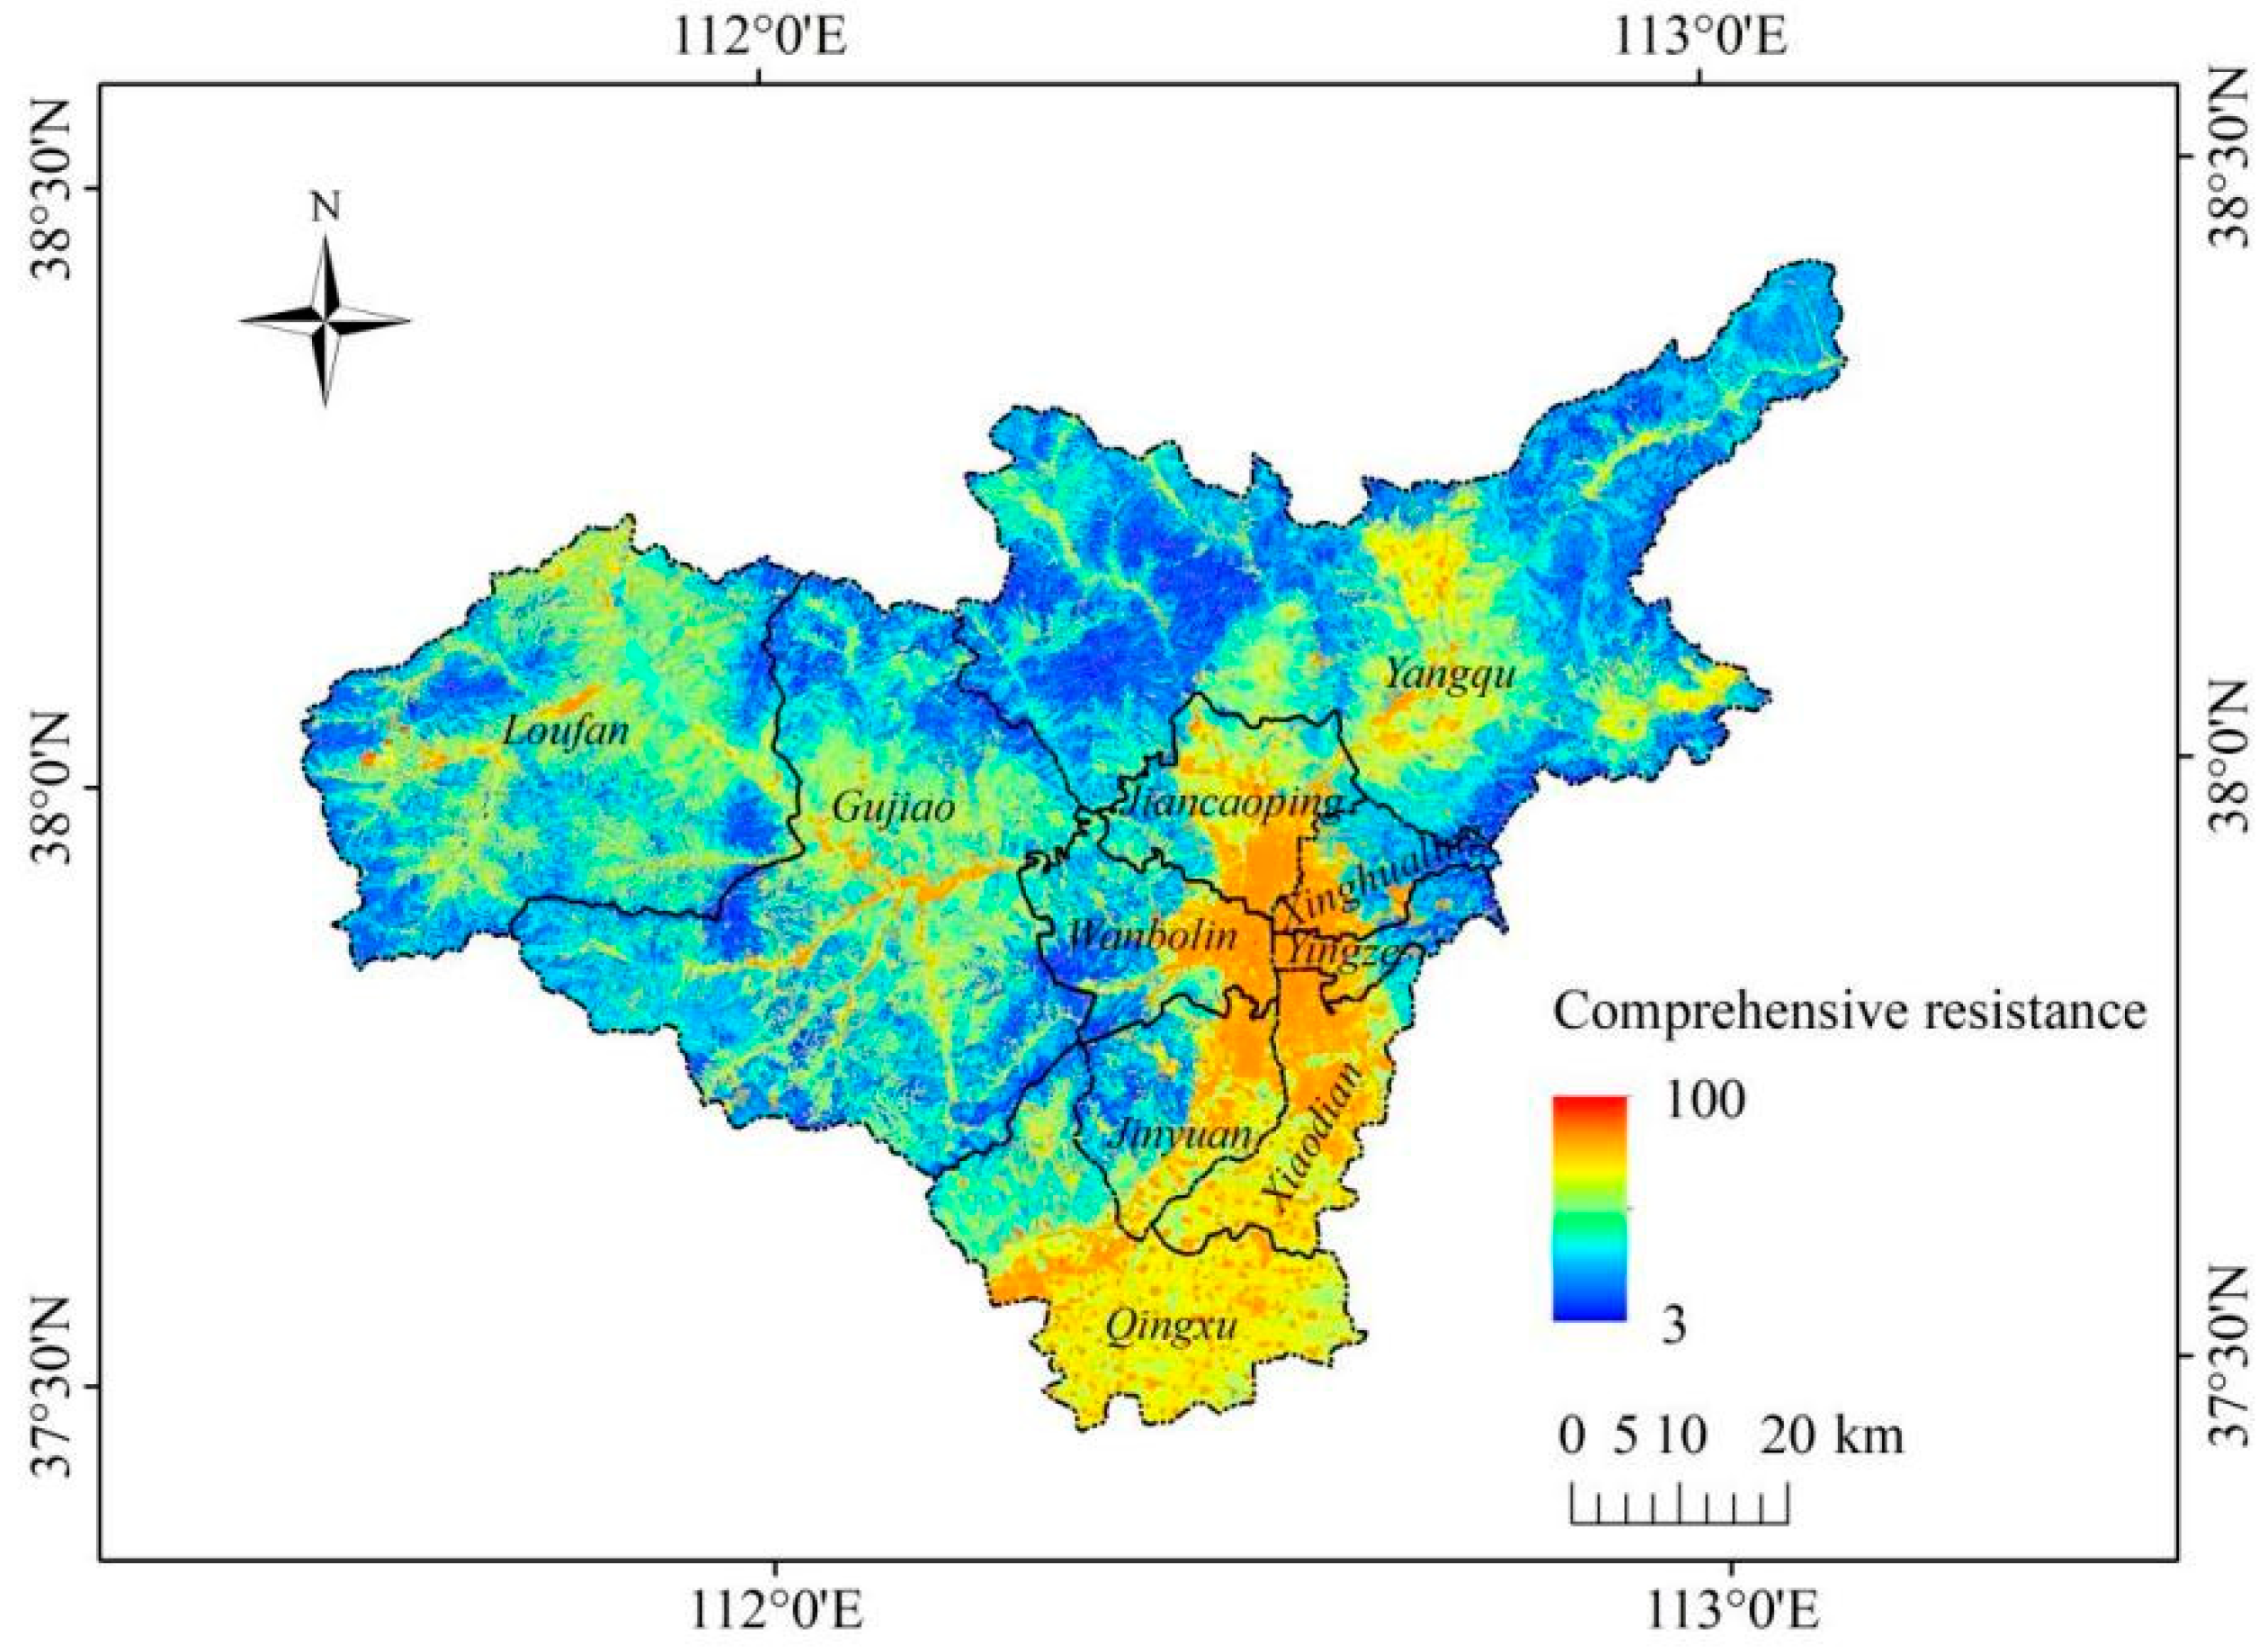
The spatial distribution of regional ecological resistance is defined as the resistance surface [51]. Regions with perfect ecological functions and high ecosystem service values have lower resistance to species migration. A reciprocal relationship between habitat quality and ecological resistance was also considered. In addition, land use type, elevation, slope, and NDVI were selected as resistance factors. Scoring standards and specific resistance values were formulated according to the research of professionals and predecessors. Weight was determined using the AHP (Table 5).
A comprehensive resistance surface for Taiyuan City was constructed based on the basis of the single-resistance surface evaluation results. As shown in Figure 8, the resistance surface of each urban and rural construction area in Taiyuan City was large. By contrast, the resistance surface was smaller in areas with high relief and low human activity. Compared with mountainous areas, flat terrain is more conducive to animal migration; however, with the continuous increase in impervious pavement areas in the city, it is difficult to form large green patches in urban built-up areas. Thus, the resistance coefficient of the built-up area in Taiyuan remained very high, which increased the difficulty of constructing and restoring the ecological source area in Taiyuan. Compared to built-up areas, the mountainous area of Taiyuan City has become an important area for ecological protection and biodiversity maintenance. Lower ecological resistance also creates more suitable conditions for corridor construction and reduces the economic input and difficulty of corridor construction.

3.5. Identification of Ecological Corridors, Nodes, and Obstacle Points

We identified the length of the corridor and the construction areas according to the constructed source and resistance surface. In the width design, considering the local economic development level and the difficulty of corridor construction, the potential corridor was simulated using a threshold of 5000. This study identified 79 corridors with a total length of 626.7 km and an average length of 8.14 km (Figure 9a). Among the corridors, the shortest was 0.51 km, and the longest was 32.83 km. The corridor space was mainly dominated by woodlands and grasslands, and these areas also had low resistance values. The corridor construction area was 109.82 km2, of which cultivated land accounted for 8.5 km2, forest land accounted for 70.9 km2, grassland accounted for 27.4 km2, water area accounted for 1.1 km2, and construction land accounted for 1.92 km2. The spatial layouts of the corridors in Taiyuan show clear differences. Owing to the higher drag coefficient, the corridors in the six districts and Qingxu County are less distributed. There were four long corridors, two horizontal and two verticals, which were traversed by the low-resistance spaces in the city and effectively created a connection between the ecological sources around the “six urban areas”. A number of ecological sources of varying sizes constituted the northern part of Yangqu County and the southern part of Gujiao City; therefore, the corridors were generally short. The ecological sources in the southern parts of Loufan and Yangqu Counties were far apart; the area was composed of many ecological patches with smaller areas, and the distribution of each corridor was “cobwebbed”.
Ecological lands and corridors were overlaid, and the nodes of a corridor segment that passed through the ecological land were considered ecological nodes. An ecological breakpoint is highly resistant to normal ecological flow. There are 31 pinch-point locations in the city of Taiyuan. Ecological pinch points in the study area were mostly located near corridors, near the junction of ecological sources, and in the middle of the long corridors (Figure 9b). In addition, corridors in the eastern and western regions of Taiyuan exhibited a network distribution, and the number of pinch points increased substantially. According to the identification results of obstacle points, the largest area of obstacle points in Taiyuan was distributed in the central city of Taiyuan and north of TISCO Industrial Park. Land use in these areas is complex, mainly comprising industrial, cultivated, and urban construction land. The main urban road spans Taiyuan from east to west, notably affecting biological passage. The second is Yangqu County, located east of Taiyuan City. This area is at the eastern border of Taiyuan, where a large area of cultivated land and rural settlements is located, and several expressway networks interweave, resulting in a large area of obstacles under the influence of human activity. The obstacle points west of Taiyuan are mainly distributed near the second reservoir of the Fen River. The fragile water ecological environment and longitudinal ecological corridor network led to obstacles in this region. The obstacles and pinch points directly affect the connectivity of regional corridors. Therefore, effectively protecting the ecological environment at these points is key to promoting the quality of regional ecological governance and restoration, and it is also an important factor influencing the smooth connectivity, construction, and maintenance of corridors.

4. Discussion

4.1. Ecological Source Assessment

The scientific and accurate identification of ecological source areas is an important goal for the construction of ecological security patterns and territorial ecological restoration, and the construction of ecological source area identification systems based on local conditions is the core technology. Owing to the different needs of ecological security, the identification system of ecological source areas varies significantly [22]. In the present study, we selected soil conservation, habitat quality, water yield, and carbon storage to identify ecological sources.
The Loess Plateau is one of the most serious soil erosions and the most fragile ecological environment in our country. There are significant differences in the functions of soil and water conservation services between different ecosystems in different regions. Moreover, forest and grass vegetation measures are influenced by the warming and drying climate and human activities [52]. The primary function of soil conservation is to alleviate the regional soil erosion caused by water erosion. A high level of soil conservation capacity can effectively improve the water conservation capacity in the region, play a vital role in reducing water and soil loss, and enhance wind and sand fixation [53,54]. The results show that the soil conservation of different ecosystems in Taiyuan City in 2020 is in the order of cultivated land < grassland < woodland. The woodland ecosystem has a high function of soil and water conservation, which can be realized mainly through the interception and absorption of precipitation by vegetation canopy, ground cover, and root soil layer to reduce its splash and scour on the soil. The grassland ecosystem lacks the interception effect of the forest canopy on rainfall, and land cover is relatively low. Compared with forest and grass ecosystems, the vegetation coverage of the farmland ecosystem is relatively lower; therefore, soil conservation is the lowest.
Urbanization not only has a direct impact on habitat, but also has an indirect impact on land use through the transmission of ecological protection [55]. Taiyuan City is located in the eastern part of the Loess Plateau and has a unique geographical location and diverse landform types. The degradation of habitat quality in typical landscape areas was significant. There are many natural landscapes, such as loess beams, tablelands, mounds, hilly landforms, erosional residual tablelands, and serious problems such as soil erosion and desertification. In addition, urban construction and energy and mineral exploitation have greatly changed the spatial pattern composition and structural characteristics of Taiyuan City, resulting in the reduction in regional greenspace area, the increase in landscape heterogeneity, and the degradation of natural ecology. The average habitat quality index for Taiyuan in 2020 was 0.56, which was higher than that of Tianjin City in 2020 (0.2311) [56]. The better the habitat quality, the more the ecological flow can be promoted, corresponding to low resistance [57]. Based on habitat suitability and threat factor, the habitat quality results in this study were representative to some extent; woodland and high-coverage grassland had the highest habitat quality, whereas bare land and urban land had lower habitat quality. However, habitat quality in Taiyuan has been declining over the past 40 years owing to land use changes.
Water yield can be evaluated quantitatively and visualized to understand trends in the supply of water in ecosystems and determine the impact of human activities on water resources [58,59,60]. From the perspective of water yield service, compared with other land use types, the soil infiltration capacity of woodlands is strong, and the water yield capacity is low owing to the effect of surface runoff interception. Construction land has a high-water yield because of its impervious surface and low precipitation infiltration. The results for Shanghai and Beijing-Tianjin-Hebei in China clearly show that construction land is often covered with asphalt, cement, and concrete, creating an impervious layer that reduces the number of penetrations and concentrations, which leads to an increase in water yield [61].
Regions with high carbon storage capacity can play a positive role in promoting ecosystem production and climate regulation as key indicators of ecosystem services; therefore, they are increasingly used in the evaluation of regional ecosystem services [62,63,64]. Research has suggested that LULC has a significant impact on the potential of carbon storage and that natural vegetation is positively correlated with carbon storage [65]. According to the results of this study, cultivated land, woodland, and grassland are the most important carbon storage.
This study found that ecological lands, such as mountains, grasslands, and water surfaces, have high ecological suitability and are the main areas for ecological corridor construction. Areas with more serious human interference, such as agricultural land, industrial land, and urban construction land, have higher ecological resistance, which affects the connectivity of ecological corridors. Therefore, urban planning and construction should be prioritized. In general, plains are more suitable for biological migration. However, the rapid development of cities on plains poses great resistance to animal migration. To realize the harmonious development of humans and nature and build ecologically friendly and habitable cities, more ecological patches, such as wetland parks and forest botanical gardens, need to be built and preserved in the process of existing urban planning and renovation instead of moving mountains and filling lakes [66]. Simultaneously, the restoration of ecological corridors must be accompanied by the avoidance of urban pollutants and urban flood risks [67,68]. The safeguarding of biological migration is one of the main functions of ecological corridors. If organisms encounter a highly polluted environment during their migration to the corridor, the pollutants will have a more negative ecological impact; therefore, the discharge of pollutants near ecological corridors must be strictly controlled. In terms of flood prevention, the urban green corridors identified in this study, such as the Fen River corridor, can be coupled with ecological sponge measures for simultaneous construction [69,70].

4.2. Construction of Ecological Security Pattern in Taiyuan City

Human activities have a significant impact on ESP, which can easily damage the local ecological landscape. This results in an increase in landscape complexity, the landscape patch shape becomes more complex, and the connectivity is reduced [71]. Similar results in arid areas of China can be found in Ganzhou District [72] and the Middle Reaches of the Heihe River [73]. Therefore, improving the connectivity and stability of the ecological landscape has a significant effect on the response to disturbances in human activities. In the present study, the regional topographical features and migration habits of biological species were fully considered, and resistance surfaces and potential ecological corridors were constructed to protect biodiversity and promote river wetland environment construction to identify ESP.
Taiyuan City’s ecological security pattern was built by connecting the ecological corridors and ecological sources. In this study, owing to the large area of impervious pavement in built-up urban and rural areas, urban ecology was hindered as a result of a lack of ecological sources, corridors, and human settlement environments. In recent years, with the relevant departments of Taiyuan City continuing to strengthen the Fen River landscape transformation and restoration, the Fen River has effectively played the role of an urban green corridor, becoming an important place for wildlife migration and the recreation of citizens. Therefore, this study used the Fen River as an independent corridor in the construction of an urban corridor and constructed an ecological security pattern optimization governance model of “two ring roads, four zones, and nine corridors” (Figure 10).
The two rings refer to the land corridor around the city of Taiyuan and the waterfront corridor along the bank of the Fen River. Through the construction of these two corridors, an ecological corridor network space connecting the north, south, east, and west was formed, effectively connecting the ecological sources of Taiyuan. The central part of Taiyuan is the primary construction and development area. Urban construction land has a large spatial area and lacks large green areas. In the long run, it will continue to divide the connection between Taiyuan City and ecological land at both ends and affect the migration of animals. It is urgent to build an ecological corridor in the east-west direction to repair the ecological connection between the eastern and western mountains.
“Four zones” refers to the ecological control zone of high coverage vegetation in Yangqu county and Gujiao City in the north of Taiyuan City; Tianlong, Meng Mountain, and Tai Mountain (scenic spots with restricted development zones) in Jinyuan District; the ecological barrier zone in the southwest of Gujiao City and Loufan County; and an ecological conservation zone in the northeast of Yangqu County. A common feature of these areas is that they have large ecological patches and are the main ecological source distribution areas.
The term “nine corridors” refers to the “two vertical and one horizontal” corridors which connect the ecological source areas in the main urban area of Taiyuan City; “one horizontal and three verticals” corridors connecting Yangqu County, Gujiao City, and Loufan County of Taiyuan City; and “one vertical and one horizontal” corridor in the northeast of Yangqu County. The “two vertical corridors and one horizontal” are located in the main urban area, with frequent human activity, resulting in high resistance to corridor construction. Located in the west of Taiyuan City, the “one horizontal and three verticals” corridors connecting Yangqu County, Gujiao City, and Loufan County are composed of small ecological patches. These areas encompass the water source protection area of Taiyuan City, the second reservoir of the Fen River. Therefore, they are more suitable for the living and breeding space of wild animals and plants. Located in northeast Yangqu County, Taiyuan City, the “one vertical and one horizontal” corridor passes through the important “ecological conservation area”. Although there was high vegetation coverage in the study area, the ecosystem services value was low. Through the construction of the corridor, the ecological source space was effectively combined, and strict source protection and active corridor construction were implemented to promote regional ecological development and improve ecosystem service value. Collectively, these nine corridors constitute the construction of an ecological network in Taiyuan, which can effectively increase the links between ecological sources and become an important way to achieve sustainable development in the region.

4.3. Limitations and Future Research Directions

Firstly, limited by the length of the paper, this study only constructed ESP in 2020. In future studies, changes in ESPs during different periods should be considered. Secondly, the settings of some parameters in the InVEST model are subjective, and more objective methods will be integrated to set the model parameters in the future. Thirdly, in terms of selecting ecological nodes, more practical nodes can be proposed from the perspective of biodiversity protection. Only land use type and terrain were considered in the construction of the resistance surface. In the future, social resistance factors such as population and economy can be included to build a more comprehensive resistance surface. Finally, future studies can be strengthened from the aspects of the diachronic, cross-scale, and driving mechanism of ESPs, and the influencing factors, dynamic processes, and driving mechanisms of the evolution of ESPs.

5. Conclusions

In this study, we systematically analyzed the history of LULC changes in Taiyuan City from 1980 to 2020. We then assessed four ecosystem services in 2020, including soil conservation, habitat quality, water yield, and carbon storage. Furthermore, we identified ecological corridors, pinch points, and barrier points by combining the MCR model and circuit theory method. Finally, we constructed an optimization model of the ecological security pattern. The main conclusions are as follows:
(1)
During the period from 1980 to 2020, urban construction land has continuously increased, with a cumulative increase of 432.05 km2; cultivated land area continued to decrease, with a cumulative decrease of 344.82 km2; grassland and water area have also experienced a decrease of 146.1 km2 and 1.98 km2, respectively. Significant LULC changes occurred from 2000 to 2010, which was also a decade of rapid development.
(2)
The total amount of soil conservation in Taiyuan was 2.18 × 10⁸ t. The total water yield was 6.47 × 10⁸ m3, which is close to the annual runoff of 7.15 × 10⁸ m3 in the Water Resources Bulletin of Taiyuan. The carbon storage ranges from 0.14 to 14.37 Mg/ha, with an average of 12.83 Mg/ha. The average habitat quality index was 0.56.
(3)
A total of 38 ecological sources were identified, covering an area of 1124.16 km2 and accounting for 16% of the total area of Taiyuan City. The ecological sources were mainly woodlands and grasslands. Comprehensive resistance surface analysis shows that areas with high resistance values were mainly concentrated in the central urban area of Taiyuan City and the built-up area of local counties. A total of 79 corridors and 31 ecological “pinch points” were identified in Taiyuan City, which were mainly distributed in the corridors near each ecological source. Six ecological barrier points were also identified, the largest of which was located near the northern corridor of Taiyuan City. There are significant spatial differences in ecological sources in Taiyuan, which are shown as “six districts” and Qingxu county are lower than Yangqu County, Gujiao City, and Loufan County.
(4)
Integrate the ecological source, corridor, pinch, and obstacle points, and bring the Fenhe River bank zone into the construction of regional ecological security patterns as an important river ecological corridor. The optimal management model of the ecological security pattern of “two rings, four regions, and nine corridors” was constructed.

Author Contributions

Conceptualization, Z.Z.; Methodology, Q.Q.; Software, Z.Z.; Supervision, P.L.; Validation, L.L. and P.L.; Writing—original draft, Q.Q.; Writing—review and editing, P.L. and Q.Q. All authors will be informed about each step of manuscript processing, including submission, revision, revision reminder, etc., via email from our system or an assigned Assistant Editor. All authors have read and agreed to the published version of the manuscript.

Funding

National Key R&D Program of China (2018YFE0103800), International Education Research Program of Chang’an University (300108221102), General Project of Shaanxi Provincial Key R&D Program—Social Development Field (2021SF-454), China National Social Science Fund Project (20XKS006). Those fundings are not envoled in the study designing and draft.

Data Availability Statement

Not applicable.

Acknowledgments

The authors gratefully thank the editors and anonymous reviewers for their valuable advice in improving this manuscript.

Conflicts of Interest

The authors declare no conflict of interest.

References

  1. Mooney, H.A.; Duraiappah, A.; Larigauderie, A. Evolution of natural and social science interactions in global change research programs. Proc. Natl. Acad. Sci. USA 2013, 110 (Suppl. 1), 3665–3672. [Google Scholar] [CrossRef] [PubMed] [Green Version]
  2. Hailu, A.; Mammo, S.; Kidane, M. Dynamics of land use, land cover change trend and its drivers in Jimma Geneti District, Western Ethiopia. Land Use Policy 2020, 99, 105011. [Google Scholar] [CrossRef]
  3. Turner, B.L.; Moss, R.H.; Skole, D.L. Relating land use and global land cover change: A proposal for an IGBP-HDP core. Project. Report from the IGBP-HDP Working Group on Land use/land Cover Change. In Joint Publication of the IGBP No. 24 and HDP No 5; Swedish Academy of Sciences: Stockholm, Sweden, 1993. [Google Scholar]
  4. Gebreslassie, H. Land Use-Land Cover dynamics of Huluka watershed, central rift Valley, Ethiopia. Int. Soil Water Conserv. Res. 2014, 2, 25–33. [Google Scholar] [CrossRef] [Green Version]
  5. Su, S.; Xiao, R.; Jiang, Z.; Zhang, Y. Characterizing landscape pattern and ecosystem service value changes for urbanization impacts at an eco-regional scale. Appl. Geogr. 2012, 34, 295–305. [Google Scholar] [CrossRef]
  6. Haas, J.; Ban, Y. Urban growth and environmental impacts in Jing-Jin-Ji, the Yangtze, river delta and the Pearl River delta. Int. J. Appl. Earth Obs. Geoinf. 2014, 30, 42–55. [Google Scholar] [CrossRef]
  7. Li, J.; Fang, W.; Wang, T.; Qureshi, S.; Alatalo, J.; Bai, Y. Correlations between socioeconomic drivers and indicators of urban expansion: Evidence from the heavily urbanised Shanghai metropolitan area, China. Sustainability 2017, 9, 1199. [Google Scholar] [CrossRef] [Green Version]
  8. Wang, S.; Cao, Z.; Luo, P.; Zhu, W. Spatiotemporal variations and climatological trends in precipitation indices in Shaanxi Province, China. Atmosphere 2022, 13, 744. [Google Scholar] [CrossRef]
  9. Luo, P.; Mu, Y.; Wang, S.; Zhu, W.; Mishra, B.K.; Huo, A.; Zhou, M.; Lyu, J.; Hu, M.; Duan, W.; et al. Exploring sustainable solutions for the water environment in Chinese and Southeast Asian cities. Ambio 2022, 51, 1199–1218. [Google Scholar] [CrossRef] [PubMed]
  10. Cetin, M.; Adiguzel, F.; Gungor, S.; Kaya, E.; Sancar, M.C. Evaluation of thermal climatic region areas in terms of building density in urban management and planning for Burdur, Turkey. Air Qual. Atmos. Health 2019, 12, 1103–1112. [Google Scholar] [CrossRef]
  11. Willemen, L.; Barger, N.N.; ten Brink, B.T.; Cantele, M.; Erasmus, B.F.N.; Fisher, J.L.; Gardner, T.; Holland, T.G.; Kohler, F.; Kotiaho, J.S.; et al. How to halt the global decline of lands. Nat. Sustain. 2020, 3, 164–166. [Google Scholar] [CrossRef] [Green Version]
  12. Wu, J.; Xiang, W.-N.; Zhao, J. Urban ecology in China: Historical developments and future directions. Landsc. Urban Plan. 2014, 125, 222–233. [Google Scholar] [CrossRef]
  13. Norström, A.V.; Cvitanovic, C.; Löf, M.F.; West, S.; Wyborn, C.; Balvanera, P.; Bednarek, A.T.; Bennett, E.M.; Biggs, R.; de Bremond, A.; et al. Principles for knowledge co-production in sustainability research. Nat. Sustain. 2020, 3, 182–190. [Google Scholar] [CrossRef]
  14. Peng, J.; Pan, Y.; Liu, Y.; Zhao, H.; Wang, Y. Linking ecological degradation risk to identify ecological security patterns in a rapidly urbanizing landscape. Habitat Int. 2018, 71, 110–124. [Google Scholar] [CrossRef]
  15. Yang, R.; Du, W.; Yang, Z. Spatiotemporal evolution and influencing factors of urban land ecological security in Yunnan Province. Sustainability 2021, 13, 2936. [Google Scholar] [CrossRef]
  16. Ding, M.; Liu, W.; Xiao, L.; Zhong, F.; Lu, N.; Zhang, J.; Zhang, Z.; Xu, X.; Wang, K. Construction and optimization strategy of ecological security pattern in a rapidly urbanizing region: A case study in central-south China. Ecol. Indic. 2022, 136, 108064. [Google Scholar] [CrossRef]
  17. Yu, K.J. Security patterns and surface model in landscape ecological planning. Landsc. Urban Plan. 1996, 36, 1–17. [Google Scholar] [CrossRef]
  18. Peng, J.; Zhao, H.; Liu, Y.; Wu, J. Research progress and prospect on regional ecological security pattern construction. Geogr. Res. 2017, 36, 407–419. [Google Scholar] [CrossRef]
  19. Chai, J.; Wang, Z.; Yu, C. Analysis for the interaction relationship between urbanization and ecological security: A case study in wuhan city Circle of China. Int. J. Environ. Res. Public Health 2021, 18, 13187. [Google Scholar] [CrossRef]
  20. Wang, S.; Zhang, X.; Wu, T.; Yang, Y. The evolution of landscape ecological security in Beijing under the influence of different policies in recent decades. Sci. Total Environ. 2019, 646, 49–57. [Google Scholar] [CrossRef]
  21. Xu, D.; Yang, F.; Yu, L.; Zhou, Y.; Li, H.; Ma, J.; Huang, J.; Wei, J.; Xu, Y.; Zhang, C.; et al. Quantization of the coupling mechanism between eco-environmental quality and urbanization from multisource remote sensing data. J. Clean. Prod. 2021, 321, 128948. [Google Scholar] [CrossRef]
  22. Peng, J.; Yang, Y.; Liu, Y.; Hu, Y.; Du, Y.; Meersmans, J.; Qiu, S. Linking ecosystem services and circuit theory to identify ecological security patterns. Sci. Total Environ. 2018, 644, 781–790. [Google Scholar] [CrossRef] [PubMed] [Green Version]
  23. Wang, D.; Chen, J.; Zhang, L.; Sun, Z.; Wang, X.; Zhang, X.; Zhang, W. Establishing an ecological security pattern for urban agglomeration, taking ecosystem services and human interference factors into consideration. PeerJ 2019, 7, e7306. [Google Scholar] [CrossRef] [PubMed]
  24. Yu, H.; Gu, X.; Liu, G.; Fan, X.; Zhao, Q.; Zhang, Q. Construction of regional ecological security patterns based on multi-criteria decision making and circuit theory. Remote Sens. 2022, 14, 527. [Google Scholar] [CrossRef]
  25. Yang, R.; Bai, Z.; Shi, Z. Linking morphological spatial pattern analysis and circuit theory to identify ecological security pattern in the Loess Plateau: Taking Shuozhou city as an example. Land 2021, 10, 907. [Google Scholar] [CrossRef]
  26. Song, Y.; Xue, D.; Dai, L.; Wang, P.; Huang, X.; Xia, S. Land cover change and eco-environmental quality response of different geomorphic units on the Chinese Loess Plateau. J. Arid. Land 2020, 12, 29–43. [Google Scholar] [CrossRef] [Green Version]
  27. Sun, W.; Song, X.; Mu, X.; Gao, P.; Wang, F.; Zhao, G. Spatiotemporal vegetation cover variations associated with climate change and ecological restoration in the Loess Plateau. Agric. For. Meteorol. 2015, 209–210, 87–99. [Google Scholar] [CrossRef]
  28. Kong, D.; Miao, C.; Borthwick, A.; Lei, X.; Li, H. Spatiotemporal variations in vegetation cover on the Loess Plateau, China, between 1982 and 2013: Possible causes and potential impacts. Environ. Sci. Pollut. R 2018, 25, 13633–13644. [Google Scholar] [CrossRef] [Green Version]
  29. Shi, P.; Li, P.; Li, Z.; Sun, J.; Wang, D.; Min, Z. Effects of grass vegetation coverage and position on runoff and sediment yields on the slope of Loess Plateau, China. Agric. Water Manag. 2022, 259, 107231. [Google Scholar] [CrossRef]
  30. Ma, H.; Zhen, Z.; Mi, M.; Wang, Q. Characteristics of nutrients pollution and ecological risk assessment of heavy metal in sediments of Fenhe River, Taiyuan section, China. Water Supply 2022, 22, 2596–2611. [Google Scholar] [CrossRef]
  31. Quan, B.; Chen, J.; Qiu, H.; Römkens, M.J.M.; Yang, X.; Jiang, S.; Li, B. Spatial-temporal pattern and driving forces of land use changes in Xiamen. Pedosphere 2006, 16, 477–488. [Google Scholar] [CrossRef]
  32. Quan, B.; Bai, Y.; Römkens, M.J.M.; Chang, K.; Song, H.; Guo, T.; Lei, S. Urban land expansion in Quanzhou City, China, 1995–2010. Habitat Int. 2015, 48, 131–139. [Google Scholar] [CrossRef]
  33. Quan, B.; Römkens, M.J.M.; Tao, J.; Li, B.; Li, C.; Yu, G.; Chen, Q. Spatial-temporal pattern and population driving force of land use change in Liupan Mountains region, southern Ningxia, China. Chin. Geogr. Sci. 2008, 18, 323–330. [Google Scholar] [CrossRef]
  34. Sun, W.; Shao, Q.; Liu, J. Assessment of soil conservation function of the ecosystem services on the Loess Plateau. J. Nat. Resour. 2014, 29, 365–376. [Google Scholar] [CrossRef]
  35. Xiao, P.; Zhou, Y.; Li, M.; Xu, J. Spatiotemporal patterns of habitat quality and its topographic gradient effects of Hubei Province based on the InVEST model. Environ. Dev. Sustain. 2022, 1–30. [Google Scholar] [CrossRef]
  36. Li, M.; Zhou, Y.; Xiao, P.; Tian, Y.; Huang, H.; Xiao, L. Evolution of habitat quality and its topographic gradient effect in northwest Hubei Province from 2000 to 2020 based on the invest model. Land 2021, 10, 857. [Google Scholar] [CrossRef]
  37. Pharo, E. Nature’s services: Societal dependence on natural ecosystems, by G. C. Daily. The Bryologist 1998, 101, 475. [Google Scholar] [CrossRef] [Green Version]
  38. Ningrum, A.; Setiawan, Y.; Tarigan, S.D. Annual water yield analysis with InVEST model in Tesso Nilo national park, Riau Province. IOP Conf. Ser. Earth Environ. Sci. 2022, 950, 012098. [Google Scholar] [CrossRef]
  39. Sharp, R.; Tallis, H.T.; Ricketts, T.; Guerry, A.D.; Wood, S.A.; Chaplin-Kramer, R.; Nelson, E.; Ennaanay, D.; Wolny, S.; Olwero, N.; et al. +VERSION+ User’s Guide; The Natural Capital, Project; Stanford University: Stanford, CA, USA; University of Minnesota: Minneapolis, MN, USA; The Nature Conservancy: Arlington, TX, USA; World Wildlife Fund: Washington, DC, USA, 2018. [Google Scholar]
  40. Droogers, P.; Allen, R.G. Estimating reference evapotranspiration under inaccurate data conditions. Irrig. Drain. Syst. 2002, 16, 33–45. [Google Scholar] [CrossRef]
  41. Kim, S.; Jung, Y. Application of the InVEST model to quantify the water yield of North Korean forests. Forests 2020, 11, 804. [Google Scholar] [CrossRef]
  42. Liu, Y.; Hu, N.; Zhang, J.; Lv, Z. Spatiotemporal Change of Carbon Storage in the Loess Plateau of Northern Shaanxi, based on the InVEST Model. Sci. Cold Arid. Reg. 2018, 10, 0240–0250. [Google Scholar] [CrossRef]
  43. Xu, Q.; Yang, K.; Wang, G.; Yang, Y. Agent-based modeling and simulations of land-use and land-cover change according to ant colony optimization: A case study of the Erhai Lake Basin, China. Nat. Hazards 2015, 75, 95–118. [Google Scholar] [CrossRef]
  44. Muhati, G.L.; Olago, D.; Olaka, L. Land use and land cover changes in a sub-humid montane forest in an arid setting: A case study of the Marsabit forest reserve in Northern Kenya. Glob. Ecol. Conserv. 2018, 16, e00512. [Google Scholar] [CrossRef]
  45. Huang, B.; Huang, J., Jr.; Gilmore Pontius, R.; Tu, Z. Comparison of intensity analysis and the land use dynamic degrees to measure land changes outside versus inside the coastal zone of Longhai, China. Ecol. Indic. 2018, 89, 336–347. [Google Scholar] [CrossRef]
  46. Luo, P.; Liu, L.; Wang, S.; Ren, B.; He, B.; Nover, D. Influence assessment of new inner tube porous brick with absorbent concrete on urban floods control. Case Stud. Constr. Mater. 2022, 17, e01236. [Google Scholar] [CrossRef]
  47. Luo, P.; Luo, M.; Li, F.; Qi, X.; Huo, A.; Wang, Z.; He, B.; Takara, K.; Nover, D.; Wang, Y. Urban flood numerical simulation: Research, methods and future perspectives. Environ. Modell. Softw. 2022, 156, 105478. [Google Scholar] [CrossRef]
  48. Bao, Y.; Liu, K.; Li, T.; Hu, S. Effects of land use change on habitat based on InVEST model—Taking Yellow River wetland nature reserve in Shaanxi Province as an example. Arid. Zone Res. 2015, 32, 622–629. [Google Scholar] [CrossRef]
  49. Yan, Y.; Ju, H.; Zhang, S.; Chen, G. The construction of ecological security patterns in coastal areas based on landscape ecological risk assessment—A case study of Jiaodong Peninsula, China. Int. J. Environ. Res. Public Health 2021, 18, 12249. [Google Scholar] [CrossRef]
  50. Li, Y.; Liu, W.; Feng, Q.; Zhu, M.; Yang, L.; Zhang, J.; Yin, X. The role of land use change in affecting ecosystem services and the ecological security pattern of the Hexi Regions, Northwest China. Sci. Total Environ. 2023, 855, 158940. [Google Scholar] [CrossRef]
  51. Avon, C.; Bergès, L. Prioritization of habitat patches for landscape connectivity conservation differs between least-cost and resistance distances. Landscape Ecol. 2016, 31, 1551–1565. [Google Scholar] [CrossRef] [Green Version]
  52. Fu, B.; Liu, Y.; Lü, Y.; He, C.; Zeng, Y.; Wu, B. Assessing the soil erosion control service of ecosystems change in the Loess Plateau of China. Ecol. Complex. 2011, 8, 284–293. [Google Scholar] [CrossRef]
  53. Liu, H.; Liu, Y.; Wang, K.; Zhao, W. Soil conservation efficiency assessment based on land use scenarios in the Nile River basin. Ecol. Indic. 2020, 119, 106864. [Google Scholar] [CrossRef]
  54. Gong, J.; Zhang, J.; Zhang, Y.; Zhu, Y.; Jin, T.; Xu, C. Do forest landscape pattern planning and optimization play a role in enhancing soil conservation services in mountain areas of Western China? Chin. Geogr. Sci. 2021, 31, 848–866. [Google Scholar] [CrossRef]
  55. Bai, L.; Xiu, C.; Feng, X.; Liu, D. Influence of urbanization on regional habitat quality: A case study of Changchun city. Habitat Int. 2019, 93, 1–10. [Google Scholar] [CrossRef]
  56. Li, X.; Liu, Z.; Li, S.; Li, Y. Multi-scenario simulation analysis of land use impacts on habitat quality in Tianjin based on the PLUS model coupled with the InVEST model. Sustainability 2022, 14, 6923. [Google Scholar] [CrossRef]
  57. Zhang, Y.; Jiang, Z.; Li, Y.; Yang, Z.; Wang, X.; Li, X. Construction and optimization of an urban ecological security pattern based on habitat quality assessment and the minimum cumulative resistance model in Shenzhen City, China. Forests 2021, 12, 847. [Google Scholar] [CrossRef]
  58. Huang, W.; Duan, W.; Chen, Y. Rapidly declining surface and terrestrial water resources in Central Asia driven by socio-economic and climatic changes. Sci. Total Environ. 2021, 784, 147193. [Google Scholar] [CrossRef]
  59. Duan, W.; Zou, S.; Chen, Y.; Nover, D.; Fang, G.; Wang, Y. Sustainable water management for cross-border resources: The Balkhash lake basin of Central Asia, 1931–2015. J. Clean. Prod. 2020, 263, 121614. [Google Scholar] [CrossRef]
  60. Duan, W.; Maskey, S.; Chaffe, P.L.B.; Luo, P.; He, B.; Wu, Y.; Hou, J. Recent advancement in remote sensing technology for hydrology analysis and water resources management. Remote Sens. 2021, 13, 1097. [Google Scholar] [CrossRef]
  61. Nahib, I.; Ambarwulan, W.; Rahadiati, A.; Munajati, S.L.; Prihanto, Y.; Suryanta, J.; Turmudi, T.; Nuswantoro, A.C. Assessment of the impacts of climate and LULC changes on the water yield in the Citarum River Basin, West Java Province, Indonesia. Sustainability 2021, 13, 3919. [Google Scholar] [CrossRef]
  62. He, C.; Zhang, D.; Huang, Q.; Zhao, Y. Assessing the potential impacts of urban expansion on regional carbon storage by linking the LUSD-urban and invest models. Environ. Modell. Softw. 2016, 75, 44–58. [Google Scholar] [CrossRef]
  63. Liang, Y.; Liu, L.; Huang, J. Integrating the SD-CLUE-S and InVEST models into assessment of oasis carbon storage in Northwestern China. PLoS ONE 2017, 12, e0172494. [Google Scholar] [CrossRef] [PubMed] [Green Version]
  64. Wei, X.D.; Yang, J.; Luo, P.P.; Lin, L.G.; Lin, K.L.; Guan, J.M. Assessment of the variation and influencing factors of vegetation NPP and carbon sink capacity under different natural conditions. Ecol. Indic. 2022, 138, 108834. [Google Scholar] [CrossRef]
  65. Kumarasiri, A.D.T.N.; Udayakumara, E.P.N.; Jayawardana, J.M.C.K. Impacts of soil erosion and forest quality on water quality in Samanalawewa watershed, Sri Lanka. Model. Earth Syst. Environ. 2022, 8, 529–544. [Google Scholar] [CrossRef]
  66. Bai, H.; Li, Z.; Guo, H.; Chen, H.; Luo, P. Urban green space planning based on remote sensing and geographic information systems. Remote Sens. 2022, 14, 4213. [Google Scholar] [CrossRef]
  67. Luo, P.; Xu, C.; Kang, S.; Huo, A.; Lyu, J.; Zhou, M.; Nover, D. Heavy metals in water and surface sediments of the Fenghe River Basin, China: Assessment and source analysis. Water Sci. Technol. 2021, 84, 3072–3090. [Google Scholar] [CrossRef]
  68. Wang, Z.; Luo, P.; Zha, X.; Xu, C.; Kang, S.; Zhou, M.; Nover, D.; Wang, Y. Overview assessment of risk evaluation and treatment technologies for heavy metal pollution of water and soil. J. Clean. Prod. 2022, 379, 134043. [Google Scholar] [CrossRef]
  69. Zha, X.; Luo, P.; Zhu, W.; Wang, S.; Lyu, J.; Zhou, M.; Huo, A.; Wang, Z. A bibliometric analysis of the research on sponge city: Current situation and future development direction. Ecohydrology 2021, 14, e2328. [Google Scholar] [CrossRef]
  70. Luo, P.; Zheng, Y.; Wang, Y.; Zhang, S.; Yu, W.; Zhu, X.; Huo, A.; Wang, Z.; He, B.; Nover, D. Comparative assessment of sponge city constructing in public awareness, Xi’an, China. Sustainability 2022, 14, 11653. [Google Scholar] [CrossRef]
  71. Wang, Z.; Shi, P.; Zhang, X.; Tong, H.; Zhang, W.; Liu, Y. Research on landscape pattern construction and ecological restoration of Jiuquan city based on ecological security evaluation. Sustainability 2021, 13, 5732. [Google Scholar] [CrossRef]
  72. Wu, W.; Shi, P.; Hu, W. Study on land ecological risk in oasis city based on LUCC: A case study in the Ganzhou District. Arid Zone Res. 2012, 29, 122–128. [Google Scholar] [CrossRef]
  73. Meng, J.; Jiang, S.; Laba, Z.; Zhang, W. The spatial and temporal analysis of land use conflict in the middle reaches of the Heihe River based on landscape pattern. Sci. Geogr. Sin. 2020, 40, 1553–1562. [Google Scholar] [CrossRef]
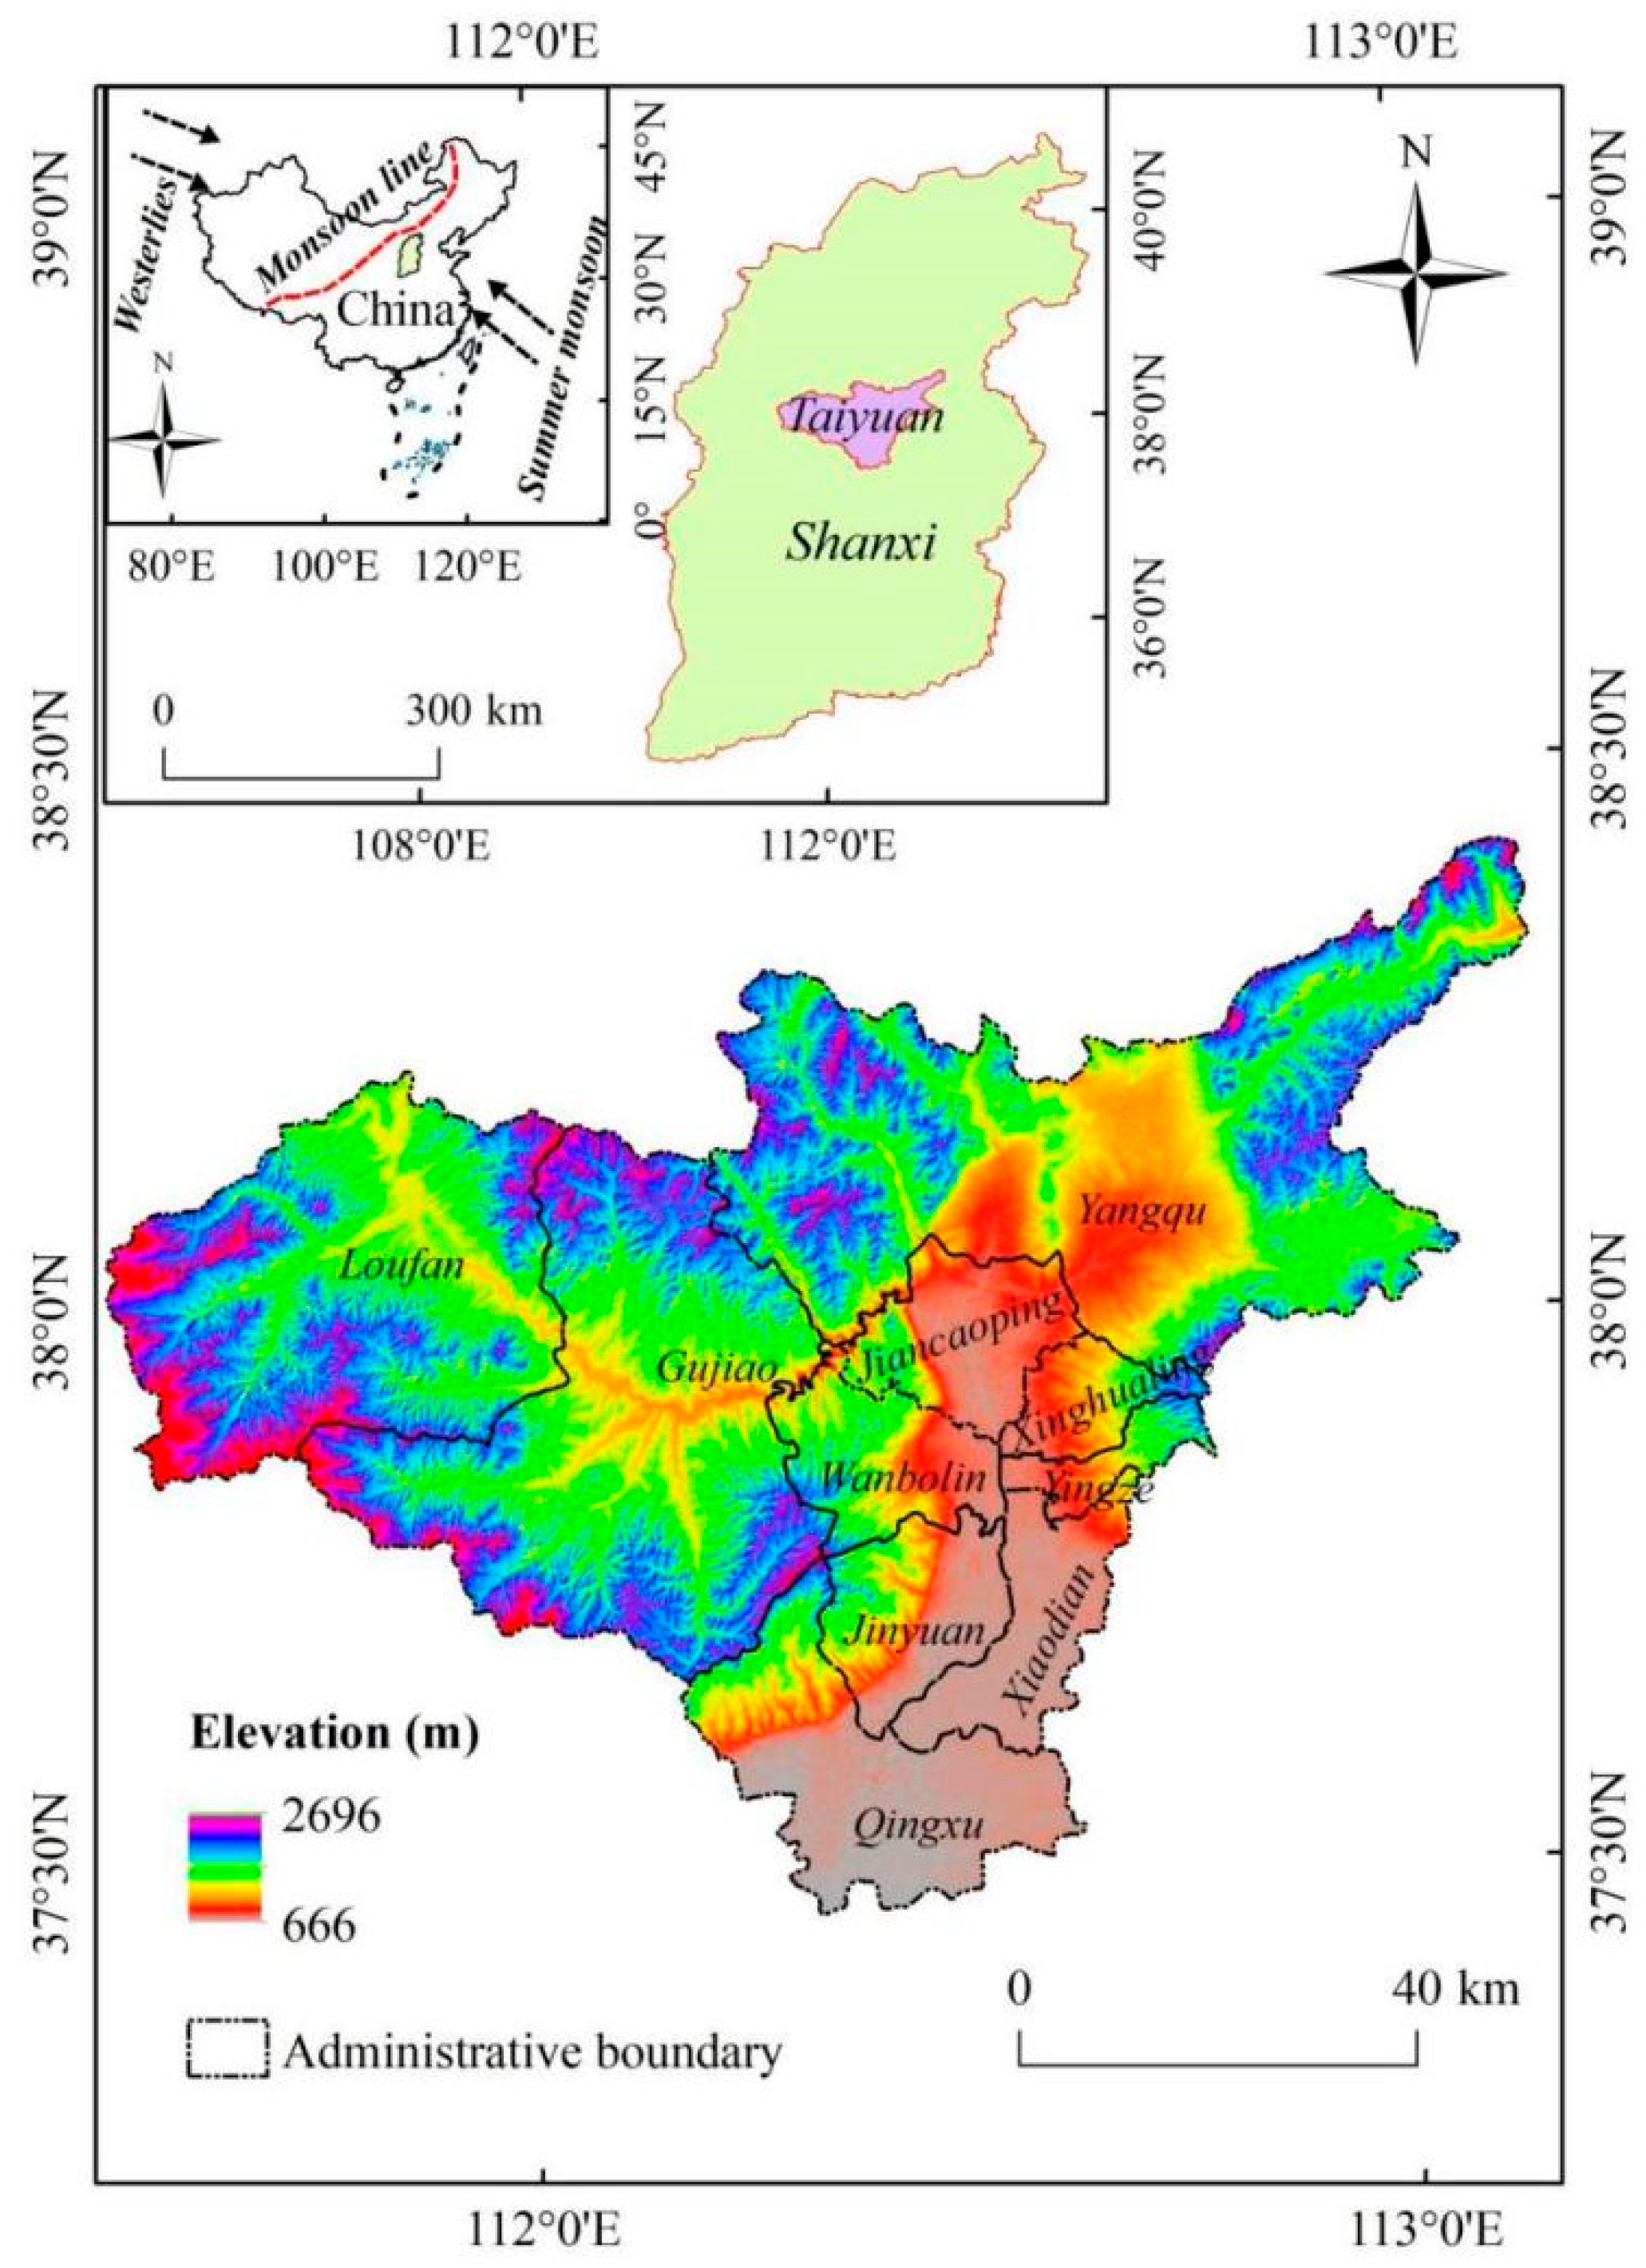
Figure 1. Map of Taiyuan city location and elevation.
Remotesensing 15 01523 g001
Figure 2. Map of the ESPs construction.
Remotesensing 15 01523 g002
Figure 3. Land use change from 1980 to 2020 in Taiyuan City.
Remotesensing 15 01523 g003
Figure 4. Distribution of (a) soil conservation, (b) water yield, and (c) carbon storage amount in Taiyuan City; (d) amount of soil conservation, water yield, and carbon storage in each administrative region.
Remotesensing 15 01523 g004
Figure 5. Sensitivity of land covers to habitat threat factor.
Remotesensing 15 01523 g005
Figure 6. (a) Habitat quality assessments. (b) Mean habitat quality value in each administrative region.
Remotesensing 15 01523 g006
Figure 7. (a) Ecological source in Taiyuan City. (b) Ecological source areas in each administrative region.
Remotesensing 15 01523 g007
Figure 8. Comprehensive resistance surface constructions.
Remotesensing 15 01523 g008
Figure 9. (a) Ecological corridors in Taiyuan City and (b) ecological pinch and barrier point construction in Taiyuan City.
Remotesensing 15 01523 g009
Figure 10. Optimization model of ecological security pattern in Taiyuan City.
Remotesensing 15 01523 g010
Table 1. The detailed data descriptions.
Data NameSpatial ResolutionWebsite Source
The administrative boundary http://www.resdc.cn/ (accessed on 9 August 2021)
Digital Elevation Model (DEM)30 mhttp://www.gscloud.cn/ (accessed on 9 August 2021)
The LULC30 mhttps://www.resdc.cn/DataSearch.aspx (accessed on 30 July 2021)
Precipitation https://data.cma.cn/ (accessed on 10 August 2021)
Soil thickness and Soil texture1000 mhttp://www.iiasa.ac.at/Research/LUC/External-World-soil-database/HTML (accessed on 10 August 2021)
The potential evapotranspiration1000 mhttp://www.cnern.org.cn (accessed on 9 August 2021)
Table 2. Land use transfer matrix of Taiyuan City from 1980 to 2020.
Land Use Types
Cultivated LandWoodlandGrasslandWaterConstruction LandUnused Land
1980–1990Cultivated land2192.550.731.403.2326.150.00
Woodland0.942345.730.560.010.160.00
Grassland2.031.311911.090.023.420.21
Water0.040.010.1176.180.000.00
Construction land0.180.010.030.00306.280.00
Unused land0.000.000.000.000.002.61
1990–2000Cultivated land2122.281.181.1310.6560.500.00
Woodland5.942302.8237.670.011.340.00
Grassland23.677.721877.550.244.000.00
Water1.810.000.1077.090.430.00
Construction land0.190.010.030.01335.690.00
Unused land0.000.000.000.000.00 2.82
2000–2010Cultivated land1814.3062.2665.425.94205.940.05
Woodland17.052255.6716.150.4622.340.11
Grassland59.22103.741694.140.5558.040.78
Water8.280.370.4964.5014.350.00
Construction land25.773.972.331.38368.500.00
Unused land0.640.010.020.031.380.75
2010–2020Cultivated land1757.4824.1564.513.4075.750.01
Woodland28.652340.9341.990.6513.850.03
Grassland69.1140.651658.100.939.770.09
Water2.110.511.0167.961.270.00
Construction land21.854.105.481.41637.780.03
Unused land0.010.030.080.000.131.44
Table 3. Single landscape dynamics in Taiyuan City from 1980 to 2020.
Land UseSingle Land Use Dynamic Degree/%
1980–19901990–20002000–20102010–20201980–2020
Cultivated land−0.13−0.19−1.19−0.25−0.40
Woodland0.00−0.160.47−0.120.06
Grassland−0.030.02−0.77−0.04−0.20
Water0.390.97−2.080.970.09
Construction land0.881.644.011.043.65
Unused land0.740.00−6.86−0.66−1.03
Table 4. Threat factor properties.
Threat FactorMaximum Distance/kmWeightAttenuation Way
Cultivated land10.6Exponential
Road50.5Linearity
Urban land use70.8Exponential
Rural land use30.4Exponential
Industrial and mining land80.6Exponential
Table 5. Classification and weight of each resistance factor.
Resistance FactorScoring StandardResistance ValueWeight
NDVI/%0.2–0.4800.2
0.4–0.650
0.6–0.830
0.8–1.01
Slope/°0.0–2.0100.15
2.0–6.030
6.0–15.050
15.0–25.080
>25.0100
Habitat quality/%0.0–0.21000.3
0.2–0.480
0.4–0.650
0.6–0.830
0.8–1.01
Land use typeWoodland10.2
Water20
Grassland30
Cultivated land50
Construction land and unused land100
Elevation/m677–950100.15
950–125030
1250–145050
1450–165080
1650–2686100
Disclaimer/Publisher’s Note: The statements, opinions and data contained in all publications are solely those of the individual author(s) and contributor(s) and not of MDPI and/or the editor(s). MDPI and/or the editor(s) disclaim responsibility for any injury to people or property resulting from any ideas, methods, instructions or products referred to in the content.